
Kinetics of Ethanol Electrooxidation at a Modified ... · Paper: ASAT-16-101-CA The cyclic...
19
Paper: ASAT-16-101-CA 16 th International Conference on AEROSPACE SCIENCES & AVIATION TECHNOLOGY, ASAT - 16 – May 26 - 28, 2015, E-Mail: [email protected] Military Technical College, Kobry Elkobbah, Cairo, Egypt Tel : +(202) 24025292 – 24036138, Fax: +(202) 22621908 Kinetics of Ethanol Electrooxidation at a Modified Platinum Electrode in 0.1M Perchloric acid Y. Atef*, S. Abd El Wanees † and M. M. Hefny ‡ Abstract: The present paper reports cyclic voltammetry (CV) studies on electrooxidation of ethanol at a modified Pt electrode surface in 0.1M perchloric acid solution. The activity of Pt electrode towards ethanol oxidation increases with increasing number of cycles and concentration of ethanol. Cyclic voltammetry was also used to investigate the electrochemical and thermochemical parameters related to electrooxidation of ethanol under the influence of temperature. The effect of temperature was carried out for a temperature range of 283–303 K. Apparent activation energies of the oxidation reactions on a modified Pt electrode were determined. The enhancement is discussed and attributed to the mechanism of oxidation that is likely to be dissociative chemisorptions involving electron transfer. Kinetic and thermodynamic parameters values for the electrooxidation process E a * , ∆G * , ∆H * and ∆S * have been computed and discussed. The high activation energy for the process suggests that C–C bond cleavage is the rate determining step. Keywords: Ethanol electrooxidation, modified Pt electrode ------------------------------------------------ * Author for correspondence. Chemistry Administration, Cairo, Egypt. Address: [email protected] † Chemistry Department, Faculty of Science, Zagazig University, Zagazig, Egypt ‡ Chemistry Department, Faculty of Science, Cairo University, Giza, Egypt
Transcript of Kinetics of Ethanol Electrooxidation at a Modified ... · Paper: ASAT-16-101-CA The cyclic...

Paper: ASAT-16-101-CA
16th
International Conference on
AEROSPACE SCIENCES & AVIATION TECHNOLOGY,
ASAT - 16 – May 26 - 28, 2015, E-Mail: [email protected]
Military Technical College, Kobry Elkobbah, Cairo, Egypt
Tel : +(202) 24025292 – 24036138, Fax: +(202) 22621908
Kinetics of Ethanol Electrooxidation at a Modified Platinum
Electrode in 0.1M Perchloric acid
Y. Atef*, S. Abd El Wanees
† and M. M. Hefny
‡
Abstract: The present paper reports cyclic voltammetry (CV) studies on electrooxidation of
ethanol at a modified Pt electrode surface in 0.1M perchloric acid solution. The activity of Pt
electrode towards ethanol oxidation increases with increasing number of cycles and
concentration of ethanol. Cyclic voltammetry was also used to investigate the electrochemical
and thermochemical parameters related to electrooxidation of ethanol under the influence of
temperature. The effect of temperature was carried out for a temperature range of 283–303 K.
Apparent activation energies of the oxidation reactions on a modified Pt electrode were
determined. The enhancement is discussed and attributed to the mechanism of oxidation that
is likely to be dissociative chemisorptions involving electron transfer. Kinetic and
thermodynamic parameters values for the electrooxidation process Ea*, ∆G
*, ∆H
* and ∆S
*
have been computed and discussed. The high activation energy for the process suggests that
C–C bond cleavage is the rate determining step.
Keywords: Ethanol electrooxidation, modified Pt electrode
------------------------------------------------
* Author for correspondence. Chemistry Administration, Cairo, Egypt.
Address: [email protected] † Chemistry Department, Faculty of Science, Zagazig University, Zagazig, Egypt
‡ Chemistry Department, Faculty of Science, Cairo University, Giza, Egypt

Paper: ASAT-16-101-CA
1. Introduction In various applications, fuel cells are widely recognized as very attractive
devices to obtain directly electric energy from the electrooxidation of a chemical
product. The main focus of research in the case of direct alcohol fuel cells is
development of novel anodic catalysts, which are mostly platinum [1]. The direct
oxidation of methanol in fuel cells has been widely investigated. However, the
question of the toxicity of methanol remains crucial. Methanol is considered since a
long time as a toxic product, in addition to possible environmental problems in relation
to its large miscibility to water. The interest in ethanol has increased, not only as a
renewable resource, but especially as a fuel source due to its high theoretical yield of
12 protons and 12 electrons released upon oxidation. Ethanol offers an attractive
alternative as a fuel in low temperature fuel cells because it can be produced in large
quantities from agricultural products and it is the major renewable biofuel from the
fermentation of biomass, while DEFCs are operated at elevated temperatures under
enforced electrolyte transport, using high surface area electrodes. The DEFC
transforms directly the Gibbs energy of combustion of ethanol into electricity, without
a fuel processor. This greatly simplifies the system, reducing its volume and cost [2,3].
Wang et al., [4] found that ethanol is a promising alternative fuel with an
electrochemical activity comparable to that of methanol. These reasons motivate
investigations on ethanol electrooxidation in order to improve the electrical
performances when using it in DEFCs, and to open the possibility of replacing
methanol indirect alcohol fuel cells. Much effort has been focused on the mechanistic
aspects of this reaction on different electrodes materials [5]. Pt is the most active
electrode for this reaction [6].
Several studies on the electrooxidation of ethanol have been devoted mainly to
identifying the adsorbed intermediates on the electrode and elucidating the reaction
mechanism by means of various techniques, as differential electrochemical mass
spectrometry (DEMS) [7,8], in situ Fourier transform infrared spectroscopy (FTIRS)
[8,9], electrochemical thermal desorption mass spectroscopy (ECTDMS) [10] and
SNIFTIRS study [11].
The effect of concentration and temperature are important parameters in
electrooxidation of ethanol. The temperature rising operation is an effective method to
obtain a high power DEFC. In the case when one measures the electrochemical
oxidation of alcohols in aqueous media, the measuring temperature is limited to 60–70
°C which is attributed to the vaporization of the alcohols. In the present study, the
electrooxidation properties were investigated using a sheet as the Pt electrode by
varying the temperature of the electrolytic solution. In this study, an experimental
system of cyclic voltammetry (CV) was used to provide kinetic data of the
electrooxidation of ethanol on the Pt electrode in the temperature range of 10 to 30°C.
Based on CV data, the kinetic parameters and apparent activation energy were
evaluated. Additionally, the reaction pathway of ethanol oxidation (C1 & C2) is
proposed and discussed in this study.
We have focused on a CV study of ethanol in acidic (0.1M HClO4) medium on
a Pt electrode in order to investigate the thermodynamic parameters ΔH, ΔG, ΔS and
Ea of the electrooxidation reaction. Potentiodynamic cyclic voltametry measurements
provide important information on the electrochemical characterization of the
intermediate species under study and is a simple method for screening the processes

Paper: ASAT-16-101-CA
occurring in a wide potential range though a constant current or potential electrolysis
is used more often for practical purposes.
2. Experimental Voltammetric measurements were conducted in a 50 ml conventional cell in 0.1
M HClO4 under normal atmosphere and with temperature controller. As WE
compartment, pure Pt (0.6 cm2 sheet, Aldrich, thermocouple quality) was used. A
saturated calomel electrode (SCE) connected to the electrochemical cell by a Luggin
capillary, was used as the reference. The counter electrode was a piece of thin rod of
platinum of area about 0.3 cm2. All potentials, E, given here are referred to SCE.
Solutions were made using high purity (Analar grade) chemicals and triply distilled
water. The electrode potential was controlled by a voltage scan generator (VSG 72,
Wenking).Before each experiment, the smooth working electrodes were abraded with
a fine grade emery paper followed by washing with triply distilled water to clean. The
electrode was coated with hydrated Pt oxide and by the repetitive cycling at a sweep
rate of 2000 mV/still a specified number of cycles (N) in pure 0.1M HClO4, at 25°C.
The lower and upper potential limits of the cycle are –400 mV and +1500 mV vs.
SCE, respectively. The organic reductant is spectroscopically pure grade supplied from
Merck.An automatically-controlled electronic Wenking Laboratory Poteniostat (LB
75) was used in this work. DC Voltammograms were recorded using Allen, Model
1000 and X-Y recorder. The measurements were performed in a conventional three
compartments cell. The working electrode compartment was surrounded by a water
jacket, for temperature control. The cell temperature was controlled using an ultra-
thermostat type Polyscience (USA). Each experiment was carried out in a freshly
prepared solution and with a newly polished electrode surface. After the formation of
the oxide, the electrolyte was replaced by pure 0.1M HClO4, and then by the same
electrolyte but containing ethanol. The cyclic voltammograms were recorded for each
solution between the previously specified potential limits at a scan rate of 50 mV/s.
The oxidation current density of the reductant, j, was measured as the difference in the
anodic current densities for the first cycle in the presence of the reductant and in its
absence (pure 0.1 M HClO4) at a specified potential of the current plateau. The current
densities are referred to the geometric area.
3. Results and discussion 3.1. Cyclic voltammetry
The surface of Pt electrode was modified by applying the repetitive
cyclizationin 0.1M HClO4and it occurs over wider potential region and high scan rate
to introduce O-species as the active site on Pt electrode. These active sites improve the
catalytic activity of Pt towards alcohol electrooxidation. The time dependent
polarization curves in HClO4 were measured at 15, 30, 45 & 60 minutes of Pt
modification and the roles of the reaction intermediates and the dynamic equilibrium
coverage of Pt-OH in determining the quasi-stable kinetic current of ORR were also
demonstrated. The hydrogen adsorption/desorption region and the oxide formation
region also did not show significant variations.
But it is important to note an increase in the oxide formation charge
as the cyclization time increases. In addition, is observed in the cathodic scan that the
oxide reduction peak becomes sharper.

Paper: ASAT-16-101-CA
The cyclic voltammetry of Pt electrode in Figure 1 was performed in 0.1M
HClO4 solution between –0.4 and 1.5V at a scan rate of 2000 mVs–1
shows the well
known adsorption/desorption of weakly and strongly adsorbed H atoms (peaks Ia, IIa,
IIIc) at low potentials and finally the oxide region where the formation of monolayer
oxide (IIa). The oxide formation on platinum has been proposed as equations (1) and
(2), even though minor processes can take place [12].
Pt + H2O → PtOH + H+ + e
− (1)
PtOH → PtO + H+ + e
− (2)
In Figure 1, the oxide reduction normally appears as a single cathodic peak (IIIc)
but the reaction is not so simple and may occur in two overlapping steps [13, 14].
-500 0 500 1000 1500
-30
-20
-10
0
10
20
IIIc
Ia
j, m
A.c
m-2
E, mV(SCE)
IIa
-500 0 500 1000 1500
-30
-20
-10
0
10
20
Fig. 1. Cyclic voltammogram of Pt electrode in 0.1M HClO4 at 2000 mV s
–1, after 30
minutes cyclization, at 25 °C.
3.2. Effect of ethanol concentration
After the cyclization process of formation the oxide on Pt electrode as an active
area of investigation, the performance of the ethanol electrooxidation can be carried
out at low scan rate. The cyclic voltammograms of a modified Pt electrode in 0.1M
HClO4 solution between –0.4 and 1.5V at a scan rate of 50 mV s–1
, in absence and
presence of ethanol after 30 minutes of Pt modification are shown in figure 2. It can
see clearly that a modified Pt electrode has good electrocatalytic activity for ethanol
oxidation.

Paper: ASAT-16-101-CA
Fig. 2.Cyclic voltammograms of platinum at different concentrations of ethanol, at 25 °C
(30 min. modification), at a sweep rate of 50 mV/s in 0.1M HClO4.
In oxidation of ethanol using platinum electrode in HClO4, there are three peaks
which are also designate oxidation of water and ethanol [15]. First peak is residing at
the potential about 500–600 while for the second peak it is residing at bigger potential,
900–1000 mV. It shows that peaks which are equal to CV of ethanol at acid medium
occurred at a potential around 500-1000 mV. The third peak is observed at lower
potential about 300–400 mV and only during the positive-going scan, none being
observed in the negative-going scan, evidencing that the C–C bond breaking takes
place only at lower potentials indicating that CO2 formation [16].
To compare the electrochemical activity of the modified Pt electrode in absence
and presence of ethanol, the large current in the anodic region is observed on the
modified Pt electrode, which is ascribed to the good activity for ethanol oxidation,
which is due to the oxidation of COads with the OHads on modified Pt sites. It is known
that, oxidation of alcohol on a Pt occurs due to the presence of oxygenated species
(PtO or PtOH), which help the oxidation of CO to CO2 [17]. The modifier, when
added to platinum, improve the catalytic effect of the electrode during the alcohol
electrooxidation through the transfer of their oxygenated adsorbed species (OH, O or
H2O) to neighboring adsorbed organic molecules, at lower potentials than on non-
modified platinum electrode [18].Therefore the objective of research on bimetallic
catalysts is to find a metal that can adsorb the OH radical or any other oxygen
containing species at relatively lower potentials [19]. Pt-OH reacts with organic
poison. Also, the enhancement may occur by preventing the formation of a strongly
adsorbed poisoning species such as CO either by blocking the sites necessary for its
adsorption [20] or by oxidizing completely CO in solution into CO2 [21]. Schell [22]
and Krausa and Vielstich [23] have postulated that chemisorbed CO reacts with
weakly bound water and/or chemisorbed OH to give CO2 [24]. Moreover, the peak
potential is less positively shifted and peak current increases by increasing of ethanol
concentration.
Plots of the logarithm of current densities (log jp) vs. the logarithm of the
concentrations of ethanol for both anodic and reverse anodic peaks on the modified Pt
electrode as shown in figure (3), in 0.1M HClO4 after 30 minutes of modification, at
-500 -250 0 250 500 750 1000 1250 1500-8
-4
0
4
8 Free (0.1M HClO4 after 30 min. ox.)
j, m
A.c
m-2
E, mV (SCE)
-500 -250 0 250 500 750 1000 1250 1500
-6
0
6
12 1 0.05M
2 0.1M
3 0.2M
4 0.3M
5 0.4M
6 0.5M
7 0.6M
0.1M HClO4+ xM Ethanol after 30 min. cyclization
j, m
A.c
m-2
E, mV (SCE)
1
2
7

Paper: ASAT-16-101-CA
25 °C. The increase of the anodic currents does not follow a linear law. This can be
explained by saturation of the electrode surface for concentrated ethanol solutions
[25], except for the lower ethanol concentration and the slope represents the overall
reaction order, m. Thus, for peak Ia, m= 0.75, for peak IIa, m = 0.66 and for peak IIIa,
m = 1.8. In a first approximation, the reaction seems to be controlled by a first-order
process during the two oxidation peaks Ia, IIa and a second-order process during peak
IIIa. Therefore, the overall reaction rate is mainly adsorption controlled, and the anodic
current can be expressed as:
I = n F k Cm
(3)
where, n is the number of electrons, F the Faraday constant, k is the rate constant, C
the bulk concentration of the reactant and m the overall reaction order.
-1.4 -1.2 -1.0 -0.8 -0.6 -0.4 -0.2
-0.6
-0.4
-0.2
0.0
0.2
0.4
0.6
0.8
1.0
1.2
log
jP,
mA
.cm
-2
log Ceth.
, M
Anodic current density Ia
Anodic current density IIa
Anodic current density IIIa
-1.4 -1.2 -1.0 -0.8 -0.6 -0.4 -0.2
-0.6
-0.4
-0.2
0.0
0.2
0.4
0.6
0.8
1.0
1.2
Fig. 3.Plots of log jp vs. log Cethanolfor peaks Ia, IIa&IIIa on the modified Pt electrode in
0.1M HClO4 (30 minutes of modification), at 25 °C.
Mechanism of ethanol oxidation
Based on the foregoing work, the global oxidation mechanism of ethanol in
acid solution may be summarized in the following scheme of parallel reactions [26]:
CH3CH2OH → [CH3CH2OH]ad → C1ad, C2ad → CO2 (total oxidation) (4)
CH3CH2OH→[CH3CH2OH]ad→CH3CHO→ CH3COOH (partial oxidation) (5)
The formation of CO2 goes through two adsorbed intermediates C1ad and C2ad,
which represent fragments with one and two carbon atoms, respectively. In spite of
many advances in the understanding of the mechanism of ethanol oxidation, there are
still some unclear aspects. For instance, there is some controversy on whether acetic
acid is formed in one step or through the aldehyde. Also, there is no agreement
regarding the nature of the adsorbed species. According to some workers, the carbon–
carbon bond is preserved, so a larger quantity of intermediates of the type C2 are
formed [27,28], but others claim that the main intermediates contain only one carbon
atom and are of the type C1 [29,30]. In fact, chemical adsorption of ethanol in the
"hydrogen region" generates strongly adsorbed species, from the breaking of the C–C
bond, like CO which is oxidized to CO2 at higher potentials. As expected, Pt is able to
break the C–C bond of ethanol but it is unable to oxidize the corresponding adsorbates

Paper: ASAT-16-101-CA
at low potentials leading to the same problems as for methanol [31]. So, the addition of
O-adlayer increases the electrode activity because of the presence of activated oxygen
species.
The first step of the electrochemical oxidation of ethanol at platinum electrode
is the dissociative adsorption of ethanol, either via an O-adsorption or a C-adsorption
process [32,33], to form acetaldehyde (AAL) according to the following reaction
equations. Indeed, it was shown by Hitmi et al., [25] that AAL was formed at
potentials lower than 0.6 V. Thus:
PtO + CH3CH2OH → Pt–(OCH2CH3)ads+ H+ + e
− (6)
or
PtO + CH3CH2OH → Pt–(CHOHCH3)ads+ H+ + e
− (7)
at E ~ 0.6 V, followed by
PtO–(OCH2CH3)ads → Pt + CHOCH3+ H+ + e
− (8)
or
PtO–(CHOHCH3)ads → Pt + CHOCH3+ H+ + e
− (9)
AAL has to be readsorbed for further oxidation either into acetic acid or carbon
dioxide. To complete the oxidation reaction leading to both of these species, an extra
oxygen atom is needed, which has to be brought by activated (adsorbed) water
molecules at the platinum surface. In this study, the supply of these activated sites is
more feasible on hydrated oxide surface.
Thus, as soon as AAL is formed, it can adsorb on platinum sites leading to a
PtO–COCH3 species at E ~ 0.6 V:
PtO + CHOCH3 → PtO–(COCH3)ads+ H+ + e
−(10)
Further oxidation, without breaking of the –C–C– bond, may occur at potentials
> 0.9 V, through the activation of water molecules at platinum sites:
Pt + H2O → Pt–(OH)ads+ H+ + e
− at E > 0.9 V (11)
PtO–(COCH3)ads+ Pt–(OH)ads → 2Pt + CH3COOH (12) At potentials higher than 0.6 V, the dissociative adsorption of water occurs on
platinum, providing –OH adsorbed species, able to oxidize further the adsorption
residues of ethanol. Then, oxidation of adsorbed CO species occurs as was shown by
FTIR reflectance spectroscopy and CO stripping experiments [34]:
Pt–(CO)ads + Pt–(OH)ads → 2Pt + CO2+ H+ + e
− (13)
AAL can also be oxidized, leading to acetic acid (AA), as follows:
Pt–(CHOCH3)ads+ Pt–(OH)ads→ 2Pt + CH3COOH + H+ + e
− (14)
3.3. Effect of temperature on ethanol oxidation
Cyclic voltammograms are obtained in 0.1M HClO4 + xM ethanol, Figs. (2, 4,
5) at different temperatures (10–30 °C). It shows stabilized cyclic voltammograms for
the ethanol oxidation reaction on a modified Pt electrode with increasing temperature
from 283–303 K. It is observed from figures that the oxidation current in the forward
sweeps (peak Ia, IIa) rises by a factor of 2.5 on increase of temperature from 283–303
K.Also, the foot of the curve for ethanol oxidation shifts to less positive potentials with
temperature. This indicates that the temperature has a positive effect on ethanol
oxidation leading to faster reaction kinetics and reduced deactivation of the oxide
surface. With increase in temperature, the peak potentials for ethanol oxidation
particularly on a modified Pt electrode shift less positively with a broadening of the
peak width. This behavior reflects the simultaneous formation of less strongly bonded
Pt-oxides at higher temperature along with the ethanol oxidation. The peak broadening
for ethanol oxidation on a modified Pt electrode also suggests that the peak currents

Paper: ASAT-16-101-CA
(Ia) and (IIa) are independent of OH adsorption [35]. Another effect of temperature on
a modified Pt electrode for ethanol oxidation is the almost vertical increase of reverse
oxidation peak (IIIa) which increases with temperature. Since the renewed oxidation
peak is related to the reduction of adsorbed OH species, the vertical increase indicates
that the reduction of the adsorbed OH occurs very fast at high temperatures on Pt.
Fig. 4.Cyclic voltammograms of platinum at different concentrations of ethanol, at 10 °C
(30 min. modification), at the sweep rate of 50 mV/s in 0.1M HClO4.
Fig. 5. Cyclic voltammograms of platinum at different concentrations of ethanol, at 30
°C (30 min. modification), at the sweep rate of 50 mV/s in 0.1M HClO4.
Lower H2O binding energy of Pt could be one of the reasons for this behavior
[36]. The forward sweep is characterized by the typical peak current, which declines
due to the formation of strongly bonded Pt-oxides/hydroxide as surface species. In the
reverse sweep, the progressive reduction of these oxides initiates the renewed
oxidation of the ethanolic species at low potentials. With increase in temperature, the
-500 -250 0 250 500 750 1000 1250 1500
-8
-4
0
4
8
E, mV (SCE)
Free (0.1M HClO4 at 10
oC
)
j, m
A.c
m-2
-500 -250 0 250 500 750 1000 1250 1500-8
-4
0
4
8
12 0.1M HClO4+ xM Ethanol at 10
oC
1 0.1M
2 0.2M
3 0.3M
4 0.4M
5 0.5M
6 0.6Mj, m
A.c
m-2
E, mV (SCE)
1
6
-500 -250 0 250 500 750 1000 1250 1500-8
-4
0
4
8 Free (0.1M HClO4
at 30oC)
j, m
A.c
m-2
E, mV (SCE)
-500 -250 0 250 500 750 1000 1250 1500
-6
0
6
12
18
0.1M HClO4+ xM Ethanol at 30
oC
1 0.05M
2 0.1M
3 0.2M
4 0.3M
5 0.4M
6 0.5M
7 0.6Mj, m
A.c
m-2
E, mV (SCE)
2
7
1
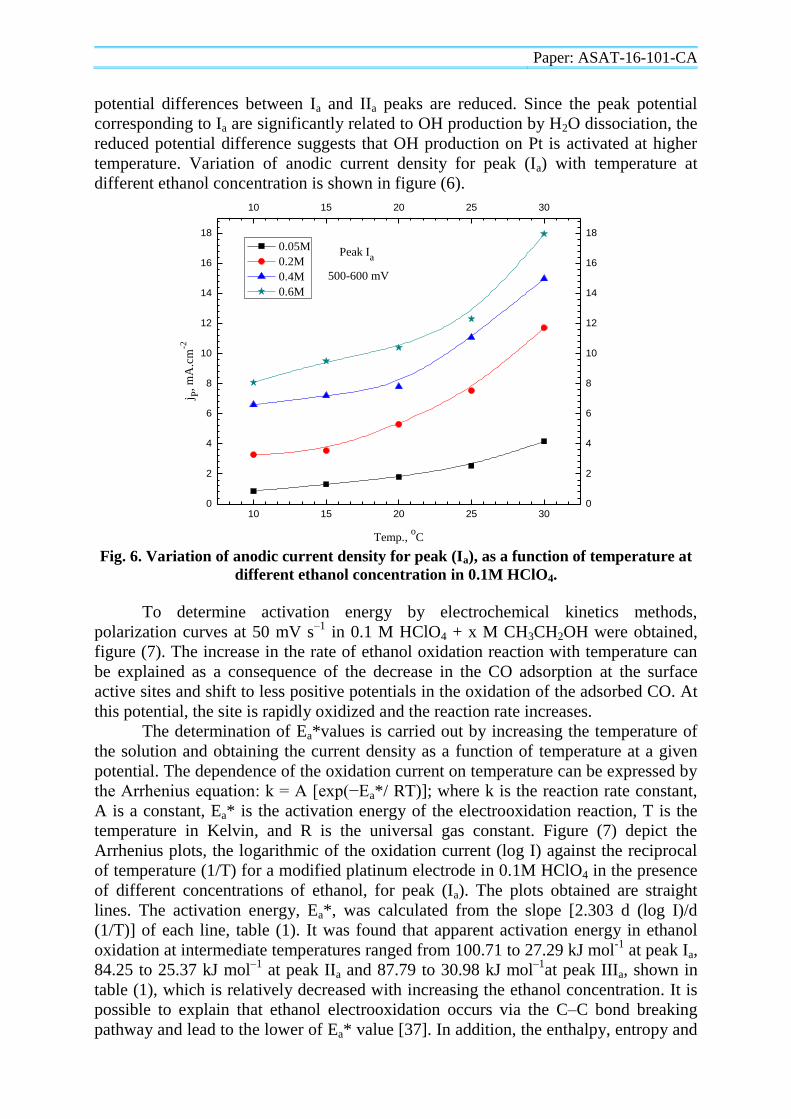
Paper: ASAT-16-101-CA
potential differences between Ia and IIa peaks are reduced. Since the peak potential
corresponding to Ia are significantly related to OH production by H2O dissociation, the
reduced potential difference suggests that OH production on Pt is activated at higher
temperature. Variation of anodic current density for peak (Ia) with temperature at
different ethanol concentration is shown in figure (6).
10 15 20 25 300
2
4
6
8
10
12
14
16
18
500-600 mV
Peak Ia
j P,
mA
.cm
-2
Temp., oC
0.05M
0.2M
0.4M
0.6M
10 15 20 25 30
0
2
4
6
8
10
12
14
16
18
Fig. 6. Variation of anodic current density for peak (Ia), as a function of temperature at
different ethanol concentration in 0.1M HClO4.
To determine activation energy by electrochemical kinetics methods,
polarization curves at 50 mV s–1
in 0.1 M HClO4 + x M CH3CH2OH were obtained,
figure (7). The increase in the rate of ethanol oxidation reaction with temperature can
be explained as a consequence of the decrease in the CO adsorption at the surface
active sites and shift to less positive potentials in the oxidation of the adsorbed CO. At
this potential, the site is rapidly oxidized and the reaction rate increases.
The determination of Ea*values is carried out by increasing the temperature of
the solution and obtaining the current density as a function of temperature at a given
potential. The dependence of the oxidation current on temperature can be expressed by
the Arrhenius equation: k = A [exp(−Ea*/ RT)]; where k is the reaction rate constant,
A is a constant, Ea* is the activation energy of the electrooxidation reaction, T is the
temperature in Kelvin, and R is the universal gas constant. Figure (7) depict the
Arrhenius plots, the logarithmic of the oxidation current (log I) against the reciprocal
of temperature (1/T) for a modified platinum electrode in 0.1M HClO4 in the presence
of different concentrations of ethanol, for peak (Ia). The plots obtained are straight
lines. The activation energy, Ea*, was calculated from the slope [2.303 d (log I)/d
(1/T)] of each line, table (1). It was found that apparent activation energy in ethanol
oxidation at intermediate temperatures ranged from 100.71 to 27.29 kJ mol-1
at peak Ia,
84.25 to 25.37 kJ mol–1
at peak IIa and 87.79 to 30.98 kJ mol–1
at peak IIIa, shown in
table (1), which is relatively decreased with increasing the ethanol concentration. It is
possible to explain that ethanol electrooxidation occurs via the C–C bond breaking
pathway and lead to the lower of Ea* value [37]. In addition, the enthalpy, entropy and

Paper: ASAT-16-101-CA
free energy were computed in electro-oxidation of ethanol and the results are given in
table (2).
Fig. 7.Arrhenius plot, log Iox against 1/ T for the modified Pt in 0.1M HClO4 at different
ethanol concentration, for peak (Ia).
Table 1. Activation energy, Ea, (kJ mol-1
) for oxidation current at different
concentrations of ethanol for all anodic peaks Ia,IIa&IIIa.
Concentration Ea*, (kJ mol
-1)
Ia IIa IIIa
0.05 M 100.71 84.25 87.79
0.1 M 79.15 79.6 74.39
0.2 M 52.39 44.75 46.68
0.3 M 32.36 31.2 36.04
0.4 M 30.7 31.2 33.07
0.5 M 29.55 26.79 32.88
0.6 M 27.29 25.37 30.98
3.30 3.35 3.40 3.45 3.50 3.55-1.2
-0.8
-0.4
0.0
0.4
0.8
1.2
0.05M
0.1M
0.2M
0.3M
0.4M
0.5M
0.6M
log
Io
x,
mA
103/T,
ok
-1
3.30 3.35 3.40 3.45 3.50 3.55
-1.2
-0.8
-0.4
0.0
0.4
0.8
1.2
500-600 mV
Peak Ia

Paper: ASAT-16-101-CA
Table 2. Thermodynamic parameters for oxidation current at different concentrations
of ethanol for all anodic peaks Ia,IIa&IIIa.
Ethanol
concentration
∆H*
(kJmol-1
)
∆S*
(Jmol-1
K-1
)
∆G*
(kJmol-1
)
Ia
0.05 M 98.28 9.89 95.99
0.1 M 76.72 -61.32 95
0.2 M 49.96 -153.07 95.58
0.3 M 29.93 -221.85 96.04
0.4 M 28.26 -228.4 96.32
0.5 M 27.11 -233.02 96.55
0.6 M 24.85 -241.51 96.82
IIa
0.05 M 81.82 -50.58 96.89
0.1 M 77.03 -64.77 96.33
0.2 M 42.32 -184.11 97.19
0.3 M 28.72 -231.24 97.63
0.4 M 28.72 -232.57 98.03
0.5 M 24.36 -247.91 98.24
0.6 M 22.94 -253.41 98.46
IIIa
0.05 M 85.36 -16.86 90.38
0.1 M 71.94 -60.19 89.88
0.2 M 44.25 -160.05 91.95
0.3 M 33.6 -200.09 93.23
0.4 M 30.64 -231.71 94.33
0.5 M 30.44 -216.78 95.04
0.6 M 28.55 -225.22 95.67
3.4. Effect of time of Pt modification
Fundamental studies of ethanol reactions on metals and oxides, examining the
relationships between surface properties (structure, surface defects, etc.) and the
reaction yields, have helped to further our understanding of the various processes. The
different reactions occurring with ethanol on metal and metal oxide surfaces are
showed in previous [38]. The reaction can be shifted from CO to CO2 and from H2 to
H2O, depending on the ethanol: oxygen ratio. Thus, the balance is not simple and the
role of the catalyst is crucial.
Dissociative chemisorption of the alcohols is a process which occurs at fairly
high potentials, at which the Pt surface contains oxide or hydroxide sites, and, in
principle, the reactivity of the hydroxyl group of the alcohol should be independent of
the chain length [39]. For most electrocatalytic processes the specific activity (i.e. the
activity per unit hydrogen electrode area) of platinized platinum (Pt/Pt) electrodes is
lower than that of smooth Pt [40].
The cyclic voltammetry of a modified Pt electrode was also performed in 0.1M
HClO4 solution between –0.4 and 1.5V at a scan rate of 50 mV s–1
after modification

Paper: ASAT-16-101-CA
of Pt electrode for 15, 30, 45, 60 minutes, as shown in figures (8, 2, 9, 10),
respectively. From these figures, we can see clearly that the modification increases the
electrocatalytic activity for ethanol oxidation by increasing number and activity of the
reaction sites.
Fig. 8. Cyclic voltammograms of platinum at different concentrations of ethanol, at 25
°C (15 min. modification), at the sweep rate of 50 mV/s in 0.1M HClO4.
Fig. 9. Cyclic voltammograms of platinum at different concentrations of ethanol, at 25
°C (45 min. modification), at the sweep rate of 50 mV/s in 0.1M HClO4.
-500 -250 0 250 500 750 1000 1250 1500
-6
-3
0
3
6 Free (0.1M HClO4
at 15 min. ox.)
j, m
A.c
m-2
E, mV (SCE)
-500 -250 0 250 500 750 1000 1250 1500-8
-4
0
4
8
12
16 0.1M HClO4+ xM Ethanol at 15 min. ox.
1 0.1M
2 0.2M
3 0.3M
4 0.4M
5 0.5M
6 0.6Mj, m
A.c
m-2
E, mV (SCE)
1
6
-500 -250 0 250 500 750 1000 1250 1500-8
-4
0
4
8 Free (0.1M HClO
4 at 45 min. ox.)
j, m
A.c
m-2
E, mV (SCE)
-500 -250 0 250 500 750 1000 1250 1500-8
-4
0
4
8
12
16 0.1M HClO4 + xM Ethanol at 45 min. ox.
1 0.05M
2 0.1M
3 0.2M
4 0.3M
5 0.4M
6 0.5M
7 0.6Mj, m
A.c
m-2
E, mV (SCE)
1
7

Paper: ASAT-16-101-CA
Fig. 10. Cyclic voltammograms of platinum at different concentrations of ethanol, at 25
°C (60 min. modification), at the sweep rate of 50 mV/s in 0.1M HClO4.
Plots of the logarithm of current densities (log jp) vs. the logarithm of the
concentrations of ethanol for anodic peak (Ia) on the modified Pt electrode in 0.1M
HClO4 after different times of modification, are shown in figure (11) at 25 °C. The rate
of current increase is higher for lower number of cycles and decreased gradually due to
saturation of the surface by active sites at longer cyclization.
-1.4 -1.2 -1.0 -0.8 -0.6 -0.4 -0.2
0.2
0.4
0.6
0.8
1.0
1.2
log
j,
mA
.cm
-2
log Ceth
, M
15 min. modification
30 min. modification
60 min. modification
-1.4 -1.2 -1.0 -0.8 -0.6 -0.4 -0.2
0.2
0.4
0.6
0.8
1.0
1.2
500-600 mV
Peak Ia
Fig. 11. Plots of log jp vs. log Cethanol for anodic peak (Ia) in 0.1M HClO4 after different
times of modification, at 25 °C.
It can be observed that the CVs exhibit the irreversible nature of the ethanol
electrooxidation that is characteristic of the modified Pt catalyst. The onset for ethanol
electrooxidation occurs at approximately 0.4 V but a shift to more negative potentials is
-500 -250 0 250 500 750 1000 1250 1500
-4
0
4
8 Free (0.1M HClO4at 60 min. ox.)
j, m
A.c
m-2
E, mV (SCE)
-500 -250 0 250 500 750 1000 1250 1500-6
0
6
12
18
0.1M HClO4+ xM Ethanol at 60 min. ox.
1 0.05M
2 0.1M
3 0.2M
4 0.3M
5 0.4M
6 0.5M
7 0.6M
j, m
A.c
m-2
E, mV (SCE)
1
7

Paper: ASAT-16-101-CA
clearly apparent when introducing O-species on the Pt electrode, especially in the case
of the 60 minutes of modification compared to those of 15, 30, 45 minutes of
modification to reach about 0.3 V. Moreover, different maximum current densities are
achieved during the positive potential scan. The highest current density is apparent for
60 minutes modification, and it is about 1.5 that obtained for 15 minutes modification.
The modified Pt electrocatalyst also increases the catalytic activity of higher ethanol
concentrations, by a factor of 5 when compared to lower ethanol concentrations.
Therefore, the activity order towards ethanol electrooxidation can be established as
follows: the modification for (60 minutes > 45 minutes > 30 minutes > 15 minutes).
Then, the content of oxides/hydroxides on the Pt catalysts affects the catalytic activity
for ethanol electrochemical oxidation allowing the oxidation at lower potentials and
increasing the current density values.
The electrochemical parameters for the oxidation reaction including the onset
potential and the anodic peak potential (EsIa
, EpIa
), are given in figures (12, 13),
respectively. The onset potential (EsIa
) for given concentrations (0.05–0.6M) after 15
minutes modification decreases from 0.46 to 0.37 V and decreases about 0.42 to 0.31 V
after 60 minutes modification for the anodic peak (Ia). The peak potential (EpIa
) after 15
minutes modification is 0.55–0.51 V decreases to 0.53–0.49 V after 60 minutes
modification for the same peak which are approximately close to each other. So, the
increase in current peaks (IpIa
) was noticed by increasing the modification time of Pt
electrode and also by the ethanol concentration.
Fig. 12. Variation of onset potential for peak (Ia), as a function of ethanol
concentrationin 0.1M HClO4, at different times of Pt modification.
0.0 0.1 0.2 0.3 0.4 0.5 0.6
300
320
340
360
380
400
420
440
460
500-600 mV
Peak Ia
15 min. ox.
30 min. ox.
45 min. ox.
60 min. ox.
EsIa
, m
V
Conc.eth
, M
0.0 0.1 0.2 0.3 0.4 0.5 0.6
300
320
340
360
380
400
420
440
460

Paper: ASAT-16-101-CA
Fig. 13. Variation of peak potential for peak (Ia), as a function of ethanol concentration
in 0.1M HClO4, at different times of Pt modification.
3.5. Quantity of Electricity Curves:
Here, we used the amount of coulombs released during alcohol
electrooxidation to measure the activity of ethanol electrooxidation. Charge associated
with a cyclic voltammetry could be determined by manual technique of cutting and
weighing the peaks and then taking the ratio of the peak weight to a rectangle of a
known area and weight [41].
Figure (14) represents the charge density involved in the ethanol
electrooxidation in 0.1 M HClO4 solution compartment as a function of different
ethanol concentrations after 30 minutes of Pt modification.
It was found that the quantity of electricity increases as ethanol concentration
increases. It can be seen that, in the case of 0.05–0.6 M ethanol and 30 minutes of Pt
modification, the quantity of electricity increased from 52.9 to 243.7 mC cm–2
. The
results show that ethanol is more easily electrochemically oxidized as ethanol
concentration increases. The charging performance of ethanol electrooxidation
increases at the modified Pt electrode and higher concentrations of ethanol.
0.0 0.1 0.2 0.3 0.4 0.5 0.6490
500
510
520
530
540
550
560
500-600 mV
Peak Ia
15 min. ox.
30 min. ox.
45 min. ox.
60 min. ox.
EP
Ia,
mV
Conc.eth
, M
0.0 0.1 0.2 0.3 0.4 0.5 0.6
490
500
510
520
530
540
550
560

Paper: ASAT-16-101-CA
Fig. 14. Quantity of electricity for different ethanol concentrationsin 0.1M HClO4, after
30 minutes of Pt modification.
The charge densities of ethanol electrooxidation were evaluated in the
temperature range of 10–30 °C, shown in Fig. (15). The results obtained clearly show
on the modified Pt based electrocatalysts, the charge density in case of 30 °C was 2–3
times higher than in case of 10 °C, reaching a limiting value of 372.14 mC cm–2
. It is
clear that the temperature rising has a positive effect on the anode performance
towards ethanol oxidation; in addition to the ethanol concentration which improves the
extent oxidation of ethanol.
Fig. 15. Quantity of electricity as a function of ethanol concentrationin 0.1M HClO4, at
different temperatures, after 30 minutes of Pt modification.
0.0 0.1 0.2 0.3 0.4 0.5 0.6
50
100
150
200
250 30 min. modification
Qd
ensi
ty,
mC
.cm
-2
Conceth.
, M
0.0 0.1 0.2 0.3 0.4 0.5 0.6
50
100
150
200
250
0.0 0.1 0.2 0.3 0.4 0.5 0.6
50
100
150
200
250
300
350
400
10 oC
15 oC
20 oC
25 oC
30 oC
Qd
ensi
ty,
mC
.cm
-2
Conc.eth
, M
0.0 0.1 0.2 0.3 0.4 0.5 0.6
50
100
150
200
250
300
350
400

Paper: ASAT-16-101-CA
The Effect of modification time for the electrooxidation of ethanol on
the modified Pt electrode prepared with different modification time was shown in Fig.
(16). When the modification time was prolonged from 15 to 60 minutes, the amount of
coulombs for the alcohol oxidation increased with the modification time. The oxide
thick film obtained at the modification time of 60 minutes shows a higher catalytic
activity than at obtained in the case of modification time of 15 minutes. Therefore, the
modification time can strongly affect the electrooxidation process. When the
modification time increased from 15 to 60 minutes, the charge density increased from
133.9 to 203.3 mC cm–2
for 0.3M of ethanol. Meanwhile, the synergistic effect of
oxide film and ethanol concentration on the overall catalytic activity of the Pt
electrode can be taken into account. Consequently, for low adsorbed oxide, the
modified Pt catalyst exhibits low catalytic activity due to the lack of active oxidizing
species.
Fig. 16. Quantity of electricity as a function of ethanol concentrationin 0.1M HClO4, at
different times of Pt modification, at 25 °C.
4. Conclusions In the present paper, the electrooxidation properties of ethanol which are
promising candidates for DAFCs, was studied under different ethanol concentrations,
temperatures and times of Pt modification with oxide formation. The electrooxidation
of ethanol on modified Pt electrode was explored by cyclic voltammetry
measurements. The major roles of Pt-O sites were to increase the activities of ethanol
electrooxoidation by adsorbed water as OHads formation on Pt electrode.
Modified Pt electrode was well characterized and utilized for the
electrochemical measurement of ethanol oxidation at 10–30 °C. The increase in anodic
current value at higher temperatures indicated that the reaction rate would be
enhanced. As a result, the current density at 25 °C exceeds that at 10 °C of the ethanol
oxidation. At 30 °C, the ethanol oxidation current density overcomes that at 25 °C.
The highest current density for the ethanol oxidation at 0.6 M ethanol to peak Ia, is
0.0 0.1 0.2 0.3 0.4 0.5 0.60
50
100
150
200
250
300
350
15 min. ox.
30 min. ox.
45 min. ox.
60 min. ox.
Qd
ensi
ty,
mC
.cm
-2
Conc.eth
, M
0.0 0.1 0.2 0.3 0.4 0.5 0.6
0
50
100
150
200
250
300
350

Paper: ASAT-16-101-CA
obtained at 30 °C 17.93 mA/cm2, then at 25 °C is 12.31 mA/cm
2, whereas at 10 °C is
8.085 mA/cm2. Consequently, it is deduced that ethanol has an advantage during the
rising operation temperature. From the Arrhenius analysis, the activation energy of
ethanol electrooxidation on the modified Pt electrode was ranged from 100.71 to 27.29
kJ mol–1
for peak Ia. It is suggest that ethanol occur via the C–C bond breaking
pathway and lead to the lower of Ea value.
Also, the rising of modification time for Pt electrode has a positive effect on the
anode performance towards ethanol oxidation; in addition to the ethanol concentration
which improved adsorption as a preceding step in ethanol oxidation.
5. References
[1] E. Herrero, L. J. Buller andH. D.Abruña, Chem. Rev., 101 (2001) 1897–930.
[2] C. Lamy, E. M. Belgsir, and J. M. Léger, Journal of Applied Electrochemistry, 31
(2001) 799–809.
[3] C. Lamy, A. Lima, V. Le Rhun, F. Delime, C. Coutanceau and J. M. Léger, Journal
of Power Sources, 105 (2002) 283–296.
[4] J. Wang, S. Wasmus and R. F. Savinell, J. Electrochem. Soc., 142 (1995)
4218.
[5] T. D. Jarvi and E. M. Stuve, Electrocatalysis (Edited for J. Lopkowski and P.N.
Ross), Chapter. 3, Wiley- VCH, New York, (1998), p. 75.
[6] L. Burke, Electrodes of Conductive Metallic Oxides (Edited for S. Trasatti),
Elsevier, (1981), Chap. 3.
[7] V. Rao, C. Cremers, U. Stimming, L. Cao, S. Sun, S. Yan, G. Sun and Q. Xin,
Journal of the Electrochemical Society, 154 (2007) B1138.
[8] María V. Martínez-Huerta, Nikolaos Tsiouvaras, Gonzalo García, Miguel A. Peña,
Elena Pastor, José L. Rodriguez and José L. G. Fierro, Catalysts, 3 (2013) 811-838.
[9] G. A. Camara and T. Iwasita, Journal of Electroanalytical Chemistry, 578 (2005)
315.
[10] E. Antolini, J. Power Sources, 170 (2007) 1–12.
[11] T. Iwasita and W. Vielstich, Journal of Electroanalytical Chemistry and
Interfacial Electrochemistry, 257:1-2 (1988) 319–324.
[12] Chi-Chang Hu, Kweun-Yo Liu, Electrochim. Acta, 44 (1999) 2727.
[13] Yi-Fu Yang and G. Denuault, J. Electroanal. Chem., 443 (1998) 273.
[14] F. Villiard and G. Jerkiewicz, Can. J. Che., 75 (1997) 1656.
[15] Riyanto, TEKNOIN, 10 (3), (2005), 181-190.
[16] D. A. Cantane, W. F. Ambrosio, M. Chatenet and F. H. B. Lima, Journal of
Electroanalytical Chemistry, 681 (2012) 56–65.
[17] Hanaa B. Hassan, The Open Electrochemistry Journal, 1 (2009) 19-27.
[18] M. M. P. Janssen and J. Moolhuysen, Electrochim. Acta, 21 (1976) 869.
[19] V. S.Bagotsky, Yu. B. Vassiliev and Khazova O. A. Generalized, J. Electroanal.
Chem., 81 (1977) 229–238.
[20] A. Hamnett and B. J. Kennedy, J. Electrochim. Acta, 33 (1988)
1613–1618.
[21] H. A. Gasteiger, M. N. Markovic and P. N. Ross, J. Catal. Lett., 36 (1996) 1–8.
[22] M. Schell, J. Electroanal. Chem., 457 (1998) 221.
[23] M. Krausa and W. Vielstich, J. Electroanal. Chem. 399 (1995) 7.
[24] R. S. Gonc¸ alves, J. M. Léger and C. Lamy, Electrochim. Acta, 34 (1998) 433.
Paper: ASAT-16-101-CA
[25] H. Hitmi, E. M. Belgsir, J. M. Léger, C. Lamy and R. O. Lezna, Electrochimica
Acta, 39 (1994) 407–415.
[26] E. Antolini, J. Power Sources, 170 (2007) 1.
[27] J. Willsau and J. Heitbaum, J. Electroanal. Chem., 194 (1985) 27.
[28] T. Iwasita and E. Pastor, Electrochim. Acta, 39 (1994) 531.
[29] B. Bittins-Cattaneo, S. Wilhelm, E. Cattaneo, H. W. Buschmann, W. Vielstich and
Ber. Bunsenges, Phys. Chem., 92 (1988) 1210.
[30] J. F. E. Gootzen, W. Visscher and J. A. R. Van Veen, Langmuir, 12 (1996) 5076.
[31] F. Vigier, C. Coutanceau, A. Perrard, E. M. Belgsir and C. Lamy, Journal of
Applied Electrochemistry, 34 (2004) 439–446.
[32] R. A. Rightmire, R. L. Rowland, D. L. Boos and D. L. Beals, Journal of the
Electrochemical Society, 111 (1964) 242.
[33] T. Iwasita and E. Pastor, Electrochimica Acta, 39 (1994) 531–547.
[34] C. Lamy, S. Rousseau, E. M. Belgsir, C. Coutanceau and J. M. Léger,
Electrochimica Acta, 49 (2004) 3901–3908.
[35] R. N. Singh, A.Singh and Anindita, Int. J. Hydrogen Energy, 34 (2009) 2052–7.
[36] M. Umeda, M. Kokubo, M. Mohaedi and I. Uchida, Electrochim. Acta, 48 (2003)
1363–74.
[37] Panadda Katikawong, Tanakorn Ratana and Waret Veerasai, J. Chem. Sci.,
121(3), (2009) 329–337.
[38] H. Idriss, Platinum Metals Rev., 48 (3), (2004) 105–115.
[39] Claudia Yáñez, Claudio Gutiérrez, M. Soledad Ureta-Zañartu,Journal of
Electroanalytical Chemistry, 541(2003) 39–49.
[40] S. N. Pron’kin, O. A. Petrii, G. A. Tsirlina and D. J. Schiffrin, J. Electroanal.
Chem., 480 (2000) 112.
[41] Omar A. Hazzazi, Ph-D-thesis "Electrochemical studies of metal deposition and
surface chirality at well-defined platinum single crystal electrodes", University of
Wales, (2002) p:148


