Kinetic study on martensite formation in steels 1045 and ... · PDF...
9
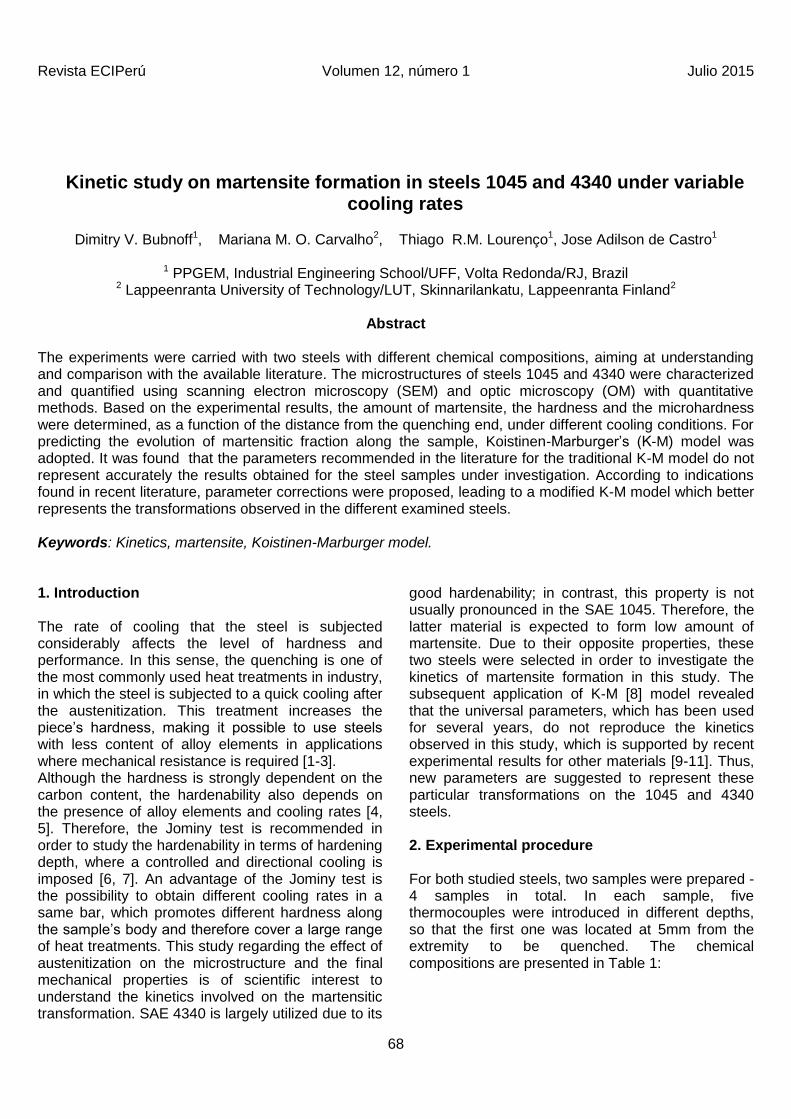
Revista ECIPerú Volumen 12, número 1 Julio 2015 68 Kinetic study on martensite formation in steels 1045 and 4340 under variable cooling rates Dimitry V. Bubnoff 1 , Mariana M. O. Carvalho 2 , Thiago R.M. Lourenço 1 , Jose Adilson de Castro 1 1 PPGEM, Industrial Engineering School/UFF, Volta Redonda/RJ, Brazil 2 Lappeenranta University of Technology/LUT, Skinnarilankatu, Lappeenranta Finland 2 Abstract The experiments were carried with two steels with different chemical compositions, aiming at understanding and comparison with the available literature. The microstructures of steels 1045 and 4340 were characterized and quantified using scanning electron microscopy (SEM) and optic microscopy (OM) with quantitative methods. Based on the experimental results, the amount of martensite, the hardness and the microhardness were determined, as a function of the distance from the quenching end, under different cooling conditions. For predicting the evolution of martensitic fraction along the sample, Koistinen-Marburger’s (K-M) model was adopted. It was found that the parameters recommended in the literature for the traditional K-M model do not represent accurately the results obtained for the steel samples under investigation. According to indications found in recent literature, parameter corrections were proposed, leading to a modified K-M model which better represents the transformations observed in the different examined steels. Keywords: Kinetics, martensite, Koistinen-Marburger model. 1. Introduction The rate of cooling that the steel is subjected considerably affects the level of hardness and performance. In this sense, the quenching is one of the most commonly used heat treatments in industry, in which the steel is subjected to a quick cooling after the austenitization. This treatment increases the piece’s hardness, making it possible to use steels with less content of alloy elements in applications where mechanical resistance is required [1-3]. Although the hardness is strongly dependent on the carbon content, the hardenability also depends on the presence of alloy elements and cooling rates [4, 5]. Therefore, the Jominy test is recommended in order to study the hardenability in terms of hardening depth, where a controlled and directional cooling is imposed [6, 7]. An advantage of the Jominy test is the possibility to obtain different cooling rates in a same bar, which promotes different hardness along the sample’s body and therefore cover a large range of heat treatments. This study regarding the effect of austenitization on the microstructure and the final mechanical properties is of scientific interest to understand the kinetics involved on the martensitic transformation. SAE 4340 is largely utilized due to its good hardenability; in contrast, this property is not usually pronounced in the SAE 1045. Therefore, the latter material is expected to form low amount of martensite. Due to their opposite properties, these two steels were selected in order to investigate the kinetics of martensite formation in this study. The subsequent application of K-M [8] model revealed that the universal parameters, which has been used for several years, do not reproduce the kinetics observed in this study, which is supported by recent experimental results for other materials [9-11]. Thus, new parameters are suggested to represent these particular transformations on the 1045 and 4340 steels. 2. Experimental procedure For both studied steels, two samples were prepared - 4 samples in total. In each sample, five thermocouples were introduced in different depths, so that the first one was located at 5mm from the extremity to be quenched. The chemical compositions are presented in Table 1:
-
Upload
dangkhuong -
Category
Documents
-
view
219 -
download
3
Transcript of Kinetic study on martensite formation in steels 1045 and ... · PDF...
Revista ECIPerú Volumen 12, número 1 Julio 2015
68
Kinetic study on martensite formation in steels 1045 and 4340 under variable cooling rates
Dimitry V. Bubnoff1, Mariana M. O. Carvalho2, Thiago R.M. Lourenço1, Jose Adilson de Castro1
1 PPGEM, Industrial Engineering School/UFF, Volta Redonda/RJ, Brazil
2 Lappeenranta University of Technology/LUT, Skinnarilankatu, Lappeenranta Finland2
Abstract
The experiments were carried with two steels with different chemical compositions, aiming at understanding and comparison with the available literature. The microstructures of steels 1045 and 4340 were characterized and quantified using scanning electron microscopy (SEM) and optic microscopy (OM) with quantitative methods. Based on the experimental results, the amount of martensite, the hardness and the microhardness were determined, as a function of the distance from the quenching end, under different cooling conditions. For predicting the evolution of martensitic fraction along the sample, Koistinen-Marburger’s (K-M) model was adopted. It was found that the parameters recommended in the literature for the traditional K-M model do not represent accurately the results obtained for the steel samples under investigation. According to indications found in recent literature, parameter corrections were proposed, leading to a modified K-M model which better represents the transformations observed in the different examined steels. Keywords: Kinetics, martensite, Koistinen-Marburger model. 1. Introduction The rate of cooling that the steel is subjected considerably affects the level of hardness and performance. In this sense, the quenching is one of the most commonly used heat treatments in industry, in which the steel is subjected to a quick cooling after the austenitization. This treatment increases the piece’s hardness, making it possible to use steels with less content of alloy elements in applications where mechanical resistance is required [1-3]. Although the hardness is strongly dependent on the carbon content, the hardenability also depends on the presence of alloy elements and cooling rates [4, 5]. Therefore, the Jominy test is recommended in order to study the hardenability in terms of hardening depth, where a controlled and directional cooling is imposed [6, 7]. An advantage of the Jominy test is the possibility to obtain different cooling rates in a same bar, which promotes different hardness along the sample’s body and therefore cover a large range of heat treatments. This study regarding the effect of austenitization on the microstructure and the final mechanical properties is of scientific interest to understand the kinetics involved on the martensitic transformation. SAE 4340 is largely utilized due to its
good hardenability; in contrast, this property is not usually pronounced in the SAE 1045. Therefore, the latter material is expected to form low amount of martensite. Due to their opposite properties, these two steels were selected in order to investigate the kinetics of martensite formation in this study. The subsequent application of K-M [8] model revealed that the universal parameters, which has been used for several years, do not reproduce the kinetics observed in this study, which is supported by recent experimental results for other materials [9-11]. Thus, new parameters are suggested to represent these particular transformations on the 1045 and 4340 steels. 2. Experimental procedure For both studied steels, two samples were prepared - 4 samples in total. In each sample, five thermocouples were introduced in different depths, so that the first one was located at 5mm from the extremity to be quenched. The chemical compositions are presented in Table 1:

Revista ECIPerú Volumen 12, número 1 Julio 2015
69
Table1: Chemical composition (wt pct). SAE C S P Si Mn Cr Ni Mo V Nb 1045 0.424 0.026 0.027 0.199 0.888 – – – 0.001 –
4340 0.383 0.020 0.021 0.323 0.764 0.818 1.721 0.243 0.008 0.022
The samples (CP) were heated in a temperature controlled furnace to about 100°C above the austenitization temperature, then they were placed into a support and the controlled water flow was maintained at 12.5 mm of jet height. The data acquisition system uses the Spider software recorded in real time the cooling data. After Jominy experiments, the samples were cross cut - the measurements’ and thermocouples’ locations can be seen in Fig. 1, in which the cuts and the marked surfaces are shown. It can be observed that six cross sections were made in each sample, which are represented sequentially by the letters of the alphabet. In total, 12 samples of steel 1045 and the same quantity for the steel 4340 were analyzed.
Figure 1: Positions in the specimen for thermocouples and slices for microstructural analysis. Table 2 shows the identification of the samples and the thermocouples locations, which are used as the nomenclature for the results and discussions:
Table 2: Identification of steel samples used in this study.
4340 1 A B C D E F
2 G H I J K L
1045 1 M N O P Q R
2 S T U V X Z
3. Results and discussion All the curves presented and their corresponding microstructures were obtained by measurements around the thermocouples’ positions. The results out of these regions were obtained by interpolation, considering that the trends can be applied to the whole piece. The martensite’s volume fractions around the thermocouples were estimated using quantitative metallography. Finally, these volume fractions in the corresponding regions are confronted with the respective results for microhardness and hardness. In order to theoretically estimate the martensite transformation, the K-M model was applied and compared with the final measurements
on each region. According to the results obtained, this model is not able to accurately predict the phenomena in the investigated samples. Therefore, new parameters are proposed in order to improve the model’s performance in this situation. A discussion regarding the applicability of this model is addressed and new parameters are suggested in order to accurately predict the final volume fractions of martensite of these steel samples. Based on the experimental results, the conclusion of this paper is that it was possible to get new parameters for K-M simulations which are able to better represent the real kinetics of the transformations for the 1045 and 4340 steels.
Figure 2: Comparative hardness measurements along the 1045 steel. Figure 2 represents a comparison between the average hardnesses of two samples (1 and 2) of 1045 steel. The quenched extremity has a hardness corresponding to a steel with this percentage of carbon, since the cooling was sufficiently fast to attain practically 100% of martensite. It was also noticed that this material presents an abrupt decrease in the values of HRC hardness near to the quenched extremity, which can be confirmed by the results obtained by optical OM microscopy and SEM (Fig 8). The reason for such behavior is probably due to the fact that the kinetics of this transformation was not fast enough to avoid formation of ferrite and cementite.
Figure 3: Comparative hardness measurements along the 4340 steel. Figure 3 represents a comparison between the average hardness obtained in the samples 1 and 2 of the 4340 steel. These results show that, for this material, the hardness remains above 50 HRC even

Revista ECIPerú Volumen 12, número 1 Julio 2015
70
for the 60 mm distance, which is in accordance with the presence of martensitic structure along the whole piece (Fig.9). Using the softwares Image Pro-Plus and Image J it was possible to estimate with accuracy the martensitic volumetric fraction in the steel samples. These results can be seen in Figures 4 and 5, in which the nomenclature utilized follows the indication shown in Table 2 and Figure 1.
Figure 4: Measurements of martensite formation along 1045 steel sample. These results can be seen in Figures 4 and 5, in which the nomenclature utilized follows the indication shown in Table 2 and Figure 1.
Figure 5: Measurements of martensite formation along 4340 steel sample. Additionally the samples were subjected to a microhardness test, which has significant importance due to his potential correlation with mechanical properties.
Figure 6: Averaged microhardness for 1045 samples
Figure 7: Averaged microhardness for 4340 samples. The results presented in Figures 2 to 8 are in complete agreement with the results of metalographic analysis (OM and SEM) and show consistence for all positions.
a
b 1045 - (a) M region, (b) R region. OM_500x
1045 - (a) M region, (b) R region. SEM_3000x
a
b 4340 - (a) G region , (b) L region. OM_500x
4340 - (a) G region, (c) L region. SEM_3000x
Figure 8: Compartive microstures obtained by OM and SEM for 1045 and 4340 steels.
The Figure 8 shows the microstructures as indicated by the Table 2. The presence of martensitic structure

Revista ECIPerú Volumen 12, número 1 Julio 2015
71
is observed in Figures 8(a), originated from the fast cooling in this region. In Figure 8 (1045b), it is shown that the acicular ferrite fraction continuously increased as the position is distanced from the quenching surface. In Figure 8 (4340a,b), it can be observed that this sample is mostly composed of martensitic structure along the whole sample. From this result, it is found that, as expected, the carbon content has strong effect on the hardenability only near the region of strong quenching and the hardness of the piece as a whole depends more on the alloying elements. After all aforementioned tests, the K-M model was used to verify its ability to predict the martensite evolution in these steels. Although it is argued that the model proposed by Koistinen and Marburger [8] is able to reasonably predict the kinetic of martensite transformation in most usual steels, experimental results for some particular steels has shown large discrepancy and some authors have proposed parameters corrections based on chemical compositions and cooling rates, as follows:
TMsy exp (1)
where yγ is the residual austenite fraction; α was
considered to be approximately equal to 1.10×10⁻² K-
1. Meyzaud and Sauzay [9] tested Koistinen and Marburger’s formula modifying the original equation for:
700
3001)(011,0exp tTMsy (2)
where ]03,0exp[1exp41,0 700
300
700
300 tt
700
300t is the time needed for cooling a material from
700 ºC to 300 ºC. PROPOSED CORRECTIONS FOR MARTENSITE PREDICTION IN 4340 AND 1045 STEELS: Taking Meyzaud and Sauzay’s model [9] as a reference, the parameters ∆t, temperature evolution and final volume fractions were measured and a general equation was proposed with the parameters A and B, which can be adjusted for each steel sample.
]exp[1exp 700
300
700
300 tBAt
By applying this formulation to the experimental data obtained in this study, the results for new parameters can be drawn. Thus, a specialized equation based on K-M model can be obtained for these steels. In Figures 9 and 10 (presents empirically obtained cooling rates), for the steels 1045 and 4340 respectively, are presented the comparisons
between the simulations using Eq. (2) Koistinen, Marburger, Meyzaud, Sauzay (K-M) and of K-M modified in this investigation (K-M-c). Figure 9 compares the martensite fractions as predicted by the K-M and K-M-c models in the first thermocouple (quenching end). The experimental cooling curve ”R” is plotted in blue, for reference. In this chart, the right scale corresponds to the cooling curve (temperature) and the left one is representing the models (martensite volume fraction).
1045-M sample
4340-G sample
Figure 9: Prediction of martensite formation during the cooling time, first thermocouples/quenching end.
In Figure 9, it can be observed that when the temperature curves droped below 300°C the martensite formation started. The general trend of the curves kept the same and, with the new paramters proposed, the experimental data and model predictions get closer (Table 3). The cooling rates used to adjust the model parameters were locally calculated for each thermocouple and hence represent the tranformation conditions in each region of the piece. The 4340 steel presented martensite volume fraction around 95% and the 1045 steel about 90%, and the cooling rates are -3.17°C/s and -3°C/s accordingly. The new corrected parameters suggested in this study for K-M-c simulation were: 4340 – 0.25 and 0.005; 1045 – 0.19 and 0.01. The curves obtained through the K-M simulation appeared inflexible and almost did not changed, therefore they were applied only for the quenching end. For this reason, they are not shown

Revista ECIPerú Volumen 12, número 1 Julio 2015
72
in Figures 11 to 18. Figures 11 and 12 show the temperature, cooling rates and martensite predictions for the second thermocouples (15 mm).
1045-M sample
4340-G sample
Figure 10: Cooling rates measurements, first thermocouples/quenching end.
1045-N sample
4340-H sample
Figure 11: Prediction of martensite formation during the cooling time in the second thermocouples. The 4340 steel presented martensite around 90% while 1045 only about 10% for similar temperatures and cooling rates, -1.45°C/s and -1.4°C/s respectively. As alredy explained, the reason the
amount of alloying content of the 4340 steel. The new parameters suggested were: 4340 – 0.25 and 0.005; 1045 – 0.38 and 0.018.
1045-N sample
4340-H sample
Figure 12: Cooling rates mesurements in the second thermocouples.
1045-N sample
4340-H sample
Figure 13: Prediction of martensite formation during the cooling time, third thermocouples.

Revista ECIPerú Volumen 12, número 1 Julio 2015
73
Figures 13 and 14 show the third termocouples at 30 mm distance from the end of the Jominy sample. The cooling rate for the 1045 steel (-1.2°C/s) was higher than for the 4340 steel, which was only -0.6°C/s. This value correspons to half of the cooling rate usually applied to carbon steel. Nonetheless, even with such low half cooling rate applied to the microcoalloyed steel, it was able to form practically 85 % of martensite while the 1045 steel remained without changes. The new parameters for K-M model suggested were: 4340 – 0.25 and 0.005; 1045 – 0.39 and 0.01.
1045-N sample
4340-H sample
Figure 14: Cooling rates measurements, third thermocouples. Figures 15 and 16 show the condiction of the fourth termocouples located at 45 mm distance. The conditions were similar to the third termocouples, as the cooling rates were: -1.2°C/s for the 1045 steel and -0.58°C/s for the 4340 steel. The microcoalloyed steel reached 80 % of martensitic formation, on the contrary, the carbon steel kept a despicable percentage of 3 % approximately. The new parameters suggested were the same as for third thermocouples.
1045-N sample
4340-H sample
Figure 15: Prediction of martensite formation during the cooling time, fourth thermocouples.
1045-N sample
4340-H sample
Figure 16: Measurements of the cooling rates, fourth thermocouples.

Revista ECIPerú Volumen 12, número 1 Julio 2015
74
1045-N sample
4340-H sample
Figure 17: Prediction of martensite formation during the cooling time, fifth thermocouples.
Figures 17 and 18 show the last thermocouples situated on the opposite side of the Jominy sample. They reveal that even at 60 mm distance and cooling rate of -0.57°C/s, 4340 steel forms between 75% and 80% martesite. At the same time, the 1045 steel with a cooling rate of -1.06°C/s practically does not produce any martensite. This could be attributed to the fact that the microalloyed steel 4340 continues the matensite formation even at a cooling rate of -0.2°C/s. To reinforce the arguments discussed in this paper, there are two curves shown in Figure 19 in which the results of the K-M simulations are presented: the green triangle line corresponds to Eq. (1) representing the original Koistinen Marburger’s model; on the other hand, the orange square line is obtained from Eq. (2). It is evidenced in Figure 19, which corresponds to the 1045-Q steel (fifth thermocouple, the most distant from the quench end), the great difference between the K-M simulations and the experimental data (real situation).
1045-N sample
4340-H sample
Figure 18: Measurements of the cooling rates, fifth thermocouples.
Figure 19: Comporative statement of simulations, 1045-Q, fifth thermocouple.
The results were supported by measurements of hardness, microhardness and metallographic analysis that served as a basis for the parameters corrections proposed in this study. Figure 19 compares the results predicted by the K-M models without any corrections and K-M-c with proposed corrections, which are in good aggreement with the final volume fractions obtained by the combined methods. Contrarly, it was observed and confirmed that the K-M models using the original parameters are roughtly discrepant with the experimental data for these steels, which justify the contribution of this paper and corroborate with other authors [5,9-11]. Table 3 shows the data obtained during this study by experimental procedure and model predictions.

Revista ECIPerú Volumen 12, número 1 Julio 2015
75
Table 3: The corrected parameters for K-M-c simulation. Thermocouples 1 2 3 4 5
Cooling rates 1045 (°C/s) 4340
-3
-3.17
-1.4 -1.45
-1.2 -0.6
-1.2 -0.58
-1.06 -0.57
∆t (s) 1045 4340
52 27
146 120
218 216
244 315
275 352
Ms (°C) 310 310 310 310 310
Constants 1045 4340
0.19 0.01 0.25 0.005
0.38 0.018 0.25
0.005
0.39 0.01 0.25
0.005
0.39 0.01 0.25
0.005
0.39 0.01
0.25 0.005
The formula K-M-c used in this review is:
700
3001)(011,0exp1 tTMsVm (3)
where the effects of cooling rates is given by:
]03,0exp[1exp41,0 700
300
700
300 tt
The underlined parameters were substituted as indicated in the Table 3. 4. Conclusions It was confirmed in this study that the rate of cooling during heat treatment effects the formation of phases with higher hardness. Based on the experimental data obtained in this study it was possible to improve the predictability of the martensite formation by proposing new constants to K-M formulae. Regarding the volume fraction of the phase transformation, the following conclusions can be made: The analysis and calculation of martensitic transformation using the Koistinen-Marburger formulae was efficient, once it takes into consideration the suggestions/corrections proposed in this paper, whose goal was to improve the existing model. The relevance of these corrections is in fact, that they are based on experimental results, so no significant differences between the simulated and empirical data were found. The difference between calculated and measured martensite fraction is within the limits of measurement uncertainty. For each type of steel there are different particular constants to be used for K-M-c simulations, aiming at predicting the kinetics of martensite formation, and also a specific relationship between the cooling rates and these constants. In this paper it is suggested new parameters for a modified termed K-M-c that show better agreement with the final volume fractions of martensite transformation data for 4340 and 1045 steels.
5. Acnowledgment The authors would like to acknowledge the partial financial support of CAPES. 6. References
[1] A. Zehtab Yazdi, S.A. Sajjadi, S.M. Zebarjad,
S.M. Moosavi Nezhad, Prediction of hardness at different points of Jominy specimen using quench factor analysis method, Journal of materials processing technology. 199 (2008) pp. 124-129.
[2] Taher Ghrib, Fatah Bejaoui, Abdelwahheb Hamdi, Noureddine Yacoubi, Correlation between thermal properties and hardness of end quench bars of C-48, 42CrMo4 and 35NiCrMo16 steels, Thermochimica Acta. 47 (2008) pp. 86-91.
[3] I. Telejko, H. Adrian, K. Skalny, M. Pakiet, R. Stasko, The investigation of hardenability of low alloy structural cast steel, Journal of Achievements in materials and manufacturing engineering. 37 (2009) pp. 480-48.
[4] J. Trzaska, W. L. A. Sitek, Dobrzański, Selection method of steel grade with required hardenability, Journal of Achievements in materials and manufacturing engineering. 17: ISSUE (2006) pp. 1-2.
[5] R. L. Simencio O., W. R. Otero, G. E. Totten and L.C.F. Canale, Quench Factor Characterization of Steel Hardening: A Review, International Journal of Mechanical Engineering and Automation. vol. 1, number 3 (June 2014) pp. 119-128.
[6] H. S. Fong, Further observations on the Jominy end quench test, Journal of Materials Processing Technology. 98(1-2) (1993) pp. 221-226.
[7] Bhaskar Chandra Kandpal, Agnay Chutani, Amit Gulia, Harsimran, Chandan Sadanna, A review on Jominy test and determination of effect of alloying elements on hardenability of steel using Jominy end quench test, International Journal of Advances in Engineering & Technology. vol.1, Issue 3 (July 2011) pp. 65-71.
[8] D.P. Koistinen and R.E. Marburger, A general equation for Austenite-Martensite transformation in carbon steels, Acta Metallurgica. vol.7 (1959) pp. 59-60.
[9] Y. Meyzaud and C. Sauzay, Traitement thermique et austenite residuelle, Traitement thermique, France. v 33-34 (1994) pp. 61-74.

Revista ECIPerú Volumen 12, número 1 Julio 2015
76
[10] S.M.C. van Bohemen and J. Sietsma, Effect of composition on kinetics of athermal martensite formation in plain carbon steels, Material Science & Technology. vol. 25 (2009) pp. 1009-1012.
[11] S. J. Lee and C.J. van Tyne, A Kinetics Model for Martensite Transformation in Plain Carbon
and Low-Alloyed Steels, The Minerals, Metals & Material Society and ASM International. vol. 43A (September 2011) azz 422-427.
E-mail: [email protected], [email protected], [email protected], [email protected]