Kim Ejlertsen- Palle Bendsen NOAH-Friends of the Earth ... file800 Gt CO2-eq is a key figure for the...
23
Scientific update Kim Ejlertsen- Palle Bendsen NOAH-Friends of the Earth Denmark Energi og Klima Gruppen 11. november 2008
Transcript of Kim Ejlertsen- Palle Bendsen NOAH-Friends of the Earth ... file800 Gt CO2-eq is a key figure for the...

Scientific update
Kim Ejlertsen- Palle Bendsen NOAH-Friends of the Earth Denmark
Energi og Klima Gruppen
11. november 2008
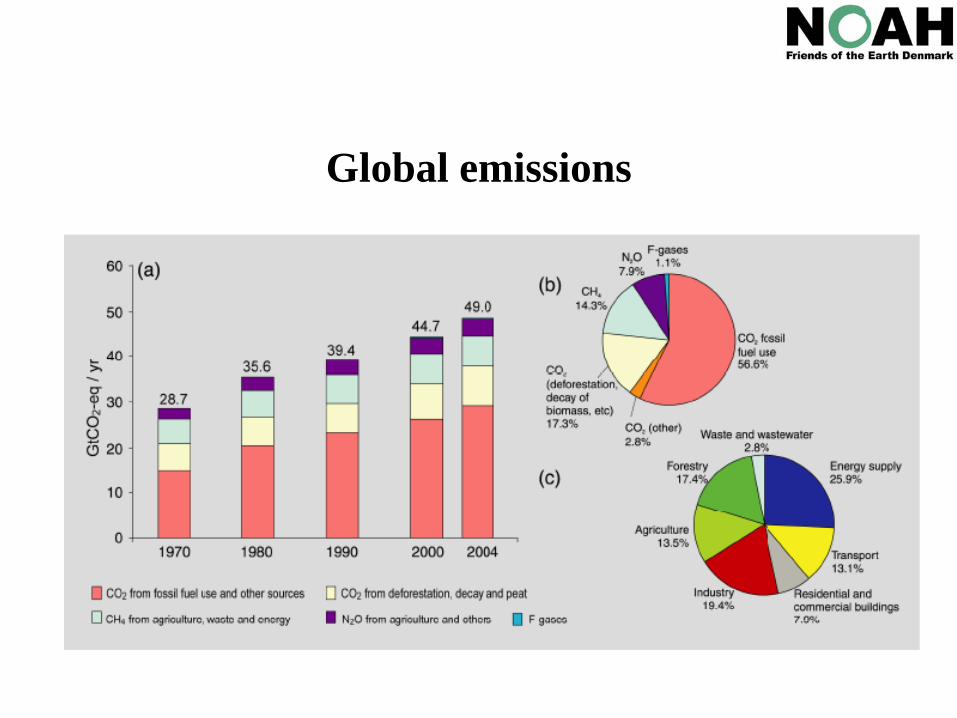
Global emissions

Stabilization scenarios AR4
Source: IPCC november 2007. Synthesis Report p. 67, table 5.1

AR4 estimates for cumulated emissions year 2000-2100


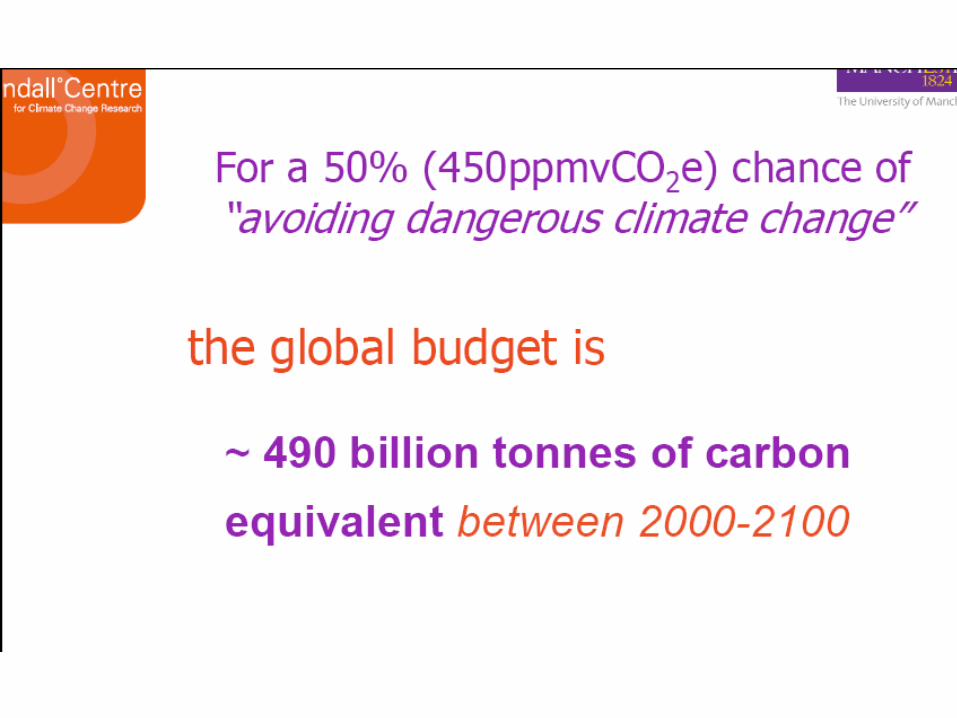
800 Gt CO2-eq is a key figure for the cumulated emissions of GHGs in the 21th century to keep the temperature increase
below 2 degree C
• In the period 2000-2005 we emitted 234 Gt CO2-eq
• The global emissions in 2004 amounted 49 Gt CO2-eq per year
• Including emissions in 2006 + 2007, we have less than 500 Gt CO2-eq left for the rest of the century. Including 2008 + 2009 the figure is less than 400 Gt CO2-eq

AR4 says that 2 degree C means a global 85 % reduction in GHG emissions before 2050
• A 85 % reduction with year 2000 as basis equivalent about 87,5 % with year 2005 as basis
• Assuming a global emission of about 49 Gt CO2-eq in 2005 the emissions should be reduced to about 6,2 Gt CO2-eq in 2050
• A linear reduction leads to a cumulated emission of 1240 Gt CO2-eq compared to an exponential reduction giving a cumulated emission of 930 Gt CO2-eq
• To get in the scale of cumulated 500 Gt CO2-eq or 400 Gt CO2-eq the emission reductions must be supplemented with big scale afforestation and changed land use securing a positive C-balance in forrests and (agricultural) land

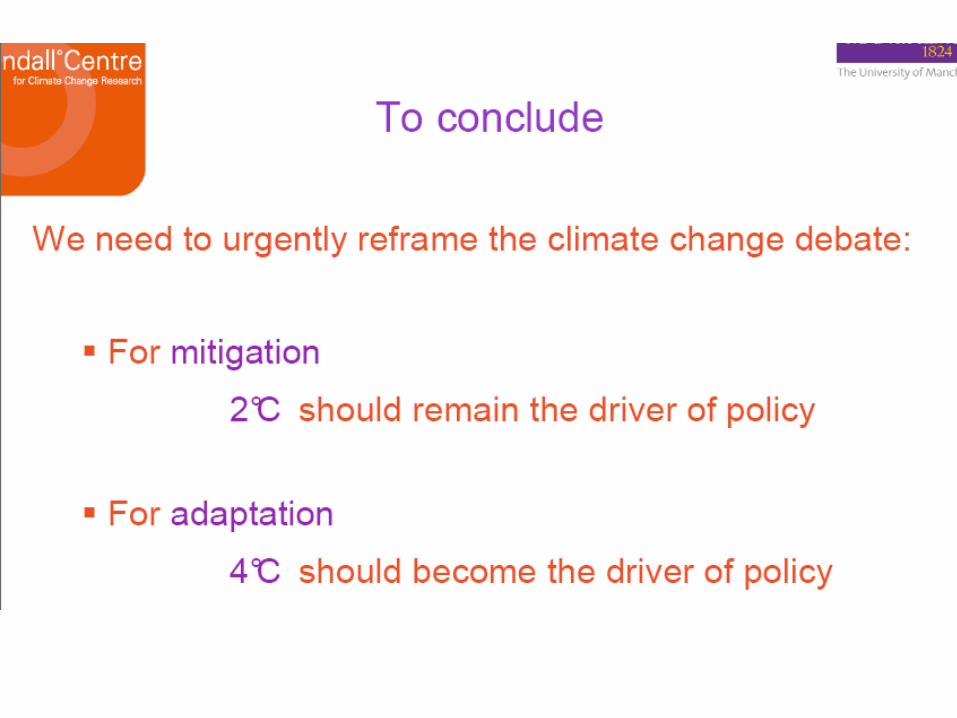
What reduction pathway should we choose?

What do other institutions say?350 ppm CO2 = 445 ppm CO2-eq
• James Hansen, NASA/Goddard Institute for Space Studies, USA < 350 ppm CO2
• SEI together with the Tällberg Initiative < 350 ppm CO2
• EcoEquity, USA < 400 ppm CO2-eq
• Tyndall Centre, University of Manchester refers to Meinshausen < 350 ppm CO2-eq for a 93 % probability of temperature increase to stay below 2 degree – but say it is practically unachievable – 450 ppm CO2-eq corresponds to max 858 Gt CO2-eq cumulated, peak 2015, post peak total 4% year by year reductions and energy and process 6-8% year by year reductions

The global challange2 ° C * Annex 1 – 90% * non-Annex –80% * 2050
EcoEquity

EU´s contribution to the global reductions
EU-27 GHG reductionsEnvironmental Space target curve after 2005
2060
46554073
0
1000
2000
3000
4000
5000
6000
1990 2000 2010 2020 2030 2040 2050
Year
GHG
em
issi
ons
(Mt C
O2-
eq/y
)
Environmental Space Curve -20% target -30% target