khandelwal cma
40
1 2 a ue n acs 4 BASIC INFORMATION 5 Please Enter Data In Blue Coloured Cell 6 Last year of audit ed / provisional resul ts 2011 7 Company Code 8 Name of the Company Khandelwal distributors private limited 9 Industry (as per ASCROM classi ficati on) 10 Currency INR INR 11 Auditors Audited Audited Audited Projected Projected 12 2009 2010 2011 2012 2013 13 Year ended (DD-Mon-YYYY) 31-Mar-09 31-Mar-10 31-Mar-11 31-Mar-12 31-Mar-13 14 No. Of Months 12 12 12 12 12 15 xc ange ate 17 PROFIT & LOSS ACCOUNT INPUT 18 Gross Sales 19 - Domestic 774.05 1107.79 1276.42 1646.00 1810.60 20 - Export 21 Sub Total (Gross Sales) 774.05 1107.79 1276.42 1646.00 1810.60 22 23 Less Excise Duty 24 25 Net Sales 774.05 1107.79 1276.42 1646.00 1810.60 26 27 % wise rise/fall in net sales as compared to previous year 0.00 43.12 15.22 28.95 10.00 28 29 Other Operating Income 30 Export Incenti ves 31 Dut y Drawback 32 Others 32.84 29.96 31.34 30.20 33.22 33 Total Operating Income 806.89 1137.75 1307.76 1676.20 1843.82 34 35 Cost of Sales 36 Raw materials consumed 37 i) Imported 38 ii) Indigenous 647.89 816.52 935.66 1107.94 1266.15 39 40 Other Spares consumed 41 i) Imported 42 ii) Indi genous 43 44 Power and fuel 3.78 2.35 26.29 15.55 17.10 45 Direct labour and wages 64.19 90.07 120.67 111.22 122.34 46 Other manufacturing expenses 8.78 37.64 33.59 176.72 194.28 47 Depreciation 13.74 13.52 16.72 17.51 15.77 48 Sub Total 738.38 960.10 1132.93 1428.94 1615.64 49 50 Add: Op. Stock of WIP 51 Less: Cl. Stock of WI P 52 Total Cost of Production 738.38 960.10 1132.93 1428.94 1615.64 53 54 Add Opening Stock of Finished Goods 19.40 31.64 56.61 144.64 101.81
Transcript of khandelwal cma

8/3/2019 khandelwal cma
http://slidepdf.com/reader/full/khandelwal-cma 1/40
12
a ue n acs
4 BASIC INFORMATION
5 Please Enter Data In Blue Coloured Cell
6 Last year of audited / provisional results 2011
7 Company Code
8 Name of the Company Khandelwal distributors private limited
9 Industry (as per ASCROM classification)10 Currency INR INR
11 Auditors Audited Audited Audited Projected Projected
12 2009 2010 2011 2012 2013
13 Year ended (DD-Mon-YYYY) 31-Mar-09 31-Mar-10 31-Mar-11 31-Mar-12 31-Mar-13
14 No. Of Months 12 12 12 12 1215 xc ange ate
17 PROFIT & LOSS ACCOUNT INPUT
18 Gross Sales
19 - Domestic 774.05 1107.79 1276.42 1646.00 1810.60
20 - Export
21 Sub Total (Gross Sales) 774.05 1107.79 1276.42 1646.00 1810.6022
23 Less Excise Duty
24
25 Net Sales 774.05 1107.79 1276.42 1646.00 1810.60
26
27
% wise rise/fall in net sales as compared to
previous year 0.00 43.12 15.22 28.95 10.00
28
29 Other Operating Income
30 Export Incentives
31 Duty Drawback
32 Others 32.84 29.96 31.34 30.20 33.22
33 Total Operating Income 806.89 1137.75 1307.76 1676.20 1843.82
34
35 Cost of Sales
36 Raw materials consumed
37 i) Imported
38 ii) Indigenous 647.89 816.52 935.66 1107.94 1266.15
39
40 Other Spares consumed
41 i) Imported
42 ii) Indigenous
43
44 Power and fuel 3.78 2.35 26.29 15.55 17.1045 Direct labour and wages 64.19 90.07 120.67 111.22 122.34
46 Other manufacturing expenses 8.78 37.64 33.59 176.72 194.28
47 Depreciation 13.74 13.52 16.72 17.51 15.77
48 Sub Total 738.38 960.10 1132.93 1428.94 1615.64
49
50 Add: Op. Stock of WIP
51 Less: Cl. Stock of WIP
52 Total Cost of Production 738.38 960.10 1132.93 1428.94 1615.64
53
54 Add Opening Stock of Finished Goods 19.40 31.64 56.61 144.64 101.81
8/3/2019 khandelwal cma
http://slidepdf.com/reader/full/khandelwal-cma 2/40
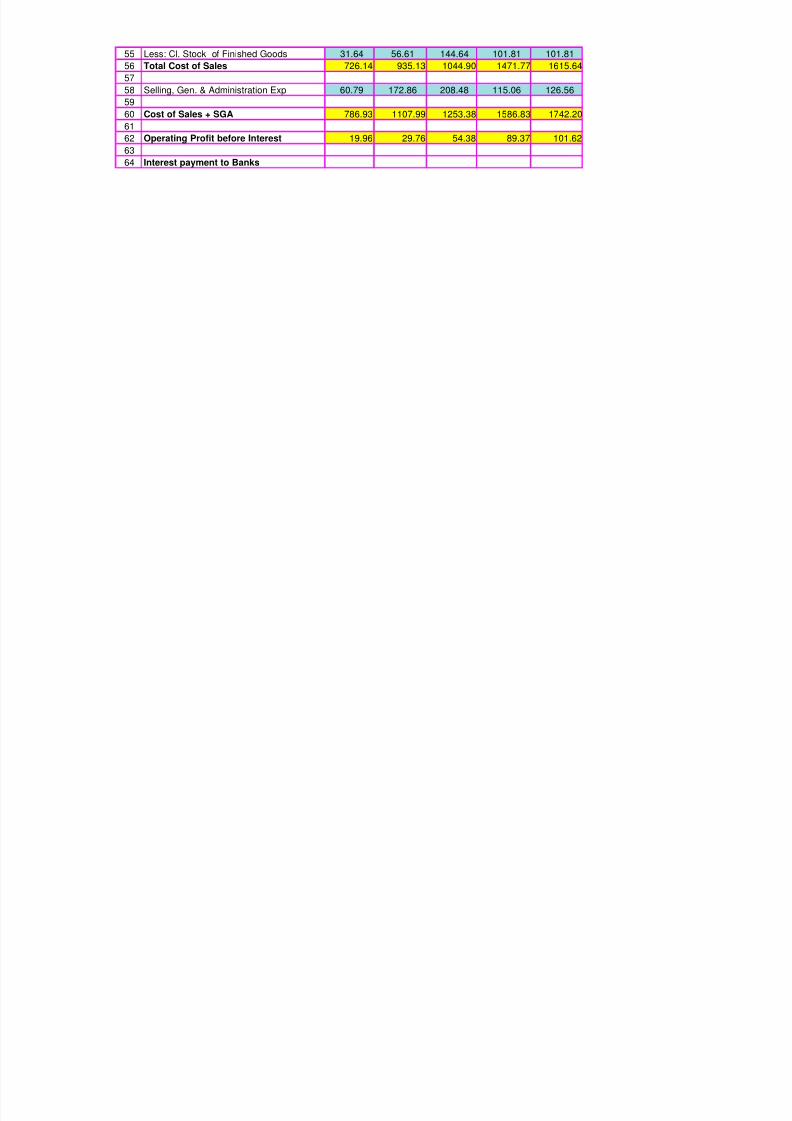
55 Less: Cl. Stock of Finished Goods 31.64 56.61 144.64 101.81 101.81
56 Total Cost of Sales 726.14 935.13 1044.90 1471.77 1615.64
57
58 Selling, Gen. & Administration Exp 60.79 172.86 208.48 115.06 126.56
59
60 Cost of Sales + SGA 786.93 1107.99 1253.38 1586.83 1742.20
61
62 Operating Profit before Interest 19.96 29.76 54.38 89.37 101.6263
64 Interest payment to Banks
8/3/2019 khandelwal cma
http://slidepdf.com/reader/full/khandelwal-cma 3/40
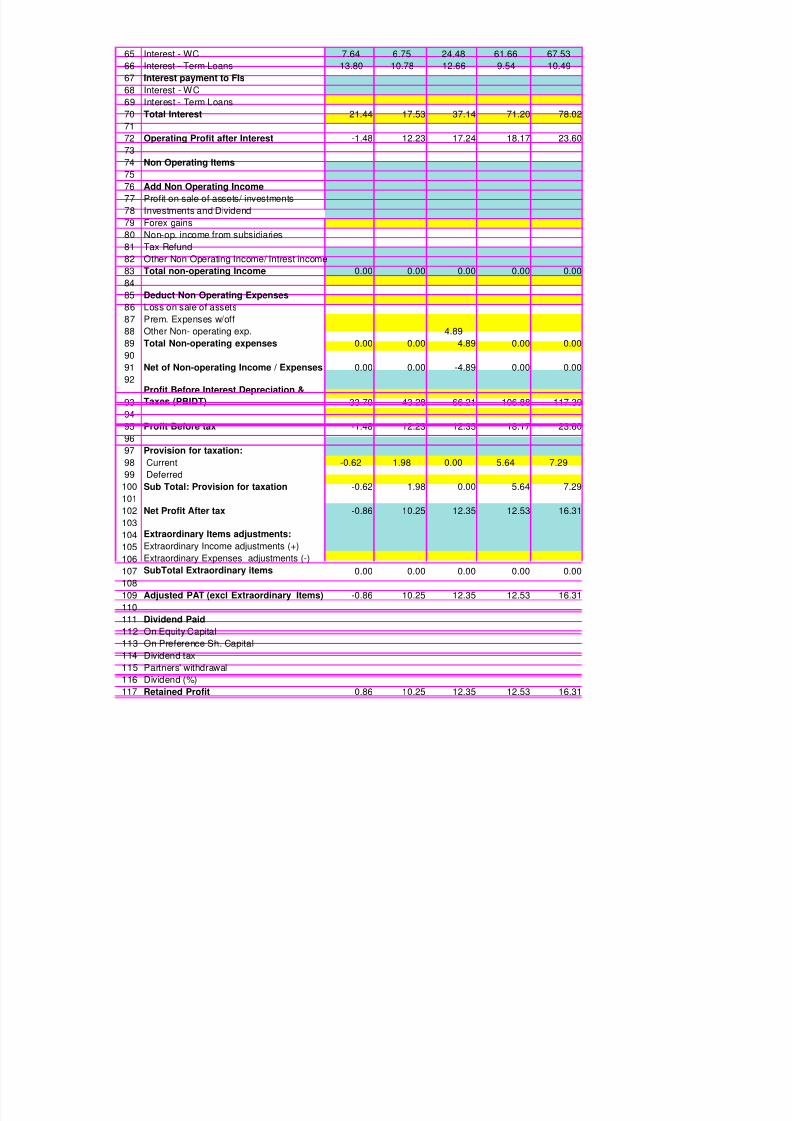
65 Interest - WC 7.64 6.75 24.48 61.66 67.53
66 Interest - Term Loans 13.80 10.78 12.66 9.54 10.49
67 Interest payment to FIs
68 Interest - WC
69 Interest - Term Loans
70 Total Interest 21.44 17.53 37.14 71.20 78.02
71
72 Operating Profit after Interest -1.48 12.23 17.24 18.17 23.6073
74 Non Operating Items
75
76 Add Non Operating Income
77 Profit on sale of assets/ investments
78 Investments and Dividend
79 Forex gains
80 Non-op. income from subsidiaries
81 Tax Refund
82 Other Non Operating Income/ Intrest income
83 Total non-operating Income 0.00 0.00 0.00 0.00 0.00
8485 Deduct Non Operating Expenses
86 Loss on sale of assets
87 Prem. Expenses w/off
88 Other Non- operating exp. 4.89
89 Total Non-operating expenses 0.00 0.00 4.89 0.00 0.00
90
91 Net of Non-operating Income / Expenses 0.00 0.00 -4.89 0.00 0.00
92
93
Profit Before Interest Depreciation &
Taxes (PBIDT) 33.70 43.28 66.21 106.88 117.39
94
95 Profit Before tax -1.48 12.23 12.35 18.17 23.6096
97 Provision for taxation:
98 Current -0.62 1.98 0.00 5.64 7.29
99 Deferred
100 Sub Total: Provision for taxation -0.62 1.98 0.00 5.64 7.29
101
102 Net Profit After tax -0.86 10.25 12.35 12.53 16.31
103
104 Extraordinary Items adjustments:
105 Extraordinary Income adjustments (+)
106 Extraordinary Expenses adjustments (-)
107 SubTotal Extraordinary items 0.00 0.00 0.00 0.00 0.00108
109 Adjusted PAT (excl Extraordinary Items) -0.86 10.25 12.35 12.53 16.31
110
111 Dividend Paid
112 On Equity Capital
113 On Preference Sh. Capital
114 Dividend tax
115 Partners' withdrawal
116 Dividend (%)
117 Retained Profit -0.86 10.25 12.35 12.53 16.31
8/3/2019 khandelwal cma
http://slidepdf.com/reader/full/khandelwal-cma 4/40
118
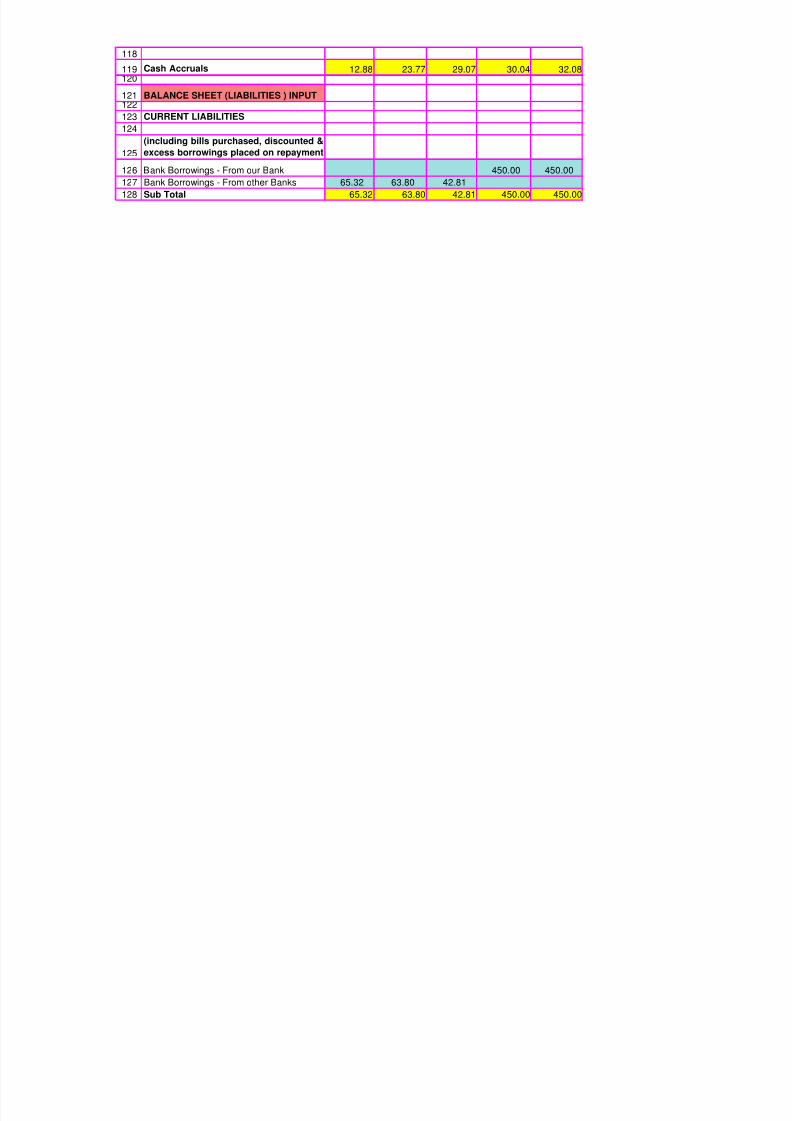
119 Cash Accruals 12.88 23.77 29.07 30.04 32.08120
121 BALANCE SHEET (LIABILITIES ) INPUT122
123 CURRENT LIABILITIES
124
125
(including bills purchased, discounted &excess borrowings placed on repayment
126 Bank Borrowings - From our Bank 450.00 450.00
127 Bank Borrowings - From other Banks 65.32 63.80 42.81
128 Sub Total 65.32 63.80 42.81 450.00 450.00

8/3/2019 khandelwal cma
http://slidepdf.com/reader/full/khandelwal-cma 5/40
129
130
& Group Concerns
131
132 Short term borrowings from Others
133
134 Creditors for purchases 84.67 73.52 78.74 12.00 12.25
135
136
Advances/ payments from
customers/deposits from dealers. 45.52 44.22 98.01 6.00 6.75
137
138 Provisions
139 - Tax
140 -Others
141
142 Dividends Payable
143
144 Statutory liabilities due within one year
145
146
ns a men s o erm oans e erre
payment credits / Debentures / deposits /
redeemable preference shares (due within 10.70 11.98 23.48 10.00 10.00
147
148 Deposits 20.30 57.75 24.96 2.00 2.20
149
150 Other Current Liabilities due within one year 4.17 5.39 3.02 0.00 0.00
151
152 Total Current Liabilities 230.68 256.66 271.02 480.00 481.20
153
154 TERM LIABILITIES
155
156 Debentures
157 Preference share capital
158 Dealer's Deposit
159 Deferred Tax Liability
160 Term Loans - From Banks 94.92 88.72 68.30 38.00 11.00
161 Term Loans - From Fis
162 Term Deposits
163
Borrowings from subsidiaries / affiliates
(Quasi Equity)
164 Unsecured Loans (Quasi Equity) 41.27 62.56 120.74 121.88 121.88
165 Other term liabilities
166 Total Term Liabilities 136.19 151.28 189.04 159.88 132.88
167
168 TOTAL OUTSIDE LIABILITIES 366.87 407.94 460.06 639.88 614.08
169
170 NET WORTH
171 Equity Share Capital
172 Share Capital (Paid-up) 28.97 68.97 100.97 129.03 129.03
173 Share Application (finalised for allotment)
174 Sub Total (Share Capital) 28.97 68.97 100.97 129.03 129.03
175
176 General Reserve
177 Revaluation Reserve
8/3/2019 khandelwal cma
http://slidepdf.com/reader/full/khandelwal-cma 6/40
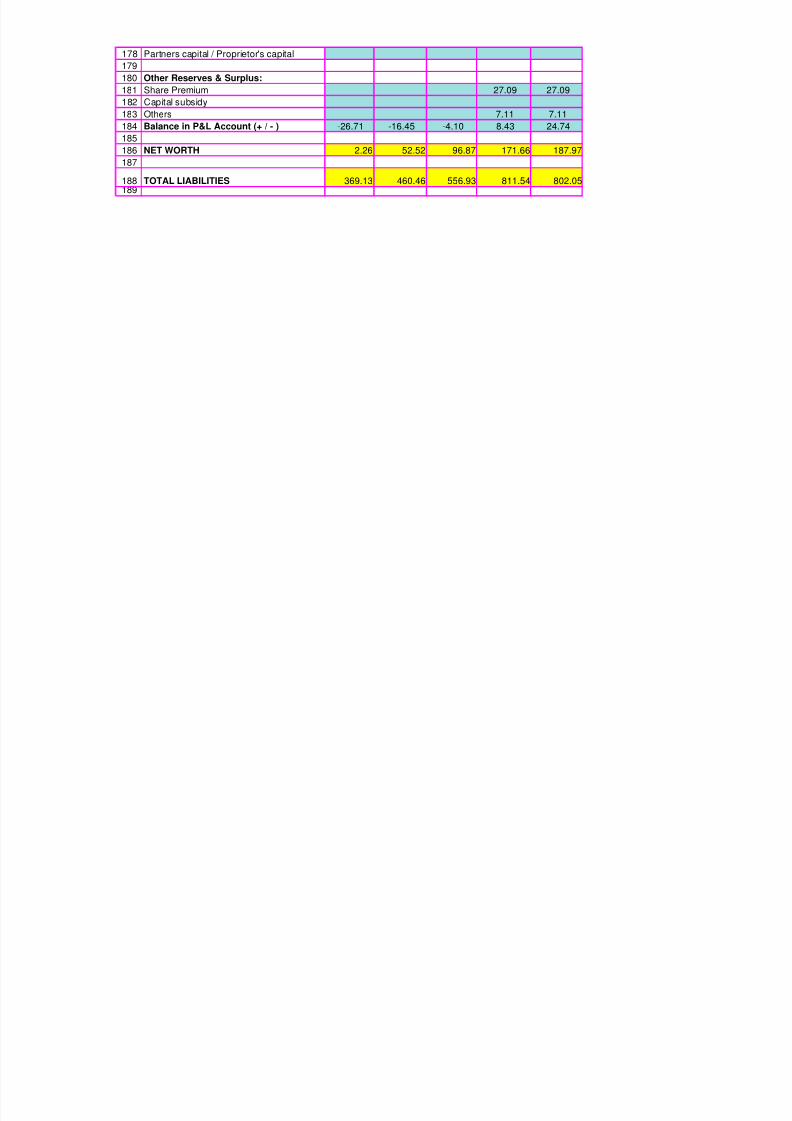
178 Partners capital / Proprietor's capital
179
180 Other Reserves & Surplus:
181 Share Premium 27.09 27.09
182 Capital subsidy
183 Others 7.11 7.11
184 Balance in P&L Account (+ / - ) -26.71 -16.45 -4.10 8.43 24.74
185186 NET WORTH 2.26 52.52 96.87 171.66 187.97
187
188 TOTAL LIABILITIES 369.13 460.46 556.93 811.54 802.05189
8/3/2019 khandelwal cma
http://slidepdf.com/reader/full/khandelwal-cma 7/40
190 191
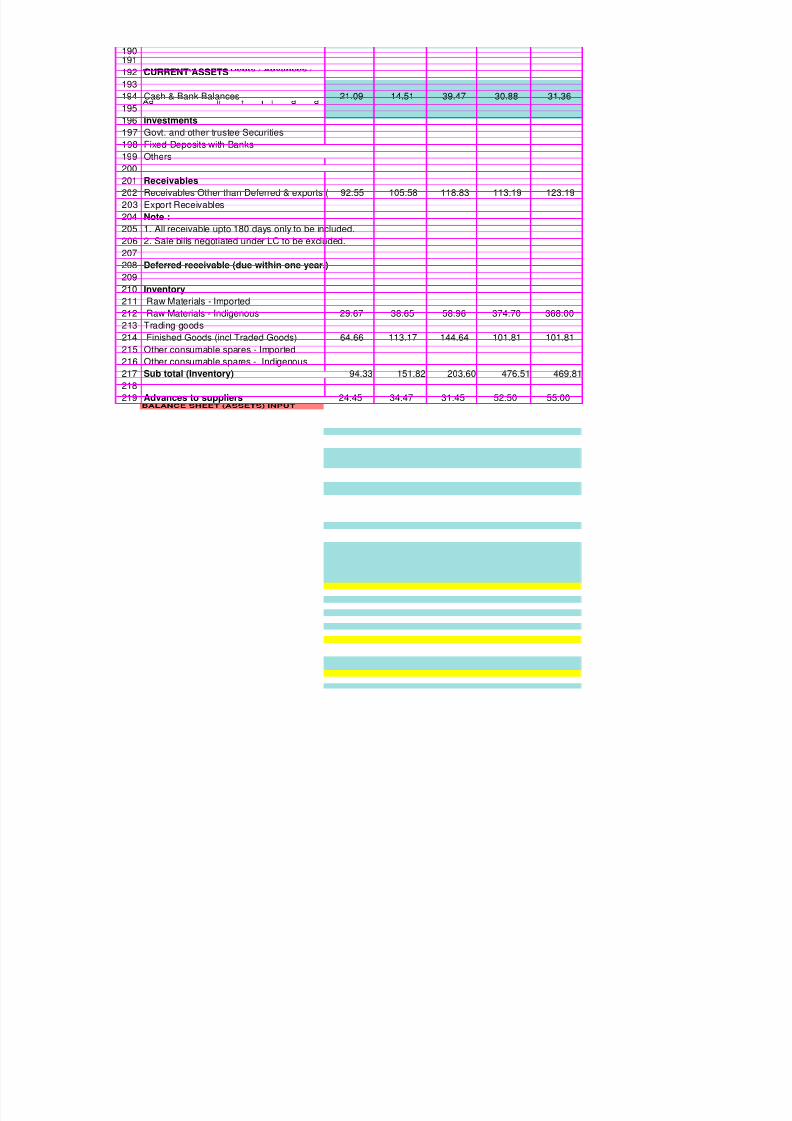
192 CURRENT ASSETS
193
194 Cash & Bank Balances 21.09 14.51 39.47 30.88 31.36
195
196 Investments
197 Govt. and other trustee Securities
198 Fixed Deposits with Banks199 Others
200
201 Receivables
202 Receivables Other than Deferred & exports ( 92.55 105.58 118.83 113.19 123.19
203 Export Receivables
204 Note :
205 1. All receivable upto 180 days only to be included.
206 2. Sale bills negotiated under LC to be excluded.
207
208 Deferred receivable (due within one year.)
209
210 Inventory211 Raw Materials - Imported
212 Raw Materials - Indigenous 29.67 38.65 58.96 374.70 368.00
213 Trading goods
214 Finished Goods (incl Traded Goods) 64.66 113.17 144.64 101.81 101.81
215 Other consumable spares - Imported
216 Other consumable spares - Indigenous
217 Sub total (Inventory) 94.33 151.82 203.60 476.51 469.81
218
219 Advances to suppliers 24.45 34.47 31.45 52.50 55.00
220
221 Advance payment of tax
222
223 Other Current Assets
224
225 TOTAL CURRENT ASSETS 232.42 306.38 393.35 673.08 679.36
226
227 FIXED ASSETS
228 Gross Block 181.56 144.36 159.01 155.97 138.46
229 Less: Accumulated Depreciation 47.93 13.52 16.72 17.51 15.77
230 Net Block 133.63 130.84 142.29 138.46 122.69
231
232 Capital Work in progress
233
234 NON-CURRENT ASSETS
235
236
Deposits (which are not current assets):
237 Investments in Group concerns
238 Loans to group concerns / Advances to subsidiaries
239 Investments in others 1.29 21.29 21.29
240
vances to supp ers o cap ta goo s an
contractors
241 Deferred receivables (maturity exceeding one year)

8/3/2019 khandelwal cma
http://slidepdf.com/reader/full/khandelwal-cma 8/40
242 Debtors > 6 mths.
243
ers oans vances non curren n
nature, ICD's etc.)
244
245 Deferred Tax Asset
246
247
-
(incld. Dues from directors) 1.79 1.95
248
249 TOTAL NON CURRENT ASSETS 3.08 23.24 21.29 0.00 0.00
250
251
Intangible Assets:
Goodwill, Patents & trademarks
252
expenses,Miscellaneous expenditure not
w/off, Other deferred revenue expenses
253
254 TOTAL ASSETS 369.13 460.46 556.93 811.54 802.05
8/3/2019 khandelwal cma
http://slidepdf.com/reader/full/khandelwal-cma 9/40
255
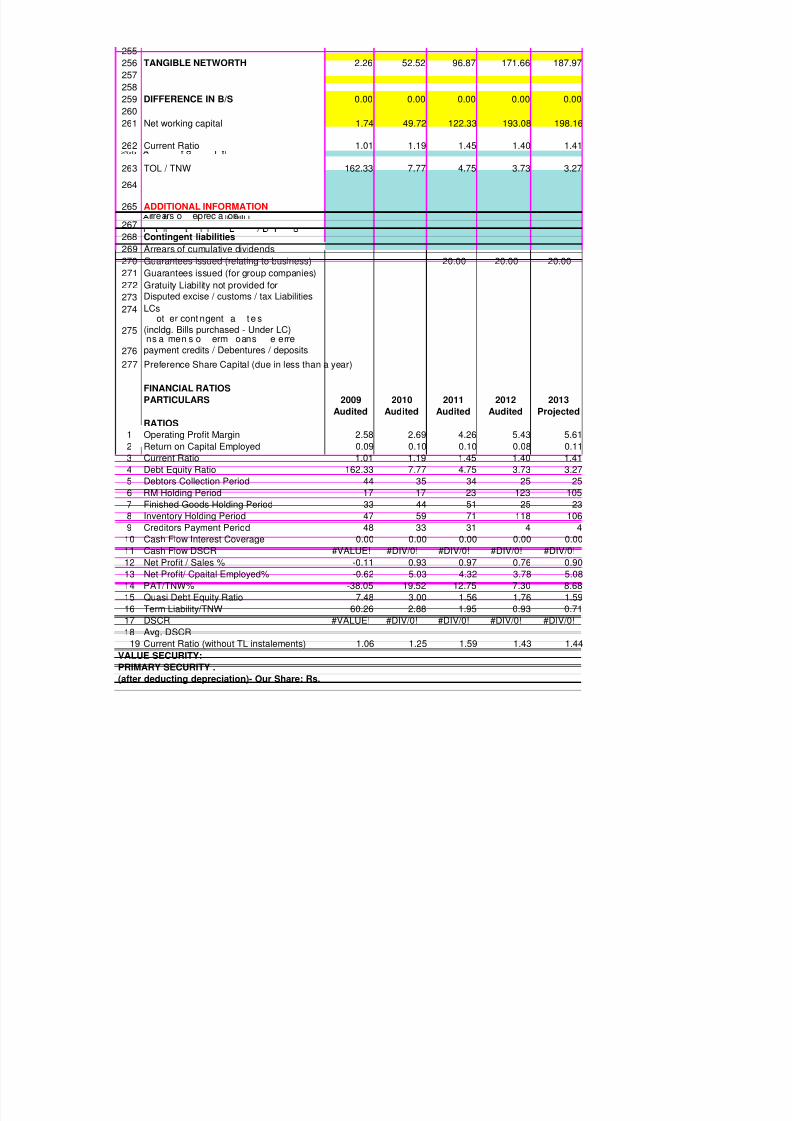
256 TANGIBLE NETWORTH 2.26 52.52 96.87 171.66 187.97
257
258
259 DIFFERENCE IN B/S 0.00 0.00 0.00 0.00 0.00
260
261 Net working capital 1.74 49.72 122.33 193.08 198.16
262 Current Ratio 1.01 1.19 1.45 1.40 1.41
263 TOL / TNW 162.33 7.77 4.75 3.73 3.27
264
265 ADDITIONAL INFORMATIONrrears o eprec a on
267
268 Contingent liabilities
269 Arrears of cumulative dividends
270 Guarantees issued (relating to business) 20.00 20.00 20.00
271 Guarantees issued (for group companies)
272 Gratuity Liability not provided for273 Disputed excise / customs / tax Liabilities
274 LCs
275
ot er cont ngent a t e s
(incldg. Bills purchased - Under LC)
276
ns a men s o erm oans e erre
payment credits / Debentures / deposits
277 Preference Share Capital (due in less than a year)
FINANCIAL RATIOS
PARTICULARS 2009 2010 2011 2012 2013
Audited Audited Audited Audited Projected
RATIOS
1 Operating Profit Margin 2.58 2.69 4.26 5.43 5.61
2 Return on Capital Employed 0.09 0.10 0.10 0.08 0.11
3 Current Ratio 1.01 1.19 1.45 1.40 1.41
4 Debt Equity Ratio 162.33 7.77 4.75 3.73 3.27
5 Debtors Collection Period 44 35 34 25 25
6 RM Holding Period 17 17 23 123 105
7 Finished Goods Holding Period 33 44 51 25 23
8 Inventory Holding Period 47 59 71 118 106
9 Creditors Payment Period 48 33 31 4 4
10 Cash Flow Interest Coverage 0.00 0.00 0.00 0.00 0.00
11 Cash Flow DSCR #VALUE! #DIV/0! #DIV/0! #DIV/0! #DIV/0!
12 Net Profit / Sales % -0.11 0.93 0.97 0.76 0.90
13 Net Profit/ Cpaital Employed% -0.62 5.03 4.32 3.78 5.0814 PAT/TNW% -38.05 19.52 12.75 7.30 8.68
15 Quasi Debt Equity Ratio 7.48 3.00 1.56 1.76 1.59
16 Term Liability/TNW 60.26 2.88 1.95 0.93 0.71
17 DSCR #VALUE! #DIV/0! #DIV/0! #DIV/0! #DIV/0!
18 Avg. DSCR
19 Current Ratio (without TL instalements) 1.06 1.25 1.59 1.43 1.44
VALUE SECURITY:
PRIMARY SECURITY .
(after deducting depreciation)- Our Share: Rs.

8/3/2019 khandelwal cma
http://slidepdf.com/reader/full/khandelwal-cma 10/40
COLLATERAL SECURITY.
(after deducting depreciation)- Our Share: Rs.
PURCHASES 647.89 816.52 935.66 1107.94 1266.15
8/3/2019 khandelwal cma
http://slidepdf.com/reader/full/khandelwal-cma 11/40
1
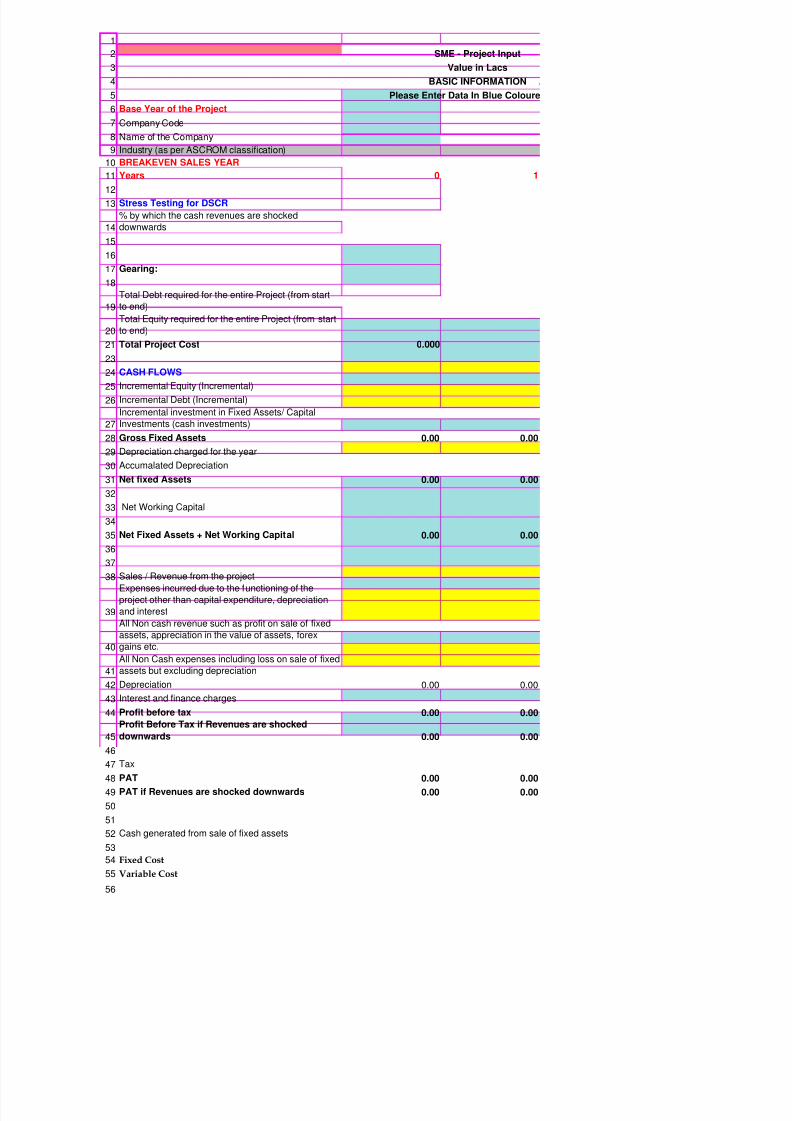
2 SME - Project Input
3 Value in Lacs
4 BASIC INFORMATION
5 Please Enter Data In Blue Coloure
6 Base Year of the Project
7 Company Code
8 Name of the Company
9 Industry (as per ASCROM classification)
10 BREAKEVEN SALES YEAR
11 Years 0 1
12
13 Stress Testing for DSCR
14
% by which the cash revenues are shocked
downwards
15
16
17 Gearing:
18
19
Total Debt required for the entire Project (from start
to end)
20
Total Equity required for the entire Project (from start
to end)
21 Total Project Cost 0.000
23
24 CASH FLOWS
25 Incremental Equity (Incremental)
26 Incremental Debt (Incremental)
27
Incremental investment in Fixed Assets/ Capital
Investments (cash investments)
28 Gross Fixed Assets 0.00 0.00
29 Depreciation charged for the year
30 Accumalated Depreciation
31 Net fixed Assets 0.00 0.00
32
33 Net Working Capital
34
35 Net Fixed Assets + Net Working Capital 0.00 0.00
36
37
38 Sales / Revenue from the project
39
Expenses incurred due to the functioning of the
project other than capital expenditure, depreciation
and interest
40
All Non cash revenue such as profit on sale of fixed
assets, appreciation in the value of assets, forex
gains etc.
41
All Non Cash expenses including loss on sale of fixed
assets but excluding depreciation
42 Depreciation 0.00 0.00
43 Interest and finance charges
44 Profit before tax 0.00 0.00
45
Profit Before Tax if Revenues are shocked
downwards 0.00 0.00
46
47 Tax
48 PAT 0.00 0.00
49 PAT if Revenues are shocked downwards 0.00 0.00
50
51
52 Cash generated from sale of fixed assets
53

8/3/2019 khandelwal cma
http://slidepdf.com/reader/full/khandelwal-cma 12/40
57
Enter year from which the cash flows stabalize and
are presumed to be the same in every period after
this year
58
59
60 Discounting Rate based on Project Risk
61
62 Debt Schedule
63
64
Starting year of the loan sanctioned/ to be
sanctioned by our bank
65
Ending year of the loan santioned/ to be
sanctioned by our bank
66
67
68
Total Debt payable within one year (Principal
component)
69 Total Interest & Finance Charges 0.00 0.00
70
Total Debt payable within one year including
Interest & Finance Charges 0.000 0.000
71 PAT + Depreciation + Interest & Finance Charges 0.00 0.00
8/3/2019 khandelwal cma
http://slidepdf.com/reader/full/khandelwal-cma 13/40
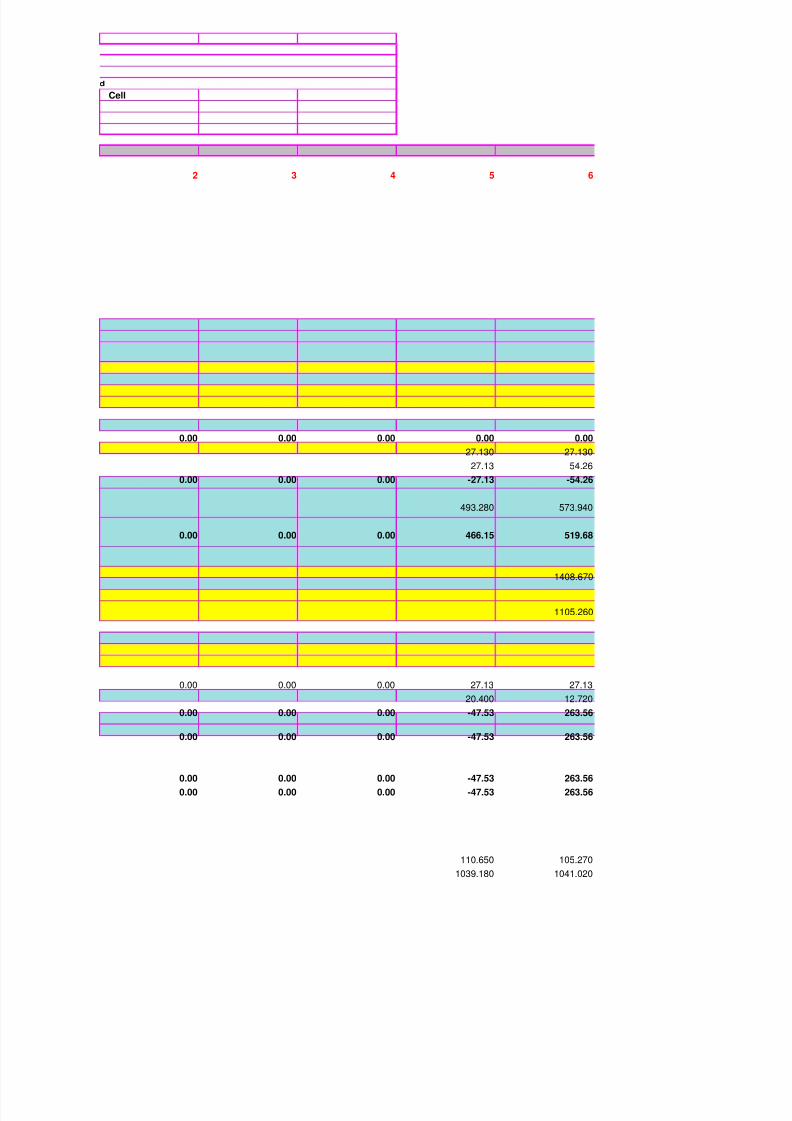
Cell
2 3 4 5 6
0.00 0.00 0.00 0.00 0.00
27.130 27.130
27.13 54.26
0.00 0.00 0.00 -27.13 -54.26
493.280 573.940
0.00 0.00 0.00 466.15 519.68
1408.670
1105.260
0.00 0.00 0.00 27.13 27.13
20.400 12.720
0.00 0.00 0.00 -47.53 263.56
0.00 0.00 0.00 -47.53 263.56
0.00 0.00 0.00 -47.53 263.56
0.00 0.00 0.00 -47.53 263.56

8/3/2019 khandelwal cma
http://slidepdf.com/reader/full/khandelwal-cma 14/40
0.00 0.00 0.00 20.40 12.72
0.000 0.000 0.000 20.400 12.720
0.00 0.00 0.00 0.00 303.41

8/3/2019 khandelwal cma
http://slidepdf.com/reader/full/khandelwal-cma 15/40
7 8 9 10 11
0.00 0.00 0.00 0.00 0.00
54.26 54.26 54.26 54.26 54.26
-54.26 -54.26 -54.26 -54.26 -54.26
-54.26 -54.26 -54.26 -54.26 -54.26
0.00 0.00 0.00 0.00 0.00
0.00 0.00 0.00 0.00 0.00
0.00 0.00 0.00 0.00 0.00
0.00 0.00 0.00 0.00 0.00
0.00 0.00 0.00 0.00 0.00

8/3/2019 khandelwal cma
http://slidepdf.com/reader/full/khandelwal-cma 16/40
0.00 0.00 0.00 0.00 0.00
0.000 0.000 0.000 0.000 0.000
0.00 0.00 0.00 0.00 0.00
8/3/2019 khandelwal cma
http://slidepdf.com/reader/full/khandelwal-cma 17/40
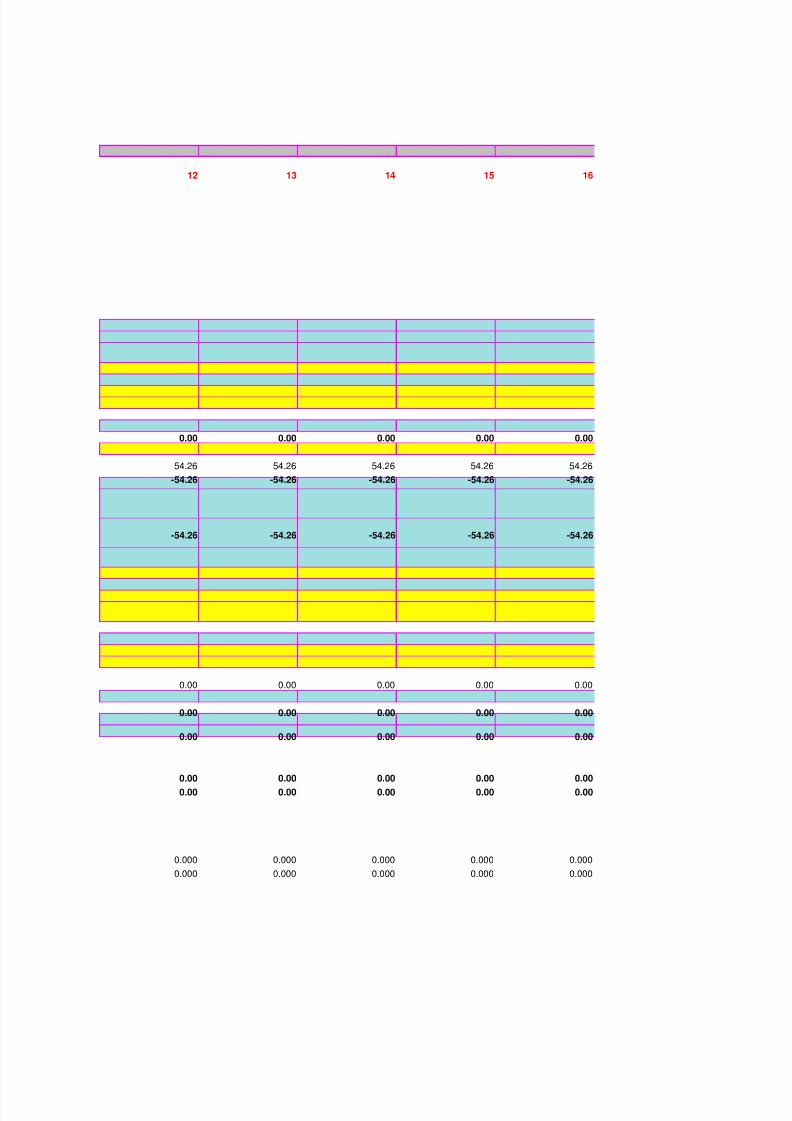
12 13 14 15 16
0.00 0.00 0.00 0.00 0.00
54.26 54.26 54.26 54.26 54.26
-54.26 -54.26 -54.26 -54.26 -54.26
-54.26 -54.26 -54.26 -54.26 -54.26
0.00 0.00 0.00 0.00 0.00
0.00 0.00 0.00 0.00 0.00
0.00 0.00 0.00 0.00 0.00
0.00 0.00 0.00 0.00 0.00
0.00 0.00 0.00 0.00 0.00

8/3/2019 khandelwal cma
http://slidepdf.com/reader/full/khandelwal-cma 18/40
0.00 0.00 0.00 0.00 0.00
0.000 0.000 0.000 0.000 0.000
0.00 0.00 0.00 0.00 0.00

8/3/2019 khandelwal cma
http://slidepdf.com/reader/full/khandelwal-cma 19/40
17 18 19 20 21
0.00 0.00 0.00 0.00 0.00
54.26 54.26 54.26 54.26 54.26
-54.26 -54.26 -54.26 -54.26 -54.26
-54.26 -54.26 -54.26 -54.26 -54.26
0.00 0.00 0.00 0.00 0.00
0.00 0.00 0.00 0.00 0.00
0.00 0.00 0.00 0.00 0.00
0.00 0.00 0.00 0.00 0.00
0.00 0.00 0.00 0.00 0.00

8/3/2019 khandelwal cma
http://slidepdf.com/reader/full/khandelwal-cma 20/40
0.00 0.00 0.00 0.00 0.00
0.000 0.000 0.000 0.000 0.000
0.00 0.00 0.00 0.00 0.00

8/3/2019 khandelwal cma
http://slidepdf.com/reader/full/khandelwal-cma 21/40
22 23 24 25 26
0.00 0.00 0.00 0.00 0.00
54.26 54.26 54.26 54.26 54.26
-54.26 -54.26 -54.26 -54.26 -54.26
-54.26 -54.26 -54.26 -54.26 -54.26
0.00 0.00 0.00 0.00 0.00
0.00 0.00 0.00 0.00 0.00
0.00 0.00 0.00 0.00 0.00
0.00 0.00 0.00 0.00 0.00
0.00 0.00 0.00 0.00 0.00

8/3/2019 khandelwal cma
http://slidepdf.com/reader/full/khandelwal-cma 22/40
0.00 0.00 0.00 0.00 0.00
0.000 0.000 0.000 0.000 0.000
0.00 0.00 0.00 0.00 0.00

8/3/2019 khandelwal cma
http://slidepdf.com/reader/full/khandelwal-cma 23/40
27 28 29 30 31
0.00 0.00 0.00 0.00 0.00
54.26 54.26 54.26 54.26 54.26
-54.26 -54.26 -54.26 -54.26 -54.26
-54.26 -54.26 -54.26 -54.26 -54.26
0.00 0.00 0.00 0.00 0.00
0.00 0.00 0.00 0.00 0.00
0.00 0.00 0.00 0.00 0.00
0.00 0.00 0.00 0.00 0.00
0.00 0.00 0.00 0.00 0.00

8/3/2019 khandelwal cma
http://slidepdf.com/reader/full/khandelwal-cma 24/40
0.00 0.00 0.00 0.00 0.00
0.000 0.000 0.000 0.000 0.000
0.00 0.00 0.00 0.00 0.00

8/3/2019 khandelwal cma
http://slidepdf.com/reader/full/khandelwal-cma 25/40
32 33 34 35 36
0.00 0.00 0.00 0.00 0.00
54.26 54.26 54.26 54.26 54.26
-54.26 -54.26 -54.26 -54.26 -54.26
-54.26 -54.26 -54.26 -54.26 -54.26
0.00 0.00 0.00 0.00 0.00
0.00 0.00 0.00 0.00 0.00
0.00 0.00 0.00 0.00 0.00
0.00 0.00 0.00 0.00 0.00
0.00 0.00 0.00 0.00 0.00

8/3/2019 khandelwal cma
http://slidepdf.com/reader/full/khandelwal-cma 26/40
0.00 0.00 0.00 0.00 0.00
0.000 0.000 0.000 0.000 0.000
0.00 0.00 0.00 0.00 0.00
8/3/2019 khandelwal cma
http://slidepdf.com/reader/full/khandelwal-cma 27/40
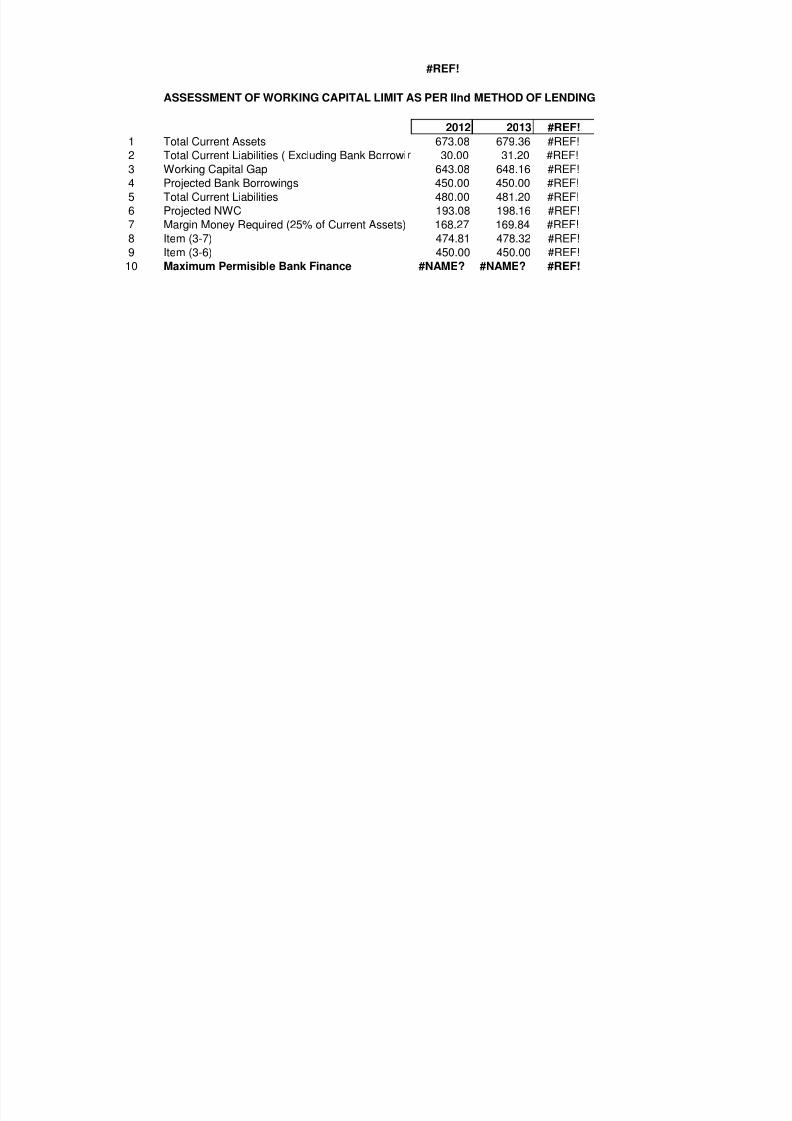
#REF!
ASSESSMENT OF WORKING CAPITAL LIMIT AS PER IInd METHOD OF LENDING
2012 2013 #REF!
1 Total Current Assets 673.08 679.36 #REF!2 Total Current Liabilities ( Excluding Bank Borrowi 30.00 31.20 #REF!
3 Working Capital Gap 643.08 648.16 #REF!
4 Projected Bank Borrowings 450.00 450.00 #REF!
5 Total Current Liabilities 480.00 481.20 #REF!
6 Projected NWC 193.08 198.16 #REF!
7 Margin Money Required (25% of Current Assets) 168.27 169.84 #REF!
8 Item (3-7) 474.81 478.32 #REF!
9 Item (3-6) 450.00 450.00 #REF!
10 Maximum Permisible Bank Finance #NAME? #NAME? #REF!

8/3/2019 khandelwal cma
http://slidepdf.com/reader/full/khandelwal-cma 28/40

8/3/2019 khandelwal cma
http://slidepdf.com/reader/full/khandelwal-cma 29/40
Funds Flow StatementAudited Audited Audited Projected Projected #REF! #REF! #REF!
2010 2011 2012 2013 #REF! #REF! #REF! #REF!
INCREASE IN
Capital 50.26 44.35 74.79 16.31 #REF! #REF! #REF! #REF!
T/L / Debt / Def. Payment
Public Deposit (Director)
Total term labilities incl Unsecure 15.09 37.76 0.00 0.00 #REF! #REF! #REF! #REF!
DECREASE IN
Fixed Assets 2.79 0.00 3.83 15.77 #REF! #REF! #REF! #REF!
Inter-Corp. investments & Advance #REF!
Other non current assets 20.16 0.00 0.00 0.00 #REF! #REF! #REF! #REF!
Sub total (Long Terms Fund 88.30 82.11 78.62 32.08 #REF! #REF! #REF! #REF!
INCREASE INBank borrowings 0.00 0.00 407.19 0.00 #REF! #REF! #REF! #REF!
Other Current liabilities 27.50 35.35 0.00 1.20 #REF! #REF! #REF! #REF!
DECREASE INInventory 0.00 0.00 0.00 6.70 #REF! #REF! #REF! #REF!
Receivables 0.00 0.00 5.64 0.00 #REF! #REF! #REF! #REF!
Other current assets 0.00 0.00 0.00 0.00 #REF! #REF! #REF! #REF!
Sub total: (Short Term Fund 27.50 35.35 412.83 7.90 #REF! #REF! #REF! #REF!
TOTAL FUNDS AVAILABLE
USESDECREASE IN
Capital 0.00 0.00 0.00 0.00 #REF! #REF! #REF! #REF!
T/L / Debt / Def. Payment
Public DepositTotal term labilities 0.00 0.00 29.16 27.00 #REF! #REF! #REF! #REF!
INCREASE INFixed Assets 0.00 11.45 0.00 0.00 #REF! #REF! #REF! #REF!
Inter-Corp. investments & Advance
Other non current assets 20.16 0.00 0.00 0.00 #REF! #REF! #REF! #REF!
Sub total (Long Term Uses) 20.16 11.45 29.16 27.00 #REF! #REF! #REF! #REF!
DECREASE INBank borrowings 1.52 20.99 0.00 0.00 #REF! #REF! #REF! #REF!
Other Current liabilities 0.00 0.00 198.21 0.00 #REF! #REF! #REF! #REF!
INCREASE IN
Inventory 57.49 51.78 272.91 0.00 #REF! #REF! #REF! #REF!
Receivables 13.03 13.25 0.00 10.00 #REF! #REF! #REF! #REF!
Other current assets 3.44 21.94 12.46 2.98 #REF! #REF! #REF! #REF!
Sub total: (Short term Uses) 75.48 107.96 483.58 12.98 #REF! #REF! #REF! #REF!
TOTAL FUNDS USED
SUMMARY:
Long Term Sources 88.30 82.11 78.62 32.08 #REF! #REF! #REF! #REF!
Less: Long Term Uses 20.16 11.45 29.16 27.00 #REF! #REF! #REF! #REF!Surplus(+)/Short fall(-) 68.14 70.66 49.46 5.08 #REF! #REF! #REF! #REF!
Short Term Sources 27.50 35.35 412.83 7.90 #REF! #REF! #REF! #REF!
Less: Short Term Uses 75.48 107.96 483.58 12.98 #REF! #REF! #REF! #REF!
Surplus(+) /Short fall(-) -47.98 -72.61 -70.75 -5.08 #REF! #REF! #REF! #REF!

8/3/2019 khandelwal cma
http://slidepdf.com/reader/full/khandelwal-cma 30/40

8/3/2019 khandelwal cma
http://slidepdf.com/reader/full/khandelwal-cma 31/40

8/3/2019 khandelwal cma
http://slidepdf.com/reader/full/khandelwal-cma 32/40

8/3/2019 khandelwal cma
http://slidepdf.com/reader/full/khandelwal-cma 33/40

8/3/2019 khandelwal cma
http://slidepdf.com/reader/full/khandelwal-cma 34/40

8/3/2019 khandelwal cma
http://slidepdf.com/reader/full/khandelwal-cma 35/40

8/3/2019 khandelwal cma
http://slidepdf.com/reader/full/khandelwal-cma 36/40
8/3/2019 khandelwal cma
http://slidepdf.com/reader/full/khandelwal-cma 37/40
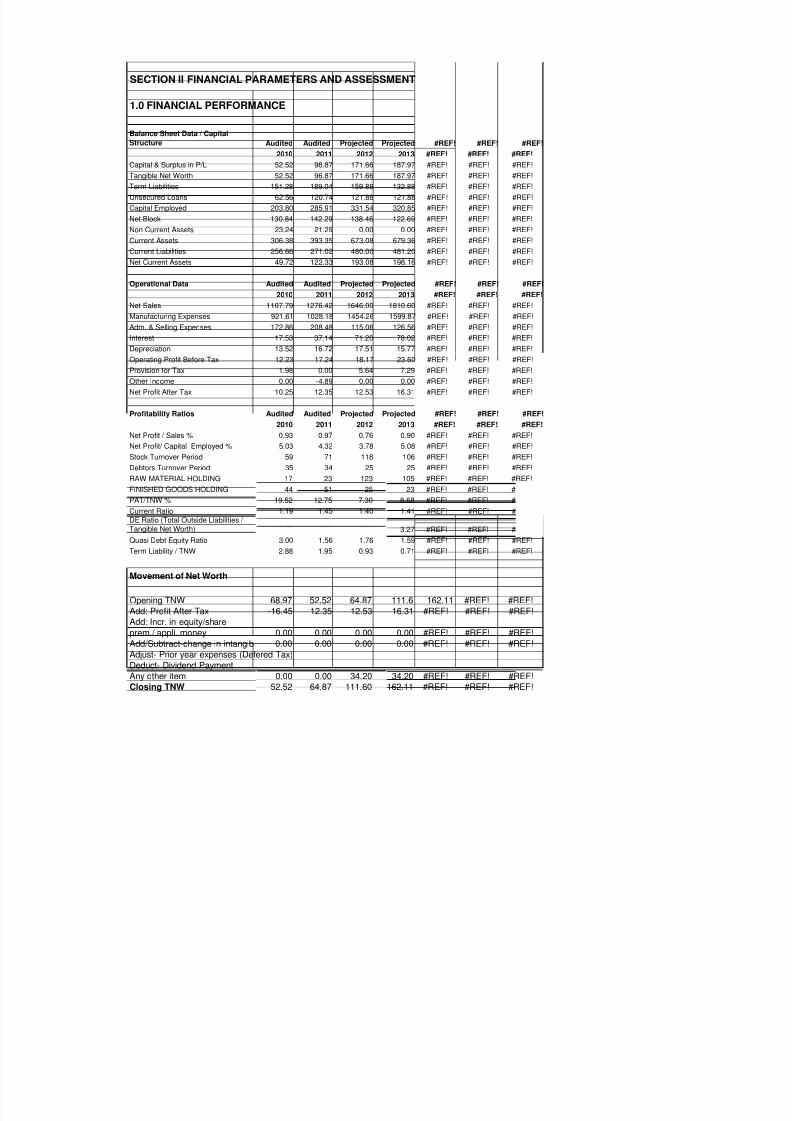
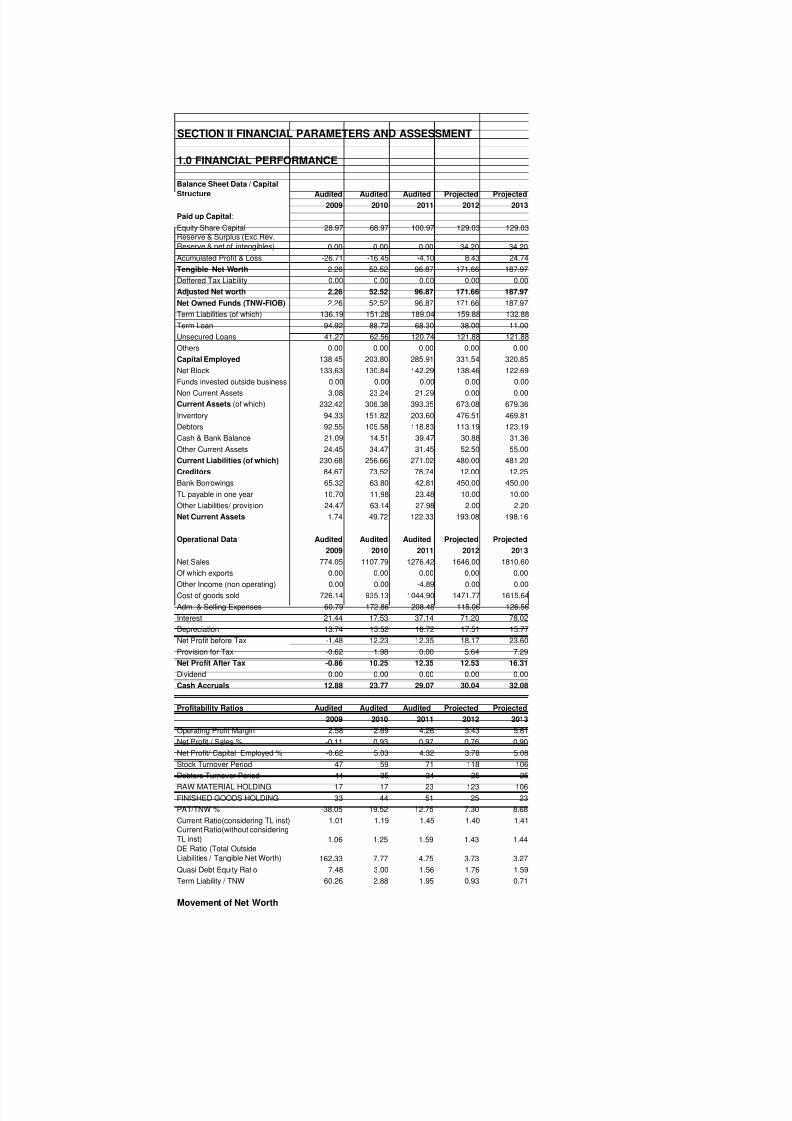
SECTION II FINANCIAL PARAMETERS AND ASSESSMENT
1.0 FINANCIAL PERFORMANCE
Balance Sheet Data / Capital
Structure Audited Audited Projected Projected #REF! #REF! #REF!2010 2011 2012 2013 #REF! #REF! #REF!
Capital & Surplus in P/L 52.52 96.87 171.66 187.97 #REF! #REF! #REF!
Tangible Net Worth 52.52 96.87 171.66 187.97 #REF! #REF! #REF!
Term Liabilities 151.28 189.04 159.88 132.88 #REF! #REF! #REF!
Unsecured Loans 62.56 120.74 121.88 121.88 #REF! #REF! #REF!
Capital Employed 203.80 285.91 331.54 320.85 #REF! #REF! #REF!
Net Block 130.84 142.29 138.46 122.69 #REF! #REF! #REF!
Non Current Assets 23.24 21.29 0.00 0.00 #REF! #REF! #REF!
Current Assets 306.38 393.35 673.08 679.36 #REF! #REF! #REF!
Current Liabilities 256.66 271.02 480.00 481.20 #REF! #REF! #REF!
Net Current Assets 49.72 122.33 193.08 198.16 #REF! #REF! #REF!
Operational Data Audited Audited Projected Projected #REF! #REF! #REF!2010 2011 2012 2013 #REF! #REF! #REF!
Net Sales 1107.79 1276.42 1646.00 1810.60 #REF! #REF! #REF!
Manufacturing Expenses 921.61 1028.18 1454.26 1599.87 #REF! #REF! #REF!
Adm. & Selling Expenses 172.86 208.48 115.06 126.56 #REF! #REF! #REF!
Interest 17.53 37.14 71.20 78.02 #REF! #REF! #REF!
Depreciation 13.52 16.72 17.51 15.77 #REF! #REF! #REF!
Operating Profit Before Tax 12.23 17.24 18.17 23.60 #REF! #REF! #REF!
Provision for Tax 1.98 0.00 5.64 7.29 #REF! #REF! #REF!
Other Income 0.00 -4.89 0.00 0.00 #REF! #REF! #REF!
Net Profit After Tax 10.25 12.35 12.53 16.31 #REF! #REF! #REF!
Profitability Ratios Audited Audited Projected Projected #REF! #REF! #REF!
2010 2011 2012 2013 #REF! #REF! #REF!
Net Profit / Sales % 0.93 0.97 0.76 0.90 #REF! #REF! #REF!
Net Profit/ Capital Employed % 5.03 4.32 3.78 5.08 #REF! #REF! #REF!
Stock Turnover Period 59 71 118 106 #REF! #REF! #REF!
Debtors Turnover Period 35 34 25 25 #REF! #REF! #REF!
RAW MATERIAL HOLDING 17 23 123 105 #REF! #REF! #REF!
FINISHED GOODS HOLDING 44 51 25 23 #REF! #REF! #REF!
PAT/TNW % 19.52 12.75 7.30 8.68 #REF! #REF! #REF!
Current Ratio 1.19 1.45 1.40 1.41 #REF! #REF! #REF!
DE Ratio (Total Outside Liabilities /
Tangible Net Worth) 7.77 4.75 3.73 3.27 #REF! #REF! #REF!
Quasi Debt Equity Ratio 3.00 1.56 1.76 1.59 #REF! #REF! #REF!
Term Liability / TNW 2.88 1.95 0.93 0.71 #REF! #REF! #REF!
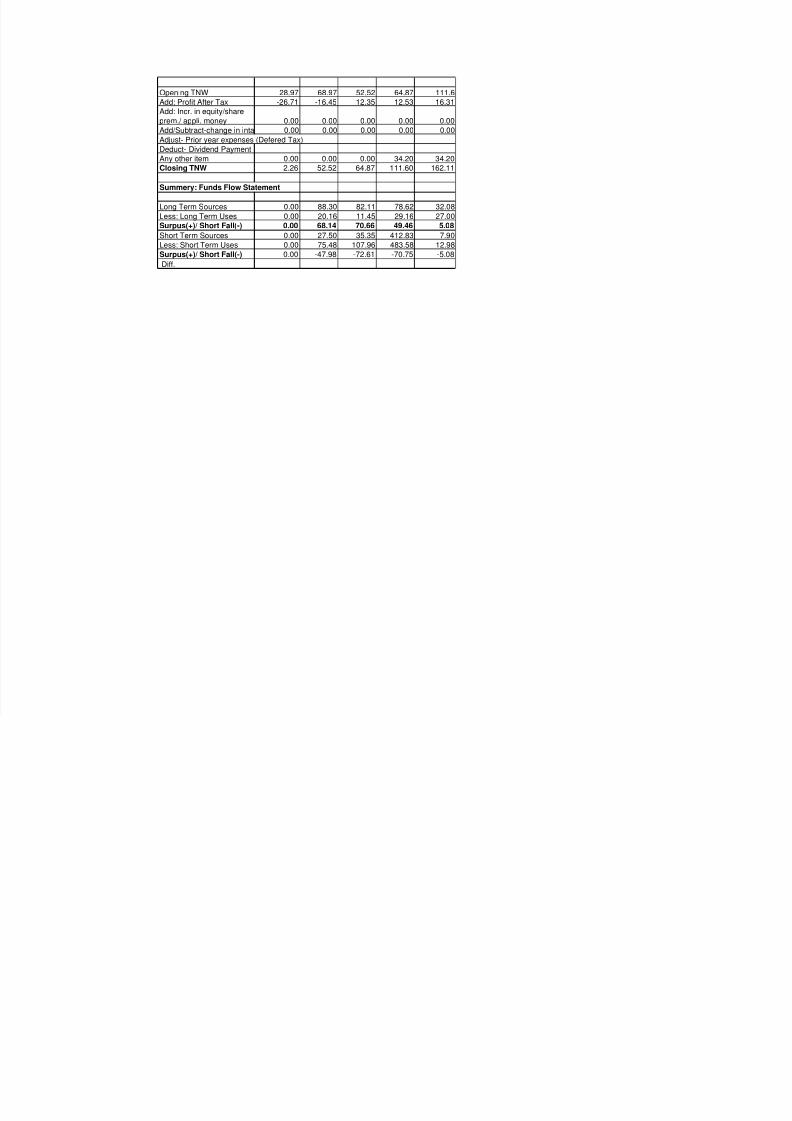
Movement of Net Worth
Opening TNW 68.97 52.52 64.87 111.6 162.11 #REF! #REF!
Add: Profit After Tax -16.45 12.35 12.53 16.31 #REF! #REF! #REF!
Add: Incr. in equity/share
prem./ appli. money 0.00 0.00 0.00 0.00 #REF! #REF! #REF!
Add/Subtract-change in intangib 0.00 0.00 0.00 0.00 #REF! #REF! #REF!
Adjust- Prior year expenses (Defered Tax)
Deduct- Dividend Payment
Any other item 0.00 0.00 34.20 34.20 #REF! #REF! #REF!
Closing TNW 52.52 64.87 111.60 162.11 #REF! #REF! #REF!
8/3/2019 khandelwal cma
http://slidepdf.com/reader/full/khandelwal-cma 38/40
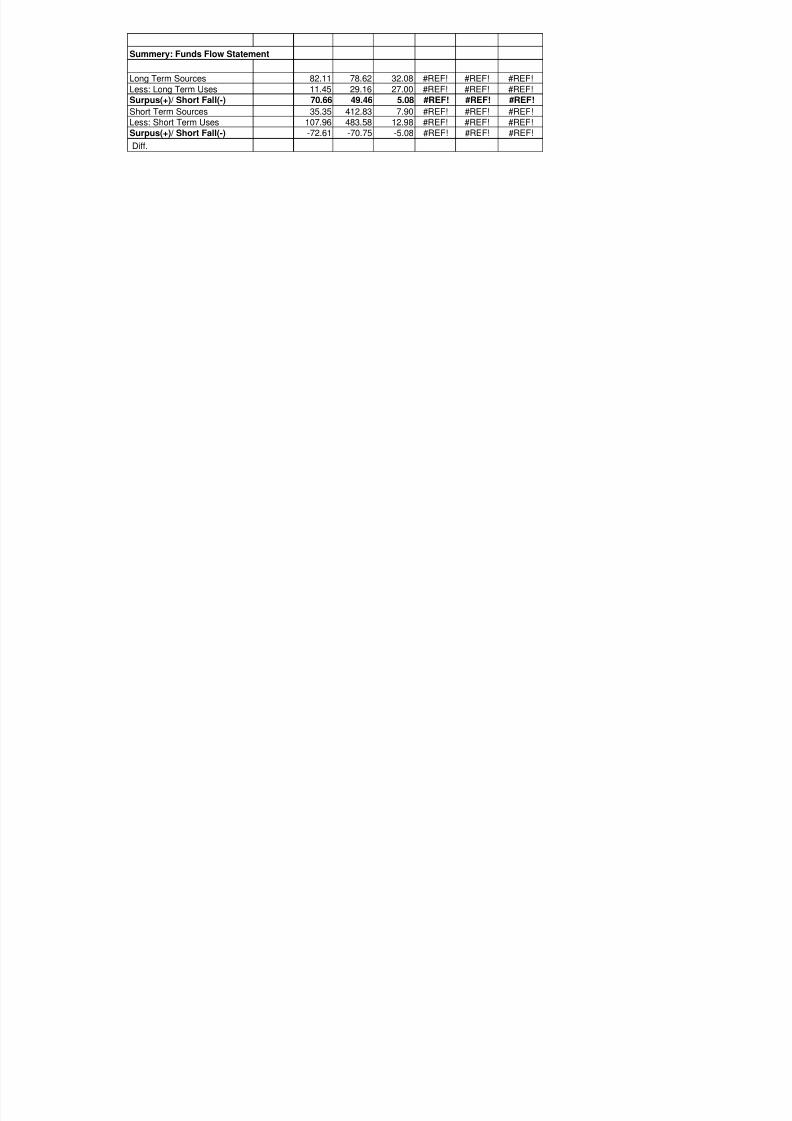
Summery: Funds Flow Statement
Long Term Sources 82.11 78.62 32.08 #REF! #REF! #REF!
Less: Long Term Uses 11.45 29.16 27.00 #REF! #REF! #REF!
Surpus(+)/ Short Fall(-) 70.66 49.46 5.08 #REF! #REF! #REF!
Short Term Sources 35.35 412.83 7.90 #REF! #REF! #REF!
Less: Short Term Uses 107.96 483.58 12.98 #REF! #REF! #REF!
Surpus(+)/ Short Fall(-) -72.61 -70.75 -5.08 #REF! #REF! #REF!
Diff.
8/3/2019 khandelwal cma
http://slidepdf.com/reader/full/khandelwal-cma 39/40
SECTION II FINANCIAL PARAMETERS AND ASSESSMENT
1.0 FINANCIAL PERFORMANCE
Balance Sheet Data / Capital
Structure Audited Audited Audited Projected Projected
2009 2010 2011 2012 2013
Paid up Capital:
Equity Share Capital 28.97 68.97 100.97 129.03 129.03Reserve & Surplus (Exc.Rev.
Reserve & net of intengibles) 0.00 0.00 0.00 34.20 34.20
Acumulated Profit & Loss -26.71 -16.45 -4.10 8.43 24.74
Tengible Net Worth 2.26 52.52 96.87 171.66 187.97
Deffered Tax Liability 0.00 0.00 0.00 0.00 0.00
Adjusted Net worth 2.26 52.52 96.87 171.66 187.97
Net Owned Funds (TNW-FIOB) 2.26 52.52 96.87 171.66 187.97
Term Liabilities (of which) 136.19 151.28 189.04 159.88 132.88
Term Loan 94.92 88.72 68.30 38.00 11.00
Unsecured Loans 41.27 62.56 120.74 121.88 121.88
Others 0.00 0.00 0.00 0.00 0.00
Capital Employed 138.45 203.80 285.91 331.54 320.85
Net Block 133.63 130.84 142.29 138.46 122.69
Funds invested outside business 0.00 0.00 0.00 0.00 0.00
Non Current Assets 3.08 23.24 21.29 0.00 0.00
Current Assets (of which) 232.42 306.38 393.35 673.08 679.36
Inventory 94.33 151.82 203.60 476.51 469.81
Debtors 92.55 105.58 118.83 113.19 123.19Cash & Bank Balance 21.09 14.51 39.47 30.88 31.36
Other Current Assets 24.45 34.47 31.45 52.50 55.00
Current Liabilities (of which) 230.68 256.66 271.02 480.00 481.20
Creditors 84.67 73.52 78.74 12.00 12.25
Bank Borrowings 65.32 63.80 42.81 450.00 450.00
TL payable in one year 10.70 11.98 23.48 10.00 10.00
Other Liabilities/ provision 24.47 63.14 27.98 2.00 2.20
Net Current Assets 1.74 49.72 122.33 193.08 198.16
Operational Data Audited Audited Audited Projected Projected
2009 2010 2011 2012 2013
Net Sales 774.05 1107.79 1276.42 1646.00 1810.60
Of which exports 0.00 0.00 0.00 0.00 0.00Other Income (non operating) 0.00 0.00 -4.89 0.00 0.00
Cost of goods sold 726.14 935.13 1044.90 1471.77 1615.64
Adm. & Selling Expenses 60.79 172.86 208.48 115.06 126.56
Interest 21.44 17.53 37.14 71.20 78.02
Depreciation 13.74 13.52 16.72 17.51 15.77
Net Profit before Tax -1.48 12.23 12.35 18.17 23.60
Provision for Tax -0.62 1.98 0.00 5.64 7.29
Net Profit After Tax -0.86 10.25 12.35 12.53 16.31
Dividend 0.00 0.00 0.00 0.00 0.00
Cash Accruals 12.88 23.77 29.07 30.04 32.08
Profitability Ratios Audited Audited Audited Projected Projected
2009 2010 2011 2012 2013
Operating Profit Margin 2.58 2.69 4.26 5.43 5.61
Net Profit / Sales % -0.11 0.93 0.97 0.76 0.90
Net Profit/ Capital Employed % -0.62 5.03 4.32 3.78 5.08
Stock Turnover Period 47 59 71 118 106
Debtors Turnover Period 44 35 34 25 25
RAW MATERIAL HOLDING 17 17 23 123 106
FINISHED GOODS HOLDING 33 44 51 25 23
PAT/TNW % -38.05 19.52 12.75 7.30 8.68
Current Ratio(considering TL inst) 1.01 1.19 1.45 1.40 1.41Current Ratio(without considering
TL inst) 1.06 1.25 1.59 1.43 1.44DE Ratio (Total Outside
8/3/2019 khandelwal cma
http://slidepdf.com/reader/full/khandelwal-cma 40/40
Opening TNW 28.97 68.97 52.52 64.87 111.6
Add: Profit After Tax -26.71 -16.45 12.35 12.53 16.31
Add: Incr. in equity/share
prem./ appli. money 0.00 0.00 0.00 0.00 0.00
Add/Subtract-change in inta 0.00 0.00 0.00 0.00 0.00
Adjust- Prior year expenses (Defered Tax)Deduct- Dividend Payment
Any other item 0.00 0.00 0.00 34.20 34.20
Closing TNW 2.26 52.52 64.87 111.60 162.11
Summery: Funds Flow Statement
Long Term Sources 0.00 88.30 82.11 78.62 32.08
Less: Long Term Uses 0.00 20.16 11.45 29.16 27.00
Surpus(+)/ Short Fall(-) 0.00 68.14 70.66 49.46 5.08
Short Term Sources 0.00 27.50 35.35 412.83 7.90
Less: Short Term Uses 0.00 75.48 107.96 483.58 12.98
Surpus(+)/ Short Fall(-) 0.00 -47.98 -72.61 -70.75 -5.08
Diff.