Austrolimnius cleidecostae, a new species of riffle beetle ...

Draft
The importance of metacommunity processes for long-term
turnover of riffle-dwelling fish assemblages depends on spatial position within dendritic network
Journal: Canadian Journal of Fisheries and Aquatic Sciences
Manuscript ID cjfas-2016-0049.R1
Manuscript Type: Article
Date Submitted by the Author: 10-May-2016
Complete List of Authors: Dala-Corte, Renato; Universidade Federal do Rio Grande do Sul, Ecologia Becker, Fernando; Universidade Federal do Rio Grande do Sul, Ecologia Melo, Adriano; Universidade Federal de Goiás,
Keyword: stream, habitat change, channel slope, connectivity, DISPERSAL < General
https://mc06.manuscriptcentral.com/cjfas-pubs
Canadian Journal of Fisheries and Aquatic Sciences

Draft
1
The importance of metacommunity processes for long-term turnover of riffle-dwelling fish 1
assemblages depends on spatial position within dendritic network 2
3
Renato Bolson Dala-Corte 1†
, Fernando Gertum Becker2
and Adriano Sanches Melo3
4
5
1 Programa de Pós-Graduação em Ecologia, Universidade Federal do Rio Grande do Sul, PO 6
box 15007, CEP 91501–970, Porto Alegre, RS, Brazil; [email protected]
7
2 Departamento de Ecologia, IB, Universidade Federal do Rio Grande do Sul, PO box 15007, 8
CEP 91501–970, Porto Alegre, RS, Brazil; [email protected]
9
3 Departamento de Ecologia, ICB, Universidade Federal de Goiás, PO box 131, CEP 74001–10
970, Goiânia, GO, Brazil. E-mail: [email protected] 11
12
†Corresponding author: [email protected], +55 51 33086782 13
14
15
16
17
18
19
20
21
22
23
Page 1 of 55
https://mc06.manuscriptcentral.com/cjfas-pubs
Canadian Journal of Fisheries and Aquatic Sciences

Draft
2
Abstract: Spatial position within dendritic network may determine environmental filters and 24
connectivity with source of immigrants, influencing species composition and variation in 25
metacommunities. We investigated how long-term turnover of riffle-dwelling fish assemblages 26
is affected by niche- and dispersal-related processes. Multiple linear model selection resulted in 27
four variables important to explain assemblage turnover: (i) habitat change, (ii) channel slope, 28
(iii) dlink - a proxy for connectivity - and (iv) catchment area. These four variables were related 29
to turnover in species abundance, while turnover in species occurrence was only related to 30
habitat change. Models generated for each species indicated they were differently affected by 31
niche- and dispersal-related processes. Our findings provide support for the hypothesis that 32
metacommunity processes affecting temporal turnover of stream fish communities are 33
dependent on the spatial position within dendritic network, but also vary among species. Our 34
study has implications for sampling design in monitoring programs, as the degree of 35
dissimilarities in fish communities depends not only on local habitat change, but on spatial 36
position within the drainage network and on species particularities. 37
38
Keywords: stream, habitat change, channel slope, connectivity, dispersal 39
40
41
42
43
44
45
46
Page 2 of 55
https://mc06.manuscriptcentral.com/cjfas-pubs
Canadian Journal of Fisheries and Aquatic Sciences
Draft
3
Introduction 47
Long-term variation in species occurrence and population density is a central theme in 48
ecology and allows understanding and predicting how communities will behave facing particular 49
environmental conditions (Magurran et al. 2010). Changes in species occurrence and abundance 50
between years have been widely studied in stream ecosystems and linked mainly to variations in 51
environmental conditions (e.g., Mykrä et al. 2011; Matthews et al.1988, 2013). This seems to be 52
of particular importance in stream ecosystems, as environmental conditions may be highly 53
variable in time due to slow and continuous processes (erosion, deposition) and to episodic 54
disturbances caused by drought and spates that lead to channel reconfiguration (e.g., Matthews 55
et al. 1988; Grossman et al. 1998; Matthews and Marsh-Matthews 2006). However, less 56
attention has been given to the fact that flow regime and the severity of hydrological 57
disturbances may depend on the spatial position within a drainage network (the “Process 58
Domain Concept”, Montgomery 1999) and that its spatial structure affects the dispersal of 59
aquatic organisms (Hitt and Angermeier 2008; Altermatt 2013). According to the Process 60
Domain Concept, “spatial variability in geomorphic processes governs temporal patterns of 61
disturbances that influence ecosystem structure and dynamics”. 62
The importance of metacommunity theory to explain patterns and processes of 63
freshwater assemblages in dendritic networks has received increasing attention (Altermatt 2013; 64
Heino 2013; Heino et al. 2015). Metacommunity theory posits that local assemblages are 65
determined by i) environmental and biotic (e.g. competition) filtering, operating at different 66
spatial scales, ii) dispersal limitation dependent on the spatial connectivity and on dispersal 67
abilities of species, and iii) neutral processes (Leibold et al. 2004; Heino et al. 2015). In this 68
sense, local assemblages are recognized as open systems that are dependent on other local 69
Page 3 of 55
https://mc06.manuscriptcentral.com/cjfas-pubs
Canadian Journal of Fisheries and Aquatic Sciences

Draft
4
communities. For instance, dispersal may influence population size and preclude local species 70
extinctions in sub-optimal or sink patches (Leibold et al. 2004). 71
Metacommunity theory has been more broadly used to explain spatial patterns in species 72
occurrence and in population abundance of local assemblages, in both terrestrial (Schmidt et al. 73
2008; Driscoll and Lindenmayer 2009; Myers et al. 2013) and dendritic aquatic networks (e.g. 74
Thompson and Townsend 2006; Perkin and Gido 2012; Altermatt 2013). However, it can also 75
address processes affecting the temporal dynamics of local assemblages (Leibold et al. 2004). 76
For instance, metacommunity theory can be evoked to predict which communities will be more 77
or less stable between years and over mid- to long-term periods (i.e., more than 10 years). 78
Communities well connected in a network should receive many migrants that buffer against 79
demographic stochasticity and allow fast recovery from disturbance events. 80
The hydrological regime of riverine ecosystems, including flood and drought 81
disturbances, is probably the most important factor driving temporal variation in stream habitats 82
and faunal composition (Poff and Ward 1989; Grossman et al. 1990; Matthews et al. 2013). 83
Variation in flow regime can affect immigration and extinction rates of stream fishes (Taylor 84
and Warren 2001). Due to the spatially structured geomorphologic characteristics of river 85
basins, upstream segments of mountainous streams are expected to have steep slopes, 86
entrenched and straight channels, to retain large substrates and to experience high stream flow 87
energy (Rosgen 1994; Montgomery 1999; Rice et al. 2001). Also, steep channels will respond 88
more quickly to rainfall and will produce higher and shorter peak discharges compared to 89
streams with gentle slopes in the lower section of watersheds (Resh et al. 1988; Gordon et al. 90
2004; Nippgen et al. 2011). Therefore, fish assemblages in stream segments with steep channels 91
will be subjected to strong environmental filtering owing to continuous high flow energy and to 92
Page 4 of 55
https://mc06.manuscriptcentral.com/cjfas-pubs
Canadian Journal of Fisheries and Aquatic Sciences

Draft
5
severe hydrological disturbances caused by spates, which may influence temporal turnover of 93
fish assemblages (changes in species occurrence and population abundance). 94
A second important aspect associated with the dendritic structure of stream networks is 95
that the faunal movement is highly dependent on the connectivity between branches of the 96
network and on how the network structure is spatially organized (Benda et al. 2004; Altermatt 97
2013). In contrast to dispersal in terrestrial landscapes, fish and other aquatic species are 98
constrained to disperse through branches and confluences (or edges and vertices) of the stream 99
network (Fagan 2002; Altermatt 2013; Altermatt et al. 2013). Two particular features of such 100
dendritic structure are that small streams can be connected to rivers of different sizes depending 101
on their location within the basin (central or peripheral), and within a given stream there is a 102
longitudinal distance gradient from the connection to the mainstem channel (Fausch et al. 2002; 103
Campbell-Grant et al. 2007). The influence of the dendritic structure of drainage networks on 104
spatial variation in occurrence and abundance of fish species has been demonstrated (Osborne 105
and Wiley 1992; Grenouillet et al. 2004; Thornbrugh and Gido 2010). A likely mechanism for 106
such influence is that large rivers with increased habitat capacity act as sources of migrants, 107
altering local richness and community structure of tributaries (Osborne and Wiley 1992). 108
Accordingly, the distance of a stream segment from its downstream confluence with a large 109
stream has been shown to be important for local composition of stream communities 110
(Thornbrugh and Gido 2010). Also, centrally located stream segments are more connected to 111
other habitat patches and to other fish populations distributed across the drainage network. Thus, 112
isolated stream habitats in the periphery of the basin are expected to receive fewer migrants 113
compared to more connected stream habitats in the center of the basin (Taylor 1997). Even if the 114
extinction rates are similar between peripheral and central sites, the populations in the latter are 115
Page 5 of 55
https://mc06.manuscriptcentral.com/cjfas-pubs
Canadian Journal of Fisheries and Aquatic Sciences

Draft
6
more likely to be ‘rescued’ from local extinction by high immigration rates. Additionally, 116
immigration rates have been demonstrated to increase with stream size (Taylor and Warren 117
2001). This effect may be dependent on the combined effect of patch size and dendritic 118
connectivity of drainage networks, which increase simultaneously in more centrally located sites 119
(Carrara et al. 2014). Therefore, we should expect that distance from sources of colonists may 120
lead to differences in temporal turnover of assemblages regarding species occurrence and 121
abundance. 122
Considering the influences that niche- and dispersal-related processes may have on fish 123
assemblages in dendritic networks, we investigated how long-term turnover of riffle-dwelling 124
fish assemblages is affected by habitat change, channel slope, and spatial position within 125
drainage network. We used habitat and slope variables as proxies for niche-related processes and 126
spatial position variables as proxies for dispersal-related processes. We hypothesized that (1) 127
large changes in instream physical habitat structure (i.e. changes in environmental conditions) 128
should lead to high temporal turnover, (2) high-gradient channels should lead to high temporal 129
turnover due to severe stochastic flood events, and (3) proximity to a large stream should lead to 130
low temporal turnover of riffle-dwelling fish assemblages due to a high influx of downstream 131
immigrants that dampens disturbance effects. We addressed these hypotheses using 22 stream 132
fish assemblages sampled 13 years apart in a subtropical catchment. 133
134
Methods 135
Study area 136
This study was conducted in the Maquiné river basin (total area ca. 550 km2), an Atlantic 137
coastal drainage located in southern Brazil between longitudes 50°05’W and 51°21’W and 138
Page 6 of 55
https://mc06.manuscriptcentral.com/cjfas-pubs
Canadian Journal of Fisheries and Aquatic Sciences

Draft
7
latitudes 29°20’S and 29°50’S (Fig. 1). Headwaters of the river Maquiné are located on a basalt 139
plateau (ca. 1000 m above sea level) and its final segment flows into lake Quadros (ca. 10 m 140
above sea level). Regional climate is humid subtropical (Moreno 1961) with mean temperatures 141
higher than 22°C in the warmest month and between 13°C and 15°C in the coldest month 142
(Hasenack and Ferraro 1989). There is no typical dry season and annual rainfall is high (1400 143
mm to 1800 mm) (Hasenack and Ferraro 1989). Rain storms are common over the year (mainly 144
in spring and summer) resulting in high-energy flash floods, which physically affect stream 145
habitats (Becker et al. 2008). The pronounced elevation profile of the Maquiné basin and the 146
steep and entrenched stream channels (mainly in its upper and intermediate segments), 147
contribute to episodes of harsh hydrological conditions for the fish fauna. 148
149
Sampling sites 150
Fish sampling was conducted in 1999 and 2012. There were at least three catastrophic 151
flood events in the period caused by concentrated rainfall that physically affected stream 152
habitats: 206 mm in three days (2001), 172 mm in two days (2007) and 306 mm in three days 153
(2008). There was more accumulated rainfall in one day in the 2008 event than in any other day 154
between 1999 and 2012 period, exceeding the mean rainfall expected for an entire month 155
(Appendix, Fig. A1). In fact, two of the authors (ASM, FGB) were able to visit the area 156
immediately after the 2008 intense rains and observed a severe flood episode that caused 157
profound channel reconfiguration in some of the stream segments, particularly those in low 158
valley areas (< 250 m). Average monthly rainfall of the two sampling years were similar to each 159
other (131 mm for 1999 and 123 mm for 2012) and to the average monthly rainfall of the entire 160
13 years sampling interval (1999 to 2012; mean = 145 mm; Appendix, Fig. A1). 161
Page 7 of 55
https://mc06.manuscriptcentral.com/cjfas-pubs
Canadian Journal of Fisheries and Aquatic Sciences

Draft
8
Streams of the Maquiné basin are composed of riffle–pool sequences with clear and fast-162
flowing water and substrate composed mainly of pebbles, cobbles and boulders (Becker et al. 163
2008). We sampled riffle habitats with an average depth of 22 cm and average wetted width of 164
8.8 m (ranging from 4.0 m to 19.5 m). Catchment area of the sample sites ranged from 6.4 km2
165
to 165.9 km2, average 38.1 km
2 (Appendix, Tables A1, A2). Sampling sites were restricted to 166
lower valley sections (< 250 m of elevation) and to the tributaries of the main river (Maquiné). 167
In each stream, we selected riffle sites according to accessibility (roads) and to distance between 168
sites (a minimum of 1 km network distance between sites). 169
170
Fish sampling 171
We sampled 22 riffle sites (Fig. 1) that differed in channel steepness and distance from 172
the mainstem channel. At each site, we employed kick-sampling to capture fish along a 40-m 173
stream riffle segment using a rectangular dip-net (80 x 40 x 40 cm with 4 mm mesh), sampling 174
all the flowing-water micro-habitats by disturbing stream bottom. A benthic-sampler (Fisher 175
1987) similar to the kick-sampling procedure we used has been shown to be reliable for 176
obtaining quantitative samples of small benthic fishes in riffle habitats. In addition, we observed 177
that kick-sampling is efficient (compared to trawl-net, gill-net and electrofishing) for capturing 178
fish species in riffle habitats of the study area, particularly when the focus is on riffle-dwelling 179
specialists such as benthic species (e.g., most of loricariids; R. B. Dala-Corte and F. G. Becker, 180
personal observation). For instance, we noted that several shocked armored catfish (loricariids) 181
individuals get stuck among bottom rocks because of their benthic, cryptic habit and body 182
morphology, reducing their catchability in comparison to kick-sampling (R.B. Dala-Corte, 183
personal observation). Indeed, Champeau et al. (2009) reported that armored catfish species 184
Page 8 of 55
https://mc06.manuscriptcentral.com/cjfas-pubs
Canadian Journal of Fisheries and Aquatic Sciences
Draft
9
were less vulnerable to electrofishing gear and may be underrepresented in electrofishing 185
samples. Thus, although electrofishing may be more efficient than kick-sampling to sample the 186
whole fish community, kick-sampling should be as good as electrofishing for the benthic riffle 187
fishes in the study region. Most importantly, however, is that any potential sampling bias 188
introduced by the chosen sampling method was standardized between the two sampling periods, 189
as we used precisely the same sampling protocol and sampling effort. 190
We sampled 40-m long riffle segments because a previous assessment has demonstrated 191
that the total number of riffle species does not increase substantially when more than 40 m are 192
sampled (F. G. Becker, unpublished data). We were able to catch most of the species that one 193
can find in riffles of the Maquiné river basin (25 out of 27 species) according to a previous 194
extensive sampling effort performed throughout the whole basin (Becker 2002). We sampled 195
each site once in the spring–summer of 1999 and once in the spring–summer of 2012. In both 196
years, we captured fishes during low-flow periods and at least one week after rainfall events. 197
Thus, fish catchability was unlikely to be affected by discharge variability between samples. In 198
each site, we employed the same sampling effort in the two sampling years. Sampling performed 199
in 2012 was supervised by the author who sampled the sites in 1999 (FGB). Most South 200
American freshwater fishes usually live up to 5–6 years (Dei Tos et al. 2010) and, therefore, a 201
13-year period should be enough for at least 1 to 2 full replacements of all individuals in the 202
population. 203
The fish species pool of the Maquiné basin is well known, although a few species are 204
still not formally described (Malabarba et al. 2013), allowing us to identify individuals in situ 205
during field work. Only two of the caught species have not been formally described to date 206
(Heptapterus sp. and Trichomycterus sp.), but they were readily identifiable during field work 207
Page 9 of 55
https://mc06.manuscriptcentral.com/cjfas-pubs
Canadian Journal of Fisheries and Aquatic Sciences

Draft
10
and thus included in the analyses. We returned all the sampled fishes to the stream site 208
immediately after each sampling in 2012. 209
In order to reduce noise in statistical analyses, we removed from the data matrix those 210
species for which kick-sampling is not an efficient method and also those species typical of 211
other habitats (e.g. pools or stream shore aquatic vegetation), or which were only accidentally 212
caught. After these criteria, we kept 14 species in the data matrix out of the total of 25 species 213
captured by kick-sampling. Therefore, this study focused on benthic species that are typically 214
found in riffle habitats. Removal of these species was based on previous studies in streams of 215
the same basin, including electrofishing, seining and gill-nets (Becker 2002; Vogel 2012) and 216
underwater observation (FGB and RBD, personal observation). Out of the 11 low-abundant 217
species caught with kick-sampling and that were removed from analyses, five were among the 218
most abundant species sampled using electrofishing (Rhamdella zelimai, Crenicichla maculata, 219
Astyanax laticeps, Astyanax douradilho, Rhamdia quelen) and three were among the most 220
abundant species caught with seine nets (Odontostoechus lethostigmus, Hyphessobrycon 221
luetkenii, Deuterodon stigmaturus). These are all nektonic (A. laticeps, A. douradilho, 222
O. lethostigmus, H. luetkenii, D. stigmaturus) or nektobenthic (C. maculata, R. zelimai, R. 223
quelen) species. The other three species removed (Mimagoniates rheocharis; Microglanis 224
cibelae; Phalloceros caudimaculatus) are typical of other habitats, such as lateral backwater 225
channels and vegetated slow water pools, and are not usually caught in riffles (Menezes and 226
Weitzman 2009; Malabarba et al. 2013). 227
228
Local habitat variables and habitat change 229
Page 10 of 55
https://mc06.manuscriptcentral.com/cjfas-pubs
Canadian Journal of Fisheries and Aquatic Sciences

Draft
11
In 1999 and 2012 we measured local habitat variables at five cross sections 230
perpendicular to stream flow, and placed every 10 m along each 40-m stream segment where 231
fish were sampled. We measured bankfull and wetted width, and depth at three equidistant 232
points in each transect. Substrate size composition and variation were quantified by visually 233
estimating the percent cover of five size classes of substrate at the same locations where we 234
measured depths: 1) < 2 cm; 2) 2–7 cm, 3) 7–25 cm, 4) 25–50 cm, 5) > 50 cm. Percent cover 235
corresponding to each substrate size were visually estimated in the following classes: 1) 1–25%; 236
2) 25–50%; 3) 50–75%; 4) > 75%. We used these measures to generate 13 habitat variables per 237
site: 1–4) mean and coefficient of variation of bankfull and wetted width; 5) wetted:bankfull 238
width ratio; 6–7) mean and coefficient of variation of water depth; 8–12) averages of percent 239
cover for each of the five substrate classes and 13) Shannon–Wiener diversity index based on 240
substrate classes. Differences in habitat variables between 1999 and 2012 were evaluated with 241
paired t-tests, using sampled sites as blocking factor. 242
Based on the 13 aforementioned local habitat variables, we calculated habitat change 243
between 1999 and 2012 for each sampling site using Euclidean distances on variables 244
standardized by their ranges with the vegan package (Oksanen et al. 2013). Thus, habitat change 245
was measured as the Euclidean distance based on how much a site differed in time regarding its 246
habitat characteristics. All the statistical analyses were carried out using R Statistical 247
Environment (R Development Core Team 2015). 248
249
Stream size, channel slope and network position 250
Eight variables regarding stream size, channel slope and spatial position within the 251
drainage network were used to investigate temporal turnover of fish assemblage using species 252
Page 11 of 55
https://mc06.manuscriptcentral.com/cjfas-pubs
Canadian Journal of Fisheries and Aquatic Sciences

Draft
12
occurrence and species abundance (Table A2). They were obtained from a digital elevation 253
model (DEM) generated for the Maquiné basin using ArcGIS 10.2. The DEM was generated 254
from topographic data and stream network lines available from a 1:50.000 scale digital spatial 255
database (Hasenack and Weber 2010). These eight explanatory variables included one metric of 256
stream size, four metrics of network position and three metrics of stream channel slope. 257
Stream size. To represent stream size we used square root transformed upstream 258
catchment area, which is the cumulative catchment area (km2) for each sampling site. Squared-259
transformed upstream catchment area is an indicator of discharge volume, distance from river 260
source and channel width, and thus can be used as a stream size descriptor (Leopold & 261
Maddock, 1953). Notice, however, that small streams can be located either in the periphery or in 262
the center of the basin, so that catchment area does not express differences in linkage to large 263
downstream streams (i.e., streams or rivers with greater water volume; Osborne and Wiley 264
1992); therefore we also calculated network position metrics for each site (see below). 265
Network position metrics. For each sampled stream segment we calculated the following 266
network position metrics: downstream link magnitude, downstream order, betweenness 267
centrality, and closeness centrality. Downstream link magnitude and downstream order of a 268
given site are metrics that represent size of the stream after the next downstream confluence, as 269
proposed by Osborne and Wiley (1992). We used downstream Shreve order to measure 270
downstream link magnitude and downstream Strahler order to measure downstream order. 271
Strahler order increases only after the confluence of two streams of same order (Strahler 1957), 272
while Shreve order of a given network site is the sum of the number of all upstream tributaries 273
(Shreve 1966). Consequently, stream sites with the same upstream catchment area can differ 274
both in terms of downstream link and downstream order, depending on their spatial location 275
Page 12 of 55
https://mc06.manuscriptcentral.com/cjfas-pubs
Canadian Journal of Fisheries and Aquatic Sciences

Draft
13
within a drainage network. For computing stream order, we follow Osborne and Wiley (1992) in 276
not considering the most immediate downstream confluence when they were small (first order) 277
tributaries, because of the potential influence of the larger downstream watercourse. 278
Betweenness centrality was measured as the number of shortest paths among all nodes that pass 279
through a given node of interest (Newman 2010). Thus, central nodes in the drainage network 280
will supposedly receive a high number of paths. Closeness centrality of a node was the inverse 281
of the average length of the shortest paths from the focal node to all other nodes in the graph 282
(Newman 2010). Betweenness centrality and closeness centrality were calculated with the 283
igraph package (Csardi and Nepusz 2006). We used packages shp2graph (Lu 2014) and 284
maptools (Bivand and Lewin-Koh 2014) to convert shapefiles of the drainage network and sites 285
into igraph-class objects. Sample sites and confluences were defined as nodes. See Fig. A2 286
(Appendix) for a schematic representation of how network position metrics were calculated. 287
Stream channel slope (stream gradient). We assessed the three following stream slope 288
metrics: average slope between upstream and downstream confluences of the sampled site, 289
average slope in a 1-km segment upstream from the sampled site, and average local slope. The 290
first two metrics were obtained in ArcGIS 10.2 using the slope tool in the Spatial Analyst 291
toolbox. Average local slope was obtained from field measurements of channel steepness 292
between the five cross sections along each sampling site (see sub-section Local habitat variables 293
and habitat change). We included stream channel slope measured at three different spatial scales 294
because there is still little information in the literature on which scale slope should be measured 295
to represent the influence of hydrological process on local assemblages. 296
297
Assemblage turnover and model selection 298
Page 13 of 55
https://mc06.manuscriptcentral.com/cjfas-pubs
Canadian Journal of Fisheries and Aquatic Sciences

Draft
14
We used multiple linear model selection to evaluate three hypotheses about the influence 299
of habitat change, stream channel slope and within-network spatial position on temporal 300
turnover of riffle-dwelling fish assemblages. The response variable used in the models was 301
within-site dissimilarity of assemblages between 1999 and 2012 (temporal beta diversity). We 302
tested models using two different dissimilarity measures: 1) Sorensen dissimilarity based on 303
species presence and absence data, to assess turnover based on species occurrence data, and 2) 304
Bray–Curtis dissimilarity, as an indicator of assemblage change based on log-transformed 305
species abundance data. 306
We generated two linear regression models, one for Sorensen dissimilarity (species 307
occurrence) and the other for Bray–Curtis dissimilarity (species abundance) as response 308
variables, including eight variables regarding spatial position, plus 1999-2012 changes in 309
instream physical habitat (Table A2). We then used Variance Inflation Factor (VIF) analysis 310
(Fox and Monette 1992) to evaluate multicollinearity in the models. Variables with higher 311
values of VIF were removed one-by-one from the models until all remaining variables presented 312
VIF values lower than two (Fox and Monette 1992). From the nine initial explanatory variables, 313
two presented VIF values higher than two (betweenness centrality and downstream order) and 314
were removed from the models (Appendix, Table A3). The remaining seven explanatory 315
variables were kept for model selection using the second-order Akaike Information Criterion 316
(AICc). 317
Reduced models with all possible combinations of the seven explanatory variables and 318
their respective AICc values were generated with the dredge function from the MuMIn package 319
(Barton 2014). Reduced models were ranked according to AICc differences (delta) and Akaike 320
weights. Models with higher Akaike weights may be interpreted as being more probable given 321
Page 14 of 55
https://mc06.manuscriptcentral.com/cjfas-pubs
Canadian Journal of Fisheries and Aquatic Sciences

Draft
15
the data (Burnham and Anderson 2002). We also estimated the relative importance of each 322
explanatory variable by summing Akaike weights (SW) of all models in which a given predictor 323
was included (Burnham and Anderson 2002). The validity of using SW to quantify the relative 324
importance of explanatory variables in models has been recently demonstrated (Giam & Olden 325
2015). By using SW, even if a variable was not included in the best models it can be detected as 326
important if it appeared several times in the other models. Furthermore, coefficients of the 327
explanatory variables were standardized (beta argument in the dredge function) to make them 328
comparable (MuMIn package; Barton 2014). Only models with delta AICc values less than two 329
were retained. Subsequently, we included interaction terms between the most important 330
variables (based on their Akaike weights). For example, channel slope could interact with 331
habitat change to drive fish assemblage turnover. 332
333
Ordination and overall species variation 334
To best interpret the turnover of fish assemblages, we performed a Principal Coordinate 335
Analysis (PCoA) with Sorensen (species occurrence) and Bray–Curtis (species abundance) 336
dissimilarities using the package vegan (Oksanen et al. 2013). Species spatial position in the 337
ordinations was proportional to their correlation with PCoA axes. We performed PCoA with 338
1999 and 2012 assemblage composition data. 339
We calculated the overall relative frequency of occurrence in the sample sites (fr%) and 340
the relative abundance of individuals (ab%) as mean values for each species caught in 1999 and 341
2012. Overall differences in fr% and ab% between years were calculated as the absolute 342
differences in these values for each species. 343
344
Page 15 of 55
https://mc06.manuscriptcentral.com/cjfas-pubs
Canadian Journal of Fisheries and Aquatic Sciences

Draft
16
Individual species models 345
In order to assess whether fish species differed in their response to environmental 346
variables regarding turnover from 1999 to 2012, we fitted individual models for each species. 347
These models were performed for each one of the species that occurred at least in 10 sampling 348
sites in 1999 or 2012 samples (9 out of the 14 studied species), using as explanatory variables 349
only the most important variables according to SW in the overall model selection performed for 350
assemblage turnover (see details in the sub-section above “Assemblage turnover and model 351
selection”). The response variable in each species model was the difference in species 352
abundance regarding an expected relationship, which indicated how much a species changed 353
from 1999 to 2012. This was performed by fitting a linear model between 1999 and 2012 354
abundances for each species and using its residuals as response variables, i.e. how much the 355
species abundance differed from expected for all sites. 356
357
Correlation between habitat variables and assemblage turnover 358
Posterior to model selection, we carried out an exploratory analysis to find out which 359
instream habitat variables used to quantify habitat change were the most important variables 360
contributing to explain the relationship between habitat change and assemblage turnover. We 361
generated all possible combinations of the 13 instream habitat variables (from one to 13 362
variables) to calculate site-level habitat change (Euclidean distance). Subsequently, we tested the 363
Pearson’s correlation between habitat dissimilarities, calculated with different combinations of 364
habitat variables with assemblage turnover, in order to find those combinations of variables that 365
maximized the correlation between habitat change and assemblage turnover. 366
367
Page 16 of 55
https://mc06.manuscriptcentral.com/cjfas-pubs
Canadian Journal of Fisheries and Aquatic Sciences

Draft
17
Results 368
Instream habitat and assemblage composition 369
Sampling sites changed from 1999 and 2012 regarding instream habitat characteristics 370
(Table 1). Significant differences between years were observed in the coefficient of variation of 371
depth, in the substrate diversity and in most of the categories of substrate size. Depth and was 372
higher in 1999 samples, while stream width and cover percentage of larger categories of 373
substrate size increased in 2012 (Table 1). 374
Fourteen species of riffle-dwelling fishes were sampled at the 22 sites in the Maquiné 375
river basin. Mean species richness per site including 1999 and 2012 data was 8.5, ranging from 376
5 to 11 species. One species (Hemiancistrus punctulatus) was sampled only in 1999, but no 377
species occurred exclusively in 2012. Siluriformes was the richest order, with 11 species, 378
followed by Characiformes and Cyprinodontiformes, with two and one species respectively. 379
The most frequent and abundant species caught for both 1999 and 2012 samples were 380
Rineloricaria aequalicuspis, Pareiorhaphis nudulus, Pareiorhaphis hypselurus, Epactionotus 381
bilineatus and Characidium pterostictum (Table 2). Overall, species that most varied in 382
frequency of occurrence from 1999 to 2012 were Ancistrus multispinis, Diapoma itaimbe and P. 383
nudulus; whereas the species that most varied in their relative abundance from 1999 to 2012 384
were E. bilineatus, D. itaimbe, R. aequalicuspis and C. pterostictum (Table 2). All sampled 385
species are resident and thus turnover of the studied assemblages was not influenced by 386
diadromous species. 387
388
Turnover of fish assemblages 389
Page 17 of 55
https://mc06.manuscriptcentral.com/cjfas-pubs
Canadian Journal of Fisheries and Aquatic Sciences

Draft
18
We found that habitat change, i.e., local habitat dissimilarity between years, was the 390
single important variable in the models explaining turnover in species occurrence (R2 = 0.23; 391
standardized coefficient = 0.47; Tables 3 and 4). Habitat modifications over time increased 392
turnover of species occurrence, indicating that streams that presented more changes in local 393
environmental characteristics also showed more variation in fish species composition (Figs 2 394
and 3). Interaction terms of explanatory variables were not important to explain assemblage 395
turnover (Table 4). 396
Nine best models (delta AICc < 2) were selected to explain temporal turnover of 397
assemblage based on species abundance and they included different combinations of seven 398
explanatory variables (Table 3). Four of these seven variables were the most important to 399
explain turnover of species abundance, since they had relative importance values greater than 400
0.5 and the greatest standardized coefficients (Table 4). These variables were habitat change, 401
slope between confluences, downstream link magnitude and catchment area (Figs 4 and 5). 402
Thus, turnover in species abundance differed from turnover in species occurrence because in 403
addition to local habitat change, turnover in assemblages using species abundance was also 404
influenced by channel slope, downstream link magnitude and catchment area (Table 4). 405
Turnover of species abundance was negatively related to channel slope and downstream link 406
magnitude and positively related to catchment area and local habitat change (Table 4). 407
Differences were observed in the individual response of species to the four most 408
important variables selected to overall assemblage turnover in abundance, namely: habitat 409
change, slope between confluences, downstream link magnitude and catchment area (Table 5). 410
Models generated separately for each species showed some species changed more from 1999 to 411
2012 due to the influence of habitat change (E. bilinelatus), downstream link magnitude (R. 412
Page 18 of 55
https://mc06.manuscriptcentral.com/cjfas-pubs
Canadian Journal of Fisheries and Aquatic Sciences

Draft
19
aequalicuspis, P. nudulus and E. bilinelatus), slope between confluences (P. nudulus) or 413
catchment area (D. itaimbe) (Table 5). 414
Instream habitat variables that most contributed to maximize the correlation between 415
habitat change and assemblage turnover were the combination of coefficient of variation of 416
depth and mean bankfull width for turnover in species occurrence (r = 0.74; Appendix, Table 417
A4); and the combination of mean depth and cover percentage of substrate size class 25 to 50 418
cm for turnover in species abundance (r = 0.52; Appendix, Table A5). 419
420
Discussion 421
The hypothesis that high habitat change would lead to high turnover of communities was 422
supported. Turnover in species occurrence of riffle-dwelling fish assemblages in the 13-years 423
interval was explained only by temporal changes of habitat characteristics, with higher turnover 424
occurring at sites where physical habitat structure changed more. As well as species occurrence, 425
turnover in species abundance was explained by habitat change. Additionally, turnover in 426
species abundance was also explained by other factors that do not change with time in the 427
studied temporal scale, such as channel slope, downstream link magnitude (a proxy for 428
connectivity), and catchment area. Differences between 1999 and 2012 in channel size, depth 429
and substrate composition were the most important habitat changes explaining turnover in fish 430
assemblages. Processes of erosion and deposition, affected by regular flow and also by episodic 431
severe disturbances such as flash floods, may cause channel reconfiguration by moving substrate 432
and altering local habitat structure. Habitat change over the years may thus affect the set of 433
species capable of inhabiting the new prevailing conditions or resources, affecting population 434
Page 19 of 55
https://mc06.manuscriptcentral.com/cjfas-pubs
Canadian Journal of Fisheries and Aquatic Sciences
Draft
20
abundance and species occurrence; a view consistent with species sorting of metacommunities 435
(Leibold et al. 2004). 436
The reduced turnover of species abundance found in high-gradient sites is opposite to 437
what we expected from our second hypothesis, which predicted that steep channels should lead 438
to high temporal turnover due to severe stochastic flood events. Steeper channels tend to have 439
higher flow energy and rapid response to rainfall, which will produce short and intense spates 440
(Gordon et al. 2004; Nippgen et al. 2011). The implications for stream biota are high flow 441
variability and harsh hydrological conditions (Resh et al. 1988), which may increase temporal 442
variation in abundance of stream fishes (Ross et al. 1985). Moreover, flow variability has been 443
demonstrated to be positively associated with extinction rates and negatively associated with 444
immigration rates of stream fishes (Taylor and Warren 2001). Thus, it would be plausible to 445
expect that stream segments with steep channels should show high assemblage changes. Despite 446
this predicted positive relation between assemblage turnover and stream slope (as a proxy for 447
habitat harshness), previous studies in aquatic ecosystems suggested that harsh environmental 448
conditions may instead reduce community turnover (Chase 2007; 2010). For example, Chase 449
(2007) found that communities in experimental ponds that experienced drought had much lower 450
dissimilarity to each other than permanent ponds. Moreover, Chase (2010) found that 451
community dissimilarity of producers and animals was much lower in ponds that experienced 452
low productivity than ponds with medium or high productivities. Chase argues that niche 453
selection may be the mechanism whereby species that could not tolerate such harsh 454
environmental conditions were filtered out from the regional pool (Chase 2007; 2010). In 455
contrast, in less restrictive environmental conditions, communities would be open to a large pool 456
of colonists and thus would vary in species occurrence and abundance (Chase 2007; 2010). 457
Page 20 of 55
https://mc06.manuscriptcentral.com/cjfas-pubs
Canadian Journal of Fisheries and Aquatic Sciences

Draft
21
Indeed, the dominant species we sampled at sites with steep channels, such as the suckermouth 458
armored catfishes Pareiorhaphis nudulus and P. hypselusus, are able to resist or avoid extremely 459
high flows by seeking refuge among larger rocks and crevices at the stream bottom. 460
Accordingly, we suggest that the negative relation between channel slope and turnover of 461
species abundance was due to species sorting (Leibold et al. 2004), in which a restricted pool of 462
species is able to maintain constant populations in hydrologically harsher (steeper slopes) 463
environments. We highlight, however, that we measured slope in three different ways, but 464
relationship with abundance turnover was important only when using slope between 465
confluences, a large scale measure. Thus, the way that slope is measured may affect the 466
detection of influence on assemblage turnover. Also we did not evaluate faunal composition 467
immediately after hydrological disturbances, such as floods and droughts. Therefore, our results 468
are valid for a time span of a decade and should not be extended to short periods in which 469
assemblage turnover may be affected by episodic disturbance events (Rahel 1990). 470
We found that stream segments flowing directly into larger streams (i.e., sites with high 471
downstream link magnitude) showed reduced temporal turnover in species abundance. As 472
previously demonstrated by Osborne and Wiley (1992), downstream link magnitude was a 473
useful proxy for size of downstream connection and connectivity within drainage network. This 474
finding corroborates our third hypothesis, that proximity to larger streams should lead to low 475
temporal turnover of riffle-dwelling fish assemblages, and also other studies reporting that 476
communities living in stream segments close to confluences with main channels are more 477
influenced by the pool of downstream immigrants (Osborne and Wiley 1992; Grenouillet et al. 478
2004; Thornbrugh and Gido 2010; Hitt and Angermeier 2011). The importance of spatial 479
distance for dispersal limitation has been well demonstrated for stream ecosystems, even for 480
Page 21 of 55
https://mc06.manuscriptcentral.com/cjfas-pubs
Canadian Journal of Fisheries and Aquatic Sciences

Draft
22
highly mobile organisms (e.g., Thompson and Townsend 2006). The influx of immigrants from 481
downstream pools tends to be lower at isolated and peripheral sites within the drainage network 482
(Ai et al. 2013; Miyazono and Taylor 2013). As a consequence, colonization is expected to 483
decrease and extinction to increase at peripheral segments (Gotelli and Taylor 1999). However, 484
our findings indicate that the effects of the potential increase in the influx of immigrants in more 485
centrally located sites, measured as downstream stream size, was important to population 486
abundance, but not for species occurrence. This is consistent with the experimental study of 487
Altermatt et al. (2011), which demonstrated that local population densities of protozoa and 488
rotifers had an increased rate of post-disturbance recovery in connected patches compared with 489
isolated patches. In this sense, our results indicate that tributaries centrally located in the stream 490
network (i.e. higher connectivity), and which are directly connected to the mainstem, had 491
relatively stable abundance of riffle species over time, whereas occurrence of species was 492
mostly determined by habitat change. 493
We observed that sites with large upstream catchment area presented high turnover in 494
species abundance. We had no a priori expectation regarding the effects of catchment size on 495
the turnover of stream fish assemblages. However, we included catchment size in the models 496
because it is expected to be partially correlated with variables we hypothesized to affect 497
assemblage turnover (Appendix, Table A3). For instance, although small streams may flow into 498
either small or large streams, large streams necessarily flow into large streams. Nonetheless, the 499
finding that sites with larger upstream catchment area had higher turnover are not entirely 500
surprising, given that previous studies have observed a positive relationship between stream size 501
and immigration rates (e.g. Taylor and Warren 2001; Miyazono and Taylor 2013). The 502
relationship between square root of catchment area and mean discharge has been well-known to 503
Page 22 of 55
https://mc06.manuscriptcentral.com/cjfas-pubs
Canadian Journal of Fisheries and Aquatic Sciences

Draft
23
hydrologists for decades (Leopold and Maddock 1953), and ecologists have recently used it as 504
an indicator of stream size and volume (Gordon et al. 2004, Hughes et al. 2011). We thus 505
suggest that large streams may function as corridors along which a temporally variable set of 506
dispersing individuals from different species are constantly tracking suitable habitats. Large 507
streams are not only more centrally located in the drainage network, but may present larger 508
species pool and populations (habitat capacity), providing immigrants for restructuring local 509
communities. Thus, the observed positive relationship between assemblage turnover and 510
catchment area may not only reflect the influence of habitat size by itself, but the combined 511
effects of stream size and dendritic connectivity of drainage networks (Carrara et al. 2014). 512
Our study was limited to riffle-specialist species; thus pool-specialists were not 513
considered, as well as transient species that use the interface between riffle and pool habitats, 514
most of which are nektonic species. One important implication is that the benthic riffle-specialist 515
species sampled in our study (mostly loricariids) are commonly sedentary and/or short distance 516
swimmers (Casatti and Castro 2006), a characteristic that may affect the immigration rates and 517
thus the temporal turnover of fish assemblages. For example, Hitt and Angermeier (2008, 2011) 518
observed that the most important factor influencing differences in fish species composition of 519
centrally located tributaries (compared to isolated tributaries in the network periphery) was the 520
influx of cyprinids with high dispersal ability from mainstem segments. Therefore, riverine 521
species with high dispersal abilities may exert stronger influence on assemblages of tributaries 522
near to mainstem river confluences through mass effects (Hitt and Angermeier 2011). Although 523
our study focused on benthic riffle species, we found lower turnover in assemblages at stream 524
sites connected to larger confluences. The studied basin is a small drainage (550 km2) in a 525
mountainous region with large proportion of riffle habitats in tributaries and mainstem. Thus, 526
Page 23 of 55
https://mc06.manuscriptcentral.com/cjfas-pubs
Canadian Journal of Fisheries and Aquatic Sciences

Draft
24
mainstem segments can act as potential sources of immigrants for riffle communities inhabiting 527
adjacent tributaries. Also, mainstem segments are centrally located and can act as corridors 528
connecting their flowing tributaries (Altermatt 2013). Distant peripheral stream segments, on the 529
other hand, are more spatially isolated and more difficult to reach by dispersing individuals, 530
which could influence local population dynamics (e.g. after a catastrophic event causing 531
extinction of a local population). Hence, our study indicates that even benthic (and perhaps low-532
dispersing) riffle communities of tributaries near to mainstem may be more easily and frequently 533
accessed by dispersing individuals of different species than isolated and peripheral riffle 534
communities. 535
Differences in species responses to habitat change, stream channel slope, connectivity 536
(dlink) and catchment area indicate that populations are differently affected by niche- and 537
dispersal-related processes. For instance, connectivity may be more important to occurrence of 538
some species for which local habitat characteristics are not very suitable. In this case, species 539
with high dispersal abilities may have an advantage to maintain their presence in unsuitable but 540
connected sites via immigration. Therefore, fluctuations in population abundance in mainstem or 541
tributaries will influence species occurrence in other connected tributaries. However, our results 542
indicate that this influence will be conditioned by how connected or how close a tributary is to a 543
larger connection within a drainage network. 544
A caveat of our study is that it was limited to two sampling events with 13-years interval 545
and does not account for seasonal and annual variation in species occurrence and abundance, 546
and in physical habitat. Consequently, we were not able to assess multiple temporal replicates 547
which would allow documenting the direction of assemblage changes (e.g. Matthews et al. 548
2013). Nevertheless, by using a long-term interval we were able to study a temporally 549
Page 24 of 55
https://mc06.manuscriptcentral.com/cjfas-pubs
Canadian Journal of Fisheries and Aquatic Sciences

Draft
25
independent replicate (i.e. turnover of all individuals). A second issue is that a relevant 550
proportion of the total variation in assemblage turnover was not explained by the variables used 551
in our models. Additional likely important sources of variation are intra-annual variation in 552
species occurrence (movement patterns), inter-annual oscillation in population abundance due to 553
suitable breeding events, stochastic environmental variation, and also sampling error. Also, 554
habitat change was based only on physically-based variables, e.g. substrate composition and 555
channel size, so we did not consider other potentially important factors to assemblage turnover, 556
such as water chemistry and streambed stability. Although not taking into account all these other 557
potential sources of variation, our models explained a relevant amount of variation in species 558
occurrence (r2 = 0.23) and abundance (r
2 = 0.39 to 0.53). 559
We found that the dynamic of stream fish communities was affected by multiple factors, 560
including environmental filters (slope and habitat change) and the potential for communities to 561
receive dispersing individuals (connection to larger streams). As these factors can be expected to 562
vary throughout the stream network, our study shows the spatial position within dendritic 563
network can affect metacommunity processes that drive turnover in stream fish assemblages. In 564
addition, our study indicates that species differ in their response to metacommunity processes, 565
such as habitat filtering and dispersal limitation (connectivity). These results have implications 566
for sampling design in monitoring programs, since the degree of temporal dissimilarities in fish 567
assemblages depends not only on local habitat change, but on spatial position of the sampled 568
reaches within the drainage network and species particularities. Sampling design should then 569
incorporate spatial position (e.g. downstream link) and take into account different species 570
responses. 571
572
Page 25 of 55
https://mc06.manuscriptcentral.com/cjfas-pubs
Canadian Journal of Fisheries and Aquatic Sciences

Draft
26
Acknowledgements 573
The authors thank to Mateus Camana and Taís Guimarães for helping to generate the 574
digital elevation model and layout of the study area, and Fabiana Schneck, Leandro Duarte and 575
Luciane Crossetti for comments on a previous version of the manuscript. The authors also are 576
very grateful to the people who helped us to obtain the fish samples: Júlia Moschetta, Carina 577
Vogel, Mateus Camana, Federico Domecq, Bruna Meneses, Juliano Ferrer, Karine Bonato and 578
Laís Mozzaquattro. RBDC received a scholarship from the Coordenação de Aperfeiçoamento de 579
Pessoal de Nível Superior (CAPES) and ASM a research fellowship from the Conselho 580
Nacional de Desenvolvimento Científico e Tecnológico (CNPq proc. 307479/2011-0). FGB 581
received a student scholarship from CNPq and financial support from WWF (Programa 582
Natureza e Sociedade) for sampling done in 1999. Fish collection of 1999 was authorized by the 583
Instituto Brasileiro do Meio Ambiente e dos Recursos Naturais Renováveis - IBAMA (sampling 584
permit #040/99) and fish sampling of 2012 was authorized by Instituto Chico Mendes de 585
Conservação da Biodiversidade - ICMBio (sampling permit SISBIO #10650). 586
587
References 588
Ai, D., Gravel, D., Chu, C., and Wang, G. 2013. Spatial structures of the environment and of 589
dispersal impact species distribution in competitive metacommunities. PLoS One 8(7): 590
e68927. 591
Altermatt, F. 2013. Diversity in riverine metacommunities: a network perspective. Aquat. Ecol. 592
47(3): 365–377. 593
Page 26 of 55
https://mc06.manuscriptcentral.com/cjfas-pubs
Canadian Journal of Fisheries and Aquatic Sciences

Draft
27
Altermatt, F., Bieger, A., Carrara, F., Rinaldo, A., and Holyoak, M. 2011. Effects of 594
connectivity and recurrent local disturbances on community structure and population 595
density in experimental metacommunities. PLoS One 6(4):e19525. 596
Altermatt, F., Seymour, M., and Martinez, N. 2013. River network properties shape α-diversity 597
and community similarity patterns of aquatic insect communities across major drainage 598
basins. J. Biogeogr. 40(12): 2249–2260. 599
Barton, K. 2014. MuMIn: Multi-model inference. R package version 1.10.0. Available from 600
http://CRAN.R-project.org/package=MuMIn [accessed 13 July 2015]. 601
Becker, F.G. 2002. Distribuição e abundância de peixes de corredeiras e suas relações com 602
características de habitat local, bacia de drenagem e posição espacial em riachos de Mata 603
Atlântica (bacia do rio Maquiné, RS, Brasil). PhD Dissertation, Programa de Pós-604
Graduação em Ecologia e Recursos Naturais, Universidade Federal de São Carlos, São 605
Paulo, Brazil. 606
Becker, F.G., Carvalho, S., and Hartz, S.M. 2008. Life-history of the South American darter, 607
Characidium pterostictum (Crenuchidae): evidence for small scale spatial variation in a 608
piedmont stream. Neotrop. Ichthyol. 6(4): 591–598. 609
Benda, L., Poff, N.L., Miller, D., Dunne, T., Reeves, G., Pess, G., and Pollock, M. 2004. The 610
network dynamics hypothesis: how channel networks structure riverine habitats. 611
BioScience 54(5): 413–427. 612
Bivand, R., and Lewin-Koh, N. 2014. maptools: Tools for reading and handling spatial objects. 613
R package version 0.8-30.Available from http://CRAN.R-project.org/package=maptools 614
[accessed 13 July 2015]. 615
Page 27 of 55
https://mc06.manuscriptcentral.com/cjfas-pubs
Canadian Journal of Fisheries and Aquatic Sciences

Draft
28
Burnham, K.P., and Anderson, D.R. 2002. Model selection and multi model inference: a 616
practical information-theoretic approach. Springer, N.Y. 617
Campbell-Grant, E.H., Lowe, W.H., and Fagan, W.F. 2007. Living in the branches: population 618
dynamics and ecological processes in dendritic networks. Ecol. Lett. 10(2): 165–175. 619
Carrara, F., Rinaldo, A., Giometto, A., and Altermatt, F. 2014. Complex interaction of dendritic 620
connectivity and hierarchical patch size on biodiversity in river-like landscapes. Am. 621
Nat. 183(1): 13–25. 622
Casatti, L., and Castro, R. 2006. Testing the ecomorphological hypothesis in a headwater riffles 623
fish assemblage of the rio São Francisco, southeastern Brazil. Neotrop. Ichthyol. 4(2): 624
203–214. 625
Champeau, T.R., Stevens, P.W., and Blewett, D.A. 2009. Comparison of fish community 626
metrics to assess long-term changes and hurricane impacts at Peace River, Florida. Florida 627
Scient. 72(4): 289–309. 628
Chase, J.M. 2007. Drought mediates the importance of stochastic community assembly. PNAS 629
104(44): 17430–17434. 630
Chase, J.M. 2010. Stochastic community assembly causes higher biodiversity in more 631
productive environments. Science 328(5984): 1388–1391. 632
Csardi, G., and Nepusz, T. 2006. The igraph software package for complex network research. 633
InterJournal Complex Systems 1695 (5): 1–9. 634
Dei Tos, C., Gomes, L.C., Ambrósio, A.M., and Goulart, E. 2010. An overview of freshwater 635
fish aging in South America: the science, biases and future directions. Acta Sci., Biol. Sci. 636
32(4): 323–333. 637
Page 28 of 55
https://mc06.manuscriptcentral.com/cjfas-pubs
Canadian Journal of Fisheries and Aquatic Sciences

Draft
29
Driscoll, D.A., and Lindenmayer, D.B. 2009. Empirical tests of metacommunity theory using an 638
isolation gradient. Ecol. Monogr. 79(3): 485–501. 639
Fagan, W.F. 2002, Connectivity, fragmentation, and extinction risk in dendritic 640
metapopulations. Ecology 83(12): 3243–3249. 641
Fausch, K.D., Torgersen, C.E., Baxter, C.V., and Li, H.W. 2002. Landscapes to riverscapes: 642
bridging the gap between research and conservation of stream fishes. BioScience 52(6): 643
483–498. 644
Fisher, W.L. 1987. Benthic fish sampler for use in riffle habitats. T. Am. Fish. Soc. 116(5): 768–645
772. 646
Fox, J., and Monette, G. 1992. Generalized collinearity diagnostics. J. Am. Stat. Assoc. 87(417): 647
178–183. 648
Giam, X., and Olden, J. D. 2015. Quantifying variable importance in a multimodel inference 649
framework. Methods Ecol. Evol. In press. doi:10.1111/2041-210X.12492. 650
Gordon, N.D., McMahon, T.A., Finlayson, B.L., Gippel, C.J., and Nathan, R.J. 2004. Stream 651
Hydrology: An Introduction for Ecologists. John Wiley and Sons, U.K. 652
Gotelli, N.J., and Taylor, C.M. 1999. Testing metapopulation models with stream-fish 653
assemblages. Evol. Ecol. Res. 1: 835–845. 654
Grenouillet, G., Pont, D., and Hérissé, C. 2004. Within-basin fish assemblage structure: the 655
relative influence of habitat versus stream spatial position on local species richness. Can. 656
J. Fish. Aquat. Sci. 61(1): 93–103. 657
Grossman, G.D., Dowd, J.F., and Crawford, M. 1990. Assemblage stability in stream fishes: a 658
review. Environ. Manage. 14(5): 661–671. 659
Page 29 of 55
https://mc06.manuscriptcentral.com/cjfas-pubs
Canadian Journal of Fisheries and Aquatic Sciences

Draft
30
Grossman, G.D., Ratajczak, R.E., Crawford, M., and Freeman M.C. 1998. Assemblage 660
organization in stream fishes: effects of environmental variation and interspecific 661
interactions. Ecol. Monogr. 68(3): 395–420. 662
Hasenack, H., and L.W. Ferraro. 1989. Considerações sobre o clima da região de Tramandaí, 663
RS. Pesquisas em Geociências 22: 53–70. 664
Hasenack, H., and E. Weber. 2010. Base cartográfica vetorial contínua do Rio Grande do Sul - 665
escala 1:50.000. UFRGS, Instituto de Biociências, Centro de Ecologia, Porto Alegre, 666
Brazil. Available from 667
http://www.ecologia.ufrgs.br/labgeo/index.php?option=com_content&view=article&id=12668
3:base50krs&catid=14:download-non-visible [accessed 13 July 2015]. 669
Heino, J. 2013. The importance of metacommunity ecology for environmental assessment 670
research in the freshwater realm. Biol. Rev. 88(1): 166–178. 671
Heino, J., Melo, A.S., Siqueira, T., Soininen, J., Valanko, S., and Bini, L. M. 2015. 672
Metacommunity organisation, spatial extent and dispersal in aquatic systems: patterns, 673
processes and prospects. Freshwater Biol. 60(5): 845–869. 674
Hitt, N. P., and Angermeier, P. L. 2011. Fish community and bioassessment responses to stream 675
network position. . J. North Am. Benthol. Soc. 30(1): 296–309. 676
Hitt, N.P., and Angermeier, P.L. 2008. Evidence for fish dispersal from spatial analysis of 677
stream network topology. J. North Am. Benthol. Soc. 27(2): 304–320. 678
Hughes, R.M., Kaufmann, P.R., and Weber, M.H. 2011. National and regional comparisons 679
between Strahler order and stream size. J. North Am. Benthol. Soc. 30(1): 103–121. 680
Lake, P.S. 2000. Disturbance, patchiness, and diversity in streams. J. North Am. Benthol. Soc. 681
19(4): 573–592. 682
Page 30 of 55
https://mc06.manuscriptcentral.com/cjfas-pubs
Canadian Journal of Fisheries and Aquatic Sciences

Draft
31
Leibold, M.A., Holyoak, M., Mouquet, N., Amarasekare, P., Chase, J.M., Hoopes, M.F., Holt, 683
R.D., Shurin, J.B., Law, R., Tilman, D., Loreau, M., and Gonzalez, A. 2004. The 684
metacommunity concept: a framework for multi-scale community ecology. Ecol. Lett. 685
7(7): 601–613. 686
Leopold, L.B., and Maddock Jr, T. 1953. The hydraulic geometry of stream channels and some 687
physiographic implications. Geol. Surv. Prof. Paper 252: 1–57. 688
Lu, B. 2014. shp2graph: Convert a spatial lines data frame object to a "igraph-class" object. R 689
package version 0-2.Available from http://CRAN.R-project.org/package=shp2graph 690
[accessed 13 July 2015]. 691
Magurran, A.E., Baillie, S.R., Buckland, S.T., Dick, J.M., Elston, D.A., Scott, E.M., Smith, R.I., 692
Somerfield, P.J., and Watt, A.D. 2010. Long-term datasets in biodiversity research and 693
monitoring: assessing change in ecological communities through time. Trends Ecol. Evol. 694
25(10): 574–582. 695
Malabarba, L.R., Carvalho Neto, P., Bertaco, V.A., Carvalho, T. P., dos Santos, J. F., and 696
Artioli, L.G.S. 2013. Guia de identificação dos peixes da bacia do rio Tramandaí. Via 697
Sapiens, Porto Alegre, Brazil. 698
Matthews, W., and Marsh‐Matthews, E. 2006. Temporal changes in replicated experimental 699
stream fish assemblages: predictable or not? Freshwater Biol. 51(9): 1605–1622. 700
Matthews, W.J., Cashner, R.C., and Gelwick, F.P. 1988. Stability and persistence of fish faunas 701
and assemblages in three Midwestern streams. Copeia 1988(4): 945–955. 702
Matthews, W.J., Marsh-Matthews, E., Cashner, R.C., and Gelwick, F. 2013. Disturbance and 703
trajectory of change in a stream fish community over four decades. Oecologia 173(3): 704
955–969. 705
Page 31 of 55
https://mc06.manuscriptcentral.com/cjfas-pubs
Canadian Journal of Fisheries and Aquatic Sciences

Draft
32
Miyazono, S., and Taylor, C.M. 2013. Effects of habitat size and isolation on species 706
immigration-extinction dynamics and community nestedness in a desert river system. 707
Freshwater Biol. 58(7): 1303–1312. 708
Montgomery, D.R. 1999. Process domains and the river continuum. J. Am. Water Resour. 709
Assoc. 35(2): 397–410. 710
Moreno, J.A. 1961. Clima do Rio Grande do Sul. Secretaria da Agricultura do Estado do Rio 711
Grande do Sul, Porto Alegre, Brazil. 712
Myers, J.A., Chase, J.M., Jiménez, I., Jørgensen, P. M., Araujo‐Murakami, A., 713
Paniagua‐Zambrana, N., and Seidel, R. 2013. Beta‐diversity in temperate and tropical 714
forests reflects dissimilar mechanisms of community assembly. Ecol. Lett. 16(2): 151–715
157. 716
Mykrä, H., Heino, J., Oksanen, J., and Muotka, T. 2011. The stability-diversity relationship in 717
stream macroinvertebrates: influences of sampling effects and habitat complexity. 718
Freshwater Biol. 56(6): 1122–1132. 719
Newman, M. 2010. Networks: an introduction. Oxford University Press. 720
Nippgen, F., McGlynn, B.L., Marshall, L.A., and Emanuel, R.E. 2011. Landscape structure and 721
climate influences on hydrologic response. Water Resour. Res. 47 (12): W12528. 722
Oksanen, J., Blanchet, F.G., Kindt, R., Legendre, P., Minchin, P.R., O'Hara, R.B., Simpson, 723
G.L., Solymos, P., Stevens, M.H.H., and Wagner, H. 2013. vegan: Community Ecology 724
Package. R package version 2.0-8. Available from: http://CRAN.R-725
project.org/package=vegan [accessed 13 July 2015]. 726
Osborne, L.L., and Wiley, M.J. 1992. Influence of tributary spatial position on the structure of 727
warm water fish communities. Can. J. Fish. Aquat. Sci. 49(4): 671–681. 728
Page 32 of 55
https://mc06.manuscriptcentral.com/cjfas-pubs
Canadian Journal of Fisheries and Aquatic Sciences

Draft
33
Perkin, J. S., and Gido, K. B. 2012. Fragmentation alters stream fish community structure in 729
dendritic ecological networks. Ecol. Appl. 22(8): 2176–2187. 730
Poff, N.L., and Ward, J.V. 1989. Implications of stream flow variability and predictability for 731
lotic community structure: a regional analysis of stream flow patterns. Can. J. Fish. Aquat. 732
Sci. 46(10): 1805–1818. 733
R Development Core Team. 2015. R: A Language and Environment for Statistical Computing 734
[online]. R Foundation for Statistical Computing, Vienna, Austria. Available from 735
http://www.r-project.org/ [accessed 13 July 2015]. 736
Rahel, F.J. 1990. The hierarchical nature of community persistence: a problem of scale. Am. 737
Nat. 136(3): 328–344. 738
Resh, V.H., Brown, A.V., Covich, A.P., Gurtz, M.E., Li, H.W., Minshall, G.W., Reice, S.R., 739
Sheldon, A.L., Wallace, J.B., and Wissmar, R.C. 1988. The role of disturbance in stream 740
ecology. J. North Am. Benthol. Soc. 7(4): 433–455. 741
Rice, S.P., Greenwood, M.T., and Joyce, C.B. 2001. Tributaries, sediment sources, and the 742
longitudinal organisation of macroinvertebrate fauna along river systems. Can. J. Fish. 743
Aquat. Sci. 58(4): 824–840. 744
Rosgen, D.L. 1994. A classification of natural rivers. Catena 22(3): 169–199. 745
Ross, S.T., Matthews W.J., and Echelle, A.A. 1985. Persistence of stream fish assemblages: 746
effects of environmental change. Am. Nat. 126(1): 24–40. 747
Schmidt, M.H., Thies, C., Nentwig, W., and Tscharntke, T. 2008. Contrasting responses of 748
arable spiders to the landscape matrix at different spatial scales. J. Biogeogr. 35(1): 157–749
166. 750
Shreve, R.L. 1966. Statistical law of stream numbers. J. Geol. 74(1): 17–37. 751
Page 33 of 55
https://mc06.manuscriptcentral.com/cjfas-pubs
Canadian Journal of Fisheries and Aquatic Sciences

Draft
34
Strahler, A.N. 1957. Quantitative analysis of watershed geomorphology. Eos Trans. AGU, 752
38(6): 913–920. 753
Taylor, C.M. 1997. Fish species richness and incidence patterns in isolated and connected 754
stream pools: effects of pool volume and spatial position. Oecologia 110(4): 560–566. 755
Taylor, C.M., and Warren, M.L. 2001. Dynamics in species composition of stream fish 756
assemblages: environmental variability and nested subsets. Ecology 82(8): 2320–2330. 757
Thompson, R., and Townsend, C.R. 2006. A truce with neutral theory: local deterministic 758
factors, species traits and dispersal limitation together determine patterns of diversity in 759
stream invertebrates. J. Anim. Ecol. 75(2): 476–484. 760
Thornbrugh, D.J., and Gido, K.B. 2010. Influence of spatial positioning within stream networks 761
on fish assemblage structure in the Kansas River basin, USA. Can. J. Fish. Aquat. Sci. 762
67(1): 143–156. 763
Vogel, C. 2012. Estratégias de história de vida de peixes neotropicais em diferentes tipos de 764
habitat. Master thesis, Programa de Pós-Graduação em Ecologia, Universidade Federal do 765
Rio Grande do Sul, Rio Grande do Sul, Brazil. 766
767
Page 34 of 55
https://mc06.manuscriptcentral.com/cjfas-pubs
Canadian Journal of Fisheries and Aquatic Sciences

Draft
35
Table 1. Instream habitat variables used to quantify habitat change between 1999 and 2012 for 768
22 sampling sites in the Maquiné river basin, Southern Brazil. CV = coefficient of variation; SD 769
= standard deviation; p = probability of difference between years according to paired t-test. 770
Variables Abbreviation 1999 Mean
(SD)
2012 Mean
(SD) p
Mean wetted width MeanWettWid 8.6 (4.7) 9.1 (4.8) <0.001
CV wetted width CVWettW 22.0 (10.8) 24.5 (14.1) ns
Mean bankfull width MeanBankWid 11.9 (6.5) 14.7 (7.2) <0.001
CV bankfull width CVBankW 16.6 (6.2) 15.4 (13.7) ns
Ratio wetted/bankfull width RatioWB 70.5 (13.9) 62.8 (15.2) ns
Mean depth MeanDepth 20.5 (7.0) 23.9 (5.0) <0.001
CV depth CVDepth 41.1 (13.0) 31.9 (7.4) ns
%Substrate 2 cm Subs2cm 5.8 (3.99) 1.8 (4.7) 0.014
%Substrate 2-7 cm Subs2to7 13.5 (5.5) 10.5 (7.4) ns
%Substrate 7-25 cm Subs7to25 47.9 (10.9) 39.5 (11.9) 0.016
%Substrate 25-50 cm Subs25to50 26.3 (11.1) 34.2 (11.5) 0.044
%Substrate >50 cm Subs50cm 6.5 (6.2) 14.1 (12.3) 0.013
Shannon diversity substrate DiverSubs 0.9 (0.1) 0.8 (0.2) ns
ns = nonsignificant difference (p>0.05) 771
772
773
774
775
776
777
778
779
Page 35 of 55
https://mc06.manuscriptcentral.com/cjfas-pubs
Canadian Journal of Fisheries and Aquatic Sciences

Draft
36
Table 2. Variation in fish species sampled in 22 riffle habitats between 1999 and 2012 samples. 780
Abbrev = name abbreviations; fr% = mean relative frequency of occurrence; fr% diff = absolute 781
differences in relative frequency of occurrence between 1999 and 2012; ab% = mean relative 782
abundance; ab% diff = absolute difference in relative abundance between 1999 and 2012. 783
Species Abbrev 1999
(fr%)
2012
(fr%)
fr%
diff
1999
(ab%)
2012
(ab%)
ab%
diff
Rineloricaria aequalicuspis Rae 100 100 0 42.6 33.9 8.7
Pareiorhaphis nudulus Pnu 86.4 72.7 13.7 20.6 18.8 1.8
Pareiorhaphis hypselurus Phy 90.9 95.5 4.6 20.9 18.6 2.3
Epactionotus bilineatus Ebil 100 100 0 26.5 12.6 13.9
Characidium pterostictum Cpt 100 95.6 4.4 17.9 9.9 8
Diapoma itaimbe Dit 31.8 54.6 22.8 1.3 10.9 9.6
Jenynsia unitaenia Jun 63.6 63.6 0 2.5 2.8 0.3
Heptapterus sp. Hsp 72.7 77.3 4.6 1.8 3.3 1.5
Ancistrus multispinis Amu 68.2 40.9 27.3 2.6 0.6 2
Rineloricaria maquinensis Rma 9.1 13.6 4.5 0.4 0.4 0
Heptapterus mustelinus Hmu 22.7 13.6 9.1 0.6 0.3 0.3
Ituglanis boitata Ibo 0 9.1 9.1 0 0.3 0.3
Hemiancistrus punctulatus Hpu 4.6 0 4.6 0.1 0 0.1
Trichomycterus sp. Tsp 4.6 4.6 0 0.1 0.1 0
784
785
786
787
788
789
790
791
Page 36 of 55
https://mc06.manuscriptcentral.com/cjfas-pubs
Canadian Journal of Fisheries and Aquatic Sciences

Draft
37
Table 3. Best linear regression models for fish assemblage turnover selected using AICc 792
statistics (delta AICc < 2). Response variables were turnover of species occurrence (Sorensen 793
dissimilarity) and species abundance (Bray-Curtis dissimilarity) of riffle-dwelling fish 794
assemblage between years 1999 and 2012. Explanatory variables were channel slope, position in 795
the network, local habitat change and stream size. Variables representing channel slope, site 796
position within stream network, local habitat change and stream size are: slope between 797
confluences (slope.bc); downstream link magnitude (dlink); upstream catchment area (area); 798
habitat change (habitat); closeness centrality (centr.cl); slope 1 km upstream from the sampling 799
site (slope.1k) and local slope (slope.loc). AICc = Akaike information criterion; df = degrees of 800
freedom. Delta = AICc difference from the best model; Weight = Akaike weights; adj. R2 = 801
adjusted coefficient of determination. Only models with delta AICc < 2 are shown. 802
Response
variables Explanatory variables AICc df Delta Weight adj. R2
Occurrence habitat -41.6 3 0.0 0.34 0.23
Abundance slope.bc+dlink+habitat+area -64.1 6 0.0 0.14 0.51
slope.bc+habitat -64.0 4 0.1 0.14 0.39
slope.bc+dlink+area -63.9 5 0.2 0.13 0.44
slope.bc+dlink+centr.cl+area -63.7 6 0.4 0.12 0.50
slope.bc+dlink+habitat -63.5 5 0.7 0.10 0.43
slope.bc+habitat+slope.1k -63.2 5 0.9 0.09 0.42
slope.bc+habitat+area -63.0 5 1.1 0.08 0.42
dlink+slope.1k+area -62.7 5 1.4 0.07 0.41
slope.bc+dlink+habitat+centr.cl -62.6 6 1.5 0.07 0.47
slope.bc+dlink+habitat+centr.cl+area -62.2 7 1.9 0.06 0.53
803
804
805
Page 37 of 55
https://mc06.manuscriptcentral.com/cjfas-pubs
Canadian Journal of Fisheries and Aquatic Sciences

Draft
38
Table 4. Relative importance of explanatory variables based on summed Akaike weights (SW) 806
and their average standardized (beta) coefficients resulting from all combinations of AICc 807
models of assemblage turnover (see Table 3 for the best models). Slope between confluences 808
(slope.bc); downstream link magnitude (dlink); upstream catchment area (area); habitat change 809
(habitat); closeness centrality (centr.cl); slope 1 km upstream from the sampling site (slope.1k) 810
and local slope (slope.loc). Interaction between two explanatory variables is indicated with a 811
colon. 812
Response
variables
Explanatory
variables
Standardized
coefficients
Relative
importance
Species
occurrence habitat 0.47 0.78
slope.bc -0.12 0.26
area 0.12 0.25
dlink -0.06 0.20
slope.loc -0.17 0.20
slope.1k -0.04 0.17
centr.cl -0.01 0.16
slope.bc:habitat -0.28 0.04
area:habitat -0.35 0.03
dlink:habitat -0.15 0.02
area:slope.bc -0.47 0.03
slope.bc:dlink -0.42 0.02
area:dlink 0.26 <0.01
Species
abundance slope.bc -0.54 0.75
dlink -0.49 0.66
area 0.42 0.61
habitat 0.37 0.57
slope.loc -0.34 0.25
centr.cl 0.31 0.30
slope.1k -0.07 0.23
slope.bc:dlink -0.20 0.08
dlink:habitat 0.06 0.03
Page 38 of 55
https://mc06.manuscriptcentral.com/cjfas-pubs
Canadian Journal of Fisheries and Aquatic Sciences

Draft
39
slope.bc:habitat -0.04 0.06
area:habitat 0.03 0.03
area:slope.bc 0.13 0.05
area:dlink 0.09 0.05
Boldface highlights the most important variables (scores > 0.5). 813
814
815
Page 39 of 55
https://mc06.manuscriptcentral.com/cjfas-pubs
Canadian Journal of Fisheries and Aquatic Sciences

Draft
40
Table 5. Relative importance based on summed Akaike weights (SW) and average standardized 816
(beta) coefficients resulting from all combinations of AICc models of species abundance change. 817
Only the four most important variables explaining overall assemblage turnover (see Table 3) 818
were used for each species models. See Table 2 for species names abbreviations and Table 3 for 819
variable name abbreviations. 820
Species Explanatory
variable
Standardized
coefficients
Relative importance
(SW)
Rae dlink 0.50 0.83
area 0.31 0.40
habitat 0.20 0.27
slope.bc -0.08 0.19
Pnu slope.bc 0.60 0.93
dlink 0.32 0.46
area -0.30 0.39
habitat 0.13 0.20
Phy area -0.28 0.35
habitat -0.16 0.23
dlink -0.14 0.22
slope.bc 0.05 0.20
Ebi dlink 0.42 0.64
habitat 0.38 0.59
area 0.35 0.44
slope.bc 0.10 0.20
Cpt habitat -0.15 0.23
area 0.16 0.22
slope.bc -0.10 0.21
dlink 0.03 0.19
Dit area 0.66 0.98
habitat -0.17 0.25
slope.bc -0.18 0.25
dlink -0.05 0.18
Hsp habitat 0.27 0.35
dlink 0.23 0.30
area 0.09 0.20
slope.bc -0.10 0.20
Page 40 of 55
https://mc06.manuscriptcentral.com/cjfas-pubs
Canadian Journal of Fisheries and Aquatic Sciences

Draft
41
Jun habitat 0.25 0.32
area 0.26 0.32
dlink 0.19 0.25
slope.bc -0.14 0.22
Amu area -0.04 0.19
dlink 0.07 0.20
habitat -0.05 0.20
slope.bc -0.03 0.19
Boldface highlights the most important variables according to SW (values ≥ 0.45). 821
822
Page 41 of 55
https://mc06.manuscriptcentral.com/cjfas-pubs
Canadian Journal of Fisheries and Aquatic Sciences

Draft
42
FIGURE CAPTIONS 823
824
Fig. 1. Sampling site location in the Maquiné river basin, southern Brazil. The hydrographic line 825
thickness is proportional to stream size. Note the abrupt change in steep elevation within a short 826
distance from headwater to lower valleys. Sampling was restricted to lower valley sections (< 827
250 m of elevation). 828
829
Fig. 2. Principal coordinates analysis (PCoA) based on species occurrence dissimilarities 830
(Sorensen) showing turnover in fish assemblages from 1999 (circles) to 2012 (arrowhead). 831
Arrow length is proportional to assemblage turnover and circle size is proportional to habitat 832
change, which were the only important variables explaining assemblage turnover (AICc model 833
selection). See Table 2 for species name abbreviations. 834
835
Fig. 3. Long-term turnover in species occurrence of riffle-dwelling fish assemblages calculated 836
as pairwise Sorensen dissimilarity in relation to instream habitat change. Samples were obtained 837
in 1999 and 2012, in 22 sites at the Maquiné river watershed, South Brazil. 838
839
Fig. 4. Principal coordinates analysis (PCoA) based on species abundance dissimilarities (Bray-840
Curtis) showing turnover in fish assemblages from 1999 (circles) to 2012 (arrowhead). Arrow 841
length is proportional to assemblage turnover and circle size is proportional to the four most 842
important variables explaining assemblage turnover (AICc model selection). These variables 843
were (A) slope between confluences, (B) downstream link magnitude; (C) catchment area, and 844
(D) habitat change. See Table 2 for species name abbreviations. 845
Page 42 of 55
https://mc06.manuscriptcentral.com/cjfas-pubs
Canadian Journal of Fisheries and Aquatic Sciences

Draft
43
Fig. 5. Long-term turnover in species abundance of riffle-dwelling fish assemblages calculated 846
as pairwise Bray-Curtis dissimilarity in relation to the four most important variables, according 847
to multiple model selection. These variables were (A) slope between confluences, (B) 848
downstream link magnitude; (C) square root transformed catchment area, and (D) habitat 849
change. Samples were obtained in 1999 and 2012, in 22 sites at the Maquiné river watershed, 850
South Brazil. 851
852
853
Page 43 of 55
https://mc06.manuscriptcentral.com/cjfas-pubs
Canadian Journal of Fisheries and Aquatic Sciences

Draft
Fig. 1. Sampling site location in the Maquiné river basin, southern Brazil. The hydrographic line thickness is proportional to stream size. Note the abrupt change in steep elevation within a short distance from headwater to lower valleys. Sampling was restricted to lower valley sections (< 250 m of elevation).
Fig. 1 269x210mm (300 x 300 DPI)
Page 44 of 55
https://mc06.manuscriptcentral.com/cjfas-pubs
Canadian Journal of Fisheries and Aquatic Sciences

Draft
Fig. 2. Principal coordinates analysis (PCoA) based on species occurrence dissimilarities (Sorensen) showing turnover in fish assemblages from 1999 (circles) to 2012 (arrowhead). Arrow length is proportional to assemblage turnover and circle size is proportional to habitat change, which were the only important
variables explaining assemblage turnover (AICc model selection). See Table 2 for species name abbreviations.
Fig. 2 185x169mm (300 x 300 DPI)
Page 45 of 55
https://mc06.manuscriptcentral.com/cjfas-pubs
Canadian Journal of Fisheries and Aquatic Sciences

Draft
Fig. 3. Long-term turnover in species occurrence of riffle-dwelling fish assemblages calculated as pairwise Sorensen dissimilarity in relation to instream habitat change. Samples were obtained in 1999 and 2012, in
22 sites at the Maquiné river watershed, South Brazil. Fig. 3
101x91mm (300 x 300 DPI)
Page 46 of 55
https://mc06.manuscriptcentral.com/cjfas-pubs
Canadian Journal of Fisheries and Aquatic Sciences

Draft
Fig. 4. Principal coordinates analysis (PCoA) based on species abundance dissimilarities (Bray-Curtis) showing turnover in fish assemblages from 1999 (circles) to 2012 (arrowhead). Arrow length is proportional
to assemblage turnover and circle size is proportional to the four most important variables explaining
assemblage turnover (AICc model selection). These variables were (A) slope between confluences, (B) downstream link magnitude; (C) catchment area, and (D) habitat change. See Table 2 for species name
abbreviations. Fig. 4
203x203mm (300 x 300 DPI)
Page 47 of 55
https://mc06.manuscriptcentral.com/cjfas-pubs
Canadian Journal of Fisheries and Aquatic Sciences

Draft
Fig. 5. Long-term turnover in species abundance of riffle-dwelling fish assemblages calculated as pairwise Bray-Curtis dissimilarity in relation to the four most important variables, according to multiple model
selection. These variables were (A) slope between confluences, (B) downstream link magnitude; (C) square root transformed catchment area, and (D) habitat change. Samples were obtained in 1999 and 2012, in 22
sites at the Maquiné river watershed, South Brazil. Fig. 5
185x188mm (300 x 300 DPI)
Page 48 of 55
https://mc06.manuscriptcentral.com/cjfas-pubs
Canadian Journal of Fisheries and Aquatic Sciences

Draft
Appendix
Table A1. Overall description of the 22 sampled sites in Maquiné river basin, Brazil. Slope
between confluences (slope.bc); upstream catchment area (area); downstream link value
(dlink). Large boulder = l. boulder.
Site
Mean
wetted
width
(m)
Mean
depth
(cm)
Catchment
area
(km2)
Slope.bc
(%) Dlink
Dominant
substrates
(> 20%)
1 6.0 20.4 12.6 20.2 9 cobble
2 7.9 17.0 20.4 18.3 14 cobble and pebble
3 4.8 21.0 14.0 14.4 14 boulder and cobble
4 8.1 33.9 40.6 6.2 28 boulder, cobble and l. boulder
5 19.5 22.1 81.5 9.4 39 cobble and boulder
6 4.6 20.2 7.4 15.2 39 cobble and boulder
7 4.6 15.4 11.4 8.8 39 cobble and boulder
8 12.0 23.2 15.6 19.7 11 cobble, boulder and l. boulder
9 12.8 18.0 32.8 12.3 52 cobble and boulder
10 14.5 30.5 141.6 2.3 52 cobble and boulder
11 15.0 36.8 109.7 20.4 71 cobble and boulder
12 6.9 18.8 12.4 9.0 79 cobble and boulder
13 5.8 20.5 12.9 9.0 79 cobble and boulder
14 4.0 17.7 6.4 17.2 86 cobble and boulder
15 5.5 13.4 6.5 17.2 86 Cobble
16 15.2 22.8 165.9 2.1 139 cobble, pebble and boulder
17 6.2 24.4 22.9 20.5 10 cobble and boulder
18 12.9 21.6 49.9 8.3 154 cobble and boulder
19 6.5 19.6 9.7 32.0 9 cobble, boulder and l. boulder
20 10.4 20.0 28.0 2.6 176 Cobble
21 4.9 23.3 12.4 9.6 6 cobble and boulder
22 6.7 27.3 23.2 2.3 10 cobble and boulder
Page 49 of 55
https://mc06.manuscriptcentral.com/cjfas-pubs
Canadian Journal of Fisheries and Aquatic Sciences

Draft
Table A2. Descriptive summary of explanatory variables used in multiple regression models
of turnover in species occurrences and abundances. Dorder and centr.bt were highly
correlated with other variables (see Table 3) and were not used in the model selection
procedure. Slope between confluences (slope.bc); slope one kilometre upstream of site
(slope.1k); local slope (slope.loc); upstream catchment area (area); downstream link
magnitude (dlink); downstream order (dorder); closeness centrality (centr.cl); betweenness
centrality (centr.bt) and habitat change (habitat). Values in parentheses are standard deviation.
Mean (SD) Minimum Maximum
slope.bc 12.59 (7.67) 2.09 32.03
slope.1k 11.42 (5.38) 1.08 19.08
slope.local 3.03 (1.32) 1.75 6.99
area 38.07 (45.40) 6.37 165.86
dlink 54.64 (49.91) 6.00 176.00
dorder 3.55 (0.91) 2.00 5.00
centr.cl 5.02 × 10-05
(1.08 × 10-05
) 2.66 × 10-05
6.48 × 10-05
centr.bt 10459 (11850) 1263 43788
habitat 44.02 (9.83) 27.52 66.27
Page 50 of 55
https://mc06.manuscriptcentral.com/cjfas-pubs
Canadian Journal of Fisheries and Aquatic Sciences
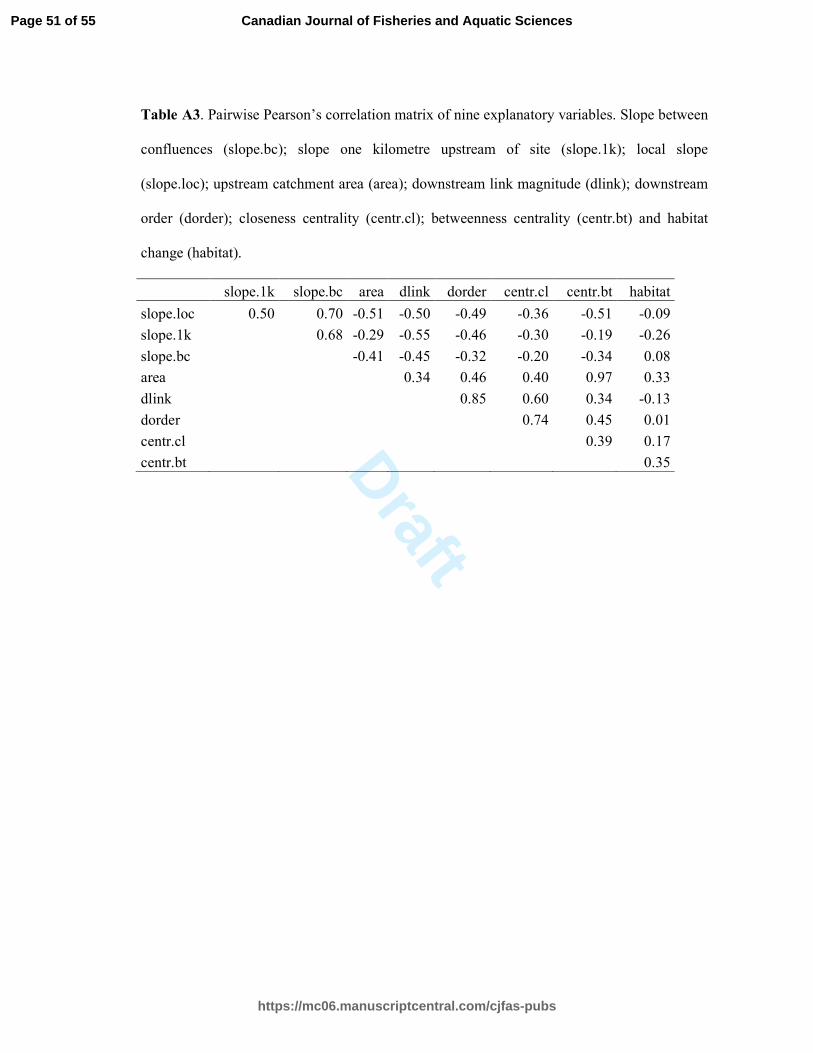
Draft
Table A3. Pairwise Pearson’s correlation matrix of nine explanatory variables. Slope between
confluences (slope.bc); slope one kilometre upstream of site (slope.1k); local slope
(slope.loc); upstream catchment area (area); downstream link magnitude (dlink); downstream
order (dorder); closeness centrality (centr.cl); betweenness centrality (centr.bt) and habitat
change (habitat).
slope.1k slope.bc area dlink dorder centr.cl centr.bt habitat
slope.loc 0.50 0.70 -0.51 -0.50 -0.49 -0.36 -0.51 -0.09
slope.1k 0.68 -0.29 -0.55 -0.46 -0.30 -0.19 -0.26
slope.bc -0.41 -0.45 -0.32 -0.20 -0.34 0.08
area 0.34 0.46 0.40 0.97 0.33
dlink 0.85 0.60 0.34 -0.13
dorder 0.74 0.45 0.01
centr.cl 0.39 0.17
centr.bt 0.35
Page 51 of 55
https://mc06.manuscriptcentral.com/cjfas-pubs
Canadian Journal of Fisheries and Aquatic Sciences

Draft
Table A4. Combinations of instream habitat variables to calculate habitat change
(dissimilarity) based on Euclidean distances that maximize the correlation with fish
assemblage turnover of species occurrences (Sorensen dissimilarity). See Table 1 for variable
names abbreviations.
Variable combinations Correlation
(Pearson's r)
CVDepth 0.590
CVDepth + MeanBankWid 0.741
CVDepth + MeanBankWid + Subs2cm 0.786
CVDepth + MeanBankWid + Subs2cm + Subs2to7 0.784
CVDepth + MeanBankWid + Subs2cm + Subs2to7 + Subs50cm 0.802
CVDepth + MeanBankWid + Subs2cm + Subs2to7 + Subs50cm +
MeanDepth
0.833
CVDepth + MeanBankWid + Subs2cm + Subs50cm + MeanDepth
+ MeanWettWid + DiverSubs
0.820
CVDepth + MeanBankWid + Subs2cm + Subs25to50 + Subs50cm
+ MeanDepth + MeanWettWid + DiverSubs
0.812
CVDepth + MeanBankWid + Subs2cm + Subs25to50 + Subs50cm
+ MeanDepth + MeanWettWid + DiverSubs + RatioWB
0.738
CVDepth + MeanBankWid + Subs2cm + Subs2to7 + Subs25to50
+ Subs50cm + MeanDepth + MeanWettWid + DiverSubs +
RatioWB
0.711
CVDepth + MeanBankWid + Subs2cm + Subs2to7 + Subs25to50
+ Subs50cm + MeanDepth + MeanWettWid + RatioWB +
CVWettW + DiverSubs
0.675
CVDepth + MeanBankWid + Subs2cm + Subs2to7 + Subs25to50
+ Subs50cm + MeanDepth + MeanWettWid + RatioWB +
CVWettW + DiverSubs + Subs7to25
0.640
CVDepth + MeanBankWid + Subs2cm + Subs2to7 + Subs25to50
+ Subs50cm + MeanDepth + MeanWettWid + RatioWB +
CVWettW + DiverSubs + Subs7to25 + CVBankW
0.479
Page 52 of 55
https://mc06.manuscriptcentral.com/cjfas-pubs
Canadian Journal of Fisheries and Aquatic Sciences

Draft
Table A5. Combinations of instream habitat variables to calculate habitat change
(dissimilarity) based on Euclidean distances that maximize the correlation with fish
assemblage turnover of species abundances (Bray-Curtis dissimilarity). See Table 1 for
variable abbreviations.
Variable combinations Correlation
(Pearson's r)
Subs25to50 0.392
MeanDepth + Subs25to50 0.522
MeanDepth + Subs25to50 + MeanBankWid 0.544
MeanDepth + Subs25to50 + Subs2to7 + CVBankW 0.585
MeanDepth + Subs25to50 + Subs2to7 + CVBankW + Subs2cm 0.603
MeanDepth + Subs25to50 + Subs2to7 + CVBankW + Subs2cm +
MeanBankWid 0.605
MeanDepth + Subs25to50 + CVBankW + Subs2cm +
MeanWettWid + DiverSubs + Subs7to25 0.604
MeanDepth + Subs25to50 + CVBankW + Subs2cm +
MeanWettWid + DiverSubs + Subs7to25 + CVDepth 0.605
MeanDepth + Subs25to50 + CVBankW + Subs2cm +
MeanWettWid + DiverSubs + Subs7to25 + CVDepth +
MeanBankWid
0.607
MeanDepth + Subs25to50 + CVBankW + Subs2cm +
MeanWettWid + DiverSubs + Subs7to25 + CVDepth +
MeanBankWid + Subs2to7
0.596
MeanDepth + Subs25to50 + CVBankW + Subs2cm +
MeanWettWid + DiverSubs + Subs7to25 + CVDepth +
MeanBankWid + Subs2to7 + Subs50cm
0.566
MeanDepth + Subs25to50 + CVBankW + Subs2cm +
MeanWettWid + DiverSubs + Subs7to25 + CVDepth +
MeanBankWid + Subs2to7 + Subs50cm + RatioWB
0.514
MeanDepth + Subs25to50 + CVBankW + Subs2cm +
MeanWettWid + DiverSubs + Subs7to25 + CVDepth +
MeanBankWid + Subs2to7 + Subs50cm + RatioWB + CVWettW
0.405
Page 53 of 55
https://mc06.manuscriptcentral.com/cjfas-pubs
Canadian Journal of Fisheries and Aquatic Sciences

DraftFig. A1. Daily rainfall from 1999 to 2012 for the studied region, southern Brazil. Data from
Centro Estadual de Meteorologia do Rio Grande do Sul – CemetRS of the Fundação Estadual
de Pesquisa Agropecuária – Fepagro.
Page 54 of 55
https://mc06.manuscriptcentral.com/cjfas-pubs
Canadian Journal of Fisheries and Aquatic Sciences

Draft
Fig. A2. Schematic representation of a hypothetical network showing how network position
metrics were calculated for each sampling site. Downstream order (A - Dorder) and
Downstream link magnitude (B - Dlink) are based on values of downstream segment after
confluences, whereas betweenness centrality and (C) and closeness centrality (D) are
calculated based on the nodes. Red circle represents the network position value for a
hypothetical sampling site. Values for C and D were calculated using the package igraph.
Page 55 of 55
https://mc06.manuscriptcentral.com/cjfas-pubs
Canadian Journal of Fisheries and Aquatic Sciences