Keysight Technologies Ultra-Wideband …literature.cdn.keysight.com/litweb/pdf/5989-0506EN.pdfpower...
77
Keysight Technologies Ultra-Wideband Communication RF Measurements Application Note
Transcript of Keysight Technologies Ultra-Wideband …literature.cdn.keysight.com/litweb/pdf/5989-0506EN.pdfpower...
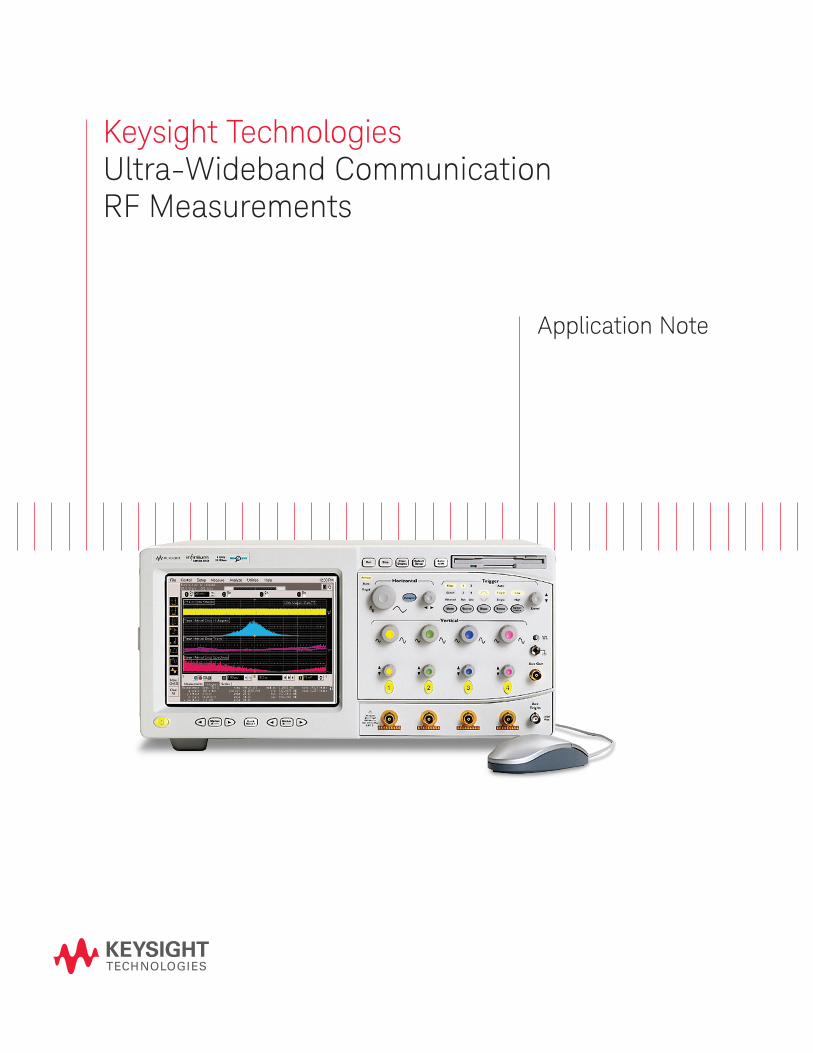
Keysight Technologies Ultra-Wideband Communication RF Measurements
Application Note

IntroductionThis application note is written for people who need to understand the configuration and testing of ultra-wideband (UWB) devices, and some of the issues surrounding their use. A broad range of topics is addressed in this paper, including practical test techniques. Further details on many of them may found in the references in Appendix B.
The basic concepts behind UWB signals are not new, but the radios are becoming more sophisticated. The signals are split into three main groups, depending on the signal generation technique: baseband-pulsed, pulse-modulated RF, and orthogonal frequency division multiplexing (OFDM).
Pulsed signals have been used in air and ground-penetrating RADAR systems of various forms for many years. Ultra-wideband OFDM involves adapting standard OFDM principles to meet the regulatory requirements of an underlay technology.
RADAR and position location in the form of radio frequency identification (RFID) tags are good applications of UWB, but it is the application to short range, very high speed data transfer that has recently triggered increased interest, and is the main focus of this application note. Communications applications like streaming video can make use of the latest mixed signal IC technology to provide viably-priced consumer devices.
Spectrum allocation is the key to new radio development. In 2002 the FCC in the United States allocated 3.1 to 10.6 GHz for use with unlicensed UWB signals as an underlay technology. It has stimulated many proposals to meet the specific requirements of the ruling. The IEEE 802.15.3a Working Group is one of the bodies looking to develop a standard that can be used generally by the industry for high-speed communication. Similar to Bluetooth™, the Multi-Band OFDM Alliance Special Interest Group has been established to promote an open OFDM standard. Other groups in Europe, Japan, and Asia are also showing interest, but do not currently have definite spectrum allocation rules with which to work.
There are alternative approaches to very high-speed wireless data transfer. One example, known as mmWave, uses conventional modulation of carriers above 20 GHz. This application note does not directly deal with this, but some of the measurement techniques will be applicable.
It is not only the RF transmission that has to be addressed to make a radio; the digital signal paths to and from the radio also need suitable hardware interfaces and a software medium to work. Industry groups such as JEDEC are tackling the hardware interface definition, while the IEEE 802.15.3 standard describes a medium access control that is suitable for the very high throughputs being sought. It continues to be enhanced.
In working with UWB devices, it is important to understand what you are trying to achieve, before making assumptions about what will be the correct measurements and equipment. Table 1 lists the basic options.
Table 1.
Objective Sections of interest
Understanding and developing the radio design or a module All
Testing for spectrum regulation purposes 6
Checking for interoperability between different vendors’ designs 6, 7, 8
Testing the effect of interference on other systems 4, 7

03 | Keysight | Ultra-Wideband Communication RF Measurements - Application Note
1. Basic Concepts Behind UWB Radio Definition of UWB…………………………………………………………………………………………………...5 Spectrum occupancy and channel capacity……………………………………………………………..5 Frequencies, power levels, and applications…………………………………………………………….6 IEEE802.15.3a (alternate PHYsical layer) section criteria………………………………………7 Signal generation and modulation…………………………………………………………………………...8 Baseband pulsed…………………………………………………………………………………………...8 Pulse modulated RF…………………………………………………………………………………………...11 Orthogonal frequency division multiplexing (OFDM)…………………………………………...13 TDMA and packet structures………………………………………………………………………………....15 Notes on MB-ODFM……………………………………………………………………………………...15 Notes on pulse modulated RF DS-CDMA…………………………………………………………...16
2. Circuit and Device Simulation…………………………………………………………………………………17
3. RF (PHYsical) Layer Test…………………………………………………………………………………………18
4. Interference Testing for Non-UWB Devices…………………………………………………………….19 Device test configuration………………………………………………………………………………………20 RF signal coupling…………………………………………………………………………………………………21 Generating the interference signal…………………………………………………………………………22
5. Component and Network Measurements ……………………………………………………………….25 Component impedance and reflection measurements…………………………………………….25 Antenna and channel response measurements………………………………………………………26 Use of equalizer characteristics…………………………………………………………………………28 Multi-path reflection and wavelets…………………………………………………………………….29 Differential network analysis………………………………………………………………………………….29 Delta (additive) EVM………………………………………………………………………………………………31
6. Transmitter Measurements……………………………………………………………………………………33 Test conditions and measurement setup……………………………………………………………33 Equivalent isotropic radiated power (EIRP)…………………………………………………….34 Interoperability testing………………………………………………………………………………….34 Hardware probing…………………………………………………………………………………………35 Measurement triggering……………………………………………………………………………36 Use of captured time records…………………………………………………………………………….39 Test modes……………………………………………………………………………………………….40 Power………………………………………………………………………………………………………………..41 Distinguish between RF bandwidth and video (demodulated) bandwidth…………41 Power spectral density, average detection……………………………………………………..41 Spectrum flatness determines total transmit power……………………………………….42 Sweep time…………………………………………………………………………………………………..42 Use of average (rms) detector for power measurement…………………………………..43 Peak power measurement using a swept spectrum analyzer…………………………..44 Peak output power, CCDF……………………………………………………………………………..44 Baseband versus envelope (zoom) CCDF……………………………………………………….45
Table of Contents

04 | Keysight | Ultra-Wideband Communication RF Measurements - Application Note
6. Transmitter Measurements continued... Transmit output spectrum…………………………………………………………………………………46 Swept spectrum measurements of pulsed RF signals…………………………………….46 Effect of increasing the resolution bandwidth on display level…………………………… 48 Peak and average detection of UWB signal……………………………………………………48 Comparing FFT-based and swept spectrum results……………………………………….52 Spectrograms and adjacent power measurements…………………………………………54 Two-channel (correlated) spectrum measurement…………………………………………54 Spectrum mask testing…………………………………………………………………………………55 Modulation tests……………………………………………………………………………………………….56 Baseband pulsed………………………………………………………………………………………….56 Pulse modulated RF………………………………………………………………………………………56 OFDM…………………………………………………………………………………………………………..58 Extending the capture period………………………………………………………………………..59 Frequency measurement CW and long pulsed signals………………………………………………………………………….60 ODFM modulated signals………………………………………………………………………………61 Short pulsed signals………………………………………………………………………………………61
7. Transceiver Spurious Tests…………………………………………………………………………………….62
8. Receiver Measurements………………………………………………………………………………………..63 Test conditions and setup………………………………………………………………………………………63 Frequency hopping……………………………………………………………………………………………….65 Receiver EVM measurements and BER…………………………………………………………………..66 Receiver sensitivity (RSSI)……………………………………………………………………………………..67 Clear channel assessment test………………………………………………………………………………68
9. Power Supply Measurements…………………………………………………………………………………69
Appendix A: Keysight Solutions for UWB……………………………………………………………………….70
Appendix B: Recommended Reading …………………………………………………………………………….72
Appendix C: Glossary……………………………………………………………………………………………………73
Appendix D: Symbols and acronyms………………………………………………………………………………74
Appendix E: References………………………………………………………………………………………………..75
Table of Contents, continued

05 | Keysight | Ultra-Wideband Communication RF Measurements - Application Note
1. Basic Concepts Behind UWB Radio
Definition of UWBFor the purpose of this application note, UWB is taken as a radio signal with an instantaneous bandwidth of ≥ 500 MHz or a fractional occupied bandwidth of ≥ 0.2, where
Fractional bandwidth = 2(fH - fL)/(fH + fL)
One of the key requirements for an UWB radio is the need for a broad, flat power spectrum. A flat transmit spectrum within the chosen frequency range will maximize the total transmitter power. Consumer UWB devices will transmit at very low powers. As an example, an indoor device operating from 3.1 to 4.8 GHz will need to transmit less than
–41.3*10.log(4800-3100) = –9 dbm
to satisfy the U.S.A.’s spectrum regulation requirements. The peak RF voltages are < 1 volt.
Spectrum occupancy and channel capacity
Most readers will know that Shannon-Hartley derived a simple expression to relate the basic data transfer capacity of a channel to the instantaneous signal bandwidth as:
C=B.log2 (1+S/N)where C = Channel capacity B = Occupied bandwidth S/N = Signal-to-noise (linear power ratio, not dB)
Another variable available with digital radio is the option to transmit data at a higher rate than the user needs to overcome practical problems. Assuming the hardware is adequate, the performance of a real radio receiver is limited by either interference or thermal noise at the input. The processing gain from direct sequence code spreading can, for example, allow a receiver to operate with input power spectral densities below the thermal noise floor of the input circuitry.
The majority of existing radio applications have an occupied bandwidth which is similar to the user data transfer rate. They rely on a good signal-to-noise ratio (SNR) and complex modulation formats for higher data rates. Some radio applications like CDMA, GPS, and the original 802.11b use direct sequence spreading to create a much wider signal bandwidth than Shannon’s equation requires. This is variously used to deal with interference, multiple users, or in the case of GPS, extreme path propa-gation loss. See Figure 1.
Incoming dataformatted into
packets
User datarecovered
Bandwidthcompressor[correlator]
Occupiedbandwidthexpansion
This is where the [correlated]signal is recovered more strongly
than the [uncorrelated] noise
Radio link
Bandwidth here dependson the user's data rate &
error protection
Bandwidth here depends onthe spectrum allocation
Figure 1. In spread spectrum radio, the SNR is improved by the correlation in the receiver.
An occupied bandwidth in the GHz range allows for some novel combinations of radio hardware and digital processing, while still addressing some of the most demanding applications.
Spectrum regulations constrain what is allowable, because along with the available spectrum, they define a maximum radiated power spectral density and peak power. This determines the received SNR, because the environment will determine the path loss.
The regulations governing UWB in the United States envisage it as an underlay technology, where the power spectral density is low enough to avoid interference with existing systems.
06 | Keysight | Ultra-Wideband Communication RF Measurements - Application Note
Frequencies, power levels, and applications
UWB systems operate across licensed and license-exempt bands, within the frequency bands shown in Table 1. The maximum transmit powers are also shown. The limits shown are only applicable in the United States. Other regions are exploring what limits they should set to suit local conditions. Currently some regions like Japan and Europe are more cautious, while Singapore is considering higher transmit powers. To allow CMOS implementations, and avoid 802.11a interference, the first UWB devices for consumer electronics will operate below 5 GHz.
Historically, UWB has been widely applied to location-sensitive applications. This is because the short pulses needed for the simplest ranging systems inherently occupy a large bandwidth. The FCC 02-48 ruling is causing this to expand.
Streaming video and wireless universal serial bus (USB) are key target applications for UWB in communications. They will not be the only uses, but act as useful, consumer-oriented ways to assess the capabilities of an UWB implementation.
Unlike the wireless local area network (WLAN) standards of IEEE 802.11, IEEE 802.15 standards are for wireless personal area networks, WPANs. In a WPAN, wireless devices form temporary piconets to enable data transfer. The well-known Bluetooth standard is in this family (IEEE 802.15.1), and a number of the principles governing system operation are shared.
The main impact of the distinction between WLAN and WPAN is felt in the software between the radio and the appliance it serves. However, there is also an effect on the RF because more than one piconet has to be able to operate in the same area, at the same time. This is known as simultaneous operating piconets, or SOPs. Unlike WLAN, there is no central access point to coordinate network activity. The piconets must be able to operate independently and asynchronously, which immediately places burdens on the system design. Each radio must be able to quickly identify RF packets meant for it, and minimize the effect of unwanted signals on its data throughput.

07 | Keysight | Ultra-Wideband Communication RF Measurements - Application Note
Table 2. System frequency bands and applications for the U.S.A.
Application FCC Part 15 freq band2 Max power (1 MHz) Restrictions
Imaging
1. Ground penetrating radars, wall
imaging, medical imaging
3.1 to 10.6 GHz
GPR < 960 MHz
–41.3 dBm Yes, usage
2. Thru-wall imaging and surveil-
lance systems
1.99 to 10.6 GHz –51.3 dBm
Communication and measurement
3. Indoor 3.1 to 10.6 GHz –41.3 dBm No separate or outdoor antenna
4. Outdoor handheld 3.1 to 10.6 GHz
24 to 29 GHz
59 to 66 GHz1
–41.3 dBm
Vehicular radar
5. Vehicular radar
Collision avoidance, improved airbag
activation, suspension systems
24 to 29 GHz and –41.3 dBm No
1. Unconfirmed.2. Band edge is –10 dB relative to the maximum in-band signal.
IEEE 802.15.3a (alternate PHYsical layer) selection criteria
The development of a new standard has to satisfy many criteria, some of which are difficult to accurately compare between different proposals. Listed below are some of the more tangible factors that have to be addressed, and provide some insight into why the process can be a lengthy one.
General solution cost, signal robustness, technical feasibility, scalability, location awareness
MAC supplements MAC changes needed, power management, power consumption
PHY layer size and form factor, bit rate and throughput, simultaneous piconet operation, signal acquisition,
range, sensitivity, multi-path, antenna practicality
08 | Keysight | Ultra-Wideband Communication RF Measurements - Application Note
Signal generation and modulation
The 802.15.3 (high rate) RF physical layer is fairly conventional, but has not been widely adopted. It is 802.15.3a (alternative high rate PHY) that is specifically targeted at using extreme radio bandwidths, and the one this application note addresses.
Most engineers are used to data being modulated onto a radio carrier before transmission. There are many ways of generating and modulating that carrier. Two of particular interest for UWB are discussed here, but the first description is of a technique that does not use a carrier at all, and it is what was initially thought might be the basis for UWB radios.
Baseband pulsedHere, the RF energy is derived from the spectral components of a baseband signal.
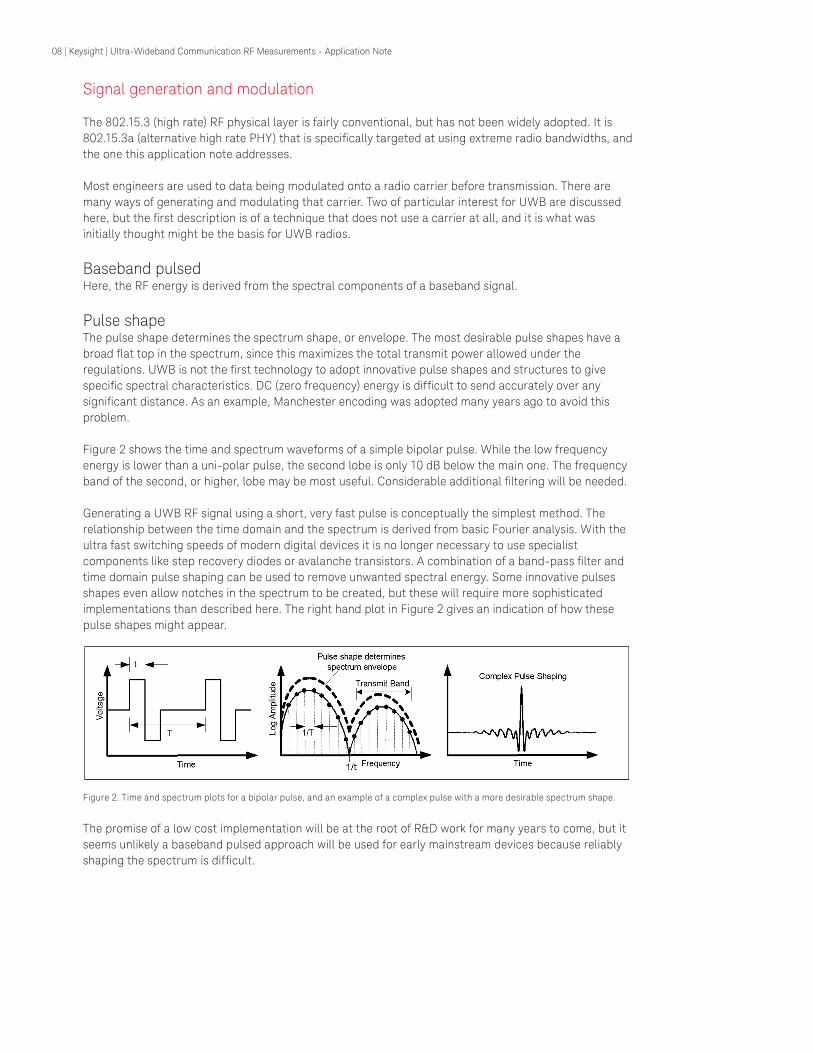
Pulse shapeThe pulse shape determines the spectrum shape, or envelope. The most desirable pulse shapes have a broad flat top in the spectrum, since this maximizes the total transmit power allowed under the regulations. UWB is not the first technology to adopt innovative pulse shapes and structures to give specific spectral characteristics. DC (zero frequency) energy is difficult to send accurately over any significant distance. As an example, Manchester encoding was adopted many years ago to avoid this problem.
Figure 2 shows the time and spectrum waveforms of a simple bipolar pulse. While the low frequency energy is lower than a uni-polar pulse, the second lobe is only 10 dB below the main one. The frequency band of the second, or higher, lobe may be most useful. Considerable additional filtering will be needed.
Generating a UWB RF signal using a short, very fast pulse is conceptually the simplest method. The relationship between the time domain and the spectrum is derived from basic Fourier analysis. With the ultra fast switching speeds of modern digital devices it is no longer necessary to use specialist components like step recovery diodes or avalanche transistors. A combination of a band-pass filter and time domain pulse shaping can be used to remove unwanted spectral energy. Some innovative pulses shapes even allow notches in the spectrum to be created, but these will require more sophisticated implementations than described here. The right hand plot in Figure 2 gives an indication of how these pulse shapes might appear.
Figure 2. Time and spectrum plots for a bipolar pulse, and an example of a complex pulse with a more desirable spectrum shape.
The promise of a low cost implementation will be at the root of R&D work for many years to come, but it seems unlikely a baseband pulsed approach will be used for early mainstream devices because reliably shaping the spectrum is difficult.
09 | Keysight | Ultra-Wideband Communication RF Measurements - Application Note
Pulse spacing
The pulse spacing determines the frequency between adjacent signal components seen on a spectrum analyzer. Since user data is applied to change some characteristic of the pulse, the spacing also determines the rate data may be sent.
Spectrum regulation measurements most often use a 1 MHz resolution bandwidth. For a repetitive signal, this means signal components of 1 MHz and above can be seen (resolved) discretely on the analyzer’s display, while low frequency components cannot. However a low repetition rate does not suit fast data transfer, and also will require a higher pulse voltage for the same power spectrum density. Considering the signal in the time domain, whenever the voltage is zero, there is no energy being transmitted.
Any repetitive element in the time domain will show as spikes (discrete tones) in the frequency spectrum, so it essential to “whiten” the pulse structure regardless of user data. What are required are tightly spaced pulses with their amplitude, timing, or shape adjusted in a way that cancels out any discrete spectral activity. Figure 18 on page 24 shows how this may look in practice.
Transmitter
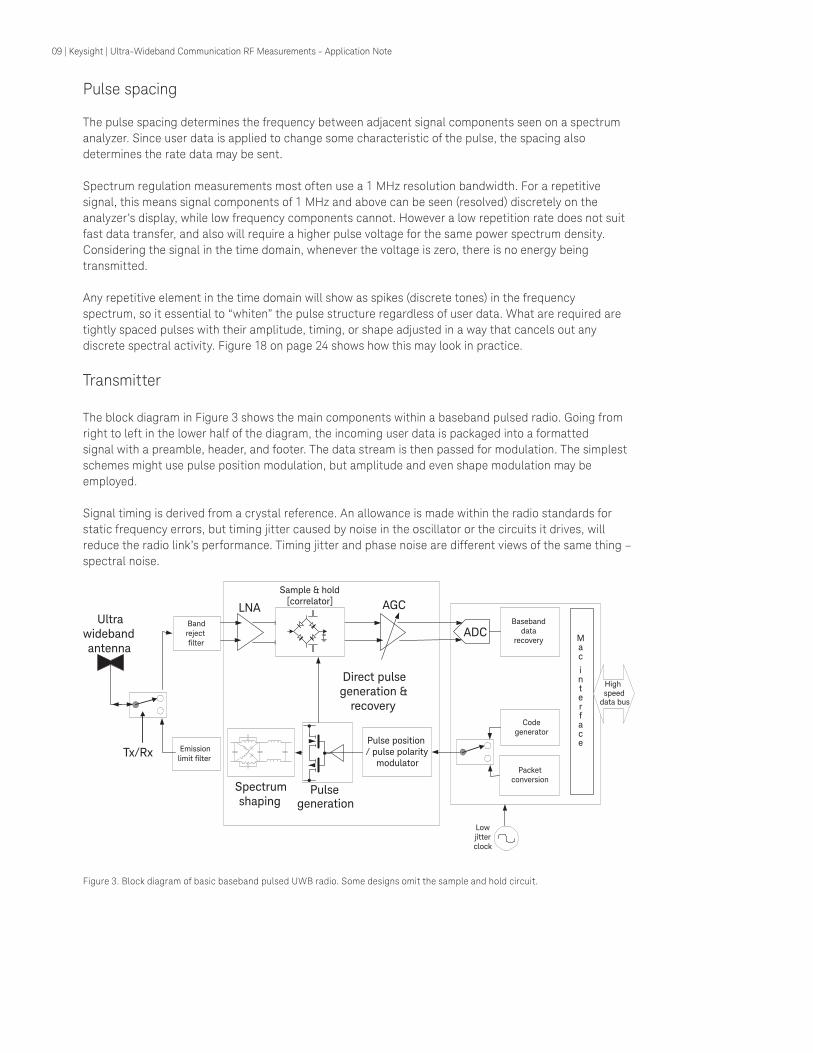
The block diagram in Figure 3 shows the main components within a baseband pulsed radio. Going from right to left in the lower half of the diagram, the incoming user data is packaged into a formatted signal with a preamble, header, and footer. The data stream is then passed for modulation. The simplest schemes might use pulse position modulation, but amplitude and even shape modulation may be employed.
Signal timing is derived from a crystal reference. An allowance is made within the radio standards for static frequency errors, but timing jitter caused by noise in the oscillator or the circuits it drives, will reduce the radio link’s performance. Timing jitter and phase noise are different views of the same thing – spectral noise.
Codegenerator
Basebanddata
recovery
Bandrejectfilter
Lowjitterclock
LNA
ADC
Packetconversion
Ultrawidebandantenna
Highspeed
data bus
Spectrumshaping
Direct pulsegeneration &
recovery
Pulsegeneration
Pulse position/ pulse polarity
modulator
AGC
Emissionlimit filter
Sample & hold[correlator]
Tx/Rx
Mac
interface
Figure 3. Block diagram of basic baseband pulsed UWB radio. Some designs omit the sample and hold circuit.

10 | Keysight | Ultra-Wideband Communication RF Measurements - Application Note
The pulse generator shown in this diagram is very simple. A pulse generator like this will require sophisticated filtering to meet spectrum regulation requirements.
The UWB devices envisaged for IEEE 802.15.3a still use a TDMA packet- based transmit/receive technique. Being able to turn off as much circuitry as possible when it is not in use will remain vital to meet the battery consumption expectations.
A single RF switch and antenna is shown. Spatial diversity transmission and reception is not appropriate for UWB, because an UWB signal does not suffer from the narrowband fades that antenna switching tackles.
Receiver
Interference is the biggest problem for most radio designs, and an UWB receiver is particularly sensitive to high-level signals simply because of the wide input frequency range. For UWB consumer applications, an IEEE 802.11a transmitter or 1.9 GHz cell-phone is likely to be the hardest with which to deal. A good demodulator can separate a wanted signal from interference, as long as the distortion is linear. This means the amplifier chain in the receiver must be well protected from high-level signals that would cause them to distort the combined signal.
After band-pass filtering, the pulsed signal goes into a correlator, which multiplies the signal by an ideal version of itself. The correlator can take different forms, one of the simplest being a very high-speed sample and hold. The baseband timing circuit needs to synchronize the timing of the sampling. It does this by looking for readily identifiable parts of the radio signal in the preamble.
Multi-path reflections mean the pulse waveforms that arrive at the receiver input will be far more complex than what was transmitted. Figure 4 gives an indication of what might be seen for an isolated pulse. More sophisticated correlators and multi-tap rake receivers can be used to capture more energy, but the designer has to trade off performance with complexity and associated power consumption.
Figure 4. Example of the complexity of an isolated pulse waveform (due to multi-path reflections) as seen by a receiver.

11 | Keysight | Ultra-Wideband Communication RF Measurements - Application Note
Pulse modulated RF
Examination of the pulse waveforms needed to create a banded spectrum shows they look like bursts of a few cycles of a carrier. The simplest extension from the bipolar pulse of Figure 2, the Gaussian mono-pulse shown in Figure 5, looks like a single sine-wave cycle.
Time Frequency
Volt
age
Log
ampl
itude
Transmit band
Figure 5. Time and spectrum plots of Gaussian mono-pulse, showing approximation to a carrier cycle.
This points to the use of conventional frequency mixing as a way to generate the UWB signal, which has become more popular. Figure 6 shows spectrum analyzer plots for signals created in this way.
Figure 6. Spectra of a pulsed 500 MHz carrier, with different turn-on periods. The carrier leakage (shown as a discrete tone) circled in lower right plot is due to imperfect mixer balance.
Figure 6 shows how the energy gets distributed very broadly across the spectrum as the on-period is reduced to the point where there are only a few cycles of the carrier (2.5 in this case). This spectrum behavior is entirely predictable, but few RF engineers will have had reason to experiment with pulses this narrow. Pulse modulation usually involves hundreds of cycles of the carrier. On paper the implementation looks more complicated, but multiplying a fixed carrier by a shaped pulse eases some of the significant problems related to realizing low-cost, reproducible performance. For a given RF bandwidth only half that bandwidth value is needed at IF. In the time domain, the pulse rise time can be half the speed needed for the same bandwidth generated using a baseband pulse system.
Pulse Rise time determinedthe slope of this line
Carrier Leakagethrough mixer
Spectrum energyis well spread
81132/81134 pulse generator ESA, PSA spectrum analyzer
Wideband mixer: mini-circuits ZEM 4300, Marki
M2-0006MA or similar 20 MHz span1 MHz rectangular pulse
50% mark space ratio
1 GHz span1 MHz rectangular pulse
50% mark space ratio
1 GHz span1 MHz rectangular pulse
20 ns on period
1 GHz span1 MHz rectangular pulse
5 ns on period
12 | Keysight | Ultra-Wideband Communication RF Measurements - Application Note
Low jitter [phase noise]crystal reference
LNAUltrawidebandantenna
Spectrum shaping
Pulse generation& frequencyconversion
Pulsegeneration
AGC
RF control
Data recovery
Baseband dataprocessing
Highspeed
data bus
ADCLow pass/band pass
filter
Tx/Rx
~4 GHz localoscillator
Frequencymultiplier
Amplitude only orIQ modulation
Amplitude only or IQdemodulation
+1, 0, –1 for DS-UWB schemeEmission limit filter
Band reject filter
Pulse shaping
+/-45
Pulse position/shape/polarity
modulator
Figure 7. Block diagram of pulse modulated RF UWB radio.
Transmitter
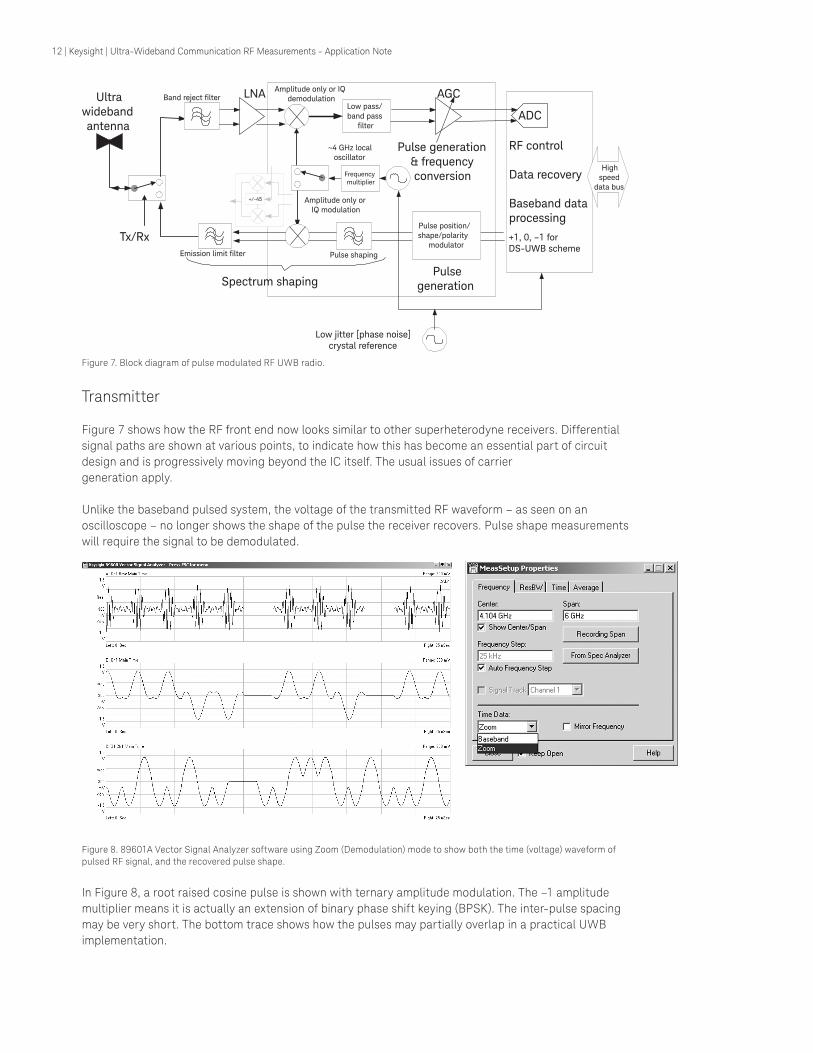
Figure 7 shows how the RF front end now looks similar to other superheterodyne receivers. Differential signal paths are shown at various points, to indicate how this has become an essential part of circuit design and is progressively moving beyond the IC itself. The usual issues of carrier generation apply.
Unlike the baseband pulsed system, the voltage of the transmitted RF waveform – as seen on an oscilloscope – no longer shows the shape of the pulse the receiver recovers. Pulse shape measurements will require the signal to be demodulated.
Figure 8. 89601A Vector Signal Analyzer software using Zoom (Demodulation) mode to show both the time (voltage) waveform of pulsed RF signal, and the recovered pulse shape.
In Figure 8, a root raised cosine pulse is shown with ternary amplitude modulation. The –1 amplitude multiplier means it is actually an extension of binary phase shift keying (BPSK). The inter-pulse spacing may be very short. The bottom trace shows how the pulses may partially overlap in a practical UWB implementation.

13 | Keysight | Ultra-Wideband Communication RF Measurements - Application Note
Direct sequence UWB (DS-UWB) modulation
The options for signal modulation are very similar to the baseband pulsed system. The direct sequence UWB (DS-UWB) proposal for IEEE 802.15.3a3 addresses the need for closely shaped pulses with long repeat intervals by using code sequence modulation. Modulation involves choosing between symbols made up of carefully chosen pulse sequences, alternating between +1, –1, and possibly 0. These may be applied as BPSK or QPSK. Figure 8 shows a short part of one of these types of sequence. The pulse spacing in the center plot of this figure was chosen to show how the pulse shape may be recovered and does not represent the real signal.
A common crystal reference will be used for carrier and pulse timing, giving a fixed relationship between the carrier frequency and pulse period. Some designs may use a variety of local oscillator frequencies to provide the right combinations of spectrum use and data throughput.
Receiver
Post down-conversion filtering provides some additional interference protection, but the IF bandwidth has to be so wide it is not as effective as a normal narrow band radio. The recovered pulse can either be fed to a simple correlator or, as shown in Figure 8, sent to an analog-to-digital converter (ADC). Digital signal processing (DSP) on the ADC output is used to recover the original signal. Over time, designs will change to use ever-faster ADCs. This will allow more signal filtering and recovery to be done digitally, rather than relying on analog circuit performance. For DS-UWB, it is the receiver’s correlation of symbol pulse sequences that is more important than individual pulses.
Orthogonal frequency division multiplexing (OFDM)
Based on the availability of high speed DSP, OFDM is becoming a very popular format, used in technologies such as digital video broadcast (DVB) and IEEE802.11a and g. The basic mechanism is to divide the payload data between many (synchronous) sub-carriers, resulting in a reduced symbol rate for each carrier, rather than using a much higher rate for a single carrier. In the time domain, this extends the time period over which a data bit is received, and makes it less affected by multi-path and narrow-band interference. The delay spread that has to be accommodated is considerably less than for WLAN due to the shorter (10 m) expected operating range.
While the radio again looks complex, OFDM has a number of characteristics that make it a realistic possibility for UWB. As well being potentially robust to multi-path interference, it has a well-defined spectrum shape and is scalable according to the data rates required. The minimum 500 MHz instantaneous bandwidth set by United States’ regulations determines the lowest DSP processing rates that can be used.
Figure 9 shows a typical block diagram for an OFDM radio, with a choice of single path or IQ mixing. Given the bandwidth of the signals being sent to the ADC/DAC, it is possible for them to become part of the RF section (e.g. in a silicon-gemanium IC), but the digital interface is then a challenge to implement.
+/-45
External amplifiersand RF filtering
Frequencyconversion IF gain control
Crystalreference
ADC
DAC
Highspeed
data bus
Ultrawidebandantenna
- 2:- 8:
~4GHz Localoscillator Freq switch control
Amplitude only or IQ modulation
Amplitude only or IQ demodulation
RF control
Data recovery
Baseband dataprocessing
DS
P
Tx/Rx
Figure 9. Block diagram of OFDM UWB radio.

14 | Keysight | Ultra-Wideband Communication RF Measurements - Application Note
Frequency switching
One of the unusual parts of this radio is the carrier generation. The maximum DSP circuits currently realizable can only generate signals with approximately 500 MHz RF bandwidth. To make use of more of the spectrum, the frequency is hopped at the OFDM symbol rate. See Figure 10. Unlike technologies like Bluetooth, the frequency is changed so rapidly it is not possible to use a single phase-locked oscillator. All the frequencies needed are generated continuously, and a switch selects the one required. There are too few frequencies to benefit from using a random frequency selection pattern. The frequency is switched in on a small number of patterns, which identifies a particular piconet.
..... .....
Synchronization Channel estimation
Tail & pad
Time
FrequencyPreamble Header Payload1.875 us
3432 MHz
3960 MHz
4488 MHz
Figure 10. Frequency switching for each symbol of UWB-OFDM burst.2
Modulation
Lower order modulations like BPSK and QPSK will be used in an UWB OFDM radio. This is because the wide bandwidths provide sufficient capacity and the poor SNR does not support higher order modulation. The number of bits in the ADC has to be limited due to the very high sampling rates. Four or five bits should be sufficient.
As with other schemes using OFDM the preamble will use the most robust, lowest order, modulation. The preamble is spread over all the frequencies to be used, allowing the equalizer to form the best estimate of the channel.
For lower user data rates a further simplification is possible, where only the real component of the DSP signal is needed. As shown in Figure 11, it is noticeable that the spectrum becomes symmetric when this is happening. The single baseband signal has half the bandwidth of the modulated RF signal.
Figure 11. Time gated spectrum using 54855 oscilloscope and 89601A VSA software, with a Gaussian RBW filter. It shows four points during an OFDM burst with real-only modulation data. The spectrum is symmetrical around the center. This effect is seen with any scheme that allows for real-component only modulation, including 2BOK DS-UWB.

15 | Keysight | Ultra-Wideband Communication RF Measurements - Application Note
TDMA and packet structures
The discussion so far has been largely about the RF signal. Many layers of protocol are laid on top of this. The details of the frame structure depend on the PHY format being employed and these are still being developed. This application note will therefore not attempt to describe these in detail. The medium access control protocol for 802.15.3a will draw heavily on that developed for 802.15.3, which has a number of mechanisms to reduce signalling overhead.
An UWB device for 802.15 data communication only transmits or receives at any point in time. Transmissions occur as packets (frames), which vary in length and spacing, usually for a few hundred microseconds. This means the frame contains hundreds of thousands of DS-UWB pulses, or around a thousand OFDM symbols.
Notes on MB-OFDM
The basic structure proposed2 to IEEE 802.15.3a for multi-band OFDM is shown in Figure 12. It is very similar to existing WLAN frames. The preamble is used by the receiver to acquire and adapt to impairments on the input signal. Depending on the modulation format, this can involve frequency and phase error equalizing, and time alignment. Since the signal is spread over multiple frequency bands, the path correction has to be calculated for all these bands.
The header contains a lot of information including the destination address and the format of the remainder of the burst. User data is transferred from the original packets, which are fed to the MAC layer. Long packets may be fragmented (broken up) if the radio determines this will improve the link performance.
PLCP Reamble30 OFDM symbols FCSFrame payload
Variable length 0-4095 bytes
Headercheck
sequence
MACheader
PHYheader
55 Mbps
Tailbits
55, 80, 110, 160, 200, 320, 480 Mbps
Padbits
Tailbits
11.5625 us
Figure 12. Frame structure for UWB-OFDM format.
16 | Keysight | Ultra-Wideband Communication RF Measurements - Application Note
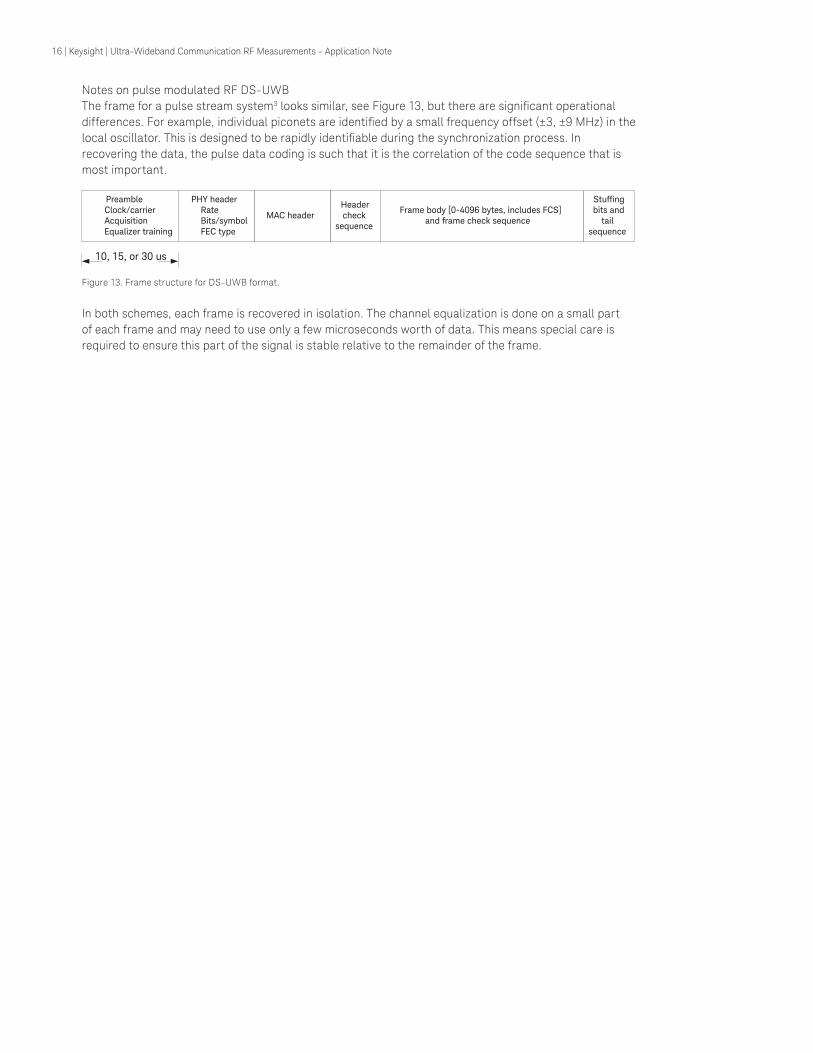
Notes on pulse modulated RF DS-UWBThe frame for a pulse stream system3 looks similar, see Figure 13, but there are significant operational differences. For example, individual piconets are identified by a small frequency offset (±3, ±9 MHz) in the local oscillator. This is designed to be rapidly identifiable during the synchronization process. In recovering the data, the pulse data coding is such that it is the correlation of the code sequence that is most important.
Preamble Clock/carrier
Acquisition Equalizer training
Stuffingbits and
tailsequence
Frame body [0-4096 bytes, includes FCS]and frame check sequence
Headercheck
sequenceMAC header
PHY header Rate Bits/symbol FEC type
10, 15, or 30 us
Figure 13. Frame structure for DS-UWB format.
In both schemes, each frame is recovered in isolation. The channel equalization is done on a small part of each frame and may need to use only a few microseconds worth of data. This means special care is required to ensure this part of the signal is stable relative to the remainder of the frame.

17 | Keysight | Ultra-Wideband Communication RF Measurements - Application Note
2. Simulation
Circuit and channel simulation are vital elements in the design of a new radio system. It is important to be able to build up a complex system from accurate component models that can themselves be verified against real-life measurements. Integrated links to test equipment (including logic analyzers) and the 89601A VSA software make this easier. It is the concept behind Keysight Technologies, Inc. Connected Solutions. The system shown in Figure 14 is an example of a DesignGuide, which allows block-by-block construction of the simulated system. It shows how a complete path, from bits-in to bits-out can be created.
Figure 14. ADS UWB DesignGuide schematic, showing the building blocks of a MB-OFDM signal generator. The 89601 VSA software
is built-in to allow analysis of the simulated signals.
DesignGuides are being developed for other UWB formats. Check for further details on http://eesof.tm.keysight.com/products/ultra_wideband_dg.html.

18 | Keysight | Ultra-Wideband Communication RF Measurements - Application Note
3. RF (PHYsical) Layer Test
The definition of what are suitable measurements also evolves during the lifecycle of a new standard. At the time of writing, UWB is still at a fairly early stage of development. Existing tools can be used for a wide range of analysis based on the most fundamental properties of a design, such as power, frequency, and existing modulation formats. This document describes some of the latest techniques available.
A lot of work has been done to define the appropriate spectrum regulation limits. In the United States this has resulted in some test limits being adopted, but work continues (such as in the ITU-R committee) to reach agreement in other regions.
Test metrics will need to be agreed upon to ensure radios from different vendors meet a minimum level of performance for interoperability. This has not yet happened, but there are a number of measurements that can be expected to be useful, particularly around parameters that are undefined in the standard, such as what happens before the packet preamble.
UWB is an underlay technology, and therefore interference testing is a significant issue. The main issue is specifying the conditions that will be usefully representative, without seeing an explosion in the number of test cases. Many different types of UWB radios will be encountered. Existing equipment can be used to approximate many of these. This provides a means to test for areas of vulnerability, while retaining flexibility.
The radio standard determines how effectively the available spectrum is used. Adjacent channel spectrum testing is only applicable if the RF is split into frequency bands. With pulsed radio this is not the case, but multiple piconets still have to work simultaneously. In CDMAone cellular a similar issue is dealt with using a peak code domain error measurement, where the effective leakage onto other codes is assessed. Different techniques, based on the pulse timing and shape may be of use, but have yet to be defined.
ADS
Sim
ulat
ion
Des
ign
Gui
des
ESA,
PSA
Spec
trum
Ana
lyze
r
5485
5
Real
Tim
e Sc
ope
8610
0C
DCA
/Sam
plin
g Sc
ope
8960
1 Ve
ctor
Sig
nal
Anal
ysis
sof
twar
e
8960
4 D
isto
rtio
n
Anal
ysis
sof
twar
e
8113
4 D
ual C
hann
el
Dat
a /P
ulse
Gen
.
ENA,
PN
A
Net
wor
k An
alyz
er
PSG
, Wid
eban
d M
od.
Sign
al. G
en.
Radio development
Spectrum regulation
Interoperability
Interference
Spectrum occupancy
Table 3. Equipment suitable for different tasks. (Some restrictions apply.)

19 | Keysight | Ultra-Wideband Communication RF Measurements - Application Note
4. Interference Testing for Non-UWB Devices
If UWB is to act as an underlay technology, it needs to be shown to have a minimal impact on existing spectrum users. As is clear from the descriptions earlier in this application note, there are many ways to generate an UWB signal. When considering interference testing, allowing for some flexibility in the test source is therefore likely to be beneficial, after making some basic choices about which format to verify.
The first step to consider for an interference test is if it is an in-band or out-of-band test as far as the victim receiver is concerned. Figure 15 identifies which is which. An in-band test is of probably the most interest, unless the UWB device is to be co-located in the same appliance as the potential victim.
Frequency
Am
plitu
de
UWB band
IEEE
802
.11a
GPS
rece
iver
Cel
l-ph
one
Possible UWBspectrum shape
Out-of-band UWB spuriousis in-band for victim
UWB signal is in-band for victim
Mixed case
Cel
l-ph
one
2nd generationdevice
1st generationdevice
Sat
ellit
e re
ceiv
er
3.1 GHz 8.2 GHz
Possible UWBspectrum shape
Figure 15. In-band versus out-of-band Interference for different victims.
Out-of-band (for the victim)
It is possible to test the rejection of the DUT to out-of-band frequencies, but for modern radios, like cell-phones, it should be very good. Ironically, some high power cellular TDMA systems, like GSM, do cause interference, but with non-RF circuitry. This is because the radiated field strengths are high enough for unintentional reception in low frequency circuits that are not well-screened. Non-linearities in the circuits provide unwanted amplitude demodulation. The relatively low repetition rate of the RF bursts makes it easy to literally hear the result.
WLAN signals are also transmitted as bursts of RF, but the signal levels are lower, and the distribution of the bursts is more random. There have been few obvious effects. Each frame of a WPAN UWB signal is still transmitted as an RF burst, but the amplitude is even lower than WLAN. With MB-OFDM, where the signal is transmitted in shorts bursts throughout each frame, the repetition rate is very high. It seems unlikely that there will be a general problem. Investigation continues for specific situations such as satellite reception.
In-band (for the victim)
The interference is in-band if the victim’s input frequency is within the UWB transmit frequency band, or if a practical transmit filter on the UWB device leaves measurable unwanted sideband components. We cannot assume the UWB device will be any better than the normal regulatory requirement and we therefore can use this as the nominal test limit.
20 | Keysight | Ultra-Wideband Communication RF Measurements - Application Note
Device test configuration
The effect of interference on the victim needs to be assessed in as quantitative a method as possible. Four factors need to be understood:
– type of victim receiver (digital or analog). Protection provided by modulation or coding formats – what is the most sensitive format to interference?
– operating link margin for the victim system – nature of the interference – the power level of interference at victim receiver input
For a digital receiver, a practical test of the impact may take the form of a bit error rate (BER) or packet error rate (PER) test in the device under test (DUT). The drawback of a PER test can be that it does not show how much margin there is between good and poor levels of operation. This can be partly addressed by attenuating the wanted signal until it is on the verge of failing. Alternatively, note that systems using error correction frequently have a mechanism to show how much correction is being applied by the digital signal processor (DSP) in the receiver. The signal quality indication may even be made available to the normal user, as is the case for digital TV in the United Kingdom. It provides an improved metric compared to PER or watching the video signal. Special test software can also provide the information needed, although it may not be widely available.
Even using this technique, the result depends on the specific implementation of the victim receiver. The most thorough understanding of how the interference affects the victim is to measure the analog signal recovered by the victim. Monitoring EVM results using a signal analyzer gives an insight into the reasons why bit errors occur, especially if a time capture of the combined signal is available to show the relative timing of bit error and EVM error.
21 | Keysight | Ultra-Wideband Communication RF Measurements - Application Note
RF signal coupling
In practice, the interference will usually (not always, we need to watch the isolation of connecting leads) get into the victim via its antenna, so this is an attractive test configuration. However, a cabled connection to the victim’s receiver will provide far more repeatable measurements. Measurement variations will be reduced if the victim system is left as close to complete as possible.
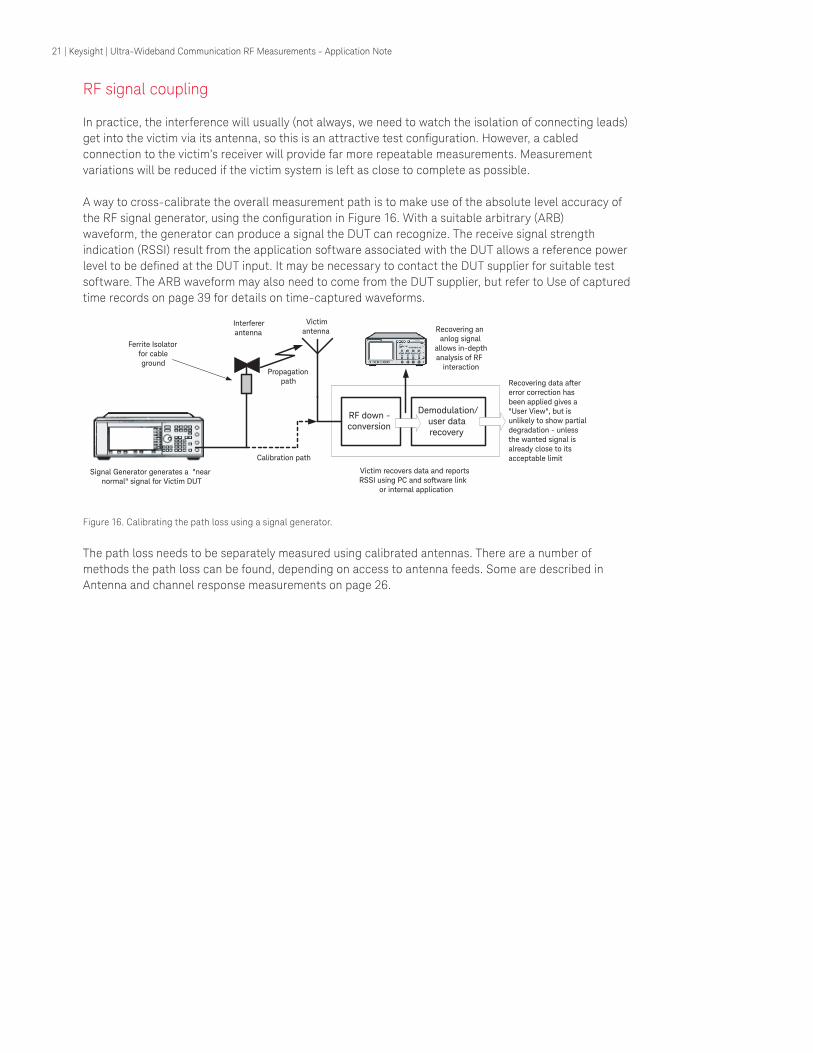
A way to cross-calibrate the overall measurement path is to make use of the absolute level accuracy of the RF signal generator, using the configuration in Figure 16. With a suitable arbitrary (ARB) waveform, the generator can produce a signal the DUT can recognize. The receive signal strength indication (RSSI) result from the application software associated with the DUT allows a reference power level to be defined at the DUT input. It may be necessary to contact the DUT supplier for suitable test software. The ARB waveform may also need to come from the DUT supplier, but refer to Use of captured time records on page 39 for details on time-captured waveforms.
RF down -conversion
Demodulation/user datarecovery
Signal Generator generates a "nearnormal" signal for Victim DUT
Victim recovers data and reportsRSSI using PC and software link
or internal application
Ferrite Isolatorfor cableground
Interfererantenna
Victimantenna Recovering an
anlog signalallows in-depthanalysis of RF
interaction
Recovering data aftererror correction hasbeen applied gives a"User View", but isunlikely to show partialdegradation - unlessthe wanted signal isalready close to itsacceptable limitCalibration path
Propagationpath
Figure 16. Calibrating the path loss using a signal generator.
The path loss needs to be separately measured using calibrated antennas. There are a number of methods the path loss can be found, depending on access to antenna feeds. Some are described in Antenna and channel response measurements on page 26.
22 | Keysight | Ultra-Wideband Communication RF Measurements - Application Note
Generating the interference signal
While the radio standards are evolving, generating a test signal that has similar characteristics may be more useful than trying to exactly emulate a particular signal. For a radio module with good RF isolation from the power supply and baseband, a signal that is wide relative to the input bandwidth of the DUT will often be sufficient. Different set-ups are needed for pulsed or MB-OFDM simulation.
Frequency switched OFDM
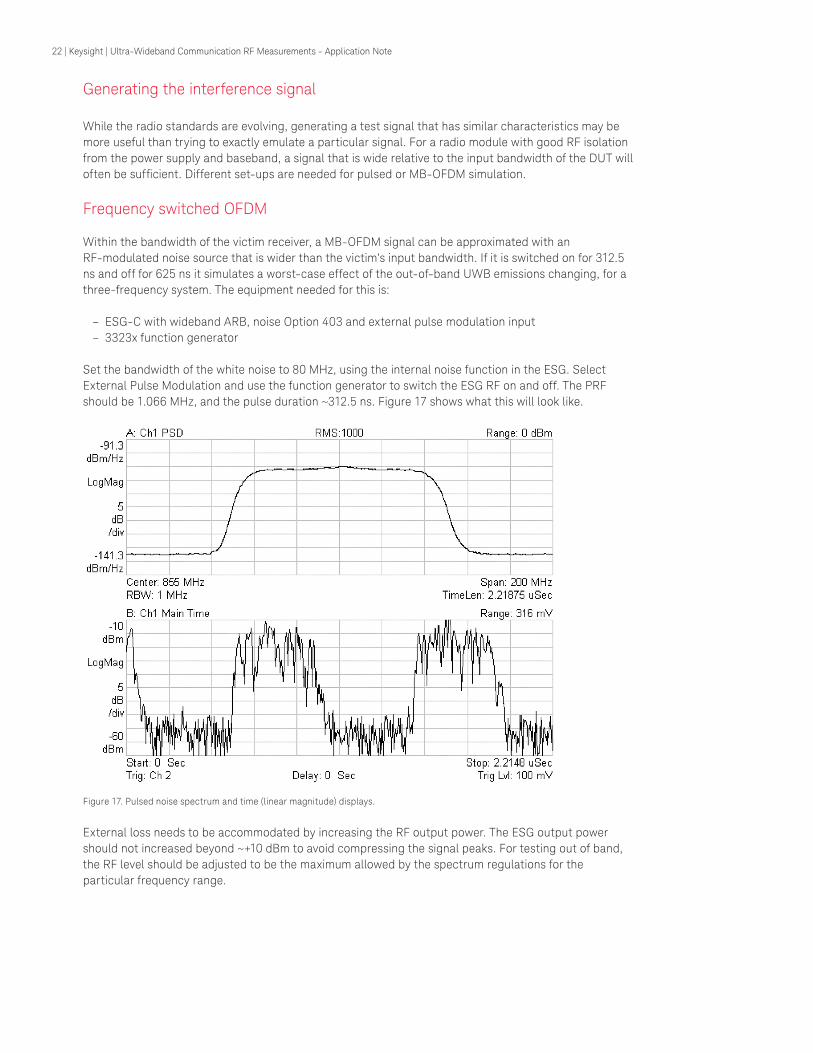
Within the bandwidth of the victim receiver, a MB-OFDM signal can be approximated with an RF-modulated noise source that is wider than the victim’s input bandwidth. If it is switched on for 312.5 ns and off for 625 ns it simulates a worst-case effect of the out-of-band UWB emissions changing, for a three-frequency system. The equipment needed for this is:
– ESG-C with wideband ARB, noise Option 403 and external pulse modulation input – 3323x function generator
Set the bandwidth of the white noise to 80 MHz, using the internal noise function in the ESG. Select External Pulse Modulation and use the function generator to switch the ESG RF on and off. The PRF should be 1.066 MHz, and the pulse duration ~312.5 ns. Figure 17 shows what this will look like.
Figure 17. Pulsed noise spectrum and time (linear magnitude) displays.
External loss needs to be accommodated by increasing the RF output power. The ESG output power should not increased beyond ~+10 dBm to avoid compressing the signal peaks. For testing out of band, the RF level should be adjusted to be the maximum allowed by the spectrum regulations for the particular frequency range.

23 | Keysight | Ultra-Wideband Communication RF Measurements - Application Note
Pulsed and pulse modulated
Within the receiver bandwidth of the victim, the spectrum of the pulsed signal, as measured with a spectrum analyzer will look quite flat, but the statistics of the time domain signal may not be Gaussian.
The real system DS-UWB system uses shaped pulses of approximately 1 ns duration to synchronously modulate a local oscillator. The position, polarity, and possibly even the shape of the pulse are changed to modulate data onto the RF signal. Accurately simulating this with general-purpose equipment is very difficult, but several approximations should highlight any sensitivity in the DUT to this or other pulsed interference.
UWB pulsed source
A wideband solution is to use a high-speed pulse generator. The dual channel 81134 pulse generator can be configured to generate a noise-like bipolar data stream, or its two channels can be used to create IQ signals using a timing offset between them. The equipment needed is:
– 81134 pulse generator – either ESG-C with a suitable external double-balanced mixer, or PSG Option 015.
The configuration is basically that shown in Figure 6 on page 11. The I or Q input may be used with PSG Option 015, or both to create QPSK, if the dual channel 81134 is available. Sensitivity testing can start with simply generating narrow pulses and noting any effect on the DUT, but this kind of signal is not related to DS-UWB.
To create an approximation to the DS-UWB signal, Ch1 and Ch2 on the 81134 are coupled using a power splitter. Using the Data Mode, the data patterns are programmed to provide the +1, –1 and 0 states required. The channel output voltage needs to be doubled to take account of the loss in the splitter. Timing differences between the channels can be corrected using the Delay adjustment. A small DC offset may be needed to minimize carrier feed-through.
The RF output should be set to give the required power spectral density (PSD) in a 1 MHz bandwidth using an average detector (for example, –41.3 dBm/MHz for center frequencies between 3.1 and 10 GHz.)
Channel 1 Channel 2 Sum
0 0 –1
0 1 0
1 0 0
1 1 1

24 | Keysight | Ultra-Wideband Communication RF Measurements - Application Note
Restricted bandwidth pulsed source
As with the OFDM interferer example, this technique is based on creating what the DUT’s receiver will be exposed to within its RF input bandwidth. Just part of the spectral content of the DS-UWB signal is created using the ARB in the ESG. This signal could be from a simulation or even a captured waveform using the technique discussed in Use of time captured records on page 39. Reducing the capture span will increase the maximum length of time recording.
Figure 18 shows how the signal amplitude with a 100 MHz span is reduced from the full bandwidth signal, and how the modulation looks more noise- like as a time-domain waveform. The pulse shaping is no longer visible. The CCDF (see Peak output power, CCDF on page 44) confirms the signal amplitude is statistically more evenly distributed in a narrower analysis span.
Some evidence of the (4104 MHz) carrier may be found if the capture is done based on the center frequency. Tuning away from the center frequency removes this effect, since the carrier is no longer contained in the measurement. The VSA software is able to perform this calculation even on a captured time record because of the re-sampling algorithms it uses.
Figure 18. Spectrum and time domain plots of a DS-UWB-like signal for 3 GHz (top traces) and 100 MHz (bottom traces) frequency spans. The lower traces of voltage (middle) and CCDF (right-hand) show the increasingly noise-like nature of the signal as the analysis bandwidth is reduced.
The band power markers used in Figure 18 indicate how the PSD may be measured. They have been spaced more widely than the normal 1 MHz requirement to avoid the spectral effects due to the very short FFT time lengths. A 10 log scaling should be applied to the selected bandwidth to convert to a 1 MHz bandwidth.

25 | Keysight | Ultra-Wideband Communication RF Measurements - Application Note
5. Component and Network Measurements
Component impedance and reflection measurements
Unintended RF signal loss degrades the system operation and has to be avoided. Impedance mis-matches (such as between the antenna and DUT input), are one of the ways signal loss occurs. Matching takes extra attention when operating over a multi-GHz range.
Using a very fast voltage step, or pulse, is a well-known technique for examining the performance of transmission lines. It is a cost-effective and intuitive way of assessing UWB impedance matching.
Figure 19. TDR reflections along a printed circuit board filter.
The basic assumption is that the bandwidth of the DUT is very wide and goes down to low frequencies. Otherwise, the picture becomes distorted. As the voltage step of the test signal travels down the line, if the line impedance changes, some of the signal is reflected. The pulse repetition rate has to be slow enough to cope with the longest delay expected.
Using an 86100 as the test tool, Figure 19 shows a typical response. In this simple example it is easy to translate what happens on the screen to problems with the circuit. More advanced techniques have been introduced to improve the accuracy of the measurement. See references in Appendix B: Recommended Reading on page 72 for more details.
There are some situations when a voltage pulse approach may cause problems:
– there is an active device in the circuit that cannot cope with the test signal – the circuit is band-limited, which distorts the reflected signal, making the display difficult to
interpret – there is RF attenuation before the circuit that is to be tested, which reduces the amplitude of the
reflected component
An alternative technique uses a vector network analyzer. The source power can be varied and a tuned receiver gives increased dynamic range. Using an inverse Fast Fourier transform it is possible to switch from frequency to time domain. This technique has been further developed to allow advanced “windowing” of specific parts of the system being tested.

26 | Keysight | Ultra-Wideband Communication RF Measurements - Application Note
The choice of frequency domain parameters affects what will be seen in the time-domain window. If the S11 plot is affected, so will the time domain. For example:
– the highest test frequency determines the time/distance resolution – the number of frequency points determines the resolution between adjacent items on the trace
The measurement works on the principle that the voltage at one frequency point is the vector sum of all the system responses as the signal progresses through it. The frequency of the test signal therefore has to be stable for long enough for all significant response to have settled. This may be a problem that is not often encountered, but filters with steep frequency responses may cause it to happen.
Antenna and channel response measurements
The IEEE process requires a channel model to be agreed upon, to allow the comparison of different radio proposals4. A new model was needed because earlier narrow-band models assumed frequency-independent scattering, which becomes invalid over the very wide frequency range of an UWB signal. The IEEE model is a complex expression, with the main variables being the excess delay, rms delay spread, and the number of significant multi-path components.
Some of the simplest channel measurements use a sampling oscilloscope, with a high-level pulse being used as the stimulus. A network analyzer is normally used for more detailed analysis, and was one of the methods used to derive the IEEE channel model. As shown in Figure 20, it is possible to incorporate a separate, triggered RF source to allow for longer range testing. A reference antenna allows antenna pattern measurement to be included.
Figure 20. Extended range test configuration for antenna pattern and channel response measurements, using a vector network analyzer and triggered external RF source.
RF source
PSG series signal generatorPSG trig out
PSG trig in
Reference IF(to Rcvr R1 in)
LO source(from PNA source out)Test IF
(to Rcvr A in)
PSG series NA
PSG trig in
PSG trig out

27 | Keysight | Ultra-Wideband Communication RF Measurements - Application Note
A third option is to use a real-time oscilloscope in combination with post-capture analysis. Subject to dynamic range limitations of the oscilloscope and external amplification, this approach allows the most complete set of channel data to be acquired. Capturing signals using a two-channel oscilloscope and then correlating the data between the measurements allows the relative timing of the signals to be seen. Vector averaging allows the effect of noise to be reduced if the channel is stable. Table 4 summarizes the alternatives.
Table 4. Comparison of different techniques for UWB path loss measurements.
Sampling scope and pulse
generator (86100)
Network analyzer (ENA,
PNA)
Real time scope (54855)
and analysis software
(89601)
Information provided Simple. real time. Good for
intuitive understanding if
path not too complex/test
signal pulses spaced well
apart
Used for IEEE model vector
information. Swept sine
wave stimulus. Use FFT to
extract time response
Allows use of DUT transmit
signal. Good for
understanding time delay
Separation of items
contributing to the
measurement
Limited, amplitude only Good. Use standard
calibration techniques to
improve accuracy of port
measurements like S21
Good. Use equalizer to
remove antenna response.
Compare equalizer data
with model
Dynamic range Limited by broadband noise
floor or interference signals
including unwanted LO
feed-through
Highest, especially with
external source. Ensure
cables do not suffer RF
leakage
Limited by scope ADC
resolution. Requires
external LNA. Ensure
displayed trace amplitude
is as high as possible

28 | Keysight | Ultra-Wideband Communication RF Measurements - Application Note
Use of equalizer characteristics
Fixed equalization is useful for making two measurement channels appear to have identical responses. This allows you to make stimulus-response measurements in either the frequency domain or the time domain. It is a more powerful technique than frequency-domain normalization, but must be applied with care. An example of using fixed equalization for two-channel measurements is illustrated in Figure 21.
Test signal
Path or device under test
Power splittere.g. Keysight
11636B
54855 Oscilloscope
Time
Volts
Low noise amplifiere.g. Keysight 8449B
Figure 21. Using digitized signal for time correlation/coherence measurements.
To obtain stimulus response measurements using the 89601 VSA software with a 58455 oscilloscope:
1. Connect a wide-band signal via a splitter to Channel 1 and Channel 2. The signal must have energy (on average) throughout the band of frequencies for which you wish to equalize. The best signals are white noise, chirps, or noise-like digitally modulated signals (OFDM). They need not be periodic.2. MeasSetup > Average > RMS (Video) Choose sufficient averages to reduce the display variance noise to a satisfactory level.3. Trace > Data > ChX > Coherence The coherence should be close to one across the span. Coherence usually increases with the number of averages. If it is consistently low in some portions of your span, you may need to change your signal so that is has energy in these areas.4. Trace > Data > ChX > Freq Response > Save > D1 The Data can be extracted for external use.5. Utilities > Fixed Equalization > Equalization > Ch2 > D1, or Utilities > Fixed Equalization > Equalization > Ch1 > D1 > Invert6. If you now repeat the measurement, the frequency response should be flat in amplitude and phase.
29 | Keysight | Ultra-Wideband Communication RF Measurements - Application Note
Multi-path reflection and wavelets
Wavelet analysis is a type of windowed spectrum analysis. Unlike short-time Fourier analysis, with its uniform time-frequency regions, wavelet analysis divides the time-frequency plane into non-uniform regions.
In the context of UWB, the term wavelet has been used in connection with multi-path propagation and the composite signal levels a victim receiver experiences. This is of interest because of the need to understand the effect of a large number of UWB devices on existing radio systems.
The configuration in Figure 21 allows the time correlation of such signals to be examined. The impact on a specific type of radio depends on its bandwidth and modulation format, as described in Device test configuration on page 20. As shown in Figure 18, the UWB signal is noise-like for a narrow band receiver, but the instantaneous vector sum will also depend on the frequency response of the path. Due to the correlation time intervals involved, the envelope amplitude detector of a spectrum analyzer will usually respond to multi-path signals as if they were uncorrelated noise. This topic is still under discussion in the spectrum regulatory agencies, but may affect the transmission power allowed for certain devices.
Differential network analysis
Driven by low voltage power supplies and the need to reduce coupling between digital and analog cir-cuitry, differential signal paths are rapidly becoming a standard practice in radio device design. A UWB radio places special demands on the measurement of differential components for two reasons. First, building a practical balun with the necessary phase matching is difficult. This means the differential connection cannot be easily converted to a single-ended connection. Second, the separation between RF and IF/baseband signal frequencies is reduced, making it more important to fully understand any limits in the isolation of different components through mode conversion.
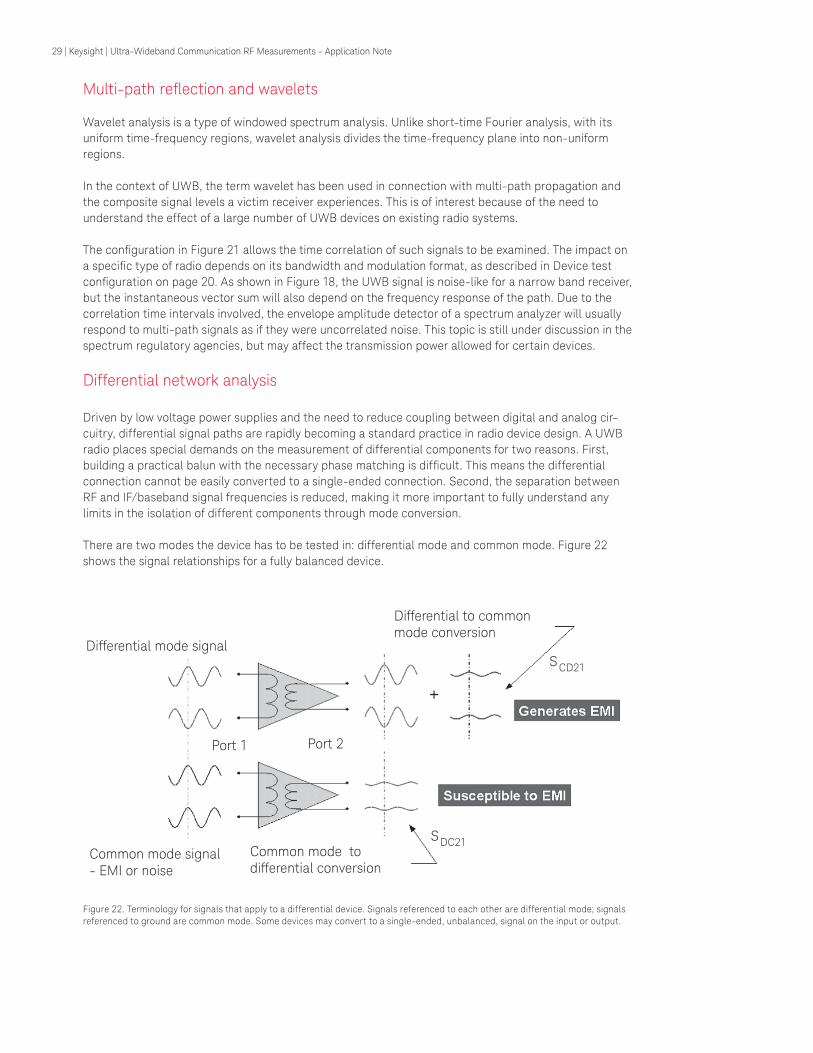
There are two modes the device has to be tested in: differential mode and common mode. Figure 22 shows the signal relationships for a fully balanced device.
Differential mode signal
Port 1 Port 2
Common mode signal- EMI or noise
Common mode todifferential conversion
SDC21
Differential to commonmode conversion
SCD21
Figure 22. Terminology for signals that apply to a differential device. Signals referenced to each other are differential mode; signals referenced to ground are common mode. Some devices may convert to a single-ended, unbalanced, signal on the input or output.

30 | Keysight | Ultra-Wideband Communication RF Measurements - Application Note
Vector network analyzer techniques have evolved to address differential analysis, by adding additional ports, new measurements, and error correction techniques. Using a single port stimulus, mixed mode analysis is available. It allows the display of the conversion of signals in one mode to another. Instead of just S21, the stimulus and response mode is now specified. The example shown in Figure 22 is for SDC21 and SCD21. As with the original S parameters, the convention is for the response mode to be written first in the subscript.
For linear analysis, the measurement accuracy is excellent, and many important characteristics such as common mode rejection, can be thoroughly assessed.
For active components, both linear and non-linear analysis may be required. The generation of a true differential (180 degree) test signal over a very wide bandwidth is not trivial. Careful consideration of the practical error mechanisms is needed.
Different methods have advantages and issues as summarized in Table 5. Table 5. Summary of issues for three methods of driving a differential device.
Linear analysis Non-linear analysis
Mixed mode Independently drive each port. Mathematically derive and correct the results
Excellent parameter coverage and accuracy
Good. Common mode input parameters can show errors at high signal levels. These may not be of practical concern
Balun
Build a custom physical part with best possible performance, since error correction is limited
Cannot isolate common mode information
Balun imperfections give errors in differential mode results
Fair, if it is possible to get correct phase relationship over the bandwidth to be tested
Hybrid junctionSingle port drive, but feedback allows linear error correction
Excellent Good. Design of hybrid junction limits performance
Figure 23 shows the configuration for a new technique, using a hybrid junction. The technique offers more than a plain balun, because the errors from the hybrid junction can be removed from all the linear measurements.
Figure 23. Basic configuration for device test using hybrid junction.
Research continues to make differential device measurements more straightforward. Updated informa-tion may be found at www.keysight.com/find/ena including references to hybrid junction suppliers.

31 | Keysight | Ultra-Wideband Communication RF Measurements - Application Note
Delta (additive) EVM
Conventional network analysis uses swept frequency or amplitude sine wave test signals. Moving beyond this to analyze a system with a variety of life-like complex test signals reveals more about the effect of non-linearities, and makes the transition from modeling and simulation to real hardware analysis more straightforward.
Test signalDevice under test
Power splitter
54855 Oscilloscope& 89604A software
Time
Volts
NOTE: The input signal may alsosimulated data from ADS, MATLAB®, etc,
TriggerSet sample rate
to maximum
Figure 24. Test configuration for using 89604 distortion suite.
By using a time record of the voltage of a signal at the input and output of a device, see Figure 24, the 89604 Distortion Suite software is able to show the nature of the non-linearity, and provide the coefficients of a best fitting curve.
Figure 25. Sample plot from 89604 software using an 802.11 OFDM waveform as the test signal.

32 | Keysight | Ultra-Wideband Communication RF Measurements - Application Note
89604 results include delta EVM, which provides a generic figure of merit. It is different to the EVM in a radio standard (see Table 6), which makes an assumption about the type of signal being used and the amount of equalizing that is done to create the EVM reference.
For UWB devices, the EVM result may be limited by sampling noise. To minimize this effect, ensure the sampling rate in the oscilloscope is set to the maximum available. This increases the amount of averaging that can be done on the data.
Table 6. Comparison of traditional and delta EVM measurements.
Traditional EVM Delta EVM
Requires demodulator to detect bits Uses one input channel as a reference – no demodulation required
Bits used to synthesize a perfect, noise-free reference Does not assume an ideal signal, or that the signal is a modulated
carrier
Assumes ideal signal at the input to the DUT Noise on the reference channel measurement may degrade
measurement’s accuracy
Computed at symbol intervals Computed over all time samples. Reduces the numeric value. No
measurement filter to limit signal bandwidth
In Figure 25, the time domain input and output waveforms are shown at the bottom. The example used an OFDM signal as the stimulus. Gain and phase distortion is shown at the top, including a best-fitting curve for a fifth order polynomial. Figure 26 shows the polynomial extraction. The amplitude probability density function and the CCDF are the plots in the middle of Figure 25. The analysis done in this software removes linear phase and timing differences, but does not perform the equivalent of adaptive equalization in removing linear distortion from the signal.
Figure 26. Example of configuration options and curve fitting results for 89604.

33 | Keysight | Ultra-Wideband Communication RF Measurements - Application Note
6. Transmitter Measurements
The measurements described below are split into groups according to the type of DUT (pulse oriented or OFDM) and the test objective. The details of many areas of testing are still being developed, but it is reasonable to expect they will fall into the following categories:
Measurement Test objective
Output power, power spectral density Range, in-band interference
Peak output power, CCDF Interference, interoperability, range
Spectrum occupancy, spectrum mask Out-of-band interference
Adjacent channel performance Range, interoperability
Modulation analysis Range, interoperability
Frequency accuracy and stability Range, interoperability
Figure 26. Example of configuration options and curve fitting results for 89604.
Test conditions and measurement setup
Parametric tests of the antenna/channel and the transmitter or receiver will generally be done separately. Unless carefully controlled, using an antenna or a live network introduces considerable uncertainty. While a number of the tests described here can be performed live, it is expected that generally a cabled RF connection will be used. This is essential for repeatable receiver sensitivity measurements.
Microwave signals act very differently from the audio and digital signals with which many people are used to dealing. The reader is advised seek advice if they wish to perform measurements, but are new to RF testing.
There are two main configurations used for testing the transmitter path. They are distinguished by the signal interfaces, and the way the device is controlled. One is suitable for RF/analog only circuitry, the other for a complete UWB device. Figure 27 shows the configuration for the RF/analog only case. Control of the circuit will require proprietary hardware.
If the baseband signal is three-level digital, it can be generated using two channels of an 81134 pattern generator. Details are provided in the UWB pulsed source description on page 23. The 81134 can be programmed to create specific patterns, or generate very long random sequences.
An external ARB or a proprietary device (from a real radio) can be used as the modulation source for an OFDM design. For modulation accuracy, the measurement has to be able to recognize the format. The delta EVM technique described in Delta (additive) EVM (beginning on page 31) can use any signal, and will not degrade the result because the test signal is not perfect. An alternative is to adapt the modulation format of the test signal to suit the analysis capability available.

34 | Keysight | Ultra-Wideband Communication RF Measurements - Application Note
Note: The 2 channels of the 81134 can be used to create either 3 level pulses or I and jQ signals. Setting the dattern pattern to a long prbs (up to 2^31) creates a wideband noise-like signal.
RF up/down
conversion
Basebanddata/packetformatting
ModulationFPGA/DACsDUT
controller
IF
Ultra high speedformatted data
e.g. LVDS
RF
Power amp& detector
Device under test
For +1, 0, –1signal levels
IFRF
PSAswept spectrum analyzer
5485520 GSa/sec 6 GHz
real time scope
8113412 Mb data pattern/
pulse generator
Dual arb wavefrom generator[> 250 MHz bandwidth]
I, Q
Differential signals
IQ path calibration
Waveform generation
Figure 27. Transmitter test configuration for RF/analog circuitry.
Equivalent isotropic radiated power (EIRP)
The antenna in a real-life system may be designed to focus the transmit power in certain directions and will have a radiation efficiency that depends on the implementation. This can make it difficult to compare the performance of different hardware. Therefore, some measurements refer to equivalent isotropic radiated power, EIRP. Physical measurements involve the use of a remote antenna for testing, which can be impractical for anything except (pre-) certification testing. The designer needs to understand the individual transmitter and antenna characteristics. EIRP measurements may require offset factors depending on the propagation in the test chamber. See also wavelet notes at the end of Antenna and channel response measurements section.
The FCC regulations do not allow externally mounted antenna, for indoor or outdoor use. ETSI require certification tests to include the antenna. See Antenna and channel response measurements on page 26 for antenna measurements.
Interoperability testing
There are many transmitter parameters, which, if not controlled, can reduce the performance of the UWB system, or even prevent different devices working together. Tests will be devised to help stop this from happening. These are not yet available.
The transmitter tests are described first in this application note because there are several problems in a transceiver that can be found more readily by analyzing the transmitted output.
Examination of the block diagrams in Signal generation and modulation (beginning on page 8), show why this is the case. The local oscillator(s) for frequency up and down conversion is shared. Many impairments on the LO, which could affect the receiver, will be visible on the transmissions.
35 | Keysight | Ultra-Wideband Communication RF Measurements - Application Note
Hardware probing
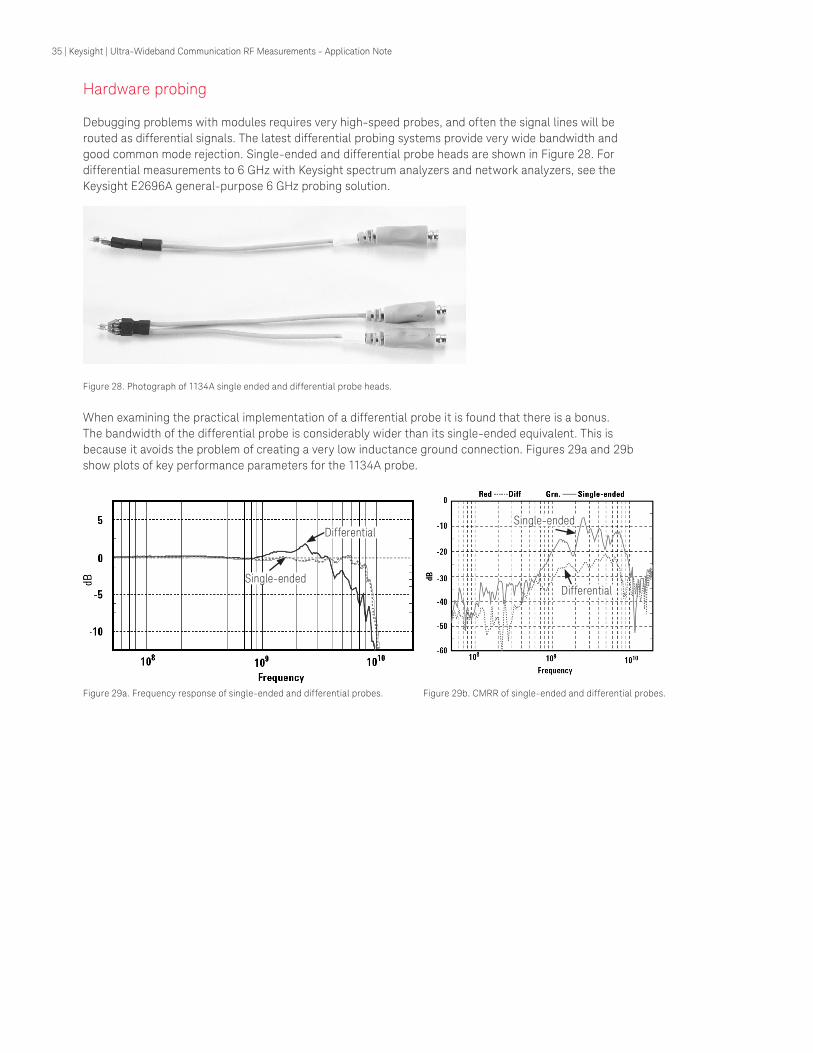
Debugging problems with modules requires very high-speed probes, and often the signal lines will be routed as differential signals. The latest differential probing systems provide very wide bandwidth and good common mode rejection. Single-ended and differential probe heads are shown in Figure 28. For differential measurements to 6 GHz with Keysight spectrum analyzers and network analyzers, see the Keysight E2696A general-purpose 6 GHz probing solution.
Figure 28. Photograph of 1134A single ended and differential probe heads.
When examining the practical implementation of a differential probe it is found that there is a bonus. The bandwidth of the differential probe is considerably wider than its single-ended equivalent. This is because it avoids the problem of creating a very low inductance ground connection. Figures 29a and 29b show plots of key performance parameters for the 1134A probe.
Figure 29a. Frequency response of single-ended and differential probes. Figure 29b. CMRR of single-ended and differential probes.
Differential
Single-endedDifferential
Single-ended
36 | Keysight | Ultra-Wideband Communication RF Measurements - Application Note
Measurement triggering
Triggering on a pulsed RF carrier, for time domain measurements The most robust way of making measurements is to generate a trigger signal from the baseband circuit that is driving the DUT. Beyond prototypes, this kind of signal is not always available, so level-sensitive triggering on the RF has been used.
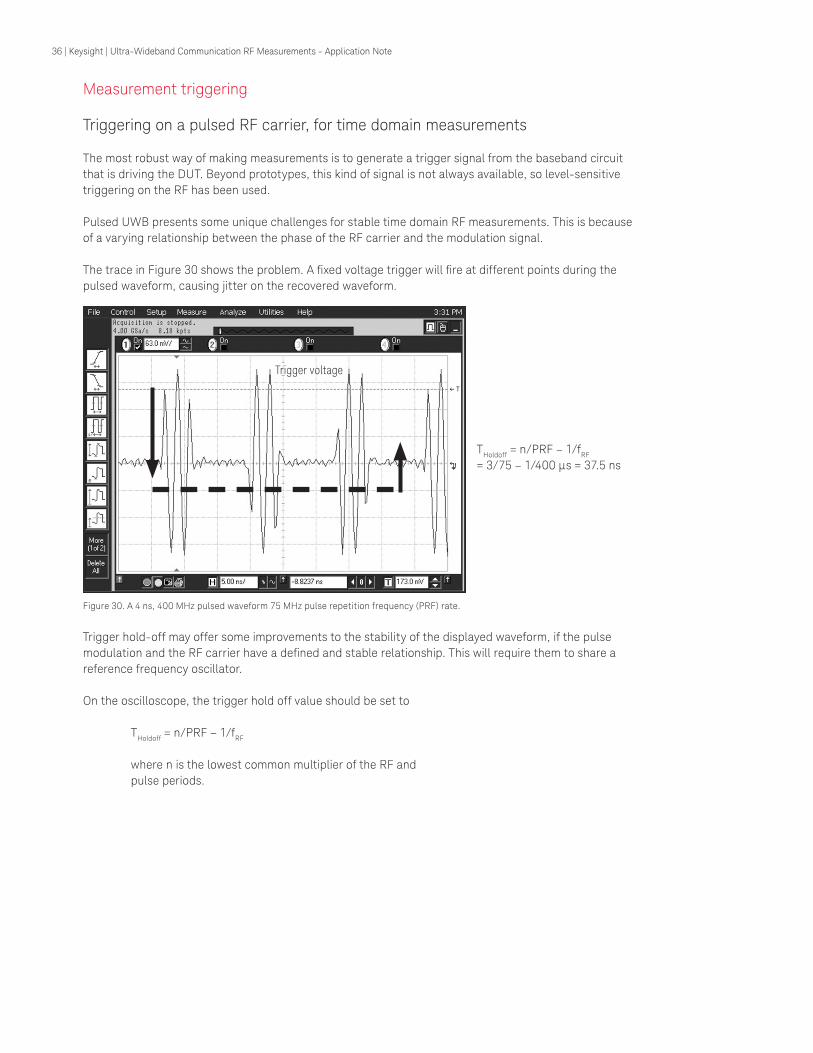
Pulsed UWB presents some unique challenges for stable time domain RF measurements. This is because of a varying relationship between the phase of the RF carrier and the modulation signal.
The trace in Figure 30 shows the problem. A fixed voltage trigger will fire at different points during the pulsed waveform, causing jitter on the recovered waveform.
Figure 30. A 4 ns, 400 MHz pulsed waveform 75 MHz pulse repetition frequency (PRF) rate.
Trigger hold-off may offer some improvements to the stability of the displayed waveform, if the pulse modulation and the RF carrier have a defined and stable relationship. This will require them to share a reference frequency oscillator.
On the oscilloscope, the trigger hold off value should be set to
THoldoff = n/PRF – 1/fRF
where n is the lowest common multiplier of the RF and pulse periods.
THoldoff = n/PRF – 1/fRF
= 3/75 – 1/400 µs = 37.5 ns
Trigger voltage
37 | Keysight | Ultra-Wideband Communication RF Measurements - Application Note
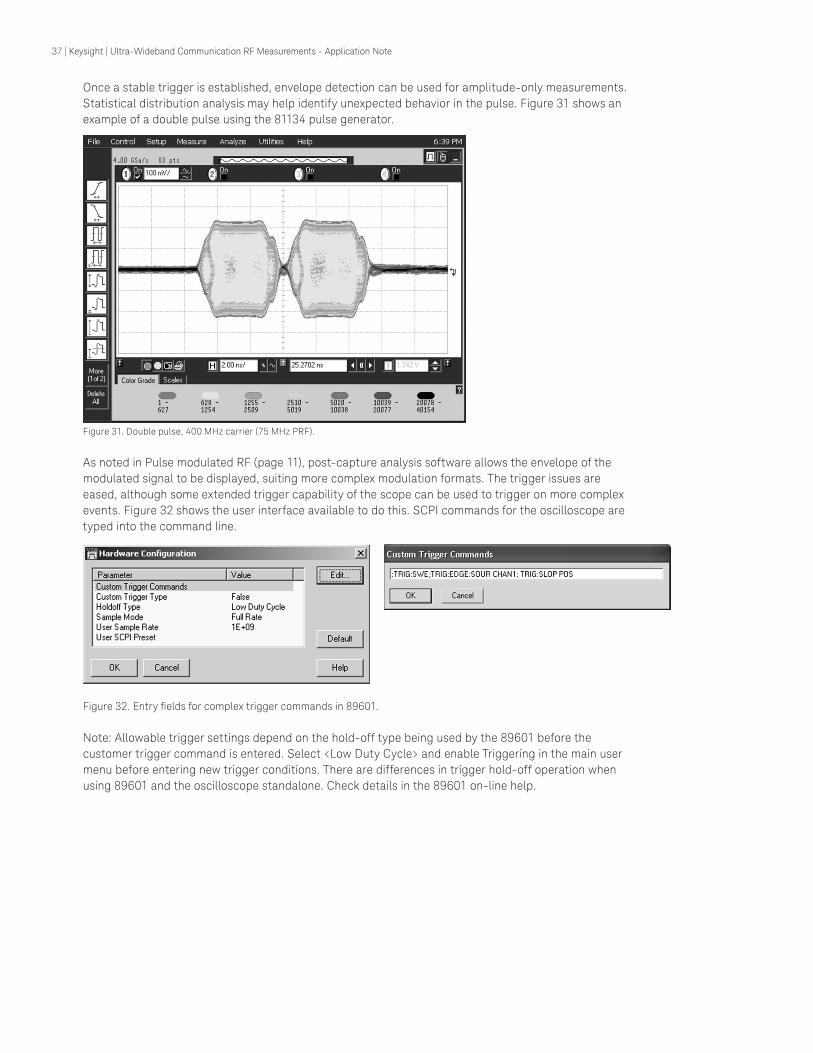
Once a stable trigger is established, envelope detection can be used for amplitude-only measurements. Statistical distribution analysis may help identify unexpected behavior in the pulse. Figure 31 shows an example of a double pulse using the 81134 pulse generator.
Figure 31. Double pulse, 400 MHz carrier (75 MHz PRF).
As noted in Pulse modulated RF (page 11), post-capture analysis software allows the envelope of the modulated signal to be displayed, suiting more complex modulation formats. The trigger issues are eased, although some extended trigger capability of the scope can be used to trigger on more complex events. Figure 32 shows the user interface available to do this. SCPI commands for the oscilloscope are typed into the command line.
Figure 32. Entry fields for complex trigger commands in 89601.
Note: Allowable trigger settings depend on the hold-off type being used by the 89601 before the customer trigger command is entered. Select <Low Duty Cycle> and enable Triggering in the main user menu before entering new trigger conditions. There are differences in trigger hold-off operation when using 89601 and the oscilloscope standalone. Check details in the 89601 on-line help.

38 | Keysight | Ultra-Wideband Communication RF Measurements - Application Note
Triggering on MAC data frame and MB-OFDM symbols for spectrum measurements
The spectrum of any modulated RF signal changes with time. In many burst-based radio systems there are specific events, such as the preamble, which have quite different spectral characteristics to the data content. As shown in Figure 33, there are a multitude of different timing intervals from which to select. In WLAN, some of these can be measured using a conventional spectrum analyzer and time-gating; with UWB they are likely to be too short but some experiments may be done. Measuring such specific events requires the use of a trigger signal. Many spectrum analyzers already generate this internally using envelope detection. It may be wideband in the same way a power sensor is wideband, but it is the video bandwidth of the trigger circuit that determines how fast a pulse can be reliably triggering. Trigger options vary with the model of spectrum analyzer. Refer to the spectrum analyzer block diagram in Figure 44 to consider what trigger signals may be available.
Interframe spacing[IFS] - variable length
MAC frame [variable length]
MB-OFDM symbol periods
Signal envelopeduring each symbol
Inter symbol drop-out
Figure 33. Timing intervals and dropouts in signal envelope for MB-OFDM.
An RF frame is typically 200 to 1000 µs long, with a highly variable inter-frame spacing. In MB-OFDM, each symbol is 312.5 ns long, transmitted on a different frequency at a rate of 457 kHz or 1.066 MHz. The envelope trigger bandwidth of the ESA/PSA spectrum analyzers is fast enough for these signals, but not individual pulses. An oscilloscope combined with 89601 software should be used for pulse spectrum diagnostics.
Frequency selective triggering has historically been achieved using the video trigger. In UWB testing a problem can apparently arise because signal path switching means the video trigger is available when the peak detector is used, but may not be when using the average detector. In practice, the swept analyzer’s peak detector is likely to be sufficient for this kind of diagnostic analysis.
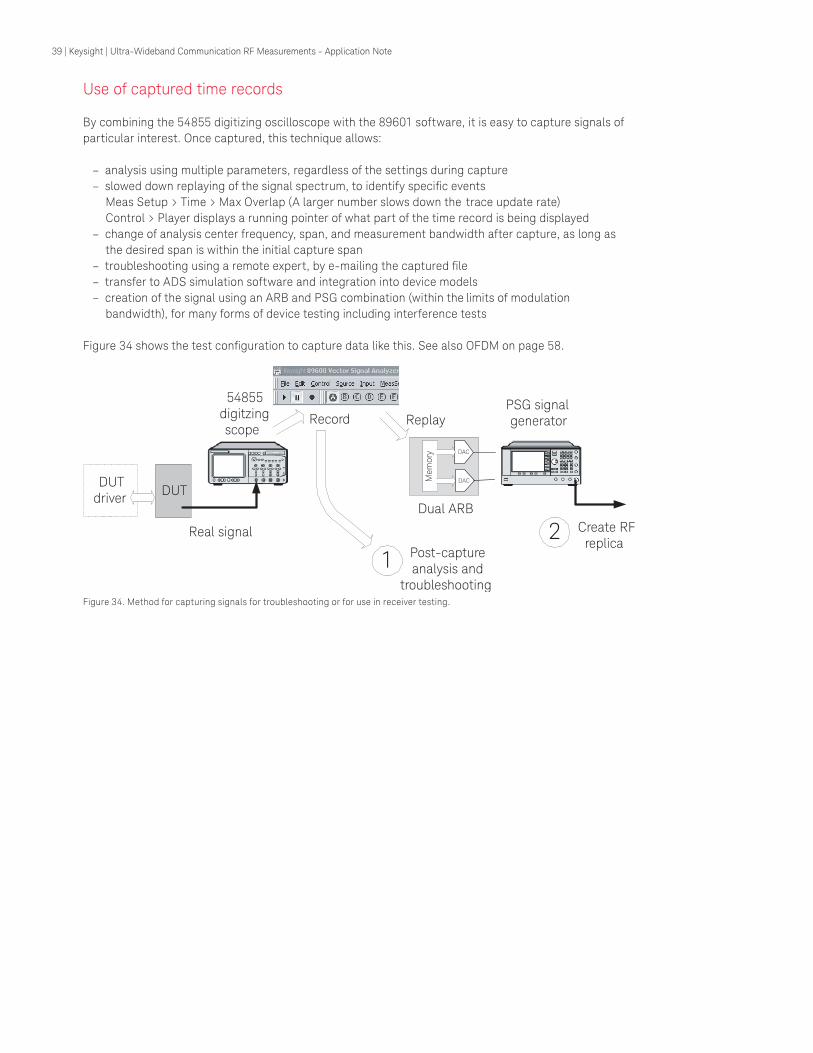
39 | Keysight | Ultra-Wideband Communication RF Measurements - Application Note
Use of captured time records
By combining the 54855 digitizing oscilloscope with the 89601 software, it is easy to capture signals of particular interest. Once captured, this technique allows:
– analysis using multiple parameters, regardless of the settings during capture – slowed down replaying of the signal spectrum, to identify specific events
Meas Setup > Time > Max Overlap (A larger number slows down the trace update rate) Control > Player displays a running pointer of what part of the time record is being displayed
– change of analysis center frequency, span, and measurement bandwidth after capture, as long as the desired span is within the initial capture span
– troubleshooting using a remote expert, by e-mailing the captured file – transfer to ADS simulation software and integration into device models – creation of the signal using an ARB and PSG combination (within the limits of modulation
bandwidth), for many forms of device testing including interference tests
Figure 34 shows the test configuration to capture data like this. See also OFDM on page 58.
DUTdriver DUT
Record
Real signal
PSG signalgenerator
Create RFreplica
Replay
Dual ARB
54855digitzingscope
Post-captureanalysis and
troubleshooting
12
DAC
DACMem
ory
Keysight
Figure 34. Method for capturing signals for troubleshooting or for use in receiver testing.

40 | Keysight | Ultra-Wideband Communication RF Measurements - Application Note
Test modes
Test modes are invariably used during prototyping stages of a design. They are designed to allow verification of isolated system components without requiring the whole radio to work, and may be needed for certification testing. Modified versions of these tests may also be used to manufacture sub-system components.
Some standards incorporate over-the-air test modes, such as signal loopback, to ease type conformance testing, and receiver testing in particular. While test modes are an additional development task, they significantly ease the path of a radio from R&D through to integration in the host device and manufacture.
At the time of writing, no standardized interfaces have been defined for the UWB radios under discussion. Table 7 has been included to indicate what functions have proved useful historically in design evaluation. A number of transmitter test functions are usually mandatory to confirm the DUT meets spectrum regulatory requirements.
For device testing, even simpler test signals may be used, for example selecting specific groups of sub-carriers in OFDM-based systems.
IEEE 802.11 WLAN receiver testing has not been standardized because no test mode was defined. Even without a loopback mechanism, UWB testing will be made more straightforward if the DUT is made to respond with an ACK packet to a properly configured, but isolated, test packet. The payload should be chosen to be easily generated, such as a repeating PN sequence with a “0” seed.
Table 7. Basic test mode functions.
Test function Device control Notes
Transmitter
Output power Transmit power control
Bursting on/off
Hopping off (where applicable)
Max power used for regulatory test. Simple transmitter test using a power meter. Generally tests are best carried out with bursting on.Allows in-band spectrum mask testing
Spectrum characteristics PN9, 15 data sequences Whitens signal. Use value of 0 as the seed, for repeatable results
Modulation characteristics Defined bit patterns, 0, 1, 01,10, PN9, PN15Scrambling/Encryption on/off
Allows identification of specific issues
Reduces reading to reading variations of spectrum and EVM
Receiver
Sensitivity/Interference testing Hopping off (where use)
Ack packets on/off
The DUT should be able to recover arbitrary packets, or define required payload.Ack packets can give a simply way of externally checking PER. Switch them off to increase test speed

41 | Keysight | Ultra-Wideband Communication RF Measurements - Application Note
Power
All the power measurements described here are affected by the loss and impedance mismatches of cables and other RF components used in the measurement set-up. It is important to use parts suitable for the frequency range. Even what looks like an SMA power divider may only be a Tee Piece.
The simplest, and most accurate, way to record the true average power of any signal is to use a power meter with a thermal sensor. For IEEE 802.15.3a radios, the result will be in the region of –10 to –3 dBm. The drawback is that it tells you very little about the characteristics of the signal against time and against frequency, which is what is important for an underlay technology.
Distinguish between RF bandwidth and video (demodulated) bandwidth
The RF measurement bandwidth is not the same as the video (demodulated) bandwidth. Depending on the signal’s timing characteristics, a peak power meter can be used to show the response against time, but again not against frequency. A wideband digitizer (oscilloscope) can give both. There may be some differences in the measurement results compared to a swept spectrum analyzer due to the way the signal is detected. Table 8 summarizes the options to measure different characteristics.
Table 8. Equipment choices for measuring UWB signal power characteristics.
Time response
Frequency response
PSD test True peak and CCDF
Spurious signals
Basic power measurementaccuracy
Power meter with thermal sensor
No No No No No Excellent
Power meter with peak detector
Basic Basic No No No Very good
Swept spectrumanalyzer (average detector needed)
No Yes Yes No Yes Good
Oscilloscope andmeasurement software
Yes
Instantaneousbandwidth ofsignal shown
Yes Yes No Good
Power spectral density, average detection
Power spectrum density (PSD), is the main regulatory performance test for an UWB transmitter. It measures the power within a narrow portion of the spectrum. PSD can be measured in an arbitrary bandwidth. It is often scaled to dBm/Hz even though the measurement bandwidth is not 1 Hz. If the measurement bandwidth is narrow however, measurements take longer. If it is too wide, the measurement may not identify unwanted peaks in the spectral response.
In the United States, FCC document 02-48, (CFR Part 15, August 2003, Appendix F), requires measurement of the 1 ms time-averaged PSD of an UWB transmitter in a 1 MHz bandwidth, and an assessment of the peak power in a 3 MHz bandwidth. Both measurements anticipate the use of a swept spectrum analyzer. By ensuring the PSD of the DUT does not exceed a pre-defined maximum value across the permitted frequency band, an upper limit is set on the signal-interferer ratio seen by another receiver operating within the UWB frequency band. A different test safeguards those devices operating at other frequencies. Graphically, a PSD measurement looks like a spectrum plot.

42 | Keysight | Ultra-Wideband Communication RF Measurements - Application Note
Spectrum flatness determines total transmit power
Working with a limit value that applies to the whole usable frequency range, the designer has to ensure the transmitter generates as flat a frequency response as possible. This gives maximum total power, and therefore the optimum transmission range for the user.
The example in Figure 35 is of a poor noise modulated signal suffering both from LO feed-through, and amplitude unflatness. The output power in the signal would have to be reduced to allow the DUT to pass the PSD test.
Carrier leakage spur
Unflatness inresponse
(due to mixer)
Figure 35. An example of poor PSD flatness.
Sweep time
For regulatory tests, the sweep is not triggered by any part of the data structure with a packet. A measurement interval of 1 ms determines the sweep time. The signal should be within any given 1 MHz portion of the span for 1 ms. This substantially removes the effect of modulation artifacts, and, when present, rapid frequency switching. For a 1.5 GHz span, the sweep should be 1.5 s.
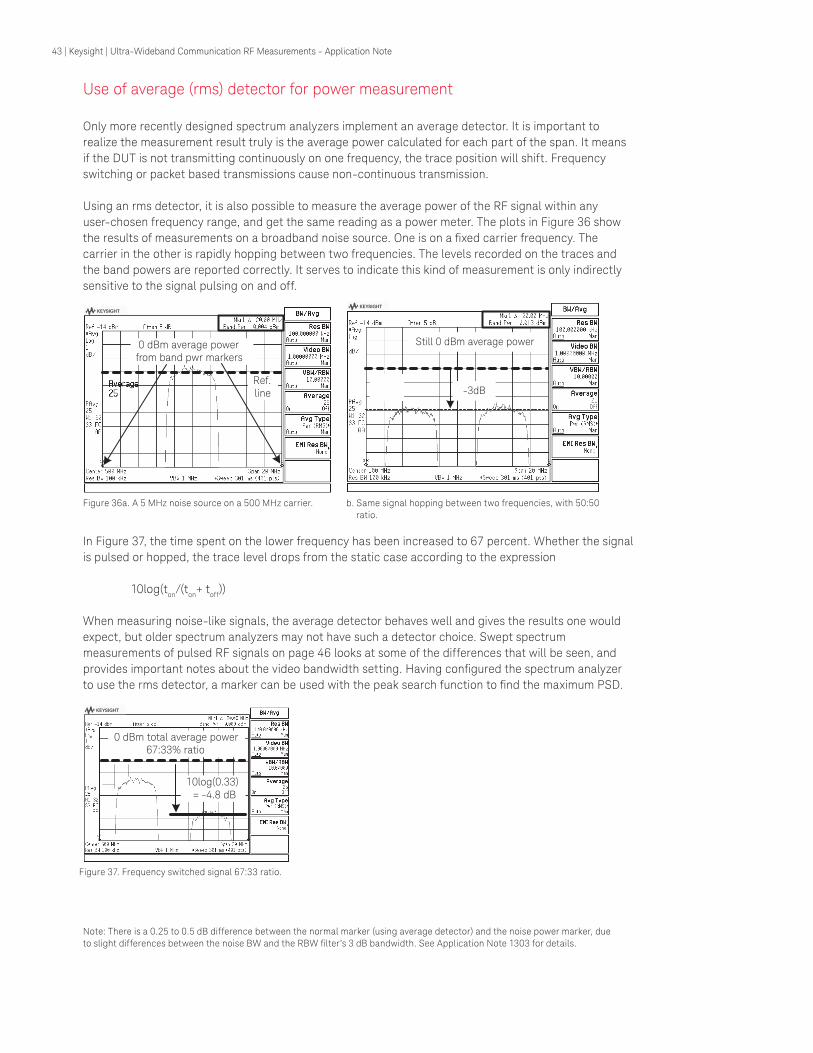
43 | Keysight | Ultra-Wideband Communication RF Measurements - Application Note
Use of average (rms) detector for power measurement
Only more recently designed spectrum analyzers implement an average detector. It is important to realize the measurement result truly is the average power calculated for each part of the span. It means if the DUT is not transmitting continuously on one frequency, the trace position will shift. Frequency switching or packet based transmissions cause non-continuous transmission.
Using an rms detector, it is also possible to measure the average power of the RF signal within any user-chosen frequency range, and get the same reading as a power meter. The plots in Figure 36 show the results of measurements on a broadband noise source. One is on a fixed carrier frequency. The carrier in the other is rapidly hopping between two frequencies. The levels recorded on the traces and the band powers are reported correctly. It serves to indicate this kind of measurement is only indirectly sensitive to the signal pulsing on and off.
0 dBm average powerfrom band pwr markers
Ref.line
In Figure 37, the time spent on the lower frequency has been increased to 67 percent. Whether the signal is pulsed or hopped, the trace level drops from the static case according to the expression 10log(ton/(ton+ toff))
When measuring noise-like signals, the average detector behaves well and gives the results one would expect, but older spectrum analyzers may not have such a detector choice. Swept spectrum measurements of pulsed RF signals on page 46 looks at some of the differences that will be seen, and provides important notes about the video bandwidth setting. Having configured the spectrum analyzer to use the rms detector, a marker can be used with the peak search function to find the maximum PSD.
10log(0.33)= -4.8 dB
0 dBm total average power67:33% ratio
Note: There is a 0.25 to 0.5 dB difference between the normal marker (using average detector) and the noise power marker, due to slight differences between the noise BW and the RBW filter’s 3 dB bandwidth. See Application Note 1303 for details.
Still 0 dBm average power
-3dB
Figure 36a. A 5 MHz noise source on a 500 MHz carrier. b. Same signal hopping between two frequencies, with 50:50 ratio.
Figure 37. Frequency switched signal 67:33 ratio.
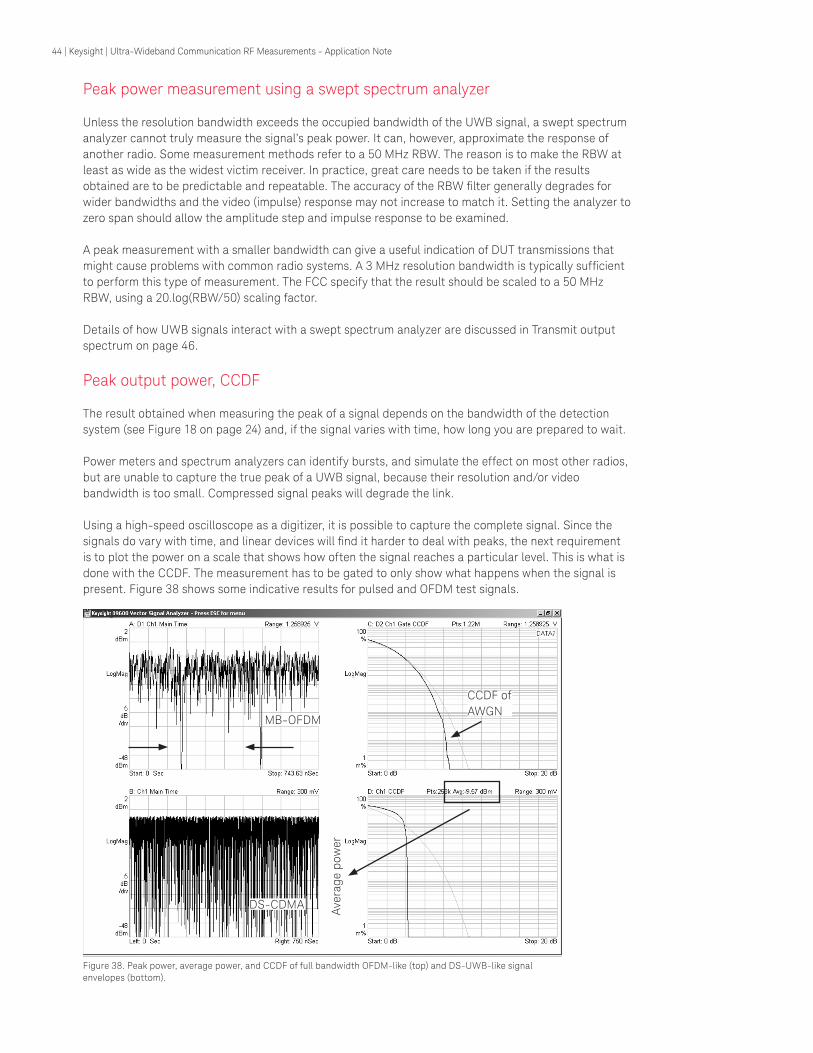
44 | Keysight | Ultra-Wideband Communication RF Measurements - Application Note
Figure 38. Peak power, average power, and CCDF of full bandwidth OFDM-like (top) and DS-UWB-like signal envelopes (bottom).
Peak power measurement using a swept spectrum analyzer
Unless the resolution bandwidth exceeds the occupied bandwidth of the UWB signal, a swept spectrum analyzer cannot truly measure the signal’s peak power. It can, however, approximate the response of another radio. Some measurement methods refer to a 50 MHz RBW. The reason is to make the RBW at least as wide as the widest victim receiver. In practice, great care needs to be taken if the results obtained are to be predictable and repeatable. The accuracy of the RBW filter generally degrades for wider bandwidths and the video (impulse) response may not increase to match it. Setting the analyzer to zero span should allow the amplitude step and impulse response to be examined.
A peak measurement with a smaller bandwidth can give a useful indication of DUT transmissions that might cause problems with common radio systems. A 3 MHz resolution bandwidth is typically sufficient to perform this type of measurement. The FCC specify that the result should be scaled to a 50 MHz RBW, using a 20.log(RBW/50) scaling factor.
Details of how UWB signals interact with a swept spectrum analyzer are discussed in Transmit output spectrum on page 46.
Peak output power, CCDF
The result obtained when measuring the peak of a signal depends on the bandwidth of the detection system (see Figure 18 on page 24) and, if the signal varies with time, how long you are prepared to wait.
Power meters and spectrum analyzers can identify bursts, and simulate the effect on most other radios, but are unable to capture the true peak of a UWB signal, because their resolution and/or video bandwidth is too small. Compressed signal peaks will degrade the link.
Using a high-speed oscilloscope as a digitizer, it is possible to capture the complete signal. Since the signals do vary with time, and linear devices will find it harder to deal with peaks, the next requirement is to plot the power on a scale that shows how often the signal reaches a particular level. This is what is done with the CCDF. The measurement has to be gated to only show what happens when the signal is present. Figure 38 shows some indicative results for pulsed and OFDM test signals.
MB-OFDM
CCDF ofAWGN
DS-CDMA Ave
rage
pow
er

45 | Keysight | Ultra-Wideband Communication RF Measurements - Application Note
Baseband versus envelope (zoom) CCDF
Traditionally, the CCDF curve plots the power distribution of the demodulated envelope of the signal. Using an oscilloscope as the input device, it is possible to see the baseband CCDF too. It is not the same. The difference is due to the number of degrees of freedom in the amplitude distribution of the signal.
As an example, to help visualize why the plots are different, a 50 percent AM signal is shown in Figure 39. The demodulated waveform is on the left side. The lower plots show the amplitude probability density function, which is closest to the waveform seen on an oscilloscope. In qualitative terms, the broader shape of the modulated signal in the lower right corresponds to the wider range of voltage excursions, and the wider peak-average power in shown in the CCDF plot. For background information on CCDF plots, refer to http://www.educatorscorner.com/media/AN_5968-6875E.pdf.
CCDF of demodulatedsinewave with DC offset
Envelope Baseband
CCDF of the full ammodulated carrier
Peaks associated withsinewave signal
Wider skirts due to more complexamplitude distribution of the carrier
and its modulating sinewave
Figure 39. Envelope and baseband CCDFs of a 50 percent AM waveform.
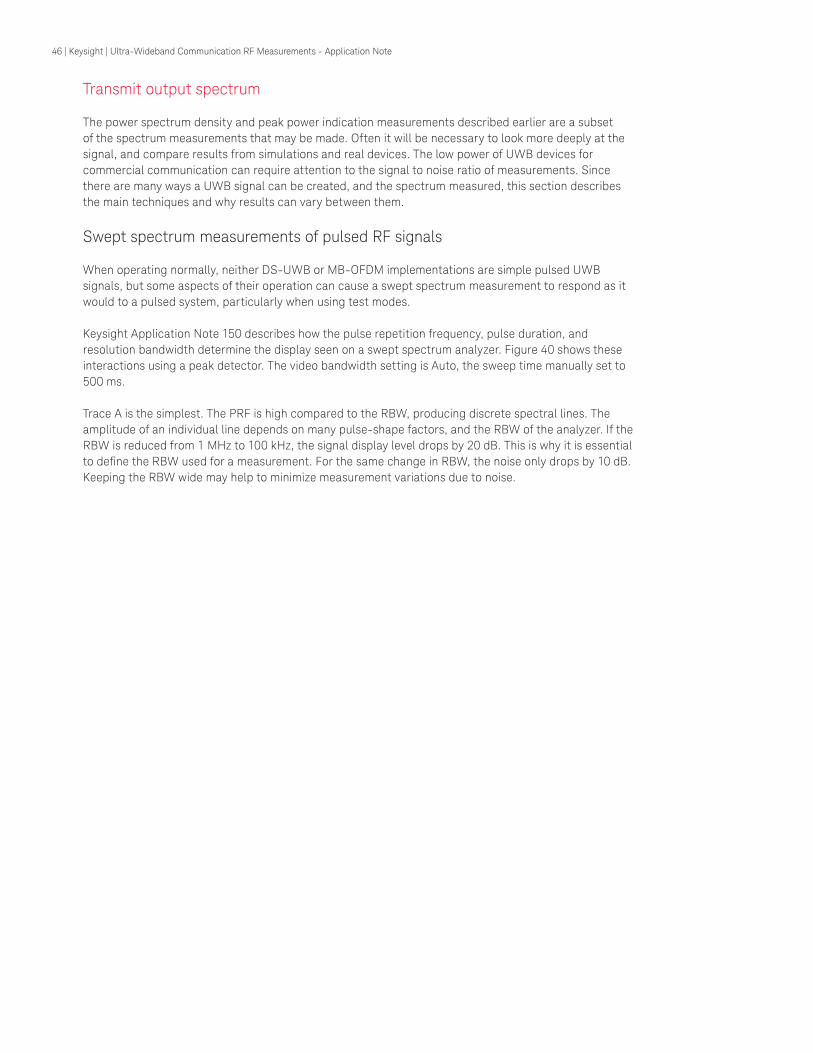
46 | Keysight | Ultra-Wideband Communication RF Measurements - Application Note
Transmit output spectrum
The power spectrum density and peak power indication measurements described earlier are a subset of the spectrum measurements that may be made. Often it will be necessary to look more deeply at the signal, and compare results from simulations and real devices. The low power of UWB devices for commercial communication can require attention to the signal to noise ratio of measurements. Since there are many ways a UWB signal can be created, and the spectrum measured, this section describes the main techniques and why results can vary between them.
Swept spectrum measurements of pulsed RF signals
When operating normally, neither DS-UWB or MB-OFDM implementations are simple pulsed UWB signals, but some aspects of their operation can cause a swept spectrum measurement to respond as it would to a pulsed system, particularly when using test modes.
Keysight Application Note 150 describes how the pulse repetition frequency, pulse duration, and resolution bandwidth determine the display seen on a swept spectrum analyzer. Figure 40 shows these interactions using a peak detector. The video bandwidth setting is Auto, the sweep time manually set to 500 ms.
Trace A is the simplest. The PRF is high compared to the RBW, producing discrete spectral lines. The amplitude of an individual line depends on many pulse-shape factors, and the RBW of the analyzer. If the RBW is reduced from 1 MHz to 100 kHz, the signal display level drops by 20 dB. This is why it is essential to define the RBW used for a measurement. For the same change in RBW, the noise only drops by 10 dB. Keeping the RBW wide may help to minimize measurement variations due to noise.
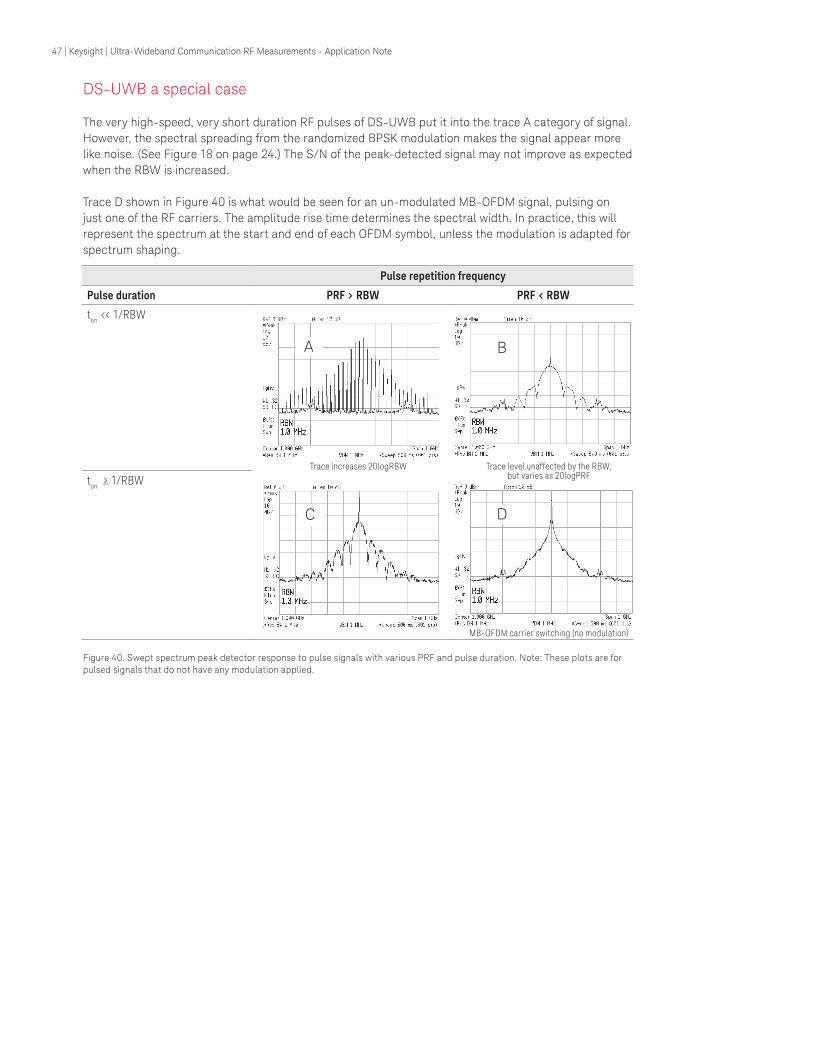
47 | Keysight | Ultra-Wideband Communication RF Measurements - Application Note
DS-UWB a special case The very high-speed, very short duration RF pulses of DS-UWB put it into the trace A category of signal. However, the spectral spreading from the randomized BPSK modulation makes the signal appear more like noise. (See Figure 18 on page 24.) The S/N of the peak-detected signal may not improve as expected when the RBW is increased.
Trace D shown in Figure 40 is what would be seen for an un-modulated MB-OFDM signal, pulsing on just one of the RF carriers. The amplitude rise time determines the spectral width. In practice, this will represent the spectrum at the start and end of each OFDM symbol, unless the modulation is adapted for spectrum shaping.
Figure 40. Swept spectrum peak detector response to pulse signals with various PRF and pulse duration. Note: These plots are for pulsed signals that do not have any modulation applied.
A
DC
B
Pulse repetition frequency
Pulse duration PRF > RBW PRF < RBW
ton << 1/RBW
ton ≥ 1/RBWTrace increases 20logRBW Trace level unaffected by the RBW,
but varies as 20logPRF
MB-OFDM carrier switching (no modulation)

48 | Keysight | Ultra-Wideband Communication RF Measurements - Application Note
Pulse de-sensitization
This term dates back to the first RADAR spectrum measurements. Some people find it misleading, because it has nothing to do with compression in the spectrum analyzer. It refers to the effects shown in Figure 40, when the display results do not directly reflect the actual signal power.
Effect of increasing the resolution bandwidth on display level As noted, if the pulse duration of a repetitive signal is much less than 1/RBW, increasing the RBW increases the detected signal level. Figure 41 plots the transition between trace A and B in Figure 40.
Figure 41. Effect of changing RBW using peak detector with pulsed RF signal (ton<<1/RBW).
Peak and average detection of UWB signals
The transmission of a UWB device for communication should be noise-like. That is what allows it to be an underlay technology. In practice, real transmitters will produce unwanted, discrete spurious signals. The average detector, which is useful for noise-like signals, may not show the fixed spurious components at the expected level.
The test configuration is that shown in Figure 6 on page 11. The PRF and RBW have been chosen to highlight the differences between spectrum displays using peak and average detection. It is an extreme example.
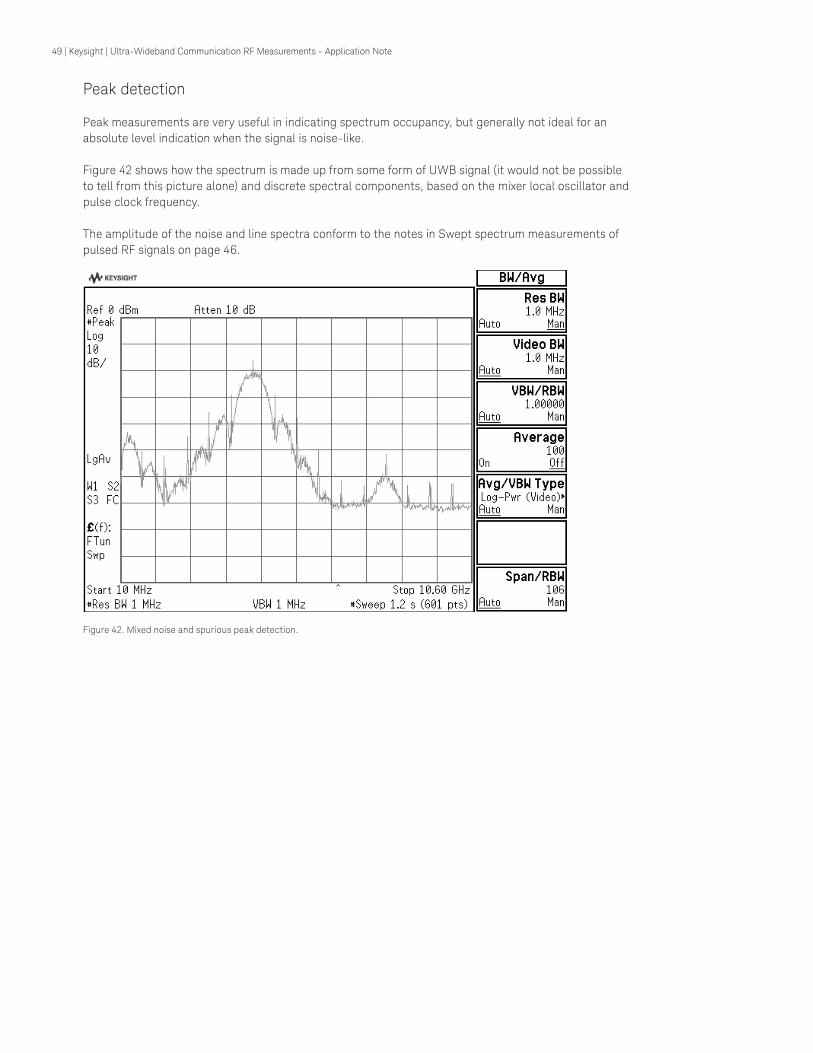
49 | Keysight | Ultra-Wideband Communication RF Measurements - Application Note
Peak detection
Peak measurements are very useful in indicating spectrum occupancy, but generally not ideal for an absolute level indication when the signal is noise-like.
Figure 42 shows how the spectrum is made up from some form of UWB signal (it would not be possible to tell from this picture alone) and discrete spectral components, based on the mixer local oscillator and pulse clock frequency.
The amplitude of the noise and line spectra conform to the notes in Swept spectrum measurements of pulsed RF signals on page 46.
Figure 42. Mixed noise and spurious peak detection.

50 | Keysight | Ultra-Wideband Communication RF Measurements - Application Note
Average detection
Figure 43 shows the average detector response measuring the same signal. The spectrum shape is now correctly displayed, and the band power function allows the total signal power to be easily measured. Some spurious signals are evident, but their level is noticeably reduced from the trace using a peak detector. The result is not wrong, but simply shows the true average of the signal while the frequency is being swept. The average result depends both on any time variation in the test signal, and the ratio of frequency span to the number of display points (buckets). If the RBW is small compared to the width of a bucket frequency span, a fixed frequency component will only be detected for a fraction of the time corresponding to a specific display point. Increasing the number of display points reduces this effect. If RBW > Freq Span / 2*Display Points, the result will only depend on the time variation of the signal.
Figure 43. Mixed noise and spurious average detection.
Average detector settings [PSA]
In the PSA, there are three choices for how the average is calculated. These suit different types of signal. The rms setting should be used to measure UWB signals.
Normal detector [PSA]
This is similar to the peak detector, but fills in more of the display to make the result look like a purely analog spectrum analyzer. It is recommended that the peak detector be used instead of the normal detector for UWB.

51 | Keysight | Ultra-Wideband Communication RF Measurements - Application Note
Mixed detector display
A simultaneous display addresses the need to see both signal responses together. Figure 44 is from an enhanced display from the PSA spectrum analyzer family.
Figure 44. Dual detector trace, showing a 660 MHz PRBS amplitude modulated signal with unwanted spurious components.
The test configuration used for Figure 44 was that of Figure 6 on page 11. The 800 ps rise time of the 81132A pulse generator used for the measurement determines the spectrum width seen in this display.
Pulse generator settings
Channel 1 of the pulse generator is used as the clock for the PRBS sequence defined in Channel 2. The configuration for this test was:
Clear existing settings: Shift > Store > 0 Levels: Ch1 > High 450mV > Low –22mV > On > Ch2 > OffMode/Trg: Continuous > Pattern of > PRBS > 2E15-1 > Pulses Out 1 > NRZ > Out 2 > RZTiming: Ch 1> Frequency > 660MHz > Lead Edge > 0.8nsPattern: Segment > Length > 4096
Spectrum analyzer settings
The UWB spectrum mask test is reached using:Mode Setup > Radio Standard > UWB > UWB Indoor
The default settings can be adjusted to suit specific test needs by modifying the range tables:Measure > Spurious Emissions > Meas Setup > Range Table
The resolution bandwidth settings are the same for both traces in Figure 44. It is possible to run sequenced tests with different settings using the ranges in the spurious measurement. Preferred settings may then be saved using File < Save < State.
52 | Keysight | Ultra-Wideband Communication RF Measurements - Application Note
Comparing FFT-based and swept spectrum results
Swept spectrum analyzers are very commonly used in practice, because the dynamic range of the signals they can measure is far larger than that obtained using a digitizing scope. The measurement frequency range can easily exceed the UWB requirements, but because it is swept, it only views part of the spectrum at any instant in time.
In simulations, and when using a time record from a digitizing oscilloscope, the spectrum will be generated using an FFT. It can be the most informative view of the spectrum, but often looks different to the spectrum seen on a conventional swept spectrum analyzer.
The factors affecting what is displayed are – the bandwidth and shape of the resolution bandwidth filter – the amount of time data is collected for each frequency display point – the point in time (during the frame) when the signal is sampled – the way the signal is detected
Table 9. Spectrum measurement characteristics used in different tools.
Measurementtool
Keysight example
FiltersResolution bandwidth/Windowing
Video bandwidth
Detector type
Peak Avg
Conventional swept analyzer
ESA Gaussian/Synchronously tunedGaussian approximationFFT (used for low RBW)
Selectable.Set VBW > RBWwhen using average to avoid log detector errors
Yes Yes
Digital swept analyzer
PSA Gaussian Gaussian approximationFFT
Selectable. Appliesdisplay averagingwith average detector
Yes Yes
Wideband oscilloscope
54855 Flat topHanningimpulse (uniform)
Display averaging No(max hold)
Yes
Post capture processing software
89601 Gaussianflat topHanninguniform: Not suitable for spectrum analysis
Display averaging No(max hold)
Yes
Gaussian filter, average detector
Table 9 shows the variety of possibilities, not including simulation tools. Selecting a Gaussian filter is the first step to getting the same results. Note also from Table 9 that FFT-based solutions do not generally emulate the peak detection function in a swept analyzer. This document will consider average detection only.
With an FFT, the amount of time data used for a particular RBW is determined by
RBW = ENBW/T
where: ENBW = normalized, equivalent noise bandwidth (2.2 Hz-sec for Gaussian1) RBW = the resolution bandwidth T = the time-record length
An FFT spectrum is a time-gated view of the signal. For a 1 MHz RBW, only 2.2 μs of data is required. As seen earlier, in Figure 11 on page 14, the spectrum changes shape dramatically over time, so the result depends on when the FFT is triggered.

53 | Keysight | Ultra-Wideband Communication RF Measurements - Application Note
The physical components in a swept analyzer strongly influence the measurements that are available, and these vary from one design to another. Figure 45 shows the main system components, including RF path switching, low noise amplification, triggering options, and signal detection.
Figure 45. Block diagram of a swept spectrum analyzer. Like any tuned receiver, the local oscillator is tuned to select specific frequencies. The output of the signal mixer is fed to either analog or digital processing. In this diagram, the switching path for frequencies above 3 GHz is also shown.
The rate the swept spectrum analyzer tunes over the chosen frequency span (sweep speed), determines how much time data is used to represent the spectrum at a specific frequency. The fastest sweep speed is set by the time response of the RBW filter.
Sweep time = 2*span/RBW2
For a 1 MHz RBW, this gives a sweep rate of 500 GHz per second. This means a 2 GHz span will take 4 ms. If the display is divided into 401 points, each display point will show the combined effect of the spectrum at that point over 10 μs.
This is five times as long as the FFT would require, and implies more averaging is taking place. The regulatory requirements may require much longer measurement periods, such as 1 ms per display point. The overall effect is that a lot of somewhat hidden averaging takes place in the swept spectrumtrace.
Getting the FFT view to look like a swept analyzer
The main need is to ensure a similar amount of averaging takes place and that any unintended gating effects are taken into account, especially if spectrally-unusual events like the preamble of inter-symbol ramping are included. The response of a peak detector can be approximated using a MaxHold function based on multiple FFT results.
Practical effects, such as the exact processing used in real instruments mean considerable care will be needed to achieve better than 2 dB matching between results. A cross-reference using a defined modulation pattern can be used to test the results.
Note: The PSA series use special techniques to increase the sweep rate by a factor of ~2.
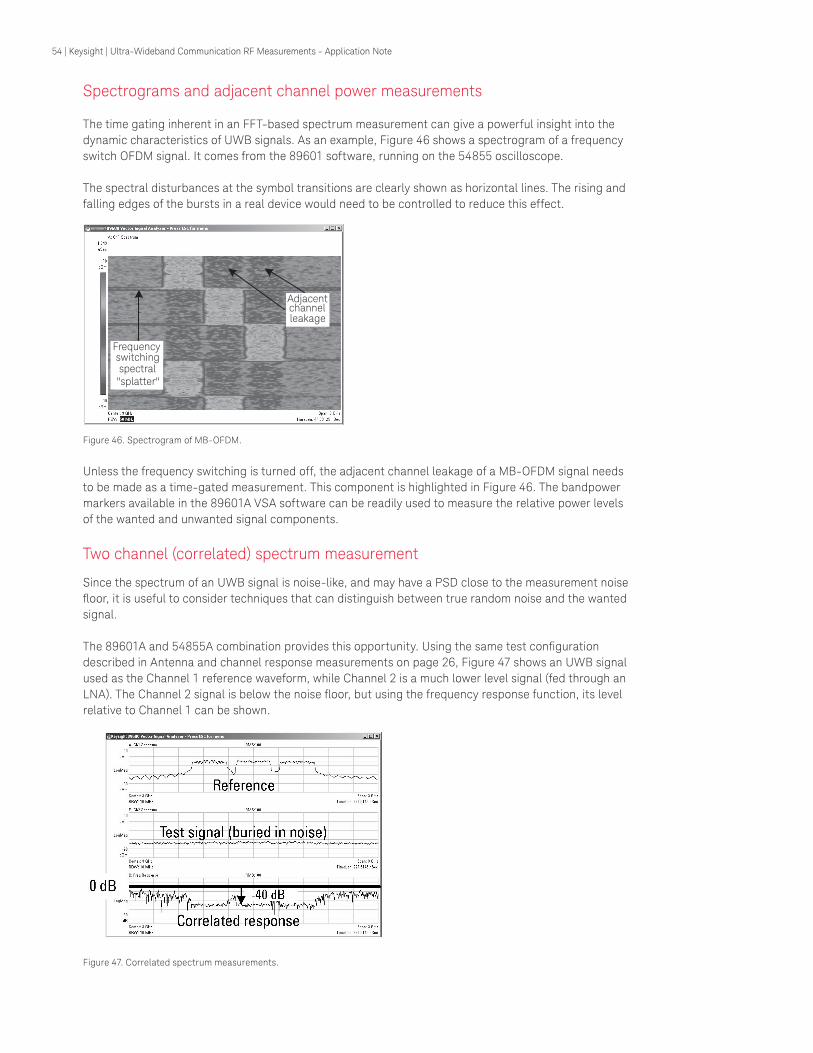
54 | Keysight | Ultra-Wideband Communication RF Measurements - Application Note
Spectrograms and adjacent channel power measurements
The time gating inherent in an FFT-based spectrum measurement can give a powerful insight into the dynamic characteristics of UWB signals. As an example, Figure 46 shows a spectrogram of a frequency switch OFDM signal. It comes from the 89601 software, running on the 54855 oscilloscope.
The spectral disturbances at the symbol transitions are clearly shown as horizontal lines. The rising and falling edges of the bursts in a real device would need to be controlled to reduce this effect.
Adjacentchannelleakage
Frequencyswitchingspectral"splatter"
Figure 46. Spectrogram of MB-OFDM.
Unless the frequency switching is turned off, the adjacent channel leakage of a MB-OFDM signal needs to be made as a time-gated measurement. This component is highlighted in Figure 46. The bandpower markers available in the 89601A VSA software can be readily used to measure the relative power levels of the wanted and unwanted signal components.
Two channel (correlated) spectrum measurement
Since the spectrum of an UWB signal is noise-like, and may have a PSD close to the measurement noise floor, it is useful to consider techniques that can distinguish between true random noise and the wanted signal.
The 89601A and 54855A combination provides this opportunity. Using the same test configuration described in Antenna and channel response measurements on page 26, Figure 47 shows an UWB signal used as the Channel 1 reference waveform, while Channel 2 is a much lower level signal (fed through an LNA). The Channel 2 signal is below the noise floor, but using the frequency response function, its level relative to Channel 1 can be shown.
Figure 47. Correlated spectrum measurements.

55 | Keysight | Ultra-Wideband Communication RF Measurements - Application Note
Spectrum mask testing
Measurement of the RF spectrum generated by a transmitter addresses two questions:
– Will the DUT interfere with other radio receivers? – Will the DUT work effectively with another of the same type?
Spectrum masks specifications for interoperability have yet to be ratified, and only make sense for MB-OFDM. Preliminary information for MB-OFDM is –12 dBr with ±285 MHz offset from the carrier, and –20 dBr at ±330 MHz. The reference level is the maximum PSD within the range ±260 MHz of the center frequency. The detector type and sweep time have not been specified. If an average detector is used, the mask measurement may require either a time gated sweep, the DUT to be transmitting on a single frequency. The absolute signal level will drop according to the mark-space ratio of the signal.
Out-of-band emission masks are currently only defined for the United States. Those for indoor and outdoor devices are shown in Figure 48. The resolution bandwidth may be changed depending on the frequency range being tested. The notes in the differences between peak and average detectors should be read prior to making these measurements.
Below 1 GHz, a different detector is used, known as quasi-peak. For further details on EMC measurements, refer to Application Note 1328.
Figure 48a. Indoor FCC and proposed ETSI spectrum masks. Figure 48b. Outdoor FCC spectrum mask.
UWB emission limit for outdoor hand-held systems

56 | Keysight | Ultra-Wideband Communication RF Measurements - Application Note
Modulation tests
Baseband pulsed
Baseband signals may be measured using the time-domain tools available within a digital oscilloscope. Features that may be useful include jitter distribution and software clock recovery. Figure 49 shows examples of these capabilities for the 54xxx family.
Pulse modulated RFFigure 8 on page 12 shows how the pulse shape of a modulated RF carrier may be displayed. It is possible to recover more information than just the shape of the pulse. Which parameters give meaningful results depend on the type of modulation. Figure 50 shows an example of a three-level BPSK signal. In this case the 0 state is not recovered correctly, but useful qualitative information can be seen that will allow the differentiation between clean and noisy signals. This plot shows the recovered baseband signal. The data behind this trace can be extracted and used for post processing. Use: File > Save > Trace.
Figure 50. Digital demodulation applied to three-state BPSK pulsed signal.
Figure 49a. Time domain jitter analysis. Figure 49b. Setup window for the software clock recovery application.
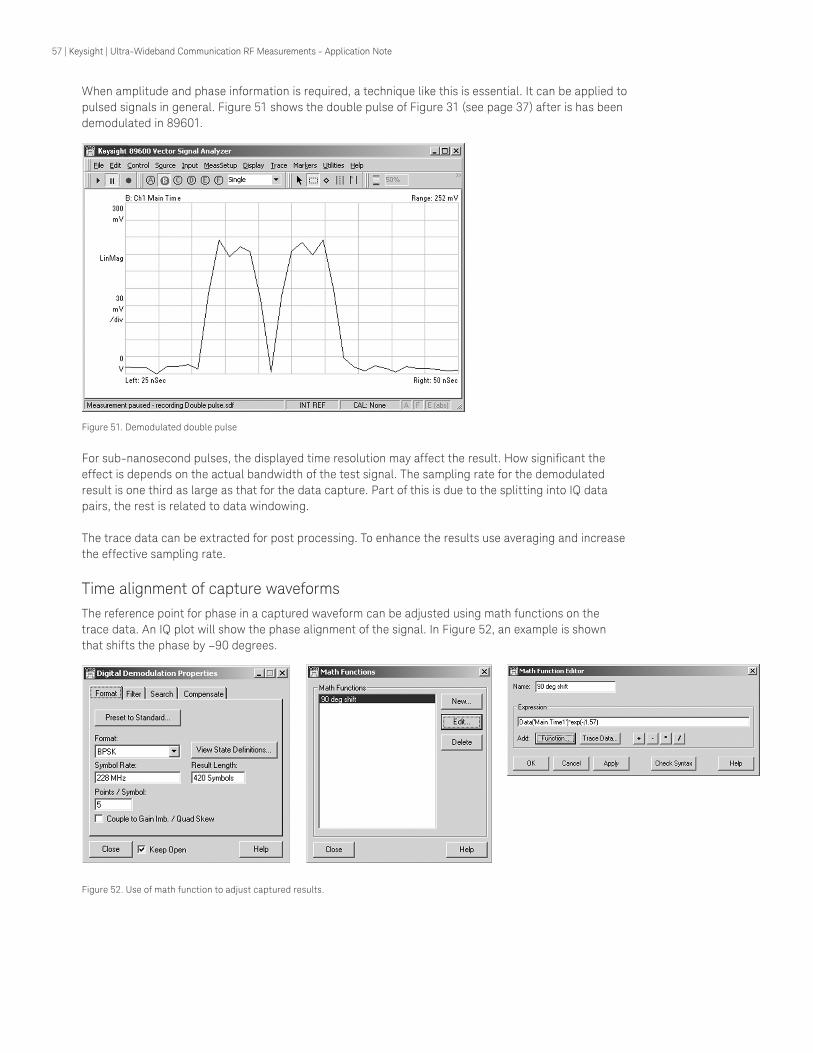
57 | Keysight | Ultra-Wideband Communication RF Measurements - Application Note
When amplitude and phase information is required, a technique like this is essential. It can be applied to pulsed signals in general. Figure 51 shows the double pulse of Figure 31 (see page 37) after is has been demodulated in 89601.
Figure 51. Demodulated double pulse
For sub-nanosecond pulses, the displayed time resolution may affect the result. How significant the effect is depends on the actual bandwidth of the test signal. The sampling rate for the demodulated result is one third as large as that for the data capture. Part of this is due to the splitting into IQ data pairs, the rest is related to data windowing.
The trace data can be extracted for post processing. To enhance the results use averaging and increase the effective sampling rate.
Time alignment of capture waveformsThe reference point for phase in a captured waveform can be adjusted using math functions on the trace data. An IQ plot will show the phase alignment of the signal. In Figure 52, an example is shown that shifts the phase by –90 degrees.
Figure 52. Use of math function to adjust captured results.

58 | Keysight | Ultra-Wideband Communication RF Measurements - Application Note
OFDMUltimately, a demodulation measurement of the adopted standard will provide the widest range of modulation performance indications. Prior to that being available, there are a number of characteristics that can be checked using existing tools. Some, such as delta EVM and CCDF have already been described.
Time based characteristics of a frequency-switched signal are shown in Figure 53. Figure 53a is a plot is of the un-modulated carrier. The plot in Figure 53b has modulation applied. Selecting Group Delay as the vertical parameter gives a frequency versus time trace.
The MB-OFDM implementation is incompatible with existing format-specific measurements and some valuable parametric results they show. Depending on the component being tested, it may be possible to use a over-clocked 802.11a signal as an alternative test signal. This allows characteristics such as settling, channel flatness, and pilot responses to be assessed. In Figure 54, an 802.11a signal is being shown running 32 times its normal rate. This means it occupies over 500 MHz of bandwidth.
Selecting MeasSetup > Demod Properties > Advanced allows the sub-carrier spacing to be increased to 10 MHz, making the x32 signal compatible with existing 89601 measurements.
Figure 53a. Frequency versus time results for frequency-switched RF Figure 53b. Spectrum versus time of modulated OFDM signal.carrier.
Figure 54. Measuring demod characteristics, including channel flatness, using a x32 time scaled 802.11a test waveform.

59 | Keysight | Ultra-Wideband Communication RF Measurements - Application Note
Extending the capture periodUsing the full sample rate of the oscilloscope to capture the entire RF signal restricts the measurement period, and increases the amount of data that has to be processed. Down-converting the RF signal to a lower frequency can be used to either extend the capture period, or introduce some over-sampling. Over-sampling tends to increase the dynamic range of the measurement because it allows wideband noise to be averaged out.
Figure 55. Down-conversion allows a lower sampling rate, and extended capture times.
In Figure 55, the ESG is set 500 MHz below the center frequency of the signal from the DUT. This gives 1 GHz of measurement bandwidth. To avoid aliasing, the DUT transmission needs to be filtered, or the measurement gated, if frequency components are present more than 500 MHz from the center.
Depending on the level of the errors in the down-conversion path, it may be possible to improve the measurement accuracy using normalization, or the equalization described in Antenna and channel response measurements on page 26.
This technique also eases triggering, by isolating individual symbol frequencies, but it does not accommodate multiple symbol measurements on a frequency hopping signal.
[4-20 GSa/s] Digitizing scope
Wideband mixer: Mini-circuits ZEM
4300, Marki M2-0006MA
or similar
Signal generator generates an LO of RF-500 MHz,
+7 dBm
DUT output
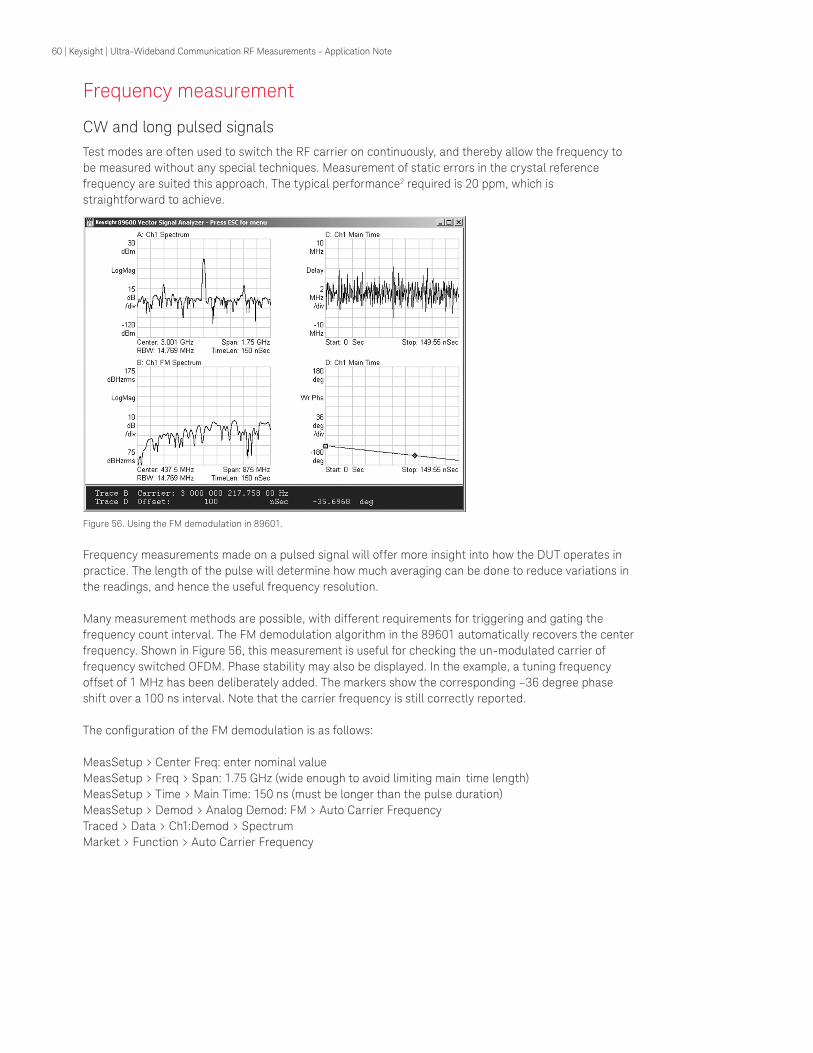
60 | Keysight | Ultra-Wideband Communication RF Measurements - Application Note
Frequency measurement
CW and long pulsed signalsTest modes are often used to switch the RF carrier on continuously, and thereby allow the frequency to be measured without any special techniques. Measurement of static errors in the crystal reference frequency are suited this approach. The typical performance2 required is 20 ppm, which is straightforward to achieve.
Figure 56. Using the FM demodulation in 89601.
Frequency measurements made on a pulsed signal will offer more insight into how the DUT operates in practice. The length of the pulse will determine how much averaging can be done to reduce variations in the readings, and hence the useful frequency resolution.
Many measurement methods are possible, with different requirements for triggering and gating the frequency count interval. The FM demodulation algorithm in the 89601 automatically recovers the center frequency. Shown in Figure 56, this measurement is useful for checking the un-modulated carrier of frequency switched OFDM. Phase stability may also be displayed. In the example, a tuning frequency offset of 1 MHz has been deliberately added. The markers show the corresponding –36 degree phase shift over a 100 ns interval. Note that the carrier frequency is still correctly reported.
The configuration of the FM demodulation is as follows:
MeasSetup > Center Freq: enter nominal valueMeasSetup > Freq > Span: 1.75 GHz (wide enough to avoid limiting main time length)MeasSetup > Time > Main Time: 150 ns (must be longer than the pulse duration)MeasSetup > Demod > Analog Demod: FM > Auto Carrier FrequencyTraced > Data > Ch1:Demod > SpectrumMarket > Function > Auto Carrier Frequency

61 | Keysight | Ultra-Wideband Communication RF Measurements - Application Note
OFDM modulated signalsThe measurement of a modulated OFDM signal requires preamble recovery. If the specific demod format is not available, an interim step is to scale the clocking rate of the DUT transmission to approximate an 802.11a signal. In the example shown in Figure 55 on page 58, it was multiplied by 32, to give a 10 MHz sub-carrier spacing. This will give a useful indicator of the DUT settling characteristics, such as the frequency perturbation caused by the transition in preamble sub-carriers, shown in the center trace. In Figure 57, the markers are coupled to make it easy to see where in the time record the frequency error occurs.
Figure 57. An 802.11a signal adapted to show preamble settling, by multiplying clock rate by 32.
Meas Setup > Demodulator > Wireless Networking: OFDMMeas Setup > Demod Properties > Advanced > Sub-carrier spacing: 10 MHzTrace > Data: Preamble Freq Error
Short pulsed signalsMeasuring the frequency error of a very narrow pulsed signal can be difficult because the gating period only encompasses a few RF cycles. It is made straightforward using a different technique, still using the 89601 software and the 54855 scope. The configuration adopts the same approach shown in Delta (additive) EVM on page 31. We assume the signal is BPSK and set the symbol rate to the pulse repetition frequency.
Figure 58 shows an example of a 200 MHz carrier that has been amplitude modulated with a 10 ns pulse. A 3 kHz frequency error was deliberately added to the signal and this is reported in the symbols/errors section of the display.
Figure 58. The 89601 can be used to show the frequency error of a narrow pulsed RF signal.
The basic configuration used is:Meas Setup > Demodulator: Digital DemodMeas Setup > Demod Properties: BPSK (set symbol rate, measurement period, and filter types to suit the signal being tested)
62 | Keysight | Ultra-Wideband Communication RF Measurements - Application Note
7. Transceiver Spurious Tests
The use of very high-speed digital circuitry means the overall system emissions are often a combination of analog and digital effects. The tests, described only in outline here, are often time-consuming and require close attention to measurement configuration. Control lines that are nominally digital can easily become unexpected antennas when RF signals couple onto them. Unexpected variations in results often indicate RF signals being present on cables.
Transceiver measurements consist of performing out-of-band spurious emissions tests. These confirm the UWB radio is operating within regulatory limits. Spurious emission testing can be performed using a spectrum analyzer.
Two types of emissions tests are carried out: conducted and radiated. Conducted emissions are a measure of the unwanted signals generated by the DUT from its output connector or any cabling the device normally uses. Special signal coupling techniques are required for some measurements.
Radiated emissions are those emanating from the device and picked up by an external antenna. Official testing often involves the use of an anechoic chamber to remove background disturbances.
Separate standards are specified according to the region in which the equipment is to be used. The United States follows the FCC standards, where CFR47 part 15 Appendix D applies. Europe follows the ETSI. Task Group 31a is working on document EN 302 065. It is at a draft stage. In Japan, TELEC define operating limits. The ITU-R is also working on common standards for UWB measurements.
Below 1 GHz, tests requiring compliance with the International Special Committee on Radio Interference (CISPR) publication 16 may require electromagnetic compatibility (EMC) spectrum analyzers with quasi-peak detectors. These tests are not covered in this application note. Please contact your local Keysight sales representative for more information on Keysight EMC products.

63 | Keysight | Ultra-Wideband Communication RF Measurements - Application Note
8. Receiver Measurements
A receiver design is challenging since the designer has to allow for many different input signal conditions, some of which are hard to predict. This is especially true when operation includes unlicensed bands and multiple chipset vendors. UWB receiver testing is particularly difficult because there is little general-purpose equipment that has the modulation bandwidth or multi-frequency switching required (for multiband OFDM), therefore so-called golden radios will be used. This approach has a number of drawbacks, but traditionally has been the only practicable solution for reference design integration and manufacturing.
With the introduction of Keysight’s N7619A Signal Studio for multiband OFDM UWB software, golden radios are no longer needed for receiver testing. Signal Studio for multiband OFDM UWB generates accurate UWB waveforms compliant with the MBOA proposal for 802.15.3a.
This application note describes those tests that can be run with test equipment and a golden radio, and provides some suggestions on techniques to minimize the drawbacks of using a golden radio. It also demonstrates the setup for using the N7619A Signal Studio for multiband OFDM UWB software in place of the golden radio.
Designers and users will want to know how the UWB DUT copes with non-UWB transmission. For information on generating interference signals refer to Generating the interference signal on page 22. Or, use the N7619A Signal Studio for multiband OFDM UWB software to create the interference signal. For more information, refer to the N7619A Technical Overview, literature number 5989-2927EN.
Test conditions and setup The basic receiver test configuration for the MB-OFDM proposal is described below. DS-UWB and pulsed system receiver test can also be broken down into the phases of basic timing and full system test. As described in Pulsed and pulse modulated on page 23, the 81134 pulse generator can be used as the modulation source. This allows deterministic impairments like jitter to be added. Precise spectrum shaping may be relatively unimportant for this kind of test.
Testing methods are typically not well defined in the IEEE 802 radio standards. The use of asynchronous packet based transmission timing has meant receiver test is generally done using a one-way signal path. Loopback mechanisms are not defined. When it is available, loopback testing allows external test equipment to demodulate the returned signal and do its own BER measurement.
A one-way signal path has the potential for faster testing, because data does not have to be returned, but places a greater burden on the device supplier and system integrator. Care is required in the triggering and sequencing of the measurement. For example, changes in level of the signal source need time to settle before further measurements are begun.

64 | Keysight | Ultra-Wideband Communication RF Measurements - Application Note
BER SW
DUTcontroller
RF
DUT
I,Q
PSGsignal generator
Option 015
DemodulationFPGA/ADCs
basebanddata recovery
RF up/down
conversion
I,Q
Calibration pathPSA
spectrum analyzer
Trigger signalsDual Arb waveform generator
[> 250 MHz bandwidth]
Waveform generation(using the N7619A Signal Studio
for multiband OFDM UWB)
IQ path calibration
Figure 59. Arbitrary waveform-based receiver test configuration for the MB-OFDM format.
In Figure 59, the configuration for single-frequency OFDM testing is shown. The test signal is created as an arbitrary waveform IQ file. The IQ files are then downloaded into the hardware waveform generator, which is connected to the I and Q inputs of the PSG signal generator. The I and Q signal bandwidth required is that of the modulated RF, or approximately 256 MHz for MB-OFDM.
Figure 60 shows the typical performance of the PSG wideband modulator option. Depending on the EVM performance requirements, it may be necessary to calibrate the IQ path. The PSA spectrum analyzer can be used to do this in conjunction with special calibration software. Contact your Keysight representative for more details.
A fully operational receiver has to go through three steps to recover the data:
1. Symbol synchronization2. Channel estimation3. Packet recognition and data recovery In design it will be important to confirm the performance for each stage, especially using impaired signals. Testing with isolated sections of the packet, starting with the synch symbols, will allow this. The timing of individual symbols can be deliberately altered to test the recovery process. For convenience the structure of the MB-OFDM packet, is reproduced here.
..... .....
Synchronization Channel estimation
Tail & pad
Time
Freq
uenc
y Preamble Header Payload1.875 us
Figure 60. Sequence of symbols in the Mode 1 MB-OFDM packet.

65 | Keysight | Ultra-Wideband Communication RF Measurements - Application Note
If the measurement is of BER or PER, the modulated RF signal is filtered and down-converted in the DUT. The application software provided with the DUT will determine what information is available for analysis. To operate with the test setup of Figure 59, the radio will need to operate in a test mode that only uses one frequency.
Wideband external I/Q inputs (Option 015)
RF output frequency range 3.2 to 20 GHz
Input
Input (baseband) frequency range DC to > 500 MHz (nominal)
Input impedance 50 W (nominal)
Recommended input level 0 dBm (nominal)
I/Q offset adjustments ±50%
RF path filters1
Carrier Frequency Low-pass 3 dB cutoff frequency (nominal)
> 3.2 to 5 GHz 5.5 GHz
> 5 to 8 GHz 8.9 GHz
> 8 to 12.8 GHz 13.9 GHz
12.8 GHz 22.5 GHz
Measured I/Q frequency response
Figure 61. Specifications for PSG Option 015 wideband modulation.
Frequency hoppingFrequency hopping tests require careful synchronization of the test source, and either a significant increase in the bandwidth of the ARB and modulation path, or a switched RF oscillator. These options may not be open to many designers.
Therefore, if possible, it is recommended the source is left static, while the DUT switches between the frequencies appropriate to its operating mode. This allows any issues with LO switching in the receiver to be isolated. It requires that the DUT is able to recover individual OFDM symbols and depends on the appropriate DUT software being available.

66 | Keysight | Ultra-Wideband Communication RF Measurements - Application Note
Receiver EVM measurements and BER
A bit or packet error measurement shows the composite result of analog and receiver demodulation. The correlation between modulation errors and bit errors becomes more complex when using multiple carriers (OFDM). The MB-OFDM proposal discussed here also use forward error correction to reduce the probability of bit errors caused by poor signal to noise ratio (energy per bit/noise or Eb/No). At lower data rates, it duplicates symbols across two frequencies. DSP algorithms, such as Viterbi, improve the raw data bit recovery performance by using a short amount of data history to predict what was most likely to have been sent.
The effect of this combination of data protection measures is to hide analog impairments and reduce the link margin. Processing gain that could be used to increase the range of the device is used to cope with hardware design issues.
Analog measurements of the output of the receiver down-conversion chain can provide a lot more information than BER and PER about any impairment suffered by the recovered signal. Figure 62 shows how a two-channel oscilloscope can be used for IQ signal recovery prior to the ADC.
Dual Arb waveform generator[> 250 MHz bandwidth]
BER SW
DUTcontroller
RF
DUT
E167xxlogic analyzer
I,Q
PSGsignal generator
Option 015
Infiniium/Phramusoscilloscope
DemodulationFPGA / ADCs
Basebanddata recovery
RF up/down
conversion
I,Q
Waveform generation(using the N7619A Signal Studio
for multiband OFDM UWB)
IQ path calibration
Trigger signals CCA indicator
Complex trigger signals
Figure 62. Enhanced receiver test configuration for EVM measurements.
Bit errors are created when the signal vector is not at the right place on the IQ plane, when the receiver reaches a decision point. The same techniques described in the transmitter modulation measurement Delta (additive) EVM (page 29) and OFDM (page 58) may be used to isolate the causes.

67 | Keysight | Ultra-Wideband Communication RF Measurements - Application Note
Receiver sensitivity and RSSI verificationWith the emphasis being on packet transmission, the IEEE UWB proposals do not directly refer to BER measurements. Unlike cellular (voice) systems there are no unprotected bits sent as part of a normal UWB transmission. Figure 63 shows the preliminary minimum sensitivity requirements for the MB-OFDM proposal, and the variation with data rate.
Figure 63. An eight percent PER sensitivity level results from draft MB-OFDM proposal.
Of course, packet errors are caused by bit errors, and the longer a packet is, the less likely it will be successfully recovered. Therefore a full system test is needed. These tests will often need to be run using a golden radio, as shown in Figure 64. Received signal strength indication tests can also be run using the setup. An alternative configuration, which reduces some of the problems associated with the RF section of the golden radio, is to feed the baseband outputs of the golden radio to the IQ inputs of the PSG signal generator
PER SW
DUTcontroller
RF DUT
54855 oscilloscope
Basebanddata
recovery
RF up /down
conversion
Vendor-specificgolden radio
RF screened box
Stepattenuator
EPM power meter ESA spectrum analyzer
Isolated digitalinterconnection
PSGOption 015
Alternative mixed golden radio /signal generator configuration
Vendor- supplied control
software
Baseband I, Q RFWideband
AWG
N7619ASignalStudio
for multiband
OFDM
Solution for multiband OFDM UWB only
Alternate to signal generation with golden radio
Figure 64. Golden radio receiver test configuration.
In addition, the baseband signal of the golden radio can be replaced with the waveform creation software N7619A Signal Studio for multiband OFDM UWB coupled with a wideband arbitrary waveform generator.
Repeatable measurements can only be obtained if care is taken to ensure the golden radio performance is controlled and the RF signal level used for the test is calibrated to an absolute standard.
68 | Keysight | Ultra-Wideband Communication RF Measurements - Application Note
The modulation quality and dynamic frequency accuracy of the golden radio can be verified using the techniques described in OFDM (see page 58) and Short pulsed signals (see page 61). The output power can be tested using the techniques described in Power on page 41. A power meter and thermal detector will allow small variations in absolute RF level to be detected, which is what is needed for this specific test.
A network analyzer can be used to calibrate the attenuator and check for impedance mismatches in the system.
Clear channel assessment test
Despite their operation as underlay technologies, the IEEE proposals may still use clear channel assessment (CCA) to control the transmission periods. For both DS-UWB and MB-OFDM proposals, the most basic requirement is to choose a piconet operating code or frequency switching sequence. However, these are selected at the time the piconet is established rather than being applied actively during data transfer.
In WLAN, CCA involves a combination of energy detection and network based information. Being a personal area network, the options to get information from other devices are more limited. The UWB radio will need to perform some form of spectrum monitoring.
The CCA test is designed to prevent the DUT from transmitting at the same time as another UWB device of the same type, although this may be modified to allow different piconets to use alternative channel switching frequencies.
The test configurations of Figures 62 and 64 can be combined to run a CCA test. The golden radio needs to be programmable to simulate different piconets. For MB-OFDM, the DUT must respond to a valid signal at the eight percent PER sensitivity level, within < 5 µs. If the preamble is not identified, the test signal level is 20 dB higher.
The DUT must detect the signal with > 90 percent probability. This implies an extended test will be needed to reduce measurement variations.
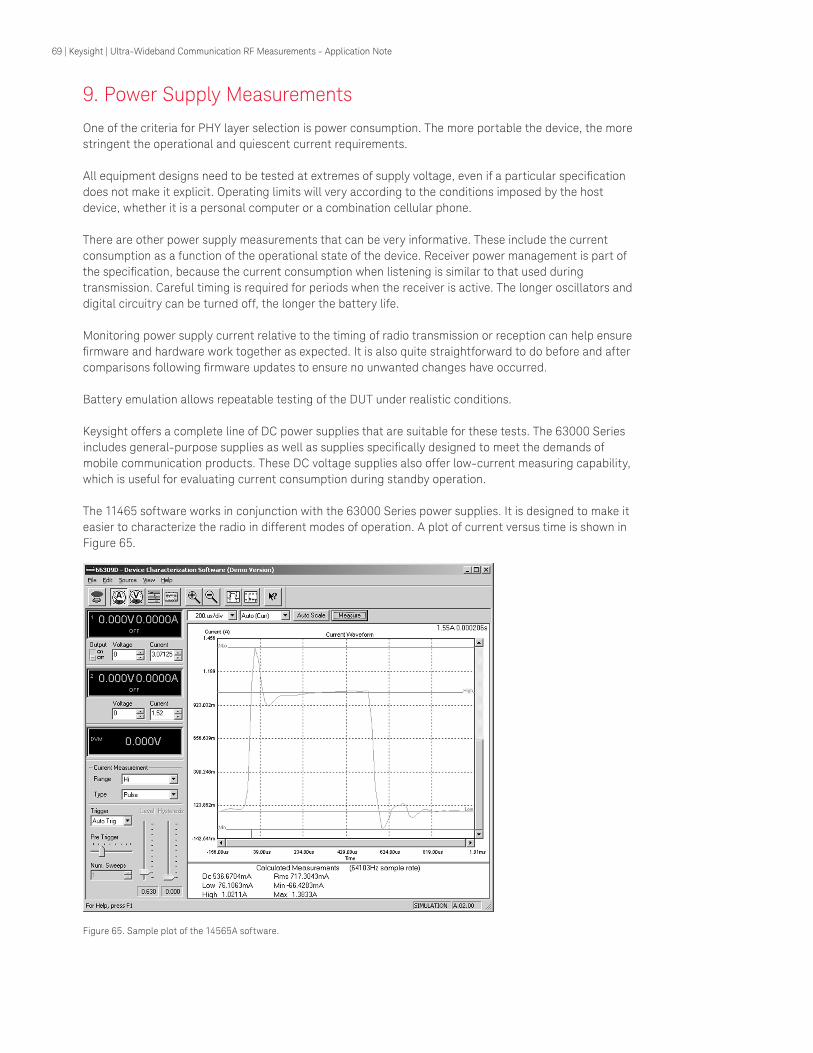
69 | Keysight | Ultra-Wideband Communication RF Measurements - Application Note
9. Power Supply Measurements
One of the criteria for PHY layer selection is power consumption. The more portable the device, the more stringent the operational and quiescent current requirements.
All equipment designs need to be tested at extremes of supply voltage, even if a particular specification does not make it explicit. Operating limits will very according to the conditions imposed by the host device, whether it is a personal computer or a combination cellular phone.
There are other power supply measurements that can be very informative. These include the current consumption as a function of the operational state of the device. Receiver power management is part of the specification, because the current consumption when listening is similar to that used during transmission. Careful timing is required for periods when the receiver is active. The longer oscillators and digital circuitry can be turned off, the longer the battery life.
Monitoring power supply current relative to the timing of radio transmission or reception can help ensure firmware and hardware work together as expected. It is also quite straightforward to do before and after comparisons following firmware updates to ensure no unwanted changes have occurred.
Battery emulation allows repeatable testing of the DUT under realistic conditions.
Keysight offers a complete line of DC power supplies that are suitable for these tests. The 63000 Series includes general-purpose supplies as well as supplies specifically designed to meet the demands of mobile communication products. These DC voltage supplies also offer low-current measuring capability, which is useful for evaluating current consumption during standby operation.
The 11465 software works in conjunction with the 63000 Series power supplies. It is designed to make it easier to characterize the radio in different modes of operation. A plot of current versus time is shown in Figure 65.
Figure 65. Sample plot of the 14565A software.

70 | Keysight | Ultra-Wideband Communication RF Measurements - Application Note
Appendix A:
Keysight Solutions for UWB
♦ Full measurement capability ● Some measurement limitations1
RF Layer tests
Transmitter tests
Average Power, PSD ♦ ♦ ●
Peak Power, CCDF ♦ ● ●
Spectrum Mask ● ♦
Correlated Spectrum ●
Demodulation ●
BaseBand Pulse Shape ● ♦ ♦
Modulated Pulse Shape ♦
Transmission Spurious ● ♦
Frequency Error ● ●
Constellation Error ♦
BB. Eye, Timing Jitter ♦ ♦
Transceiver Tests
Output of band ♦
spurious emission
Receiver Tests
Interference ♦
Sensitivity ●
Receiver EVM ●
Max Input Level ●
(Non) Adjacent Channel rejection
●
Component Test
Common Mode rejection ♦ ♦
Amplitude & Frequency Linear analysis
● ● ♦
Non-linear analysis ● ●
1. See the notes within the appropriate section of this document for a description of the capabilites and limitations of specific items of equipment
8960
1A V
SASo
ftw
are
with
Osci
llosc
ope
PSA,
ESA
Ser
ies
Spec
trum
An
alyz
ers
ESG
/PSG
Ser
ies
Sign
al
Gene
rato
rs
5485
5Os
cillo
scop
e
EPM
Pow
er M
eter
8610
0C D
CA,
Wid
eban
dSa
mpl
ing
Osci
losc
ope
ENA,
PN
AVe
ctor
Net
wor
kAn
alyz
ers
Test equipment with UWB capability
– Simulation software, ADS with E5619A UWB DesignGuide Software tool for the design and simulation of custom UWB systems.
– Pre-defined UWB component models to speed the simulation process.
– Can be linked with an external ARB, PSG Series signal generators, and 89601 VSA software
– Simulation software, N7619A Signal Studio for multiband OFDM UWB Software provides flexible, fast waveform creation for your design and verification of OFDM UWB transceivers and components. Sig-nal Studio for multiband OFDM UWB operates with the E8267C/D PSG vector signal generators coupled with an external wideband arbitrary waveform generator.
– 54855A 6-GHz real time oscilloscope A 20 GSa/s, four-channel input, 6 GHz real time oscilloscope. The 89601 VSA software can be run in-ternally, along with a range of other digital signal analysis software
– Recommended options: – E2681A jitter analysis
software – 001: 1 Msa memory

71 | Keysight | Ultra-Wideband Communication RF Measurements - Application Note
Test equipment with UWB capability continued
– Vector Signal Analysis software, 89601A Versatile and precise signal analysis. Recommended options:
– 105: Dynamic links to EESof/ADS – AYA: OFDM analysis
– Signal Generator, PSG E8267C/D Modulation source for multiband OFDM signals for transmitter and component test. Use in conjunction with an external arbitrary waveform generator or IQ outputs from radio baseband. Recommended options:
– 015: 2 GHz wideband I/Q input – UNR: enhanced phase noise performance – 520: 20 GHz PSG vector signal generator
– Signal Generator, ESG 4438C Create a wide variety of interference signals, including UWB, WLAN and Bluetooth. Use in conjunction with 89601A VSA software to replay any recorded test signal.
– Recommended option: – 403: wideband noise source
– Spectrum Analyzer, PSA (6.7 to 50 GHz) and ESA-A Series Semi-automated, one-button test execution for swept spectrum transmitter measurement. The frequency range for analysis can be extended above 50 GHz using 11970 (un-preselected) and 11974 (preselected) down-converters
– Recommended PSA options: – E4440A 26.5 GHz – H26: 50 GHz low noise preamplifier
– Pulse Generator, 81134A Able to create a wide range of pulse signals, and known timing errors. Combine Channel 1 and Channel 2 signals to create a three-level signal, or use both channels to create an IQ signal
– Recommended option: – Dual channel
– EPM-P power meter and 8482A thermal sensor, E9327 peak power sensor Make accurate average power measurements with the thermal sensor. Measure and inspect framed signals with the peak power sensors.
Other Test Equipment – TS 50 shielded RF enclosure
Allows repeatable RF measurements to be made, without interference from external environment. – DC sources, 66319, 66321 B/D with test software 11465
Fast programmable dynamic DC power sources with battery emulation. – Logic Analyzers, 1680/1690 Series
Provides comprehensive system-level debugging for digital hardware design and verification. – Logic Analyzers, 16700 Series
Provides comprehensive system-level debugging for multiple processor/bus designs. Use E5904B with emulation trace Macrocell port for ARM processor triggering.
– Network Analyzers, PNA and ENA Series Recommended Option 010 time domain analysis Provides measurement of antenna VSWR, and performance of PA, LNA,and RF switch.
– Function Generator, 33250A, 80 MHz function/arbitrary waveforms MB-OFDM frequency switching signal.
Accessories – Oscilloscope Probe –113xA
Ultra high speed active probes. Differential and single-ended. – E2696A general purpose 6-GHz probing solution
Single ended and differential probes with external power supply and DC offset capability.
72 | Keysight | Ultra-Wideband Communication RF Measurements - Application Note
Appendix B: Recommended Reading
Useful Web links Keysight UWB application and product information: http://www.keysight.com/find/UWB/
Keysight application on differential device measurement: http://www.keysight.com/find/ena
Keysight information on PSG signal generators:http://www.keysight.com/find/psg
Keysight information on CCDF plots: http://www.educatorscorner.com/media/AN_5968-6875E.pdf
IEEE 802.15.3 Home page: http://www.ieee802.org/15/
DesignGuides developments for other UWB formats:http://eesof.tm.keysight.com/products/ultra_wideband_dg.html
Multi-band OFDM Alliance: http://www.multibandofdm.org/
Demo software – 89601A Software demo is software available on CD or downloadable (130 Mb) – Download the N7619A Signal Studio for multiband OFDM UWB software to your PC (3.59 Mb). The
signal configuration and graphing capabilities can be evaluated by navigating the user interface prior to purchase, go to www.keysight.com/find/signalstudio
Application notesSpectrum Analyzer Measurement and Noise, Application Note 1303, literature number 5966-4008E
Making Pre-Compliance Conducted & Radiated Emissions Measurements with EMC Analyzers, Application Note 1328, literature number 5968-3661E
RF Testing Of Wireless LAN Products, Application Note 1380-1, literature number 5988-3762EN
Equalizer Techniques & OFDM Troubleshooting for Wireless LANs, Application Note 1455, literature number 5988-9440EN
Improving TDR/TDT Measurements using Normalization, Application Note 1304-5, literature number 5988-2490EN
High Precision Time Domain Reflectometry, Application Note 1304-7, literature number 5988-9826EN
Spectrum Analysis, Application Note 150, literature number 5952-0292
Easy Frequency Extension to 110 GHz Using Keysight 83550 Series Millimeter Wave Source Modules, literature number 5988-1098
Measuring Jitter in Digital Systems, Application Note 1448-1, literature number 5988-9109EN
Finding Sources of Jitter with Real-Time Jitter Analysis, Application Note 1448-2, literature number 5988-9740EN
73 | Keysight | Ultra-Wideband Communication RF Measurements - Application Note
Appendix B: Recommended Reading (continued)
Product notesKeysight PSA series Swept and FFT analysis, literature number 5980-3081
Keysight Infiniium Oscilloscopes Performance Guide Using 89601A VSA software, literature number 5988-4096EN
Keysight E2696A General Purpose 6 GHz Probing Solution, literature number 5988-9889EN
Keysight 89600 Series Wide Bandwidth Vector Signal Analyzers, literature number 5980-0723E
Using Vector Modulation Analysis in the Integration, Troubleshooting and Design of Digital RF Communications Systems, product note 89400-8, literature number 5091-8687E
Jitter Analysis Using and Keysight Infiniium Oscilloscope, literature number 5988-6109EN
RF background readingEffects of Physical Layer Impairments on OFDM Systems RF Design, May, 2002, p. 36, www.rfdesign.com, Cutler, Robert
Antenna measurements: Triggering the PNA series Network Analyzer, for use with PSG as remote RF source, whitepaper, literature number 5988-9518EN
8 Hints for Making Better Spectrum Analyzer Measurements, Application Note 1286-1, literature number 5965-7009E
Cookbook for EMC Pre-compliance Measurements, Application Note 1290-1, literature number 5964-2151E
Testing and Troubleshooting Digital RF Communications Receiver Designs, Application Note 1314, literature number 5968-3579E
Testing and Troubleshooting Digital RF Communications Transmitter Designs, Application Note 1313, literature number 5968-3578E
74 | Keysight | Ultra-Wideband Communication RF Measurements - Application Note
Appendix C: Glossary
Acknowledgement – the short frame sent by a receiver when it is able to correctly decode a packet
Bluetooth – a frequency hopping WPAN radio system, operating in the 2.4 GHz unlicensed band
CDMAone – spread spectrum cellular technology, using code domain modulation, based on TIA/EIA IS-95
Convolution – a technique to determine the system output when the system impulse response and input signal are known
Correlation – a technique to measure the similarity between two signals
Direct sequence code division multiple access – UWB transmission scheme that amplitude or IQ modulates an RF carrier with a very high speed, digital signal that has been fed through a spectrum-shaping filter. Payload symbols are created from selected 24-bit data sequences
Medium access control – the function of the software that adapts wired data transmissions, so they are suitable for sending over a RF link
Mixed mode – term used for a vector network measurement technique giving singled ended and differential transmission and reflection results, without needing a differential RF source
Multi-band OFDM – an UWB transmission scheme that transmits data packets as a sequence of individual OFDM symbols on adjacent RF frequencies
Multi-path propagation – the dominant effect controlling RF transmission inside buildings. A single transmit signal arrives at the receiver having been reflected from many surfaces. The difference in delay between the many reflections can lead to inter-symbol-interference
OFDM – a modulation scheme that is insensitive to multi-path radio wave propagation. A high-speed data signal is divided amongst many sub-carriers, thereby increasing the transmit duration for each data symbol
Pulse de-sensitization – a potentially mis-leading term, historically used to describe why the amplitude shown on a spectrum analyzer screen is lower than the average power of the transmitted signal. Caused by the resolution bandwidth of the spectrum analyzer being much less than signal bandwidth
Ultra wide band – informally, an RF signal with 20 percent ratio of occupied bandwidth to center frequency, or an instantaneous bandwidth of at least 500 MHz. Formally, the definition comes from spectrum regulations documents, which may vary by region
Uncoordinated piconet – a pair of wireless devices involved in data transmission, operating without the benefit of any centralized network management functions, such as to determine transmission timeslots or power level
Underlay technology – a system that can be added to an existing environment, and as a design feature must cause minimum impact. The definition of minimum is determined by regulatory bodies
Wavelet – an RF signal that is of short duration relative to the transmission propagation delay

75 | Keysight | Ultra-Wideband Communication RF Measurements - Application Note
Appendix D: Symbols and acronyms
ACK AcknowledgementADC Analog-to-digital converterADS Advanced design systemAP Access pointARB Arbitrary (waveform generator) BER Bit error ratebps Bits per secondBOK Binary orthogonal keyingBPSK Binary phase shift keyingCCA Clear channel assessmentCCDF Complementary cumulative distribution functionCDMA Code domain multiple accessCISPR International Special Committee on Radio InterferenceCMOS Complementary metal-oxide semiconductorCMRR Common mode rejection ratioCRC Cyclic redundancy checkCSMA/CA Carrier sense multiple access with collision avoidanceCW Carrier waveDAC Digital-to-analog converterDQPSK Differential quadrature phase shift keyingDS-CDMA Direct sequence code domain multiple accessDSP Digital signal processorDUT Device under testDVB Digital video broadcastEIRP Equivalent isotropic radiated powerEMC Electro magnetic compatibilityENBW Equivalent noise bandwidthESG Electronic signal generatorETSI European Technical Standards InstituteEVM Error vector magnitudeFCC Federal Communications CommissionsFFT Fast Fourier transformGPR Ground penetrating RADARGPS Global positioning systemIC Integrated circuitIEEE Institute of Electrical and Electronics Engineers, Inc.IF Intermediate frequencyIFS Inter-frame spacingISI Inter symbol interferenceISM Industrial, Scientific and MedicalITU-R International Telecommunications Union - RadioJEDEC Joint Electron Device Engineering CouncilLNA Low noise amplifierLO Local oscillatorMAC Medium access controlMB-OFDM Multi-band orthogonal frequency division multiplexingNLOS Non line of site (propagation path)OFDM Orthogonal frequency division multiplexingPER Packet error ratePHY Physical (layer)PLL Phase locked loopPN (9,15) Pseudo random number (2N-1); seed often 0PRBS Pseudo random binary sequencePRF Pulse repetition frequencyPSD Power spectral density

76 | Keysight | Ultra-Wideband Communication RF Measurements - Application Note
Appendix D: Symbols and acronyms (continued)
QAM Quadrature amplitude modulationQPSK Quaternary phase shift keyingRADAR Radio detection and rangingRBW Resolution bandwidthRF Radio frequencyRFID Radio frequency identificationrms Root mean squareRRC Root raised cosineRSSI Receive signal strength indicationRX ReceiverS/R Signal to noiseSCPI Standard commands for programmable instrumentsSEM Spectrum emission maskSMA Sub-miniature (RF connector) version ASNR Signal-to-noise ratioSOP Simultaneous operating piconetSRD Short range deviceTDD Time division duplexTDMA Time division multiple accessTPC Transmit power controlTX TransmitterUNII Unlicensed National Information InfrastructureUSB Universal serial busUWB Ultra wide bandVBW Video bandwidthVCO Voltage control interfaceVSA Vector spectrum analyzerVSWR Voltage standing wave ratioWLAN Wireless local area networkWPAN Wireless personal area networkWiMEDIA Wireless MEDIA
Appendix E: References
1. Supplement to IEEE Standard for Information Technology IEEE Std 802.15.3a–1999 (supplement to IEEE Std 802.15.3-1999)
2. IEEE P802.15-03/268 Multi-Band OFDM Physical Layer Proposal for IEEE 802.15 Task Group 3a
3. IEEE P802.15-03/154 XtremeSpectrum CFP document
4. IEEE P802.15-02/490r1 document
5. Reference FCC 02-48 Section 15.521(d)
6. FCC CFR47 part 15, sub-part F, August 2003
This information is subject to change without notice.© Keysight Technologies, 2014 -2017Published in USA, December 5, 20175989-0506ENwww.keysight.com
Bluetooth is a trademark owned by Bluetooth SIG, Inc., U.S.A. and licensed to Keysight Technologies, Inc.
MATLAB is a U.S. registered trademark of The Math Works, Inc.
www.keysight.com/find/UWB/www.keysight.com/find/enawww.keysight.com/find/psg
This document was formerly known as application note number 1488.