
Keysight Spectrum Analyzer Option (090/S93090xA) for · PDF fileREGARD TO THIS MANUAL AND ANY...
32
Ihr Spezialist für Mess- und Prüfgeräte dataTec ▪ Ferdinand-Lassalle-Str. 52 ▪ 72770 Reutlingen ▪ Tel. 07121 / 51 50 50 ▪ Fax 07121 / 51 50 10 ▪ [email protected] ▪ www.datatec.de Data Sheet and Technical Specifications Keysight Spectrum Analyzer Option (090/S93090xA) for PNA/PNA-L/PNA-X/N5290A/N5291A
Transcript of Keysight Spectrum Analyzer Option (090/S93090xA) for · PDF fileREGARD TO THIS MANUAL AND ANY...

Ihr Spezialist fürMess- und Prüfgeräte
dataTec ▪ Ferdinand-Lassalle-Str. 52 ▪ 72770 Reutlingen ▪ Tel. 07121 / 51 50 50 ▪ Fax 07121 / 51 50 10 ▪ [email protected] ▪ www.datatec.de
Data Sheet and Technical Specifications
Keysight Spectrum Analyzer Option (090/S93090xA) for PNA/PNA-L/PNA-X/N5290A/N5291A

2 dataTec ▪ Ferdinand-Lassalle-Str. 52 ▪ 72770 Reutlingen ▪ Tel. 07121 / 51 50 50 ▪ Fax 07121 / 51 50 10 ▪ [email protected] ▪ www.datatec.de
2
Documentation Warranty THE MATERIAL CONTAINED IN THIS DOCUMENT IS PROVIDED "AS IS," AND IS SUBJECT TO BEING CHANGED, WITHOUT NOTICE, IN FUTURE EDITIONS. FURTHER, TO THE MAXIMUM EXTENT PERMITTED BY APPLICABLE LAW, KEYSIGHT DISCLAIMS ALL WARRANTIES, EITHER EXPRESS OR IMPLIED WITH REGARD TO THIS MANUAL AND ANY INFORMATION CONTAINED HEREIN, INCLUDING BUT NOT LIMITED TO THE IMPLIED WARRANTIES OF MERCHANTABILITY AND FITNESS FOR A PARTICULAR PURPOSE. KEYSIGHT SHALL NOT BE LIABLE FOR ERRORS OR FOR INCIDENTAL OR CONSEQUENTIAL DAMAGES IN CONNECTION WITH THE FURNISHING, USE, OR PERFORMANCE OF THIS DOCUMENT OR ANY INFORMATION CONTAINED HEREIN. SHOULD KEYSIGHT AND THE USER HAVE A SEPARATE WRITTEN AGREEMENT WITH WARRANTY TERMS COVERING THE MATERIAL IN THIS DOCUMENT THAT CONFLICT WITH THESE TERMS, THE WARRANTY TERMS IN THE SEPARATE AGREEMENT WILL CONTROL.
U.S. Government Rights U.S. Government Rights. The Software is “commercial computer software,” as defined by Federal Acquisition Regulation (“FAR”) 2.101. Pursuant to FAR 12.212 and 27.405-3 and Department of Defense FAR Supplement (“DFARS”) 227.7202, the U.S. government acquires commercial computer software under the same terms by which the software is customarily provided to the public. Accordingly, Keysight provides the Software to U.S. government customers under its standard commercial license, which is embodied in its End User License Agreement (EULA), a copy of which can be found at http://www.keysight.com/find/sweula. The license set forth in the EULA represents the exclusive authority by which the U.S. government may use, modify, distribute, or disclose the Software. The EULA and the license set forth therein, does not require or permit, among other things, that Keysight: (1) Furnish technical information related to commercial computer software or commercial computer software documentation that is not customarily provided to the public; or (2) Relinquish to, or otherwise provide, the government rights in excess of these rights customarily provided to the public to use, modify, reproduce, release, perform, display, or disclose commercial computer software or commercial computer software documentation. No additional government requirements beyond those set forth in the EULA shall apply, except to the extent that those terms, rights, or licenses are explicitly required from all providers of commercial computer software pursuant to the FAR and the DFARS and are set forth specifically in writing elsewhere in the EULA. Keysight shall be under no obligation to update, revise or otherwise modify the Software. With respect to any technical data as defined by FAR 2.101, pursuant to FAR 12.211 and 27.404.2 and DFARS 227.7102, the U.S. government acquires no greater than Limited Rights as defined in FAR 27.401 or DFAR 227.7103-5 (c), as applicable in any technical data.

3 dataTec ▪ Ferdinand-Lassalle-Str. 52 ▪ 72770 Reutlingen ▪ Tel. 07121 / 51 50 50 ▪ Fax 07121 / 51 50 10 ▪ [email protected] ▪ www.datatec.de
3
Frequency and Time Specifications ............................................................................................................... 7
Table 1a. Frequency Specifications ............................................................................................................. 7
Table 1b. Time Specifications....................................................................................................................... 8
Amplitude Accuracy and Range Specifications ............................................................................................ 9
Table 2a. Amplitude Range Specifications .................................................................................................. 9
Table 2b. SA Detector Accuracy1, Without Frequency-band Crossing (dB) - Specifications ................... 10
Table 2c. SA Detector Accuracy1, Without Frequency-band Crossing (dB) - Specifications ................... 11
Table 2d. SA Detector Accuracy, At Frequency-band Crossing1 (dB) - Specifications ............................ 12
Table 2e. SA Detector Accuracy, At Frequency-band Crossing1 (dB) - Specifications ............................ 13
Table 2f. SA Detector Accuracy1, Without Frequency-band Crossing (dB) - Specifications .................... 14
Table 2g. SA Detector Accuracy1, At Frequency-band Crossing (dB) - Specifications ............................ 14
Table 2h. Input Attenuation1 Switching Uncertainty (dB) - Supplemental Information ........................... 15
Table 2i. Input VSWR1, without Option 029 or S93029A - Specifications ................................................ 15
Table 2j. Input VSWR1, without Option 029 or S93029A - Specifications ................................................ 16
Table 2k. Input VSWR1, without Option 029 or S93029A - Specifications ............................................... 16
Table 2l. Input VSWR - Specification ......................................................................................................... 17
Table 2m. Input VSWR1, with Option 029 or S93029A - Specifications ................................................... 18
Table 2n. Input VSWR1 - Specifications ..................................................................................................... 19
Table 2o. Other Amplitude Accuracy - Supplemental Information ........................................................... 19
Dynamic Range Specifications .................................................................................................................... 20
Table 3a. Spurious Response - Supplemental Information ....................................................................... 20
Table 3b. Displayed Average Noise Level (DANL)1 (dBm/Hz), At Test Ports - Specification .................... 20
Table 3c. Displayed Average Noise Level (DANL)1 (dBm/Hz), At Test Ports - Supplemental Information .................................................................................................................................................................... 21
Table 3c. Displayed Average Noise Level (DANL)1 (dBm/Hz), At Test Ports - Supplemental Information (cont.) .......................................................................................................................................................... 22
Table 3d. Displayed Average Noise Level (DANL)1 (dBm/Hz), At Test Ports - Typical ............................. 23
Table 3e. Displayed Average Noise Level (DANL)1 (dBm/Hz), At Test Ports - Specification .................... 24
Table 3f. Second Harmonic Distortion (SHI) - Supplemental Information ............................................... 24
Table 3g. Second Harmonic Distortion (SHI), (dBm) – Supplemental Information .................................. 25
Table 3h. Third Order Intermodulation Distortion (TOI)1 (dBm) - Characteristic ...................................... 26
Table 3i. Third Order Intermodulation Distortion (TOI)1 (dBm) - Characteristic ....................................... 27
Table 3j. DANL and Distortion Relative to Test Port Level (dB), All Options - Nominal ........................... 28
Table 3j. DANL and Distortion Relative to Test Port Level (dB), All Options - Nominal (cont.) ................ 29
Table 3j. DANL and Distortion Relative to Test Port Level (dB), All Options - Nominal (cont.) ................ 30

4 dataTec ▪ Ferdinand-Lassalle-Str. 52 ▪ 72770 Reutlingen ▪ Tel. 07121 / 51 50 50 ▪ Fax 07121 / 51 50 10 ▪ [email protected] ▪ www.datatec.de
4
Table 3k. Receiver Phase Noise (dBc/Hz), N5221x/22x/31x/32x/39x/41x/42x/49x - Typical ................. 31
Table 3l. Receiver Phase Noise (dBc/Hz), N5224x/25x/44x/45x - Typical ............................................... 31
Table 3m. Receiver Phase Noise (dBc/Hz), N5227x/47x - Typical ........................................................... 31
Table 3n. Receiver Phase Noise (dBc/Hz), N5290A - Typical ................................................................... 31
Table 3m. Receiver Phase Noise (dBc/Hz), N5291A - Typical .................................................................. 32

5 dataTec ▪ Ferdinand-Lassalle-Str. 52 ▪ 72770 Reutlingen ▪ Tel. 07121 / 51 50 50 ▪ Fax 07121 / 51 50 10 ▪ [email protected] ▪ www.datatec.de
5
This is a complete list of the technical specifications for the spectrum analyzer Option 090 (“A” models) or S93090xA (“B” models) on PNA/PNA-L/PNA-X series of network analyzer, including the following models. See model specific data sheet for the network analyzer specifications.
PNA Series Network Analyzer
N5221A/21B 10 MHz to 13.5 GHz
N5222A/22B 10 MHz to 26.5 GHz
N5224A/24B 10 MHz to 43.5 GHz
N5225A/25B 10 MHz to 50 GHz
N5227A/27B 10 MHz to 67 GHz
PNA-L Series Network Analyzer
N5239A/39B 300 kHz to 8.5 GHz
N5231A/31B 300 kHz to 13.5 GHz
N5232A/32B 300 kHz to 20 GHz
N5234A/34B 10 MHz to 43.5 GHz
N5235A/35B 10 MHz to 50 GHz
PNA-X Series Network Analyzer
N5249A/49B 10 MHz to 8.5 GHz
N5241A/41B 10 MHz to 13.5 GHz with serial number MY5201/SG5201/US5201 and above
N5242A/42B 10 MHz to 26.5 GHz with serial number MY5202/SG5202/US5202 and above
N5244A/44B 10 MHz to 43.5 GHz with serial number MY5204/SG5204/US5204 and above
N5245A/45B 10 MHz to 50 GHz with serial number MY5205/SG5205/US5205 and above
N5247A/47B 10 MHz to 67 GHz
For N5241x/42x/44x/45x with earlier serial numbers, SA detector accuracy and DANL are characteristics and all other specifications and performance information are applied.
Spectrum analyzer capability is fully functional after enabling option 090 or S93090xA and performing IF response calibration without returning to Keysight service center. However, performance verification is required to warrant option 090 specified performances. Keysight advises this work to be done in one of Keysight service centers.
Spectrum Analyzer “B” Model Option Structure
S930900A – Spectrum analysis up to 8.5 GHz S930901A – Spectrum analysis up to 13.5 GHz S930902A – Spectrum analysis up to 26.5 GHz S930904A – Spectrum analysis up to 43.5 GHz S930905A – Spectrum analysis up to 50 GHz S930907A – Spectrum analysis up to 67 GHz S930909A – Spectrum analysis up to 90 GHz

6 dataTec ▪ Ferdinand-Lassalle-Str. 52 ▪ 72770 Reutlingen ▪ Tel. 07121 / 51 50 50 ▪ Fax 07121 / 51 50 10 ▪ [email protected] ▪ www.datatec.de
6
Definitions
All specifications and characteristics apply over a 25 °C ±5 °C range (unless otherwise stated) and 90 minutes after the instrument has been turned on.
Specification (spec.): Warranted performance. Specifications include guardbands to account for the expected statistical performance distribution, measurement uncertainties, and changes in performance due to environmental conditions.
Characteristic (char.): A performance parameter that the product is expected to meet before it leaves the factory, but that is not verified in the field and is not covered by the product warranty. A characteristic includes the same guardbands as a specification.
Typical (typ.): Expected performance of an average unit which does not include guardbands. It is not covered by the product warranty.
Nominal (nom.): A general, descriptive term that does not imply a level of performance. It is not covered by the product warranty.
Supplemental Information: A performance parameter that is tested on sampled product during design validation. It does not include guardbands, and is not covered by the product warranty.
Calibration: The process of measuring known standards to characterize a network analyzer's systematic (repeatable) errors.
Corrected (residual): Indicates performance after error correction (calibration). It is determined by the quality of calibration standards and how well "known" they are, plus system repeatability, stability, and noise.
Uncorrected (raw): Indicates instrument performance without error correction. The uncorrected performance affects the stability of a calibration.
Standard: When referring to the analyzer, this includes no options unless noted otherwise.
7 dataTec ▪ Ferdinand-Lassalle-Str. 52 ▪ 72770 Reutlingen ▪ Tel. 07121 / 51 50 50 ▪ Fax 07121 / 51 50 10 ▪ [email protected] ▪ www.datatec.de
7
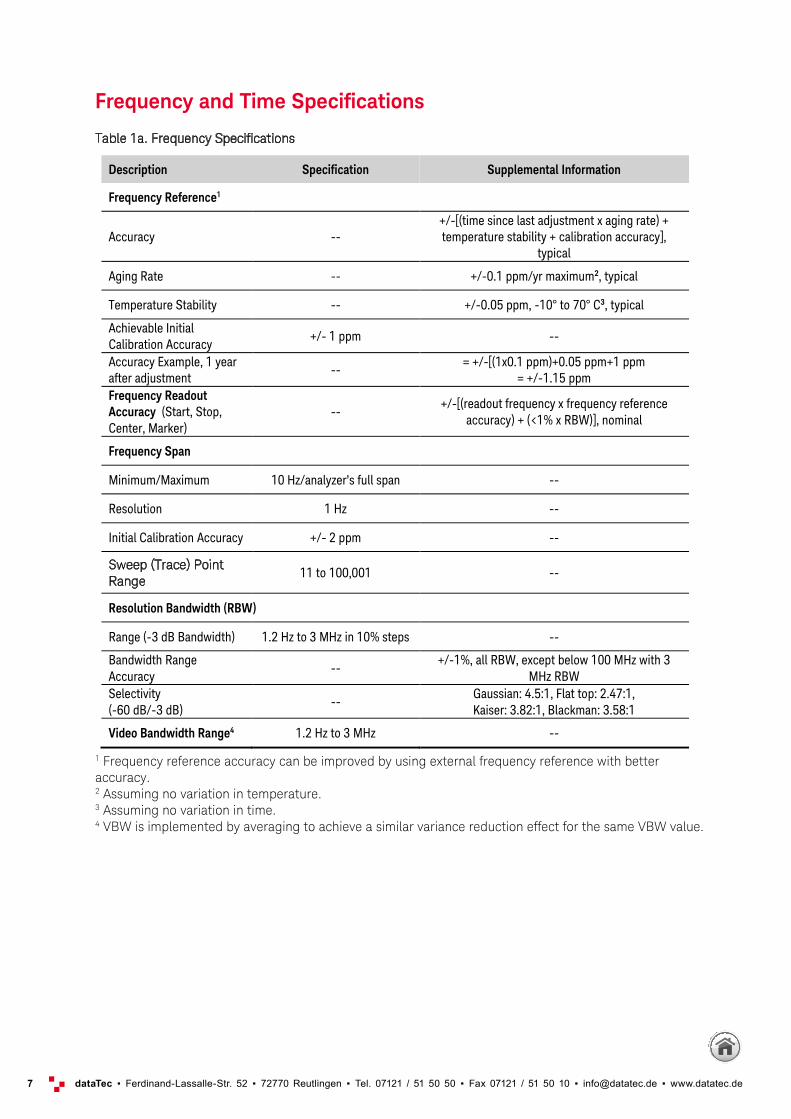
Frequency and Time Specifications
Table 1a. Frequency Specifications
Description Specification Supplemental Information
Frequency Reference1
Accuracy -- +/-[(time since last adjustment x aging rate) + temperature stability + calibration accuracy],
typical
Aging Rate -- +/-0.1 ppm/yr maximum2, typical
Temperature Stability -- +/-0.05 ppm, -10° to 70° C3, typical
Achievable Initial Calibration Accuracy
+/- 1 ppm --
Accuracy Example, 1 year after adjustment
-- = +/-[(1x0.1 ppm)+0.05 ppm+1 ppm
= +/-1.15 ppm Frequency Readout Accuracy (Start, Stop, Center, Marker)
-- +/-[(readout frequency x frequency reference
accuracy) + (<1% x RBW)], nominal
Frequency Span
Minimum/Maximum 10 Hz/analyzer’s full span --
Resolution 1 Hz --
Initial Calibration Accuracy +/- 2 ppm --
Sweep (Trace) Point Range
11 to 100,001 --
Resolution Bandwidth (RBW)
Range (-3 dB Bandwidth) 1.2 Hz to 3 MHz in 10% steps --
Bandwidth Range Accuracy
-- +/-1%, all RBW, except below 100 MHz with 3
MHz RBW Selectivity (-60 dB/-3 dB)
-- Gaussian: 4.5:1, Flat top: 2.47:1, Kaiser: 3.82:1, Blackman: 3.58:1
Video Bandwidth Range4 1.2 Hz to 3 MHz --
1 Frequency reference accuracy can be improved by using external frequency reference with better accuracy. 2 Assuming no variation in temperature. 3 Assuming no variation in time. 4 VBW is implemented by averaging to achieve a similar variance reduction effect for the same VBW value.

8 dataTec ▪ Ferdinand-Lassalle-Str. 52 ▪ 72770 Reutlingen ▪ Tel. 07121 / 51 50 50 ▪ Fax 07121 / 51 50 10 ▪ [email protected] ▪ www.datatec.de
8
Table 1b. Time Specifications
Description Specification Supplemental Information
Sweep Time and Triggering
Sweep Time Range Auto --
Trigger Types Continuous, Single, Group, Manual, External (MEAS TRIG, AUX1, AUX2)
--
Trigger Delay Range 0 to 3 s --
Trigger Delay Resolution 1 us --
Measurement and Display Update Rate
20 MHz Span, 3 kHz RBW, 3 kHz VBW
-- 62 ms
100 MHz Span, Auto RBW, Auto VBW
-- 62 ms
1 GHz Span, 3 kHz RBW, 3 kHz VBW
140 ms
1 GHz Span, 300 kHz RBW, 300 kHz VBW
65 ms
10 GHz Span, 3 kHz RBW, 3 kHz VBW
1200 ms
10 GHz Span, 300 kHz RBW, 300 kHz VBW
240 ms
Full Span, RBW/VBW = Preset (300 kHz)
--
N5239x/49x: 210 ms N5221x/31x/41x: 300 ms N5222x/32x/42x: 540 ms N5224x/34x/44x: 800 ms N5225x/35x/45x: 890 ms
N5227x/47x: 1170 ms

9 dataTec ▪ Ferdinand-Lassalle-Str. 52 ▪ 72770 Reutlingen ▪ Tel. 07121 / 51 50 50 ▪ Fax 07121 / 51 50 10 ▪ [email protected] ▪ www.datatec.de
9
Amplitude Accuracy and Range Specifications
Table 2a. Amplitude Range Specifications
Description Specification
Amplitude Range
Measurement Range DANL to maximum input level
Input Attenuator Range N523xA/B: none, N5290A/N5291A: none, N5227x/47x: 0 to 50 dB in 10 dB steps, All other models: 0 to 35 dB in 5 dB steps
Maximum Safe Input Level
Vary by analyzer model and option configuration. See maximum test port and receiver input level specifications on individual data sheet.
Display Range
Log Scale 0.001 to 500 dB/div in 0.001 steps
Linear Scale 10 divisions
Scale Units dBm, mW
Trace Detectors Types Average, Sample, Peak, Normal, Negative Peak, Peak sample, Peak average

10 dataTec ▪ Ferdinand-Lassalle-Str. 52 ▪ 72770 Reutlingen ▪ Tel. 07121 / 51 50 50 ▪ Fax 07121 / 51 50 10 ▪ [email protected] ▪ www.datatec.de
10
Table 2b. SA Detector Accuracy1, Without Frequency-band Crossing (dB) - Specifications
Description N5221x/22x/ 41x/42x/49x
N5224x/25x/ 44x/45x
N5227x/47x
Narrow IF Filter
Wide IF Filter
Narrow IF Filter
Wide IF Filter
Narrow IF Filter
Wide IF Filter
10 MHz to 250 MHz +/- 0.2 +/- 0.25 +/- 0.5 +/- 0.5 +/- 0.5 +/- 0.5
250 MHz to 800 MHz +/- 0.1 +/- 0.15 +/- 0.15 +/- 0.22 +/- 0.1 +/- 0.15
800 MHz to 3.2 GHz +/- 0.1 +/- 0.15 +/- 0.1 +/- 0.16 +/- 0.1 +/- 0.12
3.2 GHz to 10 GHz +/- 0.1 +/- 0.11 +/- 0.1 +/- 0.14 +/- 0.1 +/- 0.12
10 GHz to 26.5 GHz +/- 0.11 +/- 0.16 +/- 0.1 +/- 0.14 +/- 0.1 +/- 0.12
26.5 GHz to 40 GHz +/- 0.1 +/- 0.14 +/- 0.1 +/- 0.12
40 GHz to 50 GHz +/- 0.1 +/- 0.14 +/- 0.11 +/- 0.12
50 GHz to 67 GHz +/- 0.11 +/- 0.16
67 GHz to 70 GHz2 +/- 0.1 +/- 0.1
1 SA detector accuracy is residual error of IF response calibration. IF response is characterized with PNA’s standard measurement class after power and S-parameter calibration. Therefore the SA total absolute amplitude accuracy includes power meter, S-parameter and SA detector accuracies. Add input attenuation switching uncertainty if receiver attenuator is changed after user calibration.
2 Typical for N5227x/47x.

11 dataTec ▪ Ferdinand-Lassalle-Str. 52 ▪ 72770 Reutlingen ▪ Tel. 07121 / 51 50 50 ▪ Fax 07121 / 51 50 10 ▪ [email protected] ▪ www.datatec.de
11
Table 2c. SA Detector Accuracy1, Without Frequency-band Crossing (dB) - Specifications
Description N5290A N5291A
Narrow IF Filter
Wide IF Filter
Narrow IF Filter
Wide IF Filter
10 MHz to 250 MHz +/- 0.5 +/- 0.5 +/- 0.5 +/- 0.5
250 MHz to 800 MHz +/- 0.26 +/- 0.3 +/- 0.26 +/- 0.3
800 MHz to 3.2 GHz +/- 0.26 +/- 0.3 +/- 0.26 +/- 0.3
3.2 GHz to 10 GHz +/- 0.26 +/- 0.3 +/- 0.26 +/- 0.3
10 GHz to 26.5 GHz +/- 0.26 +/- 0.3 +/- 0.26 +/- 0.3
26.5 GHz to 40 GHz +/- 0.26 +/- 0.3 +/- 0.26 +/- 0.3
40 GHz to 50 GHz +/- 0.26 +/- 0.3 +/- 0.26 +/- 0.3
50 GHz to 67 GHz +/- 0.26 +/- 0.3 +/- 0.26 +/- 0.3
67 GHz to 70 GHz +/- 0.28 +/- 0.32 +/- 0.28 +/- 0.32
70 GHz to 90 GHz +/- 0.28 +/- 0.32 +/- 0.28 +/- 0.32
90 GHz to 120 GHz +/- 0.28 +/- 0.32
120 GHz to 125 GHz2 +/- 0.1 +/- 0.1
1 SA detector accuracy is residual error of IF response calibration. IF response is characterized with PNA’s standard measurement class after power and S-parameter calibration. Therefore the SA total absolute amplitude accuracy includes power meter, S-parameter and SA detector accuracies. Add input attenuation switching uncertainty if receiver attenuator is changed after user calibration.
2 Typical for N5291A.

12 dataTec ▪ Ferdinand-Lassalle-Str. 52 ▪ 72770 Reutlingen ▪ Tel. 07121 / 51 50 50 ▪ Fax 07121 / 51 50 10 ▪ [email protected] ▪ www.datatec.de
12
Table 2d. SA Detector Accuracy, At Frequency-band Crossing1 (dB) - Specifications
Description N5221x/22x/41x/42x/49x N5224x/25x/44x/45x N5227x/47x
Narrow IF Filter
Wide IF Filter
Narrow IF Filter
Narrow IF Filter
Narrow IF Filter
Wide IF Filter
50 MHz to 250 MHz +/- 0.5 +/- 0.6 +/- 0.5 +/- 0.5 +/- 0.6 +/- 0.8
250 MHz to 800 MHz +/- 0.5 +/- 0.6 +/- 0.5 +/- 0.5 +/- 0.6 +/- 0.8
800 MHz to 3.25 GHz +/- 0.5 +/- 0.6 +/- 0.25 +/- 0.25 +/- 0.25 +/- 0.25
3.25 GHz to 8 GHz +/- 0.25 +/- 0.25 +/- 0.25 +/- 0.25 +/- 0.25 +/- 0.25
8 GHz to 10 GHz +/- 0.25 +/- 0.25 +/- 0.25 +/- 0.72 +/- 0.25 +/- 0.35
10 GHz to 13.5 GHz +/- 0.25 +/- 0.25 +/- 0.41 +/- 0.72 +/- 0.25 +/- 0.35
13.5 GHz to 26.5 GHz +/- 0.25 +/- 0.25 +/- 0.41 +/- 0.72 +/- 0.25 +/- 0.35
26.5 GHz to 49.95 GHz +/- 0.41 +/- 0.25 +/- 0.25 +/- 0.35
49.95 GHz to 50 GHz +/- 0.41 +/- 0.25 +/- 1.75 +/- 2.15
50 GHz to 50.05 GHz +/- 1.75 +/- 2.15
50.05 GHz to 67 GHz +/- 0.25 +/- 0.35
1 SA detector accuracy with frequency-band crossing is tested at 0 Hz, +/- 1 MHz, +/- 10 MHz, and +/-50 MHz offset from each band-crossing frequency. This residual error is applied to 0 Hz, +/- 1 MHz, and +/- 10 MHz offset with narrow anti-alias filter path, and to 0 Hz, +/- 1 MHz, +/-10 MHz, and +/-50 MHz offset with wide anti-alias filter path.

13 dataTec ▪ Ferdinand-Lassalle-Str. 52 ▪ 72770 Reutlingen ▪ Tel. 07121 / 51 50 50 ▪ Fax 07121 / 51 50 10 ▪ [email protected] ▪ www.datatec.de
13
Table 2e. SA Detector Accuracy, At Frequency-band Crossing1 (dB) - Specifications
Description N5290A N5291A
Narrow2 IF Filter
Wide2 IF Filter
Narrow2 IF Filter
Wide2 IF Filter
50 MHz to 250 MHz +/- 0.6 +/- 0.8 +/- 0.6 +/- 0.8
250 MHz to 800 MHz +/- 0.35 +/- 0.35 +/- 0.35 +/- 0.35
800 MHz to 3.25 GHz +/- 0.35 +/- 0.35 +/- 0.35 +/- 0.35
3.25 GHz to 8 GHz +/- 0.35 +/- 0.35 +/- 0.35 +/- 0.35
8 GHz to 10 GHz +/- 0.35 +/- 0.35 +/- 0.35 +/- 0.35
10 GHz to 13.5 GHz +/- 0.35 +/- 0.35 +/- 0.35 +/- 0.35
13.5 GHz to 26.5 GHz +/- 0.4 +/- 0.4 +/- 0.4 +/- 0.4
26.5 GHz to 49.95 GHz +/- 0.4 +/- 0.4 +/- 0.4 +/- 0.4
49.95 GHz to 50 GHz +/- 0.4 +/- 0.4 +/- 0.4 +/- 0.4
50 GHz to 50.05 GHz +/- 0.4 +/- 0.4 +/- 0.4 +/- 0.4
50.05 GHz to 67 GHz +/- 0.4 +/- 0.5 +/- 0.4 +/- 0.5
67 GHz to 90 GHz +/- 0.4 +/- 0.5 +/- 0.4 +/- 0.5
90 GHz to 110 GHz +/- 0.55 +/- 0.65
110 GHz to 120 GHz +/- 0.55 +/- 0.65
1 SA detector accuracy with frequency-band crossing is tested at 0 Hz, +/- 1 MHz, +/- 10 MHz, and +/-50 MHz offset from each band-crossing frequency. This residual error is applied to 0 Hz, +/- 1 MHz, and +/- 10 MHz offset with narrow anti-alias filter path, and to 0 Hz, +/- 1 MHz, +/-10 MHz, and +/-50 MHz offset with wide anti-alias filter path.
2 For Band Crossings at 24GHz, 40GHz and 80GHz, specification is ±1dB, and at 63.984GHz, specification is +/- 1.75 dB.

14 dataTec ▪ Ferdinand-Lassalle-Str. 52 ▪ 72770 Reutlingen ▪ Tel. 07121 / 51 50 50 ▪ Fax 07121 / 51 50 10 ▪ [email protected] ▪ www.datatec.de
14
Table 2f. SA Detector Accuracy1, Without Frequency-band Crossing (dB) - Specifications
Description N5231x/32x/39x N5234x/35x
Narrow IF Filter
Wide IF Filter
Narrow IF Filter
Wide IF Filter
10 MHz to 250 MHz +/- 0.1 +/- 0.1 +/- 0.25 +/- 0.3
250 MHz to 800 MHz +/- 0.1 +/- 0.1 +/- 0.1 +/- 0.12
800 MHz to 13.51 GHz +/- 0.1 +/- 0.1 +/- 0.1 +/- 0.12
13.51 GHz to 20 GHz +/- 0.1 +/- 0.1 +/- 0.12 +/- 0.22
20 GHz to 40 GHz +/- 0.12 +/- 0.22
40 GHz to 50 GHz +/- 0.15 +/- 0.28
1 SA detector accuracy is residual error of IF response calibration. IF response is characterized with PNA’s standard measurement class after power and S-parameter calibration. Therefore the SA total absolute amplitude accuracy includes power meter, S-parameter and SA detector accuracies. Add input attenuation switching uncertainty if receiver attenuator is changed after user calibration.
Table 2g. SA Detector Accuracy1, At Frequency-band Crossing (dB) - Specifications
Description N5231x/32x/39x N5234x/35x
Narrow IF Filter
Wide IF Filter
Narrow IF Filter
Wide IF Filter
50 MHz to 13.46 GHz +/- 0.15 +/- 0.18 +/- 0.25 +/- 0.3
13.46 GHz to 13.5 GHz +/- 0.15 +/- 0.25 +/- 0.25 +/- 0.5
13.5 GHz to 13.52 GHz +/- 0.2 +/- 0.25 +/- 0.45 +/- 0.5
13.52 GHz to 13.56 GHz +/- 0.15 +/- 0.25 +/- 0.25 +/- 0.5
13.56 GHz to 20 GHz +/- 0.15 +/- 0.18 +/- 0.25 +/- 0.3
20 GHz to 39.95 GHz +/- 0.25 +/- 0.3
39.95 GHz to 39.99 GHz +/- 0.25 +/- 0.5
39.99 GHz to 40.01 GHz +/- 0.45 +/- 0.5
40.01 GHz to 40.05 GHz +/- 0.25 +/- 0.5
40.05 GHz to 50 GHz +/- 0.25 +/- 0.3
1 SA detector accuracy with frequency-band crossing is tested at 0 Hz, +/- 1 MHz, +/- 10 MHz, and +/-50 MHz offset from each band-crossing frequency. This residual error is applied to 0 Hz, +/- 1 MHz, and +/- 10 MHz offset with narrow anti-alias filter path, and to 0 Hz, +/- 1 MHz, +/-10 MHz, and +/-50 MHz offset with wide anti-alias filter path.

15 dataTec ▪ Ferdinand-Lassalle-Str. 52 ▪ 72770 Reutlingen ▪ Tel. 07121 / 51 50 50 ▪ Fax 07121 / 51 50 10 ▪ [email protected] ▪ www.datatec.de
15
Table 2h. Input Attenuation1 Switching Uncertainty (dB) - Supplemental Information
Description N5221x/22x/ 41x/42x/49x
N5224x/25x/ 44x/45x
N5227x/47x
5 to 30 dB 35 dB 5 to 20 dB 25 to 35 dB 10 to 40 dB 50 dB
10 MHz to 20 MHz +/- 1.0 +/- 1.2 +/- 0.6 +/- 1.0 +/- 1.0 +/- 1.3
20 GHz to 26.5 GHz +/- 1.5 +/- 1.7 +/- 0.6 +/- 1.0 +/- 1.0 +/- 1.3
26.5 GHz to 40 GHz +/- 0.6 +/- 1.0 +/- 1.0 +/- 1.3
40 GHz to 50 GHz +/- 0.7 +/- 1.1 +/- 0.15 +/- 2.2
50 GHz to 67 GHz +/- 0.15 +/- 2.2
1 For the N5290A and N5291A systems, there are no input attenuators.
Table 2i. Input VSWR1, without Option 029 or S93029A - Specifications
Description N5221x/22x
Options 210, 410 N5221x/22x
All Other Options N5241x/42x/49x
All Options
10 MHz to 50 MHz 1.135 1.785 1.785
50 MHz to 500 MHz 1.106 1.329 1.329
500 MHz to 3.2 GHz 1.135 1.329 1.329
3.2 GHz to 8 GHz 1.196 1.577 1.577
8 GHz to 10 GHz 1.329 1.577 1.577
10 GHz to 13.5 GHz 1.377 1.925 1.925
13.5 GHz to 16 GHz 1.433 1.925 1.925
16 GHz to 20 GHz 1.499 2.1 2.1
20 GHz to 24 GHz 1.671 2.1 2.1
24 GHz to 26.5 GHz 1.925 2.323 2.323
1 Tested with 0 dB source attenuator. VSWR is improved by increasing source attenuator value.
16 dataTec ▪ Ferdinand-Lassalle-Str. 52 ▪ 72770 Reutlingen ▪ Tel. 07121 / 51 50 50 ▪ Fax 07121 / 51 50 10 ▪ [email protected] ▪ www.datatec.de
16
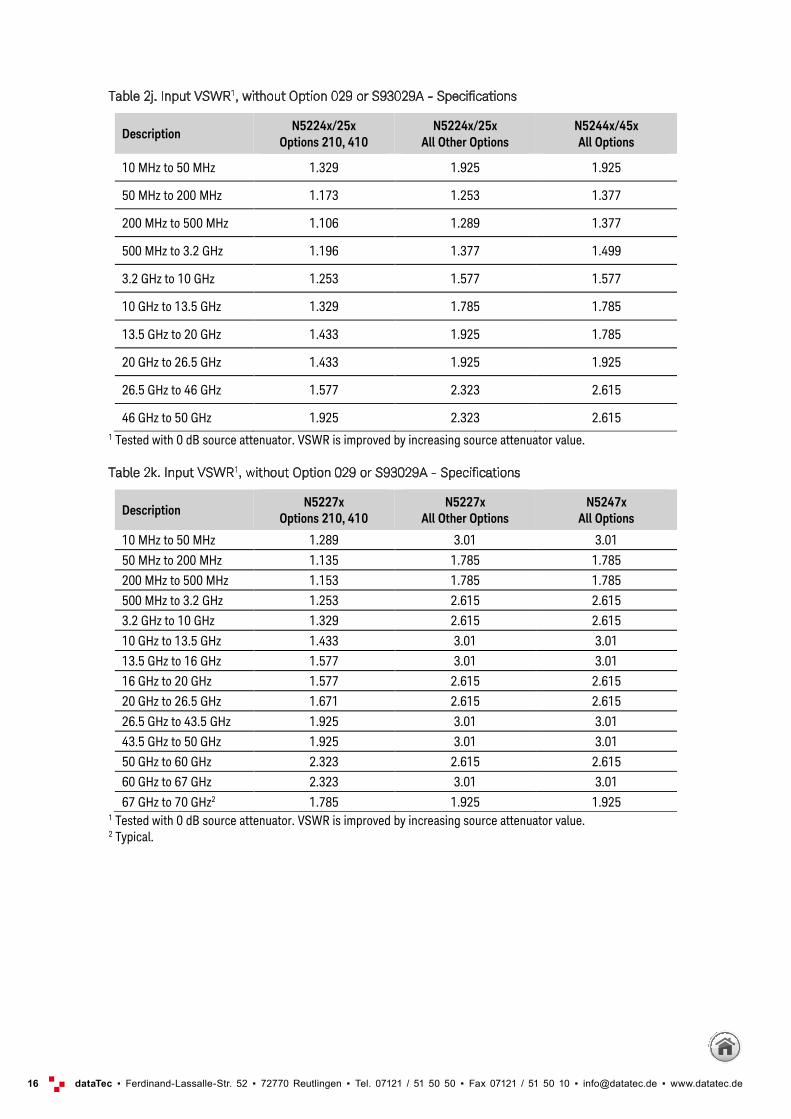
Table 2j. Input VSWR1, without Option 029 or S93029A - Specifications
Description N5224x/25x
Options 210, 410 N5224x/25x
All Other Options N5244x/45x All Options
10 MHz to 50 MHz 1.329 1.925 1.925
50 MHz to 200 MHz 1.173 1.253 1.377
200 MHz to 500 MHz 1.106 1.289 1.377
500 MHz to 3.2 GHz 1.196 1.377 1.499
3.2 GHz to 10 GHz 1.253 1.577 1.577
10 GHz to 13.5 GHz 1.329 1.785 1.785
13.5 GHz to 20 GHz 1.433 1.925 1.785
20 GHz to 26.5 GHz 1.433 1.925 1.925
26.5 GHz to 46 GHz 1.577 2.323 2.615
46 GHz to 50 GHz 1.925 2.323 2.615 1 Tested with 0 dB source attenuator. VSWR is improved by increasing source attenuator value.
Table 2k. Input VSWR1, without Option 029 or S93029A - Specifications
Description N5227x
Options 210, 410 N5227x
All Other Options N5247x
All Options
10 MHz to 50 MHz 1.289 3.01 3.01
50 MHz to 200 MHz 1.135 1.785 1.785
200 MHz to 500 MHz 1.153 1.785 1.785
500 MHz to 3.2 GHz 1.253 2.615 2.615
3.2 GHz to 10 GHz 1.329 2.615 2.615
10 GHz to 13.5 GHz 1.433 3.01 3.01
13.5 GHz to 16 GHz 1.577 3.01 3.01
16 GHz to 20 GHz 1.577 2.615 2.615
20 GHz to 26.5 GHz 1.671 2.615 2.615
26.5 GHz to 43.5 GHz 1.925 3.01 3.01
43.5 GHz to 50 GHz 1.925 3.01 3.01
50 GHz to 60 GHz 2.323 2.615 2.615
60 GHz to 67 GHz 2.323 3.01 3.01
67 GHz to 70 GHz2 1.785 1.925 1.925 1 Tested with 0 dB source attenuator. VSWR is improved by increasing source attenuator value. 2 Typical.

17 dataTec ▪ Ferdinand-Lassalle-Str. 52 ▪ 72770 Reutlingen ▪ Tel. 07121 / 51 50 50 ▪ Fax 07121 / 51 50 10 ▪ [email protected] ▪ www.datatec.de
17
Table 2l. Input VSWR - Specification
Description N5290A
All Options N5291A
All Options
10 MHz to 50 MHz 2.323 2.323 50 MHz to 200 MHz 3.570 3.570 200 MHz to 500 MHz 3.570 3.570 500 MHz to 2 GHz 3.570 3.570 2 GHz to 3.2 GHz 1.925 1.925 3.2 GHz to 10 GHz 2.323 2.323 10 GHz to 13.5 GHz 2.100 2.100 13.5 GHz to 16 GHz 2.100 2.100 16 GHz to 20 GHz 2.615 2.615 20 GHz to 24 GHz 2.323 2.323 24 GHz to 26.5 GHz 2.615 2.615 26.5 GHz to 40 GHz 3.570 3.570 40 GHz to 43.5 GHz 2.615 2.615 43.5 GHz to 50 GHz 3.010 3.010 50 GHz to 60 GHz 3.570 3.570 60 GHz to 64 GHz 3.010 3.010 64 GHz to 67 GHz 3.570 3.570 67 GHz to 90 GHz 3.010 3.010 90 GHz to 100 GHz -- 3.010 100 GHz to 110 GHz -- 4.420 110 GHz to 120 GHz -- 5.849

18 dataTec ▪ Ferdinand-Lassalle-Str. 52 ▪ 72770 Reutlingen ▪ Tel. 07121 / 51 50 50 ▪ Fax 07121 / 51 50 10 ▪ [email protected] ▪ www.datatec.de
18
Table 2m. Input VSWR1, with Option 029 or S93029A - Specifications
Description N5241x/42x/49x N5244x/45x N5247x
Port 1 Port 2 Ports 1, 2 Ports 1, 2
10 MHz to 50 MHz 1.785 1.785 1.925 3.57
50 MHz to 500 MHz 1.329 1.329 1.377 1.785
500 MHz to 3.2 GHz 1.329 1.329 1.577 2.615
3.2 GHz to 10 GHz 1.577 1.577 1.785 3.01
10 GHz to 16 GHz 1.577 1.577 1.785 3.01
16 GHz to 20 GHz 1.925 1.925 1.785 3.01
20 GHz to 26.5 GHz 1.925 1.925 2.323 3.01
26.5 GHz to 46 GHz 2.615 3.01
46 GHz to 50 GHz 3.01 3.01
50 GHz to 67 GHz 3.01
1 Tested with 0 dB source attenuator. VSWR is improved by increasing source attenuator value.

19 dataTec ▪ Ferdinand-Lassalle-Str. 52 ▪ 72770 Reutlingen ▪ Tel. 07121 / 51 50 50 ▪ Fax 07121 / 51 50 10 ▪ [email protected] ▪ www.datatec.de
19
Table 2n. Input VSWR1 - Specifications
Description N5231x/32x/39x N5234x/35x
Option 200/216 Option 400/416 All Options
300 kHz to 1 MHz 3.01 3.57
1 MHz to 10 MHz 2.1 1.499
10 MHz to 45 MHz 2.1 1.223 1.925
45 MHz to 500 MHz 1.173 1.223 1.289
500 MHz to 1 GHz 1.377 1.223 1.289
1 GHz to 2 GHz 1.377 1.289 1.289
2 GHz to 3 GHz 1.925 1.289 1.577
3 GHz to 5 GHz 1.925 1.499 1.577
5 GHz to 8.5 GHz 1.925 1.671 1.577
8.5 GHz to 11.5 GHz 2.323 1.671 1.785
11.5 GHz to 12.5 GHz 2.323 2.615 1.785
12.5 GHz to 20 GHz 2.1 2.615 2.1
20 GHz to 40 GHz 2.323
40 GHz to 50 GHz 3.57
1 Tested with 0 dB source attenuator. VSWR is improved by increasing source attenuator value.
Table 2o. Other Amplitude Accuracy - Supplemental Information
RBW Switching Uncertainty
< +/-0.02 dB, All RBW
Display Scale Fidelity
See dynamic accuracy specification in the analyzer data sheet. Specification applied to SA measurement class with user calibration between -10 dBm and -40 dBm input power and measurement between +10 dBm and -120 dBm input power.

20 dataTec ▪ Ferdinand-Lassalle-Str. 52 ▪ 72770 Reutlingen ▪ Tel. 07121 / 51 50 50 ▪ Fax 07121 / 51 50 10 ▪ [email protected] ▪ www.datatec.de
20
Dynamic Range Specifications
Table 3a. Spurious Response - Supplemental Information
Residual Response1 -60 dBm or lower level spurious may appear at 25, 50, 75 or 100 MHz.
Image Response Mostly eliminated. Intermittent image response may be seen when making multi-tone or modulated signal measurements.
LO Related Spurious Eliminated
1 Tested with 1 kHz RBW, source off with test port terminated. Spurious is detected when the signal level is higher than 6-sigma of noise deviation from the noise-mean level.
Table 3b. Displayed Average Noise Level (DANL)1 (dBm/Hz), At Test Ports - Specification
Description N5221x/
22x N5241x/ 42x/49x
N5224x/ 25x
N5244x/ 45x
N5227x N5247x N5290A N5291A
10 MHz to 200 MHz -94 -94 -84 -84 -84 -84 -81 -81
200 MHz to 800 MHz -122 -122 -108 -108 -115 -115 -113 -113
800 MHz to 3.2 GHz -135 -135 -130 -130 -132 -132 -125 -125
3.2 GHz to 8 GHz -135 -135 -130 -130 -133 -133 -129 -129
8 GHz to 16 GHz -132 -132 -133 -133 -136 -136 -129 -129
16 GHz to 20 GHz -132 -132 -130 -130 -136 -136 -129 -129
20 GHz to 24 GHz -129 -130 -130 -130 -136 -136 -129 -129
24 GHz to 26.5 GHz -122 -121 -130 -130 -136 -136 -129 -129
26.5 GHz to 34 GHz -124 -124 -122 -122 -120 -120
34 GHz to 50 GHz -124 -124 -118 -118 -120 -120
50 GHz to 67 GHz -116 -116 -120 -120
67 GHz to 70 GHz2 -121 -121 -120 -120
70 GHz to 75 GHz -120 -120
75 GHz to 90 GHz -115 -115
90 GHz to 110 GHz -115
110 GHz to 120 GHz -108
1 Tested with 10 kHz RBW, test port terminated, average detector, averaging type = Log, 0 dB attenuator, IF gain = max, image rejection = normal, random LO OFF. The specification is normalized to 1.2 Hz minimum available RBW, applied to random LO ON, and improved by approximately 13 dB by reversing test port couplers. 2 Typical for instruments only.

21 dataTec ▪ Ferdinand-Lassalle-Str. 52 ▪ 72770 Reutlingen ▪ Tel. 07121 / 51 50 50 ▪ Fax 07121 / 51 50 10 ▪ [email protected] ▪ www.datatec.de
21
Table 3c. Displayed Average Noise Level (DANL)1 (dBm/Hz), At Test Ports - Supplemental Information
N5242x DANL performance example compared to specification
N5245x DANL performance example compared to specification

22 dataTec ▪ Ferdinand-Lassalle-Str. 52 ▪ 72770 Reutlingen ▪ Tel. 07121 / 51 50 50 ▪ Fax 07121 / 51 50 10 ▪ [email protected] ▪ www.datatec.de
22
Table 3c. Displayed Average Noise Level (DANL)1 (dBm/Hz), At Test Ports - Supplemental Information (cont.)
N5227x DANL performance example compared to specification

23 dataTec ▪ Ferdinand-Lassalle-Str. 52 ▪ 72770 Reutlingen ▪ Tel. 07121 / 51 50 50 ▪ Fax 07121 / 51 50 10 ▪ [email protected] ▪ www.datatec.de
23
Table 3d. Displayed Average Noise Level (DANL)1 (dBm/Hz), At Test Ports - Typical
Description N5221x/
22x N5241x/ 42x/49x
N5224x/ 25x
N5244x/ 45x
N5227x N5247x N5290A N5291A
10 MHz to 200 MHz -97 -97 -87 -87 -87 -87 -92 -92
200 MHz to 800 MHz -132 -133 -122 -122 -129 -129 -119 -119
800 MHz to 3.2 GHz -140 -141 -135 -135 -137 -137 -130 -130
3.2 GHz to 8 GHz -140 -141 -135 -135 -137 -137 -133 -133
8 GHz to 16 GHz -139 -139 -140 -139 -141 -140 -133 -133
16 GHz to 24 GHz -139 -139 -137 -137 -141 -140 -133 -133
24 GHz to 26.5 GHz -136 -137 -137 -137 -141 -140 -133 -133
26.5 GHz to 34 GHz -130 -130 -129 -129 -133 -133
34 GHz to 50 GHz -130 -130 -125 -124 -124 -124
50 GHz to 67 GHz -124 -124 -124 -124
67 GHz to 70 GHz -121 -121 -124 -124
70 GHz to 90 GHz -121 -121
90 GHz to 110 GHz -121
110 GHz to 120 GHz -115
1 Tested with 10 kHz RBW, test port terminated, average detector, averaging type = Log, 0 dB attenuator, IF gain = max, image rejection = normal, random LO OFF. The specification is normalized to 1.2 Hz minimum available RBW, applied to random LO ON, and improved by approximately 13 dB by reversing test port couplers.

24 dataTec ▪ Ferdinand-Lassalle-Str. 52 ▪ 72770 Reutlingen ▪ Tel. 07121 / 51 50 50 ▪ Fax 07121 / 51 50 10 ▪ [email protected] ▪ www.datatec.de
24
Table 3e. Displayed Average Noise Level (DANL)1 (dBm/Hz), At Test Ports - Specification
Description N5231x/32x/39x N5234x/35x
10 MHz to 200 MHz -133 -87
200 MHz to 800 MHz -133 -118
800 MHz to 8.5 GHz -133 -128
8.5 GHz to 13.51 GHz -131 -128
13.51 GHz to 20 GHz -120 -118
20 GHz to 40 GHz -118
40 GHz to 50 GHz -107
1 Tested with 10 kHz RBW, test port terminated, average detector, averaging type = Log, 0 dB attenuator, IF gain = Auto, image rejection = normal, random LO OFF. The specification is normalized to 1.2 Hz minimum available RBW, applied to random LO ON, and improved by approximately 13 dB by reversing test port couplers.
Table 3f. Second Harmonic Distortion (SHI) - Supplemental Information
N5221x/22x/41x/42x/49x
N5224x/25x/44x/45x
25 dataTec ▪ Ferdinand-Lassalle-Str. 52 ▪ 72770 Reutlingen ▪ Tel. 07121 / 51 50 50 ▪ Fax 07121 / 51 50 10 ▪ [email protected] ▪ www.datatec.de
25
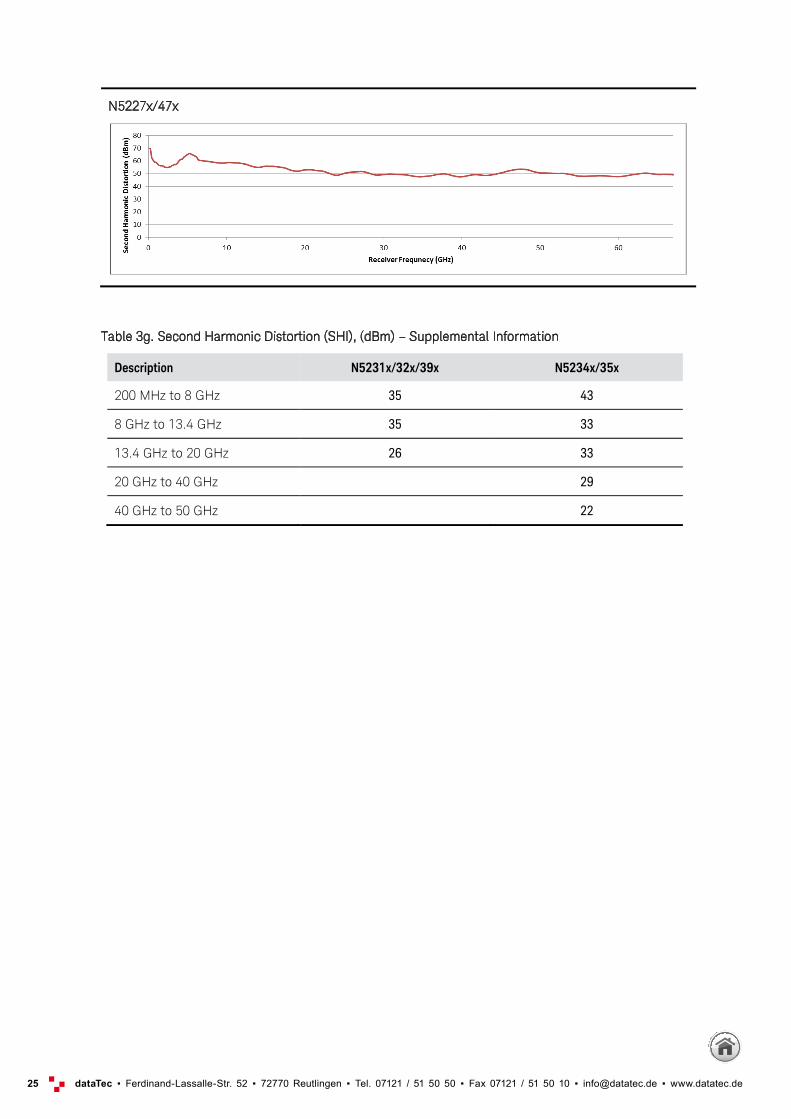
N5227x/47x
Table 3g. Second Harmonic Distortion (SHI), (dBm) – Supplemental Information
Description N5231x/32x/39x N5234x/35x
200 MHz to 8 GHz 35 43
8 GHz to 13.4 GHz 35 33
13.4 GHz to 20 GHz 26 33
20 GHz to 40 GHz 29
40 GHz to 50 GHz 22

26 dataTec ▪ Ferdinand-Lassalle-Str. 52 ▪ 72770 Reutlingen ▪ Tel. 07121 / 51 50 50 ▪ Fax 07121 / 51 50 10 ▪ [email protected] ▪ www.datatec.de
26
Table 3h. Third Order Intermodulation Distortion (TOI)1 (dBm) - Characteristic
Description N5221x/22x/ 41x/42x/49x
N5224x/25x/ 44x/45x
N5227x/47x
Distortion
(dBc) TOI (dBm)
Distortion (dBc)
TOI (dBm) Distortion
(dBc) TOI (dBm)
500 MHz to 3.2 GHz -60 20 -62 21 -64 22
3.2 GHz to 5 GHz -60 20 -62 21 -62 21
5 GHz to 8 GHz -56 18 -62 21 -62 21
8 GHz to 10 GHz -56 18 -62 21 -60 20
10 GHz to 13.5 GHz -50 15 -62 21 -60 20
13.5 GHz to 20 GHz -50 15 -56 18 -56 18
20 GHz to 26.5 GHz -38 9 -56 18 -56 18
26.5 GHz to 40 GHz -50 15 -52 16
40 GHz to 47 GHz -40 10 -44 12
47 GHz to 50 GHz -38 9 -38 9
50 GHz to 60 GHz -38 9
60 GHz to 67 GHz -28 4
1 Tested with -10 dBm input at test port, 10 MHz tone separations, 0 dBm receiver attenuator. Negligible (very high TOI) at < 500 MHz input frequency due to test port coupler roll off.

27 dataTec ▪ Ferdinand-Lassalle-Str. 52 ▪ 72770 Reutlingen ▪ Tel. 07121 / 51 50 50 ▪ Fax 07121 / 51 50 10 ▪ [email protected] ▪ www.datatec.de
27
Table 3i. Third Order Intermodulation Distortion (TOI)1 (dBm) - Characteristic
Description N5231x/32x/39x N5234x/35x
Distortion (dBc) TOI (dBm) Distortion (dBc) TOI (dBm)
100 MHz to 5 GHz -62 21 -60 20
5 GHz to 10 GHz -60 20 -60 20
10 GHz to 15 GHz -56 18 -52 16
15 GHz to 18 GHz -50 15 -52 16
18 GHz to 20 GHz -46 13 -52 16
20 GHz to 30 GHz -46 13
30 GHz to 40 GHz -42 11
40 GHz to 50 GHz -32 6
1 Tested with -10 dBm input at test port, 10 MHz tone separations, 0 dBm receiver attenuator. Negligible (very high TOI) at < 100 MHz input frequency due to test port coupler roll off.

28 dataTec ▪ Ferdinand-Lassalle-Str. 52 ▪ 72770 Reutlingen ▪ Tel. 07121 / 51 50 50 ▪ Fax 07121 / 51 50 10 ▪ [email protected] ▪ www.datatec.de
28
Table 3j. DANL and Distortion Relative to Test Port Level (dB), All Options - Nominal
N5221x/22x/41x/42x/49x
N5224x/25x/44x/45x

29 dataTec ▪ Ferdinand-Lassalle-Str. 52 ▪ 72770 Reutlingen ▪ Tel. 07121 / 51 50 50 ▪ Fax 07121 / 51 50 10 ▪ [email protected] ▪ www.datatec.de
29
Table 3j. DANL and Distortion Relative to Test Port Level (dB), All Options - Nominal (cont.)
N5227x/47x
N5231x/32x/39x

30 dataTec ▪ Ferdinand-Lassalle-Str. 52 ▪ 72770 Reutlingen ▪ Tel. 07121 / 51 50 50 ▪ Fax 07121 / 51 50 10 ▪ [email protected] ▪ www.datatec.de
30
Table 3j. DANL and Distortion Relative to Test Port Level (dB), All Options - Nominal (cont.)
N5234x/35x

31 dataTec ▪ Ferdinand-Lassalle-Str. 52 ▪ 72770 Reutlingen ▪ Tel. 07121 / 51 50 50 ▪ Fax 07121 / 51 50 10 ▪ [email protected] ▪ www.datatec.de
31
Table 3k. Receiver Phase Noise (dBc/Hz), N5221x/22x/31x/32x/39x/41x/42x/49x - Typical
Offset CF = 1 GHz CF = 3 GHz CF = 10 GHz CF = 20 GHz
1 kHz -108 -100 -90 -84
10 kHz -114 -103 -91 -85
100 kHz -115 -104 -92 -86
1 MHz -130 -126 -116 -110
10 MHz -132 -133 -130 -129
Table 3l. Receiver Phase Noise (dBc/Hz), N5224x/25x/44x/45x - Typical
Offset CF = 1 GHz CF = 3 GHz CF = 10 GHz CF = 20 GHz
1 kHz -107 -99 -89 -83
10 kHz -114 -103 -91 -85
100 kHz -115 -104 -92 -86
1 MHz -129 -126 -116 -110
10 MHz -131 -131 -129 -128
Table 3m. Receiver Phase Noise (dBc/Hz), N5227x/47x - Typical
Offset CF = 1 GHz CF = 3 GHz CF = 10 GHz CF = 20 GHz
1 kHz -105 -96 -85 -79
10 kHz -113 -103 -90 -84
100 kHz -114 -103 -92 -86
1 MHz -130 -126 -116 -110
10 MHz -131 -131 -130 -130
Table 3n. Receiver Phase Noise (dBc/Hz), N5290A - Typical
Offset CF=1 GHz CF=3 GHz CF=10 GHz CF=20 GHz CF=50 GHz CF=80 GHz CF=90 GHz
1 kHz -107 -98 -89 -83 -72 -70 -70
10 kHz -112 -104 -93 -87 -79 -75 -75
100 kHz -111 -100 -89 -83 -73 -70 -70
1 MHz -127 -123 -113 -107 -96 -95 -95
10 MHz -129 -132 -130 -128 -117 -115 -115

Ihr Spezialist fürMess- und Prüfgeräte
dataTec ▪ Ferdinand-Lassalle-Str. 52 ▪ 72770 Reutlingen ▪ Tel. 07121 / 51 50 50 ▪ Fax 07121 / 51 50 10 ▪ [email protected] ▪ www.datatec.de
Änd
erun
gen
und
Irrt
ümer
vor
beha
lten.
dat
aTec
02-
02-2
018
| © K
eysi
ght T
echn
olog
ies:
Edi
tion
8 Ja
nuar
y 30
, 201
8 | N
5224
-900
10
32
Table 3m. Receiver Phase Noise (dBc/Hz), N5291A - Typical
Offset CF=1 GHz CF=3 GHz CF=10 GHz CF=20 GHz CF=50 GHz CF=80 GHz CF=110 GHz CF=125 GHz
1 kHz -107 -98 -89 -83 -72 -70 -67 -66
10 kHz -112 -104 -93 -87 -79 -75 -72 -72
100 kHz -111 -100 -89 -83 -73 -70 -67 -67
1 MHz -127 -123 -113 -107 -96 -95 -91 -90
10 MHz -129 -132 -130 -128 -117 -115 -112 -105


