Key wordl energy stastti ics - Robert B....
80
Key world energy statistics Also available on smartphones and tablets 2016
Transcript of Key wordl energy stastti ics - Robert B....

Key wor ld energy stat ist icsAlso avai lab le on smartphones and tab lets
2016

KEY WORLDENERGY
STATISTICS
KEyWorld2016.indb 1 01/09/2016 11:38:32
IEA member countries: Australia
Austria Belgium
CanadaCzech RepublicDenmarkEstoniaFinlandFrance
GermanyGreece
HungaryIreland
ItalyJapan
KoreaLuxembourg
NetherlandsNew Zealand
NorwayPoland
PortugalSlovak RepublicSpain SwedenSwitzerlandTurkeyUnited Kingdom
United States
The European Commissionalso participates in
the work of the IEA.
Inte
rnat
ional E
nergy AgencySecure Sustainable
Tog
eth
er
KEyWorld2016.indb 2 01/09/2016 11:38:33

Dr. Fatih BirolExecutive Director, International Energy Agency
ForewordThe IEA was established in November 1974 to promote energy security and provide authoritative analysis on energy for its member countries and beyond. From the beginning, energy statistics have been and remain at the heart of all the work of the IEA. They provide a comprehensive view on energy production, transformation and final use, the factors that influence energy choices such asprices and RD&D and the wider impact of energy use on CO2 emissions. Over the years with the cooperation of energy statisticians around the world, the IEA has gained recognition as one of the world’s most authoritative sources for energy statistics. The purpose of producing energy statistics is to use them to monitor changes in energy production and use, inform debate and provide a wider understanding of energy. In Key World Energy Statistics (KWES), we look to highlight some of the key facts and trends from across the vast number of datasets the IEA produces to enable everyone to know more about energy. So if you want to know who are the top ten producers of oil or coal or the leading exporters of gas, what has been the evolution of electricity production since 1971, how energy use contributes to CO2 emissions or if you simply want to see the world picture of energy production and use – that information and more is in KWES. KWES is a summary of the comprehensive data made available by the IEA via its website: http://www.iea.org/statistics/. It is also available in app form for all major mobile devices.Because energy plays such a vital role in our lives today, I hope that these statistics will not only inform but also help policymakers and others to make wise decisions so that energy is produced and consumedinasecure,affordable,efficientandsustainablemanner.As I like to say, in the world of energy, data always wins. I would therefore like to thank Duncan Millard, the IEA Chief Statistician and his excellent team for their work in ensuring we all have the data needed to gain a comprehensive understanding of energy.
IEA member countries: Australia
Austria Belgium
CanadaCzech RepublicDenmarkEstoniaFinlandFrance
GermanyGreece
HungaryIreland
ItalyJapan
KoreaLuxembourg
NetherlandsNew Zealand
NorwayPoland
PortugalSlovak RepublicSpain SwedenSwitzerlandTurkeyUnited Kingdom
United States
The European Commissionalso participates in
the work of the IEA.
KEyWorld2016.indb 3 01/09/2016 11:38:34

TABLE
OF
CONTENTS
Supply
Transformation
Consumption
Energy balances
Prices
Emissions
Outlook
Energy indicators
Conversion factors
Glossary
KEyWorld2016.indb 4 01/09/2016 11:38:34

TABLE
OF
CONTENTS
Supply
Transformation
Consumption
Energy balances
Prices
Emissions
Outlook
Energy indicators
Conversion factors
Glossary
KEyWorld2016.indb 5 01/09/2016 11:38:34
6
Supply
Total pr imary energy supply by fuel
World
Other3
Natural gasOilBiofuels and waste
Coal2 NuclearHydro
0
2 000
4 000
6 000
8 000
10 000
12 000
14 000
1971 1975 1980 1985 1990 1995 2000 2005 2010 2014
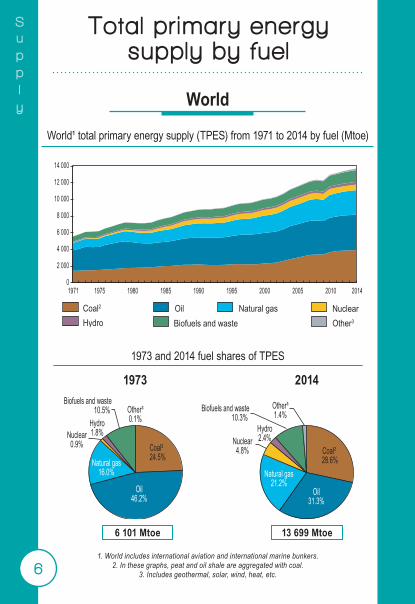
World¹ total primary energy supply (TPES) from 1971 to 2014 by fuel (Mtoe)
1973 and 2014 fuel s hares of TPES
1. World includes international aviation and international marine bunkers. 2. In these graphs, peat and oil shale are aggregated with coal.
3. Includes geothermal, solar, wind, heat, etc.
6 101 Mtoe 13 699 Mtoe
Coal² 28.6%
Oil31.3%
Natural gas21.2%
Nuclear4.8%
Hydro2.4%
Biofuels and waste10.3%
Other³1.4%
Coal²24.5%
Oil46.2%
Natural gas16.0%
Nuclear0.9%
Hydro1.8%
Biofuels and waste10.5% Other³
0.1%
1973 2014
KEyWorld2016.indb 6 01/09/2016 11:38:34

7
Supply
Total pr imary energy supply by fuel
OECD
Other3
Natural gasOilBiofuels and waste
Coal2 NuclearHydro
0
1 000
2 000
3 000
4 000
5 000
6 000
1971 1975 1980 1985 1990 1995 2000 2005 2010 2015
OECD total primary energy supply1 from 1971 to 2015 by fuel (Mtoe)
1973 and 2015 fuel shares of TPES1
1. Excludes electricity trade.2. In these graphs, peat and oil shale are aggregated with coal.
3. Includes geothermal, solar, wind, heat, etc.
Coal² 18.0%
Oil36.1%
Natural gas26.0%
Nuclear9.8%
Hydro2.2%
Biofuels and waste5.8%
Other³2.1%
Coal²22.6%
Oil52.6%
Natural gas18.9%
Nuclear1.3%
Hydro2.1% Biofuels
and waste2.3%
Other³0.2%
3 740 Mtoe 5 269 Mtoe
1973 2015
KEyWorld2016.indb 7 01/09/2016 11:38:34

8
Supply
World
Non-OECD Europe and EurasiaNon-OECD AmericasAsia1
Middle EastChinaOECD
Bunkers2Africa
0
2 000
4 000
6 000
8 000
10 000
12 000
14 000
16 000
1971 1975 1980 1985 1990 1995 2000 2005 2010 2014
World total primary energy supply from 1971 to 2014 by region (Mtoe)
1973 and 2014 regional shares of TPES
6 101 Mtoe 13 699 Mtoe1. Asia excludes China and OECD countries of Asia.
2. Includes international aviation and international marine bunkers.
OECD61.3%
Middle East 0.8%
Non-OECD Europe
and Eurasia15.5%
China 7.0%
Asia¹ 5.5%
Non-OECDAmericas
3.5% Non-OECDAmericas
4.7%
Africa3.4%
OECD38.4%
Middle East5.3%
Non-OECD Europe and Eurasia
8.2%
Asia¹12.7%
Africa5.6%
Bunkers²2.7%
China22.4%
Bunkers²3.0%
1973 2014
Total pr imary energy supply by region
KEyWorld2016.indb 8 01/09/2016 11:38:34

9
Supply
OECD
OECD EuropeOECD Asia OceaniaOECD Americas
0
1 000
2 000
3 000
4 000
5 000
6 000
1971 1975 1980 1985 1990 1995 2000 2005 2010 2015
1973 and 2015 regional shares of TPES1
3 740 Mtoe 5 269 Mtoe1. Excludes electricity trade.
1973 2015
OECDAmericas52.1%
OECD AsiaOceania11.1% OECD
Europe 36.8%
OECDAmericas50.9%
OECD AsiaOceania16.8%
OECDEurope 32.3%
OECD total primary energy supply1 from 1971 to 2015 by region (Mtoe)
Total pr imary energy supply by region
KEyWorld2016.indb 9 01/09/2016 11:38:35

10
Supply
Crude oil production
Non-OECD Europe and EurasiaChina
Middle EastNon-OECD Americas AfricaAsia2
OECD
0 500
1 0001 5002 0002 5003 0003 5004 0004 5005 000
1971 1975 1980 1985 1990 1995 2000 2005 2010 2015
Crude oil1 production from 1971 to 2015 by region (Mt)
1973 and 2015 regional shares of crude oil1 production
1. Includes crude oil, NGL, feedstocks, additives and other hydrocarbons.2. Asia excludes China and OECD countries of Asia.
1973 2015
OECD23.9%
OECD25.3%
Middle East36.7%Non-OECD Europe
and Eurasia15.7%
Asia²3.2%
Non-OECD Americas8.5%
Non-OECD Americas9.4%
Africa10.1%
Middle East31.5%
China1.9%
Non-OECD Europe and Eurasia
15.8%
Asia²3.9%
Africa9.1%
China5.0%
2 869 Mt 4 331 Mt
KEyWorld2016.indb 10 01/09/2016 11:38:35

Supply
11
Producers, net exporters and net importers of crude oil1
Net importers Mt
United States 344
People’s Rep. of China 308
India 189
Japan 165
Korea 126
Germany 89
Spain 61
Italy 59
France 54
Netherlands 54
Others 509
Total 1 958
Net exporters Mt
Saudi Arabia 354
Russian Federation 222
United Arab Emirates 125
Iraq 124
Nigeria 111
Canada 104
Kuwait 101
Venezuela 91
Angola 81
Kazakhstan 64
Others 515
Total 1 8922015 provisional data
2014 data
2014 data
1. Includes production of crude oil, NGL, feedstocks, additives and other hydrocarbons. Excludes liquids from other fuel sources
(renewable, coal and natural gas).
% ofProducers Mt world total
Saudi Arabia 572 13.2United States 567 13.1Russian Federation 533 12.3Canada 221 5.1People’s Rep. of China 215 5.0Iraq 175 4.0Islamic Rep. of Iran 168 3.9United Arab Emirates 160 3.7Kuwait 160 3.7Venezuela 144 3.3
Rest of the world 1 416 32.7
World 4 331 100.0
KEyWorld2016.indb 11 01/09/2016 11:38:35
12
Supply
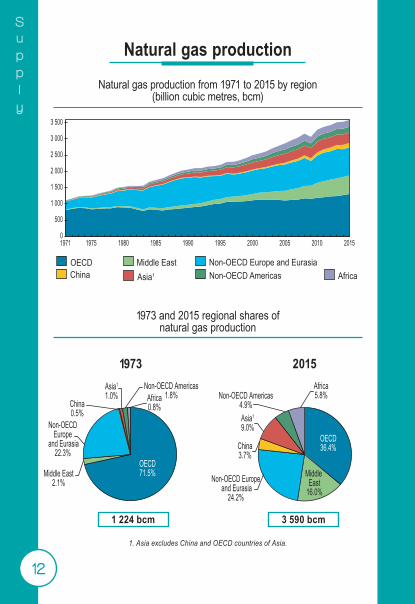
OECD71.5%
OECD36.4%
Middle East2.1%
Non-OECD Europe
and Eurasia22.3%
Asia1
1.0%Non-OECD Americas
1.8% Non-OECD Americas4.9%
Africa0.8%
Middle East
16.0%
China0.5%
Non-OECD Europe and Eurasia
24.2%
Asia1
9.0%
Africa5.8%
China3.7%
Natural gas production
Non-OECD Europe and EurasiaChina
Middle EastNon-OECD Americas AfricaAsia1
OECD
0
500
1 000
1 500
2 000
2 500
3 000
3 500
1971 1975 1980 1985 1990 1995 2000 2005 2010 2015
Natural gas production from 1971 to 2015 by region (billion cubic metres, bcm)
1973 and 2015 regional shares of natural gas production
1 224 bcm 3 590 bcm
1. Asia excludes China and OECD countries of Asia.
1973 2015
KEyWorld2016.indb 12 01/09/2016 11:38:35

13
Supply
Producers, net exporters and net importers1 of natural gas
Net importers bcm
Japan 117
Germany 73
Italy 61
People’s Rep. of China 56
Turkey 48
Korea 43
France 39
Mexico 37
United Kingdom 31
Spain 27
Others 280
Total 812
Net exporters bcm
Russian Federation 192
Qatar 115
Norway 115
Canada 59
Turkmenistan 51
Algeria 44
Indonesia 33
Australia 28
Malaysia 25
Nigeria 25
Others 143
Total 8302015 provisional data
2015 provisional data
2015 provisional data1. Net exports and net imports include pipeline gas and LNG.
% ofProducers bcm world total
United States 769 21.4
Russian Federation 638 17.8
Islamic Rep. of Iran 184 5.1
Qatar 164 4.6
Canada 164 4.6
People’s Rep. of China 134 3.7
Norway 122 3.4
Saudi Arabia 87 2.4
Turkmenistan 83 2.3
Algeria 82 2.3
Rest of the world 1 163 32.4
World 3 590 100.0
KEyWorld2016.indb 13 01/09/2016 11:38:36

14
Supply
Coal production
Non-OECD Europe and EurasiaChina
Middle EastNon-OECD Americas AfricaAsia2
OECD
01 0002 0003 0004 0005 0006 0007 0008 0009 000
1971 1975 1980 1985 1990 1995 2000 2005 2010 2015
Coal1 production from 1971 to 2015 by region (Mt)
1973 and 2015 regional shares of coal1 production
3 074 Mt 7 709 Mt1. Includes steam coal, coking coal, lignite and recovered coal.
2. Asia excludes China and OECD countries of Asia.
1973 2015
OECD55.6%
Non-OECDEurope andEurasia24.5% Non-OECD
Europe andEurasia8.1%
China13.6%
Asia2
3.9%Africa 3.5%
Non-OECDAmericas0.2% Non-OECD
Americas1.3%Africa 2.2%
OECD24.7%
China45.7%
Asia2
16.7%
KEyWorld2016.indb 14 01/09/2016 11:38:36

15
Supply
Producers, net exporters and net importers of coal1
Net importers Mt
India 221
People’s Rep. of China 199
Japan 192
Korea 135
Chinese Taipei 66
Germany 54
Turkey 34
United Kingdom 25
Malaysia 24
Thailand 23
Others 233
Total 1 206
Net exporters Mt
Australia 392
Indonesia 365
Russian Federation 129
Colombia 82
South Africa 76
United States 57
Kazakhstan 27
Canada 23
DPR of Korea 19
Mongolia 14
Others 9
Total 1 1932015 provisional data
2015 provisional data
2015 provisional data1. Includes steam coal, coking coal, lignite
and recovered coal.
% ofProducers Mt world total
People’s Rep. of China 3 527 45.8
United States 813 10.5
India 691 9.0
Australia 509 6.6
Indonesia 469 6.1
Russian Federation 349 4.5
South Africa 252 3.3
Germany 185 2.4
Poland 136 1.8
Kazakhstan 107 1.4
Rest of the world 671 8.6
World 7 709 100.0
KEyWorld2016.indb 15 01/09/2016 11:38:36

16
Supply
Nuclear production
Non-OECD Europe and Eurasia
Other2ChinaAsia1OECD
0
500
1 000
1 500
2 000
2 500
3 000
1971 1975 1980 1985 1990 1995 2000 2005 2010 2014
Nuclear production from 1971 to 2014 by region (TWh)
1973 and 2014 regional shares of nuclear production
203 TWh 2 535 TWh
1. Asia excludes China and OECD countries of Asia.2. Other includes Africa, Non-OECD Americas and the Middle East.
1973 2014
OECD92.8%
OECD78.1%
Non-OECDEurope andEurasia5.9%
Non-OECDEurope andEurasia11.8%
Asia1
1.3% Asia1 3.3%China 5.2%
Other2
1.6%
KEyWorld2016.indb 16 01/09/2016 11:38:37
17
Supply
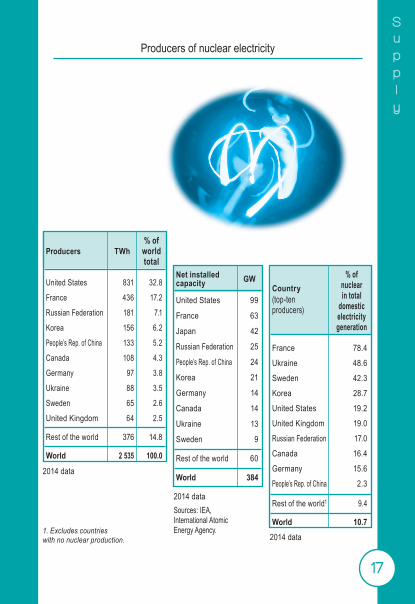
Producers of nuclear electricity
Net installed capacity GW
United States 99
France 63
Japan 42
Russian Federation 25
People’s Rep. of China 24
Korea 21
Germany 14
Canada 14
Ukraine 13
Sweden 9
Rest of the world 60
World 3842014 data
2014 dataSources: IEA, International Atomic Energy Agency.1. Excludes countries
with no nuclear production.
% ofProducers TWh world total
United States 831 32.8
France 436 17.2
Russian Federation 181 7.1
Korea 156 6.2
People’s Rep. of China 133 5.2
Canada 108 4.3
Germany 97 3.8
Ukraine 88 3.5
Sweden 65 2.6
United Kingdom 64 2.5
Rest of the world 376 14.8
World 2 535 100.0
% ofCountry nuclear(top-ten in totalproducers) domestic electricity generation
France 78.4
Ukraine 48.6
Sweden 42.3
Korea 28.7
United States 19.2
United Kingdom 19.0
Russian Federation 17.0
Canada 16.4
Germany 15.6
People’s Rep. of China 2.3
Rest of the world1 9.4
World 10.72014 data
KEyWorld2016.indb 17 01/09/2016 11:38:37

18
Supply
Hydro production
Non-OECD Europe and EurasiaChina
Middle EastNon-OECD Americas AfricaAsia2
OECD
0 500
1 0001 5002 0002 5003 0003 5004 0004 500
1971 1975 1980 1985 1990 1995 2000 2005 2010 2014
Hydro production1 from 1971 to 2014 by region (TWh)
1973 and 2014 regional shares of hydro production1
1 296 TWh 3 983 TWh1. Includes electricity production from pumped storage.
2. Asia excludes China and OECD countries of Asia.
1973 2014
OECD71.8%
Middle East0.3%
Non-OECDEurope andEurasia11.6%
China 2.9%
Asia2 4.3%
Asia2 8.0%
Non-OECD Americas6.8%
Africa 2.3%
Middle East0.5%
Africa 3.2%
OECD36.8%
Non-OECDEurope and Eurasia 7.8%
China26.7%
Non-OECDAmericas17.0%
KEyWorld2016.indb 18 01/09/2016 11:38:37
19
Supply
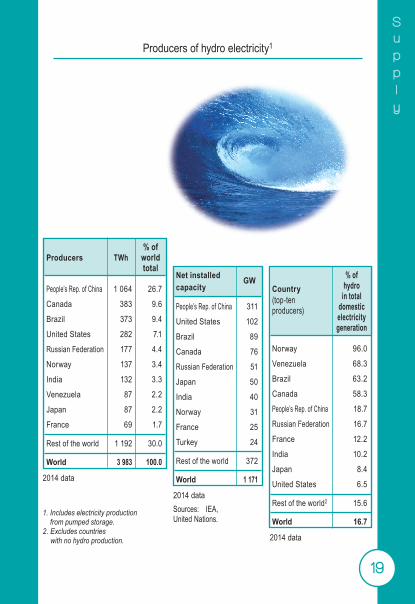
Producers of hydro electricity1
1. Includes electricity production from pumped storage.
2. Excludes countries with no hydro production.
% ofProducers TWh world total
People’s Rep. of China 1 064 26.7
Canada 383 9.6
Brazil 373 9.4
United States 282 7.1
Russian Federation 177 4.4
Norway 137 3.4
India 132 3.3
Venezuela 87 2.2
Japan 87 2.2
France 69 1.7
Rest of the world 1 192 30.0
World 3 983 100.0
2014 data
% ofCountry hydro(top-ten in totalproducers) domestic electricity generation
Norway 96.0
Venezuela 68.3
Brazil 63.2
Canada 58.3
People’s Rep. of China 18.7
Russian Federation 16.7
France 12.2
India 10.2
Japan 8.4
United States 6.5
Rest of the world2 15.6
World 16.7
Net installed GWcapacity
People’s Rep. of China 311
United States 102
Brazil 89
Canada 76
Russian Federation 51
Japan 50
India 40
Norway 31
France 25
Turkey 24
Rest of the world 372
World 1 171
2014 dataSources: IEA, United Nations.
2014 data
KEyWorld2016.indb 19 01/09/2016 11:38:37
20
Transf o r m a t i o n
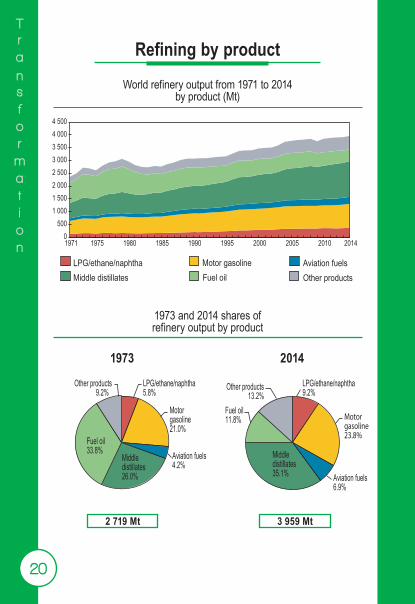
Refining by product
Other productsAviation fuels
Fuel oilMotor gasoline
Middle distillatesLPG/ethane/naphtha
2014 0
5001 0001 5002 0002 5003 0003 5004 0004 500
1971 1975 1980 1985 1990 1995 2000 2005 2010
World refinery output from 1971 to 2014 by product (Mt)
1973 and 2014 shares of refinery output by product
2 719 Mt 3 959 Mt
1973 2014
LPG/ethane/naphtha5.8%
Motorgasoline21.0%
Aviation fuels 4.2%
Middledistillates26.0%
Fuel oil33.8%
Other products9.2%
Aviation fuels 6.9%
Other products13.2%
Fuel oil11.8%
LPG/ethane/naphtha9.2%
Motorgasoline23.8%
Middledistillates35.1%
KEyWorld2016.indb 20 01/09/2016 11:38:38

21
Transf o r m a t i o n
Producers, net exporters and net importers of oil products
Net importers Mt
Japan 29
Singapore 26
Indonesia 23
France 22
Mexico 19
Australia 18
Brazil 18
Germany 16
Hong Kong, China 16
Turkey 16
Others 294
Total1 497
Net exporters Mt
Russian Federation 116
United States 86
India 45
Saudi Arabia 41
Kuwait 29
Algeria 21
Venezuela 21
Qatar 20
Korea 19
Belarus 14
Others 141
Total1 5532014 data
2014 data
2014 data
% ofProducers Mt world total
United States 820 20.7
People’s Rep. of China 485 12.3
Russian Federation 283 7.1
India 228 5.8
Japan 163 4.1
Korea 129 3.3
Brazil 113 2.9
Saudi Arabia 107 2.7
Germany 97 2.5
Canada 89 2.2
Rest of the world 1 445 36.4
World 3 959 100.0
1. The discrepancy between total net exports and total net imports
arises from different data sources and possible misallocation
of bunkers into exports for some countries.
KEyWorld2016.indb 21 01/09/2016 11:38:38

22
Transf o r m a t i o n
Refining by region
Non-OECD Europe and EurasiaChina
Middle EastNon-OECD Americas AfricaAsia2
OECD
0
1 000
2 000
3 000
4 000
5 000
1971 1975 1980 1985 1990 1995 2000 2005 2010 2014
World refinery intake1 from 1971 to 2014 by region (Mt)
1973 and 2014 regional shares of refinery intake1
2 739 Mt 4 045 Mt1. Includes crude oil, NGL, refinery feedstocks, additives and other hydrocarbons.
2. Asia excludes China and OECD countries of Asia.
1973 2014
OECD48.5%OECD
67.0%Middle East
3.7%
Non-OECDEurope and
Eurasia13.9%
China 1.5%
China12.5%
Asia2 3.3%
Asia2
12.2%
Non-OECD Americas8.8% Africa 1.8% Non-OECD
Americas6.3%
Africa 2.7%
Non-OECDEurope and Eurasia
9.5% Middle East 8.3%
KEyWorld2016.indb 22 01/09/2016 11:38:38

23
Transf o r m a t i o n
Refinery capacity, net exporters and net importers of oil1
Net importers Mt
People’s Rep. of China 320
United States 258
Japan 195
India 145
Korea 107
Germany 105
France 76
Singapore 67
Spain 58
Italy 50
Others 707
Total 2 088
Net exporters Mt
Saudi Arabia 396
Russian Federation 338
Kuwait 131
United Arab Emirates 117
Canada 114
Venezuela 112
Iraq 110
Nigeria 103
Angola 77
Norway 74
Others 506
Total 2 0782015 data
2014 data
2014 data1. Includes crude oil and oil products.
Crude % ofdistillation kb/cd worldcapacity total
United States 17 996 18.5
People’s Rep. of China 13 160 13.5
Russian Federation 6 291 6.5
India 4 694 4.8
Japan 3 865 4.0
Korea 3 296 3.4
Saudi Arabia 2 906 3.0
Brazil 2 175 2.2
Germany 2 022 2.1
Canada 1 980 2.0
Rest of the world 38 813 40.0
World 97 198 100.0
KEyWorld2016.indb 23 01/09/2016 11:38:39
24
Transf o r m a t i o n
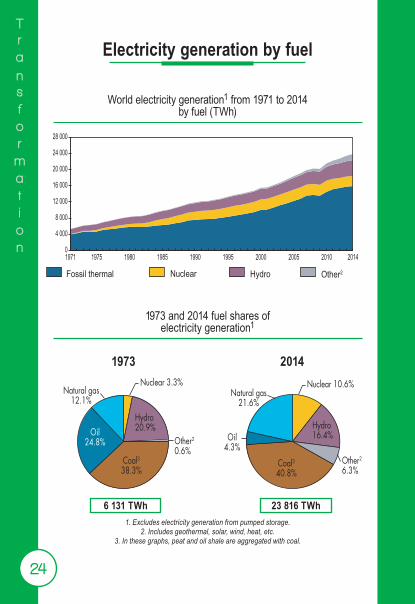
Electricity generation by fuel
Hydro Other2NuclearFossil thermal
0
4 000
8 000
12 000
16 000
20 000
24 000
28 000
1971 1975 1980 1985 1990 1995 2000 2005 2010 2014
World electricity generation1 from 1971 to 2014 by fuel (TWh)
1973 and 2014 fuel shares of electricity generation1
6 131 TWh 23 816 TWh1. Excludes electricity generation from pumped storage.
2. Includes geothermal, solar, wind, heat, etc.3. In these graphs, peat and oil shale are aggregated with coal.
Nuclear 3.3%
Other2
0.6%
Oil24.8%
Natural gas12.1%
Coal338.3%
Natural gas21.6%
Oil4.3%
Coal340.8%
Other2
6.3%
Hydro16.4%
Hydro20.9%
Nuclear 10.6%
1973 2014
KEyWorld2016.indb 24 01/09/2016 11:38:39

25
Transf o r m a t i o n
Electricity production from fossil fuels
Natural gas TWh
United States 1 161
Russian Federation 533
Japan 421
Islamic Rep. of Iran 196
Mexico 172
Saudi Arabia 160
Egypt 135
Korea 130
Turkey 121
Thailand 119
Rest of the world 2 007
World 5 155
Oil TWh
Saudi Arabia 152
Japan 116
Islamic Rep. of Iran 59
Iraq 50
Kuwait 43
Pakistan 42
United States 40
Brazil 35
Mexico 33
Indonesia 26
Rest of the world 427
World 1 023
2014 data
2014 data
2014 data
Coal1 TWh
People’s Rep. of China 4 115
United States 1 713
India 967
Japan 349
Germany 285
South Africa 232
Korea 232
Russian Federation 158
Australia 152
Poland 132
Rest of the world 1 372
World 9 707
1. In this table, peat and oil shale are aggregated with coal.
KEyWorld2016.indb 25 01/09/2016 11:38:39

26
Transf o r m a t i o n
Electricity generation by region
Non-OECD Europe and EurasiaChina
Middle EastNon-OECD Americas AfricaAsia2
OECD
0
4 000
8 000
12 000
16 000
20 000
24 000
28 000
1971 1975 1980 1985 1990 1995 2000 2005 2010 2014
World electricity generation1 from 1971 to 2014 by region (TWh)
1973 and 2014 regional shares of electricity generation1
6 131 TWh 23 816 TWh1. Excludes electricity generation from pumped storage.
2. Asia excludes China and OECD countries of Asia.
OECD72.8% Middle East
0.5%
Non-OECDEurope andEurasia16.7%
China2.9%
Asia2
2.6%Non-OECD Americas2.7% Africa
1.8% Asia2
11.0%
Non-OECD Americas5.1%
Non-OECD Europeand Eurasia 7.3%
China24.0%
OECD45.2%
MiddleEast 4.2%
Africa3.2%
1973 2014
KEyWorld2016.indb 26 01/09/2016 11:38:40
27
Transf o r m a t i o n
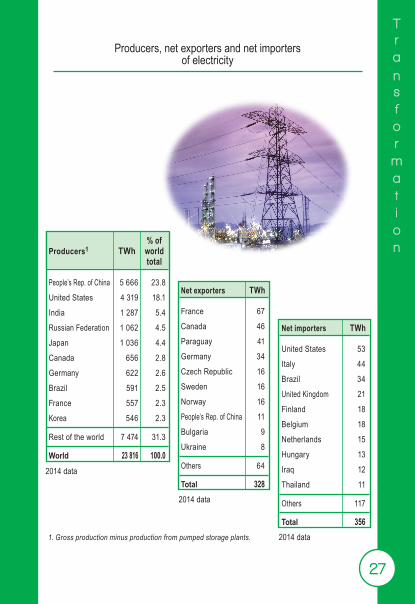
Producers, net exporters and net importers of electricity
Net importers TWh
United States 53
Italy 44
Brazil 34
United Kingdom 21
Finland 18
Belgium 18
Netherlands 15
Hungary 13
Iraq 12
Thailand 11
Others 117
Total 356
Net exporters TWh
France 67
Canada 46
Paraguay 41
Germany 34
Czech Republic 16
Sweden 16
Norway 16
People’s Rep. of China 11
Bulgaria 9
Ukraine 8
Others 64
Total 3282014 data
2014 data
2014 data*1. Gross production minus production from pumped storage plants.
% ofProducers1 TWh world total
People’s Rep. of China 5 666 23.8
United States 4 319 18.1
India 1 287 5.4
Russian Federation 1 062 4.5
Japan 1 036 4.4
Canada 656 2.8
Germany 622 2.6
Brazil 591 2.5
France 557 2.3
Korea 546 2.3
Rest of the world 7 474 31.3
World 23 816 100.0
KEyWorld2016.indb 27 01/09/2016 11:38:40
28
Consum p t i o n
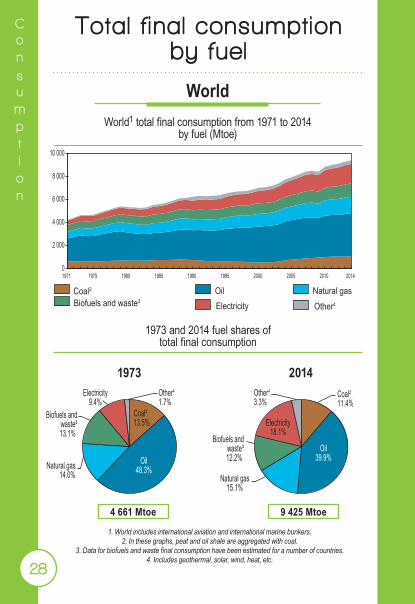
World
Other4
Natural gasBiofuels and waste3Coal2
ElectricityOil
0
2 000
4 000
6 000
8 000
10 000
1971 1975 1980 1985 1990 1995 2000 2005 2010 2014
World1 total final consumption from 1971 to 2014 by fuel (Mtoe)
1973 and 2014 fuel shares of total final consumption
1. World includes international aviation and international marine bunkers.2. In these graphs, peat and oil shale are aggregated with coal.
3. Data for biofuels and waste final consumption have been estimated for a number of countries.4. Includes geothermal, solar, wind, heat, etc.
1973 2014
Coal²13.5%
Oil48.3%Natural gas
14.0%
Biofuels andwaste³13.1%
Electricity9.4%
Other4
1.7%
Biofuels andwaste³12.2%
Electricity18.1%
Other4
3.3%Coal²11.4%
Oil39.9%
Natural gas15.1%
4 661 Mtoe 9 425 Mtoe
Total f inal consumption by fuel
KEyWorld2016.indb 28 01/09/2016 11:38:40

29
Consum p t i o n
OECD
Other2
Natural gasBiofuels and wasteCoal1
ElectricityOil
0
500
1 000
1 500
2 000
2 500
3 000
3 500
4 000
1971 1975 1980 1985 1990 1995 2000 2005 2010 2014
OECD total final consumption from 1971 to 2014 by fuel (Mtoe)
1973 and 2014 fuel shares of total final consumption
1. In these graphs, peat and oil shale are aggregated with coal.2. Includes geothermal, solar, wind, heat, etc.
1973 2014
Coal¹10.8%
Oil 56.3%
Natural gas17.7%
Biofuels andwaste 3.0%
Electricity 11.5%
Electricity22.1%
Other² 0.7%
Oil47.2%
Biofuels and waste
5.5% Natural gas20.3%
Other²1.8%
Coal¹3.1%
2 816 Mtoe 3 629 Mtoe
Total f inal consumption by fuel
KEyWorld2016.indb 29 01/09/2016 11:38:40

30
Consum p t i o n
OECD60.3%
Middle East 0.7%
Non-OECD Europe and Eurasia13.6%
China 7.8%
Asia² 6.3%
Non-OECDAmericas 3.6%
Africa 3.7% Bunkers³ 4.0% Bunkers³ 3.9% Africa 5.9%
Non-OECDAmericas 5.0%
Non-OECD Europe and Eurasia 7.6%
Asia² 12.9%
Middle East5.1%
OECD38.4%
China21.2%
World
4 661 Mtoe 9 425 Mtoe
1. Data for biofuels and waste final consumption have been estimated for a number of countries. 2. Asia excludes China and OECD countries of Asia.
3. Includes international aviation and international marine bunkers.
1973 2014
Non-OECD Europe and EurasiaAsia2
Middle EastChinaOECD
Bunkers3AfricaNon-OECD Americas
0
2 000
4 000
6 000
8 000
10 000
1971 1975 1980 1985 1990 1995 2000 2005 2010 2014
1973 and 2014 regional shares of total final consumption1
World total final consumption1 from 1971 to 2014 by region (Mtoe)
Total f inal consumption by region
KEyWorld2016.indb 30 01/09/2016 11:38:41
31
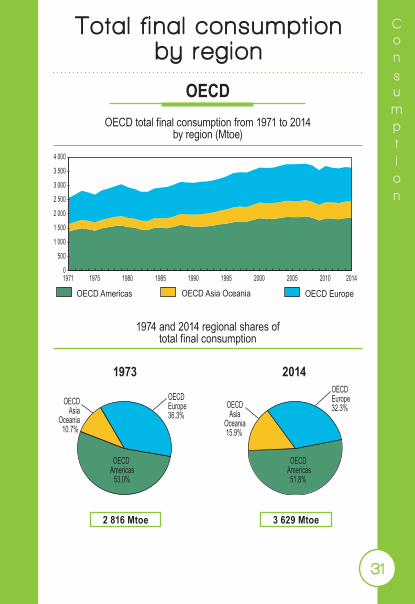
Consum p t i o n
1974 and 2014 regional shares of total final consumption
2 816 Mtoe 3 629 Mtoe
1973 2014
OECDOECD total final consumption from 1971 to 2014
by region (Mtoe)
OECD EuropeOECD Asia OceaniaOECD Americas
0
500
1 000
1 500
2 000
2 500
3 000
3 500
4 000
1971 1975 1980 1985 1990 1995 2000 2005 2010 2014
OECDEurope36.3%
OECDAsia
Oceania10.7%
OECDAsia
Oceania15.9%
OECDEurope32.3%
OECD Americas
53.0%
OECD Americas51.8%
Total f inal consumption by region
KEyWorld2016.indb 31 01/09/2016 11:38:41
32
Consum p t i o n
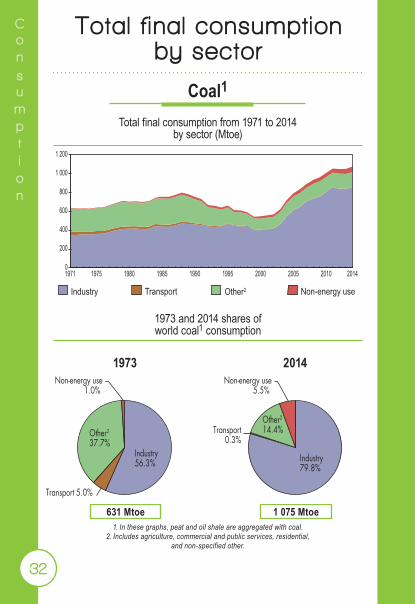
Coal1
Other2Transport Non-energy useIndustry
0
200
400
600
800
1 000
1 200
1971 1975 1980 1985 1990 1995 2000 2005 2010 2014
Total final consumption from 1971 to 2014 by sector (Mtoe)
1973 and 2014 shares of world coal1 consumption
631 Mtoe 1 075 Mtoe
Industry56.3%
Transport 5.0%
Other2
37.7%
Non-energy use1.0%
Non-energy use5.5%
Transport0.3%
Other2
14.4%
Industry79.8%
1. In these graphs, peat and oil shale are aggregated with coal.2. Includes agriculture, commercial and public services, residential,
and non-specified other.
1973 2014
Total f inal consumption by sector
KEyWorld2016.indb 32 01/09/2016 11:38:41
33
Consum p t i o n
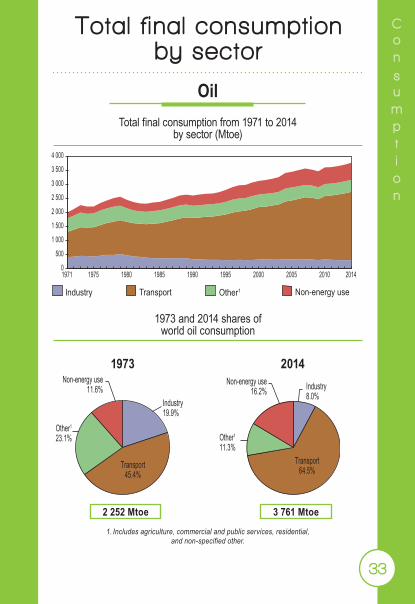
Oil
Other1 TransportIndustry Non-energy use
0
500
1 000
1 500
2 000
2 500
3 000
3 500
4 000
1971 1975 1980 1985 1990 1995 2000 2005 2010 2014
Total final consumption from 1971 to 2014 by sector (Mtoe)
1973 and 2014 shares of world oil consumption
2 252 Mtoe 3 761 Mtoe1. Includes agriculture, commercial and public services, residential,
and non-specified other.
1973 2014
Industry19.9%
Transport45.4%
Other1
23.1%
Non-energy use11.6%
Non-energy use16.2% Industry
8.0%
Transport64.5%
Other1
11.3%
Total f inal consumption by sector
KEyWorld2016.indb 33 01/09/2016 11:38:42

34
Consum p t i o n
Natural gas
Other1 TransportIndustry Non-energy use
0
300
600
900
1 200
1 500
1971 1975 1980 1985 1990 1995 2000 2005 2010 2014
Total final consumption from 1971 to 2014 by sector (Mtoe)
1973 and 2014 shares of world natural gas consumption
652 Mtoe 1 420 Mtoe1. Includes agriculture, commercial and public services, residential,
and non-specified other.
1973 2014
Industry54.7%
Industry38.6%
Transport 2.7%
Other1
39.8%
Non-energy use2.8%
Non-energy use11.3%
Other1
43.2%
Transport 6.9%
Total f inal consumption by sector
KEyWorld2016.indb 34 01/09/2016 11:38:42

35
Consum p t i o n
Electricity
Other1 TransportIndustry
0 200 400 600 800
1 0001 2001 4001 6001 800
1971 1975 1980 1985 1990 1995 2000 2005 2010 2014
Total final consumption from 1971 to 2014 by sector (Mtoe)
1973 and 2014 shares of world electricity consumption
440 Mtoe 1 706 Mtoe1. Includes agriculture, commercial and public services, residential,
and non-specified other.
1973 2014
Industry53.4%
Transport2.4%
Other1
44.2% Other1
56.0%
Industry42.5%
Transport1.5%
Total f inal consumption by sector
KEyWorld2016.indb 35 01/09/2016 11:38:42
36
Energy b a l a n c e s
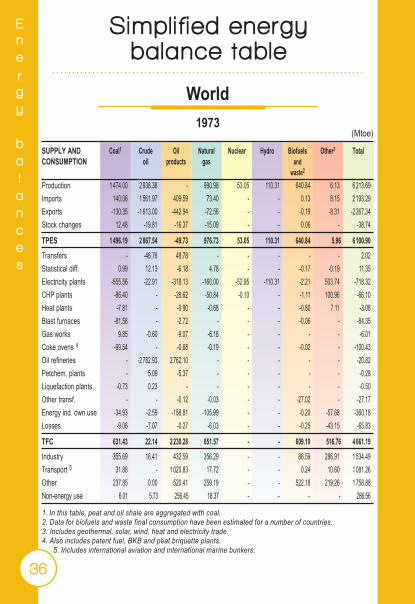
World1973
SUPPLY AND Coal1 Crude Oil Natural Nuclear Hydro Biofuels Other3 Total CONSUMPTION oil products gas and waste2 Production 1 474.00 2 938.38 - 990.98 53.05 110.31 640.84 6.13 6 213.69Imports 140.06 1 561.97 409.59 73.40 - - 0.13 8.15 2 193.29Exports -130.35 -1 613.00 -442.94 -72.56 - - -0.19 -8.31 -2 267.34Stock changes 12.48 -19.81 -16.37 -15.09 - - 0.06 - -38.74
TPES 1 496.19 2 867.54 -49.73 976.73 53.05 110.31 640.84 5.96 6 100.90Transfers - -46.76 48.78 - - - - - 2.02Statistical diff. 0.99 12.13 -6.18 4.78 - - -0.17 -0.19 11.35Electricity plants -555.56 -22.91 -318.13 -160.00 -52.95 -110.31 -2.21 503.74 -718.32CHP plants -86.40 - -28.62 -50.84 -0.10 - -1.11 100.96 -66.10Heat plants -7.81 - -0.90 -0.68 - - -0.80 7.11 -3.08Blast furnaces -81.58 - -2.72 - - - -0.06 - -84.35Gas works 9.85 -0.60 -9.07 -6.18 - - - - -6.01Coke ovens 4 -99.54 - -0.68 -0.19 - - -0.02 - -100.43Oil refineries - -2 782.93 2 762.10 - - - - - -20.82Petchem. plants - 5.09 -5.37 - - - - - -0.28Liquefaction plants -0.73 0.23 - - - - - - -0.50Other transf. - - -0.12 -0.03 - - -27.02 - -27.17Energy ind. own use -34.93 -2.59 -158.81 -105.99 - - -0.20 -57.68 -360.18Losses -9.06 -7.07 -0.27 -6.03 - - -0.25 -43.15 -65.83
TFC 631.43 22.14 2 230.28 651.57 - - 609.10 516.76 4 661.19Industry 355.69 16.41 432.59 356.29 - - 86.59 286.91 1 534.49Transport 5 31.88 - 1 020.83 17.72 - - 0.24 10.60 1 081.26Other 237.85 0.00 520.41 259.19 - - 522.18 219.26 1 758.88Non-energy use 6.01 5.73 256.45 18.37 - - - - 286.56
1. In this table, peat and oil shale are aggregated with coal.2. Data for biofuels and waste final consumption have been estimated for a number of countries.3. Includes geothermal, solar, wind, heat and electricity trade.4. Also includes patent fuel, BKB and peat briquette plants.
5. Includes international aviation and international marine bunkers.
(Mtoe)
Simpl i f ied energy balance table
KEyWorld2016.indb 36 01/09/2016 11:38:42
37
Energy b a l a n c e s
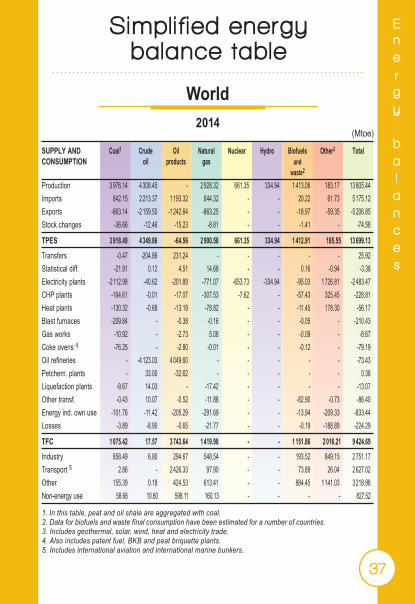
World2014
1. In this table, peat and oil shale are aggregated with coal.2. Data for biofuels and waste final consumption have been estimated for a number of countries.3. Includes geothermal, solar, wind, heat and electricity trade.4. Also includes patent fuel, BKB and peat briquette plants.5. Includes international aviation and international marine bunkers.
(Mtoe)
SUPPLY AND Coal1 Crude Oil Natural Nuclear Hydro Biofuels Other3 Total CONSUMPTION oil products gas and waste2 Production 3 976.14 4 308.45 - 2 928.32 661.35 334.94 1 413.06 183.17 13 805.44Imports 842.15 2 213.37 1 193.32 844.32 - - 20.22 61.73 5 175.12Exports -863.14 -2 159.50 -1 242.64 -863.25 - - -18.97 -59.35 -5 206.85Stock changes -36.66 -12.46 -15.23 -8.81 - - -1.41 - -74.58
TPES 3 918.49 4 349.86 -64.56 2 900.58 661.35 334.94 1 412.91 185.55 13 699.13Transfers -0.47 -204.86 231.24 - - - - - 25.92Statistical diff. -21.91 0.12 4.51 14.68 - - 0.16 -0.94 -3.38Electricity plants -2 112.98 -40.62 -201.89 -771.07 -653.73 -334.94 -95.03 1 726.81 -2 483.47CHP plants -164.61 -0.01 -17.07 -307.53 -7.62 - -57.43 325.45 -228.81Heat plants -130.32 -0.68 -13.19 -78.82 - - -11.45 178.30 -56.17Blast furnaces -209.84 - -0.38 -0.16 - - -0.05 - -210.43Gas works -10.92 - -2.73 5.08 - - -0.09 - -8.67Coke ovens 4 -76.25 - -2.80 -0.01 - - -0.12 - -79.19Oil refineries - -4 123.03 4 049.60 - - - - - -73.43Petchem. plants - 33.00 -32.62 - - - - - 0.38Liquefaction plants -9.67 14.03 - -17.42 - - - - -13.07Other transf. -0.43 10.07 -0.52 -11.88 - - -82.90 -0.73 -86.40Energy ind. own use -101.76 -11.42 -205.29 -291.69 - - -13.94 -209.33 -833.44Losses -3.89 -8.90 -0.65 -21.77 - - -0.19 -188.89 -224.29
TFC 1 075.42 17.57 3 743.64 1 419.98 - - 1 151.86 2 016.21 9 424.69Industry 858.49 6.80 294.67 548.54 - - 193.52 849.15 2 751.17Transport 5 2.86 - 2 426.33 97.90 - - 73.89 26.04 2 627.02Other 155.39 0.18 424.53 613.41 - - 884.45 1 141.03 3 218.98Non-energy use 58.68 10.60 598.11 160.13 - - - - 827.52
Simpl i f ied energy balance table
KEyWorld2016.indb 37 01/09/2016 11:38:42
38
Energy b a l a n c e s
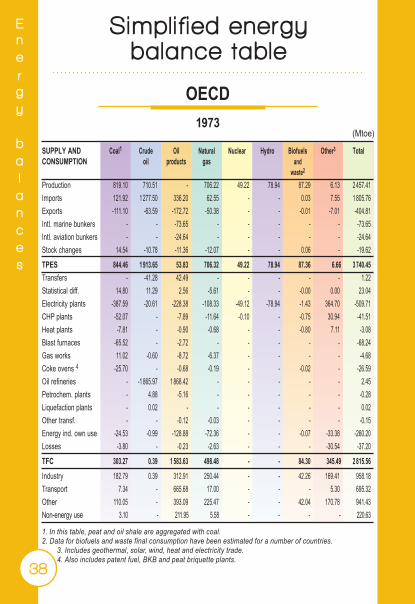
SUPPLY AND Coal1 Crude Oil Natural Nuclear Hydro Biofuels Other3 Total CONSUMPTION oil products gas and waste2 Production 819.10 710.51 - 706.22 49.22 78.94 87.29 6.13 2 457.41Imports 121.92 1 277.50 336.20 62.55 - - 0.03 7.55 1 805.76Exports -111.10 -63.59 -172.72 -50.38 - - -0.01 -7.01 -404.81Intl. marine bunkers - - -73.65 - - - - - -73.65Intl. aviation bunkers - - -24.64 - - - - - -24.64Stock changes 14.54 -10.78 -11.36 -12.07 - - 0.06 - -19.62TPES 844.46 1 913.65 53.83 706.32 49.22 78.94 87.36 6.66 3 740.45Transfers - -41.28 42.49 - - - - - 1.22Statistical diff. 14.80 11.29 2.56 -5.61 - - -0.00 0.00 23.04Electricity plants -387.59 -20.61 -228.38 -108.33 -49.12 -78.94 -1.43 364.70 -509.71CHP plants -52.07 - -7.89 -11.64 -0.10 - -0.75 30.94 -41.51Heat plants -7.81 - -0.90 -0.68 - - -0.80 7.11 -3.08Blast furnaces -65.52 - -2.72 - - - - - -68.24Gas works 11.02 -0.60 -8.72 -6.37 - - - - -4.68Coke ovens 4 -25.70 - -0.68 -0.19 - - -0.02 - -26.59Oil refineries - -1 865.97 1 868.42 - - - - - 2.45Petrochem. plants - 4.88 -5.16 - - - - - -0.28Liquefaction plants - 0.02 - - - - - - 0.02Other transf. - - -0.12 -0.03 - - - - -0.15Energy ind. own use -24.53 -0.99 -128.88 -72.36 - - -0.07 -33.38 -260.20Losses -3.80 - -0.23 -2.63 - - - -30.54 -37.20TFC 303.27 0.39 1 583.63 498.48 - - 84.30 345.49 2 815.56Industry 182.79 0.39 312.91 250.44 - - 42.26 169.41 958.18Transport 7.34 - 665.68 17.00 - - - 5.30 695.32Other 110.05 - 393.09 225.47 - - 42.04 170.78 941.43Non-energy use 3.10 - 211.95 5.58 - - - - 220.63
1. In this table, peat and oil shale are aggregated with coal.2. Data for biofuels and waste final consumption have been estimated for a number of countries.
3. Includes geothermal, solar, wind, heat and electricity trade.4. Also includes patent fuel, BKB and peat briquette plants.
OECD1973
(Mtoe)
Simpl i f ied energy balance table
KEyWorld2016.indb 38 01/09/2016 11:38:42
39
Energy b a l a n c e s
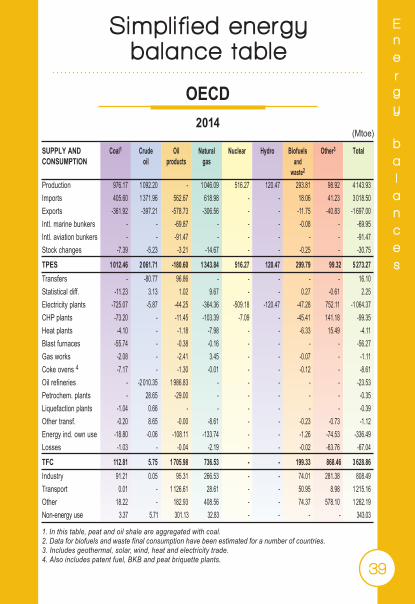
SUPPLY AND Coal1 Crude Oil Natural Nuclear Hydro Biofuels Other3 Total CONSUMPTION oil products gas and waste2 Production 976.17 1 092.20 - 1 046.09 516.27 120.47 293.81 98.92 4 143.93Imports 405.60 1 371.96 562.67 618.98 - - 18.06 41.23 3 018.50Exports -361.92 -397.21 -578.73 -306.56 - - -11.75 -40.83 -1 697.00Intl. marine bunkers - - -69.87 - - - -0.08 - -69.95Intl. aviation bunkers - - -91.47 - - - - - -91.47Stock changes -7.39 -5.23 -3.21 -14.67 - - -0.25 - -30.75TPES 1 012.46 2 061.71 -180.60 1 343.84 516.27 120.47 299.79 99.32 5 273.27Transfers - -80.77 96.86 - - - - - 16.10Statistical diff. -11.23 3.13 1.02 9.67 - - 0.27 -0.61 2.25Electricity plants -725.07 -5.87 -44.25 -364.36 -509.18 -120.47 -47.28 752.11 -1 064.37CHP plants -73.20 - -11.45 -103.39 -7.09 - -45.41 141.18 -99.35Heat plants -4.10 - -1.18 -7.98 - - -6.33 15.49 -4.11Blast furnaces -55.74 - -0.38 -0.16 - - - - -56.27Gas works -2.08 - -2.41 3.45 - - -0.07 - -1.11Coke ovens 4 -7.17 - -1.30 -0.01 - - -0.12 - -8.61Oil refineries - -2 010.35 1 986.83 - - - - - -23.53Petrochem. plants - 28.65 -29.00 - - - - - -0.35Liquefaction plants -1.04 0.66 - - - - - - -0.39Other transf. -0.20 8.65 -0.00 -8.61 - - -0.23 -0.73 -1.12Energy ind. own use -18.80 -0.06 -108.11 -133.74 - - -1.26 -74.53 -336.49Losses -1.03 - -0.04 -2.19 - - -0.02 -63.76 -67.04TFC 112.81 5.75 1 705.98 736.53 - - 199.33 868.46 3 628.86Industry 91.21 0.05 95.31 266.53 - - 74.01 281.38 808.49Transport 0.01 - 1 126.61 28.61 - - 50.95 8.98 1 215.16Other 18.22 - 182.93 408.56 - - 74.37 578.10 1 262.19Non-energy use 3.37 5.71 301.13 32.83 - - - - 343.03
1. In this table, peat and oil shale are aggregated with coal.2. Data for biofuels and waste final consumption have been estimated for a number of countries.3. Includes geothermal, solar, wind, heat and electricity trade.4. Also includes patent fuel, BKB and peat briquette plants.
OECD2014
(Mtoe)
Simpl i f ied energy balance table
KEyWorld2016.indb 39 01/09/2016 11:38:42

40
Prices
Crude oil
WTIDubaiNorth Sea
0
20
40
60
80
100
120
140
160
Jan-92 Jan-94 Jan-96 Jan-98 Jan-00 Jan-02 Jan-04 Jan-06 Jan-08 Jan-10 Jan-12 Jan-14 Jan-16
Average key crude oil spot prices in USD/barrel
Oil products
HFO Gasoil Gasoline
020406080
100120140160180
Jan-92 Jan-94 Jan-96 Jan-98 Jan-00 Jan-02 Jan-04 Jan-06 Jan-08 Jan-10 Jan-12 Jan-14 Jan-16
Average Rotterdam oil product spot prices in USD/barrel
Source for all prices: Based on Argus. Copyright © 2016 Argus Media Ltd - All rights reserved.
KEyWorld2016.indb 40 01/09/2016 11:38:43
41
Prices
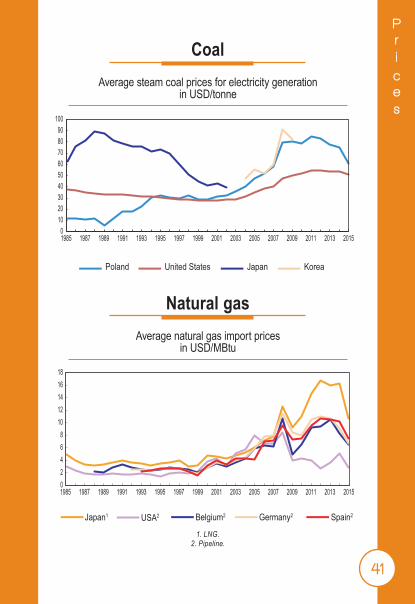
1. LNG.2. Pipeline.
Coal
Poland United States Japan Korea
0102030405060708090
100
1985 1987 1989 1991 1993 1995 1997 1999 2001 2003 2005 2007 2009 2011 2013 2015
Average steam coal prices for electricity generation in USD/tonne
Natural gas
Belgium2 Spain2Japan1 USA2 Germany2
02468
1012141618
1985 1987 1989 1991 1993 1995 1997 1999 2001 2003 2005 2007 2009 2011 2013 2015
Average natural gas import prices in USD/MBtu
KEyWorld2016.indb 41 01/09/2016 11:38:43

42
Prices
1. Prices are for 1st quarter 2016 or latest available quarter for oil products, and annual 2015 for other products. 2. Low sulphur fuel oil; high sulphur fuel oil for Canada, Ireland, Mexico, New Zealand, Turkey and the United States.
3. For commercial purposes.4. Unleaded premium gasoline (95 RON); unleaded regular for Japan.
Heavy fuel oil Light fuel oil Automotive Unleaded for industry2 for households diesel oil3 premium4 (tonne) (1 000 litres) (litre) (litre)
Australia .. .. .. 0.985Austria 267.99 602.36 0.641 1.164Belgium 197.66 449.69 0.999 1.404Canada 186.00 670.45 .. 0.766Chile .. 812.73 .. 0.992Czech Republic 222.26 548.52 0.878 1.105Denmark 414.56 1 160.09 0.962 1.481Estonia .. 679.46 0.886 1.097Finland .. 713.66 1.007 1.464France 300.68 628.33 0.948 1.388Germany 180.15 473.71 0.912 1.360Greece 287.05 790.71 0.887 1.463Hungary 308.79 x 0.850 1.113Ireland 557.30 563.37 0.958 1.348Israel c 1 518.80 c 1.575Italy 286.54 1 137.12 1.099 1.536Japan 430.12 542.46 0.720 0.991Korea 365.53 646.26 .. 1.444Luxembourg .. 422.91 0.822 1.141Mexico 129.37 x 0.660 0.774Netherlands 452.60 911.50 0.965 1.555New Zealand 233.05 .. 0.391 1.222Norway .. 1 008.24 1.062 1.528Poland 320.29 603.75 0.783 1.017Portugal 513.72 984.24 1.064 1.459Slovak Republic 195.93 .. 0.900 1.283Slovenia x 737.96 0.907 1.265Spain 249.71 546.44 0.861 1.215Sweden 764.59 .. 1.179 1.464Switzerland .. 636.28 1.098 1.341Turkey 435.70 916.76 1.191 1.444United Kingdom c 509.73 1.216 1.454United States 216.28 544.30 0.547 0.567
Energy prices1 in selectedOECD countr ies in USD/unit
KEyWorld2016.indb 42 01/09/2016 11:38:43
43
Prices
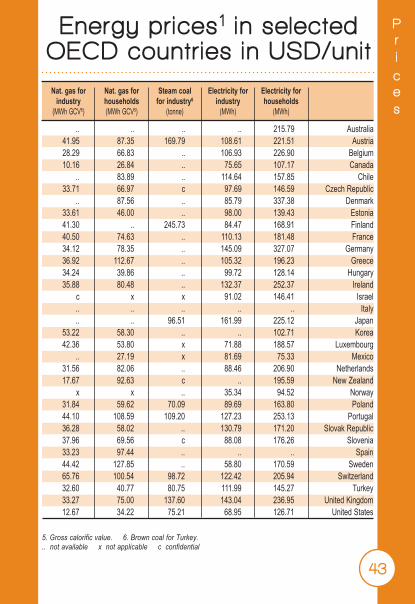
5. Gross calorific value. 6. Brown coal for Turkey... not available x not applicable c confidential
Nat. gas for Nat. gas for Steam coal Electricity for Electricity for industry households for industry6 industry households (MWh GCV5) (MWh GCV5) (tonne) (MWh) (MWh)
.. .. .. .. 215.79 Australia 41.95 87.35 169.79 108.61 221.51 Austria 28.29 66.83 .. 106.93 226.90 Belgium 10.16 26.84 .. 75.65 107.17 Canada .. 83.89 .. 114.64 157.85 Chile 33.71 66.97 c 97.69 146.59 Czech Republic .. 87.56 .. 85.79 337.38 Denmark 33.61 46.00 .. 98.00 139.43 Estonia 41.30 .. 245.73 84.47 168.91 Finland 40.50 74.63 .. 110.13 181.48 France 34.12 78.35 .. 145.09 327.07 Germany 36.92 112.67 .. 105.32 196.23 Greece 34.24 39.86 .. 99.72 128.14 Hungary 35.88 80.48 .. 132.37 252.37 Ireland c x x 91.02 146.41 Israel .. .. .. .. .. Italy .. .. 96.51 161.99 225.12 Japan 53.22 58.30 .. .. 102.71 Korea 42.36 53.80 x 71.88 188.57 Luxembourg .. 27.19 x 81.69 75.33 Mexico 31.56 82.06 .. 88.46 206.90 Netherlands 17.67 92.63 c .. 195.59 New Zealand x x .. 35.34 94.52 Norway 31.84 59.62 70.09 89.69 163.80 Poland 44.10 108.59 109.20 127.23 253.13 Portugal 36.28 58.02 .. 130.79 171.20 Slovak Republic 37.96 69.56 c 88.08 176.26 Slovenia 33.23 97.44 .. .. .. Spain 44.42 127.85 .. 58.80 170.59 Sweden 65.76 100.54 98.72 122.42 205.94 Switzerland 32.60 40.77 80.75 111.99 145.27 Turkey 33.27 75.00 137.60 143.04 236.95 United Kingdom 12.67 34.22 75.21 68.95 126.71 United States
Energy prices1 in selectedOECD countr ies in USD/unit
KEyWorld2016.indb 43 01/09/2016 11:38:43

44
Emissi o n s
CO2 Emissions by fuel
1973 and 2014 fuel shares of CO2 emissions from fuel combustion²
15 458 Mt of CO2 32 381 Mt of CO21. World includes international aviation and international marine bunkers.
2. CO2 emissions from fuel combustion are based on the IEA energy balances and on the 2006 IPCC Guidelines, excluding emissions from non-energy.
3. In these graphs, peat and oil shale are aggregated with coal. 4. Includes industrial waste and non-renewable municipal waste.
1973 2014
World¹ CO2 emissions from fuel combustion² from 1971 to 2014 by fuel (Mt of CO2)
Natural gasOilCoal3 Other4
0
5 000
10 000
15 000
20 000
25 000
30 000
35 000
1971 1975 1980 1985 1990 1995 2000 2005 2010 2014
Natural gas19.7%
Oil33.9%
Coal345.9%
Natural gas14.4%
Oil49.9%
Coal335.6%
Other4
0.5%Other4
0.1%
KEyWorld2016.indb 44 01/09/2016 11:38:43

45
Emissi o n s
1973 and 2014 regional shares of CO2 emissions from fuel combustion²
15 458 Mt of CO2 32 381 Mt of CO2
1. World includes international aviation and marine bunkers, which are shown together as Bunkers.2. CO2 emissions from fuel combustion are based on the IEA energy balances
and on the 2006 IPCC Guidelines, excluding emissions from non-energy. 3. Asia excludes China and OECD countries of Asia.
Non-OECDAmericas
2.5%
Non-OECDAmericas 3.6%
Asia3 3.0%
Asia3
11.8%
Non-OECD Europeand Eurasia 15.9%
Non-OECD Europeand Eurasia 7.6%
Middle East 0.8%
Middle East 5.3%
OECD 66.6% OECD
36.6%
China5.7%
China28.2%
Africa1.8%
Africa 3.4%
Bunkers 3.7%
Bunkers 3.5%
CO2 Emissions by region
Non-OECD Europe and EurasiaNon-OECD Americas Asia3
Middle EastChinaOECDBunkers
Africa
0
5 000
10 000
15 000
20 000
25 000
30 000
35 000
1971 1975 1980 1985 1990 1995 2000 2005 2010 2014
1973 2014
World¹ CO2 emissions from fuel combustion² from 1971 to 2014 by region (Mt of CO2)
KEyWorld2016.indb 45 01/09/2016 11:38:43

46
Outloo k
TPES Outlook by fuel to 2040
Other3 Natural gas2
HydroOil2
NuclearCoal1
02 0004 0006 0008 000
10 00012 00014 00016 00018 00020 000
NPS 450S NPS 450S NPS 450S1990 2013 2020 2030 2040
Total final consumption by sector in 2040
12 244 Mtoe 10 551 Mtoe1. In these graphs, peat and oil shale are aggregated with coal.
2. Includes international aviation and marine bunkers. 3. Includes biofuels and waste, geothermal, solar, wind, tide, etc.
4. Based on a plausible post-2015 climate-policy framework to stabilise the long-term concentration of global greenhouse gases at 450 ppm CO2-equivalent.
NPS: New Policies Scenario (based on policies under consideration)
450S: 450 Scenario4
(based on policies needed to limit globalaverage temperature increase to 2 °C)
New Policies Scenario 450 Scenario
Industry31.3%
Non-energy use8.5%
Buildingsand
agriculture32.4% Transport
27.8%
Industry31.4%
Non-energy use9.6%
Buildingsand
agriculture33.0% Transport
26.0%
(Mtoe)
Outlook for world TPES(Source: IEA, World Energy Outlook 2015)
KEyWorld2016.indb 46 01/09/2016 11:38:44

47
Outloo k
NPS: New Policies Scenario (based on policies under consideration)
450S: 450 Scenario3
(based on policies needed to limit global average temperature increase to 2 °C)
TPES Outlook by region to 2040
OECD China Asia1 Non-OECD Europe and EurasiaMiddle East Africa Non-OECD Americas Bunkers2
02 0004 0006 0008 000
10 00012 00014 00016 00018 00020 000
1990 2013 NPS2020
450S NPS2030
450S NPS2040
450S
CO2 emissions by region in 2040
36 673 Mt of CO2 18 777 Mt of CO21. Asia excludes China and OECD countries of Asia.
2. Includes international aviation and international marine bunkers. 3. Based on a plausible post-2015 climate-policy framework to stabilise the long-term
concentration of global greenhouse gases at 450 ppm CO2-equivalent. CO2 emissions are from fossil fuel combustion only.
New Policies Scenario 450 Scenario
OECD24.3%
China24.9%
Asia1
23.4%
Non-OECD Europeand Eurasia
7.3%Middle
East6.7%
Africa5.0%
Non-OECD Americas
4.0%
Bunkers2
4.4%
OECD24.2%
China17.7%
Asia1
24.1%
Non-OECD Europeand Eurasia
9.4%Middle East
8.0%Africa5.8%
Non-OECD Americas4.4%
Bunkers2
6.4%
(Mtoe)
Outlook for world TPES(Source: IEA, World Energy Outlook 2015)
KEyWorld2016.indb 47 01/09/2016 11:38:44
48
Energy
i n d i c a t o r s
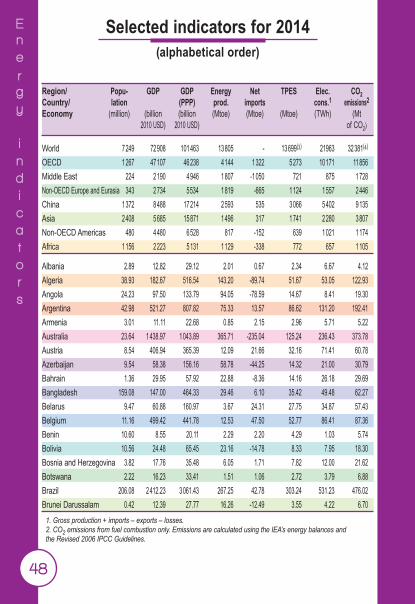
Selected indicators for 2014(alphabetical order)
Region/ Popu- GDP GDP Energy Net TPES Elec. CO2 Country/ lation (PPP) prod. imports cons.1 emissions2
Economy (million) (billion (billion (Mtoe) (Mtoe) (Mtoe) (TWh) (Mt 2010 USD) 2010 USD) of CO2)
1. Gross production + imports – exports – losses.2. CO2 emissions from fuel combustion only. Emissions are calculated using the IEA’s energy balances andthe Revised 2006 IPCC Guidelines.
World 7 249 72 908 101 463 13 805 - 13 699(3) 21963 32 381(4) 1.89 0.19 0.14 3030 2.36 4.47 0.44 0.32 WorldOECD 1 267 47 107 46 238 4 144 1 322 5 273 10 171 11 856 4.16 0.11 0.11 8028 2.25 9.36 0.25 0.26 OECDMiddle East 224 2 190 4 946 1 807 -1 050 721 875 1 728 3.22 0.33 0.15 3909 2.40 7.72 0.79 0.35 Middle EastNon-OECD Europe and Eurasia 343 2 734 5 534 1 819 -665 1 124 1 557 2 446 3.28 0.42 0.21 4543 2.18 7.14 0.91 0.45 Non-OECD Europe and EurasiaChina 1 372 8 488 17 214 2 593 535 3 066 5 402 9 135 2.24 0.36 0.18 3938 2.98 6.66 1.08 0.53 ChinaAsia 2 408 5 685 15 871 1 496 317 1 741 2 280 3 807 0.72 0.31 0.11 947 2.19 1.58 0.67 0.24 AsiaNon-OECD Americas 480 4 480 6 528 817 -152 639 1 021 1 174 1.33 0.14 0.10 2125 1.84 2.44 0.26 0.18 Non-OECD AmericasAfrica 1 156 2 223 5 131 1 129 -338 772 657 1 105 0.67 0.35 0.15 568 1.43 0.96 0.50 0.22 Africa
Albania 2.89 12.82 29.12 2.01 0.67 2.34 6.67 4.12 0.81 0.18 0.08 2305 1.76 1.42 0.32 0.14 AlbaniaAlgeria 38.93 182.67 516.54 143.20 -89.74 51.67 53.05 122.93 1.33 0.28 0.10 1363 2.38 3.16 0.67 0.24 AlgeriaAngola 24.23 97.50 133.79 94.05 -78.59 14.67 8.41 19.30 0.61 0.15 0.11 347 1.32 0.80 0.20 0.14 AngolaArgentina 42.98 521.27 807.82 75.33 13.57 86.62 131.20 192.41 2.02 0.17 0.11 3052 2.22 4.48 0.37 0.24 ArgentinaArmenia 3.01 11.11 22.68 0.85 2.15 2.96 5.71 5.22 0.98 0.27 0.13 1901 1.76 1.74 0.47 0.23 ArmeniaAustralia 23.64 1 438.97 1 043.89 365.71 -235.04 125.24 236.43 373.78 5.30 0.09 0.12 10002 2.98 15.81 0.26 0.36 AustraliaAustria 8.54 406.94 365.39 12.09 21.66 32.16 71.41 60.78 3.76 0.08 0.09 8358 1.89 7.11 0.15 0.17 AustriaAzerbaijan 9.54 58.38 156.16 58.78 -44.25 14.32 21.00 30.79 1.50 0.25 0.09 2202 2.15 3.23 0.53 0.20 AzerbaijanBahrain 1.36 29.95 57.92 22.88 -8.36 14.16 26.18 29.69 10.39 0.47 0.24 19224 2.10 21.80 0.99 0.51 BahrainBangladesh 159.08 147.00 464.33 29.46 6.10 35.42 49.48 62.27 0.22 0.24 0.08 311 1.76 0.39 0.42 0.13 BangladeshBelarus 9.47 60.88 160.97 3.67 24.31 27.75 34.87 57.43 2.93 0.46 0.17 3682 2.07 6.06 0.94 0.36 BelarusBelgium 11.16 499.42 441.78 12.53 47.50 52.77 86.41 87.36 4.73 0.11 0.12 7745 1.66 7.83 0.17 0.20 BelgiumBenin 10.60 8.55 20.11 2.29 2.20 4.29 1.03 5.74 0.40 0.50 0.21 97 1.34 0.54 0.67 0.29 BeninBolivia 10.56 24.48 65.45 23.16 -14.78 8.33 7.95 18.30 0.79 0.34 0.13 753 2.20 1.73 0.75 0.28 BoliviaBosnia and Herzegovina 3.82 17.76 35.48 6.05 1.71 7.82 12.00 21.62 2.05 0.44 0.22 3144 2.76 5.66 1.22 0.61 Bosnia and HerzegovinaBotswana 2.22 16.23 33.41 1.51 1.06 2.72 3.79 6.88 1.22 0.17 0.08 1708 2.53 3.10 0.42 0.21 BotswanaBrazil 206.08 2 412.23 3 061.43 267.25 42.78 303.24 531.23 476.02 1.47 0.13 0.10 2578 1.57 2.31 0.20 0.16 BrazilBrunei Darussalam 0.42 12.39 27.77 16.26 -12.49 3.55 4.22 6.70 8.52 0.29 0.13 10113 1.88 16.06 0.54 0.24 Brunei Darussalam
KEyWorld2016.indb 48 01/09/2016 11:38:44

49
Energy
i n d i c a t o r s
Selected indicators for 2014 (continued)
TPES/ TPES/ TPES/ Elec. CO2/ CO2/ CO2/ CO2/ Region/ pop. GDP GDP (PPP) cons./pop. TPES pop. GDP GDP (PPP) Country/ (toe/capita) (toe/000 (toe/000 (kWh/ (t CO2/ (t CO2/ (kg CO2/ (kg CO2/ Economy
2010 USD) 2010 USD) capita) toe) capita) 2010 USD) 2010 USD)
3. TPES for world includes international aviation and international marine bunkers as well aselectricity and heat trade.4. CO2 emissions for world include emissions from international aviation and international marine bunkers.
World 7249 72874 101390 13805 - 13699(3) 21963 32381(4) 1.89 0.19 0.14 3 030 2.36 4.47 0.44 0.32 WorldOECD 1267 47107 46238 4144 1322 5273 10171 11856 4.16 0.11 0.11 8 028 2.25 9.36 0.25 Middle East 224 2190 4946 1807 -1050 721 875 1728 3.22 0.33 0.15 3 909 2.40 7.72 0.79 Non-OECD Europe and Eurasia 343 2700 5461 1819 -665 1124 1557 2446 3.28 0.41 0.20 4 543 2.18 7.14 0.89
0.26 OECD 0.35 Middle East 0.44 Non-OECD Europe and Eurasia
China 1372 8488 17214 2593 535 3066 5402 9135 2.24 0.36 0.18 3 938 2.98 6.66 1.08 0.53 ChinaAsia 2408 5685 15871 1496 317 1741 2280 3807 0.72 0.31 0.11 947 2.19 1.58 0.67 0.24 AsiaNon-OECD Americas 480 4480 6528 817 -152 639 1021 1174 1.33 0.14 0.10 2 125 1.84 2.44 0.26 0.18 Non-OECD AmericasAfrica 1156 2223 5131 1129 -338 772 657 1105 0.67 0.35 0.15 568 1.43 0.96 0.50 0.22 Africa
Albania 2.89 12.82 29.12 2.01 0.67 2.34 6.67 4.12 0.81 0.18 0.08 2 305 1.76 1.42 0.32 0.14 AlbaniaAlgeria 38.93 182.67 516.54 143.20 -89.74 51.67 53.05 122.93 1.33 0.28 0.10 1 363 2.38 3.16 0.67 0.24 AlgeriaAngola 24.23 97.50 133.79 94.05 -78.59 14.67 8.41 19.30 0.61 0.15 0.11 347 1.32 0.80 0.20 0.14 AngolaArgentina 42.98 521.27 807.82 75.33 13.57 86.62 131.20 192.41 2.02 0.17 0.11 3 052 2.22 4.48 0.37 0.24 ArgentinaArmenia 3.01 11.11 22.68 0.85 2.15 2.96 5.71 5.22 0.98 0.27 0.13 1 901 1.76 1.74 0.47 0.23 ArmeniaAustralia 23.64 1438.97 1043.89 365.71 -235.04 125.24 236.43 373.78 5.30 0.09 0.12 10 002 2.98 15.81 0.26 0.36 AustraliaAustria 8.54 406.94 365.39 12.09 21.66 32.16 71.41 60.78 3.76 0.08 0.09 8 358 1.89 7.11 0.15 0.17 AustriaAzerbaijan 9.54 58.38 156.16 58.78 -44.25 14.32 21.00 30.79 1.50 0.25 0.09 2 202 2.15 3.23 0.53 0.20 AzerbaijanBahrain 1.36 29.95 57.92 22.88 -8.36 14.16 26.18 29.69 10.39 0.47 0.24 19 224 2.10 21.80 0.99 0.51 BahrainBangladesh 159.08 147.00 464.33 29.46 6.10 35.42 49.48 62.27 0.22 0.24 0.08 311 1.76 0.39 0.42 0.13 BangladeshBelarus 9.47 60.88 160.97 3.67 24.31 27.75 34.87 57.43 2.93 0.46 0.17 3 682 2.07 6.06 0.94 0.36 BelarusBelgium 11.16 499.42 441.78 12.53 47.50 52.77 86.41 87.36 4.73 0.11 0.12 7 745 1.66 7.83 0.17 0.20 BelgiumBenin 10.60 8.55 20.11 2.29 2.20 4.29 1.03 5.74 0.40 0.50 0.21 97 1.34 0.54 0.67 0.29 BeninBolivia 10.56 24.48 65.45 23.16 -14.78 8.33 7.95 18.30 0.79 0.34 0.13 753 2.20 1.73 0.75 0.28 BoliviaBosnia and Herzegovina 3.82 17.76 35.48 6.05 1.71 7.82 12.00 21.62 2.05 0.44 0.22 3 144 2.76 5.66 1.22 0.61 Bosnia and HerzegovinaBotswana 2.22 16.23 33.41 1.51 1.06 2.72 3.79 6.88 1.22 0.17 0.08 1 708 2.53 3.10 0.42 0.21 BotswanaBrazil 206.08 2412.23 3061.43 267.25 42.78 303.24 531.23 476.02 1.47 0.13 0.10 2 578 1.57 2.31 0.20 0.16 BrazilBrunei Darussalam 0.42 12.39 27.77 16.26 -12.49 3.55 4.22 6.70 8.52 0.29 0.13 10 113 1.88 16.06 0.54 0.24 Brunei Darussalam
KEyWorld2016.indb 49 01/09/2016 11:38:44

50
Energy i n d i c a t o r s
1. Gross production + imports – exports – losses.2. CO2 emissions from fuel combustion only. Emissions are calculated using the IEA’s energy balances and
the Revised 2006 IPCC Guidelines.
Region/ Popu- GDP GDP Energy Net TPES Elec. CO2 Country/ lation (PPP) prod. imports cons.1 emissions2
Economy (million) (billion (billion (Mtoe) (Mtoe) (Mtoe) (TWh) (Mt 2010 USD) 2010 USD) of CO2)
Bulgaria 7.22 52.30 116.83 11.36 6.45 17.90 34.02 42.13 2.48 0.34 0.15 4 709 2.35 5.83 0.81 0.36 BulgariaCambodia 15.33 14.86 46.75 4.26 2.18 6.37 4.15 6.10 0.42 0.43 0.14 270 0.96 0.40 0.41 0.13 CambodiaCameroon 22.77 28.77 63.27 9.76 -2.02 7.60 6.24 6.04 0.33 0.26 0.12 274 0.79 0.27 0.21 0.10 CameroonCanada 35.54 1 773.55 1 497.77 469.99 -184.87 279.88 552.42 554.80 7.88 0.16 0.19 15 544 1.98 15.61 0.31 0.37 CanadaChile 17.84 257.20 367.13 12.92 24.29 36.10 68.90 75.81 2.02 0.14 0.10 3 863 2.10 4.25 0.29 0.21 ChileChina (People’s Rep. of) 1 364.27 8 230.12 16 840.98 2 593.11 507.94 3 051.50 5 357.55 9 086.96 2.24 0.37 0.18 3 927 2.98 6.66 1.10 0.54 China (People’s Rep. of)Colombia 47.79 349.22 596.69 127.23 -88.27 34.01 61.63 72.50 0.71 0.10 0.06 1 290 2.13 1.52 0.21 0.12 ColombiaRepublic of Congo 4.51 14.24 26.43 15.68 -12.67 2.63 0.96 2.64 0.58 0.18 0.10 213 1.00 0.59 0.19 0.10 Republic of CongoCosta Rica 4.76 42.72 66.34 2.46 2.63 4.91 9.32 7.17 1.03 0.11 0.07 1 958 1.46 1.51 0.17 0.11 Costa RicaCôte d’Ivoire 22.16 31.23 67.48 12.89 1.04 13.87 6.22 9.35 0.63 0.44 0.21 281 0.67 0.42 0.30 0.14 Côte d’IvoireCroatia 4.24 57.38 80.63 4.35 3.62 8.04 15.74 15.14 1.90 0.14 0.10 3 715 1.88 3.57 0.26 0.19 CroatiaCuba 11.38 72.47 230.10 5.88 6.66 11.70 16.41 29.45 1.03 0.16 0.05 1 442 2.52 2.59 0.41 0.13 CubaCuraçao 0.16 1.88 1.69 0.00 3.61 1.97 0.75 4.75 12.64 1.05 1.17 4 795 2.41 30.43 2.53 2.82 CuraçaoCyprus5 0.86 22.86 25.50 0.12 2.28 1.97 4.18 5.76 2.30 0.09 0.08 4 868 2.92 6.72 0.25 0.23 Cyprus5
Czech Republic 10.53 212.20 290.64 29.26 12.53 41.21 65.88 96.55 3.92 0.19 0.14 6 259 2.34 9.17 0.46 0.33 Czech RepublicDPR of Korea 25.03 38.15 143.19 20.82 -8.90 11.91 15.08 37.80 0.48 0.31 0.08 602 3.17 1.51 0.99 0.26 DPR of KoreaDem. Rep. of the Congo 74.88 27.81 52.20 28.16 0.80 28.72 8.01 4.66 0.38 1.03 0.55 107 0.16 0.06 0.17 0.09 Dem. Rep. of the CongoDenmark 5.64 326.54 236.98 16.06 2.20 16.21 33.06 34.51 2.87 0.05 0.07 5 859 2.13 6.12 0.11 0.15 DenmarkDominican Republic 10.41 63.93 129.00 1.02 7.06 7.64 16.42 19.26 0.73 0.12 0.06 1 578 2.52 1.85 0.30 0.15 Dominican Republic Ecuador 15.90 85.92 169.04 30.45 -15.35 14.18 21.96 38.73 0.89 0.17 0.08 1 381 2.73 2.44 0.45 0.23 EcuadorEgypt 89.58 237.74 881.94 80.36 -4.41 74.83 152.20 173.27 0.84 0.31 0.08 1 699 2.32 1.93 0.73 0.20 EgyptEl Salvador 6.11 23.16 47.68 2.06 2.15 4.07 5.90 5.88 0.67 0.18 0.09 966 1.44 0.96 0.25 0.12 El SalvadorEritrea 5.11 2.55 7.33 0.63 0.18 0.81 0.32 0.56 0.16 0.32 0.11 63 0.69 0.11 0.22 0.08 EritreaEstonia 1.32 23.07 33.25 5.83 0.68 6.04 8.85 17.52 4.59 0.26 0.18 6 725 2.90 13.31 0.76 0.53 EstoniaEthiopia 96.96 44.09 135.92 45.51 3.31 48.37 6.79 9.13 0.50 1.10 0.36 70 0.19 0.09 0.21 0.07 EthiopiaFinland 5.46 246.91 204.80 18.26 16.96 33.93 83.29 45.25 6.21 0.14 0.17 15 246 1.33 8.28 0.18 0.22 FinlandFYR of Macedonia 2.08 10.21 26.14 1.27 1.38 2.62 7.27 7.43 1.26 0.26 0.10 3 500 2.83 3.58 0.73 0.28 FYR of MacedoniaFrance 66.17 2 729.47 2 406.79 137.13 114.24 242.64 460.20 285.68 3.67 0.09 0.10 6 955 1.18 4.32 0.10 0.12 FranceGabon 1.69 17.84 30.65 15.91 -10.58 5.08 2.20 3.49 3.01 0.28 0.17 1 303 0.69 2.07 0.20 0.11 GabonGeorgia 4.50 14.34 31.92 1.37 3.10 4.39 10.02 7.72 0.97 0.31 0.14 2 225 1.76 1.71 0.54 0.24 GeorgiaGermany 80.98 3 624.17 3 438.04 119.75 196.49 306.07 569.75 723.27 3.78 0.08 0.09 7 035 2.36 8.93 0.20 0.21 Germany
Selected indicators for 2014 (continued)
KEyWorld2016.indb 50 01/09/2016 11:38:44

51
Energy i n d i c a t o r s
TPES/ TPES/ TPES/ Elec. CO2/ CO2/ CO2/ CO2/ Region/ pop. GDP GDP (PPP) cons./pop. TPES pop. GDP GDP (PPP) Country/ (toe/capita) (toe/000 (toe/000 (kWh/ (t CO2/ (t CO2/ (kg CO2/ (kg CO2/ Economy 2010 USD) 2010 USD) capita) toe) capita) 2010 USD) 2010 USD)
5. Please refer to geographical coverage section for more details.
Bulgaria 7.22 52.30 116.83 11.36 6.45 17.90 34.02 42.13 2.48 0.34 0.15 4 709 2.35 5.83 0.81 0.36 BulgariaCambodia 15.33 14.86 46.75 4.26 2.18 6.37 4.15 6.10 0.42 0.43 0.14 270 0.96 0.40 0.41 0.13 CambodiaCameroon 22.77 28.77 63.27 9.76 -2.02 7.60 6.24 6.04 0.33 0.26 0.12 274 0.79 0.27 0.21 0.10 CameroonCanada 35.54 1 773.55 1 497.77 469.99 -184.87 279.88 552.42 554.80 7.88 0.16 0.19 15 544 1.98 15.61 0.31 0.37 CanadaChile 17.84 257.20 367.13 12.92 24.29 36.10 68.90 75.81 2.02 0.14 0.10 3 863 2.10 4.25 0.29 0.21 ChileChina (People’s Rep. of) 1 364.27 8 230.12 16 840.98 2 593.11 507.94 3 051.50 5 357.55 9 086.96 2.24 0.37 0.18 3 927 2.98 6.66 1.10 0.54 China (People’s Rep. of)Colombia 47.79 349.22 596.69 127.23 -88.27 34.01 61.63 72.50 0.71 0.10 0.06 1 290 2.13 1.52 0.21 0.12 ColombiaRepublic of Congo 4.51 14.24 26.43 15.68 -12.67 2.63 0.96 2.64 0.58 0.18 0.10 213 1.00 0.59 0.19 0.10 Republic of CongoCosta Rica 4.76 42.72 66.34 2.46 2.63 4.91 9.32 7.17 1.03 0.11 0.07 1 958 1.46 1.51 0.17 0.11 Costa RicaCôte d’Ivoire 22.16 31.23 67.48 12.89 1.04 13.87 6.22 9.35 0.63 0.44 0.21 281 0.67 0.42 0.30 0.14 Côte d’IvoireCroatia 4.24 57.38 80.63 4.35 3.62 8.04 15.74 15.14 1.90 0.14 0.10 3 715 1.88 3.57 0.26 0.19 CroatiaCuba 11.38 72.47 230.10 5.88 6.66 11.70 16.41 29.45 1.03 0.16 0.05 1 442 2.52 2.59 0.41 0.13 CubaCuraçao 0.16 1.88 1.69 0.00 3.61 1.97 0.75 4.75 12.64 1.05 1.17 4 795 2.41 30.43 2.53 2.82 CuraçaoCyprus5 0.86 22.86 25.50 0.12 2.28 1.97 4.18 5.76 2.30 0.09 0.08 4 868 2.92 6.72 0.25 0.23 Cyprus5
Czech Republic 10.53 212.20 290.64 29.26 12.53 41.21 65.88 96.55 3.92 0.19 0.14 6 259 2.34 9.17 0.46 0.33 Czech RepublicDPR of Korea 25.03 38.15 143.19 20.82 -8.90 11.91 15.08 37.80 0.48 0.31 0.08 602 3.17 1.51 0.99 0.26 DPR of KoreaDem. Rep. of the Congo 74.88 27.81 52.20 28.16 0.80 28.72 8.01 4.66 0.38 1.03 0.55 107 0.16 0.06 0.17 0.09 Dem. Rep. of the CongoDenmark 5.64 326.54 236.98 16.06 2.20 16.21 33.06 34.51 2.87 0.05 0.07 5 859 2.13 6.12 0.11 0.15 DenmarkDominican Republic 10.41 63.93 129.00 1.02 7.06 7.64 16.42 19.26 0.73 0.12 0.06 1 578 2.52 1.85 0.30 0.15 Dominican Republic Ecuador 15.90 85.92 169.04 30.45 -15.35 14.18 21.96 38.73 0.89 0.17 0.08 1 381 2.73 2.44 0.45 0.23 EcuadorEgypt 89.58 237.74 881.94 80.36 -4.41 74.83 152.20 173.27 0.84 0.31 0.08 1 699 2.32 1.93 0.73 0.20 EgyptEl Salvador 6.11 23.16 47.68 2.06 2.15 4.07 5.90 5.88 0.67 0.18 0.09 966 1.44 0.96 0.25 0.12 El SalvadorEritrea 5.11 2.55 7.33 0.63 0.18 0.81 0.32 0.56 0.16 0.32 0.11 63 0.69 0.11 0.22 0.08 EritreaEstonia 1.32 23.07 33.25 5.83 0.68 6.04 8.85 17.52 4.59 0.26 0.18 6 725 2.90 13.31 0.76 0.53 EstoniaEthiopia 96.96 44.09 135.92 45.51 3.31 48.37 6.79 9.13 0.50 1.10 0.36 70 0.19 0.09 0.21 0.07 EthiopiaFinland 5.46 246.91 204.80 18.26 16.96 33.93 83.29 45.25 6.21 0.14 0.17 15 246 1.33 8.28 0.18 0.22 FinlandFYR of Macedonia 2.08 10.21 26.14 1.27 1.38 2.62 7.27 7.43 1.26 0.26 0.10 3 500 2.83 3.58 0.73 0.28 FYR of MacedoniaFrance 66.17 2 729.47 2 406.79 137.13 114.24 242.64 460.20 285.68 3.67 0.09 0.10 6 955 1.18 4.32 0.10 0.12 FranceGabon 1.69 17.84 30.65 15.91 -10.58 5.08 2.20 3.49 3.01 0.28 0.17 1 303 0.69 2.07 0.20 0.11 GabonGeorgia 4.50 14.34 31.92 1.37 3.10 4.39 10.02 7.72 0.97 0.31 0.14 2 225 1.76 1.71 0.54 0.24 GeorgiaGermany 80.98 3 624.17 3 438.04 119.75 196.49 306.07 569.75 723.27 3.78 0.08 0.09 7 035 2.36 8.93 0.20 0.21 Germany
Selected indicators for 2014 (continued)
KEyWorld2016.indb 51 01/09/2016 11:38:44

52
Energy i n d i c a t o r s
1. Gross production + imports – exports – losses.2. CO2 emissions from fuel combustion only. Emissions are calculated using the IEA’s energy balances and
the Revised 2006 IPCC Guidelines.
Region/ Popu- GDP GDP Energy Net TPES Elec. CO2 Country/ lation (PPP) prod. imports cons.1 emissions2
Economy (million) (billion (billion (Mtoe) (Mtoe) (Mtoe) (TWh) (Mt 2010 USD) 2010 USD) of CO2)
Ghana 26.79 44.75 102.20 9.77 -0.64 9.03 9.56 13.11 0.34 0.20 0.09 357 1.45 0.49 0.29 0.13 GhanaGibraltar 0.03 1.14 0.98 0.00 3.02 0.20 0.19 0.54 5.94 0.17 0.20 5 818 2.74 16.25 0.47 0.55 GibraltarGreece 10.93 245.70 264.53 8.80 16.93 23.13 55.14 65.88 2.12 0.09 0.09 5 047 2.85 6.03 0.27 0.25 GreeceGuatemala 16.02 47.93 111.59 8.88 4.35 13.22 9.20 16.14 0.83 0.28 0.12 575 1.22 1.01 0.34 0.14 GuatemalaHaiti 10.57 7.70 17.11 3.24 0.94 4.15 0.41 2.76 0.39 0.54 0.24 39 0.67 0.26 0.36 0.16 HaitiHonduras 7.96 18.15 36.53 2.52 2.69 5.35 5.55 8.75 0.67 0.30 0.15 697 1.63 1.10 0.48 0.24 HondurasHong Kong, China 7.24 257.49 372.87 0.19 27.48 14.25 43.98 47.94 1.97 0.06 0.04 6 073 3.37 6.62 0.19 0.13 Hong Kong, ChinaHungary 9.87 137.47 228.01 10.14 14.19 22.84 39.13 40.28 2.31 0.17 0.10 3 966 1.76 4.08 0.29 0.18 HungaryIceland 0.33 14.45 13.41 5.22 0.84 5.87 17.62 2.04 17.94 0.41 0.44 53 896 0.35 6.25 0.14 0.15 IcelandIndia 1 295.29 2 195.65 6 902.09 541.81 289.72 824.74 1 042.33 2 019.67 0.64 0.38 0.12 805 2.45 1.56 0.92 0.29 IndiaIndonesia 254.46 942.54 2 501.42 458.00 -231.45 225.51 207.14 436.53 0.89 0.24 0.09 814 1.94 1.72 0.46 0.17 IndonesiaIslamic Rep. of Iran 78.14 463.90 1 263.83 316.25 -75.32 237.08 234.11 556.09 3.03 0.51 0.19 2 996 2.35 7.12 1.20 0.44 Islamic Rep. of IranIraq 34.81 177.05 489.96 162.99 -111.28 49.48 45.71 141.03 1.42 0.28 0.10 1 313 2.85 4.05 0.80 0.29 IraqIreland 4.62 241.27 216.23 2.01 11.66 12.77 26.42 33.86 2.77 0.05 0.06 5 725 2.65 7.34 0.14 0.16 IrelandIsrael 8.21 268.11 252.10 7.48 16.53 22.70 54.23 64.69 2.76 0.08 0.09 6 604 2.85 7.88 0.24 0.26 IsraelItaly 60.80 2 033.75 1 969.37 36.69 115.06 146.77 304.09 319.71 2.41 0.07 0.07 5 002 2.18 5.26 0.16 0.16 ItalyJamaica 2.72 13.50 22.58 0.50 2.68 2.81 3.02 7.17 1.03 0.21 0.12 1 110 2.55 2.64 0.53 0.32 JamaicaJapan 127.12 5 642.89 4 437.13 26.59 422.27 441.74 995.26 1 188.63 3.48 0.08 0.10 7 829 2.69 9.35 0.21 0.27 JapanJordan 6.61 29.49 74.42 0.26 8.37 8.18 16.63 24.11 1.24 0.28 0.11 2 517 2.95 3.65 0.82 0.32 JordanKazakhstan 17.29 184.93 391.54 166.28 -89.01 76.67 96.82 223.69 4.43 0.41 0.20 5 600 2.92 12.94 1.21 0.57 KazakhstanKenya 44.86 49.40 123.88 19.57 4.60 23.63 7.67 12.35 0.53 0.48 0.19 171 0.52 0.28 0.25 0.10 KenyaKorea 50.42 1 233.97 1 697.11 49.11 232.84 268.41 532.66 567.81 5.32 0.22 0.16 10 564 2.12 11.26 0.46 0.33 KoreaKosovo 1.82 6.57 15.53 1.61 0.60 2.21 5.11 7.40 1.21 0.34 0.14 2 803 3.35 4.06 1.13 0.48 KosovoKuwait 3.75 136.19 256.96 166.36 -131.14 33.88 57.54 86.08 9.03 0.25 0.13 15 333 2.54 22.94 0.63 0.33 KuwaitKyrgyzstan 5.83 5.83 18.12 1.91 2.15 3.80 11.33 8.36 0.65 0.65 0.21 1 942 2.20 1.43 1.43 0.46 KyrgyzstanLatvia5 1.99 27.66 42.54 2.38 1.90 4.34 6.99 6.72 2.18 0.16 0.10 3 514 1.55 3.38 0.24 0.16 Latvia5
Lebanon 4.55 40.78 74.21 0.16 7.61 7.49 16.21 22.37 1.65 0.18 0.10 3 565 2.99 4.92 0.55 0.30 LebanonLibya 6.26 38.10 91.25 36.27 -16.39 17.87 11.52 47.90 2.85 0.47 0.20 1 841 2.68 7.65 1.26 0.52 LibyaLithuania 2.93 43.62 73.08 1.75 5.35 7.00 11.21 10.31 2.39 0.16 0.10 3 826 1.47 3.52 0.24 0.14 LithuaniaLuxembourg 0.56 57.81 47.36 0.15 4.08 3.82 7.74 9.25 6.84 0.07 0.08 13 873 2.42 16.57 0.16 0.20 LuxembourgMalaysia 29.90 314.34 716.60 94.64 -1.18 89.70 138.94 220.52 3.00 0.29 0.13 4 646 2.46 7.37 0.70 0.31 Malaysia
Selected indicators for 2014 (continued)
KEyWorld2016.indb 52 01/09/2016 11:38:44
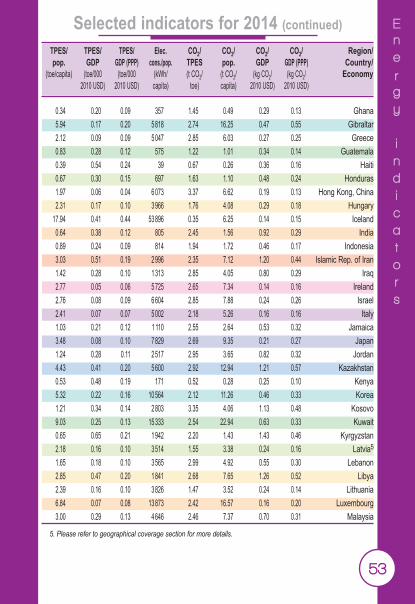
53
Energy i n d i c a t o r s
TPES/ TPES/ TPES/ Elec. CO2/ CO2/ CO2/ CO2/ Region/ pop. GDP GDP (PPP) cons./pop. TPES pop. GDP GDP (PPP) Country/ (toe/capita) (toe/000 (toe/000 (kWh/ (t CO2/ (t CO2/ (kg CO2/ (kg CO2/ Economy 2010 USD) 2010 USD) capita) toe) capita) 2010 USD) 2010 USD)
Ghana 26.79 44.75 102.20 9.77 -0.64 9.03 9.56 13.11 0.34 0.20 0.09 357 1.45 0.49 0.29 0.13 GhanaGibraltar 0.03 1.14 0.98 0.00 3.02 0.20 0.19 0.54 5.94 0.17 0.20 5 818 2.74 16.25 0.47 0.55 GibraltarGreece 10.93 245.70 264.53 8.80 16.93 23.13 55.14 65.88 2.12 0.09 0.09 5 047 2.85 6.03 0.27 0.25 GreeceGuatemala 16.02 47.93 111.59 8.88 4.35 13.22 9.20 16.14 0.83 0.28 0.12 575 1.22 1.01 0.34 0.14 GuatemalaHaiti 10.57 7.70 17.11 3.24 0.94 4.15 0.41 2.76 0.39 0.54 0.24 39 0.67 0.26 0.36 0.16 HaitiHonduras 7.96 18.15 36.53 2.52 2.69 5.35 5.55 8.75 0.67 0.30 0.15 697 1.63 1.10 0.48 0.24 HondurasHong Kong, China 7.24 257.49 372.87 0.19 27.48 14.25 43.98 47.94 1.97 0.06 0.04 6 073 3.37 6.62 0.19 0.13 Hong Kong, ChinaHungary 9.87 137.47 228.01 10.14 14.19 22.84 39.13 40.28 2.31 0.17 0.10 3 966 1.76 4.08 0.29 0.18 HungaryIceland 0.33 14.45 13.41 5.22 0.84 5.87 17.62 2.04 17.94 0.41 0.44 53 896 0.35 6.25 0.14 0.15 IcelandIndia 1 295.29 2 195.65 6 902.09 541.81 289.72 824.74 1 042.33 2 019.67 0.64 0.38 0.12 805 2.45 1.56 0.92 0.29 IndiaIndonesia 254.46 942.54 2 501.42 458.00 -231.45 225.51 207.14 436.53 0.89 0.24 0.09 814 1.94 1.72 0.46 0.17 IndonesiaIslamic Rep. of Iran 78.14 463.90 1 263.83 316.25 -75.32 237.08 234.11 556.09 3.03 0.51 0.19 2 996 2.35 7.12 1.20 0.44 Islamic Rep. of IranIraq 34.81 177.05 489.96 162.99 -111.28 49.48 45.71 141.03 1.42 0.28 0.10 1 313 2.85 4.05 0.80 0.29 IraqIreland 4.62 241.27 216.23 2.01 11.66 12.77 26.42 33.86 2.77 0.05 0.06 5 725 2.65 7.34 0.14 0.16 IrelandIsrael 8.21 268.11 252.10 7.48 16.53 22.70 54.23 64.69 2.76 0.08 0.09 6 604 2.85 7.88 0.24 0.26 IsraelItaly 60.80 2 033.75 1 969.37 36.69 115.06 146.77 304.09 319.71 2.41 0.07 0.07 5 002 2.18 5.26 0.16 0.16 ItalyJamaica 2.72 13.50 22.58 0.50 2.68 2.81 3.02 7.17 1.03 0.21 0.12 1 110 2.55 2.64 0.53 0.32 JamaicaJapan 127.12 5 642.89 4 437.13 26.59 422.27 441.74 995.26 1 188.63 3.48 0.08 0.10 7 829 2.69 9.35 0.21 0.27 JapanJordan 6.61 29.49 74.42 0.26 8.37 8.18 16.63 24.11 1.24 0.28 0.11 2 517 2.95 3.65 0.82 0.32 JordanKazakhstan 17.29 184.93 391.54 166.28 -89.01 76.67 96.82 223.69 4.43 0.41 0.20 5 600 2.92 12.94 1.21 0.57 KazakhstanKenya 44.86 49.40 123.88 19.57 4.60 23.63 7.67 12.35 0.53 0.48 0.19 171 0.52 0.28 0.25 0.10 KenyaKorea 50.42 1 233.97 1 697.11 49.11 232.84 268.41 532.66 567.81 5.32 0.22 0.16 10 564 2.12 11.26 0.46 0.33 KoreaKosovo 1.82 6.57 15.53 1.61 0.60 2.21 5.11 7.40 1.21 0.34 0.14 2 803 3.35 4.06 1.13 0.48 KosovoKuwait 3.75 136.19 256.96 166.36 -131.14 33.88 57.54 86.08 9.03 0.25 0.13 15 333 2.54 22.94 0.63 0.33 KuwaitKyrgyzstan 5.83 5.83 18.12 1.91 2.15 3.80 11.33 8.36 0.65 0.65 0.21 1 942 2.20 1.43 1.43 0.46 KyrgyzstanLatvia5 1.99 27.66 42.54 2.38 1.90 4.34 6.99 6.72 2.18 0.16 0.10 3 514 1.55 3.38 0.24 0.16 Latvia5
Lebanon 4.55 40.78 74.21 0.16 7.61 7.49 16.21 22.37 1.65 0.18 0.10 3 565 2.99 4.92 0.55 0.30 LebanonLibya 6.26 38.10 91.25 36.27 -16.39 17.87 11.52 47.90 2.85 0.47 0.20 1 841 2.68 7.65 1.26 0.52 LibyaLithuania 2.93 43.62 73.08 1.75 5.35 7.00 11.21 10.31 2.39 0.16 0.10 3 826 1.47 3.52 0.24 0.14 LithuaniaLuxembourg 0.56 57.81 47.36 0.15 4.08 3.82 7.74 9.25 6.84 0.07 0.08 13 873 2.42 16.57 0.16 0.20 LuxembourgMalaysia 29.90 314.34 716.60 94.64 -1.18 89.70 138.94 220.52 3.00 0.29 0.13 4 646 2.46 7.37 0.70 0.31 Malaysia
5. Please refer to geographical coverage section for more details.
Selected indicators for 2014 (continued)
KEyWorld2016.indb 53 01/09/2016 11:38:44

54
Energy
i n d i c a t o r s
1. Gross production + imports – exports – losses.2. CO2 emissions from fuel combustion only. Emissions are calculated using the IEA’s energy balances and
the Revised 2006 IPCC Guidelines.
Region/ Popu- GDP GDP Energy Net TPES Elec. CO2 Country/ lation (PPP) prod. imports cons.1 emissions2
Economy (million) (billion (billion (Mtoe) (Mtoe) (Mtoe) (TWh) (Mt 2010 USD) 2010 USD) of CO2)
Malta 0.43 8.80 11.93 0.01 2.05 0.77 2.14 2.34 1.81 0.09 0.07 5012 3.03 5.49 0.27 0.20 MaltaMauritius 1.26 11.14 21.91 0.22 1.69 1.40 2.75 3.96 1.11 0.13 0.06 2182 2.82 3.14 0.36 0.18 MauritiusMexico 119.71 1 176.66 1 939.05 208.27 -15.09 187.98 259.65 430.92 1.57 0.16 0.10 2169 2.29 3.60 0.37 0.22 MexicoMoldova 3.56 7.03 16.56 0.33 2.98 3.30 4.93 7.25 0.93 0.47 0.20 1386 2.19 2.04 1.03 0.44 MoldovaMongolia 2.91 11.40 32.49 14.41 -9.32 5.37 5.90 18.16 1.85 0.47 0.17 2027 3.38 6.24 1.59 0.56 MongoliaMontenegro 0.62 4.38 8.81 0.69 0.29 0.96 2.87 2.22 1.54 0.22 0.11 4611 2.32 3.57 0.51 0.25 MontenegroMorocco 33.92 108.39 241.44 1.76 19.53 18.98 30.93 53.11 0.56 0.18 0.08 912 2.80 1.57 0.49 0.22 MoroccoMozambique 27.22 13.40 28.73 17.99 -5.35 11.64 12.59 3.87 0.43 0.87 0.41 463 0.33 0.14 0.29 0.13 MozambiqueMyanmar 53.44 66.24 230.57 25.68 -7.26 19.31 11.26 19.56 0.36 0.29 0.08 211 1.01 0.37 0.30 0.08 MyanmarNamibia 2.40 14.00 22.36 0.46 1.39 1.81 3.76 3.59 0.75 0.13 0.08 1563 1.99 1.50 0.26 0.16 NamibiaNepal 28.18 19.03 62.53 9.74 2.07 11.69 3.94 5.93 0.41 0.61 0.19 140 0.51 0.21 0.31 0.09 NepalNetherlands 16.86 845.61 752.14 58.53 30.51 72.95 113.21 148.34 4.33 0.09 0.10 6713 2.03 8.80 0.18 0.20 NetherlandsNew Zealand 4.46 162.07 150.43 17.05 4.56 20.56 40.71 31.24 4.61 0.13 0.14 9131 1.52 7.01 0.19 0.21 New ZealandNicaragua 6.01 10.68 27.65 2.17 1.49 3.66 3.49 4.54 0.61 0.34 0.13 580 1.24 0.76 0.43 0.16 NicaraguaNiger 19.11 7.31 16.75 3.05 -0.11 2.89 0.99 1.96 0.15 0.39 0.17 52 0.68 0.10 0.27 0.12 NigerNigeria 177.48 452.29 980.62 260.02 -125.23 134.71 25.50 60.16 0.76 0.30 0.14 144 0.45 0.34 0.13 0.06 NigeriaNorway 5.14 458.96 307.97 196.31 -167.40 28.75 118.16 35.31 5.60 0.06 0.09 23001 1.23 6.87 0.08 0.11 NorwayOman 4.24 67.48 152.96 74.49 -48.54 24.33 25.96 59.90 5.74 0.36 0.16 6128 2.46 14.14 0.89 0.39 OmanPakistan 185.04 206.25 832.20 68.20 22.05 89.89 87.40 137.43 0.49 0.44 0.11 472 1.53 0.74 0.67 0.17 PakistanPanama 3.87 40.48 75.54 0.80 6.71 4.21 8.05 10.59 1.09 0.10 0.06 2082 2.51 2.74 0.26 0.14 PanamaParaguay 6.55 24.65 54.58 7.08 -1.85 5.17 10.25 5.19 0.79 0.21 0.09 1563 1.00 0.79 0.21 0.10 ParaguayPeru 30.97 181.34 347.10 27.32 -1.73 23.78 40.50 47.79 0.77 0.13 0.07 1308 2.01 1.54 0.26 0.14 PeruPhilippines 99.14 250.79 645.80 25.85 22.29 47.67 69.99 95.71 0.48 0.19 0.07 706 2.01 0.97 0.38 0.15 PhilippinesPoland 38.48 534.56 886.15 67.33 27.90 94.02 150.98 279.04 2.44 0.18 0.11 3923 2.97 7.25 0.52 0.31 PolandPortugal 10.40 224.00 267.77 6.00 16.38 21.16 48.50 42.81 2.03 0.09 0.08 4663 2.02 4.12 0.19 0.16 PortugalQatar 2.17 161.79 285.56 219.93 -173.81 44.08 36.35 77.61 20.29 0.27 0.15 16736 1.76 35.73 0.48 0.27 QatarRomania 19.91 181.81 363.28 26.37 5.36 31.69 51.45 68.16 1.59 0.17 0.09 2584 2.15 3.42 0.37 0.19 RomaniaRussian Federation 143.82 1 676.80 3 219.77 1 305.68 -570.84 710.88 949.59 1 467.55 4.94 0.42 0.22 6603 2.06 10.20 0.88 0.46 Russian FederationSaudi Arabia 30.89 649.57 1 501.55 622.42 -405.45 213.51 290.66 506.59 6.91 0.33 0.14 9410 2.37 16.40 0.78 0.34 Saudi ArabiaSenegal 14.67 14.90 32.00 1.87 2.42 3.96 3.25 6.28 0.27 0.27 0.12 222 1.59 0.43 0.42 0.20 SenegalSerbia 7.13 37.70 82.30 9.44 3.72 13.26 30.46 38.11 1.86 3.02 1.39 4273 2.87 5.35 8.69 3.98 Serbia
Selected indicators for 2014 (continued)
KEyWorld2016.indb 54 01/09/2016 11:38:44

55
Energy
i n d i c a t o r s
TPES/ TPES/ TPES/ Elec. CO2/ CO2/ CO2/ CO2/ Region/ pop. GDP GDP (PPP) cons./pop. TPES pop. GDP GDP (PPP) Country/ (toe/capita) (toe/000 (toe/000 (kWh/ (t CO2/ (t CO2/ (kg CO2/ (kg CO2/ Economy
2010 USD) 2010 USD) capita) toe) capita) 2010 USD) 2010 USD)
Malta 0.43 8.60 11.65 0.01 2.05 0.77 2.14 2.34 1.81 0.09 0.06 5 012 3.03 5.49 0.27 0.20 MaltaMauritius 1.26 11.14 21.91 0.22 1.69 1.40 2.75 3.96 1.11 0.13 0.06 2 182 2.82 3.14 0.36 0.18 MauritiusMexico 119.71 1176.66 1939.05 208.27 -15.09 187.98 259.65 430.92 1.57 0.16 0.10 2 169 2.29 3.60 0.37 0.22 MexicoMoldova 3.56 7.03 16.56 0.33 2.98 3.30 4.93 7.25 0.93 0.47 0.20 1 386 2.19 2.04 1.03 0.44 MoldovaMongolia 2.91 11.40 32.49 14.41 -9.32 5.37 5.90 18.16 1.85 0.47 0.17 2 027 3.38 6.24 1.59 0.56 MongoliaMontenegro 0.62 4.38 8.81 0.69 0.29 0.96 2.87 2.22 1.54 0.22 0.11 4 611 2.32 3.57 0.51 0.25 MontenegroMorocco 33.92 108.39 241.44 1.76 19.53 18.98 30.93 53.11 0.56 0.18 0.08 912 2.80 1.57 0.49 0.22 MoroccoMozambique 27.22 13.40 28.73 17.99 -5.35 11.64 12.59 3.87 0.43 0.87 0.41 463 0.33 0.14 0.29 0.13 MozambiqueMyanmar 53.44 66.24 230.57 25.68 -7.26 19.31 11.26 19.56 0.36 0.29 0.08 211 1.01 0.37 0.30 0.08 MyanmarNamibia 2.40 14.00 22.36 0.46 1.39 1.81 3.76 3.59 0.75 0.13 0.08 1 563 1.99 1.50 0.26 0.16 NamibiaNepal 28.18 19.03 62.53 9.74 2.07 11.69 3.94 5.93 0.41 0.61 0.19 140 0.51 0.21 0.31 0.09 NepalNetherlands 16.86 845.61 752.14 58.53 30.51 72.95 113.21 148.34 4.33 0.09 0.10 6 713 2.03 8.80 0.18 0.20 NetherlandsNew Zealand 4.46 162.07 150.43 17.05 4.56 20.56 40.71 31.24 4.61 0.13 0.14 9 131 1.52 7.01 0.19 0.21 New ZealandNicaragua 6.01 10.68 27.65 2.17 1.49 3.66 3.49 4.54 0.61 0.34 0.13 580 1.24 0.76 0.43 0.16 NicaraguaNiger 19.11 7.31 16.75 3.05 -0.11 2.89 0.99 1.96 0.15 0.39 0.17 52 0.68 0.10 0.27 0.12 NigerNigeria 177.48 452.29 980.62 260.02 -125.23 134.71 25.50 60.16 0.76 0.30 0.14 144 0.45 0.34 0.13 0.06 NigeriaNorway 5.14 458.96 307.97 196.31 -167.40 28.75 118.16 35.31 5.60 0.06 0.09 23 001 1.23 6.87 0.08 0.11 NorwayOman 4.24 67.48 152.96 74.49 -48.54 24.33 25.96 59.90 5.74 0.36 0.16 6 128 2.46 14.14 0.89 0.39 OmanPakistan 185.04 206.25 832.20 68.20 22.05 89.89 87.40 137.43 0.49 0.44 0.11 472 1.53 0.74 0.67 0.17 PakistanPanama 3.87 40.48 75.54 0.80 6.71 4.21 8.05 10.59 1.09 0.10 0.06 2 082 2.51 2.74 0.26 0.14 PanamaParaguay 6.55 24.65 54.58 7.08 -1.85 5.17 10.25 5.19 0.79 0.21 0.09 1 563 1.00 0.79 0.21 0.10 ParaguayPeru 30.97 181.34 347.10 27.32 -1.73 23.78 40.50 47.79 0.77 0.13 0.07 1 308 2.01 1.54 0.26 0.14 PeruPhilippines 99.14 250.79 645.80 25.85 22.29 47.67 69.99 95.71 0.48 0.19 0.07 706 2.01 0.97 0.38 0.15 PhilippinesPoland 38.48 534.56 886.15 67.33 27.90 94.02 150.98 279.04 2.44 0.18 0.11 3 923 2.97 7.25 0.52 0.31 PolandPortugal 10.40 224.00 267.77 6.00 16.38 21.16 48.50 42.81 2.03 0.09 0.08 4 663 2.02 4.12 0.19 0.16 PortugalQatar 2.17 161.79 285.56 219.93 -173.81 44.08 36.35 77.61 20.29 0.27 0.15 16 736 1.76 35.73 0.48 0.27 QatarRomania 19.91 181.81 363.28 26.37 5.36 31.69 51.45 68.16 1.59 0.17 0.09 2 584 2.15 3.42 0.37 0.19 RomaniaRussian Federation 143.82 1676.80 3219.77 1305.68 -570.84 710.88 949.59 1467.55 4.94 0.42 0.22 6 603 2.06 10.20 0.88 0.46 Russian FederationSaudi Arabia 30.89 649.57 1501.55 622.42 -405.45 213.51 290.66 506.59 6.91 0.33 0.14 9 410 2.37 16.40 0.78 0.34 Saudi ArabiaSenegal 14.67 14.90 32.00 1.87 2.42 3.96 3.25 6.28 0.27 0.27 0.12 222 1.59 0.43 0.42 0.20 SenegalSerbia 7.13 4.38 9.57 9.44 3.72 13.26 30.46 38.11 1.86 0.35 0.16 4 273 2.87 5.35 1.01 0.46 Serbia
Selected indicators for 2014 (continued)
KEyWorld2016.indb 55 01/09/2016 11:38:44

56
Energy i n d i c a t o r s
1. Gross production + imports – exports – losses.2. CO2 emissions from fuel combustion only. Emissions are calculated using the IEA’s energy balances and the Revised 2006 IPCC Guidelines.
Region/ Popu- GDP GDP Energy Net TPES Elec. CO2 Country/ lation (PPP) prod. imports cons.1 emissions2
Economy (million) (billion (billion (Mtoe) (Mtoe) (Mtoe) (TWh) (Mt 2010 USD) 2010 USD) of CO2)
Singapore 5.47 279.12 423.14 0.65 75.75 28.01 48.38 45.32 5.12 0.10 0.07 8 844 1.62 8.29 0.16 0.11 SingaporeSlovak Republic 5.42 96.90 143.50 6.57 9.77 15.95 27.84 29.33 2.94 0.16 0.11 5 137 1.84 5.41 0.30 0.20 Slovak RepublicSlovenia 2.06 47.93 56.46 3.70 3.01 6.67 13.87 12.76 3.24 0.14 0.12 6 728 1.91 6.19 0.27 0.23 SloveniaSouth Africa 54.00 411.04 658.69 168.32 -18.03 147.02 228.98 437.37 2.72 0.36 0.22 4 240 2.97 8.10 1.06 0.66 South AfricaSouth Sudan 11.91 6.08 22.48 8.11 -7.37 0.70 0.46 1.52 0.06 0.12 0.03 39 2.17 0.13 0.25 0.07 South SudanSpain 46.46 1 375.52 1 448.78 35.10 91.94 114.56 248.95 231.99 2.47 0.08 0.08 5 358 2.03 4.99 0.17 0.16 SpainSri Lanka 20.64 72.49 215.71 5.33 5.93 10.71 11.04 16.74 0.52 0.15 0.05 535 1.56 0.81 0.23 0.08 Sri LankaSudan 39.35 67.01 149.68 16.34 -1.07 14.99 9.75 13.34 0.38 0.22 0.10 248 0.89 0.34 0.20 0.09 SudanSuriname5 0.54 4.96 8.37 0.99 -0.25 0.69 1.99 1.99 1.28 0.14 0.08 3 699 2.89 3.70 0.40 0.24 Suriname5
Sweden 9.70 517.63 415.05 34.54 16.30 48.16 130.71 37.42 4.97 0.09 0.12 13 480 0.78 3.86 0.07 0.09 SwedenSwitzerland 8.19 620.44 428.99 13.27 13.36 25.06 61.58 37.74 3.06 0.04 0.06 7 520 1.51 4.61 0.06 0.09 SwitzerlandSyrian Arab Republic 22.16 54.60 120.54 5.64 5.43 10.80 18.24 27.57 0.49 0.20 0.09 823 2.55 1.24 0.50 0.23 Syrian Arab RepublicChinese Taipei 23.38 478.34 932.76 13.64 101.70 110.23 251.07 249.66 4.71 0.23 0.12 10 738 2.26 10.68 0.52 0.27 Chinese TaipeiTajikistan 8.30 7.47 20.87 1.79 1.08 2.80 12.38 4.66 0.34 0.38 0.13 1 492 1.66 0.56 0.62 0.22 TajikistanTanzania 51.82 40.88 119.36 22.17 2.87 24.83 5.18 10.37 0.48 0.61 0.21 100 0.42 0.20 0.25 0.09 TanzaniaThailand 67.73 382.59 996.11 78.74 59.58 134.76 173.75 243.52 1.99 0.35 0.14 2 566 1.81 3.60 0.64 0.24 ThailandTogo 7.12 3.92 9.50 2.64 0.71 3.30 1.10 1.72 0.46 0.84 0.35 155 0.52 0.24 0.44 0.18 TogoTrinidad and Tobago 1.35 21.88 40.47 39.66 -19.55 19.57 9.66 23.21 14.45 0.89 0.48 7 137 1.19 17.15 1.06 0.57 Trinidad and TobagoTunisia 11.00 47.52 117.54 6.71 4.15 10.52 16.09 25.01 0.96 0.22 0.09 1 463 2.38 2.27 0.53 0.21 TunisiaTurkey 76.62 870.92 1 392.43 31.35 93.72 121.54 219.89 307.11 1.59 0.14 0.09 2 870 2.53 4.01 0.35 0.22 TurkeyTurkmenistan 5.31 34.31 76.76 77.98 -50.74 26.75 14.64 67.00 5.04 0.78 0.35 2 759 2.50 12.62 1.95 0.87 TurkmenistanUkraine 45.36 134.02 346.35 76.93 27.47 105.68 154.77 236.54 2.33 0.79 0.31 3 412 2.24 5.21 1.76 0.68 UkraineUnited Arab Emirates 9.09 350.93 574.76 200.04 -109.55 70.47 102.17 175.43 7.76 0.20 0.12 11 245 2.49 19.31 0.50 0.31 United Arab EmiratesUnited Kingdom 64.60 2 605.73 2 441.45 108.24 87.40 179.42 331.44 407.84 2.78 0.07 0.07 5 131 2.27 6.31 0.16 0.17 United KingdomUnited States 319.17 16 156.62 16 156.62 2 011.98 258.11 2 216.19 4 137.10 5 176.21 6.94 0.14 0.14 12 962 2.34 16.22 0.32 0.32 United StatesUruguay 3.42 47.61 66.75 2.62 2.33 4.71 10.49 6.27 1.38 0.10 0.07 3 068 1.33 1.83 0.13 0.09 UruguayUzbekistan 30.76 53.81 160.23 55.84 -12.17 43.68 50.61 97.90 1.42 0.81 0.27 1 645 2.24 3.18 1.82 0.61 UzbekistanVenezuela 30.69 421.58 503.75 185.71 -117.48 67.50 81.69 154.99 2.20 0.16 0.13 2 661 2.30 5.05 0.37 0.31 VenezuelaViet Nam 90.73 144.84 477.38 71.20 -2.69 66.62 130.57 143.31 0.73 0.46 0.14 1 439 2.15 1.58 0.99 0.30 Viet NamYemen 26.18 28.54 93.39 16.05 -8.44 7.42 5.68 21.34 0.28 0.26 0.08 217 2.87 0.81 0.75 0.23 YemenZambia 15.72 26.02 57.37 9.13 0.83 10.06 11.05 3.19 0.64 0.39 0.18 703 0.32 0.20 0.12 0.06 ZambiaZimbabwe 15.25 12.65 25.53 11.52 1.15 11.05 8.28 11.49 0.72 0.87 0.43 543 1.04 0.75 0.91 0.45 Zimbabwe
Selected indicators for 2014 (continued)
KEyWorld2016.indb 56 01/09/2016 11:38:44

57
Energy i n d i c a t o r s
5. Please refer to geographical coverage section for more details.Sources: Energy data: IEA.
Population: OECD/World Bank. GDP and GDP(PPP) (in 2010 USD): OECD/World Bank/CEPII (Paris).
TPES/ TPES/ TPES/ Elec. CO2/ CO2/ CO2/ CO2/ Region/ pop. GDP GDP (PPP) cons./pop. TPES pop. GDP GDP (PPP) Country/ (toe/capita) (toe/000 (toe/000 (kWh/ (t CO2/ (t CO2/ (kg CO2/ (kg CO2/ Economy 2010 USD) 2010 USD) capita) toe) capita) 2010 USD) 2010 USD)
Singapore 5.47 279.12 423.14 0.65 75.75 28.01 48.38 45.32 5.12 0.10 0.07 8 844 1.62 8.29 0.16 0.11 SingaporeSlovak Republic 5.42 96.90 143.50 6.57 9.77 15.95 27.84 29.33 2.94 0.16 0.11 5 137 1.84 5.41 0.30 0.20 Slovak RepublicSlovenia 2.06 47.93 56.46 3.70 3.01 6.67 13.87 12.76 3.24 0.14 0.12 6 728 1.91 6.19 0.27 0.23 SloveniaSouth Africa 54.00 411.04 658.69 168.32 -18.03 147.02 228.98 437.37 2.72 0.36 0.22 4 240 2.97 8.10 1.06 0.66 South AfricaSouth Sudan 11.91 6.08 22.48 8.11 -7.37 0.70 0.46 1.52 0.06 0.12 0.03 39 2.17 0.13 0.25 0.07 South SudanSpain 46.46 1 375.52 1 448.78 35.10 91.94 114.56 248.95 231.99 2.47 0.08 0.08 5 358 2.03 4.99 0.17 0.16 SpainSri Lanka 20.64 72.49 215.71 5.33 5.93 10.71 11.04 16.74 0.52 0.15 0.05 535 1.56 0.81 0.23 0.08 Sri LankaSudan 39.35 67.01 149.68 16.34 -1.07 14.99 9.75 13.34 0.38 0.22 0.10 248 0.89 0.34 0.20 0.09 SudanSuriname5 0.54 4.96 8.37 0.99 -0.25 0.69 1.99 1.99 1.28 0.14 0.08 3 699 2.89 3.70 0.40 0.24 Suriname5
Sweden 9.70 517.63 415.05 34.54 16.30 48.16 130.71 37.42 4.97 0.09 0.12 13 480 0.78 3.86 0.07 0.09 SwedenSwitzerland 8.19 620.44 428.99 13.27 13.36 25.06 61.58 37.74 3.06 0.04 0.06 7 520 1.51 4.61 0.06 0.09 SwitzerlandSyrian Arab Republic 22.16 54.60 120.54 5.64 5.43 10.80 18.24 27.57 0.49 0.20 0.09 823 2.55 1.24 0.50 0.23 Syrian Arab RepublicChinese Taipei 23.38 478.34 932.76 13.64 101.70 110.23 251.07 249.66 4.71 0.23 0.12 10 738 2.26 10.68 0.52 0.27 Chinese TaipeiTajikistan 8.30 7.47 20.87 1.79 1.08 2.80 12.38 4.66 0.34 0.38 0.13 1 492 1.66 0.56 0.62 0.22 TajikistanTanzania 51.82 40.88 119.36 22.17 2.87 24.83 5.18 10.37 0.48 0.61 0.21 100 0.42 0.20 0.25 0.09 TanzaniaThailand 67.73 382.59 996.11 78.74 59.58 134.76 173.75 243.52 1.99 0.35 0.14 2 566 1.81 3.60 0.64 0.24 ThailandTogo 7.12 3.92 9.50 2.64 0.71 3.30 1.10 1.72 0.46 0.84 0.35 155 0.52 0.24 0.44 0.18 TogoTrinidad and Tobago 1.35 21.88 40.47 39.66 -19.55 19.57 9.66 23.21 14.45 0.89 0.48 7 137 1.19 17.15 1.06 0.57 Trinidad and TobagoTunisia 11.00 47.52 117.54 6.71 4.15 10.52 16.09 25.01 0.96 0.22 0.09 1 463 2.38 2.27 0.53 0.21 TunisiaTurkey 76.62 870.92 1 392.43 31.35 93.72 121.54 219.89 307.11 1.59 0.14 0.09 2 870 2.53 4.01 0.35 0.22 TurkeyTurkmenistan 5.31 34.31 76.76 77.98 -50.74 26.75 14.64 67.00 5.04 0.78 0.35 2 759 2.50 12.62 1.95 0.87 TurkmenistanUkraine 45.36 134.02 346.35 76.93 27.47 105.68 154.77 236.54 2.33 0.79 0.31 3 412 2.24 5.21 1.76 0.68 UkraineUnited Arab Emirates 9.09 350.93 574.76 200.04 -109.55 70.47 102.17 175.43 7.76 0.20 0.12 11 245 2.49 19.31 0.50 0.31 United Arab EmiratesUnited Kingdom 64.60 2 605.73 2 441.45 108.24 87.40 179.42 331.44 407.84 2.78 0.07 0.07 5 131 2.27 6.31 0.16 0.17 United KingdomUnited States 319.17 16 156.62 16 156.62 2 011.98 258.11 2 216.19 4 137.10 5 176.21 6.94 0.14 0.14 12 962 2.34 16.22 0.32 0.32 United StatesUruguay 3.42 47.61 66.75 2.62 2.33 4.71 10.49 6.27 1.38 0.10 0.07 3 068 1.33 1.83 0.13 0.09 UruguayUzbekistan 30.76 53.81 160.23 55.84 -12.17 43.68 50.61 97.90 1.42 0.81 0.27 1 645 2.24 3.18 1.82 0.61 UzbekistanVenezuela 30.69 421.58 503.75 185.71 -117.48 67.50 81.69 154.99 2.20 0.16 0.13 2 661 2.30 5.05 0.37 0.31 VenezuelaViet Nam 90.73 144.84 477.38 71.20 -2.69 66.62 130.57 143.31 0.73 0.46 0.14 1 439 2.15 1.58 0.99 0.30 Viet NamYemen 26.18 28.54 93.39 16.05 -8.44 7.42 5.68 21.34 0.28 0.26 0.08 217 2.87 0.81 0.75 0.23 YemenZambia 15.72 26.02 57.37 9.13 0.83 10.06 11.05 3.19 0.64 0.39 0.18 703 0.32 0.20 0.12 0.06 ZambiaZimbabwe 15.25 12.65 25.53 11.52 1.15 11.05 8.28 11.49 0.72 0.87 0.43 543 1.04 0.75 0.91 0.45 Zimbabwe
Selected indicators for 2014 (continued)
KEyWorld2016.indb 57 01/09/2016 11:38:44
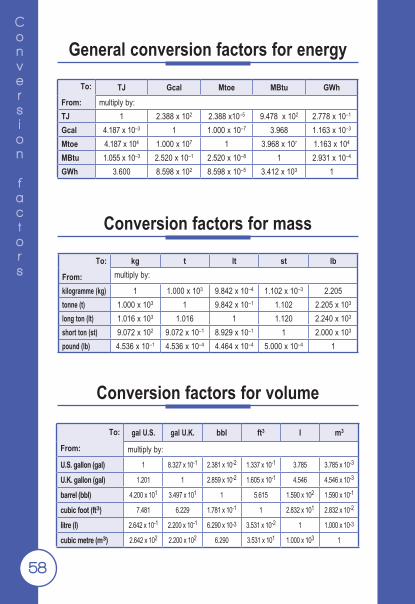
58
Conversion
factors
General conversion factors for energy
Conversion factors for mass
Conversion factors for volume
To:
From:
gal U.S. gal U.K. bbl ft3 l m3
multiply by:
U.S. gallon (gal) 1 8.327 x 10⁻¹ 2.381 x 10⁻² 1.337 x 10⁻¹ 3.785 3.785 x 10⁻³
U.K. gallon (gal) 1.201 1 2.859 x 10⁻² 1.605 x 10⁻¹ 4.546 4.546 x 10⁻³
barrel (bbl) 4.200 x 101 3.497 x 101 1 5.615 1.590 x 10² 1.590 x 10⁻¹
cubic foot (ft3) 7.481 6.229 1.781 x 10⁻¹ 1 2.832 x 101 2.832 x 10⁻²
litre (l) 2.642 x 10⁻¹ 2.200 x 10⁻¹ 6.290 x 10⁻³ 3.531 x 10⁻² 1 1.000 x 10⁻³
cubic metre (m3) 2.642 x 10² 2.200 x 10² 6.290 3.531 x 101 1.000 x 10³ 1
To:
From:
kg t lt st lbmultiply by:
kilogramme (kg) 1 1.000 x 10³ 9.842 x 10⁻⁴ 1.102 x 10⁻³ 2.205tonne (t) 1.000 x 10³ 1 9.842 x 10⁻¹ 1.102 2.205 x 10³
long ton (lt) 1.016 x 10³ 1.016 1 1.120 2.240 x 10³
short ton (st) 9.072 x 10² 9.072 x 10⁻¹ 8.929 x 10⁻¹ 1 2.000 x 10³
pound (lb) 4.536 x 10⁻¹ 4.536 x 10⁻⁴ 4.464 x 10⁻⁴ 5.000 x 10⁻⁴ 1
To:
From:TJ Gcal Mtoe MBtu GWh
multiply by:TJ 1 2.388 x 10² 2.388 x10⁻⁵ 9.478 x 10² 2.778 x 10⁻¹
Gcal 4.187 x 10⁻³ 1 1.000 x 10⁻⁷ 3.968 1.163 x 10⁻³
Mtoe 4.187 x 10⁴ 1.000 x 10⁷ 1 3.968 x 10⁷ 1.163 x 10⁴
MBtu 1.055 x 10⁻³ 2.520 x 10⁻¹ 2.520 x 10⁻⁸ 1 2.931 x 10⁻⁴
GWh 3.600 8.598 x 10² 8.598 x 10⁻⁵ 3.412 x 10³ 1
KEyWorld2016.indb 58 01/09/2016 11:38:44
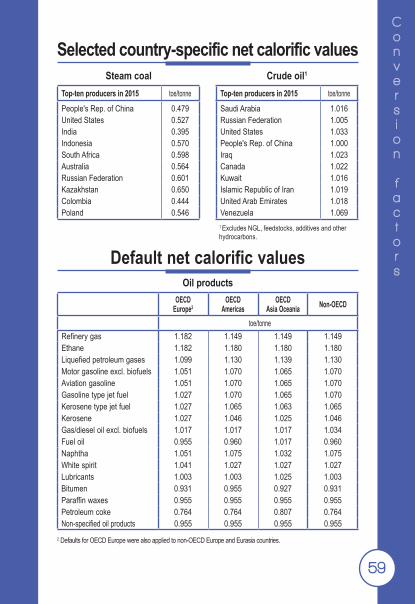
59
Conversion
factors
Selected country-specific net calorific values
2 Defaults for OECD Europe were also applied to non-OECD Europe and Eurasia countries.
Oil products
Default net calorific values
Steam coalTop-ten producers in 2015 toe/tonne
People's Rep. of China 0.479United States 0.527India 0.395Indonesia 0.570South Africa 0.598Australia 0.564Russian Federation 0.601Kazakhstan 0.650Colombia 0.444Poland 0.546
Crude oil1
Top-ten producers in 2015 toe/tonne
Saudi Arabia 1.016Russian Federation 1.005United States 1.033People's Rep. of China 1.000Iraq 1.023Canada 1.022Kuwait 1.016Islamic Republic of Iran 1.019United Arab Emirates 1.018Venezuela 1.069
1 Excludes NGL, feedstocks, additives and other hydrocarbons.
OECD Europe2
OECD Americas
OECD Asia Oceania Non-OECD
toe/tonneRefinery gas 1.182 1.149 1.149 1.149Ethane 1.182 1.180 1.180 1.180Liquefied petroleum gases 1.099 1.130 1.139 1.130Motor gasoline excl. biofuels 1.051 1.070 1.065 1.070Aviation gasoline 1.051 1.070 1.065 1.070Gasoline type jet fuel 1.027 1.070 1.065 1.070Kerosene type jet fuel 1.027 1.065 1.063 1.065Kerosene 1.027 1.046 1.025 1.046Gas/diesel oil excl. biofuels 1.017 1.017 1.017 1.034Fuel oil 0.955 0.960 1.017 0.960Naphtha 1.051 1.075 1.032 1.075White spirit 1.041 1.027 1.027 1.027Lubricants 1.003 1.003 1.025 1.003Bitumen 0.931 0.955 0.927 0.931Paraffin waxes 0.955 0.955 0.955 0.955Petroleum coke 0.764 0.764 0.807 0.764Non-specified oil products 0.955 0.955 0.955 0.955
KEyWorld2016.indb 59 01/09/2016 11:38:44

60
Conversion
factors
Conventions for electricity
Selected country-specific gross calorific valuesNatural gas
Top-ten producers in 2015 kJ/m3
United States 38 267 Russian Federation 38 230 Islamic Republic of Iran 39 356 Qatar 41 400 Canada 39 000People's Rep. of China 38 931 Norway 39 237 Saudi Arabia 38 000 Turkmenistan 37 889Algeria 39 565
Note: To calculate the net calorific value, the gross calorific value is multiplied by 0.9.
Figures for electricity production, trade, and final consumption are calculated using the energy content of the electricity (i.e. at a rate of 1 TWh = 0.086 Mtoe). Hydro-electricity production (excluding pumped storage) and electricity produced by other non-thermal means (wind, tide/wave/ocean, photovoltaic, etc.) are accounted for similarly using 1 TWh = 0.086 Mtoe. However, the primary energy equivalent of nuclear electricity is calculated from the gross generation by assuming a 33% conversion efficiency, i.e. 1 TWh = (0.086 ÷ 0.33) Mtoe. For geothermal and solar thermal, if no country-specific information is reported, the primary energy equivalent is calculated as follows: 10% for geothermal electricity; 50% for geothermal heat; 33% for solar thermal electricity; 100% for solar thermal heat.
KEyWorld2016.indb 60 01/09/2016 11:38:44
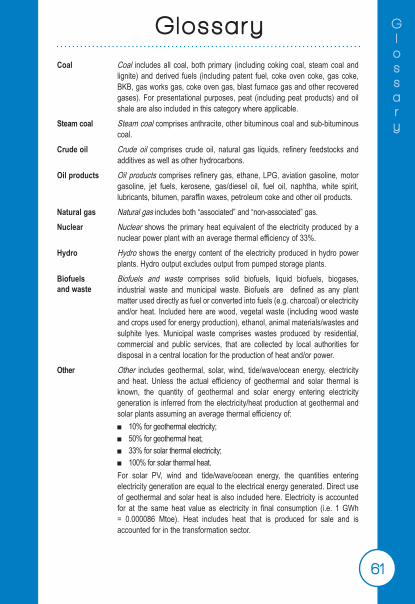
61
Glossary
Coal Coal includes all coal, both primary (including coking coal, steam coal and lignite) and derived fuels (including patent fuel, coke oven coke, gas coke, BKB, gas works gas, coke oven gas, blast furnace gas and other recovered gases). For presentational purposes, peat (including peat products) and oil shale are also included in this category where applicable.
Steam coal Steam coal comprises anthracite, other bituminous coal and sub-bituminous coal.
Crude oil Crude oil comprises crude oil, natural gas liquids, refinery feedstocks and additives as well as other hydrocarbons.
Oil products Oil products comprises refinery gas, ethane, LPG, aviation gasoline, motor gasoline, jet fuels, kerosene, gas/diesel oil, fuel oil, naphtha, white spirit, lubricants, bitumen, paraffin waxes, petroleum coke and other oil products.
Natural gas Natural gas includes both “associated” and “non-associated” gas. Nuclear Nuclear shows the primary heat equivalent of the electricity produced by a
nuclear power plant with an average thermal efficiency of 33%.Hydro Hydro shows the energy content of the electricity produced in hydro power
plants. Hydro output excludes output from pumped storage plants.Biofuels and waste
Biofuels and waste comprises solid biofuels, liquid biofuels, biogases, industrial waste and municipal waste. Biofuels are defined as any plant matter used directly as fuel or converted into fuels (e.g. charcoal) or electricity and/or heat. Included here are wood, vegetal waste (including wood waste and crops used for energy production), ethanol, animal materials/wastes and sulphite lyes. Municipal waste comprises wastes produced by residential, commercial and public services, that are collected by local authorities for disposal in a central location for the production of heat and/or power.
Other Other includes geothermal, solar, wind, tide/wave/ocean energy, electricity and heat. Unless the actual efficiency of geothermal and solar thermal is known, the quantity of geothermal and solar energy entering electricity generation is inferred from the electricity/heat production at geothermal and solar plants assuming an average thermal efficiency of:■ 10% for geothermal electricity;■ 50% for geothermal heat;■ 33% for solar thermal electricity;■ 100% for solar thermal heat.For solar PV, wind and tide/wave/ocean energy, the quantities entering electricity generation are equal to the electrical energy generated. Direct use of geothermal and solar heat is also included here. Electricity is accounted for at the same heat value as electricity in final consumption (i.e. 1 GWh = 0.000086 Mtoe). Heat includes heat that is produced for sale and is accounted for in the transformation sector.
Glossary
KEyWorld2016.indb 61 01/09/2016 11:38:44
62
Glossary
Production Production is the production of primary energy, i.e. coking coal, steam coal, lignite, peat, oil shale, crude oil, NGLs, natural gas, biofuels and waste, nuclear, hydro, geothermal, solar and the heat from heat pumps that is extracted from the ambient environment. Production is calculated after removal of impurities (e.g. sulphur from natural gas).
Imports and exports
Imports and exports comprise amounts having crossed the national territorial boundaries of the country, whether or not customs clearance has taken place.a) Oil and natural gas Quantities of crude oil and oil products imported or exported under processing agreements (i.e. refining on account) are included. Quantities of oil in transit are excluded. Crude oil, NGL and natural gas are reported as coming from the country of origin; refinery feedstocks and oil products are reported as coming from the country of last consignment. Re-exports of oil imported for processing within bonded areas are shown as exports of product from the processing country to the final destination.b) CoalImports and exports comprise the amount of fuels obtained from or supplied to other countries, whether or not there is an economic or customs union between the relevant countries. Coal in transit is not included.c) ElectricityAmounts are considered as imported or exported when they have crossed the national territorial boundaries of the country.
International marine bunkers
International marine bunkers covers those quantities delivered to ships of all flags that are engaged in international navigation. The international navigation may take place at sea, on inland lakes and waterways, and in coastal waters. Consumption by ships engaged in domestic navigation is excluded. The domestic/international split is determined on the basis of port of departure and port of arrival, and not by the flag or nationality of the ship. Consumption by fishing vessels and by military forces is also excluded.
International aviation bunkers
International aviation bunkers covers deliveries of aviation fuels to aircraft for international aviation. Fuels used by airlines for their road vehicles are excluded. The domestic/international split should be determined on the basis of departure and landing locations and not by the nationality of the airline. For many countries this incorrectly excludes fuel used by domestically owned carriers for their international departures.
Stock changes
Stock changes reflects the difference between opening stock levels on the first day of the year and closing levels on the last day of the year of stocks on national territory held by producers, importers, energy transformation industries and large consumers. A stock build is shown as a negative number, and a stock draw as a positive number.
Transfers Transfers includes both interproduct transfers, products transferred and recycled products.
KEyWorld2016.indb 62 01/09/2016 11:38:45

63
Glossary
Total primary energy supply (TPES)
Total primary energy supply (TPES) is made up of production + imports – exports – international marine bunkers – international aviation bunkers ± stock changes. For the world total, international marine bunkers and international aviation bunkers are not subtracted from TPES.
Statistical differences
Statistical differences includes the sum of the unexplained statistical differences for individual fuels, as they appear in the basic energy statistics. It also includes the statistical differences that arise because of the variety of conversion factors in the coal and oil columns.
Electricity plants
Electricity plants refers to plants which are designed to produce electricity only. If one or more units of the plant is a CHP unit (and the inputs and outputs can not be distinguished on a unit basis) then the whole plant is designated as a CHP plant. Both main activity producers and autoproducer plants are included here.
Oil refineries Oil refineries shows the use of primary energy for the manufacture of finished oil products and the corresponding output. Thus, the total reflects transformation losses. In certain cases the data in the total column are positive numbers. This can be due to either problems in the primary refinery balance or to the fact that the IEA uses regional net calorific values for oil products.
Other transformation
Other transformation covers non-specified transformation not shown elsewhere, such as the transformation of primary solid biofuels into charcoal.
Energy industry own use
Energy industry own use contains the primary and secondary energy consumed by transformation industries for heating, pumping, traction and lighting purposes [ISIC 05, 06, 19 and 35, Group 091 and Classes 0892 and 0721].
Losses Losses includes losses in energy distribution, transmission and transport. Total final consumption (TFC)
Total final consumption (TFC) is the sum of consumption by the different end-use sectors. Backflows from the petrochemical industry are not included in final consumption.
Industry Industry consumption is specified in the following subsectors (energy used for transport by industry is not included here but reported under transport): ■ Iron and steel industry [ISIC Group 241 and Class 2431]; ■ Chemical and petrochemical industry [ISIC Divisions 20
and 21] excluding petrochemical feedstocks;■ Non-ferrou s metals basic industries [ISIC Group 242 and Class 2432]; ■ Non-metallic minerals such as glass, ceramic, cement, etc.
[ISIC Division 23];■ Transport equipment [ISIC Divisions 29 and 30];■ Machinery comprises fabricated metal products, machinery and
equipment other than transport equipment [ISIC Divisions 25 to 28];
KEyWorld2016.indb 63 01/09/2016 11:38:45
64
Glossary
Industry (ctd.) ■ Mining (excluding fuels) and quarrying [ISIC Divisions 07 and 08 and Group 099];
■ Food and tobacco [ISIC Divisions 10 to 12];■ Paper, pulp and printing [ISIC Divisions 17 and 18];■ Wood and wood products (other than pulp and paper) [ISIC Division 16];■ Construction [ISIC Divisions 41 to 43]; ■ Textile and leather [ISIC Divisions 13 to 15];■ Non-specified (any manufacturing industry not included above) [ISIC
Divisions 22, 31 and 32].
Transport Transport includes all fuels used for transport [ISIC Divisions 49 to 51]. It includes transport in industry and covers domestic aviation, road, rail, pipeline transport, domestic navigation and non-specified transport. Fuel used for ocean, coastal and inland fishing (included under fishing) and military consumption (included in other non-specified) are excluded from transport. Please note that international marine and international aviation bunkers are also included here for world total.
Other Other covers residential, commercial and public services [ISIC Divisions 33, 36-39, 45-47, 52, 53, 55, 56, 58-66, 68-75, 77-82, 84 (excluding Class 8422), 85-88, 90-99], agriculture/forestry [ISIC Divisions 01 and 02], fishing [ISIC Division 03] and non-specified consumption.
Non-energy use Non-energy use covers those fuels that are used as raw materials in the different sectors and are not consumed as a fuel or transformed into another fuel. Non-energy use also includes petrochemical feedstocks. Non-energy use is shown separately in final consumption under the heading non-energy use.
KEyWorld2016.indb 64 01/09/2016 11:38:45

65
Glossary
Unit abbreviations
bcm billion cubic metres MBtu million British thermal units
Gcal gigacalorie Mt million tonnes
GCV gross calorific value Mtoe million tonnes of oil equivalent
GW gigawatt MWh megawatt hour
GWh gigawatt hour PPP purchasing power parity
kb/cd thousand barrels per calendar day t metric ton = tonne = 1 000 kg
kcal kilocalorie TJ terajoule
kg kilogramme toe tonne of oil equivalent = 107 kcal
kJ kilojoule TWh terawatt hour
kWh kilowatt hour USD United States dollar
KEyWorld2016.indb 65 01/09/2016 11:38:45

66
Glossary
Geographical coverageOECD1 Australia, Austria, Belgium, Canada, Chile, Czech Republic, Denmark, Estonia,
Finland, France, Germany, Greece, Hungary, Iceland, Ireland, Israel, Italy, Japan, Korea, Luxembourg, Mexico, Netherlands, New Zealand, Norway, Poland, Portugal, Slovak Republic, Slovenia, Spain, Sweden, Switzerland, Turkey, United Kingdom and United States.
Middle East Bahrain, Islamic Republic of Iran, Iraq, Jordan, Kuwait, Lebanon, Oman, Qatar, Saudi Arabia, Syrian Arab Republic, United Arab Emirates and Yemen.
Non-OECD Europe and Eurasia
Albania, Armenia, Azerbaijan, Belarus, Bosnia and Herzegovina, Bulgaria, Croatia, Cyprus2, Former Yugoslav Republic of Macedonia, Georgia, Gibraltar, Kazakhstan, Kosovo3, Kyrgyzstan, Latvia4, Lithuania, Malta, Republic of Moldova, Montenegro3, Romania, Russian Federation, Serbia3, Tajikistan, Turkmenistan, Ukraine and Uzbekistan.
China People’s Republic of China and Hong Kong (China).Asia Bangladesh, Brunei Darussalam, Cambodia, India, Indonesia, Democratic
People’s Republic of Korea, Malaysia, Mongolia, Myanmar, Nepal, Pakistan, Philippines, Singapore, Sri Lanka, Chinese Taipei, Thailand, Viet Nam and Other Asia.
Non-OECD Americas
Argentina, Bolivia, Brazil, Colombia, Costa Rica, Cuba, Curaçao5, Dominican Republic, Ecuador, El Salvador, Guatemala, Haiti, Honduras, Jamaica, Nicaragua, Panama, Paraguay, Peru, Suriname, Trinidad and Tobago, Uruguay, Venezuela and Other Non-OECD Americas.
Africa Algeria, Angola, Benin, Botswana, Cameroon, Congo, Côte d’Ivoire, Democratic Republic of Congo, Egypt, Eritrea, Ethiopia, Gabon, Ghana, Kenya, Libya, Mauritius, Morocco, Mozambique, Namibia, Niger, Nigeria, Senegal, South Africa, South Sudan, Sudan, Tanzania, Togo, Tunisia, Zambia, Zimbabwe and Other Africa.
1. OECD includes Estonia and Slovenia starting in 1990. Prior to 1990, data for these two countries are included in Non-OECD Europe and Eurasia.2. Note by Turkey: The information in this document with reference to “Cyprus” relates to the southern part of the Island. There is no single authority representing both Turkish and Greek Cypriot people on the Island. Turkey recognises the Turkish Republic of Northern Cyprus (TRNC). Until a lasting and equitable solution is found within the context of United Nations, Turkey shall preserve its position concerning the “Cyprus issue”. Note by all the European Union Member States of the OECD and the European Union: The Republic of Cyprus is recognised by all members of the United Nations with the exception of Turkey. The information in this document relates to the area under the effective control of the Government of the Republic of Cyprus.3. Serbia includes Kosovo from 1990 to 1999 and Montenegro from 1990 to 2004.4. Latvia was not an OECD Member at the time of the preparation of this publication. Accordingly, Latvia does not appear in the list of OECD Members and is still included in the non-OECD aggregate.5. The Netherlands Antilles was dissolved on 10 October 2010, resulting in two new constituent countries, Curaçao and Sint Maarten, with the other islands joining the Netherlands. However, due to a lack of detailed data, the IEA secretariat’s data and estimates under the Netherlands Antilles still refer to the whole territory of the Netherlands Antilles as it was known prior to 10 October 2010 up to the end of 2011. Data refer only to the island of Curaçao from 2012. The other islands of the former Netherlands Antilles are added to Other Non-OECD Americas from 2012.Note: The countries listed above are those for which the IEA secretariat has direct statistics contacts. This document is without prejudice to the status of or sovereignty over any territory, to the delimitation of international frontiers and boundaries and to the name of any territory, city or area. In this publication “country” refers to country or territory, as the case may be.
KEyWorld2016.indb 66 01/09/2016 11:38:45

67
Eight annual publications
World Energy Statistics 2016
A new publication from the IEA presenting comprehensive world energy statistics, previously presented in Energy Statistics of OECD Countries and Energy Statistics of Non-OECD Countries, World Energy Statistics contains detailed data on all energy sources – coal, gas, oil, electricity, renewables and waste. It covers energy supply and consumption for 150 countries and regions, including all OECD countries, over 100 other key energy producing and consuming countries, as well as world and regional totals. The book includes detailed tables by country in original units for the year 2014, and summary time series on production, trade, and final consumption by sector. It also presents provisional 2015 supply data for OECD countries, and initial 2015 estimates for non-OECD countries’ production and trade of natural gas, primary coal and oil.
Published August 2016 - Price: Print €120; PDF €96
World Energy Balances 2016
A new release from the IEA presenting comprehensive energy balances for all the world’s largest energy producing and consuming countries, World Energy Balances is formed by merging Energy Balances of OECD Countries and Energy Balances of Non-OECD Countries, previously published separately. The volume contains detailed data on the supply and consumption of energy for all OECD countries, over 100 other key energy producing and consuming countries, as well as world and regional totals. The book includes graphs and detailed data by country for all energy sources – coal, gas, oil, electricity, renewables and waste - expressed in balance format, for the year 2014. Alongside this, there are summary time series on production, trade, final consumption by sector, as well as key energy and economic indicators. The volume also presents provisional 2015 supply data for OECD countries, and initial 2015 estimates for non-OECD countries’ production and trade of natural gas, primary coal and oil.
Published August 2016 - Price: Print €120; PDF €96
Stat ist ics publ icat ions
KEyWorld2016.indb 67 01/09/2016 11:38:45

68
Electricity Information 2016
Electricity Information provides a comprehensive review of historical and current market trends in the OECD electricity sector, including 2015 provisional data. It provides an overview of the world electricity developments in 2014 covering world electricity and heat production, input fuel mix, supply and consumption, and electricity imports and exports. More detail is provided for the 34 OECD countries with information covering production, installed capacity, input energy mix to electricity and heat production, consumption, electricity trades, input fuel prices and end-user electricity prices. It provides comprehensive statistical details on overall energy consumption, economic indicators, electricity and heat production by energy form and plant type, electricity imports and exports, sectoral energy and electricity consumption, as well as prices for electricity and electricity input fuels for each country and regional aggregate.
Published August 2016 - Price: Print €150; PDF €120
Coal Information 2016
Coal Information provides a comprehensive review of historical and current market trends in the world coal sector, including 2015 provisional data. It provides a review of the world coal market in 2015, alongside a statistical overview of developments, which covers world coal production and coal reserves, coal demand by type, coal trade and coal prices. A detailed and comprehensive statistical picture of historical and current coal developments in the 34 OECD member countries, by region and individually is presented in tables and charts. Complete coal balances and coal trade data for selected years are presented on 22 major non-OECD coal-producing and -consuming countries, with summary statistics on coal supply and end-use statistics for about 40 countries and regions worldwide.
Published August 2016 - Price: Print €165; PDF €132
KEyWorld2016.indb 68 01/09/2016 11:38:45

69
Natural Gas Information 2016
Natural Gas Information is a detailed reference work on gas supply and demand covering not only the OECD countries but also the rest of the world, this publication contains essential information on LNG and pipeline trade, gas reserves, storage capacity and prices. The main part of the book concentrates on OECD countries, showing a detailed supply and demand balance for each country and for the three OECD regions: Americas, Asia-Oceania and Europe, as well as a breakdown of gas consumption by end user. Import and export data are reported by source and destination.
Published August 2016 - Price: Print €165; PDF €132
Oil Information 2016
Oil Information is a comprehensive reference book on current developments in oil supply and demand. This publication contains key data on world production, trade, prices and consumption of major oil product groups, with time series back to the early 1970s. Its core consists of a detailed and comprehensive picture of oil supply, demand, trade, production and consumption by end-user for each OECD country individually and for the OECD regions. Trade data are reported extensively by origin and destination.
Published August 2016 - Price: Print €165; PDF €132
KEyWorld2016.indb 69 01/09/2016 11:38:45

70
Renewables Information 2016
Renewables Information provides a comprehensive review of historical and current market trends in OECD countries, including 2015 provisional data. It provides an overview of the development of renewables and waste in the world over the 1990 to 2014 period. A greater focus is given to the OECD countries with a review of electricity generation and capacity from renewable and waste energy sources, including detailed tables. However, an overview of developments in the world and OECD renewable and waste market is also presented. The publication encompasses energy indicators, generating capacity, electricity and heat production from renewable and waste sources, as well as production and consumption of renewables and waste.
Published August 2016 - Price: Print €110; PDF €88
CO2 Emissions from Fuel Combustion 2016
In recognition of the fundamental importance of understanding energy related environmental issues, the IEA CO2 Emissions from Fuel Combustion provides a full analysis of emissions stemming from energy use. This annual publication has become an essential tool for analysts and policy makers in many international fora such as the Conference of the Parties, which will be meeting in Marrakesh, Morocco, from 7 to 18 November 2016.The data in this book are designed to assist in understanding the evolution of the emissions of CO2 from 1971 to 2014 for 150 countries and regions by sector and by fuel. Emissions were calculated using IEA energy databases and the default methods and emission factors from the 2006 IPCC Guidelines for National Greenhouse Gas Inventories.
Published November 2016 - Price: Print €165; PDF €132
KEyWorld2016.indb 70 01/09/2016 11:38:45
71
Two quarterlies
Oil, Gas, Coal and Electricity
This publication provides up-to-date, detailed quarterly statistics on oil, coal, natural gas and electricity for OECD countries. Oil statistics cover production, trade, refinery intake and output, stock changes and consumption for crude oil, NGL and nine selected oil product groups. Statistics for electricity, natural gas and coal show supply and trade. Import and export data are reported by origin and destination. The gas trade data from 1st quarter 2011 onwards corresponds to physical flows (entries/exits). Moreover, oil as well as hard coal and brown coal production are reported on a worldwide basis.
Published Quarterly - Price: single edition Print €120; annual subscription Print € 380;
single edition PDF €96; annual subscription PDF € 304
Energy Prices and Taxes
This publication responds to the needs of the energy industry and OECD governments for up-to-date information on prices and taxes in national and international energy markets. It contains crude oil import prices by crude stream, industry prices and consumer prices. The end-user prices for OECD member countries cover main petroleum products, gas, coal and electricity. Every issue includes full notes on sources and methods and a description of price mechanisms in each country. Time series availability varies with each data series.
Published Quarterly - Price: single edition Print €120; annual subscription Print € 380;
single edition PDF €96; annual subscription PDF € 304
KEyWorld2016.indb 71 01/09/2016 11:38:45
72
Electronic editions
CD-ROMs and Online Data Services
To complement its publications, the Energy Data Centre produces CD-ROMs containing the complete databases which are used for preparing the statistics publications. State-of-the-art software allows you to access and manipulate all these data in a very user-friendly manner and includes graphic facilities. These databases are also available on the internet from our online data service.
■Annual CD-ROMS / Online Databases• World Energy Statistics 2016 Price: €800• World Energy Balances 2016 Price: €800• World Energy Statistics and Balances 2016 Price: €1 400 (Combined subscription of the above two series) • Electricity Information 2016 Price: €550• Coal Information 2016 Price: €550• Natural Gas Information 2016 Price: €550• Oil Information 2016 Price: €550• Renewables Information 2016 Price: €400• CO2 Emissions from Fuel Combustion 2016 Price: €550
■Quarterly CD-ROMs / Online Databases• Energy Prices and Taxes Price: (four quarters) €900
A description of these services is available on our website: http://data.iea.org
All the annual and quarterly online databases are also accessible over the internet on a pay-per-view basis. The databases can be accessed either for a single data point or for time series.
KEyWorld2016.indb 72 01/09/2016 11:38:45

73
Other online services
The Monthly Oil Data Service
The IEA Monthly Oil Data Service provides the detailed databases of historical and projected information which is used in preparing the IEA monthly Oil Market Report (OMR). The IEA Monthly Oil Data Service comprises three packages available separately or combined as a subscriber service on the Internet. The data are available at the same time as the official release of the Oil Market Report.The packages include:
• Supply, Demand, Balances and Stocks Price: €6 150• Trade Price: €2 050• Field-by-Field Supply Price: €3 150• Complete Service Price: €9 200
A description of this service is available on our website: www.iea.org/statistics/mods
The Monthly Gas Data Service
The Monthly Gas Data Service provides monthly natural gas data for OECD countries:
• Supply balances in terajoules and cubic metres;• Production, trade, stock changes and levels where available, gross
inland deliveries, own use and losses;• Highly detailed trade data with about 50 import origins and export
destinations;• LNG trade detail available from January 2002;• From 2011 onwards, transit volumes are included and trade data
corresponds to entries/exits.The databases cover the time period January 1984 to current month with a time lag of two months for the most recent data.
• Monthly Gas Data Service: Natural Gas Balances & Trade Historical plus 12 monthly updates Price: €800
A description of this service is available on our website: www.iea.org/statistics/mgds
KEyWorld2016.indb 73 01/09/2016 11:38:45

74
The IEA statistics website contains a wealth of free statistics covering oil, natural gas, coal, electricity, renewables, energy-related CO2 emissions and more for over 140 countries and historic data for the last 20 years. It also contains Sankey flows to enable users to explore visually how a country’s energy balance shifts over up to 40 years, starting with production and continuing through transformation to see important changes in supply mix or share of consumption. The website also includes a range of monthly data.
The IEA statistics site can be accessed at: www.iea.org/statistics/
Note: The prices quoted for Electronic Editions are for single-user licences. Please contact us for information on multi-user licence prices.
For more information, please feel free to contact the Energy Data Centre of the IEA at [email protected]
INTERNATIONAL ENERGY AGENCY9, rue de la Fédération, 75739 Paris Cedex 15 - France
A wealth ofENERGY
STATSat your
f ingertips
www.iea.org
IEA ENERGY STATS: download it for
free on your
iPhone, iPad,
Android device or
Windows Phone
2016
Key wor ld energy stat ist ics
KWES_2016_App_Pub_V1.indd 1 31-08-2016 16:06:30KEyWorld2016.indb 74 01/09/2016 11:38:45

A wealth ofENERGY
STATSat your
f ingertips
www.iea.org
IEA ENERGY STATS: download it for
free on your
iPhone, iPad,
Android device or
Windows Phone
2016
Key wor ld energy stat ist ics
of
KWES_2016_App_Pub_V1.indd 1 31-08-2016 16:06:30KEyWorld2016.indb 75 01/09/2016 11:38:46
76
Oil Market Report
Each month, the primary source of data on supply, demand, stocks, prices and refining
Since its appearance in 1983, the International Energy Agency’s Oil Market Report (OMR) has become the definitive source of information on world oil market fundamentals, covering supply, demand, OECD stocks, prices and refining as well as OECD and selected non-OECD trade.The OMR provides the most extensive, up-to-date statistical data available on current world oil market trends. It is the first and exclusive source to present official government statistics from all OECD countries, as well as selected data from non-OECD countries.The main market movements of the month are highlighted in a convenient summary, while detailed analysis explains recent market developments and provides an insight into the months ahead. It is the only regular short-term analysis of the oil industry available based on information obtained from the extensive IEA network of contacts with government and industry.The OMR provides both historical data and supply/demand forecasts for the year ahead. Featuring tables, graphs and statistics, it provides all the data and analysis necessary to track the oil market and to identify trends in production, consumption, refining, inventories in OECD countries and prices for both crude and products.Additionally, subscribers to the OMR receive a copy of the annual Medium-Term Oil Market Report (MTOMR) which examines key industry themes. These include the impact of the global economic slowdown on oil demand, upstream and downstream investment levels, the likely pace of development of biofuels and non-conventional oil supplies, likely oil products availability and oil price formation. The MTOMR provides detailed supply and demand forecasts for crude oil and oil products looking five years forward, and since its inception in 2006 the report has become a standard industry reference.
To subscribe electronically, please see our website at www.oilmarketreport.org
Annual subscription rate for single electronic copy: €2 200
KEyWorld2016.indb 76 01/09/2016 11:38:46
77
World Energy Outlook 2016
The successful outcome of COP21 has raised hopes and expectations of concerted globaleffortstotackleclimatechange,buthowwillthisaffecttheefficiencyandcarbonfootprint of the energy sector? When and how will market dynamics change for oil, natural gas and coal – or might lower prices for some fuels be here to stay? How can governments address the impact of local pollution, often energy-related, on air quality? The World Energy Outlook 2016 (WEO-2016) series – including a special report in June and the full Outlook in November – will seek to shed light on these questions and more, all with the customary mix of rigorous quantitative modelling and insightful analysis. The WEO-2016 series will include a particular focus on the following topical issues:
The impact of COP21: WEO-2016 will track progress with the implementation of the different country climate pledges made in Paris and judge what they mean for long-term energy trends. Based on this assessment, it will examine and present policy options to bridge the gap and reach climate objectives in full.
Major focus on renewables: renewable energy is vital to steer the energy system to the lowcarbon future envisioned in the Paris agreement. This analysis will assess the rapid improvement in the competitiveness and economics of renewables, relative to fossil-fuels and other low carbon options, as well as the opportunities and questions that a rising share of renewable energy open up for the energy system as a whole.
The road ahead for fossil fuels: coal, oil and natural gas remain the bedrock of global energy use but all face an uncertain period of adjustment, both to today’s market conditions and – over the longer term – to the prospect of a new policy landscape post-COP21. With lower prices bringing down the axe on many new projects, WEO-2016 will assess the impact on tomorrow’s market balances and the different pathways and risks that lie further ahead.
Mexico’s energy outlook: the comprehensive energy reform package passed in Mexico will have profound effects on the country’s energy sector development. This analysis will evaluate the potential impact of the reforms for Mexico’s upstream as well as its power sector and wider economy.
Energy and water: are interdependent. This analysis will assess current and future freshwater requirements for energy production and the amount of energy required for the water sector, highlighting potential vulnerabilities and key stress points.
Special Report on Energy and Air Pollution (Released in June 2016): Energy-related air pollution leads to millions of premature deaths and costs the global economy trillions of dollars each year; with growing demand for energy services in the future, the already high costs of air pollution risk increasing dramatically. This specialreport,thefirstofitskind,willprovidenewanalysistohelpdecision-makerstackle an issue of pressing social and political concern.
For more information please visit our website: www.worldenergyoutlook.org
Order now at www.iea.org/books or by emailing [email protected] Price: €150
KEyWorld2016.indb 77 01/09/2016 11:38:46
© OECD/IEA, 2016International Energy Agency (IEA)Head of Communication and Information Office
9, rue de la Fédération, 75739 Paris Cedex 15, France.
Please note that this publication is subject to specific restrictions that limit its use and distribution.
The terms and conditions are available online atwww.iea.org/t&c
Typesetted in France by Desk, September 2016Cover design: IEA, Photo credits: © GraphicObsession
Inside photos: Pages 11, 13, 17, 21 and 25 - © PhotodiscPages 15 and 27 - © Brand X
Pages 19 and 23 - © Digital Stock
IEA/OECD possible corrigenda on: www.oecd.org/about/publishing/corrigenda.htm
KEyWorld2016.indb 80 01/09/2016 11:38:46