Key results from the survey on organic agriculture worldwide 2011 Part 3: Organic agriculture in the...
73
Key results from the survey on organic agriculture worldwide 2011 Part 3: Organic agriculture in the regions 2009 Research Institute of Organic Agriculture FiBL, Frick, Switzerland, in cooperation with the International Federation of Organic Agriculture Movements IFOAM Supported by: Swiss State Secretariat of Economic Affairs, International Trade Centre, NürnbergMesse Data as published February 2011 in The World of Organic Agriculture. Statistics and Emerging Trends 2011 For updates check www.organic-world.net Contact: Helga Willer, Research Institute of Organic Agriculture, FiBL, Frick, Switzerland, [email protected] £http://www.organic-world.net/presentations-2011.html Version: 30.5.2011
-
Upload
eleanor-morris -
Category
Documents
-
view
215 -
download
0
Transcript of Key results from the survey on organic agriculture worldwide 2011 Part 3: Organic agriculture in the...

Key results from the survey on organic agriculture worldwide 2011 Part 3: Organic agriculture in the regions 2009
Research Institute of Organic Agriculture FiBL, Frick, Switzerland, in cooperation with the International Federation of Organic Agriculture Movements IFOAM
Supported by: Swiss State Secretariat of Economic Affairs, International Trade Centre, NürnbergMesse
Data as published February 2011 in The World of Organic Agriculture. Statistics and Emerging Trends 2011For updates check www.organic-world.net
Contact: Helga Willer, Research Institute of Organic Agriculture, FiBL, Frick, Switzerland, [email protected]£http://www.organic-world.net/presentations-2011.html
Version: 30.5.2011

www.fibl.org
The Global Survey on Organic Agriculture: Supporters
› International Trade Centre, Geneva
› The Swiss State Secretariat of Economic Affairs SECO, Berne
› Nürnberg Messe, the organizers of the BioFach Organic Trade Fair

www.fibl.org
The World of Organic Agriculture 2011
› The 12th edition of ‚The World of Organic Agriculture‘, was published by FiBL and IFOAM in February 2011.*
› Contents:› Results of the survey on organic agriculture
worldwide;› Organic agriculture in the regions and country
reports;› Armenia, Australia, Canada, Chile, China,
Costa Rica, Indonesia, Kazakhstan, Republic of Korea, Pacific Islands, Switzerland, Tunisia, Uganda, United States and Ukraine.
› Chapters on the global market, standards & legislations, voluntary standards and organic beekeeping
› Numerous tables and graphs. › The book can be ordered via IFOAM.org and
shop.FiBL.org. › *Willer, H, and Kilcher, L. (2011) The World of
Organic Agriculture. Statistics and Emerging Trends 2011. IFOAM, Bonn, and FiBL, Frick

www.fibl.org
Website www.organic-world.net
› Detailed statistics in excel format (in progress)
› Graphs & Maps› Data revisions› News and
background information

www.fibl.org
About this presentation
› This presentations summarizes the key results of the FiBL/IFOAM survey on organic agriculture worldwide 2011 (data 2009). In addition key results on crop and on regional data are presented.
› More information is available at the password area of www.organic-world.net
› The presentations has 4 main chapters:1. Data background and key data on organic agriculture: Land,
producers, market data 2009
2. Organic agriculture in developing countries 2009
3. Land use and key crops in organic agriculture 2009
4. Organic agriculture in the regions
www.fibl.org
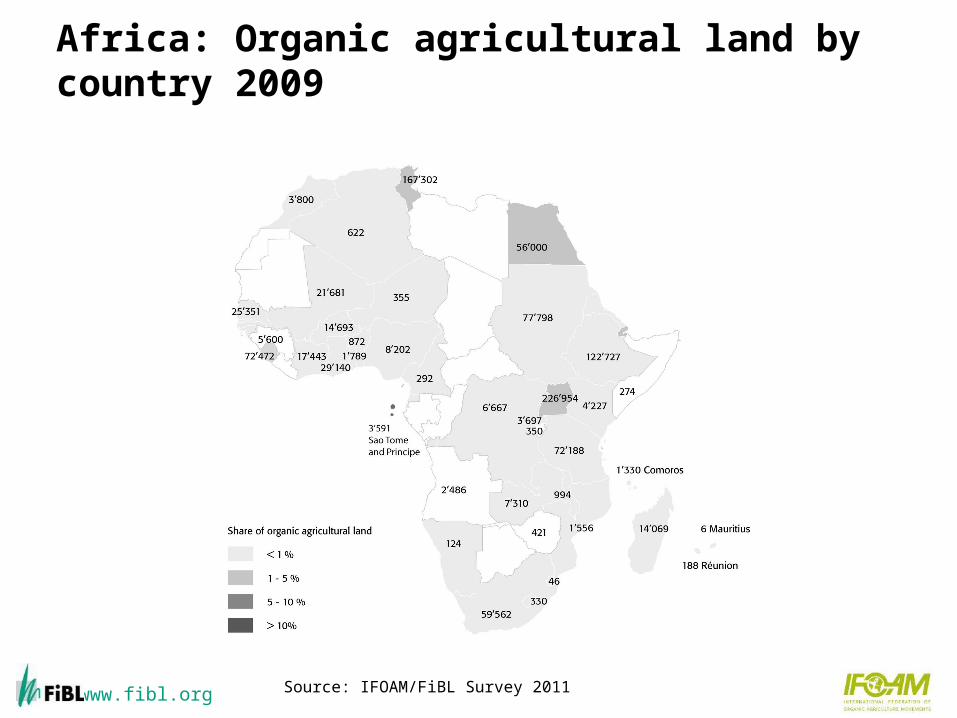
Africa: Organic agricultural land by country 2009
Source: IFOAM/FiBL Survey 2011
www.fibl.org
Organic agriculture in Africa 2009
› In Africa, there are slightly more than one million hectares of certified organic agricultural land (data 2009).
› This constitutes about three percent of the world’s organic agricultural land.
› 500’000 producers were reported. › The countries with the most organic land are Uganda (226'954
hectares), Tunisia (167'302 hectares), and Ethiopia (122'727 hectares). › The highest shares of organic land are in Sao Tome and Prince (6.5
percent), Sierra Leone (1.8 percent), and Uganda (1.7 percent). › The majority of certified organic produce in Africa is destined for export
markets; in Uganda the export value for organic products was 37 million US dollars in 2009/2010.
› The European Union, as the major recipient of these exports, is Africa’s largest market for agricultural produce. Tunisia was accepted under the EU’s Third Country List in 2009.
Source: IFOAM/FiBL Survey 2011

www.fibl.org
Africa: Development of organic agricultural land 1999-2009
0.23 0.
32 0.36
0.52
0.49
0.68
0.86
0.86
1.03
0.05
0.05
0.0
0.2
0.4
0.6
0.8
1.0
1.2
1999 2000 2001 2002 2003 2004 2005 2006 2007 2008 2009
Hec
tare
s
Source: IFOAM, FiBL and SOEL, surveys 2000-2011

www.fibl.org
Africa: The ten countries with the most organic agricultural land 2009
25'351
29'140
56'000
59'562
72'188
72'472
77'798
122'727
167'302
226'954
0 100'000 200'000
Senegal
Ghana
Egypt
South Africa
Tanzania, United Republic of
Sierra Leone
Sudan
Ethiopia
Tunisia
Uganda
Hectares
IFOAM/FiBL Survey 2011, based on data from governments, the private organic sector and certifiers
www.fibl.org
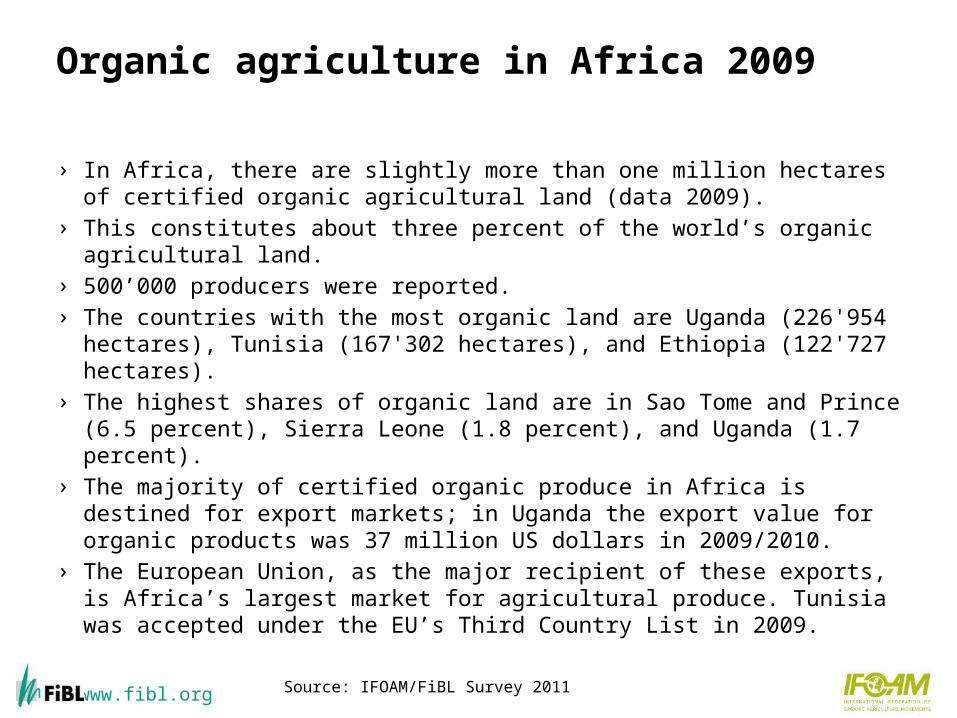
Africa: Distribution of organically managed agricultural land by country 2009 (total: 1.03 mio ha)
22%
16%
12%
50%
Uganda
Tunisia
Ethiopia
Rest
IFOAM/FiBL Survey 2011, based on data from governments, the private organic sector and certifiers

www.fibl.org
Africa: The ten countries with the highest shares of organic agricultural land 2009
0.2%
0.3%
0.4%
0.5%
0.9%
1.6%
1.7%
1.7%
1.8%
6.5%
0% 1% 2% 3% 4% 5% 6% 7%
Tanzania, United Republic of
Senegal
Ethiopia
Réunion (France)
Comoros
Egypt
Tunisia
Uganda
Sierra Leone
Sao Tome and Principe
IFOAM/FiBL Survey 2011, based on data from governments, the private organic sector and certifiers

www.fibl.org
Africa: Distribution of shares of organic land 2009
2%10%
88%
Countries with 5.0 to9.9 % organic land
Countries with 1 to4.9 % organic land
Countries with lessthan 1 % organicland
Source: FiBL/IFOAM Survey 2011
www.fibl.org
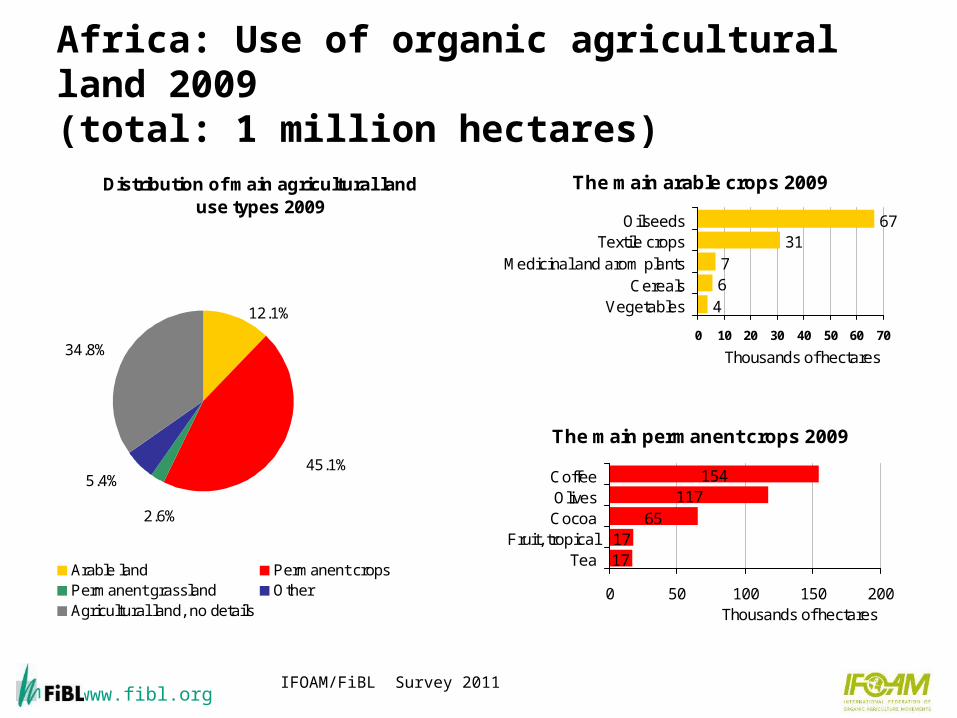
Africa: Use of organic agricultural land 2009 (total: 1 million hectares)
Distribution of main agricultural land use types 2009
12.1%
2.6%
45.1%5.4%
34.8%
Arable land Permanent cropsPermanent grassland OtherAgricultural land, no details
The main arable crops 2009
467
3167
0 10 20 30 40 50 60 70
VegetablesCereals
Medicinal and arom plantsTextile crops
Oilseeds
Thousands of hectares
The main permanent crops 2009
1717
65117
154
0 50 100 150 200
TeaFruit, tropical
CocoaOlivesCoffee
Thousands of hectares
IFOAM/FiBL Survey 2011

www.fibl.org
Articles about Africa in the 2011 Edition of "The World of Organic Agriculture"
› Organic Farming in Africa Hervé Bouagnimbeck
› Tunisia: Country Report Lukas Kilcher and Samia Maamer Belkhiria
› Uganda: Country Report Charity Namuwoza and Hedwig Tushemerirwe
14

www.fibl.org
Asia: Organic agricultural land by country 2009
Source: FiBL/IFOAM Survey 2011, based on national sources

www.fibl.org
Organic Agriculture in Asia – Key Figures 2009
› The total organic agricultural area in Asia is nearly 3.6 million hectares.
› This constitutes ten percent of the world’s organic agricultural land.
› There were 731'315 producers reported. › The leading countries by area are China (1.9 million
hectares) and India (1.2 million hectares). › Timor-Leste has the most organic agricultural area as a
proportion of total agricultural land (almost seven percent).
16

www.fibl.org
Organic Agriculture in Asia – Key Figures 2009
› The region hosts a wide range of organic sector development scenarios, from early development to highly regulated. Far from the marginal position it held previously, organic is now an accepted concept and growing market trend in the region.
› Whilst export remains the dominant feature of sector development in the majority of developing countries in the region, local markets have emerged and are gaining ground.
› Primarily a market driven sector, government policy is an emerging and significant sector development factor today in many countries. Although domestic market size is still relatively small, the high value and profile associated with organic has led to civil society (consumer) calls and governments’ interest to regulate the sector. Seven markets have implementedorganic labeling regulations (i.e., China, India, Japan, South Korea, Philippines, Taiwan, and Malaysia). Others, Sri Lanka and Nepal have established government competent authorities.
› A major event— The 17th IFOAM Organic World Congress —will be held in Korea in autumn 2011.
17

www.fibl.org
Asia: Development of organic agricultural land 2000-2009
47.9%48.1%
4.0%
Europe North America
Others
Source: FiBL /IFOAM Survey 2011The increase of organic agricultural land in 2004 is due to a major expansion in China, partly due to government support. Much of these areas were grazing areas which, however, ceased to be certified in 2005, hence the drop of the organic agricultural area in Asia in that year.

www.fibl.org
Asia: Distribution of organic agricultural land by country 2009; total: 3.6 million hectares
51%
33%
12%
4%
China
India
Kazakhstan
Others
FiBL/IFOAM Survey 2011, based on data from governments, the private organic sector and certifiers
www.fibl.org
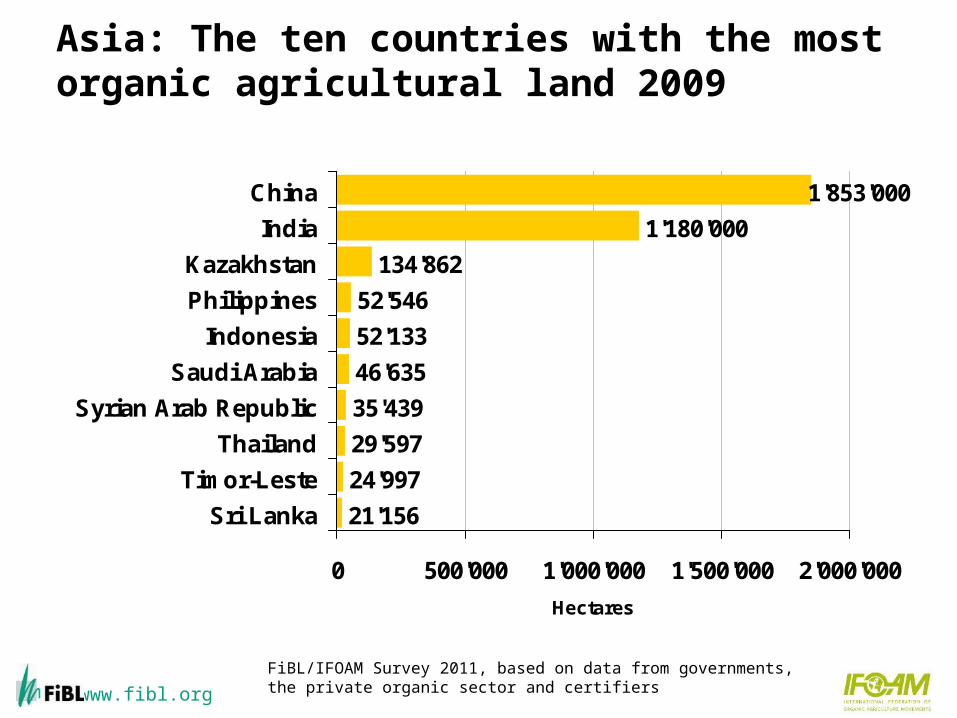
Asia: The ten countries with the most organic agricultural land 2009
21'156
24'997
29'597
35'439
46'635
52'133
52'546
134'862
1'180'000
1'853'000
0 500'000 1'000'000 1'500'000 2'000'000
Sri Lanka
Timor-Leste
Thailand
Syrian Arab Republic
Saudi Arabia
Indonesia
Philippines
Kazakhstan
India
China
Hectares
FiBL/IFOAM Survey 2011, based on data from governments, the private organic sector and certifiers

www.fibl.org
Asia: Distribution of shares of organic land 2009
94%
3%3% Countries with 5.0 to
9.9 % organic land
Countries with 1 to4.9 % organic land
Countries with lessthan 1 % organicland
Source: FiBL/IFOAM Survey 2011

www.fibl.org
Asia: The ten countries/territories with the highest shares of organic agricultural land 2009
0.3%
0.4%
0.4%
0.5%
0.5%
0.7%
0.7%
0.8%
1.4%
6.7%
0% 1% 2% 3% 4% 5% 6% 7% 8%
China
Taiwan
Azerbaijan
Philippines
Lebanon
India
Korea, Republic of
Sri Lanka
Israel
Timor-Leste
FiBL/IFOAM Survey 2011, based on data from governments, the private organic sector and certifiers

www.fibl.org
Asia: Use of organic agricultural land 2009(total: 3.6 million hectares)
Distritbution of main agricultural land use types 2009
6%5%
31%
17%
41%
Arable land Permanent cropsCropland, no details Permanent grasslandAgricultural land, no details
The main arable crops 2009
311
2128
3283
0 20 40 60 80 100
Field fodder cropsVegetables
Medicinal and arom plantsTextile crops
OilseedsCereals
Thousands of hectares
The main permanent crops 2009
14
28
28
31
60
0 20 40 60 80
Nuts
Fruit, tropical andsubtropical
Coconuts
Tea
Coffee
Thousands of hectares
Source: FiBL & IFOAM Survey 2011

www.fibl.org
Articles about Asia in the 2011 Edition of "The World of Organic Agriculture"
› Organic Asia 2010 Ong Kung Wai
› Organic Agriculture in Armenia Nune Darbinyan
› Organic Agriculture Development in China Yuhui Qiao
› Indonesia: Country Report › Lidya Ariesusanty › Kazakhstan: Country Report
Evgeniy Klimov › South Korea: Country Report
Dong-Geun Choi

www.fibl.org
Europe: Organic agricultural land by country 2009
Source: FiBL Survey 2011, revision of May 15, 2011

www.fibl.org
Organic agriculture in Europe: Key data/indicators 2009
› 9.2 million hectares of agricultural land are organic (including in conversion areas).
› This constitutes 1.9 percent of the agricultural land in Êurope.
› The organic agricultural land increased by one million hectares or twelve percent in 2009 .
› 260’000 producers were reported.
Source: FiBL Survey 2011, revision of May 15, 2011
www.fibl.org
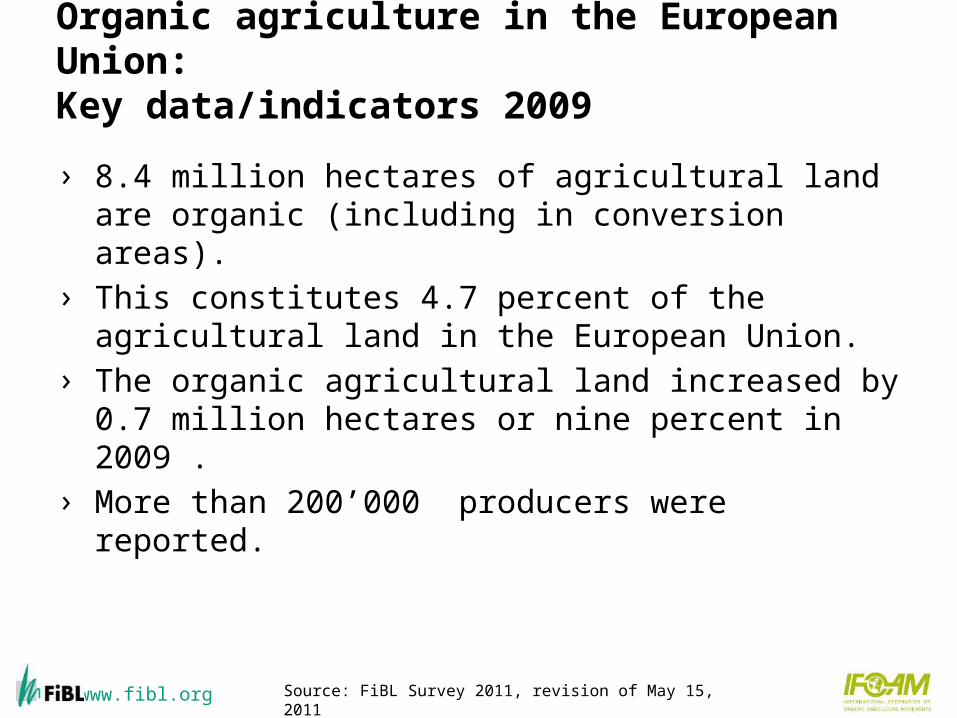
Organic agriculture in the European Union: Key data/indicators 2009
› 8.4 million hectares of agricultural land are organic (including in conversion areas).
› This constitutes 4.7 percent of the agricultural land in the European Union.
› The organic agricultural land increased by 0.7 million hectares or nine percent in 2009 .
› More than 200’000 producers were reported.
Source: FiBL Survey 2011, revision of May 15, 2011

www.fibl.org
Organic agriculture in Europe: Key data/indicators 2009
› The market was 18.4 billion euros, an increase of roughly five percent compared with 2009. The market grew at smaller rates than in previous years even though some countries like France and Sweden showed strong growth.
› The largest market for organic products in 2009 was Germany with a turnover of 5’800 million euros, followed by France (3'041 million euros) and the UK (2'065 million euros).
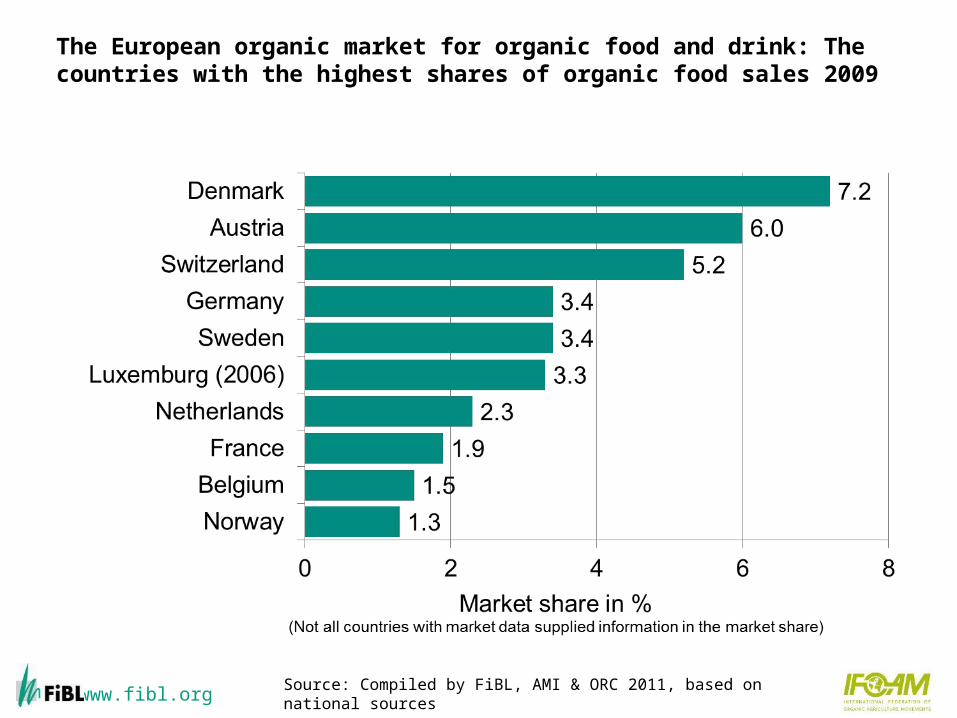
› As a portion of the total market share, the highest levels have been reached in Denmark, Austria and Switzerland, with five percent or more for organic products. The highest per capita spending is also in these countries.
› Support for organic farming in the European Union and neighboring countries includes grants under rural development programs, legal protection, and the European as well as national action plans. An updated overview of European action plans shows that currently 26 action plans (including regional action plans) are in place.
www.fibl.org
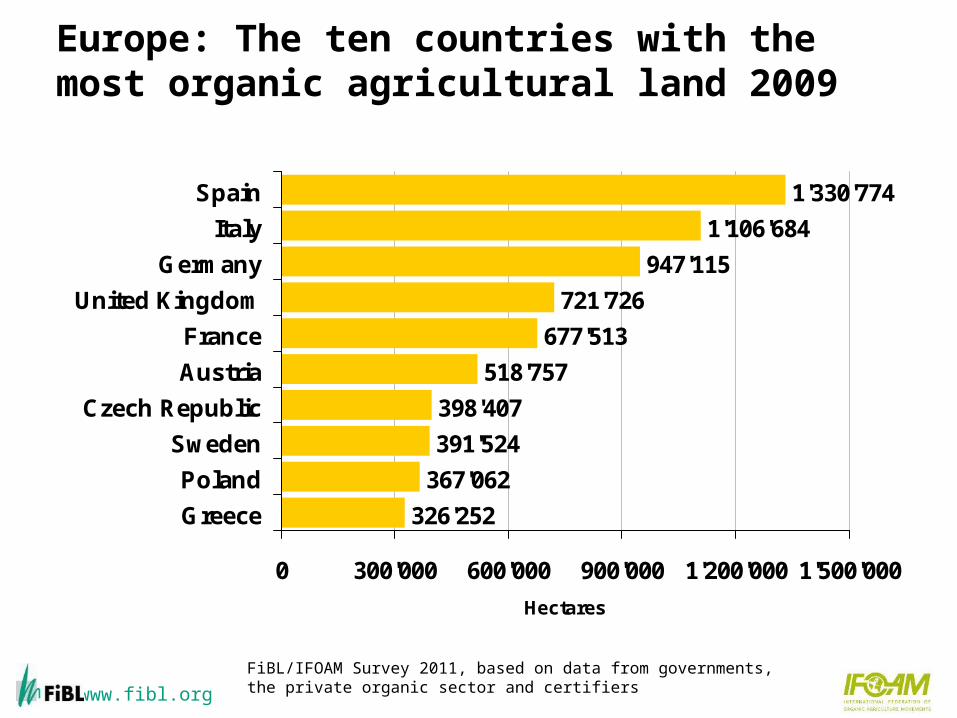
Europe: The ten countries with the most organic agricultural land 2009
326'252
367'062
391'524
398'407
518'757
677'513
721'726
947'115
1'106'684
1'330'774
0 300'000 600'000 900'000 1'200'000 1'500'000
Greece
Poland
Sweden
Czech Republic
Austria
France
United Kingdom
Germany
Italy
Spain
Hectares
FiBL/IFOAM Survey 2011, based on data from governments, the private organic sector and certifiers

www.fibl.org
Europe: Distribution of organically managed agricultural land by country 2009 (Total: 9.3 million hectares)
1'106'684ha; 12%
1'330'774ha; 14%
5'878'424 ha; 64%
947'115 ha; 10%
Spain
Italy
Germany
Rest
Source: Data based on information of Eurostat, ministries, certification bodies and the private sector. Compiled by FiBL 2011
www.fibl.org
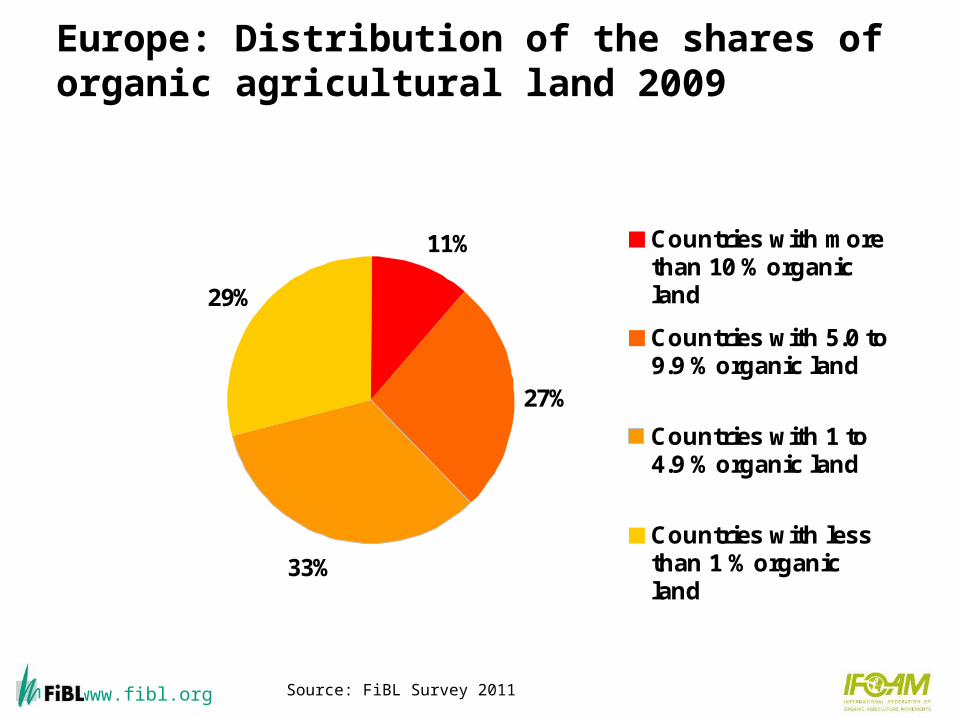
Europe: Distribution of the shares of organic agricultural land 2009
11%
27%
33%
29%
Countries with morethan 10 % organicland
Countries with 5.0 to9.9 % organic land
Countries with 1 to4.9 % organic land
Countries with lessthan 1 % organicland
Source: FiBL Survey 2011

www.fibl.org
Europe: The ten countries with the highest shares of organic agricultural land 2009
7.3%
7.5%
8.7%
9.0%
9.4%
10.5%
10.8%
12.6%
18.5%
26.9%
0% 5% 10% 15% 20% 25% 30%
Finland
Slovakia
Italy
Latvia
Czech Republic
Estonia
Switzerland
Sweden
Austria
Liechtenstein
Source: FiBL Survey 2011, based on national sources

www.fibl.org
Development of the organic agricultural land in Europe 1985-2009(Revision April 26, 2011)
0.10.10.10.20.20.30.50.60.8 11.4
1.82.3
2.9
3.7
4.5
5.45.86.16.4
6.87.3
7.88.3
9.2
0
1
2
3
4
5
6
7
8
9
10
La
nd a
rea
in m
illio
n he
cta
res
Source: FiBL, Aberystwyth University, AMI/ZMP
www.fibl.org
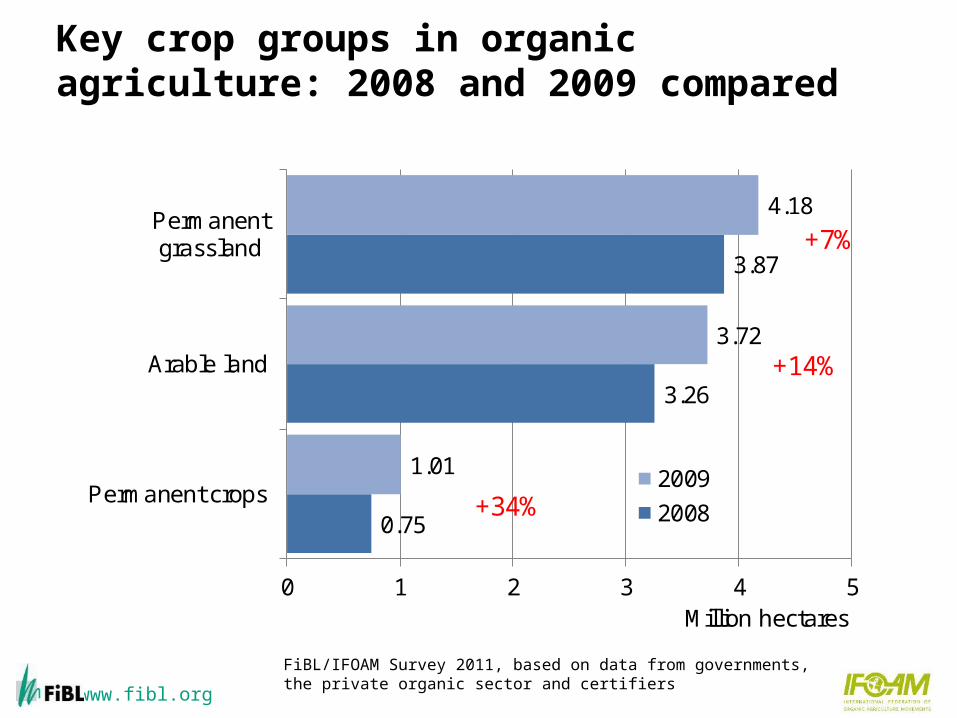
Key crop groups in organic agriculture: 2008 and 2009 compared
0.75
3.26
3.87
1.01
3.72
4.18
0 1 2 3 4 5
Permanent crops
Arable land
Permanentgrassland
Million hectares
2009
2008+34%
+14%
+7%
FiBL/IFOAM Survey 2011, based on data from governments, the private organic sector and certifiers

www.fibl.org
Europe: Use of organic agricultural land 2009 (total: 9.3 million hectares)
Distritbution of main agricultural land use types 2009
40%
11%
3%
46%
Arable land Permanent cropsPermanent grassland Other
The main arable crops 2009
103153162
1'3941'740
0 500 1'000 1'500 2'000
VegetablsOilseeds
Protein cropsField fodder crops
Cereals
Thousands of hectares
The main permanent crops 2009
4071
160167
366
0 100 200 300 400
Citrus fruitFruit, temperate
NutsGrapes
Olives
Thousands of hectares
Source: FiBL Survey 2011

www.fibl.org
Europe: Development of the European Market for Organic Food 2004-2009
10'79212'103
13'536
15'483
17'26018'400
0.0
5'000.0
10'000.0
15'000.0
20'000.0
2004 2005 2006 2007 2008 2009
Mill
ion
Eur
os
Source: FiBL, AMI & ORC 2006 -2011

www.fibl.org
The European organic market for organic food and drink: Growth rates for selected countries 2009
-12.9
0.0
+19.0
-15 -10 -5 0 5 10 15 20 25
UK
Germany
France
Market growth 2009 in %
Source: Soil Association, AMI and Agence Bio 2010
www.fibl.org
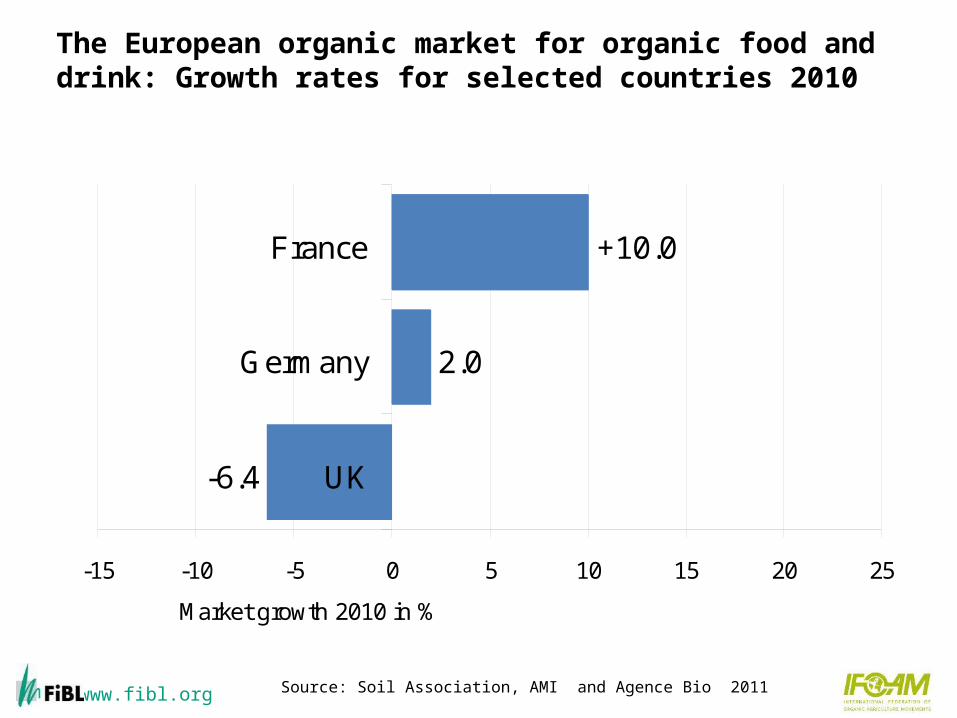
The European organic market for organic food and drink: Growth rates for selected countries 2010
-6.4
2.0
+10.0
-15 -10 -5 0 5 10 15 20 25
UK
Germany
France
Market growth 2010 in %
Source: Soil Association, AMI and Agence Bio 2011

www.fibl.org
Europe: Distribution of sales of organic food and drink by country 2009 (total: 18.4 billion Euros)
Source: FiBL, AMI, ORC Survey 2011, based on national sources

www.fibl.org
The European market for organic food and drink: The countries with the highest sales 2009
Source: Compiled by FiBL, AMI and ORC 2011, based on national sources
www.fibl.org
The European organic market for organic food and drink: The countries with the highest shares of organic food sales 2009
Source: Compiled by FiBL, AMI & ORC 2011, based on national sources

www.fibl.org
The European market for organic food: The countries with the highest per capita consumption 2009
Source: Compiled by FiBL, AMI and ORC 2011, based on national sources
www.fibl.org
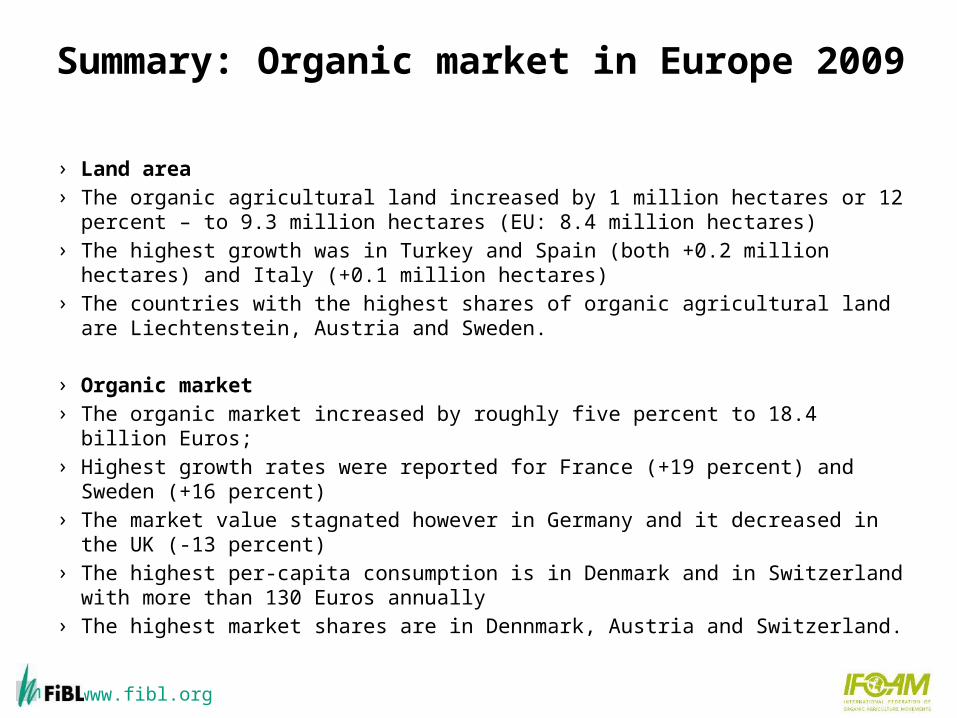
Summary: Organic market in Europe 2009
› Land area› The organic agricultural land increased by 1 million hectares or 12 percent – to 9.3
million hectares (EU: 8.4 million hectares)› The highest growth was in Turkey and Spain (both +0.2 million hectares) and Italy
(+0.1 million hectares)› The countries with the highest shares of organic agricultural land are
Liechtenstein, Austria and Sweden.
› Organic market› The organic market increased by roughly five percent to 18.4 billion Euros;› Highest growth rates were reported for France (+19 percent) and Sweden (+16
percent)› The market value stagnated however in Germany and it decreased in the UK (-13
percent) › The highest per-capita consumption is in Denmark and in Switzerland with more
than 130 Euros annually› The highest market shares are in Dennmark, Austria and Switzerland.
www.fibl.org
Articles about Europe in the 2011 Edition of "The World of Organic Agriculture"
› Organic Agriculture in Europe: Overview Helga Willer
› The Organic Market in Europe Diana Schaack, Helga Willer, and Susanne Padel
› Organic Action Plans in Europe in 2010 Victor Gonzálvez, Otto Schmid and Helga Willer
› Switzerland: Country Report Lukas Kilcher
› Ukraine Country Report Natalie Prokopchuk and Tobias Eisenring
www.fibl.org
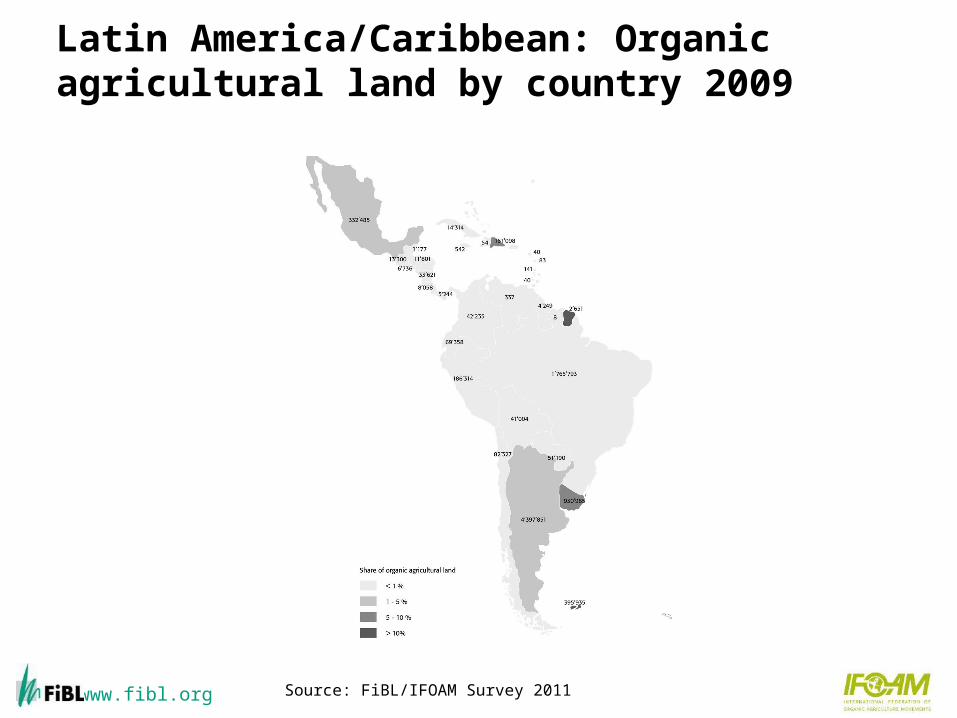
Latin America/Caribbean: Organic agricultural land by country 2009
Source: FiBL/IFOAM Survey 2011

www.fibl.org
Latin America: Key figures 2009
› In Latin America, more than 280’000 producers managed 8.6 million hectares of agricultural land organically in 2009.
› This constitutes 23 percent of the world’s organic land and 1.4 percent of the regions agricultural land.
› The leading countries are Argentina (4.4 million hectares), Brazil (1.8 million hectares), and Uruguay (930'965 hectares).
› The highest shares of organic agricultural land are in the Falkland Islands/Malvinas (35.7 percent), the Dominican Republic (8.3 percent), and Uruguay (6.3 percent).

www.fibl.org
Latin America: Key figures 2009
› Most organic products from Latin American countries are sold on the European, North American or Japanese markets. Popular goods are especially those that cannot be produced in these regions, as well as off-season products. Thus, the development of robust local markets is still a major challenge, without which the sustainability of organic production cannot be achieved. Important crops are tropical fruits, grains and cereals, coffee, cocoa, sugar, and meats. Most organic food sales in the domestic markets of the countries occur in major cities.
› Eighteen countries have legislation on organic farming, and five additional countries are currently developing organic regulations. Costa Rica and Argentina have both attained Third Country status according to the EU regulation on organic farming.
› The types of support in Latin American countries range from organic agriculture promotion programs to market access support by export agencies.
47

www.fibl.org
Latin America/Caribbean: Distribution of organically managed agricultural land by country 2009 (total: 8.6 million hectares)
51%
21%
17%
11%
Argentina
Brazil (2007)
Uruguay (2007)
Others
Source: FiBL Survey 2011

www.fibl.org
Latin America/Caribbean: The ten countries with the most organic agricultural land 2009
51'190
69'358
82'327
161'098
186'314
332'485
395'935
930'965
1'765'793
4'397'851
0 2'000'000 4'000'000 6'000'000
Paraguay (2007)
Ecuador
Chile
Dominican Republic
Peru
Mexico (2008)
Falkland Islands (Malvinas)
Uruguay (2006)
Brazil (2007)
Argentina
HectaresArgentina and Uruguay: Only fully converted area
Source: FiBL/IFOAM Survey 2011
www.fibl.org
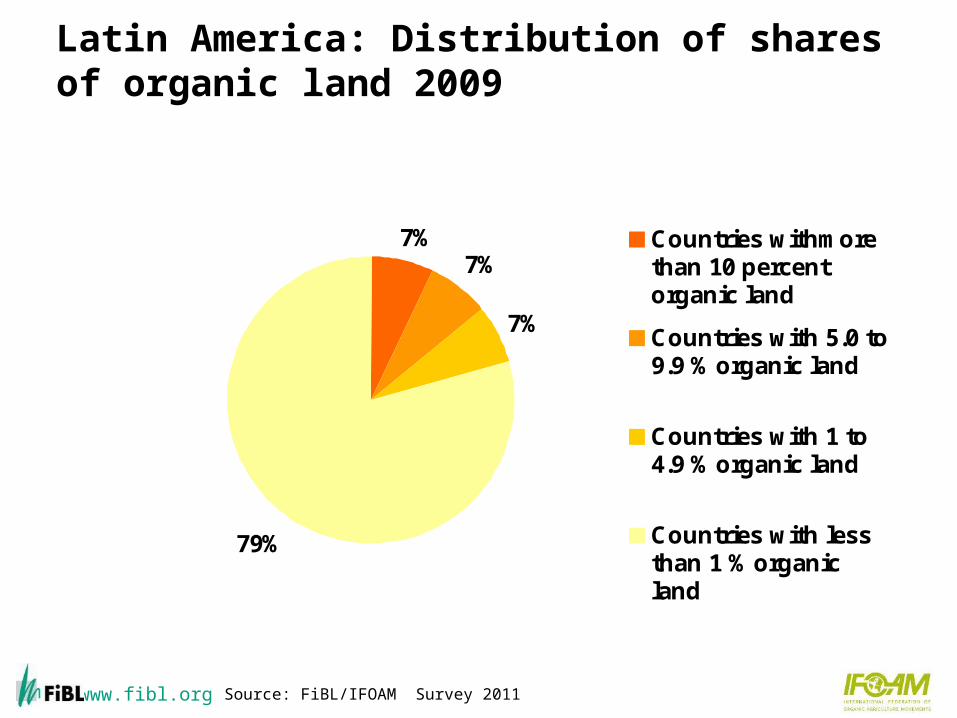
Latin America: Distribution of shares of organic land 2009
7%7%
7%
79%
Countries withmorethan 10 percentorganic land
Countries with 5.0 to9.9 % organic land
Countries with 1 to4.9 % organic land
Countries with lessthan 1 % organicland
Source: FiBL/IFOAM Survey 2011

www.fibl.org
Latin America: The ten countries with the highest shares of organic agricultural land 2009
0.7%
0.8%
0.9%
0.9%
2.4%
3.3%
6.3%
8.3%
11.7%
35.7%
0% 5% 10% 15% 20% 25% 30% 35% 40%
Brazil
Belize
Peru
Ecuador
Mexico
Argentina
Uruguay
Dominican Republic
French Guiana (France)
Falkland Islands (Malvinas)
FiBL/IFOAM Survey 2011, based on data from governments, the private organic sector and certifiers

www.fibl.org
Latin America: Development of organically managed agricultural land 2000-2009
1.2
4.8
5.8 6.0
5.2
5.1
5.0
6.4
8.1 8.
6
3.9
0
1
2
3
4
5
6
7
8
9
1999 2000 2001 2002 2003 2004 2005 2006 2007 2008 2009
Mil
lio
n h
ecta
res
Source: FiBL/IFOAM/SOEL Surveys 1999-2011

www.fibl.org
Latin America: Use of organic agricultural land 2009 (total: 8.6 million hectares)
Distritbution of main agricultural land use types 2009
2% 8%
0%
62%
28%
Arable land Permanent cropsCropland, no details Permanent grasslandAgricultural land, no details
The main arable crops 2009
2
6
25
39
51
0 20 40 60
Protein crops
Medicinal and arom. Plants
Cereals
Vegetables
Sugarcane
Thousands of hectares
The main permanent crops 2009
1214
98197
330
0 100 200 300 400
Citrus fruitCoconut
Fruit, tropicalCocoaCoffee
Thousands of hectares
Source: FiBL & IFOAM Survey 2011

www.fibl.org
Articles about Latin America and the Caribbean in the 2011 Edition of "The World of Organic Agriculture"
› Organic Farming in Latin America and the Caribbean Salvador V. Garibay, Roberto Ugas, and Patricia Flores Escudero
› Chile: Country Report Pilar Eguillor Recabarren
› Costa Rica: Country Report Roberto Azofeifa
› All in Willer/Kilcher (Eds.) 2011: The World of Organic Agriculture. Statistics and Emerging Trends 2011. IFOAM and FiBL, Bonn and Frick
54

www.fibl.org
North America: Organic agricultural land by country 2009
Source: USDA and COG 2011

www.fibl.org
Organic Agriculture in North America: Key figures 2009
› In North America, almost 2.7 million hectares are managed organically, of these nearly two million in the United States and 0.7 million in Canada.
› This represents approximately 0.7 percent of the total agricultural area in the region and 7 percent of the world’s organic agricultural land.
› US sales of organic products continued to grow during 2009 despite the distressed state of the economy. In fact, organic product sales in 2009 grew by 5.3 percent overall, to reach 26.6 billion US dollars.
› Of that figure, 24.8 billion US dollars represented organic food or 3.7 percent of the food market. The remaining 1.8 billion were sales of organic non-foods.
› Projections for 2010 and beyond indicate higher growth rates for organic sales in North America.

www.fibl.org
Organic Agriculture in North America: Key figures 2009
› In Canada, Agriculture and Agri-Food Canada in 2010 released a new report on the Canadian organic sector’s trade data and retail sales. Analyzing the 2008 sales of organic foods, the report concludes that the total Canadian organic market is worth 2 billion Canadian dollars annually.
› Regarding legislation, representatives from the Canada Organic Office and the US National Organic Program have completed a full peer review, in order to monitor and evaluate how the US-Canada organic equivalence arrangement is being applied.
www.fibl.org
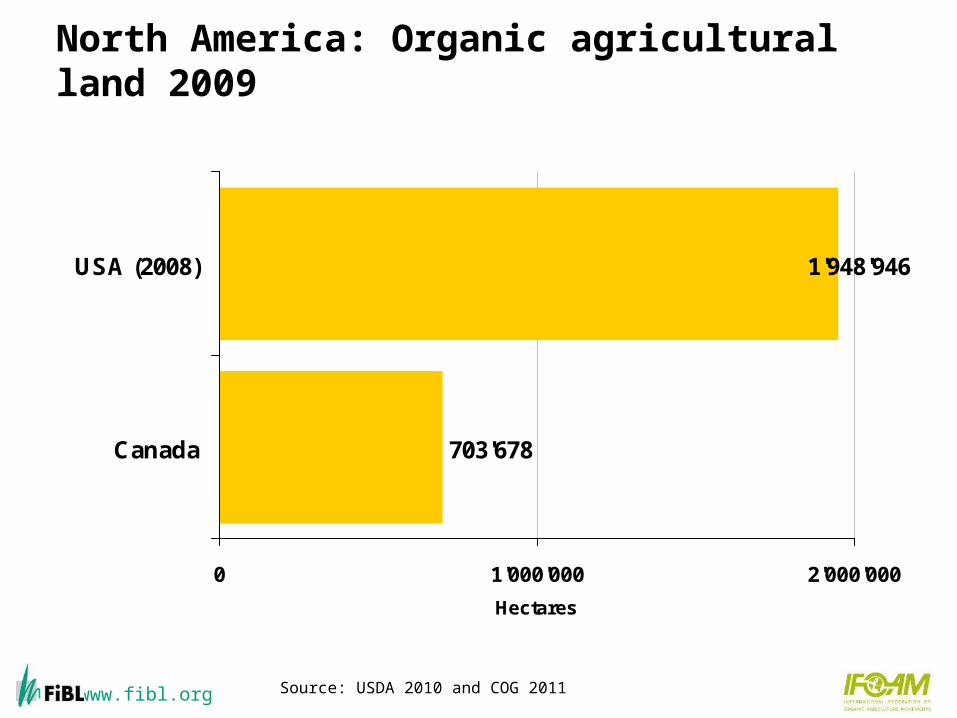
North America: Organic agricultural land 2009
703'678
1'948'946
0 1'000'000 2'000'000
Canada
USA (2008)
Hectares
Source: USDA 2010 and COG 2011

www.fibl.org
North America: Distribution of organic agricultural land by country 2009; total: 2.7 million hectares
73%
27%
USA Canada
Source: USDA 200 and Canadian Organic Growers 2011

www.fibl.org
North America: Shares of organic agricultural land 2009
0.6%
1.0%
0% 0% 0% 1% 1% 1% 1%
USA (2008)
Canada
Source: Canadian Organic Growers 2010 and USDA 2010

www.fibl.org
North America: Development of organically managed agricultural land 2000-2009
0.7
1.3
1.3 1.
4
1.7
2.2
1.8
2.3
2.6 2.7
1.1
0
1
1
2
2
3
3
1999 2000 2001 2002 2003 2004 2005 2006 2007 2008 2009
Mil
lio
n h
ecta
res
Source: USDA and Canadian Organic Growers 1999-2011
For the US, no data are available for 2009.

www.fibl.org
North America: Use of organic agricultural land 2009* (total: 2.65 million hectares)
Distritbution of main agricultural land use types 2009
50%
2%
4%
43%
1%
0%
Arable land Permanent cropsCropland, no details Permanent grasslandOther Agricultural land, no details
The main arable crops 2009
3965
169445
575
0 200 400 600 800
Protein cropsVegetables
OilseedsField fodder crops
Cereals
Thousands of hectares
The main permanent crops 2009
46
810
12
0 2 4 6 8 10 12 14
BerriesCitrus fruit
Fruit, temp.Nuts
Grapes
Thousands of hectares
Source: FiBL/IFOAM Survey 2011 *US data from 2008

www.fibl.org
US: Organic food sales 2000-2009
2000 2001 2002 2003 2004 2005 2006 2007 2008 20090
5,000
10,000
15,000
20,000
25,000
0%
1%
2%
3%
4%
6,1
00
7,3
60
8,6
35
10
,38
1
12
,00
2
14
,22
3
17
,22
1
20
,41
0
23
,60
7
24
,80
3
1.2%1.4%
1.6%
1.9%
2.2%
2.5%
2.9%
3.2%
3.6% 3.7%
Turnover in million US Dollars Share of total market (%)
Tu
rno
ver
Sh
are
of t
ota
l ma
rke
t
Source: OTAOrganic Trade Association’s 2010 Organic Industry Survey conducted 1/21/2010 – 3/3/2010. Available on http://www.ota.com/pics/documents/2010OrganicIndustrySurveySummary.pdf
www.fibl.org
Articles about North America in the 2011 Edition of "The World of Organic Agriculture"
› North American Overview Barbara Fitch Haumann
› United States: Country Report Barbara Fitch Haumann
› Canada: Country Report Matthew Holmes and Anne Macey
› All in Willer/Kilcher (Eds.) 2011: The World of Organic Agriculture. Statistics and Emerging Trends 2011. IFOAM and FiBL, Bonn and Frick

www.fibl.org
Oceania: Organic agricultural land by country 2009
FiBL/IFOAM Survey 2011
www.fibl.org
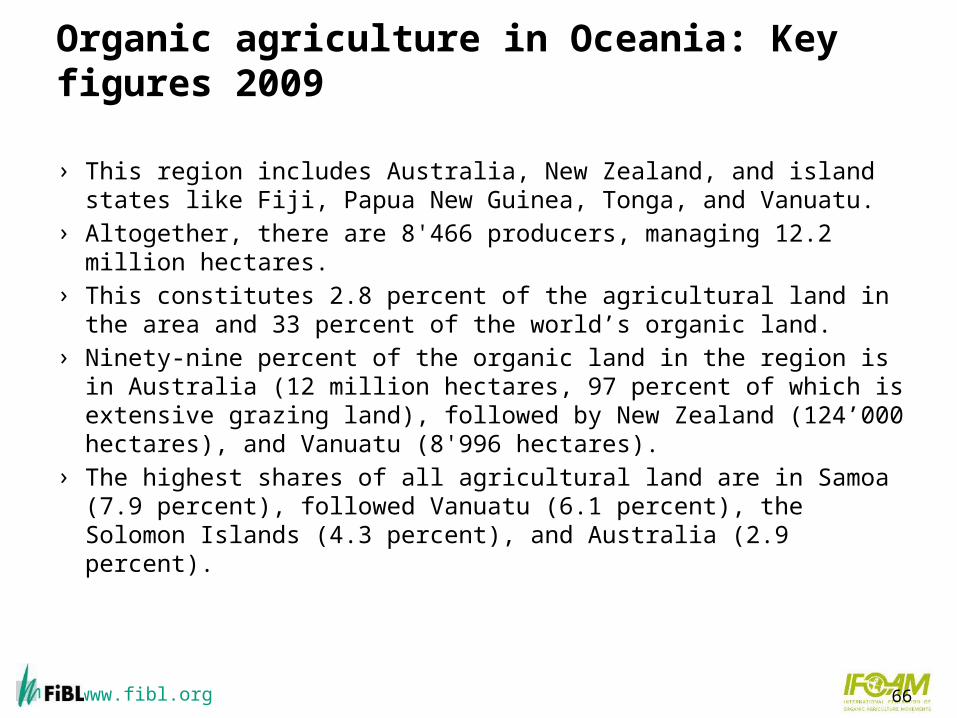
Organic agriculture in Oceania: Key figures 2009
› This region includes Australia, New Zealand, and island states like Fiji, Papua New Guinea, Tonga, and Vanuatu.
› Altogether, there are 8'466 producers, managing 12.2 million hectares.
› This constitutes 2.8 percent of the agricultural land in the area and 33 percent of the world’s organic land.
› Ninety-nine percent of the organic land in the region is in Australia (12 million hectares, 97 percent of which is extensive grazing land), followed by New Zealand (124’000 hectares), and Vanuatu (8'996 hectares).
› The highest shares of all agricultural land are in Samoa (7.9 percent), followed Vanuatu (6.1 percent), the Solomon Islands (4.3 percent), and Australia (2.9 percent).
66

www.fibl.org
Organic agriculture in Oceania: Key figures 2009
› Growth in the organic industry in Australia, New Zealand and the Pacific Islands has been strongly influenced by rapidly growing overseas demand; domestic markets are, however, also growing. In Australia it was at 947 Australian dollars in 2009 and in New Zealand at 350 million New Zealand dollars.
› The biggest change in the Australian domestic market over 2009 was that the Australian Standard for Organic and Biodynamic Products was adopted and published by Standards Australia.
› The year 2010 marked a milestone for the Pacific Region: The International Organic Accreditation Service (www.ioas.org) assessed the Pacific Organic Standard (POS) and found it to be equivalent to the standards requirements of the European Union’s organic regulations.

www.fibl.org
Oceania: Development of organic agricultural land 1999-2009
Source: USDA and Canadian Organic Growers 1999-2011
For the US, no data are available for 2009,

www.fibl.org
Oceania: Shares of organic agricultural land 2009
Source: FiBL/IFOAM Survey 2011, based on data from governments, the private organic sector and certifiers.

www.fibl.org
Oceania: Shares of organic land 2009
Source: FiBL/IFOAM Survey 2011
www.fibl.org
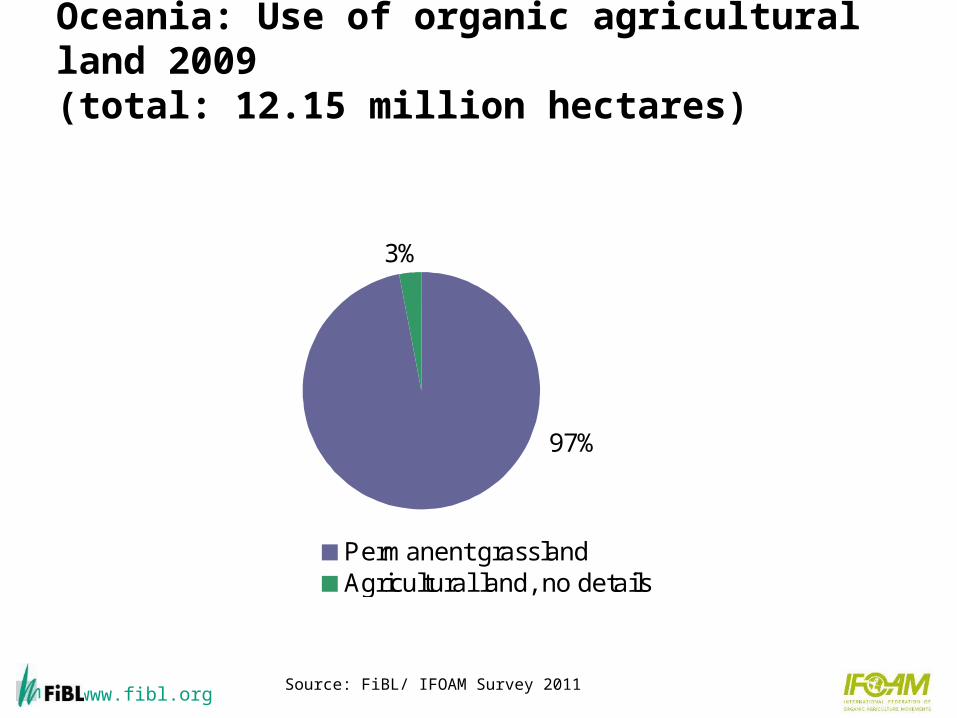
Oceania: Use of organic agricultural land 2009 (total: 12.15 million hectares)
3%
97%
Permanent grasslandAgricultural land, no details
Source: FiBL/ IFOAM Survey 2011
www.fibl.org
Articles about Oceania in the 2011 Edition of "The World of Organic Agriculture"
› Organic Farming in Australia Els Wynen, Alexandra Mitchell, and Paul Kristiansen
› The Pacific Islands Karen Mapusua
› All in Willer/Kilcher (Eds.) 2011: The World of Organic Agriculture. Statistics and Emerging Trends 2011. IFOAM and FiBL, Bonn and Frick
www.fibl.org
Abbreviations
› AMI: Agrarmarkt Informations-Gesellschaft mbH (AMI, information service for organic markets), www.ami-informiert.de
› COG: Canadian Organic Growers – www.cog.ca› FiBL: Research Institute of Organic Agriculture, Switzerland› IFOAM: International Federation of Organic Agriculture
Movements, Germany, www.ifoam.org› ORC: Organic Research Centre Elm Farm, UK, www.efrc.com› RUTA: Unidad Regional de Asistencia Técnica (RUTA;
Regional Unit for Technical Assistance), Costa Rica, www.ruta.org
› USDA: United States Department of Agriculture (USDA), www.usda.gov