Key Factors and Applications of Cavitation Peening HitosHi soyama 2. HOW TO PRODUCE CAVITATION 2.1....
58
3 Int. Journ. of Peening Science and Technology, Vol. 1, pp. 3–60 Reprints available directly from the publisher Photocopying permitted by license only. © 2017 OCP Materials Science and Engineering Published by license under the OCP Science imprint, Old City Publishing, Inc. Key Factors and Applications of Cavitation Peening HITOSHI SOYAMA* Department of Finemechanics, Tohoku University, 6-6-01 Aoba Aramaki Aoba-ku, Sendai 980-8579, Japan The impacts generated when cavitation bubbles collapse can be used for the mechanical treatment of surfaces in the same way as shot peening. A peening method that uses cavitation impacts is called “cavitation peen- ing”. In the present review, the principles of cavitation peening are explained in order to illustrate the difference between cavitation peening and water jet peening. The key factors in cavitation peening, such as the type of cavitating jet, the standoff distance, the nozzle geometry, the cav- itation number, the processing speed, the nozzle throat diameter, the injection pressure and the tank pressure are shown with experimental results. A semi-empirical equations to predict the peening intensity for a given nozzle and given operating conditions is proposed. The results of practical applications of cavitation peening, such as improving the fatigue strength of a material or suppressing hydrogen embrittlement, are also shown and compared with the results from shot peening. Keywords: cavitation peening; water jet peening; shot peening; fatigue strength; residual stress; cavitating jet; pulse laser 1. INTRODUCTION Cavitation can cause severe damage in hydraulic machinery, such as pumps, screw propellers and valves, since it produces severe impacts due to micro jets and/or shock waves generated when bubbles collapse [1]. Nevertheless, this phenomenon can be utilized for the mechanical treat- *Corresponding author's e-mail: [email protected]
Transcript of Key Factors and Applications of Cavitation Peening HitosHi soyama 2. HOW TO PRODUCE CAVITATION 2.1....

3
Int. Journ. of Peening Science and Technology, Vol. 1, pp. 3–60Reprints available directly from the publisherPhotocopying permitted by license only.
© 2017 OCP Materials Science and EngineeringPublished by license under the OCP Science imprint,
Old City Publishing, Inc.
Key Factors and Applications of Cavitation Peening
HitosHi soyama*
Department of Finemechanics, Tohoku University, 6-6-01 Aoba Aramaki Aoba-ku, Sendai 980-8579, Japan
The impacts generated when cavitation bubbles collapse can be used for the mechanical treatment of surfaces in the same way as shot peening. A peening method that uses cavitation impacts is called “cavitation peen-ing”. In the present review, the principles of cavitation peening are explained in order to illustrate the difference between cavitation peening and water jet peening. The key factors in cavitation peening, such as the type of cavitating jet, the standoff distance, the nozzle geometry, the cav-itation number, the processing speed, the nozzle throat diameter, the injection pressure and the tank pressure are shown with experimental results. A semi-empirical equations to predict the peening intensity for a given nozzle and given operating conditions is proposed. The results of practical applications of cavitation peening, such as improving the fatigue strength of a material or suppressing hydrogen embrittlement, are also shown and compared with the results from shot peening.
Keywords: cavitation peening; water jet peening; shot peening; fatigue strength; residual stress; cavitating jet; pulse laser
1. INTRODUCTION
Cavitation can cause severe damage in hydraulic machinery, such as pumps, screw propellers and valves, since it produces severe impacts due to micro jets and/or shock waves generated when bubbles collapse [1]. Nevertheless, this phenomenon can be utilized for the mechanical treat-
*Corresponding author's e-mail: [email protected]

4 HitosHi soyama
ment of surfaces in the same way as shot peening. A peening method that uses cavitation impacts is called “cavitation peening” [2-4] or “cavitation shotless peening” [5], as the shot normally used in shot peening is not required. In the case of cavitation peening, the treated surface is smooth compared with that after conventional shot peening, as there are no colli-sions between solid objects. Also, since shot is not used, there is neither contamination nor any transfer of material. Although a submerged high-speed water jet is used to produce cavitation, cavitation peening is differ-ent from “water jet peening” [6-8], in which the peening is done by the impacts of small water masses. In order to get better peening effects using cavitation peening, understanding the mechanisms of cavitation peening and the differences between cavitation peening and water jet peening is very important.
Changes in the residual stress by cavitation impact within a limited region of a cavitation tunnel has been reported [9], as have changes in the stress on the surfaces of metallic powders by ultrasonic cavitation [10]. On the other hand, in order to mitigate stress corrosion cracking in pres-sure vessels filled with water in nuclear power plants, methods to intro-duce compressive residual stress into submerged stainless steel were investigated in the late 1980’s and the 1990’s. Methods using pulsed laser without a coating [11] and impacts from small water masses in a sub-merged water jet, i.e., “water jet peening” [12] were proposed for this. Soyama et al. [13] and then Hirano et al. [14] proposed the practical use of a submerged water jet with cavitation, i.e., a cavitating jet, to introduce compressive residual stress into materials [15]. The technique using a cavitating jet has been applied to nuclear power plants to mitigate stress corrosion cracking in pressure vessels [16]. Soyama et al. succeeded in improving the fatigue strength of hard metallic materials such as silicon manganese steel [17] and carbonized chrome-molybdenum steel alloy [18] by enhancing the aggressive intensity of cavitation peening using a pressurized chamber [19]. By optimizing the nozzle geometry for a cavi-tating jet [20, 21], the aggressive intensity of a jet without a pressurized chamber could be enhanced by a factor of 80 compared to cavitating jets developed in the 1990’s. In order to summarize and discuss cavitation peening, “The 1st International Workshop on Cavitation Peening and Related Phenomena” was held in Sendai, October 27-29, 2015. This was organized by the Society of Surface Mechanics Design, and 38 papers were presented in the workshop.
In the case of conventional cavitation peening, a high speed water jet is injected into a water filled chamber. In this case, the target to be treated is put into a water filled chamber, and large items, which cannot be placed in the chamber, cannot be treated. In order to introduce compressive residual stress into the outer surfaces of tanks, pipes and other large com-ponents without using a water filled chamber, a cavitating jet in air was

Key Factors and applications oF cavitation peening 5
realized by injecting a high speed water jet into a low speed water jet using a concentric nozzle [22-24]. An optimized cavitating jet in air can introduce a larger compressive residual stress into the subsurface com-pared with a cavitating jet in water [25]. Further research on cavitating jets in air has been followed by a research group at the Georgia Institute of Technology and Boeing [26].
Although it is believed that the shock wave induced by laser abrasion has been used for submerged laser peening [27], the impact generated by collaps-ing bubbles developed after laser abrasion, and which behave in the same way as cavitation bubbles, was larger than that due to the laser abrasion [28]. In this review, the formation of bubbles due to laser abrasion is called laser cavitation. When the impact induced by laser cavitation is used for peening, the surface can be peened twice, i.e., by laser abrasion and laser cavitation, by a single laser pulse. Thus, understanding the mechanisms and the key factors of cavitation peening is beneficial in that this can help us improve the peening efficiency of submerged laser peening.
The cavitation peening mechanism is entirely different to the mecha-nism for water jet peening, and when these peening methods are con-fused, not only the peening effect is insufficient, but also the peened surface can be damaged [29]. As mentioned above, the impacts due to cavitation bubbles collapsing is important for cavitation peening. The cavitation impact at constant ambient pressure does not increase as the injection pressure of the cavitating jet is increased, and the peening inten-sity at injection pressures that are too high decreases with increasing injection pressure; thus, there is an optimum injection pressure for intro-ducing compressive residual stress [30]. On the other hand, in the case of water jet peening, the peening intensity increases with increasing injec-tion pressure, as the impact from the small water masses and/or shot in the water jet increases with this.
Although cavitation impacts are useful for the mechanical treatment of surfaces, as mentioned above, it should be borne in mind that cavitation ero-sion is still a major problem in hydraulic machinery and other systems in frontier science and technology, such as, for example, neutron sources that use mercury targets [31]. Tests on materials using a cavitating jet have been done in order to evaluate the resistance of materials to cavitation erosion [32]. Knowledge of the key factors in cavitation peening, such as the cavitation number and the scale effect, is important to enable the application of this technology and to estimate and/or reduce cavitation erosion.
In order to enable us to obtain better peening effects using cavitation peen-ing without damage to the surface the key factors of cavitation peening are reviewed with experimental results in this paper. The effects of mechanical surface modification such as improvement in the fatigue characteristics and the suppression of hydrogen embrittlement by cavitation peening are demon-strated experimentally.

6 HitosHi soyama
2. HOW TO PRODUCE CAVITATION
2.1. Cavitation Cavitation is a hydrodynamic phenomenon from the liquid phase to the gas phase produced by increasing the flow velocity to reduce the pressure. Ber-noulli’s equation is
1
22ρLv p const+ = . (1)
where, v, ρL and p are the flow velocity, density of the liquid and pressure. When the velocity of the liquid increases such that p = pv, where pv is the vapor pressure of the liquid, the liquid becomes vapor, i.e., the gas phase. Note that vaporous cavitation starts at p < pv, and gaseous cavitation is initi-ated at p > pv, because of the cavitation nuclei, which is explained later in this paper. Figure 1 (a) shows a schematic diagram illustrating the development and collapse of cavitation. First, a cavitation bubble is generated from a tiny bubble, which is dissolved in the liquid, the same as in nucleate boiling. These small bubbles are called cavitation nuclei. When the velocity decreases, the vapor goes back into liquid form. At this stage, the vapor bubble shrinks and collapses, and then rebounds. If it shrinks near to a solid surface, the
FIGURE 1Schematic diagram of the development of the and collape of cavitation
Key Factors and applications oF cavitation peening 7
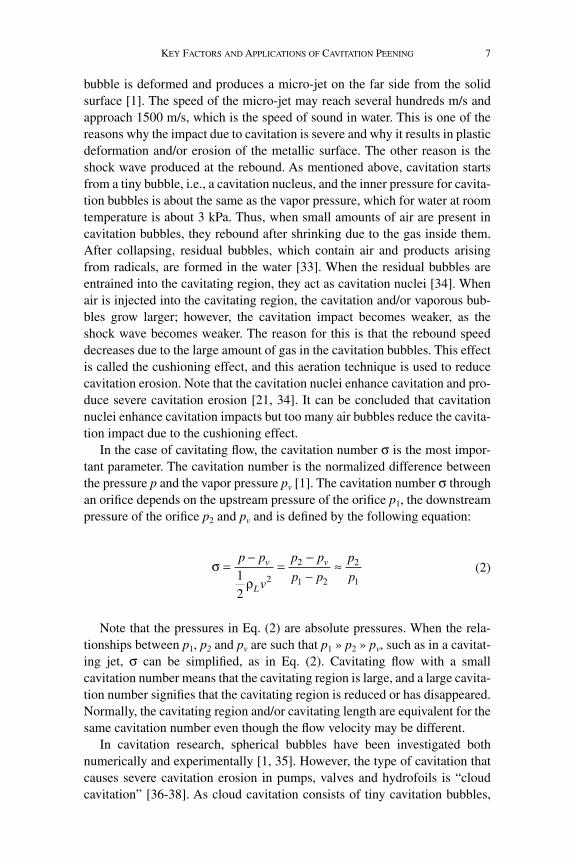
bubble is deformed and produces a micro-jet on the far side from the solid surface [1]. The speed of the micro-jet may reach several hundreds m/s and approach 1500 m/s, which is the speed of sound in water. This is one of the reasons why the impact due to cavitation is severe and why it results in plastic deformation and/or erosion of the metallic surface. The other reason is the shock wave produced at the rebound. As mentioned above, cavitation starts from a tiny bubble, i.e., a cavitation nucleus, and the inner pressure for cavita-tion bubbles is about the same as the vapor pressure, which for water at room temperature is about 3 kPa. Thus, when small amounts of air are present in cavitation bubbles, they rebound after shrinking due to the gas inside them. After collapsing, residual bubbles, which contain air and products arising from radicals, are formed in the water [33]. When the residual bubbles are entrained into the cavitating region, they act as cavitation nuclei [34]. When air is injected into the cavitating region, the cavitation and/or vaporous bub-bles grow larger; however, the cavitation impact becomes weaker, as the shock wave becomes weaker. The reason for this is that the rebound speed decreases due to the large amount of gas in the cavitation bubbles. This effect is called the cushioning effect, and this aeration technique is used to reduce cavitation erosion. Note that the cavitation nuclei enhance cavitation and pro-duce severe cavitation erosion [21, 34]. It can be concluded that cavitation nuclei enhance cavitation impacts but too many air bubbles reduce the cavita-tion impact due to the cushioning effect.
In the case of cavitating flow, the cavitation number σ is the most impor-tant parameter. The cavitation number is the normalized difference between the pressure p and the vapor pressure pv [1]. The cavitation number σ through an orifice depends on the upstream pressure of the orifice p1, the downstream pressure of the orifice p2 and pv and is defined by the following equation:
σρ
=−
=−−
≈p p
v
p p
p p
p
pv
L
v
12
2
2
1 2
2
1 (2)
Note that the pressures in Eq. (2) are absolute pressures. When the rela-tionships between p1, p2 and pv are such that p1 » p2 » pv, such as in a cavitat-ing jet, σ can be simplified, as in Eq. (2). Cavitating flow with a small cavitation number means that the cavitating region is large, and a large cavita-tion number signifies that the cavitating region is reduced or has disappeared. Normally, the cavitating region and/or cavitating length are equivalent for the same cavitation number even though the flow velocity may be different.
In cavitation research, spherical bubbles have been investigated both numerically and experimentally [1, 35]. However, the type of cavitation that causes severe cavitation erosion in pumps, valves and hydrofoils is “cloud cavitation” [36-38]. As cloud cavitation consists of tiny cavitation bubbles,

8 HitosHi soyama
and takes place in the vortex core of the cavitating flow, it is sometimes called “vortex cavitation” [36, 39-43]. A key parameter of vortex flow is the Reyn-olds number, which is a function of the velocity, size and kinematic viscosity coefficient; thus, the size is as important a parameter as the velocity. As is well known, the cavitation erosion rate drastically increases with the size of hydraulic machinery and hydrofoils, a phenomenon known as the scaling effect of cavitation erosion. The following power law for the rate of erosion, ER, with respect to the size of hydraulic machinery, L, has been proposed, as well as its relationship with the velocity v in the machinery [44, 45]:
E LRn∝ (3)
E vRn∝ (4)
With this scaling effect, cloud cavitation, i.e., a cavitating vortex, is more remarkable [41, 46]. It has been reported that micro-jets have also been observed in a cavitating vortex [47]. Since cloud cavitation causes severe ero-sion in centrifugal pumps [39], numerical simulations of this have been done and the possibility of enhancing the aggressive intensity at cloud cavitation collapse has been shown [1]. The results of studies of this phenomenon sug-gest that micro-jets and a shock wave at rebound are the reasons why cloud cavitation causes severe cavitation erosion. Figure 1 shows a schematic dia-gram illustrating the development and collapse of cavitation for both spheri-cal type cavitation and cloud type cavitation. A typical longitudinal cavitation cloud arising downstream from a butterfly valve is shown in Fig. 2 [37]. Lon-gitudinal cavitation clouds cause severe erosion.
2.2. Methods for Generating Cavitation For cavitation peening, aggressive cavitation such as longitudinal cloud cavi-tation as shown in Fig. 2 is required for practical applications. One of the powerful methods used to generate such cavitation clouds is a submerged high speed water jet with cavitation, i.e., a cavitating jet [48, 49]. Figures 3 and 4 show typical images of a cavitating jet impinging on a surface and a schematic diagram of a cavitating jet. In Fig. 3, the jet flows from left to right and the white bubbles are due to cavitation. When a high-speed water jet is injected into water through a nozzle, vortex cavitation takes place in the shear layer around the jet. The instances of vortex cavitation combine to form a large cavitation cloud, and when this hits the target, a ring vortex cavitation is formed, part of which collapses resulting in longitudinal cloud cavitation. Even with a cavitating jet, there is a potential core near the nozzle exit, and powerful impacts are produced by small water masses downstream from the

Key Factors and applications oF cavitation peening 9
potential core. As mentioned later, the impacts from these small water masses produce water jet peening effects.
The typical area peened by a cavitating jet is shown in Fig. 5, which shows a pure soft aluminum specimen after exposure for 1 minute to a cavitating jet with a nozzle throat diameter d = 2 mm at p1 = 30 MPa , p2 ≈ 0.1 MPa, σ ≈ 0.0033 and standoff distance s = 262 mm. Plastic deformation pits can clearly be observed within an annulus of 60 mm outer diameter and 20 mm inner diameter. Thus, the cavitating jet can treat a region 30 times larger than the diameter of the throat of the nozzle in this case. As mentioned above, cavita-
FIGURE 2 Typical image of vortex cavitation
FIGURE 3Typical image of a cavitating jet impinging on a surface

10 HitosHi soyama
tion impacts are produced by bubbles collapsing in longitudinal clouds included in the ring vortex cavitation. The plastic deformation pits occur less at the jet center, but are generated at the places where the cavitation bubbles collapse. As shown in Fig. 5, the soft aluminum specimen has been slightly damaged at the jet center due to the impingement of small water masses in the jet core. In the ring region, the sizes of the plastic deformation pits are several
FIGURE 4 Schematic diagram of a cavitating jet
FIGURE 5 Typical area peened by a cavitating jet (pure aluminium, d = 2 mm, p1 = 30 MPa , p2 = 0.1 MPa, s = 262 mm, t = 1 min)

Key Factors and applications oF cavitation peening 11
hundred micrometers in diameter and some pits are 1 or 2 mm in diameter. In order to carry out a uniform treatment of the surface with a cavitating jet, the nozzle or the target should be scanned. The optimum scanning pitch for uni-form treatment can be obtained experimentally, by considering the distribu-tion of the cavitation impacts induced by the jet [50].
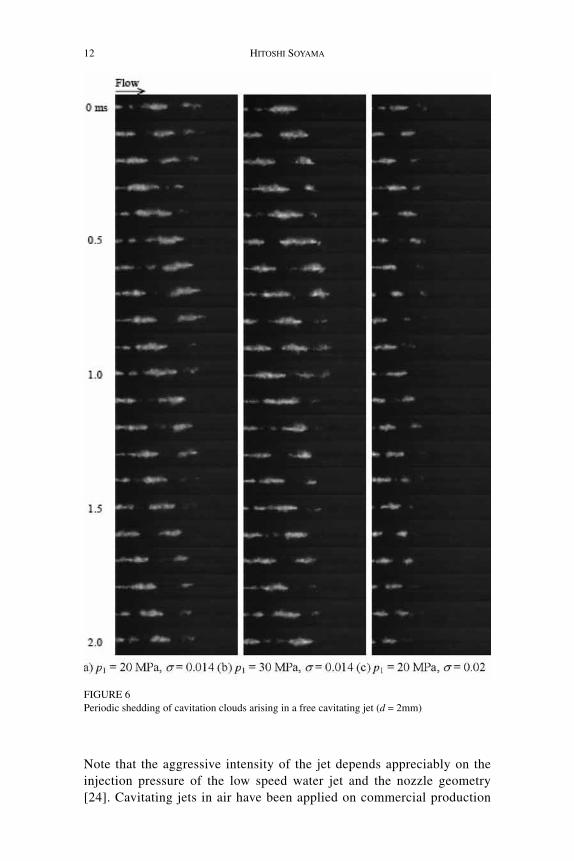
A cavitation cloud, such as shown in Fig. 3, sheds periodically [49, 51, 52], as shown in Fig. 6. Figure 6 shows periodic shedding in a cavitating jet observed by a high-speed video camera. With p1 = 20 MPa and σ = 0.014, the cavitation cloud is shed at 0.5, 0.9, 1.4 and 1.9 ms, thus the shedding fre-quency f is about 2.0 kHz. At p1 = 30 MPa and σ = 0.014, the frequency is 2.4 kHz, and is 3.2 kHz with p1 = 20 MPa and σ = 0.02. As the frequency changes with constant injection pressure but different cavitation number, the fre-quency is independent of pressure fluctuations induced by the plunger pump. Note that the shedding frequency increases with increasing injection pressure and cavitation number. This example also demonstrates that the diameter of the cavitating jet, as well as the cavitating length decreases with increasing cavitation number. The Strouhal number, St, which is defined by the shedding frequency, f, the maximum diameter of the cavitating jet, w, and the velocity at the nozzle exit, U, is nearly constant at 0.18 [52].
Sf w
Ut = =0 18. (5)
When two opposing jets pressurized by two different plunger pumps are injected into the same chamber, the shedding frequency was synchronized [53]. This suggests that the pressure wave produced by the cavitation cloud collapsing propagates upstream and breaks other cavitation clouds. From the point of view of cavitation peening, the shedding frequency is closely related to the aggressive intensity of the cavitating jet [21].
As mentioned above, for conventional cavitation peening, cavitation bubbles are generated by injecting a high speed water jet into water. In the present review, this sort of conventional cavitating jet is called “a cavitat-ing jet in water”. For these applications, the target is placed in the water filled chamber. However, the external surfaces of tanks and pipes are very difficult to treat using this apparatus. To address this, Soyama realized “a cavitating jet in air”, by injecting a high speed water jet into a low speed water jet which was injected directly into the air using a concentric nozzle [22, 23]. A typical cavitating jet in air is shown in Fig. 7. In Fig. 7, both the high and low speed water jets flow vertically down. The periodic wave pattern of the low speed water jet can be seen in Fig. 7, and this is pro-duced by periodic shedding of the cavitation cloud induced by the high speed water jet. That is, the frequency of the wave pattern of the low speed water jet is equal to the cloud shedding frequency of the jet [23].
12 HitosHi soyama
FIGURE 6 Periodic shedding of cavitation clouds arising in a free cavitating jet (d = 2mm)
Note that the aggressive intensity of the jet depends appreciably on the injection pressure of the low speed water jet and the nozzle geometry [24]. Cavitating jets in air have been applied on commercial production

Key Factors and applications oF cavitation peening 13
lines, for example, on a hot dip continuous galvanizing line to remove solid substances sticking to rolls [54].
For cavitating jets in water and air, the cavitation generally produced is “hydrodynamic cavitation”. On the other hand, cavitation can also be pro-duced by ultrasonic vibrations, in which case it is called “ultrasonic cavita-tion”. As mentioned in the introduction, changes in the residual stress in metallic powders by ultrasonic cavitation have been reported [10]. Moreover, the introduction of residual stress into metallic materials by ultrasonic cavita-tion has also been demonstrated [55]. To produce ultrasonic cavitation for the mechanical treatment of a surface, a vibratory horn, which has been used for cavitation erosion tests on materials [56], is normally used. Note that a cavi-tating jet for materials testing has also been standardized by ASTM Interna-tional as mentioned in the introduction [32]. Although optimization of the conditions for ultrasonic cavitation, such as the tip geometry, has been inves-tigated [57], the applications are limited, as the aggressive intensity of ultra-sonic cavitation changes significantly with the distance from the tip to the treated surface [58].
In the case of laser peening, it is believed that the shock waves induced by laser abrasion in water are concentrated in the material by the inertia of the water [27]. However, in the case of submerged laser peening, bubbles that are
FIGURE 7Image of a cavitating jet in air (d = 1 mm, p1 = 30MPa)

14 HitosHi soyama
produced and that develop after laser abrasion, collapse [28], as shown in Fig. 8 [59]. In this review, the development of bubbles after laser abrasion is called “laser cavitation”, as the shock wave is produced by the bubbles collapsing. For the data in Fig. 8, in order to detect the impacts induced by a laser pulse, a homemade sensor with a PVDF film used as a force sensitive material [60,
FIGURE 8 Laser abrasion and laser cavitation

Key Factors and applications oF cavitation peening 15
61] was placed on a metallic target material, and a hydrophone and a sub-merged shock wave sensor were placed in the water filled chamber. As shown in Fig. 8, when the laser pulse hits the target at t = 0 ms, laser cavitation is initiated, develops, and then collapses at t = 1 ms. After the laser cavitation has collapsed, it rebounds and collapses again at t = 1.6 ms. The impact at laser abrasion, and the 1st and 2nd collapses of the laser cavitation were detected by the PVDF sensor. The amplitude of the signal for the 1st collapse is about 1.5 times larger than that for the laser abrasion. In the case of the hydrophone, the signal amplitudes from laser abrasion and laser cavitation are similar [62]. On the other hand, when the pressure wave in the water was measured by the submerged shock wave sensor, the signal amplitude for laser abrasion was larger than that for laser cavitation [27]. Although the amplitude of the signal from the sensor depends on the type of sensor, the PVDF sensor measures the impact in the target material, and it detects not only the 1st col-lapse but also the 2nd collapse of the laser cavitation bubbles. When the impact signal was measured using an AE sensor, the ratio between the signal amplitudes for laser abrasion and for laser cavitation were found to depend on the depth of the water [63]. That is, the impact induced by laser cavitation is considered to provide a better peeing effect in submerged laser peening.
Figure 9 illustrates the relationship between the time for the laser cavita-tion to develop, tD, and the peening intensity in submerged laser peening. It has been shown that the peening intensity is related to the inverse of the radius of curvature, 1/ρ, of a 5mm duralumin plate peened with 4 pulses/mm2. In Fig. 9, in order to change the aggressive intensity of laser cavitation, the laser energy or standoff distance between the final convex lens and the target was changed. When a power law is assumed for the relationship between 1/ρ and tD, the exponent is about 3. In the case of submerged laser peening, tD is proportional to the maximum diameter of laser cavitation. Thus, it can be concluded that the peening intensity in submerged laser peen-ing is proportional to the maximum volume of the bubbles, VB max, as given by the following equation:
1
ρ∝VBmax (6)
3. CAVITATION PEENING AND WATER JET PEENING
3.1. Differences between Cavitation Peening and Water Jet Peening As a submerged high-speed water jet is commonly used to generate cavitation for cavitation peening, as mentioned above, cavitation peening and water jet peening are sometimes confused. Both the Surface Enhancement Committee SEC and the Aerospace Surface Enhancement Committee ASEC of SAE

16 HitosHi soyama
International, in which peening methods are standardized, define the impacts generated by cavitation bubbles collapsing as “cavitation peening”. On the other hand, peening methods using the impacts of small water masses in a water jet and/or shot that are injected into the water jet [64, 65] are called “water jet peening”. When a submerged high-speed water jet is used, both cavitation peening and water jet peening can occur. In order to obtain better peening effects without damage, the mechanisms for cavitation peening and water jet peening need to be better understood and, moreover, classified.
In order to show how the aggressive intensity of a submerged high speed water jet varies with standoff distance, Fig. 10 shows the mass loss as a func-tion of standoff distance at constant injection pressure for various cavitation numbers [66]. It is assumed that greater mass loss corresponds to higher aggressive intensity. For all three cases, two peaks were obtained. The peak close to the nozzle is called the “1st peak” and the one further from the nozzle is called the “2nd peak” [67]. The 1st peak is due to small water mass impacts, and is suitable for water jet peening and/or cutting. On the other hand, the 2nd peak is a result of cavitation impacts, and is suitable for cavitation peening. As shown in Fig. 10, the standoff distance of the 2nd peak, i.e., the optimum standoff distance, sopt, increases as the cavitation number, σ, decreases, and is described by Eq. (7). A relationship between cavitation number σ and opti-
FIGURE 9 Relationship between the size of the bubbles and the peening intensity

Key Factors and applications oF cavitation peening 17
mum standoff distance sopt was found by Lichtarowicz [68], then a means of comparing cavitating jets was proposed using the following equation [69].
s
dopt n∝ −σ (7)
where d is the diameter of the nozzle throat. Figure 11 shows the peeing intensity changing with standoff distance s with p1 = 30 MPa (σ = 0.0033) and d = 2 mm, and with p1 = 300 MPa (σ = 0.00033) and d = 0.4 mm, at a constant downstream pressure p1 ≈ 0.1 MPa [70]. The jet power, which depends on the injection pressure and the flow rate, were nearly equal in these two cases. In Fig. 11, specimens made of spring steel were peened and the inverse of the radius of curvature 1/ρ was measured to find the peening inten-sity. The standoff distance is normalized by d as s/d in Fig. 11. As shown in Fig. 11, the 2nd peak with p1 = 30 MPa is the largest. Although 1/ρ with p1 = 300 MPa has a peak at s/d ≈ 140, which is similar to that of the 2nd peak with p1 = 30 MPa, this is due to impacts from small water masses, i.e., due to water jet peening. With p1 = 300 MPa, there is a 2nd peak arising from cavitation impacts at s/d ≈ 280. The peeing intensity of this is very small compared with that of cavitation peening with p1 = 30 MPa. Note that, not only is the peening effect of a submerged water jet with the injection pressure too high insuffi-cient, but that it also damages the treated surface [29].
Figure 12, which is taken from reference [69], shows the normalized pressure at the center of a submerged water jet (pmax – p2)/(p1 – p2) compared with a single
FIGURE 10 1st and 2nd peaks resulting from a submerged high-speed water jet at constant injection pressure for various cavitational nuber

18 HitosHi soyama
phase jet, such as an air jet in air [71], and a submerged water jet surrounded by an air jet [72]. The measured maximum pressure, pmax, is defined as the maximum pressure at the center of a jet with an equivalent nozzle diameter, de, as follows [69],
d d ce d= (8)
where d is the nozzle throat diameter and cd is the discharge coefficient. As shown in Fig. 12, after the potential core has vanished the normalized pres-sure at the center of the jet, (pmax – p2)/(p1 – p2) decreases with the normalized standoff distance, revealing the following equation for single phase flow:
p p
p p
s
de
n
max −−
∝
2
1 2
(9)
For a single-phase jet, the exponent n is -2. The distribution for a cavitating jet has a similar region; however, n for a cavitating jet is not -2 but is smaller than -2. Thus, n decreases with decreasing cavitation number. When a cavitat-ing jet is surrounded by an air jet, it is more remarkable. Extrapolation of the straight parts of the curves in Fig. 12 to the line (pmax – p2)/(p1 – p2) = 1 gives intersects that increase with decreasing cavitation number. This suggests the
FIGIRE 11Aggressive intensity of jets at equivalent jet power as a function of standoff distance at a constant downstream pressure p2 = 0.1 MPa

Key Factors and applications oF cavitation peening 19
potential core, where the impacts of small water masses make a significant contribution, increases with decreasing cavitation number. This is the reason why the water jet peening region changes with cavitation number, and the peak at s/d ≈ 140 with p1 = 300 MPa is caused by water jet peening. The schematic diagram of the structure of a cavitating jet was revealed by measuring the pres-sure distribution across a surface treated by the jet in reference [69].
3.2. Classification Map for Cavitation Peening and Water Jet PeeningAs mentioned above, cavitation peening uses cavitation impacts, and water jet peening uses small water mass impacts. For cavitation peening, there is an optimum injection pressure, and if the injection pressure is too high the cavi-tation peening is poor. On the other hand, for water jet peening, the peening intensity increases with injection pressure. That is, the optimum jet condi-tions are different for cavitation peening and water jet peening. This makes it necessary to classify cavitation peening and water jet peening.
In order to classify cavitation and water jet peening, a classification map was proposed [70]. As described by Eq. (7), the optimum standoff distance for cavitation peening, i.e., the 2nd peak, varies with cavitation number, as
FIGURE 12 Variation of stagnation pressure with cavitation number (cylindrical nozzle, d = 2.5 mm, p1 = 8 MPa)

20 HitosHi soyama
shown in Fig. 10. On the other hand, the point at which the potential core ends, i.e., the 1st peak, also changes with injection pressure p1 as shown in Figs. 11 and 12. As shown in Figs. 10 and 11, the aggressive intensity of the jet clearly has two peaks. It is easy to find the optimum standoff distances for the 1st and 2nd peaks by measuring the mass loss, the arc height (related to the inverse radius of curvature) or the residual stress as functions of standoff distance. Figure 13 illustrates a classification map for cavitation peening and water jet peening, considering the cavitation number, σ, the injection pres-sure, p1, and the optimum standoff distance, sopt [70]. In Fig. 13, p1 is consid-ered to be one of the parameters of σ, as given by Eq. (2). The points in Fig. 13 were collected from 115 experimental data measurements from 15 refer-ences since 1976. These include the variations with standoff distance of the mass loss, the residual stress and the arc height. The details are described in reference [73]. The 1st and 2nd peak regions are divided by the line,
s
dopt = −1 8 0 6. .σ (10)
The lower region, i.e., near the nozzle, is the 1st peak region which is appli-cable for water jet peening. The upper region, including the line, i.e., far from the nozzle, is the 2nd peak region and is applicable for cavitation peening. If the
FIGURE 13 Classification map for cavitation peening and water jet peening, considering the optimum standoff distance sopt, where the aggressive intensity of the jet has a maximum, as a function of cavitation number σ

Key Factors and applications oF cavitation peening 21
equivalent nozzle diameter de which is defined by Eq. (8) is considered, the dif-ference between the 1st and 2nd peak regions is much clearer [73].
Now let’s check the peaks in Fig. 11 at s/d ≈ 140 with p1 = 300 MPa (σ = 0.00033) and at s/d ≈ 140 with p1 = 30 MPa (σ = 0.0033). For p1 = 300 MPa and p1 = 30 MPa, the values of 1.8σ -0.6 are 221 and 55, respectively. As the above-mentioned value of 140 is smaller than 221, the peak with p1 = 300 MPa corresponds to the 1st peak, whereas it is larger than 55, so the peak with p1 = 30 MPa corresponds to the 2nd peak. Note that, with p1 = 300 MPa, the peak at s/d ≈ 280, which is greater than 221, is the 2nd peak, as expected.
4. KEY FACTORS IN CAVITATION PEENING
4.1. Types of Cavitating JetsA submerged high-speed water jet with cavitation, i.e., a cavitating jet in water, is commonly used to generate cavitation for cavitation peening. More-over, a cavitating jet in air was developed by Soyama et al. as mentioned above [22-24]. In order to demonstrate the performance of the various types of cavitating jet, Fig. 14 shows schematic diagrams of jets and erosion pat-terns on pure aluminum specimens at constant injection pressure, constant exposure time and the same nozzle throat diameter. In Fig. 14, the areas treated by the jets are clearly shown by the eroded areas, and it is assumed that larger mass loss corresponds to better performance of the jet. Figures 14 (a) and (b) show a cavitating jet in water and in air, respectively. Figure 14 (c) shows a cavitating jet in water with an associated jet and Figure 14 (d) shows a cavitating jet in a pressurized chamber in which the cavitation number can be controlled by changing the pressure of the chamber. When Figs. 14 (a) and
FIGURE 14Perfomance and areas treated by several types of cavitating jet (pure aluminium, d = 1 mm, p1 = 20 MPa , t = 1 min)

22 HitosHi soyama
(b) are compared, the cavitating jet in air is more aggressive compared with the cavitating jet in water, as the mass lost from the treatment area was greater. For the cavitating jet in water with the associated water jet the plastic defor-mation is more remarkable compared to that for the cavitating jet in water. It can be said that the cavitating jet in water with the pressurized chamber is most powerful, as the mass loss was largest. Thus, clearly, the performance and treatment area depend on the type of cavitating jet.
One of the key factors related to the performance of the jet is the formation of residual bubbles, which are shown in the schematic diagram in Fig. 1. After cavitation collapse, tiny air bubbles are formed in the water [74]. These small bubbles act as cavitation nuclei [34] and/or provide a cushioning effect which is described above in the section on “cavitation”. Figure 15 shows residual bubbles induced by a cavitating jet [74]. As Fig. 15 is a typical instantaneous photograph taken by a CCD camera with a flash lamp with a 1ms exposure time placed on the far side of the jet from the camera, the cavi-tation clouds are observed as black shadows, and the residual bubbles are seen as indistinct shadows. In a normal cavitating jet in water, these residual bubbles are taken into the cavitating jet, and provide a cushioning effect, thus reducing the impact of the jet. In the case of a cavitating jet in air, fresh water without residual bubbles is fed around the high-speed water jet, so that the cushioning effect is small, since the residual bubbles are not recirculated. In addition, the vortex, which depends on the nozzle geometry and the injection conditions, around the high speed water jet also affect the performance of the jet. When an associated water jet is injected around the high speed water jet
FIGURE 15Residual bubbles induced by a cavitating jet

Key Factors and applications oF cavitation peening 23
(see Fig. 14 (c)), the recirculation of the residual bubbles is reduced, and the cushioning effect is mitigated compared with a normal cavitating jet in water (see Fig. 14 (a)). This is the main reason why a cavitating jet in water with an associated water jet produces more plastic deformation than a normal cavitat-ing jet in water does. In the case of a cavitating jet in water in a pressurized chamber, the size of the residual bubbles is reduced by the pressure of the chamber, so that the cushioning effect is considerably less. The other reason might be that the increase in pressure of the chamber would result in an increase in the difference between the pressure outside and inside the bubbles and then in an increase in the potential energy of the vapor structures which would finally result in a more violent collapse. Thus, the performance of a jet in a pressurized chamber is the best.
Figure 16 shows the distributions of residual stress with depth in stainless steel SUS316L treated by cavitation peening (CP) using cavitating jets in water and air, and a cavitating jet in a pressurized chamber. It is obvious that all three jets can introduced compressive residual stress into stainless steel SUS316L. The cavitating jet in air can introduce large compressive residual stress in the subsurface and the cavitating jet in water can introduce compres-sive residual stress into a deeper region. In order to reveal the difference between cavitating jets in water and air, Fig. 17 shows plastic deformation
FIGURE 16 Compressive residual stress introduced by several type of cavitating jets (stainless steel).

24 HitosHi soyama
pits on pure aluminum. The nozzle throat diameter of the cavitating jet in water was 2 mm and that of the cavitating jet in air was 1 mm in Figs. 16 and 17. Note that the diameter of the plastic deformation pit on pure aluminum is proportional to 0.6 power of nozzle throat diameter [75]. When the constant nozzle throat diameter was used [76], the tendency of the residual stress dis-tribution was similar to that of Fig. 16. Rather larger pits of the sub-mm and/or mm order can be seen on the surface treated by the cavitating jet in water. On the other hand, higher density and deeper smaller pits can be seen in the case of the cavitating jet in air. Thus, CP using a cavitating jet in water pro-vides an equivalent effect to shot peening with large shot, and CP using a cavitating jet in air corresponds to shot peening using small shot at high velocity. A cavitating jet in water in a pressurized chamber can introduce large compressive residual stress near the surface and also in a deeper region. As mentioned above, the pressure in the chamber reduces the residual bub-bles which then enhances the performance of the jet.
When opposing cavitating jets are used for cavitation peening, a hole and/or pipe can be treated [53]. As the pressure where the opposing jets meet increases, the cavitation collapses powerfully. Even if the opposing jets are placed parallel to the surface to be treated, the cavitation collapses to the surface. The details of this phenomenon are described in reference [53].
4.2. Standoff Distance As shown in Figs. 10 and 11, the performance of a cavitating jet varies with standoff distance, and the optimum standoff distance for the 2nd peak, sopt, which depends on the nozzle diameter d and the cavitation number σ, as described by Eq. (7), is used for cavitation peening. Figure 18 shows the inverse of the radius of curvature 1/ρ of a 5 mm thick duralumin plate JIS A2017-T3, after exposure to a cavitating jet at various standoff distances, injection pressures and nozzle diameters, using two different types of nozzle
FIGURE 17 Typical images of plastic deformation pits on pure aluminium.

Key Factors and applications oF cavitation peening 25
FIGURE 18 Aggressive intensity of cavitating jets as a function of standoff distance.

26 HitosHi soyama
N1 and N2 [77]. The 1/ρ has a maximum for each cavitating condition. As cavitation peening and water jet peening are classified by the relationship between the cavitation number σ and the optimum standoff distance sopt as shown in Fig. 13, the peaks in Fig. 18 belong to cavitation peening. The val-ues of sopt and 1/ρ at the peak increase with increasing injection pressure and/or nozzle throat diameter at the present condition.
4.3. Nozzle Geometry In order to show the relative aggressive intensities of cavitating jets through various types of nozzle, Fig. 19 shows the mass loss Dm as a function of standoff distance [78]. The specimens were made of pure aluminum to demonstrate the performance of each jet, and the exposure time in each case was 2 min. All the nozzles had the same throat diameter, i.e., 0.4 mm, with a sharp edge at the upstream end. The equivalent nozzle diameter de of all the nozzles was the same. However, there are large differences in Dm. For example, the maximum Dm of nozzle A is about 6 times larger than that of nozzle H. Actually, the 6 nozzles on the left hand side in Fig. 19 were used for water jets, while nozzles A and B were proposed for cavitating jets. Note that the shapes of the nozzles suitable for cavitating jets are much dif-ferent to those for water jets.
FIGURE 19Effect of nozzle outlet geometry on the aggressive intensity of a cavitating jet (d = 0.4 mm, p1 = 30 MPa).

Key Factors and applications oF cavitation peening 27
In order to enhance the performance of cavitating jets, resonating nozzles were proposed by Johnson et al. [79] and Chahine et al. [80]. A horn shape at the nozzle exit was also proposed [67], and an improvement in performance using a nozzle equipped with a center body as a cavitator was reported [81]. As shown in Fig. 19, a simple nozzle with an orifice plate with an outlet bore has good performance. The outlet geometry of such a nozzle was optimized by Soyama, experimentally [20], such that the aggressive intensity was increased by a factor of 20. In order to increase the aggressive intensity of the jet, a cavitator placed upstream from the orifice plate, and a guide, with which the size of the cavitation cloud was enhanced, were optimized [21]. Each of these doubled the aggressive intensity of the jet, so that the overall improvement was a fac-tor of 4. Thus, the aggressive intensity of a jet without a pressurized chamber was improved by a factor of about 80 compared to cavitating jets in the 1990’s.
4.4. Cavitation NumberIn order to demonstrate the effect of cavitation number on the aggressive intensity of a cavitating jet, Fig. 20 shows the dependency of the mass loss Dm of pure aluminum on cavitation number σ [82]. The Dm was measured at the optimum standoff distance for each cavitation number. The injection pres-sure p1 and exposure time of the jet were 20 MPa and 630 s, respectively. The
FIGURE 20Effect of cavitation number on the aggressive intensity of a cavitating jet (d = 0.4 mm, p1 = 30 MPa)

28 HitosHi soyama
peak mass loss is at σ = 0.014. Previously, it had been reported that the mass loss of a cavitating jet with p1 = 98 MPa peaks at σ = 0.01 – 0.014 [83]. The cavitation number at the peak, where the aggressive intensity is at its peak, is slightly different for different nozzle outlet geometries, but is in the range of σ = 0.01 – 0.014 [84].
For a cavitating jet in water in a pressurized chamber, mentioned in the sec-tion entitled “Types of Cavitating Jets”, when the cavitation collapses, it is in a relatively high-pressure region, thus, the individual impacts would be large, because the residual bubbles that normally produce the cushioning effect are reduced by the high pressure. This is why the aggressive intensity increases with cavitation number, σ, since σ increases with the higher pressure, i.e., the downstream pressure of the nozzle, p2, as given by Eq. (2). On the other hand, the total number of cavitation impacts decreases with cavitation number σ, so the aggressive intensity at large σ decreases with σ. This is reason why the aggressive intensity of a cavitating jet has a peak against cavitation number σ.
Regarding the experimental results of a cavitating flow through a Venturi tube [85], the aggressive intensity has a peak at a certain downstream pres-sure p2 opt, which varies with the injection pressure p1. When the cavitation number is considered, the cavitation number at the peak is nearly constant for various p1 [85]. Thus, the cavitation number is one of the key factors in cavi-tation peening. For practical applications, it is worthwhile to set the down-stream pressure at the optimum value, as the aggressive intensity of cavitation can simply be increased by controlling a valve on the downstream side with-out the need for additional power.
Now let’s consider the aggressive intensity Icav of a cavitating jet in water such as represented by the mass loss and/or the inverse of radius of curvature of the plate, i.e., the arc height, as a function of cavitation number at constant injection pressure p1. For constant cavitation number σ, that is, with constant p2, 1/ρ, and therefore, Icav, is proportional to the cavitation volume, Vcav, as shown in Eq. (6). Assuming that Icav is proportional to the pressure difference between p2 and pv,, then,
1
2ρ∝ ∝ −( )V p V p pcav cav v.∆ (11)
However, the cavitation impact is reduced by the cushioning effect of residual bubbles, which reduces Icav. Thus, the pseudo vapor pressure, pv’, is used in place of pv when residual bubbles are entrained into the cavitating region. Moreover, since the cavitating length Lcav is proportional to the opti-mum standoff distance, sopt, which can be found from erosion tests [69], Vcav in Eq. (12) can be replaced by a term depending on sopt. Thus, we have
I V p p L p p s p pcav cav v cav v opt v∝ − ′( )∝( ) − ′( )∝( ) − ′( )23
2
3
2 (12)

Key Factors and applications oF cavitation peening 29
Since pv’ > pv, Icav is reduced. The relationship between σ and sopt is given by Eq. (10), and that between p2 and p1, σ is given by Eq. (2), so Eq. (12) can be rearranged to give
I p p p p p pcav v v v∝( ) − ′( )∝ − ′( )∝ − ′( )− − −σ σ σ σ0 6 3
21 8
21 8
1. . . (13)
Although in deriving Eq. (13) from Eq. (12) the cavitating length Lcav is given as a function of the cavitation number, σ, where the optimum standoff distance sopt is used, sopt depends on the nozzle geometry. Therefore, a modi-fication to the cavitation number, ss, should be considered. For example, Lcav is usually defined as the distance from the nozzle exit to the end of the cavitat-ing region, and sopt is defined as the distance from the upstream corner of the nozzle to the surface of the target. In this case Eq. (13) can be rewritten with σ-ss replacing σ in parentheses to give
I c p pcav s v= −( ) − ′{ }−σ σ σ1 81
. (14)
where c is a constant of proportionality. Note that Eq. (14) gives the aggres-sive intensity of the jet as a function of cavitation number at constant injec-tion pressure p1. Differentiating equation (14) and setting this equal to zero shows that Icav has a maximum at
σ σ=′
+
1 8
0 8 1
.
.
p
pv
s (15)
Figure 21 shows the normalized aggressive intensity of a cavitating jet Īcav as a function of cavitation number σ. This is normalized at σ = 0.014. For Fig. 21, the experimental values of Īcav were calculated from experi-mental data published in various reports [66, 82, 86]. The estimated values were obtained from Eq. (14) by optimizing c, ss and pv, respectively. As mentioned above, the maximum value of Īcav is taken to be at σ ≈ 0.014. The estimated values of Īcav have maxima in the range σ = 0.01 - 0.014. Thus, Eq. (14) shows the effect of cavitation number on the aggressive intensity of a cavitating jet.
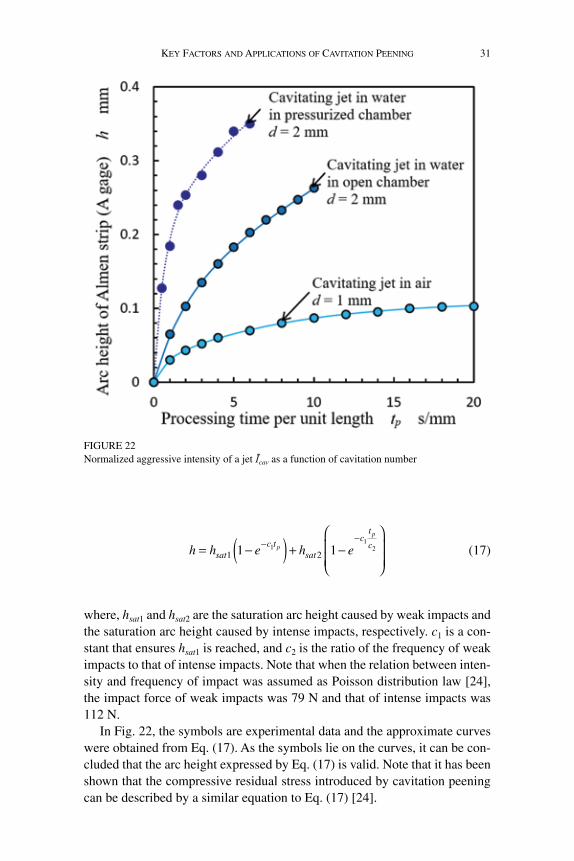
4.5. Processing Speed (Processing Time per Unit Length) In order to discover the effect of processing speed, i.e., processing time per unit length, Fig. 22 shows the arc height produced in an Almen gauge as a function of processing time per unit length tp [87]. The tp is defined by the processing speed v and the number of scans n as follows

30 HitosHi soyama
tn
vp = (16)
The cavitation peening conditions were as follows. For the cavitating jet in water in a pressurized chamber, the nozzle throat diameter d was 2 mm, the injection pressure p1 was 30 MPa, the standoff distance s was 80 mm, and the cavitation number σ was 0.014. For the cavitating jet in water in an open chamber, the cavitating conditions were d = 2 mm, p1 = 30 MPa, s = 262 mm and σ = 0.0033. For the cavitating jet in air, the conditions were d = 1 mm, p1 = 30 MPa and s = 56 mm. In all three cases, the arc height of the Almen gage increased with tp and saturated at a certain tp. The arc height reached 0.2 mm with tp = 1 mm/s, when the cavitating jet in water in the pressurized chamber was used. According to a previous report [24], the distribution of the intensity and the fre-quency of cavitation impact are stochastic phenomena. Moreover, the frequency of intense cavitation impacts is less than 1/10 the frequency of weak impacts, and the arc height can be expressed by the following equation:
FIGURE 21 Normalized aggressive intensity of a jet Īcav as a function of cavitation number
Key Factors and applications oF cavitation peening 31
h h e h esatc t
sat
ct
cp
p
= −( ) + −
− −
1 21 111
2 (17)
where, hsat1 and hsat2 are the saturation arc height caused by weak impacts and the saturation arc height caused by intense impacts, respectively. c1 is a con-stant that ensures hsat1 is reached, and c2 is the ratio of the frequency of weak impacts to that of intense impacts. Note that when the relation between inten-sity and frequency of impact was assumed as Poisson distribution law [24], the impact force of weak impacts was 79 N and that of intense impacts was 112 N.
In Fig. 22, the symbols are experimental data and the approximate curves were obtained from Eq. (17). As the symbols lie on the curves, it can be con-cluded that the arc height expressed by Eq. (17) is valid. Note that it has been shown that the compressive residual stress introduced by cavitation peening can be described by a similar equation to Eq. (17) [24].
FIGURE 22Normalized aggressive intensity of a jet Īcav as a function of cavitation number

32 HitosHi soyama
As the optimum processing time of cavitation peening is about 1/25 to 1/5 of the incubation period for both stainless steel and copper [88], cavita-tion peening does not make damage with material loss on the treated sur-face.
4.6. Nozzle Throat Diameter In order to illustrate the relationship between the nozzle throat diameter and the peening intensity, Fig. 23 shows the inverse of the radius of curvature 1/ρ as a function of nozzle throat diameter d. In Fig. 23, 1/ρ at the optimum standoff distance, where 1/ρ has its maximum value, is plotted from the data points in Fig. 18 (c). When a power law is assumed by considering the scaling effect on cavitation erosion, i.e., Eq. (3), the relationship between d and 1/ρ can be expressed by the following equation:
1
ρ∝ dnd (18)
where, nd is the exponent of the power law. In Fig. 23, nd is 1.8 ± 0.4. When the erosion rate is measured with various values of d, nd depends on cavitation number σ, with nd = 1.56 ± 0.03 at σ = 0.01, nd = 1.97 ± 0.03 at σ = 0.014 and nd = 2.49 ± 0.02 at σ = 0.02 [89]. These results suggest that
FIGURE 23 Effect of nozzle throat diameter on the peening intensity (p1 = 30 MPa)

Key Factors and applications oF cavitation peening 33
nd is roughly about 2. Thus, it can be concluded that the aggressive inten-sity of the cavitating jet is roughly proportional to the flow rate of the jet, as the flow rate is proportional to the square of d at constant injection pressure.
In order to understand the effect of the nozzle throat diameter d on the thickness of the surface modification layer, δ, Fig. 24 shows the variation in the distribution of residual stress, sR, with d for SUS316L stainless steel treated by cavitation peening with p1 = 30 MPa, p2 = 0.1 MPa, σ = 0.003, and tp = 1 s/mm [29]. At d = 0.35 mm, the residual stress at the surface is about -40 MPa and the thickness of the compressive layer is about 60 mm. On the other hand, at d = 2 mm, the residual stress at the surface is about -270 MPa and the thickness of compressive layer is about 1 mm. Thus, a cavitating jet using a large nozzle can introduce greater compressive residual stress up to greater depth.
4.7. Injection Pressure Figure 25 shows the relationship between the inverse of the radius of curva-ture 1/ρ and the injection pressure p1 from the data points for the optimum standoff distances in Fig. 18 (a) and (b). By considering Bernoulli’s equation (Eq. (1)) and the power law dependency on flow velocity given in Eq. (4), the following power law for the relationship between peening intensity, repre-sented by 1/ρ, and injection pressure is derived,
FIGURE 24Effect of nozzle throat diameter on the introduction of compressive residual stress into stainless steel (p1 = 30 MPa, p2 = 0.1 MPa, σ = 0.003, tp = 1 s/mm)

34 HitosHi soyama
11ρ
∝ pnp (19)
where np is the exponent of the power law. The values of np in Fig. 25 are 1.17 ± 0.06 at d = 0.65 mm and 0.73 ± 0.12 at d = 2 mm. Note that the values of 1/ρ in Fig. 18 (a) and (b) were evaluated at constant downstream pressure. This means that the cavitation number changes with changes in injection pressure. The above-mentioned np includes the effect of cavita-tion number. As mentioned in the section on “cavitation number”, the aggressive intensity of the jet decreases with decreasing cavitation num-ber σ for σ < 0.01. Regarding a previous report, the values of np at con-stant cavitation numbers were as follows; np = 2.25 ± 0.05 at σ = 0.01, np = 2.42 ± 0.02 at σ = 0.014 and np = 2.82 ± 0.01 at σ = 0.02 [89], suggest-ing that np changes with σ. Furthermore, np decreases with decreasing σ (= p2/p1), i.e., increasing p1 at constant tank pressure. That is, if the injec-tion pressure is too high at a constant tank pressure p2, the peening inten-sity hardly increases with p1.
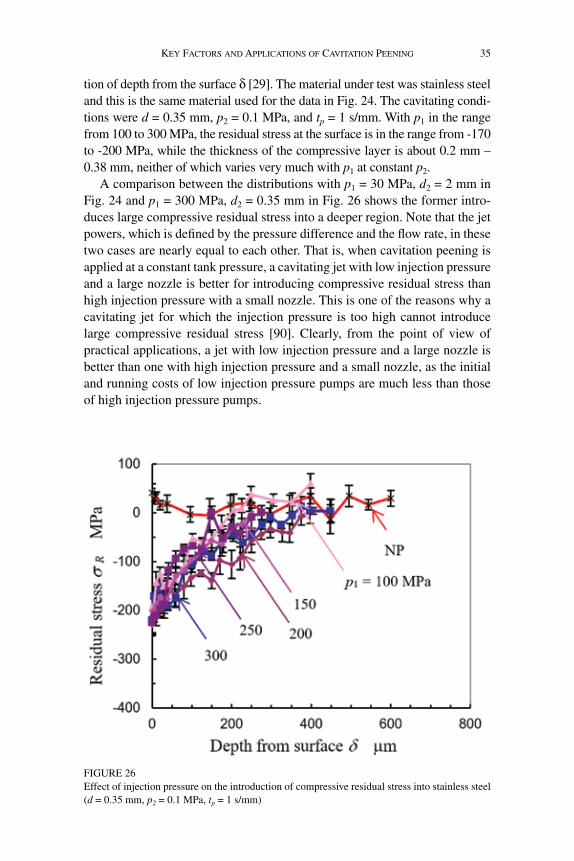
In order to illustrate the effect of injection pressure at relatively high injec-tion pressures on the introduction of compressive residual stress at a constant tank pressure p2, Fig. 26 shows the distribution of the residual stress as a func-
FIGURE 25Effect of injection pressure on the peening intensity
Key Factors and applications oF cavitation peening 35
tion of depth from the surface δ [29]. The material under test was stainless steel and this is the same material used for the data in Fig. 24. The cavitating condi-tions were d = 0.35 mm, p2 = 0.1 MPa, and tp = 1 s/mm. With p1 in the range from 100 to 300 MPa, the residual stress at the surface is in the range from -170 to -200 MPa, while the thickness of the compressive layer is about 0.2 mm – 0.38 mm, neither of which varies very much with p1 at constant p2.
A comparison between the distributions with p1 = 30 MPa, d2 = 2 mm in Fig. 24 and p1 = 300 MPa, d2 = 0.35 mm in Fig. 26 shows the former intro-duces large compressive residual stress into a deeper region. Note that the jet powers, which is defined by the pressure difference and the flow rate, in these two cases are nearly equal to each other. That is, when cavitation peening is applied at a constant tank pressure, a cavitating jet with low injection pressure and a large nozzle is better for introducing compressive residual stress than high injection pressure with a small nozzle. This is one of the reasons why a cavitating jet for which the injection pressure is too high cannot introduce large compressive residual stress [90]. Clearly, from the point of view of practical applications, a jet with low injection pressure and a large nozzle is better than one with high injection pressure and a small nozzle, as the initial and running costs of low injection pressure pumps are much less than those of high injection pressure pumps.
FIGURE 26 Effect of injection pressure on the introduction of compressive residual stress into stainless steel (d = 0.35 mm, p2 = 0.1 MPa, tp = 1 s/mm)

36 HitosHi soyama
4.8. Downstream Pressure (Tank Pressure) When the effect of the pressure downstream from the nozzle throat p2, i.e., the tank pressure, on the aggressive intensity of the cavitating jet was examined, a peak was found at a certain p2 [85, 91]. Although the value of p2, where the maximum occurred, depended on the injection pressure p1, the cavitation number σ (= p2/p1) at the peak was almost constant [85], signifying that the cavitation number is a key parameter. If the optimum downstream pressure is required, it is easy to obtain it by considering the cavitation number and the injection pressure. In the case of a cavitating jet, the optimum cavitation num-ber is 0.01 – 0.014 as mentioned in the section on “cavitation number”.
4.9. Water Temperature and Other ParametersAs cavitation is a phase change phenomenon from the liquid phase to the gas phase, similar to boiling, the water temperature Tw is one of the key parame-ters. The water temperature affects the vapor pressure, the dissolved gas con-tent, the viscosity, the surface tension and the density. The effect of temperature on the aggressive intensity of cavitation peening, such as the erosion rate has been investigated by carrying out vibratory erosion tests [92-96] and cavitating jet erosion tests [97]. The various reports concluded that the maximum erosion rate occurred at 40 – 50 ºC [92, 95], 60 – 70 ºC [94], about 30 ºC [93], or 21 ºC [96]. In the case of a cavitating jet, the erosion rate had a maximum at about 40 ºC, and the peak became indistinct at relative low cavitation numbers [97]. Therefore, the effect of the water temperature on the aggressive intensity of a cavitating jet is not clear.
Figure 27 shows the inverse of the radius of curvature 1/ρ of a 5 mm thick duralumin plate JIS A2017-T3 as a function of processing time per unit length tp at various water temperatures, Tw. The curve for Tw = 5 ºC is slightly lower than the other curves. At Tw = 15, 25 and 35 ºC, 1/ρ is independent of water temperature. That is, the peening intensity is nearly constant in the range Tw = 15 – 35 ºC under the conditions used here.
Next, let’s consider the effect of the depth of the nozzle in the water on cavitation peening. As mentioned in the sections on “Cavitation” and “Types of Cavitating Jets”, residual bubbles and/or air bubbles in the water around the jet are a very important factor, as they provide a cushioning effect. When the position of the nozzle is in a shallow open chamber in which the water surface has a free surface, a suction vortex around the jet feeds air bubbles from the surface into the jet. These air bubbles potentially provide a cushion-ing effect, thus reducing the peening intensity of the jet. Thus, the water depth dw, i.e., the distance from the water surface to the nozzle should be consid-ered. Figure 28 shows the inverse of the radius of curvature 1/ρ as a function of processing time per unit length tp for various water depths dw. The plate used was 5 mm thick duralumin, the same as that used for the experiments carried out for the data presented in Figs. 18 and 27. As shown in Fig. 28, 1/ρ with dw = 0.12 m is about two thirds of that with dw = 0.24 m. In these exper-

Key Factors and applications oF cavitation peening 37
FIGURE 27 Effect of water temperature (d = 2 mm, p1 = 30 MPa, p2 = 0.1 MPa)
FIGURE 28 Effect of the depth of water (d = 2 mm, p1 = 30 MPa, p2 = 0.1 MPa)

38 HitosHi soyama
iments, the plate was placed horizontally and the nozzle was set vertically above the plate. Actually, the pressure difference between dw = 0.12 m and dw = 0.24 m was only about 1.2 kPa, and the difference in cavitation number was only 0.00004 at p1 = 30 MPa. Thus, the difference in 1/ρ between dw = 0.12 m and dw = 0.24 m was not caused by the differences in pressure and/or cavi-tation number, but might be due to air bubbles, which are entrained into the jet. Thus, the water depth needs to be considered in order to mitigate the cushioning effect caused by air bubbles.
4.10. Experimental Formula to Estimate the Aggressive Intensity of Cavitation
As mentioned above, the peening intensity using a cavitating jet in water depends on the nozzle geometry, the nozzle throat diameter d, the cavitation number σ and the injection pressure p1. The optimum standoff distance sopt can be roughly estimated using Eq. (10), and it should be experimentally verified by measuring the peening intensity as a function of standoff distance. The peening effect of processing time per unit length and/or processing speed can be expressed by Eq. (17). Thus, in this section, the aggressive intensity of a cavi-tating jet in water Icav at sopt is discussed considering the nozzle geometry, the nozzle throat diameter d, the cavitation number σ and the injection pressure p1. Here, the aggressive intensity Icav is found from arc height measurements and/or erosion tests, as cavitation impacts cause plastic deformation and/or erosion of a material. Considering the power law dependencies of the intensity on the nozzle throat diameter d and the injection pressure p1 as expressed by Eqs. (18) and (19), an experimental formula was proposed to estimate the aggressive intensity Icav est from a reference aggressive intensity Icav ref as follows [89].
I I Kf
f
d
d
p
pcavest cavref nref ref
n
ref
nd p
=( )
( )
σ
σ1
1
(20)
where the parameters with the subscript ref are those for the reference condi-tions. Here, Kn depends on the geometry of the nozzle and/or the test section, and nd and np are the exponents of the power laws in Eqs. (18) and (19). Con-sidering Eq. (14), the function f (σ) is given by the following equation:
f p ps vσ σ σ σ( ) = −( ) − ′{ }−1 81
. (21)
As mentioned in the sections on “nozzle throat diameter” and “injection pressure”, the values nd and np depends on the cavitating condition. Example of values in the reference to estimate the aggressive intensity of cavitation are shown in Table 1.

Key Factors and applications oF cavitation peening 39
TABLE 1Example values of experimental formula to estimate the aggressive intensity of cavitation
(a) Power law exponents for nozzle throat diameter and injection pressure
Parameter Value Range Cavitating condition Reference
nd 1.8 ± 0.4 d = 1 mm – 2.5 mm p1 = 30 MPa, p2 = 0.1 MPa, σ = 0.0033 [75]
1.56 ± 0.03 d = 1 mm – 2.5 mm p1 = 10 MPa, p2 = 0.1 MPa, σ = 0.01 [86]
1.97 ± 0.03 d = 1 mm – 2.5 mm p1 = 10 MPa, p2 = 0.14 MPa, σ = 0.014 [86]
2.49 ± 0.02 d = 1 mm – 2.5 mm p1 = 10 MPa, p2 = 0.2 MPa, σ = 0.02 [86]
np 1.17 ± 0.06 p1 = 30 MPa – 80 MPa d = 0.65 mm, p2 = 0.1 MPa [75]
0.73 ± 0.12 p1 = 15 MPa – 30 MPa d = 2 mm, p2 = 0.1 MPa [75]
1.56 ± 0.03 p1 = 10 MPa – 30 MPa d = 1 mm, σ = 0.01 [86]
1.97 ± 0.03 p1 = 10 MPa – 30 MPa d = 1 mm, σ = 0.014 [86]
2.49 ± 0.02 p1 = 10 MPa – 20 MPa d = 1 mm, σ = 0.02 [86]
(b) Function depending on the shape of the nozzle
Parameter Value Nozzle type Cavitating condition Reference
Kn 1 d : D : L = 1 : 6 : 8 (see Ref. [20]) p1 = 30 MPap2 = 0.42 MPaσ = 0.014d = 2
[20]
22 d : D : L = 1 : 8 : 8 (ditto)
12 d : D : L = 1 : 10 : 8 (ditto)
10 d : D : L = 1 : 8 : 6 (ditto)
10 d : D : L = 1 : 8 : 10 (ditto)
Kn 1 Without cavitator and guide pipe (see Ref. [20]) p1 = 30 MPap2 = 0.1 MPaσ = 0.0033d = 2
[21]
1.8 Without cavitator with guide pipe (ditto)
2.3 With cavitator and without guide pipe (ditto)
4.2 With cavitator and guide pipe (ditto)
Kn 1.48 ± 0.06 Nozzle A (see Fig. 19) p1 = 30 MPap2 = 0.42 MPaσ = 0.014d = 0.4
[76]
1.00 ± 0.03 Nozzle B (ditto)
0.66 ± 0.07 Nozzle C (ditto)
0.54 ± 0.03 Nozzle D (ditto)
0.38 ± 0.03 Nozzle E (ditto)
0.36 ± 0.03 Nozzle F (ditto)
0.23 ± 0.01 Nozzle G (ditto)
0.23 ± 0.01 Nozzle H (ditto)
(c) Values to estimate relative aggressive intensity of cavitating jet
pv’ c σs Reference (experimental data)
0.05 MPa 0.00261 0.00301 [66]
0.00148 0.00171 [80]
0.00236 0.00270 [84]

40 HitosHi soyama
Now, let’s check the validity of Eq. (20). For example, when dref = 1 mm, p1 ref = 10 MPa, and sref = 0.014, Icav ref is 0.022 g/min, so that if d = 2 mm, p1 = 30 MPa, and σ = 0.014, Icav est is 1.231 g/min as shown by Eq. (22) below. The experimentally measured mass loss rate for these latter parameters was 1.428 g/min [89]. The difference between the estimated and experimental values is 16% at constant σ. Thus, Eq. (20) is useful for estimating the rela-tive aggressive intensity of a cavitating jet in water.
Icavest = × × ×
×
0 022 1 12
1
30
10
1 97 2 42
.. .
(22)
5. PEENING EFFECTS
5.1. Introduction of Compressive Residual Stress As mentioned in the introduction, in order to mitigate stress corrosion crack-ing in nuclear power plants, the introduction of compressive residual stress by “water jet peening” was proposed [12]. Soyama et al. found the cavitation impacts around a submerged water jet introduced compressive residual stress into stainless steel [13], and this was then confirmed by Hirano et al. [14]. Now, this method is applied to nuclear power plants [16]. Typical examples of the introduction of compressive residual stress into stainless steel by cavi-tation peening are shown in Figs. 16, 24 and 26. With the optimum cavitation conditions, i.e. d = 2 mm and p1 = 30 MPa, cavitation peening can introduce compressive residual stress up to a depth of about 1 mm.
The introduction of compressive residual stress by cavitation peening in order to extend the lifetime of a die for hot forging has been done. The life-time of a die was increased by 50 % [98], as a result of the compressive residual stress, which mitigates cracking of the die, and the work hardening, which suppresses deformation of the die. Figure 29 shows the variation in the distribution of residual stress with processing time per unit length tp [99]. The material under test was heat treated alloy tool steel JIS SKD61 with a Vickers hardness of 710 ± 30 before peening. After cavitation peening at tp = 10 s/mm, the Vickers hardness had increased by 17 % to 830 ± 30. Under the con-ditions used in that work, cavitation peening introduced compressive residual stress up to a depth 400 mm [99]. Note that the full width at half maximum of X-ray diffraction measurements on the material decreased after cavitation peening [99, 100]. Analysis of the micro strain using X-ray diffraction showed that the micro strain, introduced by heat treatments, such as quenching, and/or mechanical surface finishing, decreased after cavitation peening [100]. As cavitation peening is a kind of shotless peening, and can introduce compres-sive residual stress without collisions between solid materials, there is very

Key Factors and applications oF cavitation peening 41
little change in the surface roughness. On the other hand, the shock wave induced by cavitation bubbles collapsing can move dislocations in a poly-crystalline metal. This was confirmed by observation with a transmission electron microscopy [101]. Thus, cavitation peening can introduce compres-sive residual stress, i.e., macro strain, while relieving micro stain.
Cavitation peening can also introduce compressive residual stress into Ti-6Al-4V titanium alloy [102]. When the surface residual stress sR and the surface roughness Ra of cavitation peening and shot peening were compared, these were -988 ± 18 MPa and 0.53 mm, respectively, for a cavitation peened specimen, and -541 ± 141 MPa and 2.44 mm, respectively, for a shot peened specimen. Therefore, cavitation peening is capable of introducing compres-sive residual stress into titanium alloy with considerably less surface rough-ness compared to that from the widely used shot peening.
As shown in Figs. 16, 24, 26 and 29, the compressive residual stress intro-duced by cavitation peening has a maximum at the surface. There are two reasons why this is so. In the case of shot peening, in order to introduce com-pressive residual stress near the surface, small shot are applied after large shot, a process called two-stage shot peening. In the case of cavitation peen-ing, the cavitating jet produces both small and large impacts at the same time [24, 60]. As the small impacts behave like small shot and the large impacts
FIGURE 29 Introduction of compressive residual stress into tool alloy steel JIS SKD61 (d = 2 mm, p1 = 30 MPa, p2 = 0.42 MPa)

42 HitosHi soyama
behave like large shot, the distribution of residual stress treated by cavitation peening is the same as multiple stage shot peening. Another reason is the pressure distribution of an individual cavitation impact which is cone shaped with a maximum intensity at the cone center [103]. The distribution of com-pressive residual stress introduced by this sort of impact has a maximum at the surface [104]. Thus, it can be concluded that cavitation peening is suitable for maximizing the compressive residual stress at the surface.
5.2. Improvement in Fatigue Strength It was demonstrated that cavitation peening improved the fatigue strength of cast aluminum alloy [5], hot-rolled sheet steel [3], silicon manganese steel [17], carbonized chrome-molybdenum alloy steel [18], stainless steel [105], nitrocarburized carbon steel [106], duralumin [107-109], magnesium alloy [110] and Ti-6Al-4V titanium alloy manufactured by electron beam melting [111]. One example, shown in Fig. 30, shows the relationship between the bending stress sa and the number of cycles to failure Nf of stainless steel SUS316L treated by cavitating jets in water and in air. This was evaluated by a plate bending fatigue test [105]. In Fig. 30, CJA and CJW signifies cavitat-
FIGURE 30 Improvement in the fatigue strength of stainless steel using cavitating JETS in air and water (d = 1 mm, p1 = 30 MPa, p2 = 0.1 MPa)

Key Factors and applications oF cavitation peening 43
ing jets in air and water, respectively. In both cases, the nozzle throat diameter d was 1 mm and the injection pressure of the jet p1 was 30 MPa. In the case of the cavitating jet in water, the 1st and 2nd peaks were obtained by measur-ing the variation of residual stress with the standoff distance. As mentioned in the section on “Cavitation Peening and Water Jet Peening”, the 1st peak cor-responds to water jet peening (WJP) and the 2nd peak corresponds to cavita-tion peening (CP). The fatigue strength after Nf = 107 cycles obtained by Little’s method [112] were 279 MPa for the non-peened specimen, 292 MPa for WJP by CJW, 327 MPa for CP by CJW and 360 MPa for CP by CJA. Although water jet peening can improve the fatigue strength, improvement in the fatigue strength by cavitation peening is better than that by water jet peen-ing. From this test, it was found that the fatigue strength of the specimen treated by cavitation peening using the cavitating jet in air was best.
As is well known, the improvement in fatigue strength depends on crack initiation and crack propagation. A method for measuring fatigue crack growth rates using a compact tension specimen has been standardized by ASTM E647-13 [113]; however, it is very difficult to evaluate crack propaga-tion in a modified layer at the surface using the standard test method, as the thickness of the layer is too thin compared with the base material. Therefore, a load-controlled plate bending fatigue tester was developed, and it was shown that the relationship between the threshold stress intensity factor range ∆Kth and the crack propagation rate da/dN of the peened material can be evaluated using this tester [114, 115]. Examining the mechanisms by which the fatigue strength can be improved by peening can be very beneficial, and can help check whether crack initiation and/or crack propagation are sup-pressed by cavitation peening. With ∆Kth defined as the stress intensity factor range ∆K at da/dN = 10-10 m/cycle, ∆Kth of a non-peened stainless steel spec-imen, which was was 3.75 MPa, became 7.35 MPa after cavitation peening [115]. The crack propagation rate was also reduced by cavitation peening [114]. Thus, cavitation peening can suppress crack initiation and crack prop-agation.
There are many practical applications of cavitation peening to mechani-cal components. Improvements to the fatigue strengths of the elements of a steel belt for CVT [116], a roller [117], gears [118], an elastic ring for a planetary traction drive unit [119] have all been demonstrated. Figure 31 shows the relationship between torque Dn and the number of cycles to fail-ure Nf. The gears tested were made of chromium molybdenum steel JIS SCM420H and were treated by cavitation peening with d = 2 mm, p1 = 30 MPa, and p2 = 0.42 MPa, and examined by a power circulating-type gear tester. The fatigue torque at Nf = 107 determined by Little’s method [112] was 337 Nm for the non-peened gear, 376 Nm for the shot-peened gear and 418 Nm for the cavitation peened gear. Thus, it is clear that a greater improvement in fatigue torque was achieved with cavitation peening com-pared to shot peening.

44 HitosHi soyama
5.3. Improvement in Fretting Fatigue Strength Cavitation peening also suppresses fretting fatigue by introducing com-pressive residual stress [120, 121]. A spinal implant rod and its holding fixture can suffer from severe fretting fatigue, so it would be valuable if the fretting fatigue properties of these could be enhanced. Figure 32 illustrates the results of fretting fatigue tests on a 5 mm diameter spinal implant made of Ti-6Al-4V ELI (Extra-Low Interstitial) [122], [121]. As the diameter of the implant rod is relatively small, the cavitation peening conditions chosen were d = 0.64 mm, p1 = 80 MPa, and p2 = 0.8 MPa. The test rod was evaluated by a fretting fatigue test in accordance with the ASTM F1717 standard [123]. As shown in Fig. 32, at an applied load P = 350 N, the number of cycles to failure Nf of the non-peened specimen is 5.86 × 10⁴, and that of the cavitation peened specimen is 2.05 × 10⁶. The number of cycle to failure is 40 times more after cavita-tion peening. When the applied loads for Nf > 5 × 10⁶ are compared, the non-peened specimen is 150 N and the cavitation peened specimen is 350 N. Thus, the fretting fatigue strength of the spinal implant rod was enhanced by a factor of 2.2 by cavitation peening. This improvement in the fretting fatigue properties is due to hardening and the introduction of compressive residual stress [124, 125]. The Vickers hardness and
FIGURE 31Improvement in fatigue strength demonstrated by a power circulating_type gear tester (d = 2 mm, p1 = 30 MPa, p2 = 0.42 MPa)

Key Factors and applications oF cavitation peening 45
residual stress were 5.0 GPa and -116 ± 20 MPa, respectively, for the non-peened specimen, and -554 ± 20 MPa and 9.6 GPa, respectively, for the cavitation peened specimen. Thus, cavitation peening can drasti-cally improve the fretting fatigue properties by work hardening and introducing compressive residual stress.
5.4. Improvement in Yield Strength Mechanical surface treatments can improve yield strength by work harden-ing. Improvements in the yield stress of electrical sheet steel by cavitation peening has also been demonstrated [126]. Electrical sheet steel is used in the IPM motors [127] of electric and hybrid vehicles. In order to obtain bet-ter electromagnetic properties, an increase in the permissible speed of rota-tion is required, without changing the chemical composition of the sheet steel. In one report [126], cavitation peening was proposed as a technique to partially strengthen the steel to increase the speed of rotation. Figure 33 shows the relationship between tensile stress st and displacement δD [126]. The tensile test was conducted using a tensile test specimen. The thickness and width of the test section of the specimen made of non-oriented electri-cal sheet steel were 0.35 mm and 1 mm to simulate the component of an IPM motor. The yield stress σy of the sheet steel without peening was 372
FIGURE 32Improvement in the fretting fatigue strength of a spinel implant evaluated by the ASTM F1717 Standard (d = 0.64 mm, p1 = 80 MPa, p2 = 0.8 MPa)

46 HitosHi soyama
MPa, and it increased to 453 MPa after cavitation peening. Thus, an improvement in yield stress of the sheet steel by about 22 % was obtained by cavitation peening.
In the test mentioned above the cross-sectional area was relatively small, thus, the improvement in yield stress was verified by a conventional tensile test. It is difficult, however, to demonstrate improvements in the yield stress of mechanically treated surfaces, such as those treated by shot peening, laser peening, cavitation peening, etc., as the thickness of the modified layer is relatively thin compared with the bulk material. Also, the effect of the compressive residual stress in a specimen with a small test area is dif-ficult using a conventional tensile test. In this case, inverse analysis of the yield stress using an indentation test is very useful, as mechanical proper-ties, such as the yield stress, Young’s modulus, the residual stress, and the work hardening coefficient in a local area can all be evaluated [128-138]. For example, in order to investigate the mechanism for the improvement in the fatigue strength of stainless steel by cavitation peening, the yield stress of a cavitation peened layer was investigated using inverse analysis and an indentation test. This showed that the yield stress could be improved from 300 MPa to 500 ± 60 MPa by cavitation peening [139]. This is reasonable, considering the relationship between the yield stress and the fatigue strength of medium strength steels [139]. It can be concluded that cavitation peening improves the yield stress of metallic materials and that inverse analysis and
FIGURE 33 Improvement in the yield stress of electrical sheet (d = 2 mm, p1 = 30 MPa, p2 = 0.42 MPa)

Key Factors and applications oF cavitation peening 47
an indentation test can be used to investigate the yield stress of a modified layer at the surface.
5.5. Suppression of Hydrogen EmbrittlementSince Johnson [140] found that hydrogen has a remarkable effect in iron, many researchers have been investigating hydrogen embrittlement [141-143]. In order to use hydrogen for one of our basic energy sources, we need to be able to suppress hydrogen embrittlement. It has been shown that hydrogen concen-trates around crack tips where the hydrostatic stress is a maximum [144, 145]; thus, the introduction of compressive residual stress might reduce hydrogen embrittlement. However, it has been reported that the conventional way to introduce compressive residual stress, i.e., shot peening, did not suppress hydrogen embrittlement and, moreover, was detrimental [146]. Another report revealed that shot peening plays a dual role in hydrogen embrittlement [147], in that shot peening reduces the hydrogen diffusion coefficient and also enhances hydrogen induced cracking. These effects might be due to increases in the sur-face roughness and/or the dislocation density induced by shot peening. In the case of cavitation peening, the surface roughness scarcely increases, as there are no collisions between solid materials. Cavitation peening can introduce compressive residual stress while relieving the micro strain as mentioned above [100]. Therefore, cavitation peening can suppress hydrogen embrittlement.
In order to demonstrate the suppression of hydrogen embrittlement by cavi-tation peening, Fig. 34 shows the crack length 2a as a function of the number of cycles N for non-peened and cavitation peened specimens with and without hydrogen charging [148]. Test specimens made of stainless steel SUS316L with a precrack were tested using a plate bending fatigue tester with bending stress σa = 300 MPa. The specimens were treated using a cavitating jet in air with d = 1 mm and p1 = 30 MPa. The number of cycles to failure Nf of the non-peened specimen was 4.11 × 10⁴ for the specimen charged with hydrogen and 6.70 × 10⁴ for the specimen not charged with hydrogen. Thus, Nf of the non-peened specimen charged with hydrogen was considerably reduced, as the sec-ondary cracks of the specimen combined, as shown in the figure on the upper left-hand side of Fig. 34. On the other hand, Nf of the cavitation peened speci-men was 1.23 × 10⁵ for the specimen charged with hydrogen and 1.20 × 10⁵ for the specimen not charged with hydrogen. For both cavitation peened speci-mens, the cracks grew stably as shown in the figure on the upper right-hand side of Fig. 34, and Nf of the specimens with and without hydrogen are nearly equal. The Nf of the specimen charged with hydrogen increased by a factor of about three after cavitation peening. Consequently, cavitation peening can suppress hydrogen embrittlement in stainless steel SUS316L.
In order to investigate the mechanism for the suppression of hydrogen embrittlement by cavitation peening, hydrogen invasion of a specimen was measured by thermal deposition analysis (TDA) using gas chromatography [149] and secondary ion mass spectrometry (SIMS) [150]. In both these

48 HitosHi soyama
reports, the material under test was stainless steel SUS316L, the same as the material used for the data in Fig. 34. Cavitation peened and non-peened spec-imens were charged with hydrogen by cathodic electro-charging. By evaluat-ing hydrogen invasion by both TDA and SIMS, suppression of hydrogen invasion by cavitation peening was found to be proportional to the amount of compressive residual stress with respect to depth introduced by cavitation peening [149, 150]. As is well known, compressive residual stress causes crack closure which mitigates the stress concentration around the crack tip [151, 152], that is, the main mechanism for the suppression of hydrogen embrittlement by cavitation peening is the mitigation of hydrogen invasion by introducing compressive residual stress.
5.6. Improvement of Resistance to Delayed FractureDelayed fracture [153] is also a big problem for safety and the reliability of high strength steel [154]. Since a key factor in delayed fracture is the pres-ence of hydrogen [155-157], cavitation peening can improve the resistance to delayed fracture. Figure 35 shows the relationship between the tensile stress
FIGURE 34 Suppression of hydrogen embrittlement in stainless steel by cavitating in AIR (d = 1 mm, p1 = 30 MPa)

Key Factors and applications oF cavitation peening 49
st applied to a steel bolt and the time to failure tf [158]. The bolt under test was a commercially available M8 with a 1.25 mm pitch screw made of chrome molybdenum steel. In order to examine the delayed fracture of a bolt associ-ated with hydrogen, a delayed fracture test was conducted under a constant load after hydrogen charging. In order to concentrate the cavitation peening on the bolt surface, the cavitation conditions chosen were d = 2 mm, p1 = 30 MPa, and p2 = 0.42 MPa. The threshold stress for delayed fracture sth is defined as the tensile stress σt at which the bolt had not fractured within 24 hours. Without hydrogen charging, the bolt fractured at σt ≈ 910 MPa. On the other hand, σth of a non-peened bolt with hydrogen charging was 327 ± 22 MPa. When the bolt was treated by cavitation peening, σth with hydrogen charging was 426 ± 21 MPa for tp = 1 s/mm, 455 ± 11 MPa for tp = 2 s/mm and 505 ± 42 MPa for tp = 6 s/mm, demonstrating that the threshold stress increases with increasing processing time per unit length. The residual stress at the bottom of the thread was -269 ± 55 MPa for the non-peened bolt, -205 ± 2 MPa for tp = 1 s/mm, -187 ± 6 MPa for tp = 2 s/mm and -198 ± 6 MPa for tp = 6 s/mm, showing that cavitation peening improves the resistance to delayed fracture by introducing compressive residual stress.
FIGURE 35 Improvement in the delayed fracture resistance on chrome molybdenum steel bolt (d = 2 mm, p1 = 30 MPa, p2 = 0.42 MPa)

50 HitosHi soyama
6. CONCLUSIONS
In order to obtain better peening effects without damage to the surface by cavitation peening, the principal and key factors of cavitation peening were reviewed, especially in order to understand the differences between cavita-tion peening and water jet peening. In this review, cavitation peening refers to peening methods that use cavitation impacts, and water jet peening refers to peening methods using impacts due to small water masses and/or shot in the water jet. The key points can be summarized as follows:
1. For cavitation peening at a constant downstream pressure, a cavitating jet with a relatively low injection pressure and a large nozzle is better than that with high injection pressure and a small nozzle.
2. Cavitation peening and water jet peening can be classified according to Eq. (23) which is modified from Eq. (10).
s dopt = −1 8 0 6. .σ (23)
3. Here, sopt is the distance from the nozzle to the treated surface, d is the nozzle diameter and σ is the cavitation number. When the distance is smaller than sopt in Eq. (23), the peening mechanism is water jet peening, while if it is larger it is cavitation peening.
4. The key factors in cavitation peening, which affect the aggressive inten-sity of the cavitating jet, are the type of cavitating jet, the standoff dis-tance, the nozzle geometry, the cavitation number, the processing speed, the nozzle throat diameter, the injection pressure, the tank pressure, the water temperature and the depth of water above the nozzle.
5. The relative aggressive intensity of a cavitating jet can be estimated from a reference intensity by substituting the cavitation number, nozzle throat diameter and injection pressure in Eq. (20).
6. Cavitation peening is beneficial for the mechanical treatment of surfaces in order to improve the fatigue strength, the fretting fatigue strength, and the yield strength, and for suppressing hydrogen embrittlement and improving the resistance to delayed fracture.
NOMENCLATURES
a crack length c proportional constant

Key Factors and applications oF cavitation peening 51
c1 constant c2 ratio of frequency of weak impacts to intense impacts cd discharge coefficient d nozzle throat diameter Dn torque da/dN crack propagation rate de equivalent nozzle diameter dw water depthER erosion rate f shedding frequency of cavitation cloudf(σ) function of cavitation number h arc heighthsat1 saturation arc height caused by weak impactshsat2 saturation arc height caused by intense impactsIcav aggressive intensity of cavitating jet Icav est estimated value of aggressive intensity of cavitating jet Icav ref aggressive intensity of cavitating jet at reference condition Kn function depending on the shape of the nozzle and/or test section L size Lcav cavitating lengthN number of cycles Nf number of cycles to failure n power law exponentnd power law exponent for nozzle throat diameter np power law exponent for injection pressure P applied loadp pressure p1 upstream pressure of nozzle, injection pressurep2 downstream pressure of nozzle p2 opt optimum downstream pressure of nozzle pmax maximum pressure at jet center pv vapor pressure pv’ pseudo vapor pressure
ref subscript for reference conditions s standoff distance from nozzle to target surface St Strouhal number sopt optimum standoff distance t exposure time to the jet tD development time of a bubble tf time to failure tp processing time per unit length Tw water temperature U velocity at nozzle exitVcav volume of cavitation

52 HitosHi soyama
VB max maximum volume of the bubble v flow velocity w maximum diameter of cavitating jet DK stress intensity factor range DKth threshold stress intensity factor range Dm mass loss Dp pressure differenceδ depth from surface δD displacement σ cavitation number σa amplitude of bending stressσR residual stressσs shift of cavitation number σt tensile stress σth threshold stress of delayed fracture σy yield stress ρ radius of curvature ρL density of liquid
7. ACKNOWLEDGEMENTS
The author’s work on cavitation peening was partly supported by the Japa-nese Society for the Promotion of Science 17H03138, Ministry of Economy, Trade and Industry, and the Osawa Scientific Studies Grants Foundation.
REFERENCES
[1] Brennen, C. E. Cavitation and Bubble Dynamics: Oxford University Press. 1995. [2] Soyama, H. Surface Modification of Metallic Materials by Cavitation Peening. Materia
Japan, 45 (2006), 657-663. [3] Han, B., Ju, D. Y. and Jia, W. P. Influence of Water Cavitation Peening with Aeration on
Fatigue Behaviour of SAE1045 Steel. Applied Surface Science, 253 (2007), 9342-9346. [4] Toh, C. K. The Use of Ultrasonic Cavitation Peening to Improve Micro-Burr-Free
Surfaces. International Journal of Advanced Manufacturing Technology, 31 (2007), 688-693.
[5] Soyama, H., Saito, K. and Saka, M. Improvement of Fatigue Strength of Aluminum Alloy by Cavitation Shotless Peening. Journal of Engineering Materials and Technology, 124 (2002), 135-139.
[6] Daniewicz, S. R. and Cummings, S. D. Characterization of a Water Peening Process. Jour-nal of Engineering Materials and Technology, 121 (1999), 336-340.
[7] Ramulu, M., Kunaporn, S., Arola, D., Hashish, M. and Hopkins, J. Waterjet Machining and Peening of Metals. Journal of Pressure Vessel Technology, 122 (2000), 90-95.
[8] Rajesh, N., Veeraraghavan, S. and Babu, N. R. A Novel Approach for Modelling of Water Jet Peening. International Journal of Machine Tools & Manufacture, 44 (2004), 855-863.

Key Factors and applications oF cavitation peening 53
[9] Blickwedel, H., Haferkamp, H., Louis, H. and Tai, P. T., (1987). Modification of Material Structure by Cavitation and Liquid Impact and Their Influence on Mechanical Properties. Proceedings of 7th International Conference on Erosion by Liquid and Solid Impact, pp. 31-1~31-6.
[10] Rawers, J. C., McCune, R. A. and Dunning, J. S. Ultrasound Treatment of Centrifugally Atomized 316 Stainless Steel Powders. Metallurgical Transactions A, 22A (1991), 3025-3033.
[11] Sano, Y., Obata, M., Kubo, T., Mukai, N., Yoda, M., Masaki, K. and Ochi, Y. Retardation of Crack Initiation and Growth in Austenitic Stainless Steels by Laser Peening without Protective Coating. Materials Science and Engineering A, 417 (2006), 334-340.
[12] Enomoto, K., Hirano, K., Mochizuki, M., Kurosawa, K., Saito, H. and Hayashi, E. Improvement of Residual Stress on Material Surface by Water Jet Peening. Journal of Society of Materials Society, Japan, 45 (1996), 734-739.
[13] Soyama, H., Yamauchi, Y., Ikohagi, T., Oba, R., Sato, K., Shindo, T. and Oshima, R. (1996). Marked Peening Effects by Highspeed Submerged-Water-Jets - Residual Stress Change on SUS304. Jet Flow Engineering, 13(1) (1996) 25-32.
[14] Hirano, K., Enomoto, K., Hayashi, E. and Kurosawa, K. (1996). Effect of Water Jet Peen-ing on Corrosion Resistance and Fatigue Strength of Type 304 Stainless Steel. Journal of Society of Materials Society, Japan, 45 (1996), 740-745.
[15] Oba, R., Ikohagi, T., Soyama, H., Yamauchi, Y., Sato, K., Shindo, T., Oshima, R. and Kurosawa, K. A Process Method Using a High Speed Water Jet. Japan Patent, 2878529, 1999.
[16] Saitou, N., Enomoto, K., Kurosawa, K., Morinaka, R., Hayashi, E., Ishikwa, T. and Yoshimura, T. Development of Water Jet Peening Technique for Reactor Internal Compo-nents of Nuclear Power Plant. Jet Flow Engineering 20(1) (2003), 4-12.
[17] Soyama, H., Kusaka, T. and Saka, M. Peening by the Use of Cavitation Impacts for the Improvement of Fatigue Strength. Journal of Materials Science Letters 20 (2001), 1263-1265.
[18] Odhiambo, D. and Soyama, H. Cavitation Shotless Peening for Improvement of Fatigue Strength of Carbonized Steel. International Journal of Fatigue 25 (2003), 1217-1222.
[19] Soyama, H. Method and Devices for Peening and Cleaning Metal Surface. US Patent, 6,855,208 B1. 2005.
[20] Soyama, H. Enhancing the Aggressive Intensity of a Cavitating Jet by Means of the Nozzle Outlet Geometry. Journal of Fluids Engineering 133(101301) (2011), 1-11.
[21] Soyama, H. Enhancing the Aggressive Intensity of a Cavitating Jet by Introducing a Cavita-tor and a Guide Pipe. Journal of Fluid Science and Technology 9(13-00238) (2014), 1-12.
[22] Soyama, H. Introduction of Compressive Residual Stress Using a Cavitating Jet in Air. Journal of Engineering Materials and Technology 126 (2004), 123-128.
[23] Soyama, H. High-Speed Observation of a Cavitating Jet in Air. Journal of Fluids Engi-neering 127 (2005) 1095-1108.
[24] Soyama, H., Kikuchi, T., Nishikawa, M. and Takakuwa, O. Introduction of Compressive Residual Stress into Stainless Steel by Employing a Cavitating Jet in Air. Surface and Coatings Technology 205 (2011), 3167-3174.
[25] Soyama, H. Surface Mechanics Design of Metallic Materials for Automotive Lightweight Technology. Proceedings of 1st International Conference on Modern Auto Technology and Services (MATS 2014) (2014), pp. 1-4.
[26] Marcon, A., Melkote, S. N., Castle, J., Sanders, D. G. and Yoda, M. Effect of Jet Velocity in Co-Flow Water Cavitation Jet Peening. Wear 360 (2016), 38-50.
[27] Sasoh, A., Watanabe, K., Sano, Y. and Mukai, N. Behavior of Bubbles Induced by the Interaction of a Laser Pulse with a Metal Plate in Water. Applied Physics A, Vol. 80 (2005), 1497-1500.
[28] Soyama, H. (2016). Mechanical Surface Treatment of Duralumin by Laser Abrasion and Laser Cavitation. Metal Finishing News 17(4) (2016), 56-59.
[29] Soyama, H. and Takakuwa, O. Enhancing the Aggressive Strength of a Cavitating Jet and Its Practical Application. Journal of Fluid Science and Technology 6 (2011), 510-521.

54 HitosHi soyama
[30] Soyama, H., Nagasaka, K., Takakuwa, O. and Naito, A. Optimum Injection Pressure of a Cavitating Jet for Introducing Compressive Residual Stress into Stainless Steel. Journal of Power and Energy Systems 6 (2012), 63-75.
[31] Futakawa, M., Naoe, T., Tsai, C. C., Kogawa, H., Ishikura, S., Ikeda, Y., Soyama, H. and Date, H. Pitting Damage by Pressure Waves in a Mercury Target. Journal of Nuclear Materials 343 (2005), 70-80.
[32] G134-95. Standard Test Method for Erosion of Solid Materials by a Cavitating Liquid Jet. ASTM standard 03.02 (2006), 1-14.
[33] Ley, S. V. and Low, C. M. R. Ultrasound in Synthesis. Berlin: Springer-Verlag. 1980. [34] Soyama, H., Uranishi, K., Ito, Y., Kato, H., Ichioka, T. and Oba, R. Hard-Erosion-Progress
in a Typical Centrifugal Pump (1st Report, Marked Effects of Upstream Cavitators). Tur-bomachinery 18 (1990), 691-698.
[35] rum, L. A. Surface Oscillations and Jet Development in Pulsating Bubbles. Journal de Physique Colloques 40 (1979), 285-288.
[36] Soyama, H., Okamura, T., Saito, S., Kato, H. and Oba, R. Observations of Severely Erosive Vortex Cavitation in a Centrifugal Pump. Transaction of the JSME, 59B (1993), 1140-1144.
[37] Soyama, H., Ohba, K., Takeda, S. and Oba, R. High-Speed Observations of Highly Erosive Vortex Cavitation around Butterfly Valve. Transaction of the JSME 60B (1994), 1133 - 1138.
[38] Reisman, G. E., Wang, Y. C. and Brennen, C. E. Observations of Shock Waves in Cloud Cavitation. Journal of Fluid Mechanics 355 (1998), 255-283.
[39] Soyama, H., Oba, R. and Kato, H. Cavitation Observations of Severely Erosive Vortex Cavitation Arising in a Centrifugal Pump. Proceedings of Institution of Mechanical Engi-neers, 3rd International Conference on Cavitation (1992), 103-110.
[40] Ohba, K., Soyama, H., Takeda, S., Inooka, H. and Oba, R. High-Speed Observations of Highly Erosive Vortex Cavitation Using Image Processing. Journal of Flow Visualization and Image Processing 2 (1995), 161-172.
[41] Ito, Y., Oba, R., Soyama, H., Ogata, H., Okamura, T., Sudo, S. and Ikeda, R. A Study on Cavitation-Scale-Effects, Especially with Respect to Cavitation-Induced Pressure-Pulses. Proceedings of International Symposium on Scale Modeling (1988), 141-146.
[42] Zhang, S. G., Duncan, J. H. and Chahine, G. L. The Final Stage of the Collapse of a Cavi-tation Bubble near a Rgid Wall. Journal of Fluid Mechanics, 257 (1993), 147-181.
[43] Kubota, A., Kato, H. and Yamaguchi, H. A New Modeling of Cavitating Flows - a Numer-ical Study of Unsteady Cavitation on a Hydrofoil Section. Journal of Fluid Mechanics 240 (1992), 59-96.
[44] Hammitt, F. G. Cavitation and Multiphase Flow Phenomena. New York: McGraw Hill. 1993. [45] Kato, H., Konno, A., Maeda, M. and Yamaguchi, H. Possibility of Quantitative Prediction
of Cavitation Erosion without Model Test. Journal of Fluids Engineering, 118 (1996), 582-588.
[46] Soyama, H. Scaling Effects on Cavitation Erosion Pits. Transaction of the JSME, 58B (1992), 3366 - 3372.
[47] Dominguez Cortazar, M. A., Franc, J. P. and Michel, J. M. The Erosive Axial Collapse of a Cavitating Vortex: An Experimental Study. Journal of Fluids Engineering 119 (1997), 686-691.
[48] Lichtarowicz, A. Use of a Simple Cavitating Nozzle for Cavitation Erosion Testing and Cutting. Nature-Physical Science 239 (1972), 63-64.
[49] Soyama, H., Yamauchi, Y., Adachi, Y., Sato, K., Shindo, T. and Oba, R. High-Speed Obser-vations of the Cavitation Cloud around a High-Speed Submerged Water-Jet. JSME Inter-national Journal 38B (1995), 245-251.
[50] Takakuwa, O. and Soyama, H. The Effect of Scanning Pitch of Nozzle for a Cavitating Jet during Overlapping Peening Treatment. Surface and Coatings Technology 206 (2012), 4756-4762.
[51] Hutli, E. A. F. and Nedeljkovic, M. S. Frequency in Shedding/Discharging Cavitation Clouds Determined by Visualization of a Submerged Cavitating Jet. Journal of Fluids Engineering 130(021304) (2008), 1-8.

Key Factors and applications oF cavitation peening 55
[52] Nishimura, S., Takakuwa, O. and Soyama, H. Similarity Law on Shedding Frequency of Cavitation Cloud Induced by a Cavitating Jet. Journal of Fluid Science and Technology 7 (2012), 405-420.
[53] Soyama, H. Opposed Cavitating Jets and Their Application for Cavitation Peening of Wall Surrounding Hole. Proceedings of 23rd International Conference on Water Jetting, (2016), 201-208.
[54] Ogawa, M. Development and Commercialization of Advanced Cleaning System for Skin Pass Mill Work Roll, Type Cavitating Jet in Air : Realization of High-quality and High-productivity in Hot Dip Continuous Galvanizing Line. Nippon Steel & Sumikin Engineer-ing Co., Ltd. Technical Review 5 (2014), 14-20.
[55] Nakagawa, M. and Watanabe, T. Introducing Compressive Residual Stress on Metal Sur-faces by Irradiating Ultrasonic Wave with a Horn in Water : Surface Modification by Irra-diating Ultrasonic Wave in Liquid (Report 1). Quarterly Journal of Japan Welding Society 22 (2004), 587-594.
[56] G32-09, (2009). Standard Test Method for Cavitation Erosion Using Vibratory Appara-tus1. ASTM standard, Vol. 03.20, pp. 1-16.
[57] Sasaki, T., Yoshida, K., Nakagawa, M. and Yoshida, S. Effect of Horn Tip Geometry on Ultrasonic Cavitation Peening. Residual Stress, Thermomechanics & Infrared Imaging, Hybrid Techniques and Inverse Problems 9 (2016), 139-146.
[58] Kikukchi, K., Ahmed, S. M., Hiraiwa, T., Ito, Y. and Oba, R. An Indirect Vibratory Method Capable of Simulating Several Cavitating States. JSME International Journal, Series II 34 (1991), 1-8.
[59] Soyama, H., Comparison between Impact Induced by Abrasion and Bubble Collapse Impact on Laser Peening. Proceeding of Mechanica Engineering Congress, 16-1, paper No. G0400402 (2016), 1-5.
[60] Soyama, H., Lichtarowicz, A., Momma, T. and Williams, E. J. A New Calibration Method for Dynamically Loaded Transducers and Its Application to Cavitation Impact Measure-ment. Journal of Fluids Engineering 120 (1998), 712-718.
[61] Soyama, H., Sekine, Y. and Saito, K. Evaluation of the Enhanced Cavitation Impact Energy Using a PVDF Transducer with an Acrylic Resin Backing. Measurement 44 (2011), 1279-1283.
[62] Soyama, H., Sasaki, H., Endo, S. and Iga, Y. Mechanical Surface Treatment of Duralumin Plate by Bubble Induced by Pulse Laser. Journal of Physics: Conference Series 656 (2015), 1-4.
[63] Takata, T., Enoki, M., Chivavibul, P., Matsui, A. and Kobayashi, Y. Effect of Confinement Layer on Laser Ablation and Cavitation Bubble during Laser Shock Peening. Materials Transactions 57 (2016), 1776-1783.
[64] Ishiguro, T., Shimazaki, T., Terayama, K. and Yoneguchi, A. Effect of Hard Shot Peening with Water-Jet on Surface Residual-Stress Distribution of Carburized Steels. Tetsu to Hagane-Journal of the Iron and Steel Institute of Japan 80 (1994), 131-136.
[65] Naito, A., Takakuwa, O. and Soyama, H. Development of Peening Technique Using Recir-culating Shot Accelerated by Water Jet. Materials Science and Technology 28 (2012), 234-239.
[66] Momma, T. and Lichtarowicz, A. A Study of Pressure and Erosion Produced by Collaps-ing Cavitation. Wear 186 (1995), 425-436.
[67] Yamauchi, Y., Soyama, H., Adachi, Y., Sato, K., Shindo, T., Oba, R., Oshima, R. and Yam-abe, M. Suitable Region of High-Speed Submerged Water Jets for Cutting and Peening. JSME International Journal 38B (1995), 31-38.
[68] Lichtarowicz, A. Erosion Testing with Cavitating Jet Proceedings of Cavitation Erosion in Fluid Systems, ASME Fluids Engineering Conference (1981) 153-161.
[69] Soyama, H. and Lichtarowicz, A. Cavitating Jets - Similarity Correlations. Jet Flow Engi-neering 13(2) (1996), 9-19.
[70] Soyama, H. Surface Mechanics Design of Metallic Materials on Mechanical Surface Treatments, Mechanical Engineering Reviews, 2(14-00192) (2015), 1-20.

56 HitosHi soyama
[71] Donaldson, C. D., Snedeker, R. S. and Margolis, D. P. A Study of Free Jet Impingement, Part 2 Free Jet Turbulent Structure and Impingement Heat Transfer Journal of Fluid Mechanics 45 (1971), 477-512.
[72] Yahiro, T. and Yoshida, H. On the Characteristics of High Speed Water Jet in Liquid and Its Utilization of Induction Grouting Method. Proceedings of 2nd International Symposium on Jet Cutting Technology (1974), 41-63.
[73] Soyama, H. (2015). Criterion on Mechanical Surface Treatment Using a Submerged Water Jet between Cavitation Peening and Water Jet Peening. Jet Flow Engineering 31(2) (2015), 1-8.
[74] Soyama, H. Corrosion Behavior of Pressure Vessel Steel Exposed to Residual Bubbles after Cavitation Bubble Collapse. Corrosion 67(025001) (2011), 1-8.
[75] Soyama, H. Effect of Nozzle Diameter on Plastic Deformation Aggressivity of a Cavitat-ing Jet. Proceedings of Symposium on Multiphase Flow 2015(D112) (2015), 1-2.
[76] Soyama, H., Nishizawa, K. and Mikami, M. (2009). Comparison of Abilities of Various Cavitating Jets. 9th Pacific Rim International Conference on Water Jetting Technology, pp. 133-137.
[77] Soyama, H. and Moriya, T. Evaluation of Aggressive Intensity of a Cavitating Jet by Means of Peen Forming. Proceeding of Annual Meeting for Water Jet Technology (2014), 49-56.
[78] Soyama, H. Effect of Nozzle Geometry on a Standard Cavitation Erosion Test Using a Cavitating Jet. Wear 297 (2013), 895-902.
[79] Johnson, V. E., Chahine, G. L., Lindenmuth, W. T., Conn, A. F., Frederick, G. S. and Giacchino, G. J. Cavitating and Structured Jets for Mechanical Bits to Increase Drilling Rate, 1. Tehory and Concepts. Journal of Energy Resources Technology 106 (1984), 282-288.
[80] Chahine, G. L., Johnson, J., V.E., Kalumuck, K. M., Perdue, T. O., Waxman, D. N., Fred-erick, G. S. and Watson, R. E. (1987). Internal and External Acoustics and Large Structure Dynamics of Cavitating Self-Resonating Water Jets. Sandia National Laboratories, Con-tractor Report, Vol. SAND86-7176, pp. 1-202.
[81] Terasaki, N., Fujikawa, S., Takasugi, N. and Sugino, Y., (1999). A Study of Cavitation Control in Submerged Water Jet. Transactions of the JSME, Vol. 65B, pp. 1921-1926.
[82] Soyama, H. Material Testing and Surface Modification by Using Cavitating Jet. Journal of Society of Materials Science, Japan 47 (1998), 381-387.
[83] Shimizu, S., Tanioka, K. and Ikegami, N. Erosion Due to Ultra-High-Speed Cavitating Jet. Journal of Japan Hydraulics & Pneumatics Society 28 (1997), 778-784.
[84] Soyama, H., Takakuwa, O. and Naito, A., (2012). Effect of Nozzle Shape for High Injec-tion Pressure on Aggressivity of Cavitating Jet. Proceeding of 21st International Confer-ence on Water Jetting, pp. 367-378.
[85] Soyama, H. and Hoshino, J. (2016). Enhancing the Aggressive Intensity of Hydrodynamic Cavitation through a Venturi Tube by Increasing the Pressure in the Region Where the Bubbles Collapse. AIP Advances 6(045113), 1-13.
[86] Naito, A., Takakuwa, O. and Soyama, H. Effect of the Pressure of a Field at Cavitation Bubble Collapsing on Cavitation Peening. Proceedings of Annual Meeting of Tohoku Branch, JSME (2012), 64-65.
[87] Soyama, H. and Mikami, M. Evaluation of Aggressive Intensity of a Cavitating Jet by Arc Height of Almen Strip. Proceedings of Annual Meeting for Water Jet Technology (2015), 49-52.
[88] Soyama, H., Park, J. D. and Saka, M. Use of cavitating jet for introducing compressive residual stress. Journal of Manufacturing Science and Engineering-Transactions of the ASME, 122(2000), 83-89.
[89] Soyama, H., (2012). Power Law of Injection Pressure and Nozzle Diameter on Aggressive Intensity of a Cavitating Jet. Proceedings 21st International Conference on Water Jetting, pp. 343-354.
[90] Demma, A. and Frederick, G. Program on Technology Innovation: An Evaluation of Sur-face Stress Improvement Technologies for PWSCC Mitigation of Alloy 600 Nuclear Com-ponents. Materials Reliability Program MRP-162 (2006), 1-104.

Key Factors and applications oF cavitation peening 57
[91] Soyama, H. Main Factors of Material Testing and Surface Modification by Using Cavitat-ing Jet. Journal of Jet Flow Engineering 15 (1998), 31-37.
[92] Plesset, M. S. Temperature Effects in Cavitation Damage. Journal of Basic Engineering 94 (1972), 559-563.
[93] Singer, B. G. and Harvey, S. J., (1979). Gas Content and Temperature Effects in Vibratory Cavitation Tests. Wear 52, 147-160.
[94] Iwai, Y., Okada, T. and Hammitt, F. G. Effect of Temperature on the Cavitation Erosion of Cast-Iron. Wear 85 (1983), 181-191.
[95] Kwok, C. T., Man, H. C. and Leung, L. K. Effect of Temperature, pH and Sulphide on the Cavitation Erosion Behaviour of Super Duplex Stainless Steel. Wear 211 (1997), 84-93.
[96] Hutli, E. A. F., Nedeljkovic, M. S. and Radovic, N. A. Mechanics of Submerged Jet Cavi-tating Action: Material Properties, Exposure Time and Temperature Effects on Erosion. Archive of Applied Mechanics 78 (2008), 329-341.
[97] Hattori, S., Goto, Y., Fukuyama, T., Yagi, Y. and Murase, M. (2005). Influence of Tem-perature on Erosion by a Cavitating Liquid Jet. Transactions of the JSME 71A (2005), 1081-1087.
[98] Soyama, H., Takano, Y. and Ishimoto, M. Peening of Forging Die by Cavitation. Technical Review of Forging Technology Institute of Japan 25 (2000), 53-57.
[99] Sekine, Y. and Soyama, H. Surface Modification of Alloy Tool Steel for Forging Dies by Cavitation Peening. Review of Automotive 30 (2009), 393-399.
[100] Soyama, H. and Yamada, N. Relieving Micro-Strain by Introducing Macro-Strain in a Polycrystalline Metal Surface by Cavitation Shotless Peening. Materials Letters 62, (2008), 3564-3566.
[101] Takakuwa, O., Chiba, A. and Soyama, H. Movement of Dislocations in the Sub-Surface of a Polycrystalline Metal by Cavitation Peening Observed by Transmission Electron Microscopy. Materials Sciences and Applications 6 (2015), 140-144.
[102] Soyama, H., Macodiyo, D. O. and Mall, S. Compressive Residual Stress into Titanium Alloy Using Cavitation Shotless Peening Method. Tribology Letters 17 (2004), 501-504.
[103] Okada, T., Hattori, S. and Shimizu, M. A Fundamental-Study of Cavitation Erosion Using a Magnesium-Oxide Single Crystal (Intensity and Distribution of Bubble Collapse Impact Loads) Wear 186 (1995), 437-443.
[104] Soyama, H., Osada, K. and Saka, M. Numerical Simulation on Introduction of Compres-sive Residual Stress by Cavitation Impact. Preprint of Japan Society of Mechanical Engi-neers, (991-2), (1999), 51-52.
[105] Soyama, H. Improvement of Fatigue Strength by Using Cavitating Jets in Air and Water. Journal of Materials Science 42 (2007), 6638-6641.
[106] Fukuda, S., Matsui, K., Ishigami, H. and Ando, K. Cavitation Peening to Improve the Fatigue Strength of Nitrocarburized Steel. Fatigue & Fracture of Engineering Materials & Structures 31 (2008), 857-862.
[107] Soyama, H. The Use of Cavitation Peening to Increase the Fatigue Strength of Duralumin Plates Containing Fastener Holes. Materials Sciences and Applications 5 (2014), 430-440.
[108] Soyama, H. and Takeo, F. Comparison between Cavitation Peening and Shot Peening for Extending the Fatigue Life of a Duralumin Plate with a Hole. Journal of Materials Pro-cessing Technology 227 (2016), 80-87.
[109] Takakuwa, O., Takeo, F., Sato, M. and Soyama, H. Using Cavitation Peening to Enhance the Fatigue Strength of Duralumin Plate Containing a Hole with Rounded Edges. Surface and Coatings Technology 307 (2016), 200-205.
[110] Soyama, H. and Miyamoto, N. Improvement of Fatigue Strength of Light Metallic Materi-als by Cavitation Peening. Proceedins of 1st International Workshop on Cavitation Peening and Related Phenomena (5038-4) (2015) 1-2.
[111] Sato, M., Takakuwa, O., Nakai, M., Niinomi, M., Takeo, F. and Soyama, H. Using Cavita-tion Peening to Improve the Fatigue Life of Titanium Alloy Ti-6Al-4V Manufactured by Electron Beam Melting. Materials Sciences and Applications 7 (2016), 181-191.
[112] Little, R. E. Estimating the Median Fatigue Limit for Very Small Up-and-Down Quantal Response Tests and for S-N Data with Runouts. ASTM STP 511 (1972), 29-42.

58 HitosHi soyama
[113] E647-13. Standard Test Method for Measurement of Fatigue Crack Growth Rates ASTM standard 03.01 (2013), 1-48.
[114] Takakuwa, O., Sanada, K. and Soyama, H. Evaluation of Fatigue Crack Propagation in Surface Modification Layer by a Load-Controlled Plate Bending Fatigue Tester. Transac-tions of the JSME 80A(smm0022) (2014), 1-17.
[115] Soyama, H. Evaluation of Crack Initiation and Propagation of Stainless Steel Treated by Cavitating Peening Using a Load Controlled Plate Bending Fatigue Tester. Metal Finish-ing News 15(4) (2014), 60-62.
[116] Soyama, H., Shimizu, M., Hattori, Y. and Nagasawa, Y. Improving the Fatigue Strength of the Elements of a Steel Belt for CVT by Cavitation Shotless Peening. Journal of Materials Science 43 (2008), 5028-5030.
[117] Seki, M., Soyama, H., Fujii, M. and Yoshida, A. Rolling Contact Fatigue Life of Cavita-tion-Peened Steel Gear. Tribology Online 3 (2008), 116-121.
[118] Soyama, H. and Sekine, Y. Sustainable Surface Modification Using Cavitation Impact for Enhancing Fatigue Strength Demonstrated by a Power Circulating-Type Gear Tester. International Journal of Sustainable Engineering 3 (2010), 25-32.
[119] Soyama, H. Improvement of Fatigue Strength of Elastic Ring for Planetary Traction Drive Unit by Cavitation Peening. Proceedins of 1st International Workshop on Cavitation Peen-ing and Related Phenomena (5038-5) (2015), 1-2.
[120] Lee, H., Mall, S. and Soyama, H. Fretting Fatigue Behavior of Cavitation Shotless Peened Ti–6Al–4V. Tribology Letters 36 (2009), 89-94.
[121] Takakuwa, O., Nakai, M., Narita, K., Niinomi, M., Hasegawa, K. and Soyama, H. Enhanc-ing the Durability of Spinal Implant Fixture Applications Made of Ti-6Al-4V ELI by Means of Cavitation Peening. International Journal of Fatigue 92 (2016), 360-367.
[122] Niinomi, M. Recent Metallic Materials for Biomedical Applications. Metallurgical and Materials Transactions A 33 (2002), 477-486.
[123] F1717-15, Standard Test Methods for Spinal Implant Constructs in a Vertebrectomy Model. ASTM standard 13.01 (2015), 1-21.
[124] Liu, D. X., Tang, B., Zhu, X. D., Chen, H., He, J. W. and Celis, J. P. Improvement of the Fretting Fatigue and Fretting Wear of Ti6A14V by Duplex Surface Modification. Surface & Coatings Technology 116 (1999), 234-238.
[125] Kumar, S. A., Sundar, R., Raman, S. G. S., Kumar, H., Gnanamoorthy, R., Kaul, R., Ran-ganathan, K., Oak, S. M. and Kukreja, L. M. Fretting Wear Behavior of Laser Peened Ti-6Al-4V. Tribology Transactions 55 (2012), 615-623.
[126] Takakuwa, O., Nishikawa, M. and Soyama, H. Technique for Partially Strengthening Elec-trical Steel Sheet of IPM Motor Using Cavitation Peening. Materials Science and Technol-ogy 27 (2011), 1422-1426.
[127] Morimoto, S., Sanada, M. and Takeda, Y. Wide-Speed Operation of Interior Permanent-Magnet Synchronous Motors with High-Performance Current Regulator. IEEE Transac-tions on Industry Applications 30 (1994), 920-926.
[128] Tabor, D. The Physical Meaning of Indentation and Scratch Hardness. British Journal of Applied Physics 7 (1956), 159-166.
[129] Oliver, W. C. and Pharr, G. M. An Improved Technique for Determining Hardness and Elastic-Modulus Using Load and Displacement Sensing Indentation Experiments. Journal of Materials Research 7 (1992),1564-1583.
[130] Suresh, S. and Giannakopoulos, A. E. A New Method for Estimating Residual Stresses by Instrumented Sharp Indentation. Acta Materialia 46 (1998), 5755-5767.
[131] Mesarovic, S. D. and Fleck, N. A. Spherical Indentation of Elastic-Plastic Solids. Pro-ceedings of the Royal Society A 455 (1999), 2707-2728.
[132] Futakawa, M., Wakui, T., Tanabe, Y. and Ioka, I. Identification of the Constitutive Equation by the Indentation Technique Using Plural Indenters with Different Apex Angles. Journal of Materials Research 16 (2001), 2283-2292.
[133] Dao, M., Chollacoop, N., Van Vliet, K. J., Venkatesh, T. A. and Suresh, S. Computational Modeling of the Forward and Reverse Problems in Instrumented Sharp Indentation. Acta Materialia 49 (2001), 3899-3918.

Key Factors and applications oF cavitation peening 59
[134] Greer, J. R., Oliver, W. C. and Nix, W. D. Size Dependence of Mechanical Properties of Gold at the Micron Scale in the Absence of Strain Gradients. Acta Materialia 53 (2005), 1821-1830.
[135] Zhao, M. H., Ogasawara, N., Chiba, N. and Chen, X. A New Approach to Measure the Elastic-Plastic Properties of Bulk Materials Using Spherical Indentation. Acta Materialia 54 (2006), 23-32.
[136] Yan, J., Karlsson, A. M. and Chen, X. Determining Plastic Properties of a Material with Residual Stress by Using Conical Indentation. International Journal of Solids and Struc-tures 44 (2007), 3720-3737.
[137] Nishikawa, M., Kawaragi, Y. and Soyama, H. A Method to Identify the Yield Stress of Metals Using Micro-Indentation Tests with a Spherical Indenter. Transaction of the JSME 76A (2010), 1781-1788.
[138] Nishikawa, M. and Soyama, H. Two-Step Method to Evaluate Equibiaxial Residual Stress of Metal Surface Based on Micro-Indentation Tests. Materials & Design 32 (2011), 3240-3247.
[139] Nishikawa, M., Takakuwa, O. and Soyama, H. Evaluation of Yield Stress Distribution in the Surface Layer and Fatigue Properties of the Stainless Steel Modified by Cavitation Peening. Transaction of the JSME 76A (2010), 1367-1372.
[140] Johnson, W. H. On Some Remarkable Changes Produced in Iron and Steel by the Action of Hydrogen and Acids. Proceedings of the Royal Society of London 23 (1874), 168-179.
[141] Beachem, C. D. New Model for Hydrogen-Assisted Cracking (Hydrogen Embrittlement). Metallurgical Transactions 3 (1972), 441-455.
[142] Oriani, R. A. and Josephic, P. H. Equilibrium Aspects of Hydrogen-Induced Cracking of Steels. Acta Metallurgica 22 (1974), 1065-1074.
[143] Dadfarnia, M., Nagao, A., Wang, S., Martin, M. L., Somerday, B. P. and Sofronis, P. Recent Advances on Hydrogen Embrittlement of Structural Materials. International Jour-nal of Fracture 196 (2015), 223-243.
[144] Sofronis, P. and McMeeking, R. M. Numerical-Analysis of Hydrogen Tranport near a Blunting Crack Tip. Journal of the Mechanics and Physics of Solids 37 (1989), 317-350.
[145] Yokobori, A. T., Chinda, Y., Nemoto, T., Satoh, K. and Yamada, T. The Characteristics of Hydrogen Diffusion and Concentration around a Crack Tip Concerned with Hydrogen Embrittlement. Corrosion Science 44 (2002), 407-424.
[146] A. M. Brass, J. Chêne, G. Anteri, J. Ovejero-Garcia and Castex, L. Role of Shot-Peening on Hydrogen Embrittlement of a Low-Carbon Steel and a 304 Stainless Steel. Journal of Materials Science 26 (1991), 4517-4526.
[147] Li, X. F., Zhang, J., Wang, Y. F., Ma, M. M., Shen, S. C. and Song, X. L. The Dual Role of Shot Peening in Hydrogen-Assisted Cracking of PSI31080 High Strength Steel. Materials & Design 110 (2016), 602-615.
[148] Takakuwa, O. and Soyama, H. Suppression of Hydrogen-Assisted Fatigue Crack Growth in Austenitic Stainless Steel by Cavitation Peening. International Journal of Hydrogen Energy 37 (2012), 5268-5276.
[149] Takakuwa, O., Mano, Y. and Soyama, H. Suppression of Hydrogen Invasion into Austen-itic Stainless Steel by Means of Cavitation Peening. Transactions of the JSME 81(14-00638) (2015), 1-13.
[150] Takakuwa, O. and Soyama, H., (2016). Preventing Hydrogen Diffusion in Stainless Steel by Cavitating Jet in Air. Proceedings of 23rd International Conference on Water Jetting, pp. 215-221.
[151] Kang, K. J., Song, J. H. and Earmme, Y. Y. Fatigue Crack-Growth and Closeure Behavior through a Compressive Residual-Stress Field. Fatigue & Fracture of Engineering Materi-als & Structures 13 (1990), 1-13.
[152] Lados, D. A., Apelian, D. and Donald, J. K. Fracture Mechanics Analysis for Residual Stress and Crack Closure Corrections. International Journal of Fatigue 29 (2007) 687-694.
[153] Petch, N. J. and Stables, P. Delayed Fracture of Metals under Static Load. Nature 169 (1952), 842-843.

60 HitosHi soyama
[154] Yamasaki, S. and Takahashi, T. Evaluation Method of Delayed Fracture Property of High Strength Steels. Tetsu to Hagane-Journal of the Iron and Steel Institute of Japan 83 (1997), 454-459.
[155] Kushida, T., Matsumoto, H., Kuratomi, N., Tsumura, T., Nakasato, F. and Kudo, T. Delayed Fracture and Hydrogen Absorption of 1.3GPa Grade High Strength Bolt Steel. Tetsu to Hagane-Journal of the Iron and Steel Institute of Japan 82 (1996), 297-302.
[156] Nagumo, M. Hydrogen Related Failure of Steels - a New Aspect. Materials Science and Technology 20 (2004), 940-950.
[157] So, K. H., Kim, J. S., Chun, Y. S., Park, K. T., Lee, Y. K. and Lee, C. S. Hydrogen Delayed Fracture Properties and Internal Hydrogen Behavior of a Fe-18Mn-1.5Al-0.6C TWIP Steel. ISIJ International 49 (2009), 1952-1959.
[158] Kumagi, N., Takakuwa, O. and Soyama, H. Improvement of Delayed Fracture Resistance on Chrome Molybdenum Steel Bolt by Cavitation Peening. Transactions of the JSME 82(16-00111) (2016), 1-13.


![The Use of Cavitation Peening to Increase the Fatigue ...bubbles collapse [6], known as “cavitation shotless peening” or “cavitation peening”, have previously been pro-H. Soyama](https://static.fdocuments.net/doc/165x107/5e8fb1f9b407883977573f53/the-use-of-cavitation-peening-to-increase-the-fatigue-bubbles-collapse-6.jpg)