Key Exploration Highlights
24
ABN 91 124 752 745 Registered Office: Suite 8, 7 The Esplanade, Mt Pleasant, Western Australia 6153 Tel: (08)9316 9100 • Fax: (08)9315 5475 • Web: www.gbmr.com.au Exploration Office: 10 Parker Street, Castlemaine, Victoria 3450 Tel: (03) 5470 5033 ASX Announcement 31 January 2013 REPORT FOR THE QUARTER ENDED 31 st DECEMBER 2012 Key Exploration Highlights Milo IOCG-REE - Scoping Study confirms a positive and robust economic outcome Supports a decision to progress to pre-feasibility stage and to maintain ongoing exploration of the Milo ore body. Long Term Base Case indicates a net cash flow of $701 million over an 11 year mine life. Upside Case has a net cash flow of $1,160 million over the same mine life. Milo has the potential to become a mid-tier producer of rare earth oxide products with key credits for copper, phosphate and uranium. Average annual production of key commodities is estimated to be: 3,500 t of TREEYO products, 5,300 t of copper, 173,000 t of phosphate P 2 0 5 (35%) and 927,000 lbs. of uranium U 3 O 8 . Significant exploration upside a major highlight with strong opportunity to improve on economics through ongoing exploration and mineral recoveries. Maiden Milo inferred resource of 88 Mt containing 97,000 tonnes of Copper and 14 million lbs of Uranium Oxide, adding significantly to Milo’s value. Milo now one of the largest undeveloped Uranium deposits in Queensland. High value rare earth elements which have been identified as likely to be in critical undersupply, comprise 24% of the Total Rare Earth Elements and Yttrium Oxide (TREEYO’s) identified to date. GBM to investigate and progress Milo development funding opportunities in 2013.
Transcript of Key Exploration Highlights

ABN 91 124 752 745
Registered Office: Suite 8, 7 The Esplanade, Mt Pleasant, Western Australia 6153 Tel: (08)9316 9100 • Fax: (08)9315 5475 • Web: www.gbmr.com.au
Exploration Office: 10 Parker Street, Castlemaine, Victoria 3450 Tel: (03) 5470 5033
ASX Announcement 31 January 2013
REPORT FOR THE QUARTER ENDED 31st DECEMBER 2012
Key Exploration Highlights Milo IOCG-REE - Scoping Study confirms a positive and robust economic outcome Supports a decision to progress to pre-feasibility stage and to maintain ongoing exploration
of the Milo ore body.
Long Term Base Case indicates a net cash flow of $701 million over an 11 year mine life. Upside Case has a net cash flow of $1,160 million over the same mine life.
Milo has the potential to become a mid-tier producer of rare earth oxide products with key credits for copper, phosphate and uranium.
Average annual production of key commodities is estimated to be: 3,500 t of TREEYO products, 5,300 t of copper, 173,000 t of phosphate P205 (35%) and 927,000 lbs. of uranium U3O8.
Significant exploration upside a major highlight with strong opportunity to improve on economics through ongoing exploration and mineral recoveries.
Maiden Milo inferred resource of 88 Mt containing 97,000 tonnes of Copper and 14 million lbs of Uranium Oxide, adding significantly to Milo’s value.
Milo now one of the largest undeveloped Uranium deposits in Queensland.
High value rare earth elements which have been identified as likely to be in critical undersupply, comprise 24% of the Total Rare Earth Elements and Yttrium Oxide (TREEYO’s) identified to date.
GBM to investigate and progress Milo development funding opportunities in 2013.

Pan Pacific/Mitsui Farm-in Projects NW Queensland Exploration work continues to show promise at Pan Pacific Copper/ Mitsui Farm-in Projects.
Mount Margaret West Project:
Drillhole within 4km of the Ernest Henry pit intersected a broad interval over 550 metres of ‘halo’ copper mineralisation adjacent to magnetic anomaly.
Geophysical survey ( MT) defines two large conductivity anomalies beneath a zone of gold mineralisation which was intersected in historic drilling within FC4 South. Historic drilling in this area has intersected high gold values of up to 10.3g/t gold.
Bungalien Project:
A 3 hole drill program at Bronzewing Bore IOCG Prospect was completed.
Corporate
During the quarter the Company completed the first tranche of a share placement to a Singapore Consortium by the issue of 20,000,000 ordinary fully paid shares at 5 cents, raising $1,000,000 before costs of the issue.
At the Company’s AGM held on the 23rd November 2012 Shareholders approved the placement of the second tranche to place up to 19.9% of shares in the capital of the Company.
The second tranche provides the consortium with a 90 day option period to increase its holding to 19.9% of the company’s ordinary shares - which will be approximately 41.4 million shares at 5 cents per share - raising $2.1 million under the second tranche option. The second tranche option expires on 20th February 2013.
The company successfully completed the 70% acquisition of the Bungalien Phosphate rights from Swift Venture Holdings Corporation on 20 December 2012.
Figure: GBM Resources Project Location Plan.

SAFETY AND ENVIRONMENT No LTI, MTI or environmental incidents were reported during the quarter. The Company has now completed 18 consecutive months with no LTI’s and 62 consecutive months with no significant environmental incidents.
GBM is committed to maintain an incident free record and will continue to target zero injuries and environmental incidents in line with the Company’s policy of striving to achieve the highest standards in safety and environmental management.
In the Cloncurry area, GBM continues to maintain and enhance excellent relationships established over several years of activity with key landowners, while making significant progress with the remaining landholders. This progress has resulted in the signing of Conduct and Compensation agreements with most key landholders.
QUEENSLAND EXPLORATION ACTIVITIES Mount Isa Region Copper Gold Projects Brightlands Project, 100% GBM.
Completion of the Milo Scoping Study is a landmark achievement for GBM as this study clearly demonstrates the significant economic potential of the deposit. This study builds on the resource upgrade announced during the previous quarter. Significantly, there is potential to further increase resources via future testing of strong geochemical features, which were outlined in the September quarter. Milo IOCG and Rare Earth Project: The Milo Scoping Study (ASX release, 22nd November 2012) completed in 2012 demonstrates that the Milo IOCG REE deposit could support a viable mining operation based on the current resource, if developed. The scoping study is the initial stage of developing a complete economic and mining model for the deposit and was undertaken at a relatively early stage of exploration to confirm the economic potential of the poly-metallic Milo deposit.
The in-depth study highlighted that Milo has the potential to become a mid-tier producer of rare earth oxide products with key credits for copper, phosphate and uranium.
Average annual production of key commodities is estimated to be: 3,500 t of TREEYO products, 5,300 t of copper, 173,000 t of phosphate P205 (35%) and 927,000 lbs. of uranium U3O8.
Uranium is a significant credit for the Milo Project, and the announcement on the 22nd of October 2012 by the Queensland State Government that it is moving to allow the recommencement of uranium mining is very significant for the project. The Milo inferred resource contains over 14 Mlbs of U3O8 making it one of the largest undeveloped uranium deposits in Queensland.
The scoping study has demonstrated clearly that development of the Milo deposit has the potential to create significant returns for shareholders. However, this scoping study should be viewed as the “stage 1” scenario for Milo. There remains significant exploration upside at Milo as it is at an early point in its exploration cycle and the project has strong potential for further significant resource growth and the delineation of higher grade zones with infill drilling.
The Scoping Study was completed by independent consultant Mining One Pty Ltd, supported by Geomodelling Ltd, which completed the resource estimation and Core Resources Pty Ltd, which developed a potential processing flow sheet, along with costs and recoveries based on the metallurgical test work to date. Based on the multi element resource the project will have a mine life in excess of ten years. The financial model key performance indicators (pre-tax) of the project are summarised in the table below.

Project KPIs
Long Term Base Case
Upside Case*
Net Cash after capital undiscounted ($M) $702 $1,160
Payback ( undiscounted) in years 4.4 2.9 Operating Margin ( EBIT/ Revenue) 33% 38% Operating Cost/ Revenue 67% 62%
Model Differences: Improved TREEYO plant recoveries 60% 70%
TREEYO Price $75/kg $75/kg
AUD:USD .90 .90
* Upside Case – shows the financial affect improving recoveries of TREEYO from 60% to 70%. All other inputs remain unchanged. A mining schedule was developed based on a crushing rate of 10 Mtpa. This incorporates a Heavy Medium Plant resulting in 6 Mtpa passing through a treatment circuit producing rare earths, copper, phosphate rock and uranium. The concentrate products will be railed to Townsville where the Rare Earths concentrates will be further processed to produce Rare Earth Oxide products.
At this stage, social and economic studies have not been undertaken, however the Long Term Base Case could deliver over $240M in company taxes and have an estimated site workforce of 400 with a further 110 people based in Townsville.
Capital is based on a 100% company owned and owner operator development. (No external outsourcing of capital). Start-up capital totals $792 M covering: Concentrator and Rare Earth Oxide plant capital costs of $656M; Mining fleet $99M; and Infrastructure $37M. Other capital spread over the Life of Mine, includes Tailings Dam $60M; $52M for sustaining capital; and $41M for closure capital (rehabilitation).
Table: Long Term Base Case - Key Life of mine parameters.*Includes other metal credits.
Revenue Note: TREEYO product range set flat at US$75/kg for the 11 year life of the mine. The 3 year rolling average
for GBM’s TREEYO is $96/kg. Over the last two years the basket price range has recorded between $65/kg and $280/kg. Long term US dollar at 90 cents and conservative 60% recovery. 24% of the REE resource is deemed to be in critical undersupply by the US Dept. Energy (Dec 2011: Critical Materials Strategy, P4) and accounts for 70% of the TREEYO value in the resource. Hence this provides a robust outlook for medium to long term for a positive pricing impact.
Key LOM Production Profile Price Assumptions Revenue Metallurgical US Dollar AUD M Recoveries 38,000 tonnes of TREEYO $75/kg 3,185 60% 58,000 tonnes of Cu $4/lb 825* 75% 10.2 million lbs of U3O8 $50/lb 395 90% 1.9 million tonnes P205 $200/t 399 75%

Copper, phosphate and uranium in the medium to long term have a positive price outlook. These
commodities potentially provide a natural price hedge. For example a $75 /lb U3O8 adds approximately $230M to the revenue line.
The scoping study has confirmed MILO’s economic and development potential and justifies further investment.
Next Steps and Opportunity:
Commence Pre-Feasibility study (PFS) in 2013 and secure funding through a JV partner or alternative means.
Key areas of development include; o Metallurgical test work covering TREEYO products, larger scale testing and
piloting to validate flowsheet and process design. o Upgrade Inferred Resource to Indicated. o Complete geotechnical and infrastructure studies to support the operation. o Commence engagement with traditional landholders, pastoralists,
community and other stakeholders including local and state government. Opportunities:
o Mine Life: Potential increase in resource base. The Milo deposit has significant potential to grow. The study is based on a 31 hole (11,000m) resource, which is very early in the exploration phase. Significant sections of the top 150m of the resource outline have not been included as ore within the open cut design due to limited drilling. These have the potential to materially increase the known resource. The Milo Resource is over a kilometre long and remains open in all directions. There are now 3 additional separate mineralised zones to be drilled within the Milo area - which is part of an extensive mineralising system.
o Test work designed to achieve: Reduced TREEYO operating costs. Reduced Plant capital through flow sheet improvements. Improved TREEYO recoveries >60%.
o Capital: Reduced start-up capital through outsourcing ie mining and infrastructure.
Forward Exploration Programme While sourcing funding for the development of the Milo Project remains a key priority for the board, there remain a number of high level exploration targets both adjacent to the Milo Project Area and elsewhere on the Brightlands tenement that demand further testing. Geological interpretation and assessment of these targets is ongoing.
Milo is an expanding IOCG-REE breccia style deposit. This is now validated by a positive scoping study supported by the inferred resource already announced. Strong geochemical evidence of a continuation of mineralisation in the Milo area, both to the north and also to the south west, strongly supports the concept that Milo is part of an extensive mineralising system. On a larger scale the Milo system is linked to the regionally significant Cloncurry Flexure, a clearly defined deep structural feature with extensive evidence of widespread hydrothermal activity.
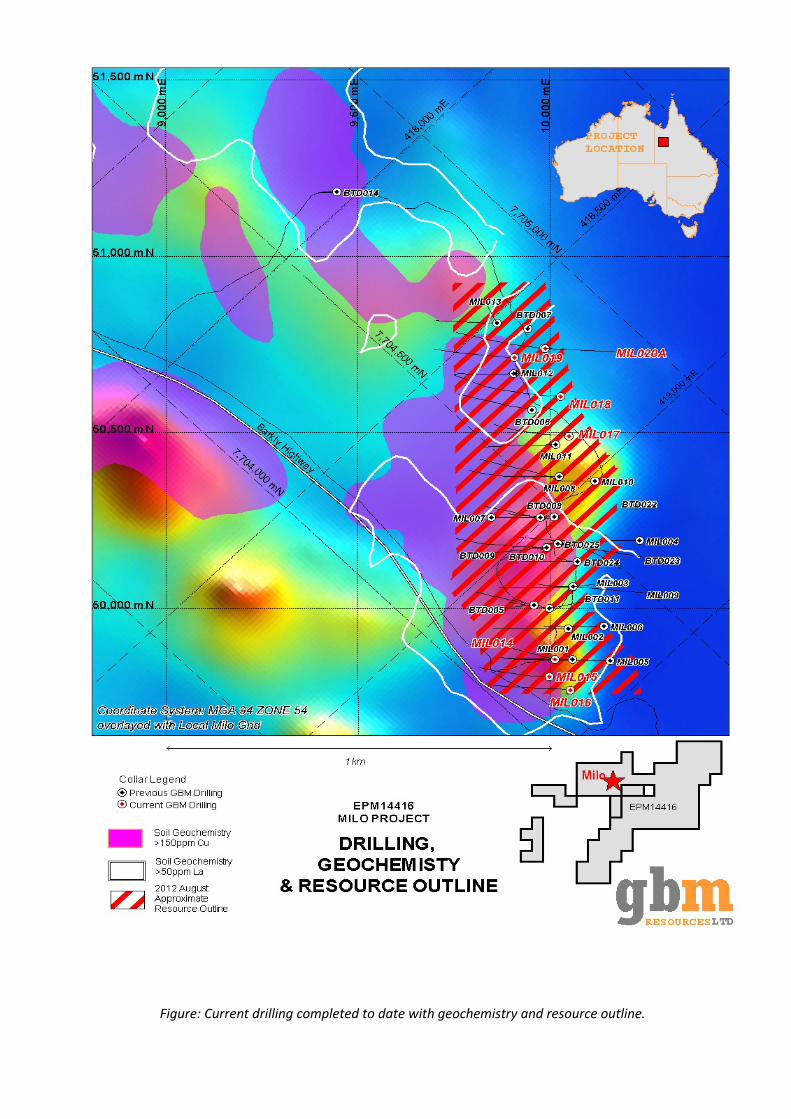
Figure: Current drilling completed to date with geochemistry and resource outline.

Figure: Milo project showing geochemistry as thematic over relief (top) and in plans (below).

Pan Pacific Copper/ Mitsui Farm in Projects This Farm In Agreement is now in its third year of an initial six year farm-in period. The current year budget has been revised upwards to an approved figure of $4.6M for this year ending 31 March 2013. Under the Farm-in Agreement, Pan Pacific / Mitsui, through their co-established Australian subsidiary Cloncurry Exploration and Development Pty Ltd (“CED”), can spend up to A$55 million on the development of new copper–gold exploration and mining projects in northwest Queensland.
Activity Overview:
During the December Quarter exploration continued at a high level before winding down for the wet season in mid-December. This activity included completion of drilling programs for the year, additional geophysical surveys, and the collection of MMI soil samples over three prospects and is summarized below:
• A ground gravity survey was completed over the FC12 prospect in the Mount Margaret area. MT surveys were completed over the Bronzewing Bore prospect (Bungalien tenement area) and over part of the FC4-South prospect within the Mount Margaret tenements.
• A three-hole drill program was completed at the Bronzewing Bore prospect (Bungalien tenement) and a two-hole drill program was completed at the FC4_South prospect (Mount Margaret tenements). IOCG-style Cu-Au mineralisation was intersected in both these drill programs.
• Mobile Metal Ion (MMI) soil survey grids were completed over the FC12 and FC15 prospects, and infill grids collected within the FC2_West prospect (all within the Mount Margaret Group of tenements).
Figure: Location map showing Farm in Areas.
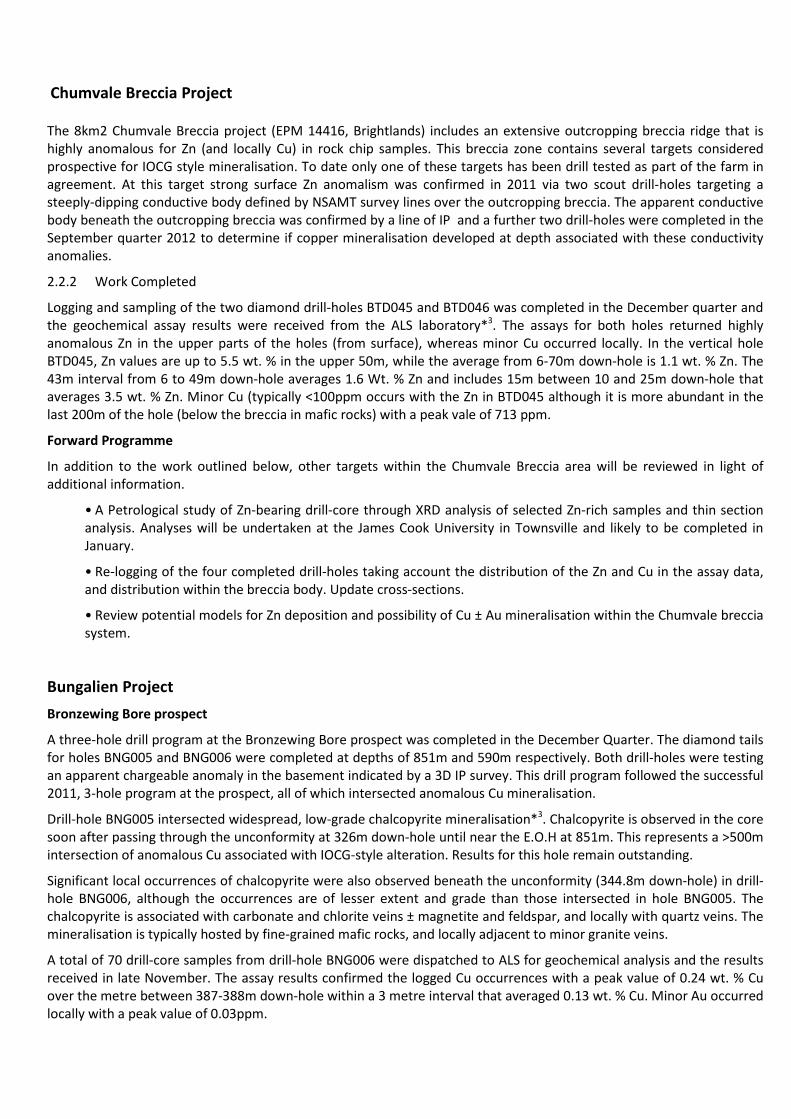
Chumvale Breccia Project
The 8km2 Chumvale Breccia project (EPM 14416, Brightlands) includes an extensive outcropping breccia ridge that is highly anomalous for Zn (and locally Cu) in rock chip samples. This breccia zone contains several targets considered prospective for IOCG style mineralisation. To date only one of these targets has been drill tested as part of the farm in agreement. At this target strong surface Zn anomalism was confirmed in 2011 via two scout drill-holes targeting a steeply-dipping conductive body defined by NSAMT survey lines over the outcropping breccia. The apparent conductive body beneath the outcropping breccia was confirmed by a line of IP and a further two drill-holes were completed in the September quarter 2012 to determine if copper mineralisation developed at depth associated with these conductivity anomalies.
2.2.2 Work Completed
Logging and sampling of the two diamond drill-holes BTD045 and BTD046 was completed in the December quarter and the geochemical assay results were received from the ALS laboratory*3. The assays for both holes returned highly anomalous Zn in the upper parts of the holes (from surface), whereas minor Cu occurred locally. In the vertical hole BTD045, Zn values are up to 5.5 wt. % in the upper 50m, while the average from 6-70m down-hole is 1.1 wt. % Zn. The 43m interval from 6 to 49m down-hole averages 1.6 Wt. % Zn and includes 15m between 10 and 25m down-hole that averages 3.5 wt. % Zn. Minor Cu (typically <100ppm occurs with the Zn in BTD045 although it is more abundant in the last 200m of the hole (below the breccia in mafic rocks) with a peak vale of 713 ppm.
Forward Programme
In addition to the work outlined below, other targets within the Chumvale Breccia area will be reviewed in light of additional information.
• A Petrological study of Zn-bearing drill-core through XRD analysis of selected Zn-rich samples and thin section analysis. Analyses will be undertaken at the James Cook University in Townsville and likely to be completed in January.
• Re-logging of the four completed drill-holes taking account the distribution of the Zn and Cu in the assay data, and distribution within the breccia body. Update cross-sections.
• Review potential models for Zn deposition and possibility of Cu ± Au mineralisation within the Chumvale breccia system.
Bungalien Project Bronzewing Bore prospect
A three-hole drill program at the Bronzewing Bore prospect was completed in the December Quarter. The diamond tails for holes BNG005 and BNG006 were completed at depths of 851m and 590m respectively. Both drill-holes were testing an apparent chargeable anomaly in the basement indicated by a 3D IP survey. This drill program followed the successful 2011, 3-hole program at the prospect, all of which intersected anomalous Cu mineralisation.
Drill-hole BNG005 intersected widespread, low-grade chalcopyrite mineralisation*3. Chalcopyrite is observed in the core soon after passing through the unconformity at 326m down-hole until near the E.O.H at 851m. This represents a >500m intersection of anomalous Cu associated with IOCG-style alteration. Results for this hole remain outstanding.
Significant local occurrences of chalcopyrite were also observed beneath the unconformity (344.8m down-hole) in drill-hole BNG006, although the occurrences are of lesser extent and grade than those intersected in hole BNG005. The chalcopyrite is associated with carbonate and chlorite veins ± magnetite and feldspar, and locally with quartz veins. The mineralisation is typically hosted by fine-grained mafic rocks, and locally adjacent to minor granite veins.
A total of 70 drill-core samples from drill-hole BNG006 were dispatched to ALS for geochemical analysis and the results received in late November. The assay results confirmed the logged Cu occurrences with a peak value of 0.24 wt. % Cu over the metre between 387-388m down-hole within a 3 metre interval that averaged 0.13 wt. % Cu. Minor Au occurred locally with a peak value of 0.03ppm.
All five holes drilled into the basement at Bronzewing Bore (including the 2011 drill-holes BNG001, 2, 3) have intersected anomalous Cu mineralisation associated with IOCG-style mineralisation, with the best visible intersections to date coming from holes BNG001 and BNG005.
An MT survey consisting of 48 stations was carried out over the Bronzewing Bore prospect. Preliminary results have been received in the form of pseudo-sections and stitched 1D sections along E-W lines through the survey points. A 3D model will be completed in 2013.
Malbon2
The results of a Mobile Metal Ion (MMI) soil survey over the Malbon 2 area were received from the SGS laboratory in the December Quarter. The Cambrian cover is 120m thick in this area and a previous explorer had defined a Cu-in-soil anomaly at this location. MMI analysis is designed to see through overlying cover and detect possible sulphide-bearing bodies in the basement. Preliminary interpretation of the results of the MMI survey appears to support a Cu anomaly in the basement.
Forward programme
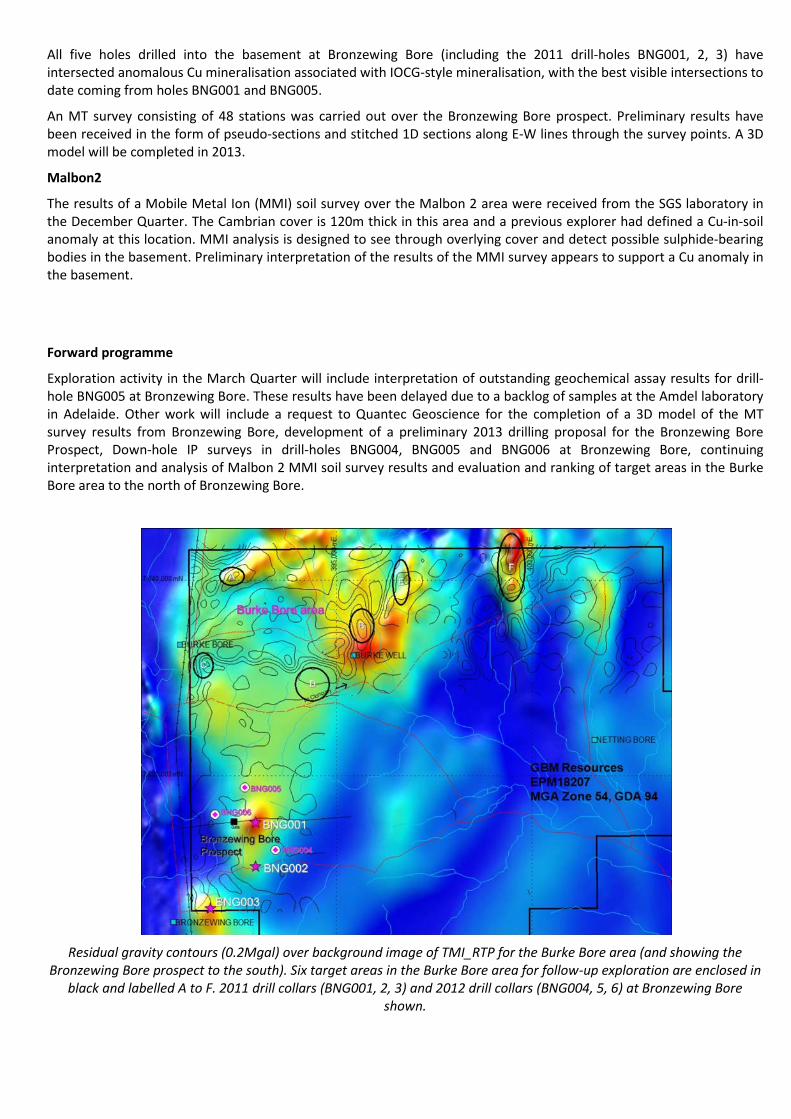
Exploration activity in the March Quarter will include interpretation of outstanding geochemical assay results for drill-hole BNG005 at Bronzewing Bore. These results have been delayed due to a backlog of samples at the Amdel laboratory in Adelaide. Other work will include a request to Quantec Geoscience for the completion of a 3D model of the MT survey results from Bronzewing Bore, development of a preliminary 2013 drilling proposal for the Bronzewing Bore Prospect, Down-hole IP surveys in drill-holes BNG004, BNG005 and BNG006 at Bronzewing Bore, continuing interpretation and analysis of Malbon 2 MMI soil survey results and evaluation and ranking of target areas in the Burke Bore area to the north of Bronzewing Bore.
Residual gravity contours (0.2Mgal) over background image of TMI_RTP for the Burke Bore area (and showing the
Bronzewing Bore prospect to the south). Six target areas in the Burke Bore area for follow-up exploration are enclosed in black and labelled A to F. 2011 drill collars (BNG001, 2, 3) and 2012 drill collars (BNG004, 5, 6) at Bronzewing Bore
shown.

Mount Margaret West Project
The first hole (MMA001) into the initial magnetic-gravity target at the FC4-South prospect intersected a broad interval of low-grade copper mineralisation*2 averaging 302 ppm from near the top of basement (the relatively shallow cover rock sequence extends to 62m) to 615m. Within this zone numerous higher grade intervals were intersected including 12m @ 0.26 wt% Cu. Intense shearing and patchy red rock alteration observed throughout the hole shows strong affinities with the Ernest Henry deposit, located less than 4 km to the south-west of MMA001. Ernest Henry is a large IOCG deposit containing a mineral endowment estimated as 300Mt @ 1.1% Cu and 0.5 g/t Au. Also nearby are the E1 and Monakoff deposits recently purchased by Xstrata which have a published resource of 52Mt averaging 0.77% Cu and 0.23g/t Au. Copper mineralisation as chalcopyrite and bornite is widespread throughout MMA001, typically in sheared mafic rocks, although it has also been observed in veins, including Quartz +/- Carbonate veins. Strong correlation between Cu-Au-Mo-Ag is noted. Peak assays from 1m intervals are 1.74 wt% Cu, 0.56 ppm Au, 274 ppm Mo and 6.5 ppm Ag. Results of Hole MMA001 are summarised below:
Hole ID From m
To m
Interval m
Cu %
Au ppm
MMA001 63.4 615 551.6 0.03 0.01 MMA001 95 98 3 0.33 0.03 MMA001 275 280 5 0.18 0.04 MMA001 497 502 5 0.14 0.09 MMA001 575 580 5 0.11 0.05 MMA001 598 610 12 0.26 0.09 Table: Significant copper intersections from MMA001 Hole MMA002 intersected magnetite and pyrite bearing mafic rocks coincident with a strong IP chargeability anomaly. Small patchy zones of chalcopyrite were observed throughout the hole with stronger intercepts between 251-270m within siliceous shale and 371-390m and 423-430m in meta-mafic volcanic. Molybdenite was noted locally. Results for this hole remain outstanding. A Magnetotelluric (MT) geophysical survey undertaken concurrently with drilling at FC4-South has defined two large and discrete conductivity anomalies beneath an area of strongly anomalous gold mineralisation defined by historic drilling. Neither target has been drill tested but both show a spatial relationship with the distribution of gold mineralisation. These features, along with a series of historic, poorly tested Induced Polarity (IP) chargeability anomalies within FC4S, will be ranked and drill tested in order of priority during the 2013 field season. Drilling by previous explorers in this area intersected anomalously high gold values for the region, up to 10.3 g/t Au. The Mount Margaret Project area includes three granted exploration permits – Mt Malakoff Ext EPM16398, Dry Creek EPM18172, and Dry Creek Ext EPM 18174 - which together cover an area of 350 square kilometres. Two applications are in process: Cotswold EPMA16622 and Mt Marge EPMA19834 (for a total 48.2 square kilometres). The Mount Margaret region received considerable attention from a number of explorers following the discovery of the Ernest Henry deposit in 1991. As a result, much open-file data exists for the project and a review of the data has produced a series of targets within established prospects and ‘greenfield’ areas. Field work commenced in the second half of 2012 focusing on FC4S, while work in other target areas is ongoing. Recent results from surface and drilling work indicate the Mount Margaret project possesses exciting potential for an IOCG discovery beneath the Carpentaria Basin cover rocks.

Photographs: Top, chalcopyrite-pyrite mineralisation in quartz-carbonate-feldspar vein. From MMA001 (NQ diamond drill core). Bottom, Ernest Henry style ‘Red Rock’ alteration with magnetite-pyrite-chalcopyrite-molybdenite. From MMA002 (NQ diamond drill core).
Figure: Plan view of FC4S- Ernest henry area showing drillhole locations. GBM MT survey stations (blue crosses), gravity survey area (brown box) and IP lines (black) also shown. Backdrop transparent RTP magnetic image over satellite image.

Figure: East-west cross-section through MMA001 showing logged downhole data and Copper assays. A schematic geological interpretation is shown, based on drill core observations, subsequent magnetic modeling, and characteristics of the nearby Ernest Henry IOCG deposit.

Figure: Plan of FC4S showing a compilation geophysical anomalies and open-file drilling.
Figure: 3D view of MT 3D Inversion looking to north-east of 50 and 100 ohm/m MT conductivity shells with historic drilling.

Figure: Data compilation for FC4S prospect showing all IP and MIMDAS/MT lines, historic drilling (coded by max Cu), and
GBM-picked chargeability anomalies. MT anomalies are shown in green. Target areas of interest circled.
Forward Programme
The forward program for the Mount Margaret group of tenements will include additional geophysics (gravity and IP and/or MT), submission and analysis of MMI soil samples collected late in 2012, scout drill-testing of targets chosen from a number of prospects via combined geophysics, soil and historic drilling results. Drill testing of the inferred magnetic body adjacent to MMA001 and the conductivity anomalies defined by the MT survey at FC4_South (A) is also planned.

QUEENSLAND EXPLORATION ACTIVITIES Mount Morgan Copper Gold Project This strategic group of exploration leases is considered by GBM to be highly prospective for the discovery of large Gold Copper systems and will form a key focus for GBM during 2013. Planning of sampling, mapping and drill programs is now underway with the objective of commencing as soon as possible after the Queensland wet season.
The Mount Morgan Project is located 40km south west of Rockhampton in Queensland in close proximity to the world class Mt Morgan Copper-Gold mine which produced in excess of 8.0M ounces of gold (Au) and 400,000 tonnes of copper (Cu) metal. Recent work by GBM has been successful in the definition of large zones of anomalous gold and copper in soil in the Mount Morgan project area along the Mount Battery/Iron Bark Fault corridor, a structural trend extending through the Sandy Creek, Kyle Mohr and Smelter Return Prospects to Mount Morgan. Results from extensive soil and rock sampling programs completed during 2012 are summarised below.
Intrusive Related gold and copper mineralisation (IRGS) at Smelter Return and Sandy Creek Prospects, near Mt Morgan.
Large high-tenor Au (+Cu) soil anomalies associated with major structures.
Rock-chip assays to 39% Cu, 8.5g/t Au and 44ppm Ag at Sandy Creek.
Within structural corridor hosting Mt Morgan mine.
Anomaly is open along fault strike into GBM ground towards Mt Morgan.
The project area includes eight licenses (seven granted) covering over 1,000 km2. Within these existing titles, numerous targets are defined ranging from early stage stream sediment anomalies to drill ready geophysical / geochemical targets.
Historic exploration in the Mount Morgan area has primarily focused on the discovery of a Mount Morgan analogue which has, up until recently, been interpreted by many as a VHMS (massive sulphide) type. Until the recent GBM work, no activity targeting intrusion related systems had been completed, nor had there been a thorough examination and interpretation of geophysical datasets or detailed compilation of existing exploration data.

Figure; Mount Morgan Project area plan showing key targets and Tenement status.
VICTORIAN EXPLORATION ACTIVITIES Malmsbury Project (includes EL5415 Malmsbury & EL5120 Lauriston) No field work was completed this quarter. Planning is underway to extend the soil grid completed during the previous quarter to the east. Existing sampling shows strong gold anomalism at the east end of a number of grid lines. A short program of core logging of previously unlogged GBM diamond core was completed. Willaura Project (includes EL4631 Lake Bolac, ELA 5423 Lake Bolac 2 & EL5346 Willaura)
No field work was completed during the September Quarter. Planning is underway for partial leach (MMI) / pH soil and ground magnetic surveys to be completed in the March Quarter 2013. A selection of previously defined buried targets along the Moysten Fault will be assessed and then ranked for drill testing in the next field season.
Yea Project (includes Tin Creek EL5292 & Monkey Gully EL5293)
No field work was completed this quarter. Interpretation of prospect-scale (1:4,000) mapping of Monkey Gully prospect completed during 2012 indicates that the Monkey Gully mineralisation is associated with a multi-phase intrusive complex, and in particular with a series of north-west trending tonalite dykes. Drill hole MGDD08 was collared in between two of the tonalite dykes and likely intersected one at around 110m downhole, suggesting a steep northerly dip to the dykes. The best tungsten intersection from MGDD08 was located at the contact of tonalite-granodiorite. Given the number of dykes present, a significant volume of potentially mineralised and largely untested ‘dyke contact’ exists at Monkey Gully. The presence of these dykes supports the existence of a hidden, and also potentially margin-mineralised, tonalite intrusion within the granodiorite. Planning of a detailed ground magnetic survey to assist in delineating the potential host tonalite dykes is underway . The program is scheduled to be conducted during the next quarter. Petrography and additional rock sampling are also required. Detailed analysis of the State airborne magnetic data may reveal similar Monkey Gully style features beneath the Black Range hornfels unit.
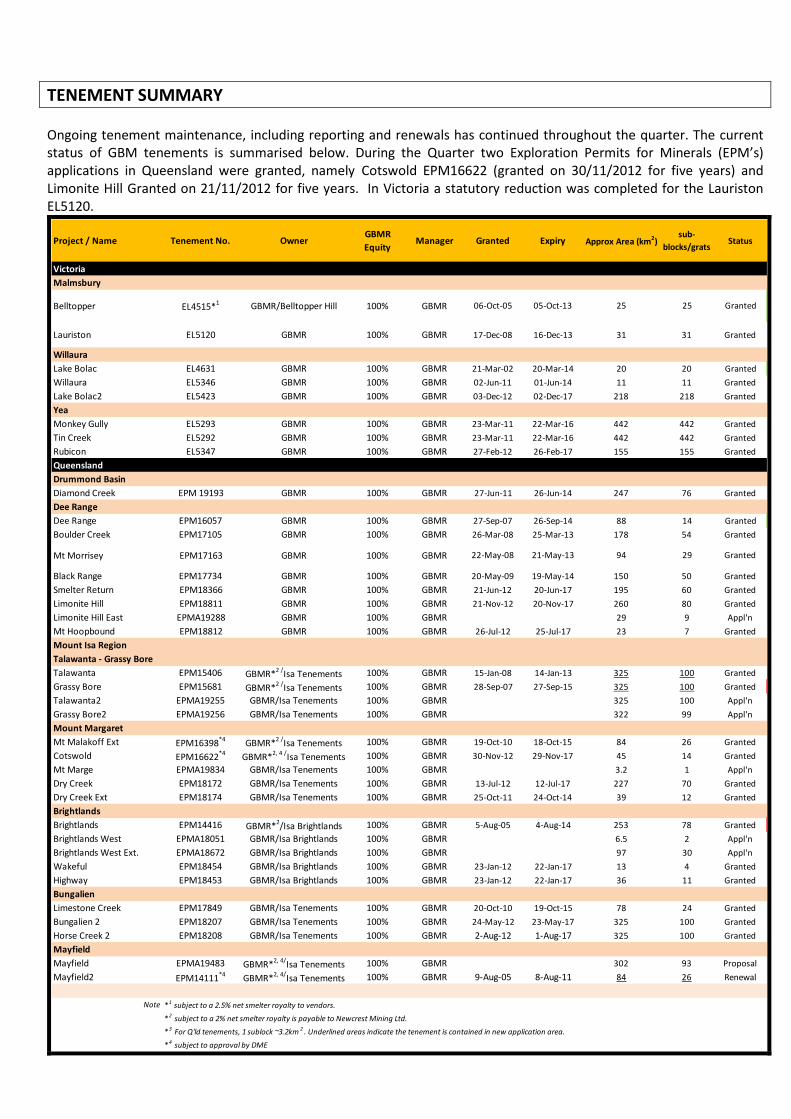
TENEMENT SUMMARY Ongoing tenement maintenance, including reporting and renewals has continued throughout the quarter. The current status of GBM tenements is summarised below. During the Quarter two Exploration Permits for Minerals (EPM’s) applications in Queensland were granted, namely Cotswold EPM16622 (granted on 30/11/2012 for five years) and Limonite Hill Granted on 21/11/2012 for five years. In Victoria a statutory reduction was completed for the Lauriston EL5120.
Project / Name Tenement No. OwnerGBMR Equity
Manager Granted Expiry Approx Area (km2)sub-
blocks/gratsStatus
VictoriaMalmsbury
Belltopper EL4515*1 GBMR/Belltopper Hill 100% GBMR 06-Oct-05 05-Oct-13 25 25 Granted
Lauriston EL5120 GBMR 100% GBMR 17-Dec-08 16-Dec-13 31 31 Granted
WillauraLake Bolac EL4631 GBMR 100% GBMR 21-Mar-02 20-Mar-14 20 20 GrantedWillaura EL5346 GBMR 100% GBMR 02-Jun-11 01-Jun-14 11 11 GrantedLake Bolac2 EL5423 GBMR 100% GBMR 03-Dec-12 02-Dec-17 218 218 GrantedYeaMonkey Gully EL5293 GBMR 100% GBMR 23-Mar-11 22-Mar-16 442 442 GrantedTin Creek EL5292 GBMR 100% GBMR 23-Mar-11 22-Mar-16 442 442 GrantedRubicon EL5347 GBMR 100% GBMR 27-Feb-12 26-Feb-17 155 155 GrantedQueenslandDrummond BasinDiamond Creek EPM 19193 GBMR 100% GBMR 27-Jun-11 26-Jun-14 247 76 GrantedDee RangeDee Range EPM16057 GBMR 100% GBMR 27-Sep-07 26-Sep-14 88 14 GrantedBoulder Creek EPM17105 GBMR 100% GBMR 26-Mar-08 25-Mar-13 178 54 Granted
Mt Morrisey EPM17163 GBMR 100% GBMR 22-May-08 21-May-13 94 29 Granted
Black Range EPM17734 GBMR 100% GBMR 20-May-09 19-May-14 150 50 GrantedSmelter Return EPM18366 GBMR 100% GBMR 21-Jun-12 20-Jun-17 195 60 GrantedLimonite Hill EPM18811 GBMR 100% GBMR 21-Nov-12 20-Nov-17 260 80 GrantedLimonite Hill East EPMA19288 GBMR 100% GBMR 29 9 Appl'nMt Hoopbound EPM18812 GBMR 100% GBMR 26-Jul-12 25-Jul-17 23 7 GrantedMount Isa RegionTalawanta - Grassy BoreTalawanta EPM15406 GBMR*2 /Isa Tenements 100% GBMR 15-Jan-08 14-Jan-13 325 100 GrantedGrassy Bore EPM15681 GBMR*2 /Isa Tenements 100% GBMR 28-Sep-07 27-Sep-15 325 100 GrantedTalawanta2 EPMA19255 GBMR/Isa Tenements 100% GBMR 325 100 Appl'nGrassy Bore2 EPMA19256 GBMR/Isa Tenements 100% GBMR 322 99 Appl'nMount MargaretMt Malakoff Ext EPM16398*4 GBMR*2 /Isa Tenements 100% GBMR 19-Oct-10 18-Oct-15 84 26 GrantedCotswold EPM16622*4 GBMR*2, 4 /Isa Tenements 100% GBMR 30-Nov-12 29-Nov-17 45 14 GrantedMt Marge EPMA19834 GBMR/Isa Tenements 100% GBMR 3.2 1 Appl'nDry Creek EPM18172 GBMR/Isa Tenements 100% GBMR 13-Jul-12 12-Jul-17 227 70 GrantedDry Creek Ext EPM18174 GBMR/Isa Tenements 100% GBMR 25-Oct-11 24-Oct-14 39 12 GrantedBrightlandsBrightlands EPM14416 GBMR*2/Isa Brightlands 100% GBMR 5-Aug-05 4-Aug-14 253 78 GrantedBrightlands West EPMA18051 GBMR/Isa Brightlands 100% GBMR 6.5 2 Appl'nBrightlands West Ext. EPMA18672 GBMR/Isa Brightlands 100% GBMR 97 30 Appl'nWakeful EPM18454 GBMR/Isa Brightlands 100% GBMR 23-Jan-12 22-Jan-17 13 4 GrantedHighway EPM18453 GBMR/Isa Brightlands 100% GBMR 23-Jan-12 22-Jan-17 36 11 GrantedBungalienLimestone Creek EPM17849 GBMR/Isa Tenements 100% GBMR 20-Oct-10 19-Oct-15 78 24 GrantedBungalien 2 EPM18207 GBMR/Isa Tenements 100% GBMR 24-May-12 23-May-17 325 100 GrantedHorse Creek 2 EPM18208 GBMR/Isa Tenements 100% GBMR 2-Aug-12 1-Aug-17 325 100 GrantedMayfieldMayfield EPMA19483 GBMR*2, 4/Isa Tenements 100% GBMR 302 93 ProposalMayfield2 EPM14111*4 GBMR*2, 4/Isa Tenements 100% GBMR 9-Aug-05 8-Aug-11 84 26 Renewal
Note * 1 subject to a 2.5% net smelter royalty to vendors.
* 2 subject to a 2% net smelter royalty is payable to Newcrest Mining Ltd.
* 3 For Q'ld tenements, 1 sublock ~3.2km 2 . Underlined areas indicate the tenement is contained in new application area.
* 4 subject to approval by DME
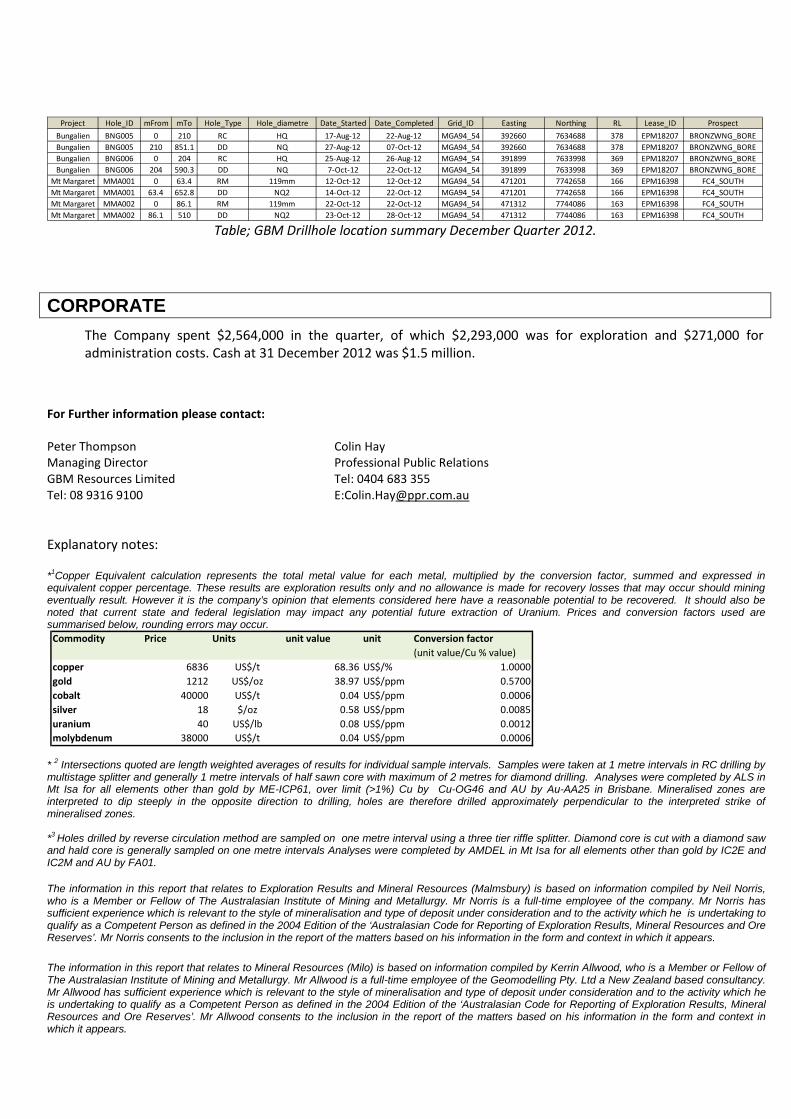
Table; GBM Drillhole location summary December Quarter 2012.
CORPORATE The Company spent $2,564,000 in the quarter, of which $2,293,000 was for exploration and $271,000 for administration costs. Cash at 31 December 2012 was $1.5 million.
For Further information please contact: Peter Thompson Colin Hay Managing Director Professional Public Relations GBM Resources Limited Tel: 0404 683 355 Tel: 08 9316 9100 E:[email protected] Explanatory notes: *1Copper Equivalent calculation represents the total metal value for each metal, multiplied by the conversion factor, summed and expressed in equivalent copper percentage. These results are exploration results only and no allowance is made for recovery losses that may occur should mining eventually result. However it is the company’s opinion that elements considered here have a reasonable potential to be recovered. It should also be noted that current state and federal legislation may impact any potential future extraction of Uranium. Prices and conversion factors used are summarised below, rounding errors may occur.
Commodity Price Units unit value unit Conversion factor(unit value/Cu % value)
copper 6836 US$/t 68.36 US$/% 1.0000gold 1212 US$/oz 38.97 US$/ppm 0.5700cobalt 40000 US$/t 0.04 US$/ppm 0.0006silver 18 $/oz 0.58 US$/ppm 0.0085uranium 40 US$/lb 0.08 US$/ppm 0.0012molybdenum 38000 US$/t 0.04 US$/ppm 0.0006
* 2 Intersections quoted are length weighted averages of results for individual sample intervals. Samples were taken at 1 metre intervals in RC drilling by multistage splitter and generally 1 metre intervals of half sawn core with maximum of 2 metres for diamond drilling. Analyses were completed by ALS in Mt Isa for all elements other than gold by ME-ICP61, over limit (>1%) Cu by Cu-OG46 and AU by Au-AA25 in Brisbane. Mineralised zones are interpreted to dip steeply in the opposite direction to drilling, holes are therefore drilled approximately perpendicular to the interpreted strike of mineralised zones. *3 Holes drilled by reverse circulation method are sampled on one metre interval using a three tier riffle splitter. Diamond core is cut with a diamond saw and hald core is generally sampled on one metre intervals Analyses were completed by AMDEL in Mt Isa for all elements other than gold by IC2E and IC2M and AU by FA01. The information in this report that relates to Exploration Results and Mineral Resources (Malmsbury) is based on information compiled by Neil Norris, who is a Member or Fellow of The Australasian Institute of Mining and Metallurgy. Mr Norris is a full-time employee of the company. Mr Norris has sufficient experience which is relevant to the style of mineralisation and type of deposit under consideration and to the activity which he is undertaking to qualify as a Competent Person as defined in the 2004 Edition of the ‘Australasian Code for Reporting of Exploration Results, Mineral Resources and Ore Reserves’. Mr Norris consents to the inclusion in the report of the matters based on his information in the form and context in which it appears. The information in this report that relates to Mineral Resources (Milo) is based on information compiled by Kerrin Allwood, who is a Member or Fellow of The Australasian Institute of Mining and Metallurgy. Mr Allwood is a full-time employee of the Geomodelling Pty. Ltd a New Zealand based consultancy. Mr Allwood has sufficient experience which is relevant to the style of mineralisation and type of deposit under consideration and to the activity which he is undertaking to qualify as a Competent Person as defined in the 2004 Edition of the ‘Australasian Code for Reporting of Exploration Results, Mineral Resources and Ore Reserves’. Mr Allwood consents to the inclusion in the report of the matters based on his information in the form and context in which it appears.
Project Hole_ID mFrom mTo Hole_Type Hole_diametre Date_Started Date_Completed Grid_ID Easting Northing RL Lease_ID ProspectBungalien BNG005 0 210 RC HQ 17-Aug-12 22-Aug-12 MGA94_54 392660 7634688 378 EPM18207 BRONZWNG_BOREBungalien BNG005 210 851.1 DD NQ 27-Aug-12 07-Oct-12 MGA94_54 392660 7634688 378 EPM18207 BRONZWNG_BOREBungalien BNG006 0 204 RC HQ 25-Aug-12 26-Aug-12 MGA94_54 391899 7633998 369 EPM18207 BRONZWNG_BOREBungalien BNG006 204 590.3 DD NQ 7-Oct-12 22-Oct-12 MGA94_54 391899 7633998 369 EPM18207 BRONZWNG_BORE
Mt Margaret MMA001 0 63.4 RM 119mm 12-Oct-12 12-Oct-12 MGA94_54 471201 7742658 166 EPM16398 FC4_SOUTHMt Margaret MMA001 63.4 652.8 DD NQ2 14-Oct-12 22-Oct-12 MGA94_54 471201 7742658 166 EPM16398 FC4_SOUTHMt Margaret MMA002 0 86.1 RM 119mm 22-Oct-12 22-Oct-12 MGA94_54 471312 7744086 163 EPM16398 FC4_SOUTHMt Margaret MMA002 86.1 510 DD NQ2 23-Oct-12 28-Oct-12 MGA94_54 471312 7744086 163 EPM16398 FC4_SOUTH

Appendix 5B GBM Resources Limited
Mining exploration entity quarterly report
+ See chapter 19 for defined terms. 17/12/2010 Appendix 5B Page 1
Rule 5.3
Appendix 5B
Mining exploration entity quarterly report Introduced 1/7/96. Origin: Appendix 8. Amended 1/7/97, 1/7/98, 30/9/01, 01/06/10, 17/12/10
Name of entity
GBM Resources Limited
Quarter ended (“current quarter”)
ABN 91 124 752 745 31 December 2012
Consolidated statement of cash flows
Cash flows related to operating activities
Current quarter $A’000
Year to date (6 months) $A’000
1.1 Receipts from product sales and related debtors
- -
1.2 Payments for: (a) exploration and evaluation (including JV Farm-in spend)
(b) development (c) production (d) administration
(2,293) - -
(271)
(4,334) - -
(599) 1.3 Dividends received - - 1.4 Interest and other items of a similar nature
received
15
30 1.5 Interest and other costs of finance paid - - 1.6 Income taxes paid - - 1.7 Other - Grants and JV management fees
- R&D concession refund -
285 198 544
Net Operating Cash Flows
(2,264)
(4,161)
Cash flows related to investing activities
1.8 Payment for purchases of: (a)prospects (b)equity investments (c) other fixed assets
- - -
- -
(33) 1.9 Proceeds from sale of: (a)prospects
(b)equity investments (c)other fixed assets
- - -
- - -
1.10 Loans to other entities - - 1.11 Loans repaid by other entities - - 1.12 Other - JV Farm-in contributions received 1,006 2,656
Net investing cash flows
1,006
2,623 1.13 Total operating and investing cash flows (carried
forward)
(1,258)
(1,538)

Appendix 5B Mining exploration entity quarterly report
+ See chapter 19 for defined terms. Appendix 5B Page 2 17/12/2010
1.13 Total operating and investing cash flows (brought forward)
(1,258)
(1,538)
Cash flows related to financing activities
1.14 Proceeds from issues of shares, options, etc. 500 1,544 1.15 Proceeds from sale of forfeited shares - - 1.16 Proceeds from borrowings - - 1.17 Repayment of borrowings - - 1.18 Dividends paid - - 1.19 Other (capital raising costs) (65) (82) Net financing cash flows 435 1,462
Net increase (decrease) in cash held
(823)
(76)
1.20 Cash at beginning of quarter/year to date 2,338 1,591 1.21 Exchange rate adjustments to item 1.20 - -
1.22 Cash at end of quarter 1,515 1,515
Payments to directors of the entity and associates of the directors Payments to related entities of the entity and associates of the related entities
Current quarter $A'000
1.23
Aggregate amount of payments to the parties included in item 1.2
168
1.24
Aggregate amount of loans to the parties included in item 1.10
-
1.25
Explanation necessary for an understanding of the transactions
Director remuneration – fees and salaries.
Non-cash financing and investing activities 2.1 Details of financing and investing transactions which have had a material effect on consolidated
assets and liabilities but did not involve cash flows During the quarter the Company issued 10 million ordinary fully paid shares at a deemed value of 5
cents each to acquire Swift Venture Corporation’s 70% interest in the Bungalien phosphate assets.
2.2 Details of outlays made by other entities to establish or increase their share in projects in which the reporting entity has an interest
Expenditure for the quarter of $1,258,077 ($2,886,892 year to date) incurred by other entities under joint venture farm-in agreements on projects held by the Company has been included at 1.2(a).
Financing facilities available Add notes as necessary for an understanding of the position.
Amount available $A’000
Amount used $A’000
3.1 Loan facilities
- -
3.2 Credit standby arrangements
- -

Appendix 5B GBM Resources Limited
Mining exploration entity quarterly report
+ See chapter 19 for defined terms. 17/12/2010 Appendix 5B Page 3
Estimated cash outflows for next quarter $A’000 4.1 Exploration and evaluation
350 4.2 Development
4.3
Production
4.4
Administration 270
Total
620
Reconciliation of cash Reconciliation of cash at the end of the quarter (as shown in the consolidated statement of cash flows) to the related items in the accounts is as follows.
Current quarter $A’000
Previous quarter $A’000
5.1 Cash on hand and at bank 1,397 2,220
5.2 Deposits at call 118 118
5.3 Bank overdraft - -
5.4 Other (provide details) - -
Total: cash at end of quarter (item 1.22) 1,515 2,338
Changes in interests in mining tenements
Tenement reference
Nature of interest (note (2))
Interest at beginning of quarter
Interest at end of quarter
6.1 Interests in mining tenements relinquished, reduced or lapsed
6.2 Interests in mining tenements acquired or increased
EPM’s 16622 and 18811
Granted – 100% application 100%

Appendix 5B Mining exploration entity quarterly report
+ See chapter 19 for defined terms. Appendix 5B Page 4 17/12/2010
Issued and quoted securities at end of current quarter Description includes rate of interest and any redemption or conversion rights together with prices and dates. Total
number Number quoted
Issue price per security (see note 3) (cents)
Amount paid up per security (see note 3) (cents)
7.1 Preference +securities (description)
-
7.2 Changes during quarter
-
7.3 +Ordinary securities
277,065,003
277,065,003
7.4 Changes during quarter (a) Increases through issues (b) Decreases through returns of capital, buy-backs
30,000,000
-
30,000,000
-
7.5 +Convertible debt securities (description)
-
-
7.6 Changes during quarter
-
-
7.7 Options (description and conversion factor)
129,493,124
129,493,124
Exercise price
$0.20
Expiry date
30/6/2013 7.8 Issued during
quarter
-
-
7.9 Exercised during quarter
-
-
7.10 Expired during quarter
-
-
7.11 Debentures (totals only)
-
-
7.12 Unsecured notes (totals only)
-
-
7.13 Performance Share Rights (description and vesting dates)
350,000
-
Vesting date
31/12/2012
Expiry date
31/12/2017
7.14 Issued during quarter
-
-
7.15 Exercised during quarter
-
-
7.16 Expired during quarter
-
-
Appendix 5B GBM Resources Limited
Mining exploration entity quarterly report
+ See chapter 19 for defined terms. 17/12/2010 Appendix 5B Page 5
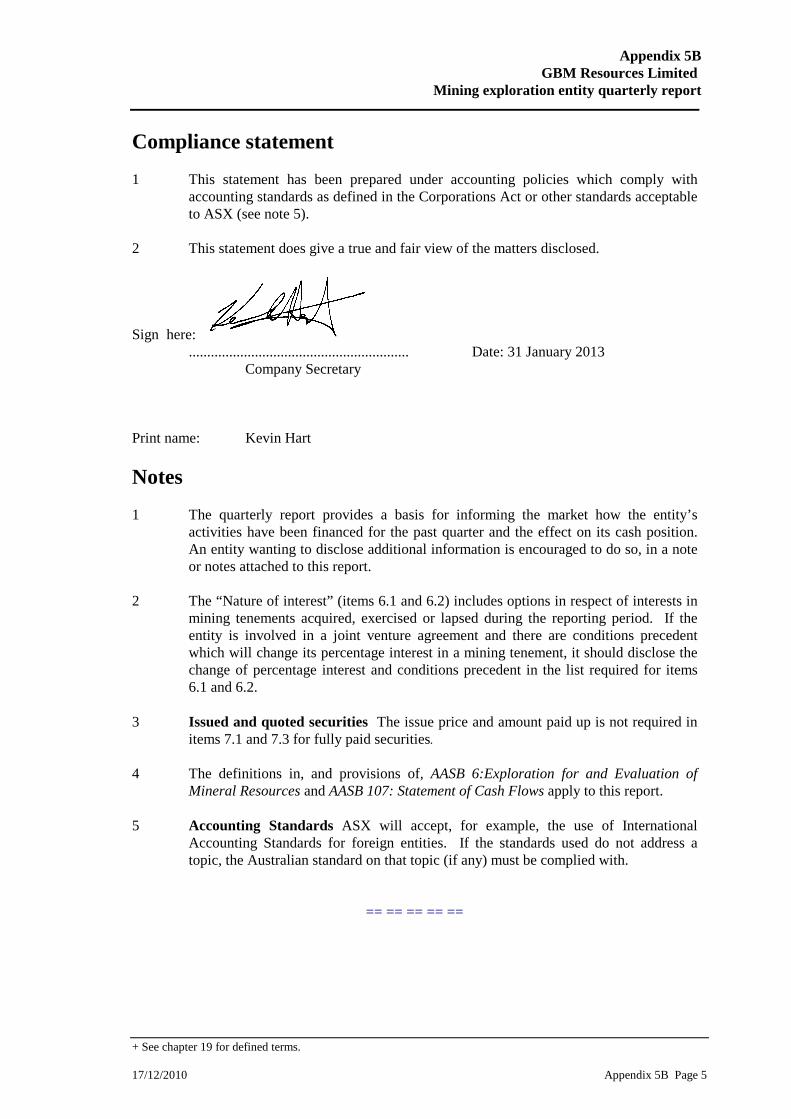
Compliance statement 1 This statement has been prepared under accounting policies which comply with
accounting standards as defined in the Corporations Act or other standards acceptable to ASX (see note 5).
2 This statement does give a true and fair view of the matters disclosed. Sign here: ............................................................ Date: 31 January 2013
Company Secretary Print name: Kevin Hart Notes 1 The quarterly report provides a basis for informing the market how the entity’s
activities have been financed for the past quarter and the effect on its cash position. An entity wanting to disclose additional information is encouraged to do so, in a note or notes attached to this report.
2 The “Nature of interest” (items 6.1 and 6.2) includes options in respect of interests in
mining tenements acquired, exercised or lapsed during the reporting period. If the entity is involved in a joint venture agreement and there are conditions precedent which will change its percentage interest in a mining tenement, it should disclose the change of percentage interest and conditions precedent in the list required for items 6.1 and 6.2.
3 Issued and quoted securities The issue price and amount paid up is not required in
items 7.1 and 7.3 for fully paid securities. 4 The definitions in, and provisions of, AASB 6:Exploration for and Evaluation of
Mineral Resources and AASB 107: Statement of Cash Flows apply to this report. 5 Accounting Standards ASX will accept, for example, the use of International
Accounting Standards for foreign entities. If the standards used do not address a topic, the Australian standard on that topic (if any) must be complied with.
== == == == ==