Key determinants of selective binding and activation by...
14
BIOCHEMISTRY 2017 © The Authors, some rights reserved; exclusive licensee American Association for the Advancement of Science. Key determinants of selective binding and activation by the monocyte chemoattractant proteins at the chemokine receptor CCR2 Zil E. Huma, 1 Julie Sanchez, 1 Herman D. Lim, 2 Jessica L. Bridgford, 1,2 Cheng Huang, 1 Bradyn J. Parker, 1 Jiann G. Pazhamalil, 1 Benjamin T. Porebski, 1 Kevin D. G. Pfleger, 3 J. Robert Lane, 2 Meritxell Canals, 2 * Martin J. Stone 1 * Chemokines and their receptors collectively orchestrate the trafficking of leukocytes in normal immune function and inflammatory diseases. Different chemokines can induce distinct responses at the same receptor. In comparison to monocyte chemoattractant protein-1 (MCP-1; also known as CCL2), the chemokines MCP-2 (CCL8) and MCP-3 (CCL7) are partial agonists of their shared receptor CCR2, a key regulator of the trafficking of monocytes and macro- phages that contribute to the pathology of atherosclerosis, obesity, and type 2 diabetes. Through experiments with chimeras of MCP-1 and MCP-3, we identified the chemokine amino-terminal region as being the primary determinant of both the binding and signaling selectivity of these two chemokines at CCR2. Analysis of CCR2 mutants showed that the chemokine amino terminus interacts with the major subpocket in the transmembrane helical bundle of CCR2, which is distinct from the interactions of some other chemokines with the minor subpockets of their receptors. These results suggest the major subpocket as a target for the development of small-molecule inhibitors of CCR2. INTRODUCTION Heterotrimeric guanine nucleotide–binding protein (G protein)– coupled receptors (GPCRs) are the largest family of transmembrane (TM) receptors and the targets of numerous therapeutics. Many GPCRs can be activated by various different natural or synthetic ago- nists, which may give rise to distinct signaling outcomes. Whereas partial agonists evoke a submaximal response relative to that of a full agonist even at concentrations that saturate all receptor sites, biased agonists can display pathway-dependent efficacy, activating certain pathways to the relative exclusion of others (1, 2). The recent flood of GPCR structures has yielded a wealth of information regarding receptor architecture, ligand-binding sites, and G protein–binding sites, as well as some details of the conformational changes associated with receptor activation (3–5). Consequently, we can now begin to identify the structural mechanisms by which different agonists induce distinct signaling outcomes. Here, we describe an analysis of the structural features underlying differential activation of a chemokine receptor by its cognate chemokine ligands. Chemokine receptors are GPCRs expressed in leukocyte mem- branes, whereas chemokines are small, soluble proteins expressed in tis- sues during normal immune surveillance or in response to injury or infection. Activation of chemokine receptors by their cognate chemokines induces leukocyte migration into, and accumulation in, the chemokine- expressing tissues (6–8), a hallmark feature of the inflammatory response. Consequently, chemokine receptors are potential therapeutic targets in a wide range of inflammatory diseases (9). There is increasing ev- idence that cognate chemokines can differentially activate their shared receptors, including examples of partial agonism (10–14) and biased agonism (15, 16). CC chemokine receptor 2 (CCR2) is the major chemokine receptor on monocytes and macrophages, cells that play central roles in the pathology of atherosclerosis, obesity, and type 2 diabetes. In athero- sclerosis, CCR2 activation by the monocyte chemoattractant proteins MCP-1, MCP-2, and MCP-3 induces the recruitment of monocytes from the blood into the arterial walls, where they differentiate into macrophages and contribute to the development of atherosclerotic pla- ques (17). In obesity, CCR2 activation by MCP chemokines is associated with macrophage infiltration into adipose tissue and induction of insu- lin resistance (18). Considering the importance of CCR2 in inflamma- tory diseases, there is strong motivation to understand its mechanism of activation by its cognate chemokine ligands. Although their distinct biological functions are not fully understood, the MCP chemokines are differentially expressed in response to type 1 versus type 2 T helper cell inflammatory stimuli and can have distinct temporal patterns of expression, suggesting that they may also activate distinct cellular responses through their shared receptor (19, 20). In support of this possibility, Berchiche et al.(13) showed that cognate che- mokines for CCR2 display differences in their efficacies of activation of both b-arrestin– and G protein–mediated signaling pathways. Here, we verified that this differential signaling can be attributed to partial ago- nism rather than biased agonism, and we used various chemokine chi- meras and CCR2 mutants to identify key structural elements of both the chemokines and the receptor that mediate this differential activation. We interpreted our data in light of the published structures of chemokine- receptor complexes (21, 22), yielding insights into the design of selective pharmacological agents. RESULTS MCP chemokines have different efficacies and affinities at CCR2 We monitored the activation of CCR2 by MCP chemokines using one proximal, nonamplified measure of receptor activation [recruitment of 1 Infection and Immunity Program, Monash Biomedicine Discovery Institute, and Department of Biochemistry and Molecular Biology, Monash University, Clayton, Victoria 3800, Australia. 2 Drug Discovery Biology, Monash Institute of Pharmaceu- tical Sciences, Monash University, Parkville, Victoria 3052, Australia. 3 Molecular En- docrinology and Pharmacology, Harry Perkins Institute of Medical Research, QEII Medical Centre; and Centre for Medical Research, University of Western Australia, Crawley and Dimerix Bioscience Limited, Nedlands, Western Australia, Australia. *Corresponding author. Email: [email protected] (M.J.S.); meri.canals@ monash.edu (M.C.) SCIENCE SIGNALING | RESEARCH ARTICLE Huma et al., Sci. Signal. 10, eaai8529 (2017) 23 May 2017 1 of 13 on June 21, 2018 http://stke.sciencemag.org/ Downloaded from
Transcript of Key determinants of selective binding and activation by...

SC I ENCE S I GNAL ING | R E S EARCH ART I C L E
B IOCHEM ISTRY
1Infection and Immunity Program, Monash Biomedicine Discovery Institute, andDepartment of Biochemistry and Molecular Biology, Monash University, Clayton,Victoria 3800, Australia. 2Drug Discovery Biology, Monash Institute of Pharmaceu-tical Sciences, Monash University, Parkville, Victoria 3052, Australia. 3Molecular En-docrinology and Pharmacology, Harry Perkins Institute of Medical Research, QEIIMedical Centre; and Centre for Medical Research, University of Western Australia,Crawley and Dimerix Bioscience Limited, Nedlands, Western Australia, Australia.*Corresponding author. Email: [email protected] (M.J.S.); [email protected] (M.C.)
Huma et al., Sci. Signal. 10, eaai8529 (2017) 23 May 2017
2017 © The Authors,
some rights reserved;
exclusive licensee
American Association
for the Advancement
of Science.
Dow
nload
Key determinants of selective binding and activationby the monocyte chemoattractant proteins at thechemokine receptor CCR2Zil E. Huma,1 Julie Sanchez,1 Herman D. Lim,2 Jessica L. Bridgford,1,2 Cheng Huang,1
Bradyn J. Parker,1 Jiann G. Pazhamalil,1 Benjamin T. Porebski,1 Kevin D. G. Pfleger,3
J. Robert Lane,2 Meritxell Canals,2* Martin J. Stone1*
Chemokines and their receptors collectively orchestrate the trafficking of leukocytes in normal immune functionand inflammatory diseases. Different chemokines can induce distinct responses at the same receptor. In comparisonto monocyte chemoattractant protein-1 (MCP-1; also known as CCL2), the chemokines MCP-2 (CCL8) and MCP-3(CCL7) are partial agonists of their shared receptor CCR2, a key regulator of the trafficking of monocytes and macro-phages that contribute to the pathology of atherosclerosis, obesity, and type 2 diabetes. Through experiments withchimeras of MCP-1 andMCP-3, we identified the chemokine amino-terminal region as being the primary determinantof both the binding and signaling selectivity of these two chemokines at CCR2. Analysis of CCR2mutants showed thatthe chemokine amino terminus interacts with the major subpocket in the transmembrane helical bundle of CCR2,which is distinct from the interactions of someother chemokineswith theminor subpockets of their receptors. Theseresults suggest the major subpocket as a target for the development of small-molecule inhibitors of CCR2.
ed
on June 21, 2018http://stke.sciencemag.org/
from
INTRODUCTIONHeterotrimeric guanine nucleotide–binding protein (G protein)–coupled receptors (GPCRs) are the largest family of transmembrane(TM) receptors and the targets of numerous therapeutics. ManyGPCRs can be activated by various different natural or synthetic ago-nists, which may give rise to distinct signaling outcomes. Whereaspartial agonists evoke a submaximal response relative to that of a fullagonist even at concentrations that saturate all receptor sites, biasedagonists can display pathway-dependent efficacy, activating certainpathways to the relative exclusion of others (1, 2).
The recent flood of GPCR structures has yielded a wealth ofinformation regarding receptor architecture, ligand-binding sites, andG protein–binding sites, as well as some details of the conformationalchanges associated with receptor activation (3–5). Consequently, wecan now begin to identify the structural mechanisms by which differentagonists induce distinct signaling outcomes.Here, we describe an analysisof the structural features underlying differential activation of a chemokinereceptor by its cognate chemokine ligands.
Chemokine receptors are GPCRs expressed in leukocyte mem-branes, whereas chemokines are small, soluble proteins expressed in tis-sues during normal immune surveillance or in response to injury orinfection.Activationof chemokine receptors by their cognate chemokinesinduces leukocyte migration into, and accumulation in, the chemokine-expressing tissues (6–8), a hallmark feature of the inflammatory response.Consequently, chemokine receptors are potential therapeutic targetsin a wide range of inflammatory diseases (9). There is increasing ev-idence that cognate chemokines can differentially activate their shared
receptors, including examples of partial agonism (10–14) and biasedagonism (15, 16).
CC chemokine receptor 2 (CCR2) is the major chemokine receptoron monocytes and macrophages, cells that play central roles in thepathology of atherosclerosis, obesity, and type 2 diabetes. In athero-sclerosis, CCR2 activation by the monocyte chemoattractant proteinsMCP-1, MCP-2, and MCP-3 induces the recruitment of monocytesfrom the blood into the arterial walls, where they differentiate intomacrophages and contribute to the development of atherosclerotic pla-ques (17). In obesity, CCR2 activation byMCPchemokines is associatedwith macrophage infiltration into adipose tissue and induction of insu-lin resistance (18). Considering the importance of CCR2 in inflamma-tory diseases, there is strongmotivation to understand itsmechanism ofactivation by its cognate chemokine ligands.
Although their distinct biological functions are not fully understood,the MCP chemokines are differentially expressed in response to type1 versus type 2 T helper cell inflammatory stimuli and can have distincttemporal patterns of expression, suggesting that they may also activatedistinct cellular responses through their shared receptor (19, 20). Insupport of this possibility, Berchiche et al. (13) showed that cognate che-mokines for CCR2 display differences in their efficacies of activation ofboth b-arrestin– and G protein–mediated signaling pathways. Here, weverified that this differential signaling can be attributed to partial ago-nism rather than biased agonism, and we used various chemokine chi-meras andCCR2mutants to identify key structural elements of both thechemokines and the receptor that mediate this differential activation.We interpreted our data in light of the published structures of chemokine-receptor complexes (21, 22), yielding insights into the design of selectivepharmacological agents.
RESULTSMCP chemokines have different efficacies andaffinities at CCR2We monitored the activation of CCR2 by MCP chemokines using oneproximal, nonamplified measure of receptor activation [recruitment of
1 of 13

SC I ENCE S I GNAL ING | R E S EARCH ART I C L E
on June 21, 2018http://stke.sciencem
ag.org/D
ownloaded from
b-arrestin 2 (b-arr2)] and two downstream, amplified signals [inhi-bition of adenosine 3′,5′-monophosphate (cAMP) formation and phos-phorylation of extracellular signal–regulated kinases 1 and 2 (ERK1/2)].The three chemokines induced recruitment of b-arr2 with differentpotencies and statistically significantly different maximal effects, Emax
(P < 0.01; Fig. 1A and Table 1); relative to MCP-1, the Emax values ofMCP-2 andMCP-3were 23 ± 3% and 56± 4%, respectively. In the twoamplified signaling assays, the three chemokines exhibited the samemaximal effects but statistically significantly different potencies andhigher potencies than in the b-arr2 assay (Fig. 1, B and C, and Table 1).The order of potencies between the three agonists in the amplified as-says was the same as the order of their maximal effects in the proximalassay. Moreover, the same rank order of binding affinities was alsoobserved in a radioligand-binding assay (Fig. 1D and Table 1). Theseresults are in agreement with the effects of MCP chemokines reportedpreviously (13).
Analysis of our data using an approach based on the operationalmodel of agonism (23, 24) indicated that the MCP chemokines didnot display biased agonism (fig. S1 and table S1) but instead thatMCP-2 and MCP-3 are partial agonists of CCR2, relative to MCP-1.Our data (Fig. 1, A to D) highlight two underlying differences in thereceptor interactions of the MCP chemokines. First, the three chemo-kines have different affinities for CCR2 (Fig. 1D). Second, the threechemokines had different maximal effects in the proximal b-arr2 re-cruitment assay (Fig. 1A). Although the rank order of these maximaleffects is the same as the rank order of affinities for the three chemo-kines, the maximal effects occur at ligand concentrations at whichthe receptor is fully occupied, so they do not result from differencesin binding affinity. Instead, they indicate that the ligands have distinctefficacies, that is, distinct intrinsic abilities to induce the receptor-mediated response. In the amplified assays (inhibition of cAMP andERK1/2 phosphorylation), the maximal effects of full and partial ago-nists were indistinguishable (the signals were amplified to the full capac-ity of the pathway evenwhen the activated state of the receptor was onlypartially populated). In such assays, the relative potency of the chemo-kines is determined by both the affinities of the chemokines for CCR2and their relative efficacies (25). The order of potency in the cAMP andpERK assays is consistent with both their relative affinities for the recep-tor and their relative Emax values in the proximal assay (Fig. 1, A to D).
An important consequence of partial agonism in the context of theb-arrestin assay is that subsequent regulatory processes, such as receptorinternalization, will also be submaximally engaged by the action ofpartial agonists. In agreementwith thework of Berchiche et al. (13), bothMCP-2 and MCP-3, at saturating concentrations, caused very limitedinternalization of CCR2, whereas MCP-1 stimulated statistically signif-icant internalization (P < 0.05; Fig. 1E). These differences correlate withthe relative efficacies of the three chemokines. Considering the robustand consistent differences observed among the MCP chemokines forCCR2 binding and activation (Fig. 1), this system is suitable for the in-vestigation of the structural features influencing the relative affinitiesand efficacies of different chemokines at their shared receptor.
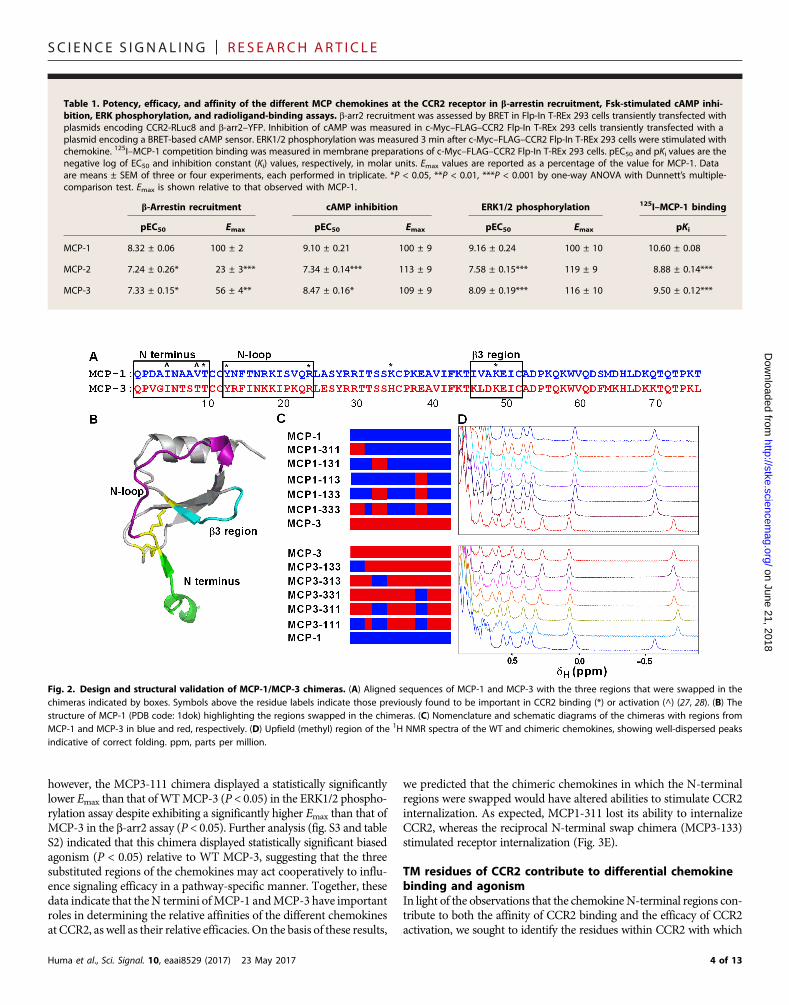
The chemokine N-terminal tail is a major determinant ofaffinity and efficacyMutational and structural studies have identified three regions ofchemokines that interact with receptors (26–29). The so-called N-loop(a ~12-residue sequence between the conserved CC or CXC motif andthe first b-strand) and the b3 region (third b-strand and preceding turn)form the two sides of a shallow groove that binds to the flexible
Huma et al., Sci. Signal. 10, eaai8529 (2017) 23 May 2017
N-terminal tail of the receptor. TheN-terminal region of the chemokine(preceding the CC or CXCmotif) penetrates into the TM helical bundleof the receptor. To identify the structural elements of MCP chemokinesthat contribute to partial versus full agonism and to relative CCR2affinity, we prepared a series of chimeras in which these three func-tionally important regions are swapped betweenMCP-1 andMCP-3(Fig. 2). MCP-3, rather thanMCP-2, was chosen primarily because itis more closely related toMCP-1, thereby simplifying the interpretationof the chimera experiments. Each chimera was named according to theparental chemokine from which it was derived followed by a sequenceof three numbers representing the origin of theN-terminal, N-loop, andb3 elements, respectively; for example, MCP1-133 is a chimera derivedfromMCP-1 and containing theN-terminal regionofMCP-1, theN-loopof MCP-3, and the b3 region of MCP-3. Each chimera was expressedas inclusion bodies in Escherichia coli, refolded, and purified. 1H nuclearmagnetic resonance (NMR) spectra (Fig. 2 and fig. S2) were similarto those of the wild-type (WT) chemokines, indicating that the chimeraswere well folded and adopted the expected native three-dimensional(3D) structures.
To assess the contributions of the three chemokine structural regionsto CCR2 binding affinity, we measured the abilities of the MCP chi-meras to compete with 125I–MCP-1 for binding to CCR2.MCP-1 had a10-fold higher affinity than that of MCP-3 for CCR2 (Fig. 3, A and B,and Table 2). Replacement of the N terminus of MCP-1 with that ofMCP-3 caused a decrease in affinity such that this chimeric chemokinedisplayed an affinity comparable to that of MCP-3. Similarly, replace-ment of the N terminus of MCP-3 with that of MCP-1 generated achimeric chemokine with comparable affinity to that of MCP-1. Theseresults indicate that the N terminus of MCP-1 has a substantial role indetermining its higher affinity for CCR2 compared to that ofMCP-3. Incontrast to the clear contribution of the N-terminal region to bindingselectivity, replacement of theN-loop, b3 region, or both ofMCP-1withthose of MCP-3 did not affect the binding affinity for CCR2 (Fig. 3, Aand B). Similarly, substitution of the b3 region of MCP-3 with that ofMCP-1 had no substantial effect on affinity. However, replacement ofthe N-loop of MCP-3 by that of MCP-1, alone or in combination withthe b3 region (chimerasMCP3-313 andMCP3-311), reduced the affin-ity for CCR2. This not only is consistent with the previous findings thatthe N-loop is a major contributor to CCR2 binding but also suggeststhat the ability of the N-loop to interact favorably with the receptor isdependent on the background scaffold in which it is located. Notably,subsequent introduction of the MCP-1 N-terminal region, resulting intheMCP3-111 chimera, increased its affinity for CCR2 100-fold relativeto that ofMCP3-311, again highlighting the importance of the N termi-nus as a determinant of the affinity of the chemokine for CCR2.
To assess the contributions of the three chemokine structural regionsto the efficacy of CCR2 activation, we measured the abilities of the che-mokine chimeras to stimulate b-arr2 recruitment (Fig. 3C). As describedearlier, MCP-3 displayed a statistically significantly lower maximaleffect than did MCP-1 (Figs. 1A and 3, B and C). Replacement of theN-loop, b3 region, or both of MCP-1 with those of MCP-3 (or vice ver-sa) caused no statistically significant changes inEmax. In contrast, replace-ment of the N terminus of MCP-1 with that of MCP-3, alone or incombination with replacement of both the N-loop and b3 region, subs-tantially decreased the maximal effect compared to MCP-1, to a valuecomparable to the maximal effect of MCP-3. This vital role of theN terminus in determining chemokine efficacy at CCR2 was furtherhighlighted in the reciprocal chimeras, whereby integration of theN terminus of MCP-1 into an MCP-3 background (MCP3-133 and
2 of 13

SC I ENCE S I GNAL ING | R E S EARCH ART I C L E
Huma et al., Sci. Signal. 10, eaai8529 (2017) 23 May 2017
on June 21, 2http://stke.sciencem
ag.org/D
ownloaded from
-
-
-
.--
--:f
-
-
f
--
018
MCP3-111) resulted in amarked increase in themax-imal effect. Furthermore, the Emax values of these twochimeras were greater than that ofWTMCP-1, againemphasizing that the background chemokine “con-text” plays an additional role in determining efficacyat CCR2. In addition to the Emax values, our data alsoshowed the potencies of the chemokine chimeras inthe b-arr2 recruitment assay. Although we observedno statistically significant differences in the potencies(Fig. 3B and Table 2), the rank order of potencies wasconsistent with those of the binding affinities andEmax values. Similarly, at themore amplified signalingend point of ERK1/2 phosphorylation (Fig. 3, B andD), replacing the N terminus of MCP-1 with that ofMCP-3 decreased potency, whereas replacing theN terminus of MCP-3 with that of MCP-1 increasedpotency, although these effects were not statisticallysignificant (Fig. 3B and Table 2).In the ERK1/2 phosphorylation assay, the twoWT chemokines and most chimeras displayed simi-lar maximal effects (Fig. 3, B and D, and Table 2);
Fig. 1. MCP chemokines display different efficacies andaffinities at CCR2. (A) Flp-In T-REx 293 cells transiently transfected with plasmids encoding CCR2-RLuc8 and b-arr2–yellowfluorescent protein (YFP) were stimulated with the indicatedconcentrations of MCP-1, MCP-2, or MCP-3 before being analyzedby BRET to assess the recruitment of b-arr2. Left: Concentrationresponse data and fitted curves. Right: Relative efficacy, definedas the Emax value relative to that of MCP-1. (B) c-Myc–FLAG–CCR2Flp-In T-REx 293 cells transiently transfected with plasmid encoding a BRET-based cAMP sensor were treated with 10 mM forskolinin the presence of the indicated concentrations of chemokinesLeft: Measurement of the percentage inhibition of forskolinstimulated cAMP production as a function of chemokine concentration. Right: Potency (pEC50) values. (C) Left: c-Myc–FLAG–CCR2Flp-In T-REx 293 cells were treated with the indicated concentrations of chemokines for 3 min before the amount of phosphorylated ERK1/2 was measured by AlphaScreen assay. RightPotency (pEC50) values. (D) Left: Membrane preparations oc-Myc–FLAG–CCR2 Flp-In T-REx 293 cells were incubated with45 pM 125I–MCP-1 in the presence of the indicated concentrations of chemokines before the extent of binding of 125I–MCP-1was determined by radioligand-binding assay. Right: Affinities(pIC50) for the three chemokines. (E) Left: c-Myc–FLAG–CCR2Flp-In T-REx 293 cells were incubated with 100 nM chemokinefor the indicated times before the extent of CCR2 internalization was determined by whole-cell anti–c-Myc enzyme-linkedimmunosorbent assay (ELISA). Right: Cell surface expression oCCR2 60 min after the addition of chemokine as a percentageof the amount of receptor present immediately before chemokine treatment. Data are means ± SEM of three to five experiments, each performed in triplicate. *P < 0.05, **P < 0.01, ***P <0.001, and ****P < 0.0001 by one-way analysis of variance(ANOVA) with Dunnett’s multiple-comparison test.
3 of 13
1
S C I ENCE S I GNAL ING | R E S EARCH ART I C L E
on June 21, 2018http://stke.sciencem
ag.org/D
ownloaded from
however, the MCP3-111 chimera displayed a statistically significantlylower Emax than that ofWTMCP-3 (P < 0.05) in the ERK1/2 phospho-rylation assay despite exhibiting a significantly higher Emax than that ofMCP-3 in the b-arr2 assay (P < 0.05). Further analysis (fig. S3 and tableS2) indicated that this chimera displayed statistically significant biasedagonism (P < 0.05) relative to WT MCP-3, suggesting that the threesubstituted regions of the chemokines may act cooperatively to influ-ence signaling efficacy in a pathway-specific manner. Together, thesedata indicate that theN termini ofMCP-1 andMCP-3 have importantroles in determining the relative affinities of the different chemokinesat CCR2, as well as their relative efficacies. On the basis of these results,
Huma et al., Sci. Signal. 10, eaai8529 (2017) 23 May 2017
we predicted that the chimeric chemokines in which the N-terminalregions were swapped would have altered abilities to stimulate CCR2internalization. As expected, MCP1-311 lost its ability to internalizeCCR2, whereas the reciprocal N-terminal swap chimera (MCP3-133)stimulated receptor internalization (Fig. 3E).
TM residues of CCR2 contribute to differential chemokinebinding and agonismIn light of the observations that the chemokineN-terminal regions con-tribute to both the affinity of CCR2 binding and the efficacy of CCR2activation, we sought to identify the residues within CCR2 with which
Table 1. Potency, efficacy, and affinity of the different MCP chemokines at the CCR2 receptor in b-arrestin recruitment, Fsk-stimulated cAMP inhi-bition, ERK phosphorylation, and radioligand-binding assays. b-arr2 recruitment was assessed by BRET in Flp-In T-REx 293 cells transiently transfected withplasmids encoding CCR2-RLuc8 and b-arr2–YFP. Inhibition of cAMP was measured in c-Myc–FLAG–CCR2 Flp-In T-REx 293 cells transiently transfected with aplasmid encoding a BRET-based cAMP sensor. ERK1/2 phosphorylation was measured 3 min after c-Myc–FLAG–CCR2 Flp-In T-REx 293 cells were stimulated withchemokine. 125I–MCP-1 competition binding was measured in membrane preparations of c-Myc–FLAG–CCR2 Flp-In T-REx 293 cells. pEC50 and pKi values are thenegative log of EC50 and inhibition constant (Ki) values, respectively, in molar units. Emax values are reported as a percentage of the value for MCP-1. Dataare means ± SEM of three or four experiments, each performed in triplicate. *P < 0.05, **P < 0.01, ***P < 0.001 by one-way ANOVA with Dunnett’s multiple-comparison test. Emax is shown relative to that observed with MCP-1.
b-Arrestin recruitment
cAMP inhibition ERK1/2 phosphorylation 125I–MCP-1 bindingpEC50
Emax pEC50 Emax pEC50 Emax pKiMCP-1
8.32 ± 0.06 00 ± 2 9.10 ± 0.21 100 ± 9 9.16 ± 0.24 100 ± 10 10.60 ± 0.08MCP-2
7.24 ± 0.26* 23 ± 3*** 7.34 ± 0.14*** 113 ± 9 7.58 ± 0.15*** 119 ± 9 8.88 ± 0.14***MCP-3
7.33 ± 0.15* 56 ± 4** 8.47 ± 0.16* 109 ± 9 8.09 ± 0.19*** 116 ± 10 9.50 ± 0.12***Fig. 2. Design and structural validation of MCP-1/MCP-3 chimeras. (A) Aligned sequences of MCP-1 and MCP-3 with the three regions that were swapped in thechimeras indicated by boxes. Symbols above the residue labels indicate those previously found to be important in CCR2 binding (*) or activation (^) (27, 28). (B) Thestructure of MCP-1 (PDB code: 1dok) highlighting the regions swapped in the chimeras. (C) Nomenclature and schematic diagrams of the chimeras with regions fromMCP-1 and MCP-3 in blue and red, respectively. (D) Upfield (methyl) region of the 1H NMR spectra of the WT and chimeric chemokines, showing well-dispersed peaksindicative of correct folding. ppm, parts per million.
4 of 13

SC I ENCE S I GNAL ING | R E S EARCH ART I C L E
on June 21, 2018http://stke.sciencem
ag.org/D
ownloaded from
the chemokine N-terminal regions interact. Published structures of twochemokine-receptor complexes (21, 22) have confirmed that theN-terminal regions of chemokines penetrate into the TMhelical bundlesof their receptors, where they presumably cause structural rearrange-ments and signaling. To identify specific residues of CCR2 that con-tribute to these interactions, we characterized chemokine binding andactivation for a series of CCR2mutants. Guided by a homologymodelof theMCP-1/CCR2 complex, which was based on the reported struc-ture of receptor CXCR4 cross-linked to chemokine vMIP-II (21), wedesigned six point mutants and four double mutants at positions
Huma et al., Sci. Signal. 10, eaai8529 (2017) 23 May 2017
pointing toward the interior of the TM bundle (fig. S4 and Table 3).Each mutant was stably expressed in FlpIn human embryonic kidney(HEK) 293 cells with an N-terminal cMyc epitope tag, enabling mea-surement of cell surface expression. After confirming thatmutant pro-teins were expressed in similar amounts to that of WT CCR2 (Table 3),we evaluated the affinity of chemokine binding at eachmutant receptor.We extended this evaluation to measure the potency and efficacy ofMCP-1 andMCP-3 at the mutant receptors using ERK1/2 phosphoryl-ation as a convenient measurement of receptor activation that does notrequire the use ofmodified receptor fusion constructs or overexpression
Fig. 3. The N-terminal tail of MCP-1 and MCP-3 is a major determinant of affinity and efficacy. (A to D) 125I–MCP-1 competition binding, b-arr2 recruitment BRET,and ERK1/2 phosphorylation were assessed for MCP-1 and chimeras in the MCP-1 background (shades of blue) and for MCP-3 and chimeras in the MCP-3 background(shades of red). (A) Membrane preparations of c-Myc–FLAG–CCR2 Flp-In T-REx 293 cells were incubated with 45 pM 125I–MCP-1 in the presence of the indicatedconcentrations of chemokines before the extent of binding of 125I–MCP-1 was determined by radioligand-binding assay. Top: Competitive displacement data for MCP-1 and chimeras in the MCP-1 background. Bottom: Competitive displacement data for MCP-3 and chimeras in the MCP-3 background. (B) Left: Schematic representationsof the WT and chimeric chemokines. As indicated, measurements of the affinity (pKi) of the indicated chemokines for CCR2, as determined by 125I–MCP-1 competition, thepotency (pEC50) and efficacy (Emax) of chemokines in the b-arr2 recruitment assay, and the potency (pEC50) and efficacy (Emax) of chemokines in the ERK1/2 phospho-rylation assay. (C) Flp-In T-REx 293 cells transiently transfected with plasmids encoding CCR2-RLuc8 and b-arr2–YFP were stimulated with the indicated concentrationsof WT or chimeric chemokines before being analyzed by BRET to assess the recruitment of b-arr2. Top: Concentration-response data for MCP-1 and chimeras in the MCP-1background. Bottom: Concentration-response data for MCP-3 and chimeras in the MCP-3 background. (D) c-Myc–FLAG–CCR2 Flp-In T-REx 293 cells were treated with theindicated concentrations of WT or chimeric chemokines for 3 min before the amount of phosphorylated ERK1/2 was measured by AlphaScreen assay. Top: Concentration-response data for MCP-1 and chimeras in the MCP-1 background. Bottom: Concentration-response data for MCP-3 and chimeras in the MCP-3 background. (E) c-Myc–FLAG–CCR2 Flp-In T-REx 293 cells were incubated with the indicated chemokine (100 nM) for 60 min before the cell surface expression of CCR2 was determined bywhole-cell anti–c-Myc ELISA. Expression is presented as a percentage of that of the vehicle control. Data are means ± SEM of three to five experiments, each performedin triplicate. *P < 0.05, **P < 0.01, ***P < 0.001, and ****P < 0.0001 compared to MCP-1. ^P < 0.05, ^^P < 0.01, ^^^P < 0.001, and ^^^^P < 0.0001 compared to MCP-3.Statistical analysis was by one-way ANOVA with Dunnett’s multiple-comparison test.
5 of 13

SC I ENCE S I GNAL ING | R E S EARCH ART I C L E
on June 21, 2018http://stke.sciencem
ag.org/D
ownloaded from
of signaling effectors. None of the mutations significantly changed theaffinities forMCP-1 orMCP-3 compared to that ofWTCCR2 (Table 3,Fig. 4A, and fig. S5). However, comparison of the relative affinities ofMCP-1 and MCP-3 at the different mutants was more revealing.MCP-3 displayed a 10-fold lower affinity for WT CCR2 than that ofMCP-1. Whereas this difference in affinity was maintained in most ofthe CCR2mutants, no such difference in affinity was observed with theR206A and Y259F mutants. Therefore, the difference in affinity be-tweenMCP-1 andMCP-3 appears to be governed, at least in part, bythese two residues.
As shown earlier with WT CCR2, MCP-1 displayed a statisticallysignificantly higher potency than that of MCP-3. This difference inpotency was maintained across most mutants, in accordance with therelative affinities for the two ligands (Fig. 4B and fig. S5). Nevertheless,the Y259F mutant displayed increased potency for both chemokines;the double-mutant I263A/N266A displayed statistically significantlyincreased potency for MCP-1 (P = 0.003) and a smaller, but not signif-icant, increase forMCP-3; and the D284Amutant showed a statisticallysignificantly increased potency for MCP-1 (P < 0.01) but not MCP-3(Fig. 4B). Although the potencies of ERK1/2 phosphorylation correlatedwell with CCR2 binding affinities for theWT chemokines (Fig. 1), therewas a poor correlation between affinity and potency when comparingthe same chemokine across the set of CCR2 mutants (fig. S6, A and B).This suggests that some of the mutations influenced the mechanism ofreceptor signaling rather than ligand binding. To further explore thispossibility, we examined themaximal effects stimulated by the two che-mokines in the ERK1/2 phosphorylation assay (Fig. 4C and figs. S5 andS6C). The CCR2 mutants Y120F, R206A, E270A/F272A, and E291A
Huma et al., Sci. Signal. 10, eaai8529 (2017) 23 May 2017
displayed statistically significantly lower Emax values for both MCP-1 andMCP-3 compared to those ofWTCCR2 (P < 0.05). Furthermore,the maximal effect of MCP-1, but not MCP-3, was statistically signifi-cantly reduced for the I263A/N266A mutant. Conversely, the double-mutant N199A/T203A displayed a statistically significantly reducedEmax for MCP-3 (P < 0.01), but not MCP-1. Finally, the mutationK34A caused an increase in Emax relative to that of WT CCR2 forMCP-1, and a similar trend was observed for MCP-3. The cell surfaceexpression of all mutants was not significantly different. Thus, thesechanges inmaximal signaling likely reflect the roles of these residues inconformational rearrangement of CCR2 coupled to the ERK1/2signaling pathways.
DISCUSSIONHumans and other mammals express a complex array of chemokinesand chemokine receptors that collectively orchestrate the traffickingof leukocytes, a central feature of the innate immune response. The ex-istence of multiple chemokines that activate the same receptor was pre-viously thought to represent functional redundancy. However, somedata, including observations of partial agonism (10–14) and biasedagonism (15, 16), increasingly suggest that different chemokines are ableto alter receptor responses in a subtle and selective manner. Here, wehave begun to elucidate the structural features underlying the partialagonism of MCP chemokines at their shared receptor CCR2.
Numerous previous structure-function studies of chemokines haveidentified residues within the N-loop and b3 region as being critical forbinding interactions and residues within theN-terminal region as being
Table 2. Potency, efficacy, and affinity of the chimeric MCP proteins at CCR2 in b-arrestin recruitment, ERK phosphorylation, and radioligand-bindingassays. 125I–MCP-1 competition binding was measured in membrane preparations of c-Myc–FLAG–CCR2 Flp-In T-REx 293 cells. b-arr2 recruitment wasassessed by BRET in Flp-In T-REx 293 cells transiently transfected with plasmids encoding CCR2-RLuc8 and b-arr2–YFP. ERK1/2 phosphorylation wasmeasured 3 to 5 min after c-Myc–FLAG–CCR2 Flp-In T-REx 293 cells were stimulated with chemokine. pEC50 and pKi values are the negative log of EC50and Ki values, respectively, in molar units. Emax values are relative to the positive control. Data are means ± SEM of three or four experiments, eachperformed in triplicate. *P < 0.05, **,^^P < 0.01, ***,^^^P < 0.001, compared to MCP-1 or MCP-3, respectively. Statistical analysis was by one-way ANOVAwith Dunnett’s multiple-comparison text.
b-Arrestin recruitment
ERK1/2 phosphorylation 125I–MCP-1 bindingpEC50
Emax pEC50 Emax pKiMCP-1
8.00 ± 0.13 0.100 ± 0.006^^^ 7.87 ± 0.32 37.8 ± 3.4 10.67 ± 0.18^^MCP1-311
7.30 ± 0.21 0.067 ± 0.006* 6.84 ± 0.17 40.3 ± 3.2 9.90 ± 0.18MCP1-131
8.32 ± 0.13 0.11 2 ± 0.006^^^ 7.64 ± 0.26 43.7 ± 3.7 10.53 ± 0.17^^MCP1-113
8.12 ± 0.13 0.111 ± 0.006^^^ 7.58 ± 0.46 46.7 ± 6.8 10.68 ± 0.16^^MCP1-133
8.45 ± 0.27 0.103 ± 0.009^^ 7.86 ± 0.42 36.4 ± 5.0 10.84 ± 0.16^^MCP1-333
7.82 ± 0.58 0.034 ± 0.009*** 6.95 ± 0.29 24.0 ± 3.1 10.02 ± 0.17MCP-3
7.63 ± 0.17 0.060 ± 0.004** 7.21 ± 0.31 34.3 ± 4.0 9.50 ± 0.19**MCP3-133
8.24 ± 0.11 0.0135 ± 0.005^^^ 8.12 ± 0.33 25.9 ± 2.3 10.36 ± 0.14MCP3-313
7.17 ± 0.22 0.051 ± 0.006*** 7.43 ± 0.27 33.1 ± 3.0 7.45 ± 0.23***,^^MCP3-331
7.65 ± 0.22 0.056 ± 0.006** 7.66 ± 0.36 21.7 ± 2.3* 8.77 ± 0.33***MCP3-311
7.13 ± 0.39 0.050 ± 0.010*** 7.87 ± 0.14 40.0 ± 1.6 7.32 ± 0.32***,^^MCP3-111
7.61 ± 0.20 0.134 ± 0.010^^^ 7.99 ± 0.36 21.3 ± 2.4* 9.80 ± 0.176 of 13

1
1
1
1
S C I ENCE S I GNAL ING | R E S EARCH ART I C L E
on June 21, 2018http://stke.sciencem
ag.org/D
ownloaded from
critical for receptor activation (26–29). These conclusions are encapsulatedby the two-site model, which postulates that chemokines first use theirN-loop and b3 residues [chemokine site 1 (CS1)] to bind to the receptorN terminus [receptor site 1 (RS1)], and subsequently, the chemokineN terminus [chemokine site 2 (CS2)] activates the receptor by binding toits TM helices [receptor site 2 (RS2)], causing conformational changesand cellular signaling (29). The presumption that binding and activationoccur in two discrete steps rather than concomitantly is not derivedfrom kinetic measurements but instead deduced from indirect evidencesuch as the ability of N-terminally truncated chemokines to bindstrongly without activating their receptors (30, 31). Recent structuresof two chemokine-receptor complexes (21, 22) not only helped tovalidate key features of the two-site model but also suggested that thetwo sites may not be completely independent. A number of additionalobservations have also suggested that elaborations of the two-sitemodelmay be necessary (32). In summary, although the two-site model isbroadly supported by structural andmutational data and has served as auseful guide for mechanistic studies, it is too simplistic to account forsuch subtle observations as partial or biased agonism.
The structure-function relationships ofMCP-1 have been thoroughlyexaminedinaseminalstudybyHandelandco-workers(27,28).MCP-1 resi-dues Thr10 (N-terminal region, immediately preceding the CC mo-tif), Tyr13 and Arg24 (N-loop), Lys35 (“30s” loop), and Lys49 (b3 region)make substantial contributions to CCR2 binding affinity, whereas theN-terminal residues Ile5 and Val9 of MCP-1 contribute to signalingthroughCCR2. Almost all of theMCP-1 residues shown to play key rolesin CCR2 binding or activation are identical inMCP-3. Thus, the interac-
Huma et al., Sci. Signal. 10, eaai8529 (2017) 23 May 2017
tions of these residues are likely to also occur for MCP-3 and do notaccount for the differences in the CCR2 binding affinity or efficacy ofMCP-1 and MCP-3. In agreement with the previous observations ofMCP-1 mutants and the two-site model, our b-arr2 recruitment datafor MCP1-311 andMCP3-133 indicate that the chemokine N-terminalregion is the major selectivity determinant of receptor activation man-ifested by changes in the intrinsic efficacy of these different chemokines.However, surprisingly, our analysis of MCP-1 and MCP-3 chimerasalso identified theN-terminal region as being the primary determinant ofthe binding selectivity of these two chemokines to CCR2. Residueswithinthis region were not previously found to contribute to binding affinity,with the sole exception of Thr10 (27), which is identical in MCP-1 andMCP-3. Our results are consistent with the prevailing model that mostof the binding affinity for both chemokines is provided by residues in theN-loop and b3 regions. However, it now appears that these regions con-tribute equally to the CCR2 binding affinities of both chemokines,whereas the N-terminal region of MCP-1 contributes more bindingenergy compared to the N-terminal region of MCP-3, resulting in thehigher binding affinity of MCP-1. In the two-site model, the chemokineN-terminal region corresponds to CS2, which is considered to be the keydeterminant of receptor activation but not to play a role in the initialbinding step. Our results suggest an extension of the two-site model suchthat interactions between CS2 and RS2 contribute either to the initialbinding step or to the formation of a more stable complex subsequentto initial binding but before (or concomitant with) receptor activation.
To identify receptor residues that interact with the N-terminal re-gions of MCP-1, MCP-3, or both, we mutated residues in CCR2 whose
Table 3. Characterization of CCR2 mutants. Cell surface expression (receptor abundance) was measured by anti–c-Myc ELISA in c-Myc–FLAG–CCR2 Flp-InT-REx 293 cells, and data are expressed as a percentage of the abundance of the WT receptor. The affinities (pKi) of MCP-1 and MCP-3 for WT and mutantCCR2 proteins were measured by 125I–MCP-1 competition binding assays with cell membrane preparations. The potency (pEC50) and efficacy (Emax) valuesof MCP-1 and MCP-3 for WT and mutant CCR2 proteins in ERK1/2 phosphorylation assays were measured 3 min after c-Myc–FLAG–CCR2 Flp-In T-REx293 cells were stimulated with chemokine. pEC50 and pKi values are the negative log of EC50 and Ki values, respectively, in molar units. Emax values arerelative to the positive control. Data are means ± SEM of three or four experiments, each performed in triplicate. For radioligand binding, ^P < 0.05as compared to MCP-1 for each mutant. Analysis was by multiple t test. For ERK1/2 phosphorylation, *P < 0.05, **P < 0.01, ***P < 0.001 as compared toWT CCR2. Analysis was by one-way ANOVA with Dunnett’s multiple-comparison test.
Mutation
Location# Cell surface expression pKi pERK1/2pEC50pERK1/2Emax (% FBS)
MCP-1
MCP-3 MCP-1 MCP-3 MCP-1 MCP-3WT
100 ± 3 10.82 ± 0.18 9.64 ± 0.19^ 8.01 ± 0.23 7.30 ± 0.23 38.9 ± 3 35.5 ± 4.5K34A
TM1 (1.28) 119 ± 12 10.42 ± 0.27 9.70 ± 0.42 8.41 ± 0.24 7.70 ± 0.23 55.5 ± 2.5*** 45.0 ± 2.8Y120F
TM3 (3.32) 118 ± 13 11.15 ± 0.18 9.65 ± 0.26^ 7.92 ± 0.32 7.58 ± 0.33 25.4 ± 2** 16.6 ± 1.6***V187/V189A
ECL2 108 ± 6 11.36 ± 0.29 9.85 ± 0.32^ 7.99 ± 0.26 7.28 ± 0.23 30.5 ± 2 30.8 ± 2.3N199A/T203A
TM5 (5.35/5.39) 116 ± 7 11.42 ± 0.29 0.17 ± 0.47 7.66 ± 0.23 7.35 ± 0.33 32.8 ± 2 20.2 ± 2.3**R206A
TM5 (5.42) 112 ± 7 10.29 ± 0.22 0.12 ± 0.33 8.25 ± 0.31 7.81 ± 0.34 11.0 ± 0.8*** 14.8 ± 2.5***Y259F
TM6 (6.51) 99 ± 6 10.44 ± 0.23 0.20 ± 0.14 8.78 ± 0.36* 8.57 ± 0.26** 31.9 ± 1.7 39.3 ± 1.7I263A/N266A
TM6 (6.55/6.58) 107 ± 8 10.79 ± 0.24 8.99 ± 0.17^ 9.46 ± 0.39** 8.22 ± 0.38 24.7 ± 2*** 36.9 ± 3.4E270A/F272A
TM6/ECL3 99 ± 13 11.68 ± 0.39 0.06 ± 0.31^ 7.36 ± 0.20 7.36 ± 0.20 22.3 ± 1.3*** 22.1 ± 1.5**D284A
TM7 (7.32) 104 ± 5 10.91 ± 0.16 9.52 ± 0.25^ 8.83 ± 0.40** 7.80 ± 0.18 34.9 ± 2 39.1 ± 1.9E291A
TM7 (7.39) 107 ± 9 10.26 ± 0.24 9.03 ± 0.22^ 7.66 ± 0.40 7.09 ± 0.48 27.9 ± 3* 12.1 ± 2.2*** #Ballesteros and Weinstein numbering of TM residues is shown in parentheses (33).7 of 13

SC I ENCE S I GNAL ING | R E S EARCH ART I C L E
on June 21, 2018http://stke.sciencem
ag.org/D
ownloaded from
side chains are predicted to point toward the interior of the TM helicalbundle. Several of the mutants displayed altered chemokine binding. Inparticular, mutation of Arg2065.42 or Tyr2596.51 [superscripts indicateBallesteros-Weinsteinnumbering (33)] completely abolished the~10-fold
Huma et al., Sci. Signal. 10, eaai8529 (2017) 23 May 2017
binding selectivity of CCR2 for MCP-1 over MCP-3. These residuesform a closely packed cluster with residues Tyr1203.32, Ile2636.55, andGlu2917.39 in a region where TM helices 3, 5, 6, and 7 come together,previously defined as the “major subpocket” of the receptor (Fig. 5, A toC)
Fig. 4. Identification of CCR2 residues contributing to MCP-1 and MCP-3 binding and agonism. (A to C) 125I–MCP-1 competition binding and ERK1/2 phospho-rylation were assessed for MCP-1 and MCP-3 at the WT and mutant CCR2 proteins expressed in Flp-In T-REx 293 cells. (A) Membrane preparations of c-Myc–FLAG–CCR2Flp-In T-REx 293 cells expressing WT or the indicated mutant receptors were incubated with 45 pM 125I–MCP-1 in the presence of various concentrations of chemokinesbefore the extent of binding of 125I–MCP-1 was determined by radioligand-binding assay. Left: Binding affinity (pKi) of MCP-1 for each WT and mutant receptor (blue).Middle: Binding affinity (pKi) of MCP-3 for each WT and mutant receptor. Right: The differences between the pKi values of MCP-1 and MCP-3 for each WT and mutantreceptor (black/gray). ^P < 0.05, compared to the difference observed at the WT receptor;*P < 0.05, compared to zero (that is, indicating difference between chemo-kines). Analysis was by multiple t test. (B and C) c-Myc–FLAG–CCR2 Flp-In T-REx 293 cells were treated with various concentrations of WT or chimeric chemokines for 3 minbefore the amount of phosphorylated ERK1/2 was measured by AlphaScreen assay. (B) Left: Potency (pEC50) of MCP-1 for each WT and mutant receptor (blue). Middle:Potency (pEC50) of MCP-3 for each WT and mutant receptor (red). Right: The differences between pEC50 values of MCP-1 and MCP-3 for each WT and mutant receptor(gray/black). *P < 0.05, **P < 0.01 compared to the potency observed at the WT receptor, by one-way ANOVA with Dunnett’s multiple-comparison test. (C) Left: Efficacy (Emax)of MCP-1 for each WT and mutant receptor (blue). Middle: Efficacy (Emax) of MCP-3 for each WT and mutant receptor (red). Right: The ratios between the Emax values ofMCP-1 and MCP-3 for each WT and mutant receptor (gray/black). *P < 0.05, **P < 0.01, ***P < 0.001, ****P < 0.0001 compared to the values observed at the WT receptor,by one-way ANOVA with Dunnett’s multiple-comparison test. Data are means ± SEM of three to five experiments, each performed in triplicate.
8 of 13

SC I ENCE S I GNAL ING | R E S EARCH ART I C L E
on June 21, 2018http://stke.sciencem
ag.org/D
ownloaded from
(34). In support of the contribution of this structural region tobinding, mutation of Ile263 (in the I263A6.55/N266A6.58 double mutant)slightly reduced the affinity for MCP-3, and mutation of Glu2917.39
slightly reduced the affinity for both MCP-1 and MCP-3 (Table 3).Although we cannot exclude the possibility that this cluster of aminoacids influences chemokine binding through an indirect, allostericmechanism, these residues are adjacent to the extreme N terminus ofthe bound chemokine in our homology model (Fig. 5, A to C), suggest-ing that they interact directly with the chemokine ligands. This conclu-sion is supported by an exhaustivemutagenesis study of CXCR4 defininga similar cluster of signal “initiation residues” adjacent to the N terminusof CXCL12 (35). Notably, in the complex of vMIP-II with CXCR4 fromwhich our homology model was derived, the N terminus of vMIP-IIpoints slightly away from these residues into the “minor subpocket”of CXCR4 (Fig. 5, D and E) (21). Our data suggest that the interactionsof the CCR2major subpocket with the chemokine N terminus play acritical role in stabilizing the chemokine-receptor complex and indetermining the relative affinities of MCP-1 andMCP-3 at their sharedreceptor.
Among the CCR2mutations that reduced chemokine binding af-finity, the Y259F and I263A/N266A mutations surprisingly causedincreased potency of MCP-1 and/or MCP-3. This lack of correlationbetween potency and affinity can be rationalized by considering thepossible interactions of these residues in the chemokine-receptor com-plex before undergoing the conformational change required for activa-
Huma et al., Sci. Signal. 10, eaai8529 (2017) 23 May 2017
tion (the inactive state) and after this conformational change (the activestate). Our affinity measurements were performed in the presence ofguanine nucleotides and therefore are likely to probe interactions inthe (G protein–uncoupled) inactive state, whereas the potency ofERK1/2 phosphorylation is likely to be more sensitive to interactionsin the active state.We suggest that the Y259F and I263A/N266Amu-tations disrupt interactions in the inactive state but favor the transitionto the active state, thereby enhancing potency. In contrast, the R206Aand E291Amutants displayed decreased affinity and decreased efficacyof ERK1/2 phosphorylation without exhibiting any statistically signifi-cant change in potency.Disruption of these residuesmay alter the struc-ture of the active state such that it is no longer well coupled to ERKsignaling effectors.
Several CCR2 mutations influenced ERK1/2 phosphorylation with-out affecting chemokine binding affinity. In particular, the D284A7.32
mutation enhanced the potency of ERK phosphorylation in responseto MCP-1, and the K34A1.28 mutation enhanced the efficacy of ERKphosphorylation in response to either chemokine. These two residuesare located adjacent to each other and form a salt bridge in our homol-ogy model (Fig. 5B). We propose that these residues do not contributedirectly to ligand interactions but instead stabilize the inactive stateof the receptor by interactingwith each other, other residues on adjacentTM helices, or both. Disruption of these interactions may thereforefacilitate the transition to the active state, albeit at the expense of desta-bilizing the unbound receptor structure.
Fig. 5. The major subpocket of CCR2 recognizes the N termini of MCP chemokines. (A to C) Full (A) and detailed side views (B) and end-on view (C) (from theextracellular perspective) showing the homology model of CCR2 bound to MCP-1. CCR2 TM helices are colored salmon (TM1), orange (TM2), pale yellow (TM3), palegreen (TM4), aquamarine (TM5), light blue (TM6), and violet (TM7); other receptor residues are in gray. Side chain sticks, labeled with single-letter amino acid code andresidue number, are shown for several residues discussed in the text in darker shades of the same colors as the helices in which they are located. MCP-1 is in teal withthe N terminus in rainbow colors from blue (residue 1) to red (residue 10). In (C), the major (M) and minor (m) subpockets are labeled in red. (D and E) The CXCR4/vMIP-IIcomplex (PDB code: 4rws) is displayed as described for the CCR2/MCP-1 complex in (B) and (C). (F and G) The CCR5/maraviroc complex (PDB code: 4mbs) is displayed asdescribed for the CCR2/MCP-1 complex in (B) and (C). Maraviroc is shown as sticks colored by element (carbon, green; nitrogen, blue; oxygen, red).
9 of 13
SC I ENCE S I GNAL ING | R E S EARCH ART I C L E
In summary, we have shown that the distinct affinities and efficaciesof CCR2 activation by MCP chemokines can be primarily attributedto the interactions of the chemokine N-terminal region, suggesting anelaboration of the two-site model in which the chemokine N terminuscontributes to binding interactions before receptor activation occurs.By analyzing CCR2mutants, we identified a cluster of CCR2 residuesnestled between TM helices 3, 5, 6, and 7 that appears to be the keybinding site for the chemokine N terminus. Considering that theequivalent residues of chemokine receptor CCR5 comprise a substantialpart of the binding site for the anti-HIV drug and CCR5 inhibitor mar-aviroc (Fig. 5, F and G) (36), our results suggest that this site withinCCR2 may also be a suitable target for the future development ofsmall-molecule CCR2 inhibitors with potential applications in ath-erosclerosis, obesity, diabetes, and other macrophage-associated in-flammatory diseases.
on June 21, 2018http://stke.sciencem
ag.org/D
ownloaded from
MATERIALS AND METHODSReagentsDulbecco’s modified Eagle’s medium (DMEM) and Hanks’ balancedsalt solution (HBSS) were from Invitrogen. Blasticidin and HygroGoldwere from InvivoGen. Fetal bovine serum (FBS) was from In VitroTechnologies. Polyethyleneiminewas fromPolysciences Inc. Coelenter-azine h was from NanoLight. All the other reagents were purchasedfrom Sigma-Aldrich.
Chimeric chemokine constructsTen chimeras of human chemokines MCP-1 (obligate monomericmutant P8A) and MCP-3 were designed on the basis of the alignedsequences (Fig. 2); the WT MCP-1 and all MCP-1–derived chimeraused in this study contain the P8Amutation.We chose to useMCP-3rather than MCP-2 for these chimeras for the following reasons: (i)The sequence ofMCP-1 is more closely related toMCP-3 (71% iden-tity) than to MCP-2 (61% identity), allowing us to more easily drawconclusions about the roles of specific residues. (ii) Both MCP-3 andtheMCP-1(P8A) mutant used here are monomeric, whereas MCP-2exists in equilibriumbetweenmonomeric and dimeric forms, potentiallycomplicating the interpretation of chimera experiments if MCP-2 wasused (especially in determining whether the chimeras were correctlyfolded). (iii) MCP-2 gives a very weak signal in the b-arr2 recruitmentassay, so there may not have been a large-enough window to reliablymeasure any decreases in efficacywhen assessing the effects of chimeras,whereas MCP-3 gives a slightly higher signal (larger window) thatallows for “confident” detection of both increases and decreases inefficacy. (iv) In our expression system, MCP-3 gives a higher yield thanMCP-2, so preparation of chimeras was expected to be more straight-forward. Each chimera consisted of the sequence of one chemokine withone or more of the following three regions replaced by the correspondingresidues from the other chemokine: N terminus (residues 1 to 10),N-loop (residues 12 to 24), and b3 region (residues 46 to 52). ForN-loopsubstitutions, residue Val22 (MCP-1) and Lys22 (MCP-3) were notreplaced, and for b3 region substitutions, residue Ile46 (MCP-1) andLys46 (MCP-3) were not replaced because these residues are buried inthe hydrophobic core, and mutation would be expected to disrupt theprotein fold. Genes encoding the chimeras (with an N-terminal His-tagand modified thrombin cleavage site for tag removal) were constructedby recursive polymerase chain reaction (PCR) using overlapping oli-gonucleotides. The PCR products were ligated into the Nco I/Xho I(MCP-1 background) orNco I/BamHI (MCP-3 background) restriction
Huma et al., Sci. Signal. 10, eaai8529 (2017) 23 May 2017
sites of the pET28a plasmid and transformed intoDH5a E. coli. Coloniescontaining recombinant plasmids were screened by PCR and verified byDNA sequencing. Amino acid sequences of the chemokines and chi-meras are listed in fig. S7.
Chemokine expression and purificationAll chemokines and chimeras were expressed and purified as describedby Tan et al. (37). Briefly, the N-terminal His6-tagged protein wasexpressed fromBL21 (DE3) E. coli in LBmedia by induction with IPTG(isopropyl-b-D-thiogalactopyranoside). Inclusion bodies containing thefusion proteins were isolated and dissolved in denaturing buffer andthen purified by Ni2+-affinity chromatography. The fusion proteinwas refolded by dropwise dilution, the His6-tag was removed usinghuman thrombin, and the untagged protein (containing the nativeN terminus)was further purifiedby size exclusionchromatography.Puritywas evaluated by SDS–polyacrylamide gel electrophoresis, and pro-tein identity was confirmed by MALDI-TOF (matrix-assisted laserdesorption/ionization–time-of-flight)mass spectrometry (table S3). ForNMR, samples were exchanged into 20mM sodium acetate-d4, pH 7.0,containing 5%D2O.
1HNMR spectrawere recorded at 25°C, referencedto external dextran sulfate sodium, on a Bruker Avance 600-MHzNMRspectrometer equipped with a triple-resonance cryoprobe and analyzedusing Bruker TopSpin software.
Homology modeling of the CCR2/MCP-1 complexToguidemutant selection, we constructed a homologymodel of humanCCR2 bound to human MCP-1 based on the crystal structure ofCXCR4 bound (and cross-linked) to the viral chemokine vMIP-II[Protein Data Bank (PDB) code: 4RWS] (21). Briefly, the sequencesof CCR2 and CXCR4 were aligned by pairwise sequence alignment,and the programModeller v. 9.12 (38) was used to construct 3Dmodelsof CCR2 based on the CXCR4 coordinates. The best CCR2 model,selected on the basis of Molpdf and high precision Discrete OptimizedProtein Energy (DOPE-HR) scores, was overlaid with CXCR4, and thestructure of MCP-1 (single protomer extracted from PDF file 1DOM)was overlaidwith vMIP-II in the 4RWS structure. The aligned structureswere then used to build a composite model of CCR2 bound to MCP-1.Chain termini were capped with neutral groups (acetyl and methyl-amide). Residues were protonated according to their states at pH 7.Completed structures were inserted into a palmitoyl oleoyl phosphati-dyl choline (POPC) bilayer measuring 85 Å by 85 Å and then solvatedin a rectangular simulation box leaving at least 46 Å of water on eitherside of the bilayer using the CHARMM-GUI membrane builder (39).System charges were neutralized with respective sodium and chloridecounter ions. Proteins, ions, and lipids were modeled using theCHARMM36 Additive Force Field (40, 41), and waters were repre-sented using the three-particle TIP3P model (42). All bonds involvinghydrogen atoms were constrained to their equilibrium lengths with theSHAKE algorithm (43). The resulting systems were subjected to at least10,000 energyminimization steps to remove any clashes, followed by anequilibration protocol. During equilibration, we applied harmonicpositional restraints of 10 kcalmol−1Å−2 to the protein backbone atoms,pressure was kept at 1 atm using the Berendsen algorithm (44), and thetemperature was increased from 10 to 310 K as a linear function of timeover the course of 1 ns, with Langevin temperature coupling. Relaxationtime for temperature and pressure was 0.5 ps. Subsequently, we removedthe restraints and performed a 5-ns simulation at constant isotropic pres-sure of 1 atm and temperature of 310 K. Electrostatic interactions werecomputed using a 10 Å cutoff radius, and the Particle Mesh Ewald
10 of 13

SC I ENCE S I GNAL ING | R E S EARCH ART I C L E
on June 21, 2018http://stke.sciencem
ag.org/D
ownloaded from
method was used for long-range interactions (45). All molecular dy-namics (MD) simulations (equilibration and production) were carriedout under periodic boundary conditions. Production simulations werecarried out in the constant temperature, constant volume (NVT) en-semble. Temperature was kept at 310 K using the Langevin thermostatwith a collision frequency of 2 ps. The simulation time step was 2 fs, andsnapshots were taken every 100 ps. Simulations were run once withAmber 14 (D. A. Case et al., University of California, San Francisco),using PMEMD on an Nvidia K20m GPU for 100 ns. The structuralconformation after 100 ns was used in subsequent structural analysis.
Construction and expression of CCR2 mutantsIndividualCCR2 residues or pairs of residueswere selected formutationbased on their locations and orientations in the predicted chemokinebinding site on the interior of the TM helical bundle. The WT c-Myc–FLAG–CCR2 construct in pcDNA5/FRT/TO (37)was used as a templatefor QuikChange site-directed mutagenesis to generate CCR2 mutants.WT and mutant c-Myc–FLAG–CCR2 constructs were transfectedin HEK293 Flp-In T-REx cells using Lipofectamine (Invitrogen). Cellswere selected and maintained in DMEM supplemented with 5% (v/v)tetracycline-free FBS, blasticidin (5 mg/ml), andHygroGold (200 mg/ml) at37°C in 5% CO2 humidified incubators. Receptor expression was induced24 hours before each experiment by addition of tetracycline (10 mg/ml).
Determination of cell surface receptor expression bywhole-cell ELISAThe cell surface expression of CCR2 wasmeasured using anti–c-MycELISA as described previously (46). Primary antibody anti–c-Myc(9E10) was diluted (1:2000) in tris-buffered saline/0.1% (w/v) bovineserum albumin. Secondary antibody, anti–mouse–horseradish per-oxidase was diluted (1:2000) in blocking buffer. Data were normalizedas the ratio of OD490 (optical density at 490 nm) of mutants over theOD490 of the WT CCR2. For internalization experiments, cells werestimulated with 100 nM chemokine in full media and incubated for1 hour at 37°C and rinsed with DMEM at pH 2.5 before fixation (46).All experiments were repeated at least three times and performed intriplicate.
Membrane preparation and radioligand-binding assaysCell membranes were prepared by detaching the cells from the flasks,centrifugation at 1500g for 3 min, and resuspension in ice-cold 50 mM3-(N-morpholino)propanesulfonic acid (Mops) buffer with 5 mMMgCl2 and 0.1% 3-[(3-cholamidopropyl)-dimethylammonio]-1-propanesulfonic acid (CHAPS), pH 7.4. The lysates were homogenizedby sonication and centrifuged at low speed for 5 min. Membrane andcytosolic fractions were separated by centrifugation of the super-natants at a relative centrifugal force (rcf) of 40,000g for 30 min.The membrane pellet was resuspended in Mops buffer with 5 mMMgCl2 and 0.1%CHAPS, pH 7.4, and stored at −20°C. Protein concen-trations were measured using a BCA protein determination assay (47).Competitive binding assays were performed as described by Zweemeret al. (48). Briefly, binding assays were performed in a 100-ml reactionvolume containing 50 mMMops buffer (pH 7.4), 5 mMMgCl2, 0.1%CHAPS, 5 to 20 mg of membranes, increasing concentrations of che-mokines, and45pM125I–MCP-1.Membraneswere incubated for 120minat 37°C. Nonspecific binding was determined in the presence of 10 mMINCB3344. Binding was terminated by dilution with ice-cold 50 mMMops buffer supplemented with 0.05% CHAPS and 0.5 M NaClfollowed by rapid filtration through a 96-well GF/C filter plate pre-
Huma et al., Sci. Signal. 10, eaai8529 (2017) 23 May 2017
coated with 0.5% polyethyleneimine using a PerkinElmer FilterMateHarvester (PerkinElmer). Filters were washed three times with ice-cold wash buffer and dried at 50°C, and 25 ml of MicroScint-O scin-tillation cocktail (PerkinElmer) was added to each well. Radioactivitywas determined by using a MicroBeta2 LumiJET 2460 MicroplateCounter (PerkinElmer).
b-Arrestin recruitment assaysRecruitment of b-arr2 to CCR2 was assessed in HEK293 Flp-In T-RExtransiently transfectedwithCCR2-RLuc8 and b-arr2–YFP as previouslydescribed (49). Briefly, CCR2-RLuc8 and b-arr2–YFP were transfectedat a receptor/arrestin ratioof 1:4usingpolyethylenimine (PEI) at a 1:6 ratio(46). After 24 hours, cells were replated in poly-D-lysine–coated 96-wellwhite opaque CulturPlates (PerkinElmer). Cells were rinsed and pre-incubated in HBSS for 30 min at 37°C 48 hours after transfection. Co-elenterazine h was added to each well (final concentration, 5 mM)followed by the immediate addition of receptor ligands. Cells were in-cubated further for 10min in the dark at 37°C. Bioluminescence reso-nance energy transfer (BRET) measurements were obtained using aPHERAstar plate reader (BMG Labtech) that allows for sequential in-tegration of the signals detected at 475 ± 30 and 535 ± 30 nm, usingfilters with the appropriate band-pass. Data are presented as a ligand-induced BRET ratio (normalized by subtracting the BRET ratio of vehicle-treated cells). All experiments were performed in triplicate and repeatedindependently at least three times.
ERK1/2 phosphorylationPhosphorylation of ERK1/2 was measured using the AlphaScreenSureFire p-ERK 1/2 (Thr202/Tyr204) Assay Kit (PerkinElmer, TGRBioSciences) following the manufacturer’s instructions. Briefly, 4 ×10⁵ cells per well were seeded in a poly-D-lysine–coated plate in fullmedia containing tetracycline (10 mg/ml) and serum-starved overnight.Initial time-course experiments determined that peak amounts ofERK 1/2 phosphorylation were achieved 3 min after the additionof chemokines. Therefore, for all subsequent concentration-responseexperiments, cells were stimulated for 3min at 37°C. FBS (10%, v/v)wasused as a positive control. The reaction was terminated by removal ofthe media and addition of 100 ml of SureFire lysis buffer. Cell lysiswas assisted by leaving the plates on a shaker at 600 rpm for 5 min.Lysate (5 ml) was transferred to a white 384-well Proxiplate followed bythe addition of 8 ml of SureFire AlphaScreenDetectionMix [240:1440:7:7(v/v) dilution of SureFire Activation Buffer/SureFire Reaction Buffer/AlphaScreen Acceptor Beads/AlphaScreen Donor Beads]. The platewas incubated in the dark for 1.5 hours at 37°C, and the AlphaScreensignal was read on an Envision plate reader (PerkinElmer). Data werenormalized between the signal in the absence of chemokine (0% re-sponse) and in the presence of 10% (v/v) FBS (100% response). Allexperiments were performed in triplicate and repeated independently atleast three times.
Inhibition of forskolin-induced cAMPThe ability of ligands to inhibit forskolin-induced cAMP productionwas assessed in c-Myc–FLAG–CCR2 HEK293 Flp-In T-REx cells tran-siently transfected to express the CAMYEL cAMP BRET biosensor(46). Cells were grown overnight in white poly-D-lysine–coated 96-wellCulturPlates (PerkinElmer). Transient transfection was performedusing PEI at a 6:1 ratio of DNA. Forty-eight hours after transfection,cells were rinsed and preincubated in HBSS for 30 min at 37°C. Cellswere then incubated with the RLuc substrate coelenterazine h (final
11 of 13

SC I ENCE S I GNAL ING | R E S EARCH ART I C L E
on June 21, 2018http://stke.sciencem
ag.org/D
ownloaded from
concentration, 5 mM) for 5min, followed by a further 5-min incubationwith increasing concentrations of chemokine. Forskolinwas then addedto a final concentration of 10 mM. After 5 min, the YFP and the RLucemissions were measured using a LUMIstar Omega (BMG Labtech)that allows for sequential integration of the signals detected at 475 ±30 and 535 ± 30 nm, using filters with the appropriate band-pass. BRETratio was calculated as the ratio of YFP to RLuc signals, and data wereexpressed as the percentage of the forskolin-induced signal.
Data analysis and statisticsAll data points represent the mean and error bars represent the SEM ofat least three independent experiments. The results were analyzed usingPrism 6.0 (GraphPad Software Inc.). All data from the concentration-response curves were normalized as outlined above and fitted using thefollowing three parameter equation
Y ¼ bottomþ top� bottom
1þ 10ð log EC50� log½A�Þ ð1Þ
where top and bottom represent the maximal and minimal asymptoteof the concentration-response curve, [A] is the molar concentration ofagonist, and EC50 (median effective concentration) is themolar concen-tration of agonist required to give a response halfway between thebottom and top. Concentration-response data were also fitted to the fol-lowing form of the operational model of agonism (23) to allow thequantification of biased agonism
Y ¼ basalþEm � basalð Þ t
KA
� �nA½ �n
A½ �n tKA
� �nþ 1þ ½A�
KA
� �n ð2Þ
where Em is the maximal possible response of the system, basal is thebasal level of response, KA represents the equilibrium dissociation con-stant of the agonist (A), and t is an index of the signaling efficacy of theagonist that is defined as RT/KE, where RT is the total number of recep-tors andKE is the coupling efficiency of each agonist-occupied receptor,and n is the slope of the transducer function that links occupancy toresponse. The analysis assumes that the transduction machinery usedfor a given cellular pathway are the same for all agonists, such that theEm and transducer slope (n) are shared between agonists. Data for allchemokines for each pathwaywere fit globally to determine values ofKA
and t. Biased agonism was quantified as previously described (24). Inshort, to exclude the impact of cell-dependent and assay-dependenteffects on the observed agonism at each pathway, the log(t/KA) valueof a reference agonist, in this case MCP-1 WT, was subtracted fromthe log(t/KA) value of the other chemokines to yield Dlog(t/KA). Therelative bias was then calculated for each chemokine at the two differentsignaling pathways by subtracting the Dlog(t/KA) of one pathway fromthe other to give a DDlog(t/KA) value, which is a measure of bias. A lackof biased agonism results in values of DDlog(t/KA) not significantly dif-ferent from 0 between pathways. To account for the propagation of er-ror associated with the determination of composite parameters, thefollowing equation was used
Pooled–SEM ¼ffiffiffiffiffiffiffiffiffiffiffiffiffiffiffiffiffiffiffiffiffiffiffiffiffiffiffiffiffiffiffiffiffiffiðSEj1Þ2 þ ðSEj2Þ2
qð3Þ
Huma et al., Sci. Signal. 10, eaai8529 (2017) 23 May 2017
For radioligand-binding, the concentration of agonist that inhibitedhalf of the 125I–MCP-1 binding [median inhibitory concentration(IC50)] was determined using the following equation
Y ¼ Bottomþ ðTop� BottomÞ1þ 10ðX�logIC50ÞnH
ð4Þ
where Y denotes the percentage-specific binding, Top and Bottom de-note the maximal and minimal asymptotes, respectively, IC50 denotesthe X value when the response is midway between Bottom and Top,and nH denotes the Hill slope factor. For 125I–MCP-1 homologouscompetition-binding experiments, estimates of affinity (Kd) were ob-tained using the equation:
IC50 ¼ ½Hot� þ Kd ð5Þ
For all other chemokines, IC50 values obtained from the inhibitioncurves were converted to Ki values using the Cheng and Prusoffequation (50). All affinity (pKi), potency (pEC50), and transductionratio [log(t/KA)] parameters were estimated as logarithms. As we havepreviously demonstrated that the logarithm of the measure is approx-imately Gaussian (51), and as the application of t tests and ANOVAsassume Gaussian distribution, estimating the parameters as logarithmsallows valid statistical comparison.Multiple t test comparisonwithHolm-Sidak correction or one-way ANOVA was used as stated in the figurelegends. Significance is defined as *P < 0.05, **P < 0.01, and ***P < 0.001for the comparison graphs.
SUPPLEMENTARY MATERIALSwww.sciencesignaling.org/cgi/content/full/10/480/eaai8529/DC1Fig. S1. Neither MCP-2 nor MCP-3 is a biased agonist at CCR2 relative to MCP-1.Fig. S2. NMR spectra of chemokine chimeras.Fig. S3. MCP3-111 displays biased agonism relative to MCP-3.Fig. S4. Homologymodel of CCR2 bound toMCP-1, showing the positions of the mutated residues.Fig. S5. 125I–MCP-1 competition binding and ERK1/2 phosphorylation concentration responsecurves for CCR2 mutants.Fig. S6. Graphical comparisons of chemokine binding and ERK1/2 phosphorylation parametersacross the set of CCR2 mutants.Fig. S7. The amino acid sequences of MCP-1 (P8A), WT MCP-3, and the chimeric chemokines.Table S1. Biased agonism parameters for MCP chemokines at CCR2.Table S2. MCP3-111 displays biased agonism at CCR2 compared to MCP-3.Table S3. Expected and observed molecular masses of WT and chimeric chemokines.
REFERENCES AND NOTES1. T. Kenakin, A. Christopoulos, Signalling bias in new drug discovery: Detection,
quantification and therapeutic impact. Nat. Rev. Drug Discov. 12, 205–216 (2013).2. T. Kenakin, Functional selectivity and biased receptor signaling. J. Pharmacol. Exp. Ther.
336, 296–302 (2011).3. W. Huang, A. Manglik, A. J. Venkatakrishnan, T. Laeremans, E. N. Feinberg, A. L. Sanborn,
H. E. Kato, K. E. Livingston, T. S. Thorsen, R. C. Kling, S. Granier, P. Gmeiner, S. M. Husbands,J. R. Traynor, W. I. Weis, J. Steyaert, R. O. Dror, B. K. Kobilka, Structural insights intom-opioid receptor activation. Nature 524, 315–321 (2015).
4. A. Manglik, T. H. Kim, M. Masureel, C. Altenbach, Z. Yang, D. Hilger, M. T. Lerch,T. S. Kobilka, F. S. Thian, W. L. Hubbell, R. S. Prosser, B. K. Kobilka, Structural insights intothe dynamic process of b2-adrenergic receptor signaling. Cell 161, 1101–1111 (2015).
5. S. G. F. Rasmussen, B. T. DeVree, Y. Zou, A. C. Kruse, K. Y. Chung, T. S. Kobilka, F. S. Thian,P. S. Chae, E. Pardon, D. Calinski, J. M. Mathiesen, S. T. A. Shah, J. A. Lyons, M. Caffrey,S. H. Gellman, J. Steyaert, G. Skiniotis, W. I. Weis, R. K. Sunahara, B. K. Kobilka, Crystalstructure of the b2 adrenergic receptor-Gs protein complex. Nature 477, 549–555 (2011).
6. B. Moser, M. Wolf, A. Walz, P. Loetscher, Chemokines: Multiple levels of leukocytemigration control. Trends Immunol. 25, 75–84 (2004).
7. M. Baggiolini, Chemokines in pathology and medicine. J. Intern. Med. 250, 91–104 (2001).
12 of 13

SC I ENCE S I GNAL ING | R E S EARCH ART I C L E
on June 21, 2018http://stke.sciencem
ag.org/D
ownloaded from
8. C. Gerard, B. J. Rollins, Chemokines and disease. Nat. Immunol. 2, 108–115 (2001).9. A. E. I. Proudfoot, Chemokine receptors: Multifaceted therapeutic targets. Nat. Rev.
Immunol. 2, 106–115 (2002).10. R. Martinelli, I. Sabroe, G. LaRosa, T. J. Williams, J. E. Pease, The CC chemokine eotaxin (CCL11)
is a partial agonist of CC chemokine receptor 2B. J. Biol. Chem. 276, 42957–42964 (2001).11. A. Mueller, N. G. Mahmoud, M. C. Goedecke, J. A. McKeating, P. G. Strange,
Pharmacological characterization of the chemokine receptor, CCR5. Br. J. Pharmacol. 135,1033–1043 (2002).
12. Y. Wan, J. P. Jakway, H. Qiu, H. Shah, C. G. Garlisi, F. Tian, P. Ting, D. Hesk, R. W. Egan,M. M. Billah, S. P. Umland, Identification of full, partial and inverse CC chemokine receptor3 agonists using [35S]GTPgS binding. Eur. J. Pharmacol. 456, 1–10 (2002).
13. Y. A. Berchiche, S. Gravel, M. E. Pelletier, G. St-Onge, N. Heveker, Different effects of thedifferent natural CC chemokine receptor 2b ligands on b-arrestin recruitment, Gaisignaling, and receptor internalization. Mol. Pharmacol. 79, 488–498 (2011).
14. C. T. Veldkamp, C. Seibert, F. C. Peterson, N. B. De la Cruz, J. C. Haugner III, H. Basnet,T. P. Sakmar, B. F. Volkman, Structural basis of CXCR4 sulfotyrosine recognition by thechemokine SDF-1/CXCL12. Sci. Signaling 1, ra4 (2008).
15. S. Rajagopal, S. Ahn, D. H. Rominger, W. Gowen-MacDonald, C. M. Lam, S. M. Dewire,J. D. Violin, R. J. Lefkowitz, Quantifying ligand bias at seven-transmembrane receptors.Mol. Pharmacol. 80, 367–377 (2011).
16. J. Corbisier, C. Gales, A. Huszagh, M. Parmentier, J.-Y. Springael, Biased signaling atchemokine receptors. J. Biol. Chem. 290, 9542–9554 (2015).
17. S. Colin, G. Chinetti-Gbaguidi, B. Staels, Macrophage phenotypes in atherosclerosis.Immunol. Rev. 262, 153–166 (2014).
18. Y. Bai, Q. Sun, Macrophage recruitment in obese adipose tissue.Obes. Rev. 16, 127–136 (2015).19. S. Struyf, E. Van Collie, L. Paemen, W. Put, J. P. Lenaerts, P. Proost, G. Opdenakker,
J. Van Damme, Synergistic induction of MCP-1 and −2 by IL-1beta and interferons infibroblasts and epithelial cells. J. Leukocyte Biol. 63, 364–372 (1998).
20. B. Qiu, K. A. Frait, F. Reich, E. Komuniecki, S. W. Chensue, Chemokine expression dynamicsin mycobacterial (type-1) and schistosomal (type-2) antigen-elicited pulmonarygranuloma formation. Am. J. Pathol. 158, 1503–1515 (2001).
21. L. Qin, I. Kufareva, L. G. Holden, C. Wang, Y. Zheng, C. Zhao, G. Fenalti, H. Wu, G. W. Han,V. Cherezov, R. Abagyan, R. C. Stevens, T. M. Handel, Crystal structure of the chemokinereceptor CXCR4 in complex with a viral chemokine. Science 347, 1117–1122 (2015).
22. J. S. Burg, J. R. Ingram, A. J. Venkatakrishnan, K. M. Jude, A. Dukkipati, E. N. Feinberg,A. Angelini, D. Waghray, R. O. Dror, H. L. Ploegh, K. C. Garcia, Structural basis forchemokine recognition and activation of a viral G protein–coupled receptor. Science 347,1113–1117 (2015).
23. J. W. Black, P. Leff, N. P. Shankley, J. Wood, An operational model of pharmacologicalagonism: The effect of E/[A] curve shape on agonist dissociation constant estimation.Br. J. Pharmacol. 84, 561–571 (1985).
24. T. Kenakin, C. Watson, V. Muniz-Medina, A. Christopoulos, S. Novick, A simple method forquantifying functional selectivity and agonist bias. ACS Chem. Neurosci. 3, 193–203 (2012).
25. T. Kenakin, Quantifying biological activity in chemical terms: A pharmacology primer todescribe drug effect. ACS Chem. Biol. 4, 249–260 (2009).
26. I. Clark-Lewis, B. Dewald, M. Loetscher, B. Moser, M. Baggiolini, Structural requirementsfor interleukin-8 function identified by design of analogs and CXC chemokine hybrids.J. Biol. Chem. 269, 16075–16081 (1994).
27. S. Hemmerich, C. Paavola, A. Bloom, S. Bhakta, R. Freedman, D. Grunberger,J. Krstenansky, S. Lee, D. McCarley, M. Mulkins, B. Wong, J. Pease, L. Mizoue,T. Mirzadegan, I. Polsky, K. Thompson, T. M. Handel, K. Jarnagin, Identification of residuesin the monocyte chemotactic protein-1 that contact the MCP-1 receptor, CCR2.Biochemistry 38, 13013–13025 (1999).
28. K. Jarnagin, D. Grunberger, M. Mulkins, B. Wong, S. Hemmerich, C. Paavola, A. Bloom,S. Bhakta, F. Diehl, R. Freedman, D. McCarley, I. Polsky, A. Ping-Tsou, A. Kosaka,T. M. Handel, Identification of surface residues of the monocyte chemotactic protein1 that affect signaling through the receptor CCR2. Biochemistry 38, 16167–16177 (1999).
29. M. P. Crump, J.-H. Gong, P. Loetscher, K. Rajarathnam, A. Amara, F. Arenzana-Seisdedos,J.-L. Virelizier, M. Baggiolini, B. D. Sykes, I. Clark-Lewis, Solution structure and basis forfunctional activity of stromal cell-derived factor-1; dissociation of CXCR4 activation frombinding and inhibition of HIV-1. EMBO J. 16, 6996–7007 (1997).
30. J. H. Gong, I. Clark-Lewis, Antagonists of monocyte chemoattractant protein 1 identifiedby modification of functionally critical NH2-terminal residues. J. Exp. Med. 181, 631–640 (1995).
31. I. Clark-Lewis, I. Mattioli, J.-H. Gong, P. Loetscher, Structure-function relationship betweenthe human chemokine receptor CXCR3 and its ligands. J. Biol. Chem. 278, 289–295 (2003).
32. A. B. Kleist, A. E. Getschman, J. J. Ziarek, A. M. Nevins, P.-A. Gauthier, A. Chevigne,M. Szpakowska, B. F. Volkman, New paradigms in chemokine receptor signal transduction:Moving beyond the two-site model. Biochem. Pharmacol. 114, 53–68 (2016).
33. J. A. Ballesteros, H. Weinstein, in Methods in Neurosciences, vol. 25, S. C. Sealfon, Ed.(Academic Press, 1995), pp. 366–428.
34. L. Roumen, D. J. Scholten, P. de Kruijf, I. J. P. de Esch, R. Leurs, C. de Graaf, C(X)CR in silico:Computer-aided prediction of chemokine receptor–ligand interactions. Drug Discov.Today Technol. 9, e281–e291 (2012).
Huma et al., Sci. Signal. 10, eaai8529 (2017) 23 May 2017
35. M. P. Wescott, I. Kufareva, C. Paes, J. R. Goodman, Y. Thaker, B. A. Puffer, E. Berdougo,J. B. Rucker, T.M.Handel, B. J.Doranz, Signal transmission through theCXC chemokine receptor4 (CXCR4) transmembrane helices. Proc. Natl. Acad. Sci. U.S.A. 113, 9928–9933 (2016).
36. Q. Tan, Y. Zhu, J. Li, Z. Chen, G. W. Han, I. Kufareva, T. Li, L. Ma, G. Fenalti, W. Zhang, X. Xie,H. Yang, H. Jiang, V. Cherezov, H. Liu, R. C. Stevens, Q. Zhao, B. Wu, Structure of the CCR5chemokine receptor–HIV entry inhibitor maraviroc complex. Science 341, 1387–1390 (2013).
37. J. H. Y. Tan, M. Canals, J. P. Ludeman, J. Wedderburn, C. Boston, S. J. Butler, A. M. Carrick,T. R. Parody, D. Taleski, A. Christopoulos, R. J. Payne, M. J. Stone, Design and receptorinteractions of obligate dimeric mutant of chemokine monocyte chemoattractantprotein-1 (MCP-1). J. Biol. Chem. 287, 14692–14702 (2012).
38. N. Eswar, B. Webb, M. A. Marti-Renom, M. S. Madhusudhan, D. Eramian, M.-y. Shen, U. Pieper,A. Sali, Comparative protein structure modeling using MODELLER. Curr. Protoc. Bioinformatics 5,Unit-5.6 (2006).
39. S. Jo, J. B. Lim, J. B. Klauda, W. Im, CHARMM-GUI membrane builder for mixed bilayers andits application to yeast membranes. Biophys. J. 97, 50–58 (2009).
40. J. Huang, A. D. MacKerell Jr., CHARMM36 all-atom additive protein force field: Validationbased on comparison to NMR data. J. Comput. Chem. 34, 2135–2145 (2013).
41. J. B. Klauda, R. M. Venable, J. A. Freites, J. W. O’Connor, D. J. Tobias, C. Mondragon-Ramirez,I. Vorobyov, A. D. MacKerell Jr., R. W. Pastor, Update of the CHARMM all-atom additive forcefield for lipids: Validation on six lipid types. J. Phys. Chem. B 114, 7830–7843 (2010).
42. W. L. Jorgensen, J. Chandrasekhar, J. D. Madura, R. W. Impey, M. L. Klein, Comparison ofsimple potential functions for simulating liquid water. J. Chem. Phys. 79, 926–935 (1983).
43. R. A. Lippert, K. J. Bowers, R. O. Dror, M. P. Eastwood, B. A. Gregersen, J. L. Klepeis,I. Kolossvary, D. E. Shaw, A common, avoidable source of error in molecular dynamicsintegrators. J. Chem. Phys. 126, 046101 (2007).
44. H. J. C. Berendsen, J. P. M. Postma, W. F. Vangunsteren, A. Dinola, J. R. Haak, Molecular-dynamics with coupling to an external bath. J. Chem. Phys. 81, 3684–3690 (1984).
45. T. Darden, D. York, L. Pedersen, Particle mesh Ewald: An N⋅Log(N) method for Ewald sumsin large systems. J. Chem. Phys. 98, 10089–10092 (1993).
46. D. J. Scholten, M. Canals, M. Wijtmans, S. de Munnik, P. Nguyen, D. Verzijl, I. J. de Esch,H. F. Vischer, M. J. Smit, R. Leurs, Pharmacological characterization of a small-moleculeagonist for the chemokine receptor CXCR3. Br. J. Pharmacol. 166, 898–911 (2012).
47. P. K. Smith, R. I. Krohn, G. T. Hermanson, A. K. Mallia, F. H. Gartner, M. D. Provenzano,E. K. Fujimoto, N. M. Goeke, B. J. Olson, D. C. Klenk, Measurement of protein usingbicinchoninic acid. Anal. Biochem. 150, 76–85 (1985).
48. A. J. M. Zweemer, I. Nederpelt, H. Vrieling, S. Hafith, M. L. Doornbos, H. de Vries, J. Abt, R. Gross,D. Stamos, J. Saunders, M. J. Smit, A. P. Ijzerman, L. H. Heitman, Multiple binding sites for small-molecule antagonists at the CC chemokine receptor 2.Mol. Pharmacol. 84, 551–561 (2013).
49. M. A. Ayoub, Y. Zhang, R. S. Kelly, H. B. See, E. K. M. Johnstone, E. A. McCall, J. H. Williams,D. J. Kelly, K. D. G. Pfleger, Functional interaction between angiotensin II receptor type1 and chemokine (C-C motif) receptor 2 with implications for chronic kidney disease.PLOS ONE 10, e0119803 (2015).
50. C. Yung-Chi, W. H. Prusoff, Relationship between inhibition constant (KI) andconcentration of inhibitor which causes 50 per cent inhibition (I50) of an enzymatic-reaction. Biochem. Pharmacol. 22, 3099–3108 (1973).
51. A. Christopoulos, Assessing the distribution of parameters in models of ligand–receptorinteraction: To log or not to log. Trends Pharmacol. Sci. 19, 351–357 (1998).
Acknowledgments: We thank H. Yeatman and J. Ludeman for technical assistance.Funding: This study was supported by the Australian Research Council Discovery GrantDP120100194, the Linkage Infrastructure, Equipment and Facilities (LIEF) grant LE0989504(M.J.S.), Monash Institute of Pharmaceutical Sciences Large Grant Support Scheme (M.C.), andANZ Trustees grant 12-3831 (M.J.S. and M.C.). K.D.G.P. is a National Health and MedicalResearch Council (NHMRC) RD Wright Career Development Fellow (1085842), and J.R.L. is aMonash University Larkins Fellow and an RD Wright Career Development Fellow. M.C. is aMonash Fellow. Author contributions: Z.E.H. and J.S. participated in the research design andperformed the experiments. H.D.L. performed and supervised the radioligand-bindingassays. J.L.B. generated the preliminary data. C.H. performed and interpreted the massspectrometry. B.J.P. and B.T.P. generated the homology models. J.G.P. contributed to thechimera design and preparation. K.D.G.P. provided the CCR2-RLuc8 construct for BRET assays.J.R.L., M.C., and M.J.S. interpreted the results and wrote the manuscript. M.C. and M.J.S. conceivedthe studies and designed the experiments. All authors read and critically reviewed themanuscript. Competing interests: The authors declare that they have no competing interests.
Submitted 22 August 2016Accepted 5 May 2017Published 23 May 201710.1126/scisignal.aai8529
Citation: Z. E. Huma, J. Sanchez, H. D. Lim, J. L. Bridgford, C. Huang, B. J. Parker,J. G. Pazhamalil, B. T. Porebski, K. D. G. Pfleger, J. R. Lane, M. Canals, M. J. Stone, Keydeterminants of selective binding and activation by the monocyte chemoattractant proteinsat the chemokine receptor CCR2. Sci. Signal. 10, eaai8529 (2017).
13 of 13

proteins at the chemokine receptor CCR2Key determinants of selective binding and activation by the monocyte chemoattractant
Benjamin T. Porebski, Kevin D. G. Pfleger, J. Robert Lane, Meritxell Canals and Martin J. StoneZil E. Huma, Julie Sanchez, Herman D. Lim, Jessica L. Bridgford, Cheng Huang, Bradyn J. Parker, Jiann G. Pazhamalil,
DOI: 10.1126/scisignal.aai8529 (480), eaai8529.10Sci. Signal.
signaling contributes to the pathology.interactions. These data may aid in the development of small-molecule inhibitors to treat diseases in which CCR2 authors also showed that a region in the transmembrane domains of CCR2 was a critical site for chemokine-receptorchemokine as important for determining both receptor-binding affinity and the efficiency of receptor activation. The
. identified the N-terminal region of theet alUsing chimeric MCP proteins and mutated CCR2 receptors, Huma found on monocytes and macrophages and is implicated in the pathogenesis of atherosclerosis and type 2 diabetes.inflammation. Monocyte chemoattractant proteins (MCPs) are chemokines that stimulate the receptor CCR2, which is
coupled receptors (GPCRs), to stimulate the directed migration of immune cells to sites of infection or−family of G protein Chemokines are small chemoattractant proteins that bind to chemokine receptors, which are members of the
Deciphering chemokine binding
ARTICLE TOOLS http://stke.sciencemag.org/content/10/480/eaai8529
MATERIALSSUPPLEMENTARY http://stke.sciencemag.org/content/suppl/2017/05/19/10.480.eaai8529.DC1
CONTENTRELATED
http://stm.sciencemag.org/content/scitransmed/6/237/237ra67.fullhttp://stm.sciencemag.org/content/scitransmed/9/384/eaah6650.fullhttp://stm.sciencemag.org/content/scitransmed/9/386/eaai9044.fullhttp://science.sciencemag.org/content/sci/347/6226/1113.fullhttp://science.sciencemag.org/content/sci/347/6226/1117.fullhttp://stke.sciencemag.org/content/sigtrans/7/336/ra72.fullhttp://stke.sciencemag.org/content/sigtrans/9/452/ra107.fullhttp://stke.sciencemag.org/content/sigtrans/10/471/eaah5756.full
REFERENCES
http://stke.sciencemag.org/content/10/480/eaai8529#BIBLThis article cites 50 articles, 16 of which you can access for free
PERMISSIONS http://www.sciencemag.org/help/reprints-and-permissions
Terms of ServiceUse of this article is subject to the
registered trademark of AAAS.is aScience Signaling Association for the Advancement of Science. No claim to original U.S. Government Works. The title
York Avenue NW, Washington, DC 20005. 2017 © The Authors, some rights reserved; exclusive licensee American (ISSN 1937-9145) is published by the American Association for the Advancement of Science, 1200 NewScience Signaling
on June 21, 2018http://stke.sciencem
ag.org/D
ownloaded from