
Key Data on Education in Europe 2009
280
Transcript of Key Data on Education in Europe 2009


EUROPEAN COMMISSION
Education, Audiovisual & CultureExecutive Agency EURYDICE
Key Data on Education in Europe 2009

This document is published by the Education, Audiovisual and Culture Executive Agency (EACEA P9 Eurydice). Available in English (Key Data on Education in Europe 2009), French (Chiffres clés de l'éducation en Europe 2009) and German (Schlüsselzahlen zum Bildungswesen in Europa 2009). ISBN 978-92-9201-033-1 DOI 10.2797/1715 This document is also available on the Internet (http://www.eurydice.org). Text completed in July 2009. © Education, Audiovisual and Culture Executive Agency, 2009. The contents of this publication may be reproduced in part, except for commercial purposes, provided the extract is preceded b y a reference to 'Eurydice network', followed by the date of publication of the document. Requests for permission to reproduce the entire document must be made to EACEA P9 Eurydice. Education, Audiovisual and Culture Executive Agency P9 Eurydice Avenue du Bourget 1 (BOU2) B-1140 Brussels Tel. +32 2 299 50 58 Fax +32 2 292 19 71 E-mail: [email protected] Website: http://www.eurydice.org

3
P R E F A C E
Key Data on Education in Europe combines statistical data and qualitative information to provide an
exceptionally wide-ranging overview of the organisation and functioning of European education systems, as
well as an insight into the ways in which the countries concerned are responding to common challenges in
education. This seventh edition appears in the context of a very severe economic, social and financial crisis,
which is one of the most important challenges the EU has ever faced. In preparing the grounds for recovery
as well as ensuring long-term economic and social stability, and in a context where education represents
almost 11 % of EU public expenditure, it remains more than ever essential to ensure that this expenditure is
efficiently and equitably spent. In this context, for example, demographic change should be seen as an
opportunity to assess what changes are needed to ensure efficient, effective and equitable Lifelong Learning
systems in these new circumstances.
In this respect, the Commission has launched several important initiatives at the European level over the last
five years. The launch of a European Qualifications Framework for Lifelong Learning (EQF), for example, is
an essential tool for helping employers and individuals compare qualifications across the EU’s diverse
education and training systems. The EQF represents an important paradigm shift in European education: it is
based on approach which takes into account learning outcomes rather than the resources which are put into
learning. In other words, it is a qualifications framework based on what learners are actually able to do at the
end of a course of education, rather than where the learning took place and how long it took. Another
important achievement has been the establishment of the European Institute of Innovation and Technology
(EIT). By linking higher education, research and industry through the creation of Knowledge Communities, it
will become a flagship contributing to Europe's capacity for innovation. Finally, the Commission and Member
States agreed a new framework for cooperation in the field of education and training up to 2020. The Council
Conclusions on a strategic framework for European cooperation in education and training ('ET 2020'),
adopted in May 2009, build on progress made under the previous work programme and set the strategic
objectives for European cooperation in education and training for the next decade.

K e y D a t a o n E d u c a t i o n i n E u r o p e 2 0 0 9
4
If we look at the current state of education systems in Europe we can see many positive trends. Participation
rates in pre-primary education have increased. As part of efforts to ensure that young people acquire core
competences there has been a rise in the number of years of compulsory education, and some countries
require pupils to continue beyond the compulsory age in order to obtain a certificate of basic education.
Higher education has seen a massive rise in the number of students, in particular in the younger age groups
and female students. In the EU-27, the share of GDP given over to education has largely remained stable,
and some countries have even increased social investment in human capital over the last years.
On the other hand, many challenges remain. Ensuring wide and equitable access to pre-primary education
as well as increasing equity of overall skill levels of pupils in compulsory education are at the forefront. The
education and training of teachers continues to be a crucial element in improving the quality of teaching and
learning at all levels of education systems. Demographic and societal changes such as the projected decline
in the school age population or the increase in the rate of the student population have far reaching
consequences that point to the need to rethink and modernise the structure and functioning of education
systems. Establishing sustainable and efficient funding mechanisms is clearly another challenge.
Key Data on Education in Europe is based on data collected through the national units of the Eurydice
network, Eurostat, and the PISA/PIRLS international education survey databases. In publishing these
standardised and readily comparable quantitative and qualitative indicators, our intention is to provide
decision makers in the field with information which will help them make the best choices and will ensure that
as many people as possible can access high quality education and training.
Ján Figel’
Commissioner for Education, Training, Culture and Youth
Joaquín Almunia
Commissioner for Economic and Monetary Affairs

5
C O N T E N T S
Preface 3
Introduction 7
Main Issues 13
Codes, Abbreviations and Acronyms 23
A – CONTEXT 27
B – ORGANISATION 41 Section I – Structures 41 Section II – Objectives and Evaluation 65 Section III – Decision-making Levels and Processes 77
C – PARTICIPATION 91
D – RESOURCES 121 Section I – Investment and Equipment 121 Section II – Teachers 149 Section III – Management Staff 189
E – EDUCATIONAL PROCESSES 199 Section I – Taught Time 199 Section II – Grouping of Pupils and School Climate 213 Section III – Assessment of Pupils 231
F – GRADUATES AND QUALIFICATION LEVELS 241
Glossary and Statistical Tools 255
Table of Figures 265
Acknowledgements 271


7
I N T R O D U C T I O N
This seventh edition of Key Data on Education in Europe retains its main special feature which is the combination of statistical data and qualitative information to describe the organisation and functioning of education systems in Europe.
The present 2009 edition maintains the subject-based structure defined by the previous one but uses new sources of information and presents new opportunities for Internet browsing.
All these innovations are geared to providing a better insight into the diversity and common aspects of education systems in Europe. They aim to satisfy more effectively the requirements of different readers, including those seeking clarification on a particular aspect of education systems no less than those interested in a wider perspective.
Structure and Content of the Report The structure and selection of indicators for this seventh edition have been the subject of consultation with the Eurydice Network and the Statistical Office of the European Communities (Eurostat). The content of the report, the timetable for producing it and the working procedures involved were determined at a joint meeting organised by the European Commission Directorate-General for Education and Culture in October 2007.
The 121 indicators contained in this report are arranged into six subject-based chapters entitled Context, Structures, Participation, Resources, Educational Processes and Graduates and Qualification Levels.
In each chapter, the information is presented in accordance with the following structure, namely by ascending order of educational level, progression from the most general to the most specific information, and from local administrative level up to national level.
The summary at the beginning of the report familiarises readers with the main issues contained in this report and briefly reviews the most evident emergent trends. It has been possible to establish some typical associations between several matters discussed in the report and these are highlighted in box form.
This main volume of Key Data on Education in Europe 2009 has been enhanced through the inclusion of several time series provided by Eurostat. Time series are especially helpful in identifying developments affecting aspects of education systems in Europe and in analysing their present situation with respect to the recent past. These time series are concerned in particular with participation rates at different educational levels and the mobility of students in tertiary education (Chapter C), with qualification levels among the general population, and with the number of women graduates in tertiary education and the number of graduates in science and technology (Chapter F). Furthermore, wherever possible and in the case of all information supplied by Eurydice, each national reform planned or implemented within the two years subsequent to the reference year is indicated in a note.
The complementary nature of qualitative and quantitative information has also been enhanced by input from two new sources of information in that the report now presents certain findings from the contextual questionnaires of the PISA (2006) and PIRLS (2006) empirical surveys carried out by the Organisation for Economic Cooperation and Development (OECD) and the International Association for the Evaluation of Educational Achievement (IEA), respectively. These indicators provide an interesting supplement to the material from Eurydice, as they offer a picture of what occurs in practice in schools and classrooms. It has

K e y D a t a o n E d u c a t i o n i n E u r o p e 2 0 0 9
8
been possible to view these data in relation to information on official recommendations and requirements in areas such as school autonomy (Chapter B), pupils’ instruction time or ways in which they are grouped together (Chapter E). The same indicators also complement the statistical information gathered by Eurostat, by focusing on areas that have not been covered, or offering insight into variations between schools within a country in contrast to the data from Eurostat on schools as a whole.
Sources Three major sources of information have thus been used for the report, namely information supplied by the Eurydice Network, the European statistical system coordinated by Eurostat and, finally, certain data taken from the international PISA/PIRLS databases.
Eurydice information gathering
The Eurydice indicators supply information derived primarily from legislation, national regulation or other official documents concerned with education, or in other words, solely from central recommendations or rulings. This information is gathered by National Units in the Eurydice Network (generally situated in the education ministries), on the basis of common definitions. It is then analysed and compared by the Network’s European Unit and the National Units working together. Where the matter examined is for local authorities or individual institutions and therefore is not governed by central-level regulation, this is clearly stated in the Figure.
On the whole, this information is generally of a qualitative nature and presents a general picture of education in Europe, or a number of models or typical patterns relating to its structure or functioning. A few indicators offer quantitative information (such as the retirement age or working time of teachers, salaries, teaching time, etc.).
Indicators cover different levels of education as defined by national education systems. In some countries, pre-primary education is provided in primary schools, while in others primary and lower secondary education are incorporated within a single structure. Compulsory education generally corresponds to primary education and lower secondary education. However, in certain countries, it begins with pre-primary education while, in others it extends to upper secondary education. Readers wishing to know the precise years of study to which an indicator refers in a given country should consult Figure B1 which illustrates the educational structure of each country. The same Figure also shows how the years of study relate to the International Standard Classification of Education (ISCED) used for the indicators from Eurostat (see below and the Statistical Tools section for the ISCED definitions).
In general, information from Eurydice relates solely to schools in the public sector. Most Figures also cover the grant-aided private (or ‘government-dependent’) sector in three countries (Belgium, Ireland and the Netherlands) where the majority of pupils attend schools in that sector. Where Figures cover the grant-aided private sector in all countries, this is explicitly stated in the title.

I n t r o d u c t i o n
9
Statistical data collection by Eurostat and the European Statistical System (ESS)
The various Eurostat data collection exercises performed by the European Statistical System (ESS) and used in this report are described briefly in the table below. More detailed explanatory material is contained in the ‘Glossary and Statistical Tools’ section. Insofar as these data collections – including statistical processing and procedures for the checking, approval and publication of the information concerned – are based on different timetables, their reference years also differ. This should be borne in mind when reading and analysing the data. All the information provided by these data collections was obtained from the Eurostat New Cronos database in July 2008 and June 2009 for the financial indicators and the reference years are 2006 and/or 2007.
THE UOE DATABASE
The joint UOE (UNESCO Institute of Statistics/OECD/EUROSTAT) questionnaires are used by the three organisations to collect internationally comparable data on key aspects of education systems on an annual basis using administrative sources.
THE DEMOGRAPHIC DATABASE
National demographic data is collected from responses to an annual questionnaire sent to the national statistical institutes. The annual national population estimates are based either on the most recent census or on data obtained from the population register.
THE COMMUNITY LABOUR FORCE SURVEY (LFS)
This survey has been carried out annually since 1983. It is the principal source of statistics on employment and unemployment in the European Union. The survey is directed at individuals and households. The questions mainly cover the characteristics of employment and job seeking.
NATIONAL ACCOUNTS
The European System of National and Regional Accounts (abbreviated to ‘ESA 1995’, ‘ESA’, or sometimes also ‘the system’) is an internationally comparable accounting framework for systematic and detailed description of a ‘total economy’ (i.e. a region, a country or a group of countries), its components and its relationships with other ‘total economies’.
These different data collection systems provide statistical information on populations and their composition, employment, unemployment and the educational levels reached by the population of the European Union (Chapter A), pupil participation rates and those newly enrolled in education systems (Chapter C), teaching staff and educational expenditure (Chapter D) and graduates (Chapter F).
All these Eurostat statistical data are available in the New Cronos Internet database at:
http://epp.eurostat.ec.europa.eu/portal/page/portal/education/data/database

K e y D a t a o n E d u c a t i o n i n E u r o p e 2 0 0 9
10
The PISA/PIRLS international databases
Besides measuring performance, the PIRLS 2006 and PISA 2006 international surveys include questionnaires to identify variables in the school and family context which may shed light on their findings. Questionnaires were sent to school heads and pupils for the PISA survey, and to teachers and the parents of pupils in the case of PIRLS. The 30 indicators contained in the present publication have been prepared using replies from these further surveys.
PISA (Programme for International Student Assessment) is an international survey conducted under the auspices of the OECD to measure the performance levels of pupils aged 15 in reading literacy, mathematical literacy and scientific literacy. The data collection used to prepare the present document is from PISA 2006. Further data collection exercises are planned in 2009 and 2012. The survey is based on representative samples of 15-year-old pupils, who may either be in lower secondary or upper secondary education, depending on the structure of the system. PIRLS
PIRLS (Progress in International Reading Literacy Study) was conducted in 2006 by the International Association for the Evaluation of Educational Achievement (IEA) and aimed to measure the performance levels of pupils in reading comprehension in the fourth year of primary education. The survey is based on representative samples of fourth-year classes in primary school in which pupils are aged 9 or 10, depending on the country concerned.
All indicators obtained from these two databases cover both public-sector schools and private schools, whether grant-aided or otherwise. Further details on statistical aspects are provided in the ‘Glossary and Statistical Tools’ section.
Geographical Coverage This Key Data on Education in Europe report covers 31 European countries, namely all those involved in the Eurydice Network under the Lifelong Learning Programme (2007-2013).
As regards Eurostat, OECD and IEA data, only results from countries taking part in the Lifelong Learning Programme (2007-2013) are provided. In the case of countries that do not contribute to certain Eurostat data collection exercises, the data are indicated as ‘not available’. By contrast, those which did not take part in the PISA and/or PIRLS surveys are indicated with a cross on the histograms prepared from these data sources.
Given the regionally based educational structure of some countries, certain indicators whose sources are Eurydice, the OECD and the IEA, break down data by administrative region (particularly in the case of Belgium and the United Kingdom) wherever possible.

I n t r o d u c t i o n
11
Partnerships and Methodology Eurostat (Unit F4 'Education, Science and Culture') has undertaken the preparation and production of statistical indicators which have been approved by the European Statistical System (ESS).
Questionnaires were prepared by the Eurydice Unit within the Education, Audiovisual and Culture Executive Agency (EACEA) working jointly with National Units in the Network in order to collect Eurydice data. The questionnaires were tested with the National Units in order to ensure their feasibility and consistency. In statistical terms, the Eurydice Unit within EACEA also exploited the findings of the context-oriented questionnaires in the PISA 2006 survey and the PIRLS 2006 survey.
All analytical content based on the statistical and descriptive data in the report was drafted by the Eurydice Unit within EACEA. Finally, the Eurydice Network, in collaboration with Eurostat and the ESS, undertook checking of the entire report.
The Eurydice Unit within EACEA was responsible for the final publication and layout of the report. It was also responsible for all work entailed in preparing maps, diagrams and other graphic material. Eurostat Unit E4 ‘Regional Statistics and Geographic Information System’ provided assistance for maps incorporating NUTS nomenclature statistical data. Finally, the summary entitled ‘Main Issues’ at the beginning of the report was the sole responsibility of the Eurydice Unit within EACEA.
All those who have contributed in any way to this collective undertaking are listed at the end of the report.
Conventions and Presentation of Content Besides its significance for policy-makers, the present report has been devised to provide a very wide audience with information on education systems in Europe.
In order for it to be easier to consult and readily accessible to everyone, the report contains numerous Figures, including histograms, maps and diagrams supplemented with comments on the essential points arising from the description and comparison of education systems.
Values associated with each quantitative indicator are presented in a table below the diagram concerned. When a table containing data is not published in printed form due to its size, readers are referred to annexes available on the Eurydice website (http://www.eurydice.org). Each Figure is accompanied by an explanatory note and additional notes directly underneath it. The explanatory note contains all details concerning terminology and conceptual aspects, which are needed for a proper understanding of the indicator and the Figure. The additional notes provide information that should be taken into account on important aspects of the situation in particular countries.
In the Figures and tables, countries appear in the protocol order established by the Office for Official Publications of the European Communities. This means that they are cited in alphabetical order in their original language and not that of the particular version of Key Data concerned.
Country name codes, statistical codes and the abbreviations and acronyms used are set out at the beginning of the report. The glossary of terms and statistical tools employed are included at the end of the report.
A table of Figures is also contained at the end of the publication. It covers the Figures from each chapter and, for each Figure, indicates the source and educational level (ISCED 0, ISCED 1-3 and ISCED 5-6).

K e y D a t a o n E d u c a t i o n i n E u r o p e 2 0 0 9
12
Electronic Version An electronic version of this seventh edition of Key Data on Education in Europe is also freely available on the Eurydice website (http://www.eurydice.org).

13
M A I N I S S U E S
Demography: Opportunities to modernise education systems and enhance quality in response to the imminent decrease in the compulsory school age population
Long-term demographic projections made on the basic trend variation of the population show a fall of around 11 % among those aged 5-9 in the EU-27 by 2020. For the 10-14 age groups the projections show an even more extreme situation with some countries set to experience a decline in the population of more than 40 % (Figures A1-A4). These projections therefore point towards a general tendency of significant reduction in the total number of pupils in compulsory education. Meanwhile, population forecasts concerning the distribution of teachers in Europe show that as the age groups of teachers closest to retirement are over-represented, many countries will experience teacher retirement on a very large scale in the near future (Figure D37). While these projections will affect pupil participation and teacher demand in compulsory as well as post-compulsory education, they are also an opportunity to adapt and plan the human and material resources required for improving the quality and effective functioning of education systems (Figures A4a and A4b).
� The proportion of young people in the EU-27 population continually decreased between 1985 and 2005. Over the following two years, the 0-9 age group maintained its 2005 level and even shows a small increase, while the 10-19 age group is still decreasing (Figures A1-A3).
� The proportion of pupils and students in the total population is between 15 % and 25 % in the majority of European countries. The decline in the numbers of young people in recent years explains the decrease of around 5 % of the pupils and students in the population (Figures C1 and C2).
� On the whole, the pupil/teacher ratio in primary schools declined in all countries between 2001 and 2006 – a tendency that may be explained partly by the relative reduction of the youth population (Figure A1) and the stable trend in the number of teachers in primary education (Figure E13).
� In Europe, the most strongly represented age groups of teachers in primary education are 30-39-year-olds and 40-49-year-olds (Figure D35). In the majority of countries, teachers in secondary education are older than those in primary education (Figure D36).
� In six countries, where the proportion of teachers in secondary education peak in the over 50 age groups, teacher retirement rates of 40 % or higher are expected within the next 10 years. In contrast, in other countries where the proportions tend to decrease through the older age groups, retirements will occur more evenly over time (Figure D37).

K e y d a t a o n E d u c a t i o n i n E u r o p e 2 0 0 9
14
Pre-primary education: Improvements in availability, access and participation can help to tackle equity issues
In Europe, pre-primary education-oriented institutions for which either the Ministry of Education or other authorities are responsible cater for children from the ages of 3 or 4 in the majority of countries (Figure B1). Although, enrolment in pre-primary education is almost always voluntary and fee-paying, over half of European countries have very high participation rates in pre-primary education from this age (Figures C5 and C6). The Communication on efficiency and equity in European education and training systems (European Commission, 2006a) stresses that pre-primary education can serve 'as an effective means to establish the basis for further learning, preventing school drop-out, increasing equity of outcomes and overall skill levels'. In order to ensure that all children, in particular the most deprived, benefit from effective intervention programmes countries are beginning to make investments so that provision can be increased, access made easier and improvements made in quality. One way to guarantee educational quality in pre-primary education is to ensure that all staff receive high-quality education and training (Eurydice, 2009a).
� In the majority of European countries, the Education Ministry is responsible for pre-primary education-oriented institutions, although in some countries other authorities than the Education Ministry are responsible for education-oriented pre-primary institutions or settings (Figure B2).
� Education-oriented pre-primary institutions mostly tend to be fee-paying, i.e. an enrolment fee is requested from parents for their children to take part in the programme, regardless of whether they are run by the public authorities or private bodies (Figure D7).
� Provision is generally available from at least 3 or 4 years of age. Over half of European countries have high participation rates (over 80 %) in pre-primary education from this age (Figure C6).
� Participation rates in pre-primary education are dependent on the provision that is available, but the general trend almost everywhere in Europe is towards an increase in the number of 4-year-olds enrolled in pre-primary or primary education (Figure C5).
� In an increasing number of countries, at least one year of pre-primary education is becoming compulsory (Figure B1).
� Although initial teacher education for pre-primary provision occurs in most countries at tertiary level ISCED 5A, it is still provided at ISCED 5B or upper secondary level in others (Figure D18).

M a i n I s s u e s
15
Compulsory education: A general trend towards more years of schooling to guarantee the acquisition of core competences
In the vast majority of European countries, compulsory full-time schooling lasts for nine or ten years, with the school trajectories generally being very similar for all children up to the end of the lower secondary level, i.e. up to 14 or 15 years of age. Reforms that have been undertaken in several countries in recent years include the extension of compulsory schooling and, in an effort to reduce school-leaving rates, a few countries have implemented measures to ensure that all pupils obtain a certificate of basic education, if necessary by continuing in the school system up to the age of 18 (Figure B1). With regard to compulsory subjects and the time dedicated to teaching them, in nearly all countries taught time is increasing in natural and social sciences as well as in foreign languages (Figures E2 and E3). As stated by the Recommendation of the European Parliament and the Council on key competences for lifelong learning, efforts must be made to ensure that all young people develop a wide range of knowledge, skills and attitudes equipping them for adult life, particularly for working life, whilst forming a basis for further learning. This applies in particular to disadvantaged pupils whose educational potential requires support (Council, 2006).
� The expected number of years of formal education for a 5-year-old child ranges from around 14 to 19. Compared with 2002, there is a group of countries that increased their school expectancy by more than a year (Figure C11).
� Although participation rates generally decline at the end of compulsory education, they still exceed 85 % in the second year after the end of compulsory education in 11 countries (Figure C10).
� In primary education, the language of instruction is clearly the most important subject in terms of taught time (Figures E2 and E4). During compulsory secondary education, the share of time earmarked for the language of instruction and mathematics is decreasing, while time given over to the natural and social sciences and foreign languages is increasing in nearly all countries. ICT as a subject accounts for a very small proportion of taught time; it is often included in other subjects or taught as part of technology studies (Figure E3).
� Textbooks are the main resource for pupils learning to read in the fourth year of primary education. Compared with the situation in 2001, an increase can be seen in the use of the new technologies to teach reading in school (Figure E5).
� Whole-class teaching is the most common organisational approach. In many countries, this method is also complemented by some other methods such as organising ability groups or individualised instruction (Figure E15).
� In almost all education systems, non-native pupils of foreign mother tongue receive special assistance in the form of language support measures within normal school hours and/or in separate groups/classes (Figure E16).

K e y d a t a o n E d u c a t i o n i n E u r o p e 2 0 0 9
16
Higher education: A significant rise in the number of students and increasing requirements for sustainable funding
During the period from 1998 to 2006, the student population in tertiary education has been continuously rising in the European Union. In total, the number of students in European countries grew in those years by 25 % and amounts to 18.7 million students (Figure C13). In a majority of countries students are required to contribute financially to the cost of their studies (Eurydice, 2009b). At the same time, students in many countries may benefit from a range of financial support measures issued in accordance with different criteria to help meet the cost of living (Eurydice, 2007a). The Commission Communication on delivering on the modernisation agenda for universities urges Member States to press on with the modernisation of Europe’s universities to achieve changes in the way in which systems are regulated, managed and financed, thereby addressing the skills needs of Europe’s workforce. Important areas that need to be addressed by future reforms include increased investment from more diversified sources and adequate student support schemes to ensure high-quality education and research as well as greater efficiency and equity in higher education outcomes (European Commission, 2006b).
� Out of those total education enrolments (at ISCED levels 0-6) the proportion of those enrolled in tertiary education increased from 15.6 % in 2002 to 17.4 % in 2006 (Figure C12).
� In 2006, on average across the EU-27, 123 women enrolled for every 100 men (Figures C15 and C16). Women account for the very large majority of enrolments in three main fields of studies, namely 'education', 'health and welfare', 'humanities and arts'. At the other extreme, men largely outnumber women in 'engineering, manufacturing, construction' and 'science, mathematics, computing' and this situation has not changed much since 2002 (Figure C18).
� Tuition fees are a widespread form of private contribution which is adopted in 16 countries (Figure D15). Differences between countries in the amounts required are substantial, ranging from under PPS EUR 200 to over PPS EUR 1 000 (Figure D16).
� Financial support to cover the cost of living and/or to pay administrative fees and contributions to tuition costs is awarded in almost all countries (Figure D14).
� In 2006, graduates in ‘social sciences, business and law’ account for over 35 % of all graduates in Europe, followed by 'health and welfare' graduates with 14.4 % and 'engineering' and 'humanities' with a little more than 12 % (Figure F5).
� The number of tertiary education graduates in ‘science and technology’ per 1 000 inhabitants rose at EU level from 11 in 2002 to 13 in 2006 (Figure F9).

M a i n I s s u e s
17
Financing: Total public expenditure on education as percentage of the GDP remains stable with highest cost per pupil in tertiary education
In the period 2001-2006, the overall proportion of EU-27 GDP given over to education remains stable around 5.1 %. However, this average rate hides disparities between countries, some of which experienced significant changes during the period (Figure D1). A breakdown of annual expenditure per pupil/student by educational level reveals two additional points: in almost all countries the unit cost increases with the educational level, and the disparities between countries widen with the educational level (Figure D5). In its Presidency Conclusions of March 2009, the European Council emphasises the urgent need to speed up and take concrete measures in the area of education and training, especially in light of the current financial and economic crisis, by improving the quality of investment in research, knowledge, and education (European Council, 2009). Direct public sector support in the form of family allowances, grants or tax relief provides financial support to the families of pupils enrolled in compulsory education, and can also be an incentive to continue studies beyond compulsory schooling. It therefore represents one strand of public sector education investment which is conducive to equality of opportunity (Figure D13).
� In 2006, the share of public expenditure on education was more than 5 % of GDP in more than half of the European countries (Figures D1 and D2). In nearly all of them, the total public expenditure on education allocated to secondary education represents a greater proportion of GDP than expenditure on other educational levels (Figure D3).
� The average annual cost in the EU-27 amounts to PPS EUR 4 896 per primary school pupil and PPS EUR 5 663 per secondary school pupil, while tertiary education is more expensive with an EU-27 average of PPS EUR 8 388 (Figures D4 and D5).
� In almost all European countries, the great majority of pupils attend public institutions; independent private education accounts on average for only 2.5 % of enrolments (Figure B3).
� In all countries staff costs represent the largest share of total expenditure on education, that is to say an average of 71 % of annual expenditure in the EU-27 (Figure D10).
� Central and/or local governments make most decisions regarding the overall amount of public expenditure earmarked for schools providing compulsory education according to the category of resources concerned. The regional level is the main funder and user of education-related budgets in only four countries. (Figures D8 and D9)
� In many countries, overall public expenditure on teaching staff is determined by central government, while decision-making procedures concerned with the expenditure for non-teaching staff, operational resources and movables are shared out between central and local levels or are implemented at local level only. The general tendency is to decentralise decisions for determining the overall amounts to be allocated to resources not directly related to teaching (Figure B19).

K e y d a t a o n E d u c a t i o n i n E u r o p e 2 0 0 9
18
Teachers: More widespread support for new teachers and wider recognition of continuing professional development as a professional duty
As key players in education, teachers are faced with many responsibilities and duties that often go beyond their daily interactions with pupils to include various educational activities developed within their schools. Ministers of Education agreed in 2007 to give high priority to sustaining and improving the quality of teacher education, and to ensure that in-service education is responsive to teaching needs in terms of both quality and quantity (Council, 2007). In many countries, continuing professional development is considered an integral part of the professional duties of teachers (Figure D24). However, disparities remain between formal requirements, the reality of everyday experience, and the means made available. A coherent overall strategy on teachers and teacher education, by placing the range of teachers' duties and increasing responsibilities in their context, can contribute towards improving the overall quality of teaching. The status, working conditions and support provided to teachers are essential elements to consider within such overall strategy (Eurydice, 2008).
� The majority of teachers for primary and lower secondary education, and all teachers for upper secondary level, receive initial teacher education at tertiary level with academically-oriented qualification (ISCED 5A) (Figures D19-D21).
� In primary and secondary education, women account for the majority of teachers (over 60 %). By contrast, in tertiary education women teachers represent less than 40 % in half of the countries (Figure D34).
� Special support for new teachers, generally in the form of assistance in the planning and assessment of lessons and/or special training, is becoming more widespread (Figures D23 and D27). But formal support in the form of an 'induction phase' is organised only in eleven countries (Figure D22).
� Although continuing professional development is officially considered a professional duty in the majority of countries, in practice it is often optional (Figure D24). With regard to in-service training for teaching reading, there has been an increase, between 2000/01 and 2005/06 in the share of pupils whose teachers had taken part in in-service training activity in this area between 6 and 35 hours in the last two years (Figure D25).
� Nearly all countries define teachers' working time not only in terms of teaching hours, but also include time commitments for availability at school or/and define an overall working time (Figures D29 and D30).
� In almost all European countries, the official retirement age is 65 (Figure D31). However, many teachers leave their profession as soon as they have completed the required number of years in service and/or reached the minimum age for retirement with full pension entitlement (Figure D37).

M a i n I s s u e s
19
School autonomy: Policies are leading to more responsibilities for schools, school heads, teachers and parents
School autonomy has come to be a widespread policy in Europe. Initially pursued as a basic principle – namely that institutions should be autonomous in order to guarantee teaching freedom, to strengthen local school democracy and to complete the process of decentralisation – school autonomy has today become, in most countries, an instrument to achieve primarily educational goals: in other words, more freedom is given to schools and teachers in order to improve the quality of education (Eurydice, 2007b, 2008). Although all countries now view the purpose of school autonomy largely in educational terms, there remain marked differences across Europe in the implementation of the school autonomy process as well as in the extent and nature of autonomy. Differences in the implementation of school autonomy policies also exist with regard to the body or individuals to whom powers are devolved (Figures B15-B18).
� In most European countries, a large degree of autonomy is granted to schools for the use of public funds for operating expenses and the management of teaching staff (Figure B15).
� Concerning the recruitment of teachers, schools and local level authorities in many countries have full autonomy and are often the authority that has responsibility for their employment (Figure B18).
� School heads spend on average more than 40 % on management and administrative activities such as hiring staff and budget management, and much less on teaching activities (Figure D41).
� Although teachers have relatively little say in determining the content of the compulsory curriculum, they have much freedom in daily education activities, such as choice of teaching methods and textbooks, grouping of pupils for learning activities and internal assessment (Figure B15).
� In the majority of countries parent representatives, who are included on school administrative councils or management bodies, have a consultative function or decision-making power in the development of the school educational plan or school action plan (Figure B16).
� At national level, there are specific provisions for the establishment of a central council with parent representation in about half of European countries (Figure B17).

K e y d a t a o n E d u c a t i o n i n E u r o p e 2 0 0 9
20
Quality assurance: A rise in the use of different standardised forms of external evaluation as tools for monitoring and accountability
In parallel with the development of policies for school autonomy in European countries, various measures have emerged that allow for a regular and systematic monitoring and evaluation of education systems. Among other objectives, such monitoring aims at examining the system closely, reporting on its quality, strengthening accountability measures and enabling adjustments to improve performance. It may take place at school level, or at local, regional or national levels (Figure B13). Across Europe, centrally standardised criteria for external evaluation of schools or standardised tests that are specifically designed for monitoring the education system are increasingly used as a tool for measuring and monitoring the quality of education (Figure B11 and B13). They are often used in combination with other information sources, such as national testing of pupils e.g. in the form of external examinations for certified assessment (Eurydice, 2009c). The ultimate goal is to obtain a picture of the performance of education systems as part of efforts to improve the quality of teaching and learning.
� In a very large number of countries, schools are evaluated externally, generally by an inspectorate, and internally by school staff and sometimes other members of the school community (Figure B10).
� Many European countries have regularly updated lists of centrally standardised criteria for the external evaluation of schools. In some countries, internal evaluation criteria are also undergoing standardisation (Figure B11).
� External tests designed specifically to monitor the education system, based on the measurement of pupils' proficiency levels in areas prescribed at national level, are becoming increasingly important (Figure B14).
� In order to monitor education systems at central level, European countries rely on several sources of information – the results of external examinations for certified assessment (Figures E22 and E23), results of tests designed for monitoring the education system or to support individual pupil's learning and findings from the external evaluation of schools. The majority of countries use at least two of these sources (Figure B13).
� Findings from the external evaluation of schools conducted at national and sometimes local level are routinely published in over one-third of European countries (Figure B12).

M a i n I s s u e s
21
Bibliography
Council of the European Union (2007), Improving the quality of teacher education, Council Conclusions of the 15th November 2007, Official Journal C 300, 12.12.2007.
Council of the European Union (2006), Key competences for lifelong learning, Recommendation of the European Parliament and of the Council of 18th December 2006, 2006/962/EC.
European Commission (2006a), Efficiency and equity in European education and training systems, Communication from the Commission to the Council and to the European Parliament, COM (2006) 481.
European Commission (2006b), Delivering on the modernisation agenda for universities: Education, research and innovation, COM (2006) 30 final of 25/01/06 and COM (2006) 208 final of 10/05/06.
European Council (2009), Presidency conclusions of the Brussels European Council 19/20 March 2009, 7880/09
Eurydice (2009a), Early childhood education and care in Europe: Tackling social and cultural inequalities, Comparative study.
Eurydice (2009b), National testing of pupils in Europe: Objectives, organisation and use of results, Comparative study.
Eurydice (2009c), Higher education in Europe 2009: Developments in the Bologna process, Comparative study.
Eurydice (2008), Levels of autonomy and responsibilities of teachers in Europe, Comparative study.
Eurydice (2007a), Key Data on Higher Education in Europe, Indicators and figures.
Eurydice (2007b), School autonomy in Europe: Policies and measures, Comparative study.


23
C O D E S , A B B R E V I A T I O N S A N D A C R O N Y M S
Country codes
EU/EU-27 European Union PL Poland
BE Belgium PT Portugal
BE fr Belgium – French Community RO Romania
BE de Belgium – German-speaking Community SI Slovenia
BE nl Belgium – Flemish Community SK Slovakia
BG Bulgaria FI Finland
CZ Czech Republic SE Sweden
DK Denmark UK United Kingdom
DE Germany UK-ENG England
EE Estonia UK-WLS Wales
IE Ireland UK-NIR Northern Ireland
EL Greece UK-SCT Scotland
ES Spain
FR France EFTA/EEA IT Italy countries
CY Cyprus
The three countries of the European Free Trade Association which are members of the European Economic Area
LV Latvia IS Iceland
LT Lithuania LI Liechtenstein
LU Luxembourg NO Norway
HU Hungary
MT Malta Candidate country
NL The Netherlands TR Turkey
AT Austria
Statistical codes
(:) Data not available (–) Not applicable

K e y D a t a o n E d u c a t i o n i n E u r o p e 2 0 0 9
24
Abbreviations and acronyms International conventions
ESS European Statistical System
EU-27 The 27 Member States of the European Union after 1 January 2007
Eurostat Statistical Office of the European Communities
GDP Gross Domestic Product
GNI Gross National Income
ICT Information and communication technology
ISCED International Standard Classification of Education
PIRLS Progress in International Reading Literacy Study (IEA)
PISA Programme for International Student Assessment (OECD)
PPP Purchasing Power Parity
PPS Purchasing Power Standard
National abbreviations in their language of origin
AHS Allgemein bildende höhere Schule AT
ARGO Autonome Raad voor het gemeenschapsonderwijs BE nl
BTS Brevet de technicien supérieur FR LU
CPGE Classes préparatoires aux grandes écoles FR
CSA Centri Servizi Amministrativi IT
DUT Diplôme Universitaire de Technologie LU
EUD Erhvervsuddannelse DK
FHL Fachhochschule Liechtenstein LI
GNVQ General National Vocational Qualifications UK
HAVO Hoger Algemeen Voortgezet Onderwijs NL
HBO Hoger Beroepsonderwijs NL
HF Højere Forberedelseseksamen DK
HHX Højere Handelseksamen DK
HTX Højere Teknisk Eksamen DK
IAP Internationale Akademie für Philosophie LI

C o d e s , A b b r e v i a t i o n s a n d A c r o n y m s
25
National abbreviations in their language of origin
IEES Institut d’études éducatives et sociales LU
IEK Institouto Epagelmatikis Katartisis EL
ISERP Institut supérieur d’études et de recherches pédagogiques LU
IST Institut Supérieur de Technologie LU
ITS Institute of Tourism Studies MT
IUT Instituts universitaires technologiques FR
KN Kolegium nauczycielskie PL
KY Kvalificerad Yrkesutbildning SE
LEA Local Education Authority UK-ENG/WLS
MAVO Middelbaar Algemeen Voortgezet Onderwijs NL
MBO Middelbaar Beroepsonderwijs NL
MCAST Malta College of Arts, Science and Technology MT
NAE National agency for education (Skolverket) SE
NKJO Nauczycielskie kolegium j�zyków obcych PL
NPQH National Professional Qualification for Headship UK-ENG
NVQ National Vocational Qualifications (NVQ) UK
PQH Professional Qualification for Headship UK-NIR
STS Sections de techniciens supérieurs FR
TEE Technika Epagelmatika Ekpaideftiria EL
TEI Technologiko Ekpaideftiko Idryma EL
UCAS Universities and Colleges Admissions Services UK
VBO Voorbereidend Beroepsonderwijs NL
VMBO Voorbereidend Middelbaar Beroepsonderwijs NL
VWO Voorbereidend Wetenschappelijk Onderwijs NL
WO Wetenschappelijk Onderwijs NL
WOT Wet op het Onderwijstoezicht NL


27
C O N T E X T
THE NUMBER OF YOUNG PEOPLE IS DECREASING AT DIFFERING RATES ________________________ IN EU MEMBER STATES _________________________
In 2007, there were 174.6 million young people aged under 30 in the 27 countries now integrated in the European Union (EU-27). This total has been gradually decreasing since 1985.
The overall variation in the number of those aged under 30 corresponds to a decline within each constituent age group. Demographic trends within the 0-29 age range reflect the fall in the birth rate recorded in most EU-27 countries since the 1960s.
The size of the population of the EU-27 in the 0-9 and 10-19 age groups decreased continually between 1985 and 2005. However, between 2005 and 2007 these age groups have revealed different tendencies as the 0-9 age group has maintained its 2005 level and even shows a slight increase while the 10-19 age group is still decreasing. From the mid-1980s, the 20-29 year olds became the largest age group, overtaking those aged 10-19 and 0-9 respectively. The 20-29 age group has also been relatively stable during the period 2005/06 with a slight increase in 2007.
Figure A1: Variation of the population in the 0-9, 10-19 and 20-29 age groups in the EU-27 (1985-2007)
0-9 age group 10-19 age group 20-29 age group
1985 61 981 774 70 560 146 71 747 526
1990 59 755 140 66 069 001 73 035 161
1995 56 945 603 62 870 813 71 366 222
2000 53 278 070 61 189 541 67 627 903
2005 51 094 592 58 820 580 66 001 798
2007 51 196 945 57 276 530 66 085 404
Source: Eurostat, population statistics (data extracted July 2008). Additional notes France: The data relates solely to the Metropolitan territory and does not include the overseas départements. Cyprus: The data relates to territories under government control. Explanatory note
The population is that of 1st January in the reference year. The population is based on data from the most recent census adjusted by the components of population change produced since the last census, or based on population registers.
This overall trend conceals contrasting situations among specific countries. For the 0-9 age group, although the EU-27 members have reported a stable situation during the 2005-2007 period, in countries such as Germany, Cyprus, Lithuania, Malta and Poland, the population has decreased at rates higher than 1.5 % per year. However, for the same age group and time period Ireland and Spain had significant growth rates above 2.5 % per year. In the 10-19 age group, several countries (Bulgaria, Estonia and Romania) had a population

C O N T E X T
28
decrease over three times higher than the average rate for the EU-27. The decline for the same age group in Latvia has reached up to four times the rate for the EU-27 average and was around 6 % per year between 2005 and 2007.
_____ THE REGIONAL DISTRIBUTION OF THOSE AGED UNDER 30 IS UNEVEN ______
The number of people aged under 30 has been steadily decreasing in Europe since 1985 (Figure A1) and the proportion of young people in the total population varies substantially from one region to the next. In nearly half of the regions for which data are available, those aged under 30 represent between 30 % to 40 % of the total population. In a few regions this figure reaches over 45 % of the total population: in Ireland (Southern and Eastern and Border Midlands and Western), Spain (Ciudad Autónoma de Melillia), France (the overseas départments), Portugal (Açores), Slovakia (Východné Slovensko) and some regions of Turkey.
Figure A2: Percentage of young people in the 0-29 age group by NUTS regions, 2006
Source: Eurostat, population statistics (data extracted July 2008). Additional note United Kingdom: Data are for the year 2004. Explanatory note The population is that of 1 January in the reference year. NUTS 1 are used in most countries with the exception of Bulgaria, the Czech Republic, Ireland, Portugal, Slovenia, Slovakia, Finland, Sweden and Norway. In these countries NUTS 2 are used. For the definition of NUTS classification, please see the Glossary and Statistical Tools section.

CONTEXT
29
Regional disparities are especially marked in southern Europe (Spain, Italy and Portugal), France and Slovakia. The proportion of young people is relatively high in the south of Spain (and in the Canary Islands), accounting for slightly more than 39 % of the total population in these regions against 35 % or less in the rest of the country. In France, the average percentage of young people is 38 %, it varies from 34 % in the Sud-Ouest to nearly 60 % in the overseas department of Guyenne. In the southern regions of Italy, the proportion of young people reaches or exceeds 35 % while it is 29 % or less in Nord West, in Lombardia, in Nord East, in Emilia-Romagna and in the Centro regions. In the north of Portugal (and also in Açores and Madeira), those aged under 30 represent more than 37 % of the population, but the proportion is around 34 % in Lisbon, as well as in the southern regions (Alentejo and the Algarve). In Slovakia, young people account for over 45 % of the total population in Východné Slovensko while they represent only 37 % in Bratislavský kraj.
_________ OVER A THIRD OF THE POPULATION OF EUROPE IS UNDER 30 _________
Young people under 30 years old represented more then 35 % of the population of the EU-27 in 2006. The largest group within this cohort is young people between 20 and 29 years old, followed by those aged 10-19 and then those in the 0-9 age group. The average proportion of young people aged under 30 in Central and Eastern European countries was slightly higher, reaching 38 % in 2006. In Turkey the youth population had a distinctive distribution with higher levels of young people in all age groups. Overall, people under the age of 30 represented more than 55 % of the total population in Turkey.
Figure A3: Proportion of the population in the 0-9, 10-19 and 20-29 age groups, 2007
0-9 age group 10-19 age group 20-29 age group
EU-27 BE BG CZ DK DE EE IE EL ES FR IT CY LV LT LU HU MT NL AT PL PT RO SI SK FI SE UK IS LI NO TR
10.3 11.2 8.7 9.2 12.1 9.0 9.7 14.0 9.4 9.9 12.5 9.3 11.0 8.8 9.5 12.0 9.6 10.3 12.1 9.8 9.7 10.3 10.0 9.1 10.0 10.9 10.8 11.5 13.9 11.1 12.6 18.9
11.6 11.9 11.2 11.5 12.4 10.7 12.8 13.1 10.2 9.8 12.4 9.7 14.1 12.9 14.2 12.1 11.8 13.4 12.1 11.7 13.4 10.7 12.7 10.9 13.6 12.3 13.0 12.7 14.9 12.2 13.3 18.1
13.3 12.4 14.3 14.8 11.4 11.9 15.0 17.3 13.8 14.6 12.8 11.5 16.7 15.0 14.6 12.6 14.4 14.6 12.0 12.7 16.8 13.9 15.7 14.4 16.9 12.6 12.0 13.3 14.5 12.5 12.1 18.4
Total
EU-27 BE BG CZ DK DE EE IE EL ES FR IT CY LV LT LU HU MT NL AT PL PT RO SI SK FI SE UK IS LI NO TR 35.3 35.5 34.2 35.5 35.9 31.6 37.5 44.4 33.3 34.3 37.8 30.6 41.8 36.7 38.4 36.8 35.8 38.3 36.1 34.3 39.9 34.9 38.5 34.3 40.4 35.8 35.8 37.5 43.3 35.7 38.1 55.3
Source: Eurostat, population statistics (data extracted July 2008).

C O N T E X T
30
Additional notes (Figure A3) Cyprus: The data relate to territories under government control. Turkey: Data provided are for 2006. Explanatory note The population is that of 1 January in the reference year.
The age structure of the youth population varies to a greater or lesser extent according to the country concerned. In Ireland, Cyprus, Poland, Slovakia, Iceland and Turkey, the youth population represented more than 40 % of the whole population. In two of these countries, namely Ireland and Iceland, the youngest age group (0-9 years old), constitutes around 14 % of the total population, the highest level for all the countries analysed with exception of Turkey. The highest proportion of young people in the age group 10-19 occurred in Cyprus, Lithuania, Iceland and Turkey where the percentage was greater than 14 % of the total population. The proportion of young people between 20 and 29 years old was lower in some of the Nordic countries such as Denmark, Sweden and Norway but also in Germany, Italy and Austria, where this group corresponded to not more than 12 % of the total population.
In all, the proportion of young people aged under 30 in 2006 was lowest (at around 30 %) in Italy and Austria, followed by Germany with 31.6 %. Ireland and Turkey recorded the highest proportion of young people with 44.4 % and 55.3 % respectively.
SOME COUNTRIES FACE A STEEP FALL IN _______________ THE COMPULSORY SCHOOL AGE POPULATION _______________
Demographic projections for young people in the 5-14 age group provide a reliable estimate of future pupil intake in primary education (ISCED 1) and lower secondary education (ISCED 2). These projections may be used to plan the human and material resources required for the efficient functioning of education systems.
More specifically, population forecasts for the 5-9 and 10-14 age groups respectively are especially helpful given the compulsory nature of primary education (ISCED 1) and lower secondary education (ISCED 2) in European countries (Figure B1). By 2010, the projections made on the basic trend variation of the population show a fall of around 8.5 % among those aged 5-9 in the EU-27 and of over 12 % among those aged 10-14. The long term projections for 2020 identify a more pronounced decrease of around 11 % in the numbers of children in the 5-9 age group across the EU-27. The same projections up to 2020 for the Central and Eastern European countries indicate an even greater decrease in the numbers of young people of compulsory education age. The estimated decrease will reach 25 % for the 5-9 age group and above 60 % for pupils in lower secondary education.
All countries with the exception of Ireland, Spain, Luxembourg and Portugal are anticipating a decrease in the number of pupils at ISCED level 1 by 2020. In the 5-9 age group, Spain and Ireland are expecting the highest growth with rates above 10 % between 2000 and 2020. The countries with the most significant population decline in this age group are Bulgaria, Lithuania and Slovakia with rates above 30 % by 2020. In Italy, France and the Netherlands, the decline in the size of the 5-9 age group will begin after 2010. During the period 2000-2010 all three of these countries expect a slight increase in numbers, reaching 5.5 % in the case of France, followed by a decrease between 2010 and 2020 to a level below that of the year 2000.

CONTEXT
31
Figure A4a: Projected population changes for the 5-9 age group between
2000 and 2010, and between 2000 and 2020
2000 - 2010 2000 - 2020
EU-27 BE BG CZ DK DE EE IE EL ES FR IT CY LV LT LU HU MT NL AT PL PT RO SI SK FI SE UK IS LI NO TR
-8.5 -6.4 -26.3 -23.9 -3.1 -12.2 -21.3 13.7 -7.0 13.8 5.5 0.9 -25.2 -30.7 -36.8 0.2 -19.9 -19.0 2.6 -15.6 -29.5 4.1 -16.7 -12.6 -29.7 -13.3 -18.2 -11.7 : : : :
-11.2 -9.0 -35.2 -24.0 -15.7 -15.4 -14.6 19.6 -4.1 12.0 -0.5 -8.4 -18.4 -19.3 -34.8 2.7 -22.3 -11.8 -8.2 -17.8 -28.7 1.4 -19.8 -10.2 -31.4 -11.6 -10.8 -11.0 : : : :
Source: Eurostat, population statistics (data extracted July 2008).
Figure A4b: Projected population changes for the 10-14 age group between 2000 and 2010, and between 2000 and 2020
2000 - 2010 2000 - 2020 EU-27 BE BG CZ DK DE EE IE EL ES FR IT CY LV LT LU HU MT NL AT PL PT RO SI SK FI SE UK IS LI NO TR
-12.9 -1.6 -39.2 -30.0 16.5 -13.5 -43.2 -4.5 -13.3 -4.1 -4.1 -1.9 -13.2 -49.2 -32.7 17.6 -19.7 -12.7 4.5 -5.8 -31.6 -5.9 -36.7 -24.9 -29.3 -4.3 -12.7 -6.4 : : : :
-14.9 -6.0 -42.1 -29.1 4.4 -21.9 -37.5 11.4 -8.3 9.5 -2.4 -0.6 -23.2 -41.6 -44.0 14.5 -24.1 -12.2 0.9 -14.0 -41.7 -0.4 -39.5 -27.9 -38.5 -8.3 -3.4 -11.2 : : : :
Source: Eurostat, population statistics (data extracted July 2008).
Explanatory note (Figures A4a and A4b)
Population projections involve making population estimates and producing the most credible figures for the years to come. Estimates are made using the latest available figures for the population on 1 January. In general, key assumptions are made with respect to mortality, fertility and migration by sex and by age, and specific ageing techniques are applied to the population pyramid from year to year.
In Estonia, Cyprus, Latvia, Malta and Sweden the decline in the number of young people in the age group 5-9 will cease by 2010 and it will increase until 2020. Nevertheless, in these countries the 2000 levels will not be reached, therefore the national education systems must plan the resources required for primary education (ISCED 1) in a flexible way.

C O N T E X T
32
The projections for the 10-14 age group evidence a more extreme situation where, as stated above, in some of the countries the decline of the population will reach rates of more than 40 %, as it is the case of Bulgaria, Latvia, Lithuania and Poland for 2020.
At the other extreme, in Denmark and Luxembourg and, to a lesser extent, the Netherlands, the 10-14 age group will grow in size between 2000 and 2010 and will then start to decrease between 2010 and 2020. However, the number of young people in lower secondary education will be higher in these countries in 2020 than they were in 2000.
In Ireland, Greece, Spain, France, Italy, Portugal and Sweden there will be an increase in enrolments in secondary education between 2010 and 2020 following the expected decline between 2000 and 2010. However, in only Ireland and Spain, will the number of young people in the 10-14 age group be higher in 2020 than in 2010.
IN MOST COUNTRIES LESS THAN 10 % OF YOUNG PEOPLE UNDER 15 ARE ___________________________ NON-NATIONALS ___________________________
In 2007, the non-national population represented less than 10 % of the total population in almost all Member States. The exceptions were Cyprus, Estonia and Latvia where the proportion was around 20 %, and Luxembourg with more than 40 %.
Figure A5: Proportion of non-nationals in the total population and in the population aged under 15, 2007
Non-nationals in the total population
Non-nationals aged under 15 in the total population aged under 15
EU-27 BE BG CZ DK DE EE IE EL ES FR IT CY LV LT LU HU MT NL AT PL PT RO SI SK FI SE UK IS LI NO TR
5.8 8.8 0.3 2.9 5.1 8.8 17.6 : 7.9 10.4 5.8 5.0 15.2 19.0 1.2 41.6 1.7 3.4 4.2 10.0 0.1 4.1 0.1 2.7 0.6 2.3 5.4 6.0 : : 5.1 :
5.1 : : 1.7 4.7 8.1 : : : 10.0 : : : : 0.7 47.7 0.9 2.4 3.2 10.3 0.0 : 0.1 1.3 0.2 2.1 4.5 : : : 4.3 :
Source: Eurostat, population statistics (data extracted July 2008).
Additional notes EU-27: Is calculated from countries with non-national data. Bulgaria, Estonia, Greece, France and United Kingdom: Data about non-nationals are Eurostat estimates Cyprus: The data relate to territories under government control. Latvia: The data include also persons holding a non-citizen passport of the Republic of Latvia. Explanatory note The proportion of non-nationals in the total population is calculated by dividing the total population of non-nationals by the total population on 1 January and multiplying the result by 100. The proportion of non-nationals aged under 15 in the total population aged under 15 is obtained by dividing the population of non-nationals in the 0-14 age group by the total population in the 0 -14 age group and multiplying the result by 100.

CONTEXT
33
Belgium, Germany, Greece, Spain and Austria have registered an overall non-national population of between 8 % and 10 % with an ascending trend over the last five years (for more details see Key Data on Education in Europe 2005). The Central and Eastern European countries, with the exception of Estonia and Lithuania, are similar in that they have small non-national populations, not exceeding 2.5 % in most countries.
In all states for which data are available, the proportion of young people who are non-nationals aged under 15 represents around 5 % of the total population of the same age. This figure is very different for the five Central and Eastern European countries with available data for their non-national populations aged under 15 where the proportion of these young people is below one percent.
Non-nationals aged under 15 are more numerous in Germany, Spain, Luxembourg and Austria where they are above 8 % of the total youth population, with much higher values for Luxembourg where the proportion of non-nationals in this age group reached almost 48 %. Everywhere else, the proportion of young non-nationals under 15 years old was less than 4 % with the exception of Denmark, Sweden and Norway where young non-nationals represented around 4.5 %. In fact, in all countries for which data is available, the proportion of non-nationals in the under 15 age group is smaller than the figure for non-nationals in the total population. The only exception is Austria where the proportion of young non-nationals in the age group under 15 years old was slightly higher than in the total population.
TERTIARY EDUCATION GRADUATES HAVE ___________________ A MUCH HIGHER EMPLOYMENT RATE ___________________
While age is a determining factor in securing a job in the European Union, the level of qualifications held by individuals is another significant factor. The employment rate for people with tertiary education (ISCED 5-6) was much higher than for people with lower-level qualifications (ISCED 0-2). Indeed, the employment rate for people with higher education qualification aged between 25 and 39 years was around 20 percentage points higher than that for other people in the same age group but less well-qualified. This correlation between employment rates and levels of qualification is typical of the EU-27 nations and is more pronounced among the 40-64 age group than for younger people.
Analysing the population with tertiary education qualification, it can be seen that more than 85 % of people aged under 40 were employed in almost all EU-27 countries. This rate was even higher than 91 % in Lithuania, Malta, the Netherlands, Romania, Slovenia and Norway. In the majority of countries the age group between 25 and 39 with tertiary education was more frequently employed than the older age group (40-64 years). That difference for 2007 was more than 11 points for Belgium and Malta and reaching 17 points in Turkey. However, there were two countries, namely the Czech Republic and Italy, where a higher proportion of people with tertiary education and aged over 40 years was in employment.
In the European Union in 2007, holders of upper secondary education qualifications constituted an intermediate group with an employment rate of around 80 % for the 25-39 age group and 10 points less for the 40-64 age group
In Luxembourg, Poland and Slovenia, among people with upper secondary education qualification, there were approximately 18 % more people aged between 25-39 years who were in employment than people over 40 years old. In the United Kingdom, however, there was no difference in the employment rates between the two age groups.

C O N T E X T
34
Figure A6: Proportion of people in employment
by age group and highest level of education attained, 2007
Low (ISCED 0-2) Intermediate (ISCED 3-4) High (ISCED 5-6)
Between 25 and 39 years Between 40 and 64 years Low (ISCED 0-2)
EU-27 BE BG CZ DK DE EE IE EL ES FR IT CY LV LT LU HU MT NL AT PL PT RO SI SK FI SE UK IS LI NO TR
66.1 60.0 50.7 49.8 75.7 57.9 66.8 63.5 72.3 72.3 66.4 65.7 76.5 70.5 59.9 80.3 49.1 62.3 74.5 69.9 53.1 80.8 59.8 73.9 25.3 68.8 67.2 63.5 : : 70.8 49.7
53.4 46.8 41.9 44.3 63.8 53.4 49.7 56.9 55.5 54.7 55.5 47.5 62.8 51.9 40.9 54.3 33.8 43.2 57.6 53.4 37.2 66.8 50.8 51.2 30.2 56.1 66.4 64.6 : : 63.4 41.3
Intermediate (ISCED 3-4)
EU-27 BE BG CZ DK DE EE IE EL ES FR IT CY LV LT LU HU MT NL AT PL PT RO SI SK FI SE UK IS LI NO TR
80.0 82.4 81.8 81.1 87.9 80.7 83.7 80.7 75.2 79.8 82.6 76.5 83.3 82.4 81.2 84.5 78.1 85 87.9 85.2 76.5 81.7 76.1 87.1 78.6 80.2 86.3 81.1 : : 86.2 66.3
70.9 68.2 71.9 72.5 79.3 71.7 76.7 73.3 63.6 72.7 71.6 72.6 76.4 74.9 73.0 66.5 64.1 79.2 75.2 71.2 58.3 76.8 64.5 67.1 68.9 73.8 81.3 81.0 : : 81.5 54.0
High (ISCED 5-6)
EU-27 BE BG CZ DK DE EE IE EL ES FR IT CY LV LT LU HU MT NL AT PL PT RO SI SK FI SE UK IS LI NO TR
87.6 90.9 89.7 83.2 90.8 90.2 87.5 88.8 83.2 85.4 87.5 76.7 90.6 89.1 91.7 88.9 83.2 92.9 93.8 89.9 88.8 86.4 91.8 91.9 85.2 87.4 88.8 90.3 : : 91.6 81.6
83.2 79.7 82.0 86.9 85.5 83.9 87.3 83.5 82.8 83.0 78.8 83.9 83.7 85.9 87.3 79.9 77.9 81.2 83.4 84.5 78.5 85.3 81.0 83.4 83.4 83.8 88.3 86.0 : : 89.5 64.8
Source: Eurostat, Labour Force Survey (data extracted July 2008).

CONTEXT
35
Additional note (Figure A6) United Kingdom: National Vocational Qualifications (NVQ) level 1 and Foundation General National Vocational Qualifications (GNVQ) are included as ISCED level 0-2 qualifications. Explanatory note The indicator is calculated by dividing the number of employed people within age group 25-64 years having attained a specific level of education, by the total population of the same age group.
MORE WOMEN GRADUATES THAN MEN ARE IN ROLES _________________ FOR WHICH THEY ARE OVER-QUALIFIED __________________
In most European Union countries people with tertiary education qualification accept roles for which they are over-qualified for a range of socio-economic reasons. In 2007 only around 55 % of all the graduates worked as ‘managers’ or ‘professionals’ and more than 20 % as ‘technicians or associate professionals’.
Some countries stand well apart from the EU average, particularly Spain, France, Cyprus and Norway. The percentage of graduates occupying posts as ‘managers’ or ‘professionals’ in these at countries was lower than 50 %. At the other extreme, in the Czech Republic, Hungary, Malta, Romania and Slovenia, the percentage of graduates engaged in similar posts was around 70 %, giving the impression that, in these countries, tertiary graduates benefit from a better access to the labour market and a closer match between their roles and levels of qualification.
The tendency of accepting roles for which candidates are over-qualified is particularly applicable to women graduates. During 2007, the proportion of women graduates who worked as ‘technicians and associate professionals’ was higher than men in all countries except Belgium, the Czech Republic and Cyprus. Furthermore, women accepted, on average twice as often as men, jobs such as clerks, service and sales workers. In all European countries the proportion of women in this group was higher than men. Additionally, in Ireland, Spain and Cyprus the proportion of women working in this occupational category was more than 40 % higher than the EU-27 average.
Relatively few graduates (around 7 %) have jobs in the ‘craft workers and machine operators’ category. However, the proportion of men who do so is over 10 % in Germany, Spain, France, Cyprus, Austria and the United Kingdom. This figure can not be directly linked to the unemployment levels in those countries, but is more likely due to specific socioeconomic factors.

C O N T E X T
36
Figure A7: Tertiary education graduates in employment by occupational category and sex
(ISCED 5 and 6), 2007
Professionals and managers
Technicians and associate professionals
Clerks, service and sales workers
Craft workers, machine operators
Males Females
Source: Eurostat, Labour Force Survey (data extracted July 2008).
Explanatory note Occupations are defined here in accordance with the International Standard Classification of Occupations (ISCO-88) which was initiated by the International Labour Organization (Geneva, 1990) and is used in the Eurostat Labour Force Survey (see the Glossary and Statistical Tools section). Percentages have been calculated on the basis of the employed population and do not take account of ‘non-respondents’ and the ‘armed forces’ category (ISCO code 0) in the denominator. The total employment per category is calculated only with the available data.

CONTEXT
37
Data (Figure A7)
Professionals and managers
EU-27 BE BG CZ DK DE EE IE EL ES FR IT CY LV LT LU HU MT NL AT PL PT RO SI SK FI SE UK IS LI NO TR
60.7 64.6 61.8 67.6 60.4 58.2 58.1 58.4 65.5 44.0 58.1 65.4 54.9 56.6 62.8 88.0 75.6 75.7 69.1 57.5 71.4 70.4 80.6 77.0 62.5 69.0 61.4 62.9 : : 46.8 56.7
52.8 62.7 58.5 68.5 40.9 51.8 50.8 56.9 61.8 45.7 41.5 51.2 44.3 58.6 64.5 : 71.9 71.3 65.2 61.1 69.1 60.2 76.0 72.4 63.1 47.1 52.2 47.5 : : 33.3 57.0
Total 56.8 63.6 59.9 68.0 50.4 55.6 53.6 57.6 63.8 44.8 49.4 58.2 49.5 57.9 63.8 84.6 73.8 73.4 67.3 59.0 70.1 64.4 78.4 74.4 62.9 56.7 56.2 55.4 : : 40.0 56.8
Technicians and associate professionals
EU-27 BE BG CZ DK DE EE IE EL ES FR IT CY LV LT LU HU MT NL AT PL PT RO SI SK FI SE UK IS LI NO TR
19.0 16.4 14.7 26.4 23.1 18.6 12.7 10.1 15.7 20.2 24.8 23.2 19.4 20.8 9.2 9.6 14.0 16.4 18.2 15.7 13.8 16.0 10.0 15.0 27.1 18.2 23.1 17.0 : : 37.4 16.2
25.5 12.4 22.6 24.9 44.8 30.3 23.0 10.2 18.7 20.4 33.9 32.3 16.4 26.9 17.7 14.2 16.6 18.3 19.1 20.2 14.8 24.2 14.8 19.9 28.0 31.6 34.4 25.0 : : 51.9 19.0
Total 22.2 14.4 19.4 25.8 34.2 23.4 19.0 10.1 17.1 20.3 29.5 27.8 17.9 24.5 14.1 11.7 15.5 17.3 18.6 17.5 14.3 20.8 12.4 17.7 27.5 25.7 29.5 21.0 : : 45.3 17.1
Clerks, service and sales workers
EU-27 BE BG CZ DK DE EE IE EL ES FR IT CY LV LT LU HU MT NL AT PL PT RO SI SK FI SE UK IS LI NO TR
8.4 12.9 11.3 2.6 6.7 6.6 : 15.0 11.4 12.6 7.0 7.6 15.3 : 8.6 : 6.1 : 7.9 5.7 7.6 : 5.6 3.1 6.3 4.5 6.6 9.5 : : 8.3 18.4
18.3 22.6 14.9 5.6 11.8 14.2 16.7 28.7 16.0 27.2 20.8 13.6 32.9 10.4 12.6 : 10.0 : 13.9 14.3 13.7 13.5 7.2 6.0 7.5 17.9 11.1 24.7 : : 12.3 22.2
Total 13.3 17.9 13.5 3.9 9.3 9.7 11.9 22.1 13.5 19.6 14.2 10.6 24.6 9.0 10.9 : 8.2 : 10.6 9.1 11.0 11.0 6.4 4.8 6.9 12.0 9.1 17.0 : : 10.5 19.7
Craft workers, machine operators
EU-27 BE BG CZ DK DE EE IE EL ES FR IT CY LV LT LU HU MT NL AT PL PT RO SI SK FI SE UK IS LI NO TR
11.9 6.0 : 3.4 9.1 16.6 : : 7.3 23.3 10.1 3.8 10.3 : : : : : : 20.6 7.2 : : : : 8.2 8.7 10.4 : : : 8.7
3.4 2.1 : : : 3.7 : : : 6.6 3.8 : : : : : : : : : 2.4 : : : : 3.4 : 2.6 : : : :
Total 7.7 4.0 : 2.3 5.7 11.3 : 9.6 5.6 15.3 6.8 3.3 8.1 : 10.6 : 2.5 : 3.4 14.1 4.5 : : : : 5.5 5.0 6.6 : : 4.4 6.4
Source: Eurostat, Labour Force Survey (data extracted July 2008).
WOMEN ARE MORE LIKELY TO BE UNEMPLOYED THAN MEN ________________ WITH THE SAME LEVEL OF QUALIFICATION _________________
The effect of a tertiary education qualification in preventing unemployment applies as much to men as to women. Yet men and women are not equally affected by unemployment.
Women with the same level of qualification remain on average more likely to be unemployed than men, even though this inequality between sexes decreases with higher levels of qualification. Thus in the EU 27, the unemployment rate among women is higher than that of men irrespective of qualification levels. The Central and Eastern European countries show a slightly different pattern as the average unemployment rate for women tends to be significantly higher among the least qualified group (ISCED 0-2) compared with the EU-27 average.
The unemployment rate among people with tertiary education in 2007 was around 3 % for men and almost 4 % for women. Important disparities exist between different countries. In Greece, Spain, Italy and Portugal the unemployment rate among women was much higher than among men, exceeding, in the case of Greece, the 8 % of the total population with that level of qualification. This figure was comparable with the rate registered in Turkey for the same year. In a second group of countries formed by Belgium, Bulgaria, the Czech Republic and Ireland the unemployment rates for men and women with tertiary education were very similar or even equal. Finally, there are four countries, namely Romania, Sweden, United Kingdom and Norway, where the unemployment rate among women in 2007 was lower than that of men.

C O N T E X T
38
Figure A8: Unemployment rates for the 25-64 age group
by level of education and by sex, 2007
Low (ISCED 0-2) Intermediate (ISCED 3-4) High (ISCED 5-6)
Males Females
Source: Eurostat, Labour Force Survey (data extracted July 2008).

CONTEXT
39
Data (Figure A8)
Low (ISCED 0-2)
EU-27 BE BG CZ DK DE EE IE EL ES FR IT CY LV LT LU HU MT NL AT PL PT RO SI SK FI SE UK IS LI NO TR
8.2 9.8 14.1 19.3 3.4 19.2 : 6.4 4.5 6.5 9.8 5.0 3.9 8.4 : 3.8 16.9 5.3 3.3 7.6 15.2 6.5 9.0 6.5 43.1 8.3 6.0 6.7 : : 3.2 7.7
10.6 13.7 20.3 18.9 5.1 16.3 : 5.5 11.9 13.3 10.7 9.1 5.1 : : 4.6 15.1 10.1 4.9 7.2 16.0 9.8 4.3 6.4 40.2 9.7 8.6 5.2 : : 3.3 4.0
Intermediate (ISCED 3-4)
EU-27 BE BG CZ DK DE EE IE EL ES FR IT CY LV LT LU HU MT NL AT PL PT RO SI SK FI SE UK IS LI NO TR
5.4 4.9 4.7 3.1 2.0 8.2 4.7 3.5 4.6 5.0 5.0 3.0 2.5 5.5 4.6 2.3 5.4 : 2.3 2.9 7.8 5.9 5.8 3.0 7.3 5.5 3.9 3.5 : : 1.3 6.4
6.8 7.9 5.4 5.9 3.2 8.2 : 3.6 12.9 9.2 7.1 5.6 4.2 5.3 5.1 3.6 6.4 : 3.2 3.7 9.9 7.8 5.1 6.2 10.3 6.9 4.7 3.8 : : 1.3 13.9
High (ISCED 5-6)
EU-27 BE BG CZ DK DE EE IE EL ES FR IT CY LV LT LU HU MT NL AT PL PT RO SI SK FI SE UK IS LI NO TR
3.2 3.3 2.2 1.5 2.9 3.3 : 2.3 4.1 3.8 4.8 3.1 2.3 : : : 2.2 : 1.7 1.9 3.3 5.1 2.3 2.6 2.5 3.3 3.8 2.3 : : 1.6 4.8
4.0 3.3 2.2 1.5 3.0 4.3 : 2.3 8.2 5.9 4.9 5.2 3.3 3.7 1.8 : 2.9 : 1.8 3.1 4.3 7.6 2.1 3.7 4.3 3.8 3.1 2.0 : : 1.5 8.3
Source: Eurostat, Labour Force Survey (data extracted July 2008).
Additional notes EU-27: is calculated from countries with available data on unemployment. United Kingdom: National Vocational Qualifications (NVQ) level 1 and Foundation General National Vocational Qualifications (GNVQ) are included as ISCED level 0-2 qualifications. Explanatory note
The unemployment rate is calculated by dividing the number of unemployed people by the active population (employed and unemployed).
For those with an intermediate-level qualification, the unemployment of women was higher in all countries with the exception of Germany where an equal proportion of men and women were unemployed and Latvia and Romania where there were more men unemployed than women. Once again, major disparities are observed in Greece and Spain with overall differences above 4 percentage points between the two sexes.
The unemployment rate among people with lower levels of education is, in general, higher in the Central and Eastern European countries with especially high levels in Bulgaria, the Czech Republic, Hungary, Poland or Slovakia. The same trend can be observed in Germany where the unemployment rate was around 19 % for men and 16 % for women. Proportionally more unemployed men than women in that qualification group also existed in several other countries such as Ireland, Hungary, Romania, Slovakia and United Kingdom. In Slovakia, the unemployment rate among men even reached levels of almost 45 %.

C O N T E X T
40
UNEMPLOYMENT RATE AMONG YOUNG PEOPLE AGED 15-24 DECREASED _____ IN THE MAJORITY OF EUROPEAN COUNTRIES BETWEEN 2002 AND 2007 _____
On average, in the European Union 15.5 % of young people between 15 and 24 years old were unemployed
in 2007. The employment rate for that age group fell by almost two points in five years.
The difficulty of securing the labour market integration of young people in 2007 was more pronounced in
Greece, Italy, Poland, Romania and Slovakia where the unemployment rate for 15-24-year-olds was above
20 %. In contrast, Denmark, Lithuania, the Netherlands and Norway had the smallest percentage of
unemployed young people (less than 8.5 %).
In the majority of European countries, the unemployment rate for 15-24-year-olds fell between 2002 and
2007. In Bulgaria, Latvia, Lithuania, Poland, Slovakia and Finland the reduction in the rate of unemployment
among young people was particularly marked with more than 10 points. Three of them (Bulgaria, Latvia and
Lithuania) even had rates below the EU-27 average of 15.5 %.
In contrast, twelve countries experienced an increase in the unemployment rate in the 15-24 year-old age
group during the same period, but two of them (Luxembourg and United Kingdom) still had rates under the
EU-27 average.
Figure A9: Unemployment rates for the 15-24 age group,
2002-2007
2002 2007
EU-27 BE BG CZ DK DE EE IE EL ES FR IT CY LV LT LU HU MT NL AT PL PT RO SI SK FI SE UK IS LI NO TR
17.9 15.7 35.6 15.4 7.1 9.3 17.3 7.8 26.1 21.6 18.9 27.1 7.7 25.6 20.4 7 11.4 15.3 4.6 7.2 41.6 10.4 22.2 14.8 37.7 28.2 12.9 10.9 6.4 : 13.0 :
15.5 18.8 15.1 10.7 7.9 12.0 10.0 8.9 22.9 18.2 18.0 20.3 10.2 10.7 8.2 15.2 18.0 13.3 7.3 8.7 21.7 16.6 20.1 10.1 20.3 16.5 19.3 14.3 : : 7.4 16.8
Source: Eurostat, Labour Force Survey (data extracted July 2008).
Explanatory note
The unemployment rate is calculated by dividing the number of unemployed people by the active population.
The standard definition of the active population is used: at least one hour must have been worked or a job must have been actively sought during the survey reference week (see the Glossary and Statistical Tools section).

41
O R G A N I S AT I O N
SECTION I – STRUCTURES
COMPULSORY SCHOOLING IS BROADLY THE SAME LENGTH IN ALL COUNTRIES _______________ BUT ITS STRUCTURE VARIES CONSIDERABLY ________________
The figure below gives an overview of the educational structures for mainstream schooling from pre-primary level (whether under the responsibility of the Ministry of Education or not) up to tertiary education (except for post-graduate level education and doctoral studies). In an attempt to summarise and facilitate comparison of the different national educational structures, only the paths/programmes of study considered to be the most representative have been taken into account.
In more than half of the countries, at pre-primary level, children are admitted into the school system (establishments under the responsibility of the Ministry of Education) from the age of 3 or 4.
In some countries (French and Flemish Communities of Belgium, France and the United Kingdom (Northern Ireland)) schooling is possible from the age of two or two and a half. In the three Baltic States, as well as in Slovenia, Sweden and Norway, unitary education settings which admit young children between their first birthday and the age of 5/6 are under the responsibility of the Ministry of Education but are not included in the school system.
Before the age of 5 or 6, in Denmark, Germany (in most of the Länder), Austria and Finland, children are admitted solely into educational structures under the responsibility of a ministry other than the Ministry of Education.
Attendance at a pre-primary establishment is optional in most countries, in which parents are free to enrol their child if they wish. Compulsory education usually starts at the age of 5 or 6 and generally corresponds to entry into primary school, except in Ireland, Greece, Cyprus, Latvia, Luxembourg, Hungary and in Poland, where compulsory education starts at pre-primary level. In Ireland and in the Netherlands, where an entirely separate level of pre-primary education does not exist, children from the age of 4 may attend the infant classes of primary schools and the optional year of basisonderwijs in their respective countries. In Luxembourg, attending pre-primary education (Spillschoul) is compulsory for all the children who have reached 4 years of age before the first of September of the reference year. In Hungary, 5 year-old children have to take part in educational activities preparing them for school entry. In three Nordic countries (Denmark (up to 2008), Finland and Sweden), as well as in Bulgaria, Estonia and Lithuania education is compulsory from the age of 7.
In the vast majority of countries, compulsory full-time education lasts for nine or ten years and continues up to at least the age of 15 or 16. However, it lasts for eleven years in Luxembourg, Malta and the United Kingdom (England, Wales and Scotland), twelve years in the Netherlands and in the United Kingdom (Northern Ireland) and thirteen years in Hungary.
School pathways are generally identical for all children up to the end of the lower secondary level, i.e. up to 14 or 15 years of age. The core curriculum continues up to 16 years of age in Malta, Poland and in the United Kingdom. In about ten countries, compulsory general education is provided in single-structure schools without a transition between primary level and lower secondary levels, up to the age of 14 in Turkey, 15 in the Czech Republic, Portugal, Slovenia and Slovakia, and up to 16 in all the Nordic countries and in Estonia.

O R G A N I S A T I O N
42
In some countries, however, parents have to choose (or schools define) a route or a specific type of schooling for pupils at the beginning of lower secondary education. This takes place from the age of 10 in most of the Länder in Germany and in Austria, 11-12 years in the Netherlands, 11 years in Liechtenstein and 12 years in Luxembourg. In the Czech Republic, Latvia, Hungary and in Slovakia, compulsory education is organised in a single structure up to the age of 14 or 15, but from the age of 10 or 11, pupils in these countries can, at certain stages in their school career, enrol in separate establishments offering both lower and upper secondary education.
Figure B1: Description of the structures of the education systems from pre-primary to tertiary education (ISCED 0 to 5), 2006/07
Explanatory note The ages shown here correspond to the 'theoretical' years for entry to schooling and its duration. Neither early or late entry, nor longer periods of schooling due to having to repeat years, or interruptions are taken into account in the examples and explanations. The maximum ages in post-secondary (ISCED 4) and tertiary education (ISCED 5A and 5B) are not given. The information is structured by level of education according to the latest version of the International Standard Classification of Education (ISCED – UOE, 1997 edition). These ISCED levels do not always correspond to the levels of education defined in the different countries (and described in the diagram). In this case, the allocations ISCED 0, 1 and 2 have been introduced into the diagram. These details are especially necessary in the case of countries which organise compulsory schooling in a single structure and do not differentiate between primary (ISCED 1) and lower secondary (ISCED 2) education. Black vertical lines within the levels of education indicate different cycles or degrees for ISCED1 to 3 and the variable duration of qualifying programmes in ISCED 4 and 5. Only the pre-primary establishments 'said to be for ‘educational purposes', i.e. which are obliged to employ staff (responsible for a group of children) qualified in education are shown here, whether they are under the responsibility of the Ministry of Education or not. Nurseries and play centres (whose staff are not obliged to be qualified in education) are not included. Special education, organised in separate structures, is not included in this diagram either. Nor does the figure include advanced research programmes of the doctoral type (ISCED 6). Detailed information on these programmes, as well as on those at ISCED level 5, can be found in the Eurydice publication: Focus on the structure of tertiary education in Europe 2006/2007: National trends in the Bologna Process, Brussels: Eurydice, 2007.
NON UNIVERSITAIRE COURT
SECONDAIRE DE QUALIFICATION TECHNIQUE / ARTISTIQUE
4 1 2 3 5 6 7 8 9 11 12 13 14 15 16 17 18 19 20 21 22 23 24 25 26 27 10
UNIVERSITÉ
NON UNIVERSITAIRE LONG
ENSEIGNEMENTMATERNEL
ENSEIGNEMENT PRIMAIRE SECONDAIRE DE TRANSITION GÉNÉRAL / TECHNIQUE / ARTISTIQUE BE fr
SECONDAIRE PROFESSIONNEL
2e pro- fession- nelle
1e B
HOCHSCHULUNTERRICHT DES 1. ZYKLUS
TECHNISCHER BEFÄHIGUNGSUNTERRICHT
4 1 2 3 5 6 7 8 9 11 12 13 14 15 16 17 18 19 20 21 22 23 24 25 26 27 10
VORSCHULERZIEHUNG PRIMARUNTERRICHT ALLGEMEIN BILDENDER / TECHNISCHER ÜBERGANGSUNTERRICHT
BERUFSBILDENDERUNTERRICHT
ERGÄNZENDER BERUFSBILDENDER SEKUNDARUNTERRICHT
BE de 2. Berufs- bildendes jahr
1.B- Klasse
1. Stufe 2. Stufe 3. Stufe
Source: Eurydice.
Additional notes Belgium: Compulsory full-time education ends at the age of 16 for pupils who have not ended the first stage of secondary education. Belgium (BE de): Only children who are 3 years of age on 31 December of the current school year are admitted to pre-primary education.

S E C T I O N I – S T R U C T U R E S
43
Figure B1: Description of the structures of the education systems from pre-primary to tertiary education (ISCED 0 to 5), 2006/07
TECHNISCH / KUNST SECUNDAIR ONDERWIJS
UNIVERSITEIT
HOGESCHOOL
KLEUTERONDERWIJS LAGER ONDERWIJS ALGEMEENSECUNDAIR ONDERWIJS
SECUNDAIRONDERWIJS
DBSO
BEROEPSSECUNDAIR ONDERWIJS
BE nl41 2 3 5 6 7 8 9 11 12 13 14 15 16 17 18 19 20 21 22 23 24 25 26 2710
VISCHI UTCHILISHTA
KOLEJ
GIMNAZIA
PROFILIRANA GIMNAZIA
NATCHALNO UTCHILISHTEDETSKA GRADINA
PROGIMNAZIALNOUTCHILISHTE
PROFESSIONALNA GIMNAZIA / TECHNIKUM
PROFESSIONALEN KOLEJ
41 2 3 5 6 7 8 9 11 12 13 14 15 16 17 18 19 20 21 22 23 24 25 26 2710
BG
MATEŘSK Á ŠKOLAZÁKLADN Í ŠKOLA
VYSOK Á ŠKOLAGYMNÁZIUMGYMNÁZIUM
STŘEDNÍ ŠKOLA
STŘEDNÍ ŠKOLA
VYŠŠÍ ODBORNÁ ŠKOLA
K O N Z E R V A T O Ř
ZKRÁCENÉ STUD IUM
41 2 3 5 6 7 8 9 11 12 13 14 15 16 17 18 19 20 21 22 23 24 25 26 2710
CZPr vn í s tupeň D ruhý s tupeň
NÁSTAVBOVÉ STUD IUM
410 2 3 5 6 7 8 9 11 12 13 14 15 16 17 18 19 20 21 22 23 24 25 26 2710
LANGE VIDEREGÅENDE UDDANNELSERGYMNASIUM
MELLEMLANGE VIDEREGÅENDE UDDANNELSERHHX
KORTE VIDEREGÅENDE UDDANNELSERHTX
EUD
BØRNEHAVEKLASSE
BØRNEHAVER
FOLKESKOLE / GRUNDSKOLEHFDK
VUGGESTUER
ALDERSINTEGREREDE INSTITUTIONER
-/n/-
>>
Pre-primary - ISCED 0(for which the Ministry of Education is responsible)
Primary - ISCED 1
Single structure(no institutional distinction between ISCED 1 and 2) Post-secondary non-tertiary - ISCED 4
Pre-primary - ISCED 0(for which the Ministry of Education is not responsible)
Tertiary education - ISCED 5A
Part-time or combined schooland workplace courses
Upper secondary general - ISCED 3
Upper secondary vocational - ISCED 3
Lower secondary general -ISCED 2 (including pre-vocational)
Lower secondary vocational - ISCED 2
Tertiary education - ISCED 5B
Compulsory full-time education
Compulsory part-time education
Additional year
Compulsory work experience + its duration
Study abroad Allocation to the ISCED levels:ISCED 0ISCED 1
ISCED 2
Source: Eurydice.
Additional notes Denmark: From 2008/09 compulsory education starts at the age of 6.

O R G A N I S A T I O N
44
Figure B1: Description of the structures of the education systems from pre-primary to tertiary education (ISCED 0 to 5), 2006/07
4 1 2 3 5 6 7 8 9 11 12 13 14 15 16 17 18 19 20 21 22 23 24 25 26 27 10
DE VORKLASSE / SCHULKINDERGARTEN
GRUNDSCHULE ORIENTIE- RUNGSSTUFE
GYMNASIUM
GESAMTSCHULE
REALSCHULE
GYMNASIALE OBERSTUFE
UNIVERSITÄT / KUNSTHOCHSCHULE / MUSIKHOCHSCHULE
BERUFSAKADEMIE
FACHHOCHSCHULE
VERWALTUNGSFACHHOCHSCHULE
F A C H O B E R S C H U L E
B E R U F S F A C H S C H U L E
SCHULEN DES GESUNDHEITSWESENS
ABENDGYMNASIUM / KOLLEGBERUFSSCHULE+BETRIEB
BEAMTENAUS-BILDUNG
BERUFSSCHULE+BETRIEB
FACHSCHULE
H A U P T S C H U L E
SCHULARTEN MIT MEHRERENBILDUNGSGÄNGEN
KINDERGARTEN
4 1 2 3 5 6 7 8 9 11 12 13 14 15 16 17 18 19 20 21 22 23 24 25 26 27 10
EE P Õ H I K O O L
GÜMNAASIUM
KUTSEÕPPEASUTUS
KUTSEÕPPEASUTUS
ÜLIKOOL / KUTSEÕPPEASUTUS / RAKENDUSKÕRGKOOL
ÜLIKOOLLASTESÕIM
LASTEAED ≥ 1
RAKENDUSKÕRGKOOL
PRIMARY SCHOOLS SECONDARY / VOCATIONAL / COMPREHENSIVE SCHOOLS /
TEACHER TRAINING
INSTITUTES OF TECHNOLOGY AND OTHER THIRD-LEVEL COLLEGES
SECOND LEVEL SCHOOLS / INSTITUTES OF TECHNOLOGY
UNIVERSITIES Infant Classes
4 1 2 3 5 6 7 8 9 11 12 13 14 15 16 17 18 19 20 21 22 23 24 25 26 27 10
IE COMMUNITY SCHOOLS AND
COLLEGES
Transition year
EARLY START PROGRAMME
TRAVELLER PRE-SCHOOLS
4 1 2 3 5 6 7 8 9 11 12 13 14 15 16 17 18 19 20 21 22 23 24 25 26 27 10
DIMOTIKO SCHOLEIO GYMNASIO
ESPERINO GYMNASIO
GENIKO LYKEIO
ESPERINO EPAGGELMATIKO LYKEIO
ESPERINO GENIKO LYKEIO
PANEPISTIMIO (A.E.I . )
TECHNOLOGIKO EKPAIDEFTIKO IDRYMA (T.E.I . )
INSTITOUTO EPAGELMATIKIS KATARTISIS ( I .E.K.)
NIPIAGOGEIA
EPAGGELMATIKO LYKEIO (EPAL)
EPAGGELMATIKES SCHOLES (EPAS)
41 2 3 5 6 7 8 9 11 12 13 14 15 16 17 18 19 20 21 22 23 24 25 26 27100
ESENSEÑANZAS UNIVERS ITAR IAS
C ICLOS FORMATIVOS DE GRADO SUPER IOR
GRADO SUPER IOR DE AR TES PLÁSTICAS Y DISEÑO /
ENSEÑANZAS AR T ÍSTICAS SUPER IORESENSEÑANZAS ELEMENTALESDE MÚS ICA Y DANZA
ENSEÑANZAS PROFES IONALES DE MÚS ICA Y DANZA
C ICLOS FORMATIVOS DE GRADO MEDIO
GRADO MEDIO DE AR TES PLÁSTICAS Y DISEÑO /ENSEÑANZAS DEPOR TIVAS DE GRADO SUPER IORENSEÑANZAS DEPOR TIVAS DE GRADO MEDIO
BACHILLERATOEDUCACIÓN SECUNDARIAOBLIGATORIA
EDUCAC IÓN PR IMAR IAEDUCAC IÓN INFANTIL
Source: Eurydice.
Additional notes Germany: In some Länder, Vorklassen admit children of the age of 5. In most other Länder, Vorklassen or Schulkindergärten admit children of compulsory school age but who do not have the maturity required to enter the primary stage. Estonia: Compulsory education lasts until the age of 17 for pupils who have not completed basic education. Ireland: According to ISCED 1997, Early Start Schools are considered to be ISCED level 0; infant classes are at ISCED level 1. Spain: The Enseñanzas artísticas de grado superior form part of a larger category (the Enseñanzas de régimen especial de grado superior).

S E C T I O N I – S T R U C T U R E S
45
Figure B1: Description of the structures of the education systems from pre-primary to tertiary education (ISCED 0 to 5), 2006/07
4 1 2 3 5 6 7 8 9 11 12 13 14 15 16 17 18 19 20 21 22 23 24 25 26 27 10
FR ÉCOLES MATERNELLES / CLASSES ENFANTINES
ÉCOLES ÉLÉMENTAIRES COLLÈGE LYCÉE GÉNÉRAL & TECHNOLOGIQUE
UNIVERSITÉ
ÉCOLES SPÉCIALISÉES
CPGE GRANDES ÉCOLES
STS / IUT
LYCÉE PROFESSIONNEL 41 2 3 5 6 7 8 9 11 12 13 14 15 16 17 18 19 20 21 22 23 24 25 26 2710
IT SCUOLA DELL' INFANZ IA SCUOLA PR IMAR IA SCUOLASECONDAR IADI PR IMO GRADO
LICEI UNIVERS ITÁ / POLITECNIC I / AFAM
LICEO AR TISTICO
ISTRUZ IONE E FORMAZ IONE TECNICA SUPER IOREISTITUTO D 'AR TE / PROFESS IONALE
ISTITUTO TECNICO
FORMAZ IONE PROFESS IONALE DI BASE 41 2 3 5 6 7 8 9 11 12 13 14 15 16 17 18 19 20 21 22 23 24 25 26 2710
CY N IP IAGOGEIO D IMOTIKO SCHOLEIO GYMNASIO
ENIAIO LYKEIO PANEPISTIMIA
TECHN IK I SCHOLI
D IMOSIES SCHOLES TRITOVATHMIAS EKPAIDEFSIS
ESPERINO GYMNASIO
ESPERIN I TECHN IK I SCHOLI 41 2 3 5 6 7 8 9 11 12 13 14 15 16 17 18 19 20 21 22 23 24 25 26 2710
LV AUGSTSKOLA / KOLEDŽA
P IRMSSKOLAS IZGLĪTĪBAS KONSULTATĪVA IS CENTRS /P IRMSSKOLAS IZGLĪTĪBASGRUPAS P IE SKOLĀM
PAMATSKOLAV IDUSSKOLA
ĢIMNĀZ I JA
PROFES IONĀLĀS IZGLĪTĪBAS IESTĀDE
Sākumskola
P IRMSSKOLAS IZGLĪTĪBAS IESTĀDE (BĒRNUDĀRZS )
4 1 2 3 5 6 7 8 9 11 12 13 14 15 16 17 18 19 20 21 22 23 24 25 26 27 10
LOPŠELIS-DARŽELIS
DARŽELISGIMNAZIJA
KOLEGIJA
PRADINĖ MOKYKLA PAGRINDINĖ MOKYKLA VIDURINĖ MOK.
P R O F E S I N Ė M O K Y K L A
UNIVERSITETAS / AKADEMIJA
PRIEŠMOKYKLINIO UGDYMO GRUPĖS
-/n/-
>>
Pre-primary - ISCED 0(for which the Ministry of Education is responsible)
Primary - ISCED 1
Single structure(no institutional distinction between ISCED 1 and 2) Post-secondary non-tertiary - ISCED 4
Pre-primary - ISCED 0(for which the Ministry of Education is not responsible)
Tertiary education - ISCED 5A
Part-time or combined schooland workplace courses
Upper secondary general - ISCED 3
Upper secondary vocational - ISCED 3
Lower secondary general -ISCED 2 (including pre-vocational)
Lower secondary vocational - ISCED 2
Tertiary education - ISCED 5B
Compulsory full-time education
Compulsory part-time education
Additional year
Compulsory work experience + its duration
Study abroad Allocation to the ISCED levels:ISCED 0ISCED 1
ISCED 2
Source: Eurydice.
Additional notes Italy: From 2007/08 compulsory education ends at the age of 16. Cyprus: From 2004/05, a year of pre-primary education (prodimotiki) became compulsory. Latvia: Pupils who are 15 years old and who do not hold a certificate of basic education may follow this type of education via the vocational basic education programme up to the age of 18. Lithuania: The legislation in force stipulates that compulsory school age is 7 years of age (or 6 if the child is sufficiently mature for school).

O R G A N I S A T I O N
46
Figure B1: Description of the structures of the education systems from pre-primary to tertiary education (ISCED 0 to 5), 2006/07
LYCÉE SUPÉRIEUR UNIVERSITAIRE
LYCÉE TECHNIQUE BTS
BREVET DE MAÎTRISERÉGIME PROFESSIONNEL
STAGE PÉDAGOGIQUE
SPILLSCHOUL ÉCOLE PRIMAIRE LYCÉE
RÉGIME TECHNIQUE
RÉGIME DE TECHNICIEN
1 2 3 5 6 7 8 9 11 12 13 14 15 16 17 18 19 20 21 22 23 24 25 26 2710 4
LU
4 1 2 3 5 6 7 8 9 11 12 13 14 15 16 17 18 19 20 21 22 23 24 25 26 27 10
HU ÓVODA
EGYETEM / FŐISKOLA
FELSŐFOKÚ SZAKKÉPZÉS
GIMNÁZIUM
ÁLTALÁNOS ISKOLA
Alsó tagozat Felső tagozat GIMNÁZIUM / SZAKKÖZÉPISKOLA
SZAKKÖZÉPISKOLA
SZAKISKOLA
4 1 2 3 5 6 7 8 9 11 12 13 14 15 16 17 18 19 20 21 22 23 24 25 26 2710
CHILD DAY CARE CENTRES
ARTS, SCIENCE AND TECHNOLOGY COURSES (MCAST)
TOURISM STUDIES COURSES (ITS)
JUNIOR LYCEUMS / SECONDARY SCHOOLS / BOYS' GIRLS' SCHOOLS UNIVERSITY
JUNIOR COLLEGE / HIGHER SEC. SCHOOL
MT
1
KINDER- GARTEN CENTRES
PRIMARY SCHOOLS
BASISONDERWIJS
HAVO HAVO
KORT HBO
HBO
WO
VMBO
PRAKTIJKONDERWIJS
4 1 2 3 5 6 7 8 9 11 12 13 14 15 16 17 18 19 20 21 22 23 24 25 26 27 10
NL
VMBO
MBO VAKOPLEIDING
MBO MIDDENKADEROPLEIDING
MBO BASISBEROEPSOPLEIDING
SPECIALISTENOPLEIDING
MBO ASSISTENTOPLEIDING
VWO VWO
Source: Eurydice.
Additional notes Luxembourg: Some communes offer pre-primary education from 3 years of age. From 2009/10, municipalities will be obliged to provide early education. Malta: The Malta College of Arts, Science and Technology (MCAST), which admitted its first pupils in 2001/02, is gradually assuming responsibility for all professional training. Netherlands: There is no pre-primary education in the strict sense. The figure shows the situation of the first years of basisonderwijs (primary school). Compulsory schooling is completed at the end of the school year during which the pupils who have followed the 12 years of compulsory full-time schooling reach the age of 16. From 2007/08, all pupils will have to attend school until they have obtained the certificate of basic education. This new measure replaces compulsory part-time training up to 18 years of age.

S E C T I O N I – S T R U C T U R E S
47
Figure B1: Description of the structures of the education systems from pre-primary to tertiary education (ISCED 0 to 5), 2006/07
41 2 3 5 6 7 8 9 11 12 13 14 15 16 17 18 19 20 21 22 23 24 25 26 2710
KINDERGARTENAT ALLGEMEINBILDENDE HÖHERE SCHULE
OBERSTUFENREALGYMNASIUM
UNIVERSITÄTEN
FACHHOCHSCHULEN
VOLKSSCHULE
HAUPTSCHULE
BERUFSBILDENDE HÖHERE SCHULE
BERUFSBILDENDE MITTLERE SCHULE
SCHULEN FÜR GESUNDHEITS- UND KRANKENPFLEGE
AUSBILDUNGEN IM GESUNDHEITSBEREICH
POLYTECHNISCHE SCHULE BERUFSSCHULE UND LEHRE
AKADEMIEN
KOLLEGS
4 1 2 3 5 6 7 8 9 11 12 13 14 15 16 17 18 19 20 21 22 23 24 25 26 27 10
PL PRZEDSZKOLE GIMNAZJUM JEDNOLITE STUDIA MAGISTERSKIE
STUDIA 2 STOPNIASTUDIA 1 STOPNIA
KN / NKJO / KPSS
SZKOŁY POLICEALNE
LICEUM OGÓLNOKSZTAŁCĄCE
LICEUM PROFILOWANE
ZASADNICZA SZKOŁA ZAWODOWA UZUPEŁNIAJĄCE LICEUM OGÓLNOKSZTAŁCĄCE
TECHNIKUM UZUPEŁNIAJĄCE
TECHNIKUM
SZKOŁA PODSTAWOWA
ODDZIAŁY PRZEDSZKOLNE
ENSINO BÁSICO ENSINO BÁSICO ENSINO UNIVERSITÁRIOCURSOS CIENTÍFICO-HUMANÍSTICOS
CURSOS TECNOLÓGICOS /CURSOS ARTÍSTICOS ESPECIALZADOS /
CURSOS PROFISSIONAISCURSOS DE ESPECIALIZAÇÃO TECNOLÓGICA
ENSINO POLITÉCNICOCT
4 1 2 3 5 6 7 8 9 11 12 13 14 15 16 17 18 19 20 21 22 23 24 25 26 27 28 10
PT 1.° ciclo 2.° ciclo 3.° ciclo
JARDIM DE INFÂNCIA
4 1 2 3 5 6 7 8 9 11 12 13 14 15 16 17 18 19 20 21 22 23 24 25 26 27 10
RO GRADINIŢA ŞCOALA PRIMARĂ GIMNAZIU
AN DE COMPLETARE
ŞCOALADE ARTE ŞI MESERI
LICEU
ŞCOALA POSTLICEALĂ
UNIVERSITATE
-/n/-
>>
Pre-primary - ISCED 0(for which the Ministry of Education is responsible)
Primary - ISCED 1
Single structure(no institutional distinction between ISCED 1 and 2) Post-secondary non-tertiary - ISCED 4
Pre-primary - ISCED 0(for which the Ministry of Education is not responsible)
Tertiary education - ISCED 5A
Part-time or combined schooland workplace courses
Upper secondary general - ISCED 3
Upper secondary vocational - ISCED 3
Lower secondary general -ISCED 2 (including pre-vocational)
Lower secondary vocational - ISCED 2
Tertiary education - ISCED 5B
Compulsory full-time education
Compulsory part-time education
Additional year
Compulsory work experience + its duration
Study abroad Allocation to the ISCED levels:ISCED 0ISCED 1
ISCED 2
Source: Eurydice.
Additional notes Poland: According to the legislation adopted in 2009, compulsory pre-primary education will start at the age of 5 as of 2011, and compulsory primary education at the age of 6 as of 2012. In compliance with the new legislation, before 2012 parents will have the right to send their 6-year old children to school if they wish so, and schools will be obliged to enrol these children. Portugal: Children of 15 years of age who have not successfully completed the 9 years of compulsory education can take part in the cursos de educação e formação which offer a second chance of education.

O R G A N I S A T I O N
48
Figure B1: Description of the structures of the education systems from pre-primary to tertiary education (ISCED 0 to 5), 2006/07
SI VRTCI OSNOVNE ŠOLE
GIMNAZIJE
STROKOVNI PROGRAMI
VIŠJE STROKOVNE ŠOLE
UNIVERZITETNI PROGRAMI / STROKOVNI PROGRAMI
TEHNIŠKI /STROKOVNI PROGRAMI
NIŽJEPOKLICNI PROGRAMI
POKLICNI IN POKLICNO-TEHNIŠKI PROGRAMI
POKLICNI TEČAJ / MATURITETNI TEČAJ
16 17 18 19 20 21 22 23 24 25 26 27 4 3 2 1 5 6 7 8 9 11 12 13 14 15 10
4 1 2 3 5 6 7 8 9 11 12 13 14 15 16 17 18 19 20 21 22 23 24 25 26 27 10
SK MATERSKÁ ŠKOLA ZÁKLADNÁ ŠKOLA
UNIVERZITA / VYSOKÁ ŠKOLA
STREDNÁ ODBORNÁ ŠKOLA / KONZERVATÓRIUM GYMNÁZIUM
S T R E D N Á O D B O R N Á Š K O L A / K O N Z E R VAT Ó R I U M
STREDNÉ ODBORNÉ UČILIŠTE
UČILIŠTE
1. stupeň 2. stupeň
4 1 0 2 3 5 6 7 8 9 11 12 13 14 15 16 17 18 19 20 21 22 23 24 25 10
PÄIVÄKOTI – DAGHEM
≥ 3
ESIOPETUS – FÖRSKOLEUNDERVISNING
PERUSOPETUS – GRUNDLÄGGANDE UTBILDNING
LUKIO – GYMNASIUM YLIOPISTO / KORKEAKOULU – UNIVERSITET / HÖGSKOLA
AMMATTIKORKEAKOULU – YRKESHÖGSKOLA
AMMATILLINEN KOULUTUS – YRKESUTBILDNING
FI
FÖR-SKOLE-KLASS
GRUNDSKOLA
41 2 3 5 6 7 8 9 11 12 13 14 15 16 17 18 19 20 21 22 23 24 25 26 2710
SEUNIVERSITET / HÖGSKOLA
KOMMUNAL VUXENUTBILDNING / FOLKHÖGSKOLA
KY / YRKESHÖGSKOLA
FÖRSKOLAGYMNASIESKOLA
Source: Eurydice.
Additional notes Slovenia: The possibility of following part-time education exists at all levels of education. ISCED level 4 programmes are offered by the upper secondary education establishments and are classed at this level solely by the international statistics. Finland: ISCED level 5A polytechnic Master's degrees correspond to 60-90 ECTS (approximately one to a year and a half of studies), but the programmes usually last 2 to 3 years because they are organised in such a way that the students can follow them while having a job. Sweden: The training courses offered by the KY (komvux and folkhögskola) include some courses which are not ISCED level 4 courses. The flexibility relates both to the age of the students and to the time devoted to teaching.

S E C T I O N I – S T R U C T U R E S
49
Figure B1: Description of the structures of the education systems from pre-primary to tertiary education (ISCED 0 to 5), 2006/07
4 1 2 3 5 6 7 8 9 11 12 13 14 15 16 17 18 19 20 21 22 23 24 25 26 27 10
UK HIGHER / FURTHER EDUCATION INSTITUTIONS
HIGHER / FURTHER EDUCATION INSTITUTIONS
FURTHER / HIGHER EDUCATION INSTITUTIONS
SECONDARY SCHOOLS PRIMARY SCHOOLS PRIMARY SCHOOLS / NURSERY SCHOOLS /
VOLUNTARY/ PRIVATE SETTINGS
Foundation stage Key stage 1 Key stage 2 Key stage 3 Key stage 4
FURTHER EDUCATION INSTITUTIONS
SECONDARY SCHOOLS / FURTHER EDUCATION INSTITUTIONS
ENG
Access courses
41 2 3 5 6 7 8 9 11 12 13 14 15 16 17 18 19 20 21 22 23 24 25 26 2710
UK HIGHER / FURTHER EDUCATION INSTITUTIONS
HIGHER / FURTHER EDUCATION INSTITUTIONS
FURTHER / HIGHER EDUCATION INSTITUTIONS
SECONDARY SCHOOLSPRIMARY SCHOOLSPRIMARY SCHOOLS /NURSERY SCHOOLS /
VOLUNTARY/PRIVATE SETTINGS
Key stage 1 Key stage 2 Key stage 3 Key stage 4
FURTHER EDUCATIONINSTITUTIONS
SECONDARYSCHOOLS /FURTHEREDUCATIONINSTITUTIONS
WLS
Accesscourses
PRIMARY SCHOOLS
42 3 5 6 7 8 9 11 12 13 14 15 16 17 18 19 20 21 22 23 24 25 26 2710
UKNIR HIGHER / FURTHER EDUCATION INSTITUTIONS
HIGHER / FURTHER EDUCATION INSTITUTIONS
SECONDARY SCHOOLSKey stage 3 Key stage 4Key stage 1 Key stage 2
PRIMARY SCHOOLS /NURSERY SCHOOLS /
VOLUNTARY/PRIVATE SETTINGS
Pre-school
FURTHER EDUCATIONINSTITUTIONS
SECONDARYSCHOOLS /FURTHEREDUCATIONINSTITUTIONS
FURTHER EDUCATION INSTITUTIONS
Accesscourses
41 2 3 5 6 7 8 9 11 12 13 14 15 16 17 18 19 20 21 22 23 24 25 26 2710
UKSCT
SECONDARY SCHOOLSPRIMARY SCHOOLSPRE-SCHOOL
EDUCATION CENTRES
FURTHER EDUCATION INSTITUTIONS
HIGHER / FURTHER EDUCATION INSTITUTIONS
HIGHER / FURTHER EDUCATION INSTITUTIONS
FURTHER / HIGHEREDUCATIONINSTITUTIONS
Accesscourses
-/n/-
>>
Pre-primary - ISCED 0(for which the Ministry of Education is responsible)
Primary - ISCED 1
Single structure(no institutional distinction between ISCED 1 and 2) Post-secondary non-tertiary - ISCED 4
Pre-primary - ISCED 0(for which the Ministry of Education is not responsible)
Tertiary education - ISCED 5A
Part-time or combined schooland workplace courses
Upper secondary general - ISCED 3
Upper secondary vocational - ISCED 3
Lower secondary general -ISCED 2 (including pre-vocational)
Lower secondary vocational - ISCED 2
Tertiary education - ISCED 5B
Compulsory full-time education
Compulsory part-time education
Additional year
Compulsory work experience + its duration
Study abroad Allocation to the ISCED levels:ISCED 0ISCED 1
ISCED 2
Source: Eurydice.
Additional notes
United Kingdom (ENG/WLS/NIR): Voluntary and private pre-primary settings, e.g. day nurseries, pre-school groups and playgroups, are considered here to be education-oriented if they provide an educational programme which follows government guidelines and receive funding. In England, the Foundation Stage was replaced in 2008 by the Early Years Foundation Stage. This applies from birth to 5, although it is included as ISCED 0 from age 3 only. In Wales, implementation of the foundation phase for children aged 3 to 7 began in 2008. Northern Ireland began the gradual introduction of an extended foundation stage in 2007. In England and Wales, children attain compulsory school age at different points in the school year. Schools provide a reception class (ISCED 0) for children who reach compulsory school age before the start of key stage 1 (ISCED 1). Reception places may also be available for 4-year-olds for all or part of the year. Secondary schools, often working in partnership with further education colleges and training organisations, now also offer some vocational (applied) and work-related courses to 14- to 16-year-olds. Legislation has been passed to raise the compulsory education age in England from 16 to 18. Access courses prepare mature students (19+ but typically older) without formal qualifications for tertiary education.

O R G A N I S A T I O N
50
Figure B1: Description of the structures of the education systems from pre-primary to tertiary education (ISCED 0 to 5), 2006/07
41 2 3 5 6 7 8 9 11 12 13 14 15 16 17 18 19 20 21 22 23 24 25 26 2710
ISMENNTASKÓLI / FJÖLBRAUTASKÓLI
FJÖLBRAUTASKÓLI / IÐNSKÓLI /SÉRSKÓLI FJÖLBRAUTASKÓLI / IÐNSKÓLI / MENNTASKÓLI
HÁSKÓLILEIKSKÓLI GRUNNSKÓLI
41 2 3 5 6 7 8 9 11 12 13 14 15 16 17 18 19 20 21 22 23 24 25 26 2710
LI PRIMARSCHULEKINDERGARTEN
GYMNASIUM UNTERSTUFE
BERUFSMITTELSCHULE
GYMNASIUM OBERSTUFE
OBERSCHULE
REALSCHULE HOCHSCHULE LIECHTENSTEIN (HL)>>>>>>>>>>
>>>>>>>>>>>>>>>>>>>>
GRUNNSKOLE
UNIVERSITET / HØGSKOLE
FAGSKOLER
VIDEREGÅENDE SKOLE
LÆRLINGORDNING
4 1 2 3 5 6 7 8 9 11 12 13 14 15 16 17 18 19 20 21 22 23 24 25 26 27 10
NO
UNIVERSITET / HØGSKOLE
UNIVERSITET / HØGSKOLE
ÅPNE BARNEHAGER / VANLIGE BARNEHAGER / FAMILIEBARNEHAGER
0
Barnetrinnet Ungdomstrinnet
≥ 2
Pre-reform
Post-reform
4 1 2 3 5 6 7 8 9 11 12 13 14 15 16 17 18 19 20 21 22 23 24 25
14 15 16 17 18 19 20 21 22 23 24 25
26 2710
TR GENEL LİSELER ÜNİVERSİTELER
MESLEK YÜKSEK OKULLARI
MESLEK YÜKSEK OKULLARI
SOSYAL BİLİMLER LİSESİ
FEN LİSELERİ
MESLEK LİSELERİ / TEKNİK LİSELER / ANADOLU MESLEK LİSELERİ
ANA SINIFLARI
İLKÖĞRETİM OKULLARI ANA OKULLARI / UYGULAMALI ANA OKULLARI
SOSYAL BİLİMLER LİSESİ
ANADOLU LİSELERİ / ANADOLU GÜZEL SANATLAR LİSESİ
FEN LİSELERİ
MESLEK LİSELERİ
TEKNİK LİSELER
ANADOLU MESLEK LİSELERİ
ANADOLU TEKNİK LİSELERİ
ANADOLU TEKNİK LİSELERİ
GENEL LİSELER / ANADOLU LİSELERİ / ANADOLU GÜZEL SANATLAR LİSESİ / SPOR LİSELERİ
ÜNİVERSİTELER
Pre-reform until 2008/09
Post-reform since 2005/06
-/n/-
>>
Pre-primary - ISCED 0(for which the Ministry of Education is responsible)
Primary - ISCED 1
Single structure(no institutional distinction between ISCED 1 and 2) Post-secondary non-tertiary - ISCED 4
Pre-primary - ISCED 0(for which the Ministry of Education is not responsible)
Tertiary education - ISCED 5A
Part-time or combined schooland workplace courses
Upper secondary general - ISCED 3
Upper secondary vocational - ISCED 3
Lower secondary general -ISCED 2 (including pre-vocational)
Lower secondary vocational - ISCED 2
Tertiary education - ISCED 5B
Compulsory full-time education
Compulsory part-time education
Additional year
Compulsory work experience + its duration
Study abroad Allocation to the ISCED levels:ISCED 0ISCED 1
ISCED 2
Source: Eurydice.

S E C T I O N I – S T R U C T U R E S
51
Additional notes (B1 – continued) Norway: The new system of degrees was launched during the academic year 2002/03. In order to simplify the transition from the old system to the new, a transition period was agreed which gave rise to the two systems co-existing. The general rule is that candidates who meet the criteria for degrees in the new degree system are given these degrees. However, the higher university degrees of the old system could be awarded up to the academic year 2006/07, while the degrees of the old system and at doctorate level were awarded up to the academic year 2007/08. Turkey: there is no ISCED level 2. The single structure (for pupils of 6 to 14 years of age) is considered overall to equate to ISCED level 1.
The end of compulsory full-time education often coincides with the transition between lower and upper secondary education or with the end of the single structure. However, in some countries (Belgium, Bulgaria, France, Ireland, the Netherlands, Austria, Slovakia, the United Kingdom (England, Wales and Northern Ireland) and Liechtenstein (for the Gymnasium)), the transition between lower and upper secondary education takes place one or two years before the end of full-time compulsory schooling. In Hungary, compulsory schooling covers the whole of the upper secondary level. After 15 or 16 years of age, young people are obliged to undergo at least part-time training for two or three years in Belgium, Germany and in Poland. In the Netherlands, the obligation to undergo part-time training that lasts for one year existed up to 2007/08. In these countries, compulsory schooling is followed in upper secondary education or finishes at the end of this level of education.
In upper secondary education, different educational options are established provided in all countries. It is possible to distinguish between two main categories: the general education option which prepares the pupils for tertiary education and the vocational option, which prepares pupils both for working life and for further studies.
In several countries these different options are organised into separate programmes and the students have to opt for one or the other. In other countries, the general education and vocational programmes are offered in the same structure and sometimes in the same establishment. In Ireland, in addition to the general option, programmes containing elements of both general and vocational education are offered. In Sweden, in the United Kingdom (for further education institutions) and in Norway, vocational and general training may be offered within the same establishments and students may follow a general or vocational programme and even combine the two types of education.
Several countries offer post-secondary education which is not tertiary education level. Students who follow this type of education have generally finished upper secondary education without a formal qualification at this level being required for entry. The training offered in post-secondary education generally lasts between 1 and 2 years and is often offered on a part-time basis. Some programmes give access to the employment market, others make it possible to continue studies in tertiary education.
The diagram shows the theoretical age of entry into tertiary education and the minimum normal duration of the programmes offered. This information is given as an indication. In fact, depending on the country, the age of entry into tertiary education is theoretically 18 or 19 years of age, but it can vary. At this level of education, all countries offer programmes with a largely academic orientation (ISCED 5A) awarding students sufficient qualifications to enter professions which require high-level skills or advanced research programmes of the doctoral type (ISCED 6) which are not represented here. With the exception of Estonia, Greece, Italy, Portugal, Romania, Finland and Liechtenstein, tertiary education in Europe also includes other programmes (ISCED 5B) with a more practical, technical or even vocational orientation which last for a shorter time than the programmes with an academic orientation.

O R G A N I S A T I O N
52
In line with the reforms started as part of the Bologna Process since the beginning of the 2000s, study programmes have been converted, in most countries, into ECTS credits. The minimum duration of the programmes with an academic orientation leading to a first degree (of the Bachelor type) is generally three years (or 180 ECTS credits); that leading to higher degrees (of the Master’s type) vary from on average between 1 and 2 years (from 60 to 120 ECTS credits).
Among the recent changes seen at this level of education, the case of Luxembourg can be highlighted since it has opened a university where the programmes on offer are organised according to the model proposed in the Bologna Process since 2005/06. In Romania, ISCED level 5B programmes are no longer being offered from 2006/07. In Estonia, Finland and Norway, some paths of tertiary education also have the peculiarity of only offering access to a second cycle of studies after professional experience of a defined duration, immediately after the first cycle of studies in the area concerned has been successfully completed.
In addition to the various reforms connected with adapting tertiary education structures to the ministerial recommendations issued during biannual conferences which led up to the Bologna Process, other types of reform have been undertaken in several countries in recent years.
These reforms generally relate to extending compulsory education and/or the re-structuring of school phases (including (pre)vocational education).
Full-time compulsory education has therefore been extended by one year in Cyprus and in Poland since 2004/05 and in Denmark since 2008.
Re-structuring of school phases has affected different levels of education in different countries. In Lithuania, the pre-primary level within the Lopšelis-Darželis was extended by one year in 2006/07. In Turkey, reforms affecting mainly the nature and duration of upper secondary education have gradually been implemented since 2005/06. The old and new systems of education are required to co-exist until 2008/09.
In some countries, the need to address existing problems such as, improving staying-on rates, has led to measures reforming some parts of the educational system. In Italy and the Netherlands, for example, all pupils up to the age of 18 will have to continue in the school system until they obtain a certificate of basic education. This measure, in effect from the school year 2007/08, also replaces part-time compulsory education.

S E C T I O N I – S T R U C T U R E S
53
EDUCATION MINISTRIES ARE MAINLY RESPONSIBLE __________ FOR PRE-PRIMARY EDUCATIONAL EDUCATION SETTINGS ___________
There is a wide range of settings that the youngest children in Europe may attend before entering in primary school. The age of admission varies from one country to the next, but, in general, education-oriented institutions enrol children from the age of 3 onwards (Figure B1).
Figure B2: Education authorities responsible for pre-primary education-oriented institutions (ISCED 0), 2006/07
Source: Eurydice.
Additional notes Netherlands: There is no pre-primary education in the strict sense. The Figure shows the situation in the first years of basisonderwijs (primary school). Finland: Pre-primary education for 6 year-olds is a shared responsibility between the Ministry of Education and other institutions. Explanatory note Only so-called ‘education-oriented’ pre-primary institutions or settings, in which staff (responsible for a group of children) have to hold qualifications in education, are shown here, irrespective of whether those institutions or settings come under the ministry of education. Day care centres, day nurseries and playgroups (whose staff do not necessarily hold qualifications in education) are not included.
In the majority of European countries, the education ministry is responsible for education-oriented pre-primary settings (ISCED 0). In Denmark, Germany (most of the Länder) Austria and Finland, however, other authorities than the education ministry are responsible for pre-primary education. In few German Länder, Greece, Portugal, the United Kingdom (Scotland) and Turkey, the education ministry as well as other ministries may be responsible for pre-primary education depending on the type of institution.
Educational provision for which the education ministry is responsible
Educational provision which comes under the responsibility of ministries other than the education ministry
Coexistence of several forms of educational provision for which different ministries are responsible up to primary education

O R G A N I S A T I O N
54
In pre-primary institutions that are the responsibility of the education ministry, staff responsible for a group of children always hold tertiary- level qualifications in education (Figure D18). In Finland, Iceland and Norway, all types of pre-primary establishment catering for children from a very early age must employ staff with a university qualification in education.
PRIVATE EDUCATIONAL INSTITUTIONS ENROL _______________ A MINORITY OF STUDENTS AT ISCED 1, 2 AND 3 _______________
In almost all European countries, the great majority of students attend public institutions, except in Belgium and the Netherlands, where there are proportionally more students in the government-dependent private sector. Attendance at government-dependent private institutions is also fairly widespread in Spain, France, Malta (between 21 and 26 %) and the United Kingdom (14.7 %).
Figure B3: Distribution of pupils/students (ISCED 1, 2 and 3) according to the type of institution they attend (public or private), 2006
Public Government-dependent private Independent private Total private
EU-27 BE BG CZ DK DE EE IE EL ES FR IT CY LV LT LU HU MT NL AT PL PT RO SI SK FI SE UK IS LI NO TR
86.5 43.9 98.4 94.4 87.5 93.2 97.6 99.4 93.7 70.3 78.8 94.5 89.9 98.7 99.5 87.2 89.4 68.7 23.6 91.9 95.5 87.1 99.4 98.5 92.2 93.3 92.5 79.8 96.0 95.7 95.9 98.1
: 56.1 - 5.6 12.5 : - - - 25.1 20.7 0.3 - - - 5.4 10.6 22.4 76.4 8.1 0.7 4.3 - 1.5 7.8 6.7 7.5 14.7 3.9 0.4 : -
: - 1.6 - 0.1 : 2.4 0.6 6.3 4.6 0.5 5.2 10.1 1.3 0.5 7.4 - 8.9 0.0 - 3.8 8.7 0.6 0.1 0.0 - 0.0 5.5 0.1 3.9 : 1.9
13.5 56.1 1.6 5.6 12.5 6.8 2.4 0.6 6.3 29.7 21.2 5.5 10.1 1.3 0.5 12.8 10.6 31.3 76.4 8.1 4.5 12.9 0.6 1.5 7.8 6.7 7.5 20.2 4.0 4.3 4.1 1.9
Source: Eurostat, UOE (data extracted July 2008).

S E C T I O N I – S T R U C T U R E S
55
Additional notes (Figure B3) EU-27: average is calculated from countries with available data. Belgium: Data exclude independent private institutions. Netherlands: Data is from 2004. United Kingdom: Although public sector schools cater for the great majority of children up to the age of 16, the data also reflect adult ISCED3 provision which is mainly provided in further education colleges, i.e. government-dependent private institutions. The data is also affected by a change in the reporting methodology since the last edition of Key Data on Education in Europe 2005, designed to align more closely with international guidelines on reporting. Explanatory note Pupils or students of all ages are allocated into different categories depending on whether they attend public-sector or private institutions. An institution is classified as public if it is controlled directly by the public authorities. If not, it is private. Private institutions are either government-dependent or independent, depending on their core funding. They are said to be government-dependent if they receive more than 50 % of their financing from the public authorities. Independent private institutions receive less than 50 % of their finance from the public sector.
The countries where almost all students (98 % or more) attend public institutions are Bulgaria, Ireland, Latvia, Lithuania, Romania, Slovenia and Turkey.
In the 27 EU countries, independent private education accounts on average for only 2.5 % of enrolments, in comparison to some 86.5 % in the case of public institutions. Cyprus has the highest percentage of students in independent private institutions (10.1 %), followed by Malta (8.9 %), Portugal (8.7 %) and Luxembourg (7.4 %).
IN THE PUBLIC SECTOR, PUPILS ARE MAINLY ALLOCATED TO A SPECIFIC SCHOOL, ______________ BUT PARENTS MAY REQUEST AN ALTERNATIVE _______________
Parents may normally choose if they send their children to public or private schools. If they choose the public sector, then pupils can be allocated to specific schools in different ways. Nevertheless, parents may sometimes freely choose their preferred school. However, when a school reaches its maximum enrolment capacity, public authorities often channel pupils towards other schools using different criteria.
In the majority of European countries, parents as well as the authorities may be in a position to influence decisions concerning the allocation of pupils to public-sector schools, although to a varying extent. In one third of all countries, pupils are allocated to a school mainly within their district, but parents may choose an alternative one. Where this rule applies, the schools must not refuse admittance or give them priority over children residing in that district. In another third, parents choose a school but the public authorities may intervene if the school’s enrolment capacity is overstretched, applying different admissions criteria for limiting the number of pupils (drawing of lots, parents working area, brothers or sisters attending the school, etc.).
Only in Belgium, Ireland, Luxembourg (at lower secondary level) and the Netherlands can parents freely choose a school for their child with no interference whatever by the public authorities. In such cases, for example in Ireland, if the enrolment of a child is refused by a specific school his parents can appeal against that decision to the Ministry for Education and Science. This statutory appeal is heard by an independent committee and its recommendation is binding on the school.
Conversely, the authorities allocate pupils to schools with no scope for parental intervention (except in the event of special dispensation), in Greece, France, Cyprus, Luxembourg (primary level), Malta and Portugal, Liechtenstein and Turkey. In doing so, the public authorities may take into account, for example, whether pupils (or their brothers or sisters) have previously attended the school, or the place of residence or work of their families, etc.

O R G A N I S A T I O N
56
Figure B4: Degree of parental freedom in choice of school
for compulsory education in the public sector, 2006/07
Source: Eurydice.
Additional notes Bulgaria: In line with the regulations of the National Programme for Optimization of School Network, since 2006, the intervention of municipalities is mandatory, despite the expressed parents' wish, in case schools are to be closed down (small-size classes or mixed classes) in order to direct the pupils from the schools concerned towards other schools. In this respect, the choice of parents is limited as the enrolment to the school of their choice is subject to certain conditions. Germany: In the case of secondary schools, the Hauptschulen and Berufsschulen have catchment areas. Estonia: Each child is ensured study opportunity in a local school but parents may freely choose an alternative school if it has vacant places. Ireland: Public authorities do not regulate pupil numbers in a school, but official pupil/teacher ratios and maximum class-size requirements may impact on a school’s capacity to accept pupils. The onus is on parents to seek alternative placement. France: From the academic year 2007/08, parents can apply for dispensation that is satisfied if there are vacant places in the requested establishment. Lithuania: Parents may choose an alternative school but, if it has no vacant places, their children have to attend the school in which they were originally enrolled or the nearest school in their municipality. Hungary: In the public sector pupils are allocated to schools of a specific catchment area, but parents may request an alternative school. Alternative schools may refuse admission after reaching their maximum enrolment capacity. Netherlands: Municipal authorities may make a division in school districts and can thus allocate a pupil to a school, but the pupil's parents can then still choose to send their child to another school. Poland and Finland: Pupils may be enrolled in the alternative school only if there are places available. Sweden and Norway: The degree of parental choice varies from one municipality to the next. United Kingdom (SCT): If parents express a preference for another particular school (known as a placing request) the education authority has a duty to grant it wherever possible. Turkey: Parents may ask for enrolment in a school which is outside the planned school area, if the requested school is not full. In case applications exceed the capacity, pupils are selected by drawing of lots.
Pupils are allocated a school (application for special dispensation from the decision is required)
Pupils are allocated a school but parents may request an alternative one
Parents choose a school but the public authorities may intervene if its enrolment capacity is overstretched
Parents are free to choose a school
Lower secondary

S E C T I O N I – S T R U C T U R E S
57
THE MAJORITY OF PUPILS ATTEND PRIMARY SCHOOLS __________ WITH AVERAGE ENROLMENTS OF LESS THAN 400 PUPILS ___________
According to the PIRLS 2006 survey, most pupils in their fourth year of primary education attend schools that cater for between 200 and 400 pupils. In nine countries, attendance at large schools is prevalent, with the majority of pupils attending schools with between 400 and 600 pupils. This is the case for Bulgaria, Denmark, Spain, Latvia, Hungary, Romania, Slovenia, Slovakia and Iceland. At the other end of the spectrum, in France and Austria, the majority of pupils attend a school with an enrolment size below 250 pupils. These differences are partly attributable to the structure of provision (Figure B1) and whether pupils at different levels are taught in separate schools. Only in Lithuania and Italy is the mean size of the schools greater than 600 pupils. In France and Austria, primary schools are always separate from secondary schools. In Bulgaria, Denmark, Latvia, Hungary, Romania, Slovenia and Iceland, most schools offer both primary and secondary education, which accounts for their very considerable size. Figure B5: Distribution of pupils in the fourth year of primary education (in terms of the median and percentiles)
by size of school attended, public and private sectors combined, 2006
Percentile 25 Percentile 50 Percentile 75
Country that did not contribute to data collection
Source: IEA, PIRLS 2006 database.

O R G A N I S A T I O N
58
Data (Figure B5)
(P) EU- 27
BE fr
BE nl BG DK DE ES FR IT LV LT HU NL AT PL RO SI SK SE UK-
ENG UK- SCT IS NO
10 120 154 156 95 169 112 183 85 169 103 131 142 127 51 102 138 201 103 105 160 114 159 86
25 180 225 230 169 330 173 267 130 408 195 237 221 200 113 163 226 320 242 171 211 185 285 188
50 299 278 301 420 488 259 424 177 624 485 639 410 245 177 340 489 426 426 292 301 267 418 303
75 472 459 413 742 630 372 649 241 848 797 1005 604 367 240 553 767 610 627 428 416 352 562 382
90 756 576 490 1016 753 465 1099 362 993 1002 1272 827 455 302 758 1085 766 794 622 464 395 609 525
Ø 375 382 349 479 478 284 525 198 622 535 745 447 283 178 385 559 467 441 325 316 266 414 297
(P) Percentile; Ø Mean size.
Source: IEA, PIRLS 2006 database.
Additional note EU-27: average is calculated from countries with available data. Explanatory note School heads were asked to indicate the number of pupils attending their school. The sampling procedure involved selecting schools and then pupils of a class in the fourth year of primary education. It sought to offer each pupil the same probability of being selected irrespective of the size of the school he or she attended. For this purpose, schools were weighted in such a way that the probability that they would be selected was inversely proportional to their size. This explains why the Figure does not directly show the distribution of schools by size, but the distribution of pupils by size of the school they attended. The sampling procedure adopted by the survey leads to an overrepresentation of large schools. Values derived from simply sampling schools themselves would have been slightly lower. For further information on the PIRLS survey and the definition of percentile, see the Glossary and Statistical Tools section. In the interests of clarity, the figure only shows values corresponding to the percentiles 25, 50 and 75 in the distribution. Values for the percentiles 10 and 90 are shown in the table under the Figure. For the countries that did not contribute to the data collection additional information about the specific topic can be found in Eurybase.
Differences within countries in the size of schools attended by pupils in the fourth year of primary education appear to be substantial in Bulgaria, Latvia, Lithuania and Romania. Some pupils are at schools with a total enrolment of less than 200 and others at schools with over 800 pupils. However, in France, the Netherlands, Austria, the United Kingdom (Scotland) and Norway, and to a lesser extent, Belgium (Flemish Community) and Germany, there is less variation in school size. Average sizes are also lower in these countries.

S E C T I O N I – S T R U C T U R E S
59
BEFORE- OR AFTER-SCHOOL CHILDCARE IS AVAILABLE ____________ FOR THE MAJORITY OF PUPILS IN PRIMARY SCHOOLS ____________
Childcare service in schools before and/or after lesson times is widely available in European countries, but the proportion of pupils (in the fourth year of primary education) attending a school that offers a service of this kind varies from one country to the next. According to the PIRLS 2006 survey, in several countries including Poland, Slovenia and Norway, the great majority of fourth-year pupils (over 90 %) attend a school where they may be looked after prior to or following their lessons. In Belgium (French Community), Hungary and Slovakia all primary schools offer before or after lesson childcare services on school premises.
In comparison with the school year 2000/01 (see Key Data on Education in Europe 2005), the availability of childcare services has increased substantially in some countries in 2005/06, with around 30 % more pupils in the fourth year of primary education attending a school with childcare services before or after lessons in the United Kingdom (England) and Norway.
The lowest percentages of pupils attending schools with childcare services on their premises before or after lesson times appear in Denmark, Lithuania, the Netherlands, Romania and the United Kingdom (Scotland). Figure B6: Percentage of pupils in the fourth year of primary education who attend a school offering a childcare
service on school premises before or after lesson times, public and private sectors combined, 2006
Countries that did not contribute to data collection EU- 27
BE fr
BE nl BG DK DE ES FR IT LV LT HU NL AT PL RO SI SK SE UK-
ENG UK-SCT IS NO
73.0 100 87.8 60.5 42.0 81.5 58.7 88.4 63.5 70.9 45.8 99.3 27.8 54.3 96.2 44.6 97.3 100 84.5 60.9 48.1 73.7 95.9
Source: IEA. PIRLS 2006 database. Additional note EU-27: is calculated from countries with available data. Explanatory note School heads were asked to indicate whether before or after-school childcare service was offered to pupils at the school. The sampling procedure involved selecting schools and then pupils of a class in the fourth year of primary education. It sought to offer each pupil the same probability of being selected irrespective of the size of the school he or she attended. For this purpose, schools were weighted in such a way that the probability that they would be selected was inversely proportional to their size. This explains why the Figure does not directly show the proportions of schools associated with one or other of the factors at issue, but the proportions of pupils attending a school of the particular kind concerned. For further information on the PIRLS survey, see the Glossary and Statistical Tools section. For the countries that did not contribute to the data collection additional information about the specific topic can be found in Eurybase.

O R G A N I S A T I O N
60
THE END OF LOWER SECONDARY EDUCATION OFTEN COINCIDES ___________ WITH THE END OF FULL-TIME COMPULSORY EDUCATION ___________
In this context, three different organisational models can be distinguished, depending on whether countries have a single structure, compulsory integrated secondary education corresponding to a ‘common core’ or distinct types of education (Figure B1). In the Czech Republic, Lithuania, Hungary and Slovakia several combinations of two out of the three models exist alongside each other.
Figure B7: Structure and duration of lower secondary education compared to the age of pupils at the end of full-time compulsory education, 2006/07
Years Years
Single structure
Common-core curriculum/common general education Differentiated branches or types of education
Additional year possible End of compulsory full-time education Source: Eurydice. Additional notes Belgium: The end of full-time compulsory education is extended to the age of 16 for pupils who have not completed the first stage of lower secondary education. In the French and German-speaking Communities, admission to this level of education can take place at a differentiated stage (1re B and 2e année professionnelle). Germany: Full-time compulsory education lasts between 9 and 10 years, depending on the Länder concerned. Estonia: Compulsory education continues until pupils have completed basic education (at the age of 16) or reached the age of 17. Latvia: Pupils without a certificate of basic education by the age of 15 may take the appropriate courses up to the age of 18 within the curriculum for basic vocational education. Lithuania: Pupils wishing to gain a vocational qualification may attend a vocational school from the age of 14. Hungary: The end of lower secondary education is extended to the age of 16 for pupils who have repeated a year. Netherlands: Depending on the school attended, lower secondary education ends at the age of 15 (VWO, HAVO) or 16 (MAVO, VBO and VMBO). Compulsory education ends at the end of the school year when pupils turn the age of 18 or when they have achieved a basic qualification (VWO, HAVO or MBO-2 certificate), which can be the case at the age of 17. Sweden: If a pupil in the Compulsory Comprehensive School has not satisfactorily completed the last class when compulsory schooling ceases, but is deemed to have the ability to complete the education, the pupil shall be given an opportunity to do so for a maximum of two years after termination of compulsory schooling. Turkey: Lower secondary education is not applicable for Turkish education system. Turkey has a single structured compulsory primary education including lower secondary education with no formal separation between them. Explanatory note In countries where secondary education is provided within a single continuous structure, only the number of years corresponding to ISCED 2 are coloured in the Figure. ISCED 3 programmes that are part of the compulsory education are not included in the figure.

S E C T I O N I – S T R U C T U R E S
61
In all countries where the single structure is the only form of educational arrangement (Bulgaria, Denmark, Estonia, Latvia, Portugal, Slovenia, Finland, Sweden, Iceland, Norway and Turkey), the end of (single-structure) education coincides with the end of compulsory education except in Bulgaria where compulsory education ends one year later.
In almost half of all European countries, all pupils follow the same general curriculum (common core) during lower secondary education. In eight of these countries or regions, the end of lower secondary education coincides with the end of full-time compulsory education.
In Belgium, Bulgaria, Ireland, France, Hungary, the Netherlands, Austria, Slovakia and the United Kingdom (England, Wales and Northern Ireland), the end of full-time compulsory education does not correspond to the end of lower secondary education. Instead, the one or more final years of compulsory education are part of upper secondary education.
In the French and German-speaking Communities of Belgium, Germany, Lithuania, Luxembourg, the Netherlands, Austria and Liechtenstein, pupils may select or be streamed into different types of provision or school from the beginning or before the end of lower secondary education. Even though pupils in Germany attend different schools, they follow entirely compatible curricula for the first two years so that selection of an appropriate study branch can be deferred. In the Netherlands, pupils follow a common core curriculum usually for the first two years at VMBO and three years at HAVO and VWO. While its level varies depending on the type of school concerned, it specifies minimum skills that should be acquired by all pupils. The three types of lower secondary school in Liechtenstein offer the same basic common curriculum, which is supplemented by certain kinds of provision in the Realschule or Gymnasium.
LIMITATION OR SELECTION PROCEDURES FOR ENTRY TO __________ TERTIARY EDUCATION EXIST IN ALMOST ALL COUNTRIES ___________
Everywhere in Europe, the minimum requirement for securing access to tertiary education is an upper secondary education certificate or its equivalent. In most countries, other admission procedures may be added to this, such as passing an entrance examination, submitting a personal record of achievement or attending an interview.
Such procedures are used either to limit admissions – mainly because the number of candidates exceeds the intake capacity of institutions – or to ensure that candidates have qualifications geared to the educational provision on offer (for example, in artistic, technical or medical fields of study). Labour market conditions may also underlie attempts to control the number of places available if too many or too few young people are graduating in particular subjects relative to jobs available in the corresponding professional sectors.
There are three main levels in the regulation of access to tertiary education: central/regional numerus clausus, institutional regulation, free access. Additionally in some countries different combinations between these three categories can be used. The entry criteria may be applied to all fields of study or programmes, or just some of them.
A selection or limitation procedure may exist at national or regional level. In such cases, the government limits the places available and exercises direct control over the selection procedure. A numerus clausus of this kind may apply to some or all courses offered by tertiary education institutions. In seven countries (Greece, Spain, Cyprus, Luxembourg, Portugal, Liechtenstein and Turkey), the selection procedure for all fields of university study is administered at national or regional level. In Spain, the national university entrance examination (Prueba de Aptitud para el Acceso a la Universidad) is, in principle, not compulsory for

O R G A N I S A T I O N
62
certain university courses. However, since the capacity of the institutions is often lower than the demand for places, they give priority to those students who have passed the entrance examination.
In Cyprus, a selection or limitation procedure exists at national level. The number of places made available for student candidates are the result of negotiation between the public institutions of tertiary education (i.e. the University of Cyprus) and the relevant government authorities (i.e. the Ministry of Education and Culture, the Ministry of Finance and the Planning Bureau). Access to state institutions of tertiary education is granted through the competitive entrance examinations, namely the Pancyprian Examinations, organised by the Ministry of Education and Culture.
Institutions themselves may decide to limit places or select students in accordance with clearly defined requirements or ability. Here, institutions are free to apply selection procedures with due regard for their capacity, or for centrally determined criteria intended to limit the number of places. Limits may be set for some or all courses. Moreover, institutions may decide to select students on the basis of ability regardless of the number of places available. Indeed this approach is the most widespread. It is encountered in about one-third of all countries.
A different combination between both procedures is also used in some countries. Slovenia and Sweden adopt parallel procedures at national and institutional level for all fields of study, while Finland does so in most fields.
In Ireland, the institution determines the number of places and the admission requirements, and application for almost all full-time undergraduate courses is made through a Central Applications Office. In Italy, a numerus clausus exists at national level for health-related courses. There are also procedures established at each individual university level, but just for a limited number of cases and upon authorisation of the Ministry of University and Research.
In the Czech Republic, Estonia, Latvia, Lithuania and Romania, each institution determines its own selection procedures and the number of places available. However, the government fixes the number of places for which it will provide funding. In Slovenia, institutions organise their own admissions procedures, and also fix the number of places available but in this case subject to government approval. In Bulgaria, each institution organises the selection of students, with due regard for national standards limiting the number of enrolments.
In the Netherlands, for some courses in higher professional education the student has to command specific skills, knowledge or qualities (aanvullende eisen, i.e. additional requirements), which are formulated by the institutions. For some courses in university education there are more enrolments than available places. Places are therefore assigned by lot. A numerus clausus/numerus fixus is introduced if the number of enrolling students is higher than the nationally available number of places (opleidingsfixus, course clausus) or the available number of places at institutional level (instellingsfixus, institutional clausus).
In Hungary the government fixes the number of places for which it provides funding. Furthermore, the Educational Authority exercises certain control over the number of non state financed places. The precondition for admission to a tertiary education institution is the successful passing of the national upper secondary school-leaving examination (érettségi vizsga), which also serves as an entrance exam for undergraduate (Bachelor) courses. The exam can be taken at two levels (standard and advanced).
Although, in the United Kingdom, the overall number of students is centrally determined, universities and other tertiary education institutions decide freely which students to admit and on what criteria. Applicants for full-time undergraduate programmes (ISCED 5A first cycle and 5B) apply online for up to six institutions/courses (or, from 2008 entry onwards, up to five) via UCAS (the Universities and Colleges

S E C T I O N I – S T R U C T U R E S
63
Admissions Service), which administers the process on behalf of the institutions. As applications are, at present, generally made before the results of final examinations are available, institutions decide whether to offer a place to a particular applicant largely on the basis of predicted grades. The offer specifies particular grades – which vary according to the particular institution and course – which the applicant must achieve.
Figure B8: Levels of authority involved in limiting places or selecting students for the first cycle of tertiary education (ISCED 5A and 5B), 2006/07
Source: Eurydice.
Additional notes Belgium (BE de): The only programmes offered are in teacher education and nursing (both at ISCED level 5B). Cyprus: Information for the panepistimio (university). Liechtenstein: The only programmes offered are in business studies and architecture. Explanatory note For further information on the structure of tertiary education, by country, see the Eurydice publication Focus on the Structure of Higher Education in Europe – 2006/07: National Trends in the Bologna Process.
In Norway, following registration by the Samordna opptak (the universities and colleges admission service), the tertiary education institution corresponding to an applicant's first choice (out of 15) handles the application on behalf of all institutions for which he or she has expressed a preference. If admitted, applicants receive only one offer of admission – for the institution and discipline highest on their list of preferences – but with due regard for the competition and the admissions capacity of the institutions concerned. Applications are handled in a similar way in Sweden.
In the majority of countries, the approaches adopted for all fields of study are virtually the same. However, in some countries a complex approach for regulating access to tertiary education exists depending on the field of study, the type of institution (for more details about the specific arrangements about the entry criteria by field of study please see the Report Key Data on Higher Education in Europe 2007).
Limitation of places/selection of students at national/regional level for all or almost all fields of study
Limitation of places/selection of students at institutional level for all or almost all fields of study
Several different procedures dependent on the field of study and/or institution concerned
Free access to all/almost all fields of study

O R G A N I S A T I O N
64
Unrestricted or open access to tertiary education exists if the certificate awarded on satisfactory completion of upper secondary education, or its equivalent, is all that is required for admission to an institution. This means that institutions may accept all applicants. Such free access to all or most fields of study is offered in just a few countries, namely Belgium, Malta, the Netherlands and Iceland. In Belgium, there is a very strong tradition of free access. Students have to take an entrance examination only for certain courses in artistic fields in the French and Flemish Communities, medicine and dentistry in the Flemish Community. In the Netherlands, all branches of tertiary education have open access in principle. However, the number of admissions can be limited at national level regarding the labour market. Such a decision can also be taken by the institution when the number of applicants exceeds the places available. For some courses, the minister can impose a requirement that candidates must have studied one or two specific subjects during secondary education.

65
O R G A N I S AT I O N
SECTION II – OBJECTIVES AND EVALUATION
OVER HALF OF ALL EUROPEAN COUNTRIES IDENTIFY SKILLS THAT CHILDREN _______ SHOULD POSSESS ON COMPLETION OF PRE-PRIMARY EDUCATION _______
In the majority of European countries, pre-primary education-oriented institutions, for which either the ministry of education or other authorities are responsible, cater for children from the ages of 3 or 4 in (Figure B1). While it is not generally compulsory for children to participate in educational provision at this level, in all countries official documents relating to such education specify either general aims or more detailed objectives, or both. In the case of the former, the terms employed are somewhat similar everywhere and include ‘development’, ‘autonomy’, ‘responsibility’, ‘well-being’, ‘self-confidence’, ‘citizenship’, ‘preparation for life at school’, ‘the pursuit of learning’, etc.
The importance of collaborating with families is also often emphasised. Here too, the same terms often recur, such as ‘communication’, ‘information’, ‘comprehension’, ‘collaboration’, ‘dialogue’, ‘support’, ‘mutual assistance’, ‘participation’, ‘involvement of parents in educational strategy and processes’, ‘continuity’, ‘consistency’, etc.
A very large number of programmes state precisely what subjects should be taught or what activities should be carried out, while also specifying desirable educational approaches and methods of assessment. Furthermore, skills that should have been acquired by the end of pre-primary education or before embarking on compulsory education are clearly stated in two thirds of all European countries, irrespective of whether the ministry of education or another body is responsible for the institutions concerned.
Figure B9: Areas covered by official guidelines for education-oriented pre-primary institutions, 2006/07
Aims
Subjects/activities
Educational approach
Assessment
Skills to be acquired
Pre-primary education for which the Ministry of Education: is responsible is not responsible
Source: Eurydice. Additional notes Belgium (BE fr): There are no specified skills that children should possess on completion of pre-primary education. However, skills that should be acquired during pre-primary education and the first two years of primary education are identified. Denmark: Since August 2007, all municipalities have offered all three-year-olds a linguistic assessment. This is considered to be a tool to support and develop the pedagogical work with children’s linguistic development.

O R G A N I S A T I O N
66
Additional notes (Figure B9 – continued) Ireland: The official guidelines shown here apply to Early Start units (children aged 3-4), and to infant classes (those aged 4-6) in the primary school system. Malta: The National Minimum Curriculum is currently being reviewed. The review started in January 2008. Austria: The Ministry of Education developed a federal curriculum for language development along with an observational scale of language mastering for 5 to 6 year-olds. Both instruments are used in kindergartens since September 2008. Finland: National guidelines shown here apply to pre-primary education for 6 year-olds. Norway: The early childhood sector was transferred to the Ministry of Education in 2006 and a new 'Framework Plan for the Content and Tasks of Kindergartens' entered into force in the same year. There are no skills to be acquired by the children, but demands on the staff. Explanatory note Only so-called ‘education-oriented’ pre-primary institutions which are obliged to employ staff with qualifications in education are shown here. Day nurseries, playgroups and day care centres (in which the staff are not required to hold a qualification in education) are not shown. The ‘assessment’ category relates to the ongoing evaluation of children’s progress based primarily on observation without necessarily involving the submission of a written document and/or formal assessment of children. The ‘educational approach’ category covers not just aspects of teaching, but also recommendations regarding organisation and appropriate attitudes when leading children’s activities.
THE EVALUATION OF SCHOOLS PROVIDING COMPULSORY EDUCATION _________________________ IS VERY WIDESPREAD __________________________
Evaluation of the quality of education may focus on different administrative levels. Besides global evaluation of the education system (Figure B13), it may involve teachers, schools or local authorities, depending on the particular country.
In a very large number of countries, schools are evaluated and this may or may not be supplemented by the appraisal of individual teachers. Schools are evaluated externally, generally by an inspectorate, and internally by school staff and sometimes other members of the school community. Internal evaluation is mandatory or strongly recommended everywhere. Around half of the countries concerned have drawn up lists of national criteria for external evaluation (Figure B11).
In the Czech Republic, Estonia, Lithuania and Poland, schools are also evaluated by the corresponding educational provider, as they are in the case of the United Kingdom (except Northern Ireland), where the local authorities perform this task. In Lithuania and the United Kingdom, local authorities are themselves evaluated by the central government. In Hungary, responsibility for school external evaluation mainly lies with local education providers, in a framework established by the national education authorities (Figure B11). In Italy, school evaluation is essentially internal.
In countries where school evaluation is carried out in addition to individual teacher evaluation, the school head is responsible for individual teacher evaluation in nearly all cases. In France (ISCED 2) and Cyprus, teachers are also evaluated regularly by the inspectorate. In Liechtenstein, the inspectorate alone evaluates them.
In seven countries where schools are evaluated, teachers are not evaluated individually as a matter of course. However, in Belgium (Flemish Community), Estonia, Spain, Italy, Lithuania and Slovenia, they may be evaluated in specific circumstances, such as when they are applying for promotion or at the end of their first year in service.
In two groups of countries, schools providing compulsory education are not the focus of the evaluation system.

SECTION I I – OBJECTIVES AND EVALUATION
67
In Greece, France (primary education) and Luxembourg (primary education), external evaluation by the inspectorate or school advisers is concerned mainly with teachers. While external evaluation of schools exists in all these countries, it is concerned with matters relatively limited in scope. The internal evaluation of schools is not very widespread or virtually non-existent.
In the Nordic countries except Iceland, the evaluation system is centred on local authorities who are responsible for evaluating their own educational provision and are evaluated in turn by the central education authorities or a national education agency. In these countries, the municipalities are authorised to delegate their responsibility to schools. Teachers are not evaluated individually. Internal evaluation (self-evaluation) occurs everywhere to a varying extent but is not always mandatory. However, Sweden has a different approach to others in this group of countries, as schools are also systematically evaluated by central authorities in Sweden.
The situation has changed in several countries where, in 2002/03, schools were not central to the system of evaluation. In Belgium (French Community as of 2006/07 and German-speaking Community as of 2008/09), Luxembourg (secondary education), Sweden and Norway, the external evaluation of schools (and internal evaluation in the case of Luxembourg) is assuming growing importance (See Key Data on Education in Europe 2005 and Evaluation of Schools Providing Compulsory Education in Europe, Eurydice, 2004).
Figure B10: Elements of the education system subject to evaluation, compulsory general education, 2006/07
Source: Eurydice.
Primary education
School evaluation and individual teacher evaluation (and also local authorities in some countries)
School evaluation
Mainly individual teacher evaluation
Mainly local authorities
Data not available

O R G A N I S A T I O N
68
Additional notes (Figure B10) Belgium (BE fr): A decree from March 2007 extended the scope of the school activities to be evaluated. Belgium (BE de): External evaluation of schools, foreseen by the decree of 31 August 1998, was introduced in a pilot phase in primary education in 2007/08, and in one secondary school in 2008/09. Other secondary schools will be evaluated in 2009/10. The 1998 decree also envisages compulsory internal evaluation. Denmark: Since 2000/01, EVA has been responsible for evaluating all Ministry of Education schools. For this purpose, it evaluates samples of schools, and individual judgements may be made about the schools selected. Estonia: Since September 2006, external evaluation organised centrally takes different samples of schools each year. The focus of evaluations depends on annual priorities. Internal evaluation remains obligatory. Italy: a 2007 law foresees the introduction of external evaluation of schools, to be carried out by the National Institute for the Evaluation of the Education System. Malta: As of 2006/07, external evaluation of schools has been introduced. It is carried out by the Quality Assurance Department. Slovenia: Periodical observation of teachers in classes is one of the legal duties of the head teacher, although in 2006/07 there was not yet a formal system for regular teacher evaluation. However, from 2009 school heads are obliged to produce a yearly evaluation report for every single teacher. Finland: Education providers (mostly municipalities) are responsible for evaluating the effectiveness of their provision, and must participate in national evaluations. Sweden: The National Agency for Education (NAE), which was primarily responsible for monitoring compliance with regulations during the 1990s, has reinforced its school evaluation activities since 2003/04. In 2008, school evaluation was moved from NAE to a new authority, the National Schools Inspectorate. Norway: The external evaluation of schools by municipalities became mandatory with effect from 2004/05.
Explanatory note The evaluation of schools and of teachers considered here is carried out by external and/or internal evaluators depending on the country concerned. School evaluation focuses on activities carried out by school staff without seeking to assign individual responsibility to one or more staff members of the school concerned. Evaluation of this kind seeks to monitor or improve the performance and results of schools and findings are presented in an overall report containing no individual appraisals. If an appraisal of the school head is part of an evaluation covering all school activities (including those for which school heads are not responsible themselves) and findings are used with a view to improving the quality of the school concerned, this is regarded as an evaluation of the school. On the other hand, an evaluation by the school board/council of limited and specific aspects of the work of the head, such as the management of human or financial resources, is not regarded as an evaluation of the school. External evaluation of schools is conducted by evaluators who report to a local, regional or central education authority and who are not staff members at the school concerned. Such an evaluation covers a broad range of school activities, including teaching and learning and/or all aspects of the management of the school. Evaluation which is conducted by specialist evaluators and concerned with specific tasks (related to accounting records, health, safety, archives, etc.) is not regarded as external evaluation of the school. Internal evaluation of school, also known as school self-evaluation, is carried out by members of the school community, meaning individuals or groups of people who are directly involved in school activities (such as the school head, teaching and administrative staff and pupils) or who have a direct stake in them (such as parents or local community representatives). Individual teacher evaluation involves forming a judgement about a teacher’s work in order to guide them and help them as individuals to improve. The teacher subject to evaluation receives personal verbal or written feedback. This evaluation may occur during the process of school evaluation (in which case it generally results in verbal feedback), or be carried out independently (possibly leading to a formal appraisal of the teacher evaluated in this way).

SECTION I I – OBJECTIVES AND EVALUATION
69
ALMOST HALF OF EUROPEAN COUNTRIES USE _______ CENTRALLY STANDARDISED CRITERIA IN EXTERNAL EVALUATION _______
In 2006/07, 13 European countries, and several Autonomous Communities in Spain, had lists of standard criteria for the external evaluation of schools carried out by evaluators directly accountable to the central level (or highest level for education). This process of standardisation, which for the most part got underway in the 1990s, continued in the millennium decade in some countries (Evaluation of Schools providing Compulsory Education in Europe, Eurydice, 2004). Thus, in Ireland and Sweden, lists of standard criteria have been in use since 2004/05. In Luxembourg, Malta and Slovenia such lists are currently being developed.
Figure B11: Use of standard criteria for external evaluation of schools providing compulsory general education, 2006/07
Source: Eurydice. Additional notes Belgium (BE de) and Italy: See the note in Figure B10. Czech Republic, Lithuania, Slovakia and United Kingdom (ENG/WLS, SCT): The references to external evaluation apply to evaluation conducted at central level. Denmark: This applies only in the case of evaluation by the municipalities. Estonia: Since September 2006, there is no more a standard list of criteria for school external evaluation, which is carried out according to the priorities and topics approved by the minister for one school year. Ireland: A set of criteria for external evaluation was developed in 2003/04, and its use is recommended for internal evaluation. Spain: The evaluation of schools is a competence of the Autonomous Communities and there is no standard list of criteria at national level. Standard lists of criteria for external evaluation exist in some Autonomous Communities and they are often used for internal evaluation as well.
Primary education
Standard list of criteria for external evaluation
Recommended for use in internal evaluation
With no recommendations for use in internal evaluation
No standard list of criteria for external evaluation
Local autonomy
No external evaluation of schools
Data not available

O R G A N I S A T I O N
70
Additional notes (Figure B11 – continued) Latvia: Schools are recommended to base their internal evaluation on the criteria for the new approach to external evaluation of schools introduced in 2005/06. This evaluation is undertaken by the State Agency for Quality Assessment in General Education. Lithuania: With effect from 2004/05, schools had to use common internal evaluation criteria. The same criteria have been applied to the new approach to external evaluation of schools introduced in September 2007 and carried out under the supervision of the national agency for school evaluation. Luxembourg: For the external evaluation of secondary school, a list of standard criteria is being drawn up and will be applied in 2010/11. Hungary: There is no standard list of criteria for school external evaluation. However, there is a standardised procedure to follow in case a defined minimum threshold is not achieved in the national assessments of pupils. Malta: A list of standard criteria is being drawn up for external and internal evaluation of schools. Poland: As of 2007, each regional education authority has to prepare a list of standard criteria for external evaluation of schools carried out by the regional inspectorate (kuratorium). Romania: The Figure relates to evaluation criteria produced by the inspectorate and the evaluation criteria drawn up by the Romanian Agency for Quality Assurance in Pre-university Education. Slovenia: Changes of the Organisation and Financing of Education Act adopted in 2008 foresee the development of a list of national criteria for external evaluation of schools by 2011. Finland: See the note in Figure B10. Iceland: A list of standard criteria has been drawn up for evaluating internal evaluation methods (meta-evaluation) but not for the evaluation of schools. Norway: The external evaluation of schools by municipalities is mandatory with effect from 2004/05.
Explanatory notes For the definitions of external and internal evaluation of schools, see the explanatory note of Figure B10. The evaluation criteria consists of two elements, namely the parameter (or measurable aspect of a task that is evaluated), and the required standard (benchmark, norm, regulation or standard of proficiency) against which the parameter is evaluated. They provide the (quantitative and/or qualitative) basis on which a judgement is formed. Standard lists of criteria lay down the content of the external evaluation of schools, and are drawn up at the central (or top-level) authority for education, either by inspectoral management staff or by ministerial or administrative departments responsible for education. Where lists of external evaluation criteria are also used for internal evaluation, this is generally on the basis of a recommendation issued by the central (or top-level) authorities for education.
In general, where central-level evaluators do not possess predetermined lists of criteria, this is because they evaluate only specific matters such as compliance with regulations or the school development plan. In contrast, when a country broadens the range of externally evaluated school activities, it tends to produce lists of standardised criteria. This is especially apparent in Ireland, Luxembourg and Sweden (evaluation conducted by the National Agency for Education and taken over by the National Schools Inspectorate from 2008).
Evaluators who are not directly accountable to the central or top level are not obliged to use lists of criteria established in advance at central level. In general, they refer to the content of national legislation or the educational aims of their local authority in order to determine their criteria.
In some countries, lists of criteria are subject to frequent revision. In the Czech Republic, they are revised annually. In Latvia, lists of criteria used were related to different kinds of regulation and varied according to the focus of evaluation. They were replaced in 2004/05 by a single more detailed list of criteria. In Portugal, the approach used by the inspectorate to evaluate schools was revised in 2006 and subsequently a new list of criteria has been drawn up. In the United Kingdom (Scotland), a revised version of the evaluation criteria established by the inspectorate was published in 2007, in the context of the new approach to inspection introduced in 2008.
Besides standardising external evaluation criteria on the basis of national lists, internal evaluation criteria are also undergoing standardisation to some extent. Ireland, Latvia, Slovakia, Romania and the United Kingdom

SECTION I I – OBJECTIVES AND EVALUATION
71
recommend that these lists should be used for the internal evaluation of schools. In Lithuania, a recently introduced approach to external evaluation uses criteria that are already standardised for internal evaluation. The use of external evaluation criteria during internal evaluation improves the consistency between these two forms of evaluation.
OVER ONE-THIRD OF EU COUNTRIES ROUTINELY PUBLISH _____________ RESULTS OF EXTERNAL EVALUATION OF SCHOOLS _____________
Almost all countries undertake some form of external evaluation of schools (Figure B10). The routine publication of their findings, as recorded in evaluation reports, is a fairly recent practice in Europe. In general, it dates from the end of the 1990s, although it was already established in the United Kingdom (England) in the 1980s.
In the Flemish Community of Belgium (as of 2007/08), the Czech Republic, Ireland, Lithuania (as of 2007/08), the Netherlands, Portugal, Romania, Sweden, the United Kingdom and Iceland, findings from the external evaluation of schools carried out by evaluators directly accountable to the central authorities (in most cases inspectors) are published as a matter of course on the website of the inspectorate or ministry of education. In Hungary, Sweden, Iceland and Norway, the results of evaluation conducted at local level are (also) published on a regular basis. In Poland, the decision is taken at regional level and publication sometimes occurs.
The United Kingdom also attaches special importance to ensuring that this information reaches parents. Inspection reports are sent to all parents and anyone else who formally requests them.
Figure B12: Publication of findings from the external evaluation of schools, compulsory general education, 2006/07
Source: Eurydice.
Primary education
Routine publication of findings for individual schools
No routine publication of findings for individual schools
Local autonomy
No external evaluation of schools
Data not available

O R G A N I S A T I O N
72
Additional notes (Figure B12) Belgium (BE fr): No publication of the results of the external evaluation of schools. Belgium (BE de): It is not envisaged that the results of the external evaluations of schools which were introduced in a pilot phase from 2007/08 (see the note on figure B10) will be published. Belgium (BE nl): Since the end of 2007, results of school evaluations have been published on the inspectorate website. Czech Republic, Estonia, Slovakia and United Kingdom (ENG/WLS, SCT): The Figure relates solely to external evaluation carried out at central level. There are no central regulations on publication of the findings of evaluations carried out by the local authorities. The situation may vary. Ireland: Since 2006, reports of evaluation of schools by the inspectorate are published on the Department of Education and Science website. Italy and Finland: See the note in Figure B10. Latvia: With the school year 2009/10 the institution responsible for quality assessment in general education will publish routinely the results of external evaluation for individual schools. Lithuania: As of 2007/08, individual reports of school external evaluation carried out by the National Agency for School Evaluation are published on the Education Management Information System. Hungary: As of 2006/07, findings of school external evaluation conducted by the local education provider have to be made public by the school concerned. Malta: Some parts of the external evaluation report must be presented by schools at the request of parents. Netherlands: Since January 2008, inspections focus mostly on schools that have a poor performance and are specifically adapted to the circumstances of the individual school. Therefore, standardised information regarding all schools is not provided by the evaluation reports published on the Inspectorate's website. Romania: The Romanian Agency for Quality Assurance in pre-university education publishes on its website individual schools' reports resulting from the new approach to external evaluation of schools introduced in 2006/07. Slovakia: The results are not published but may be consulted on request. Iceland: The map relates solely to the external evaluation of schools. Findings from the external appraisal of internal evaluation methods are not published.
Explanatory note For the definition of external evaluation of schools: see the explanatory note of Figure B10. Publication of findings from the external evaluation of individual schools is defined as the publication of some or all of the outcomes of the evaluation; comparisons with other schools may also emerge. A report which aggregates the results of individual school evaluations and provides global information is not considered to fall within this definition. Results may be published in different forms (e.g. written reports distributed to parents of pupils at a school, as well as to other persons on request, and/or reports placed on the Internet). Routine publication of the results of the external evaluation of schools means publication takes place as a matter of course following each evaluation and is provided for in official regulations. Publication is not routine if it occurs only under certain circumstances, or on an ad hoc basis or, yet again, if the results concerned may only be consulted on request.
A VARIETY OF INFORMATION SOURCES ARE USED ___________________ IN MONITORING EDUCATION SYSTEMS ___________________
National monitoring of educations systems implies a process of collecting and analysing information in order to check its performance in relation to goals and standards, as well as allowing any necessary changes to be made to the system. Different reference criteria are used in different countries and may relate for instance to the results of school self-evaluation, external examinations, other national assessments (Figure B14), specially prepared performance indicators, the definition of competence thresholds or final requirements, international evaluations (including PIRLS, TIMSS, PISA, etc.), or reliance on experts or a special authority (for example, a council set up to monitor a reform).
A majority of countries take action of this kind, whatever its precise form, and many of them have established special bodies to carry out this task. Two major tools for monitoring the development of education systems are analysed here: pupils’ results in external tests and examinations, and the findings from school evaluations.

SECTION I I – OBJECTIVES AND EVALUATION
73
In over half of the countries, the results of external examinations designed for certified assessment (high-stakes tests for pupils' career because they mark the satisfactory completion of a given stage of education) are used to carry out an overall investigation into the state of the education system at a particular time and they sometimes result in comparisons between – and the classification of – schools. In general, such examinations are held at the end of either compulsory education or upper secondary education. Organisation methods for certified assessment in secondary education as well as the years and courses concerned vary from one country to the next (Figures E22 and E23).
Estonia, Ireland, Italy, Malta, the Netherlands, Poland, Portugal, Slovenia (until 2006/07), the United Kingdom and Norway use both external examinations for certified assessment at the end of compulsory or lower secondary education and those held at the end of upper secondary education. Denmark and, until 2008/09, Iceland, use only the external examinations at the end of compulsory education, whereas Greece, France, Cyprus, Lithuania, Hungary and Slovenia (from 2007/08) only use the results of external examinations for certified assessment held on completion of upper secondary education.
Over one third of countries use both the results of low stakes tests (where the results do not have important direct consequences for pupils' career; these include tests to support the learning of individual pupils and tests designed with the specific purpose of monitoring the education system) – (Figure B14) – and high stakes tests. While six countries use only the results of tests leading to certificates, 8 countries only use low stakes tests. The latter also applies to Iceland since 2008/09.
Findings from the external evaluation of schools are very frequently used to monitor the education system as a whole in countries where such evaluations occur on a regular basis (Figure B10). The only exceptions are Luxembourg, Hungary, Malta, Austria, Romania and Liechtenstein. In all the other countries, the findings of school evaluation are used by central education authorities to monitor the system. Evaluators directly accountable to the central level generally prepare an overall report which is used by the education authorities. In Cyprus and Iceland, a national report is not produced but the education authorities draw their conclusions by looking at evaluation reports for individual schools. Where evaluators are directly accountable to the local or regional levels, the arrangements enabling the central education authorities to use the evaluation findings vary from one country to the next. In Poland, regional education authorities prepare reports concerning the state of education in their respective regions. In Denmark and Sweden, the findings of evaluations carried out by the municipalities are processed by a specialist national agency in the field of education and are then subsequently used by the central education authorities.
In order to monitor their education systems at central or national level, Estonia, Ireland, France, Lithuania, Luxembourg, Poland, Portugal, Slovenia, the United Kingdom and Iceland rely on the three sources of information examined here. The majority of countries use at least two of these sources.

O R G A N I S A T I O N
74
Figure B13: National monitoring of education systems – use made of results of external evaluation of pupils and schools, ISCED levels 1 to 3, 2006/07
Use of pupils’ results from external tests and examinations
Use of findings from the external evaluation of schools
Low stakes tests used in national monitoring
Findings from the external evaluation of schools used in national monitoring
High stakes tests used in national monitoring
Findings from the external evaluation of schools not used in national monitoring
External tests are not used in national monitoring Data not available
Source: Eurydice.
Additional notes Germany: Since 2005/06, monitoring the education system on the basis of standardised tests results does exist at Land level, in some Länder regarding tests designed specifically for this purpose and in all Länder regarding tests for certified assessment. Malta: External tests designed for monitoring the education system are not used on a regular basis. However, as part of a national literacy survey, such tests were administered in March 1999 and March 2003 on the same cohort of pupils, in the second and fifth years of primary education respectively. Austria: As of 2005, external tests held for samples of pupils for monitoring the education system have progressively been introduced in the years four and eight of compulsory education. Full implementation is planned to be achieved in 2012. Results of these tests will then be used to monitor the education system. Romania: In 2002/03, a report was prepared on the state of pre-university education, which included the results of pupils in examinations for certified assessment at the end of lower secondary and upper secondary education. Slovenia: From 2007/08, national tests held at the end of compulsory education will not be used anymore for pupil certification. Iceland: Since 2008/09, there is no more external examination at the end of the compulsory education. Norway: Low stakes tests – in terms of their consequences for individual pupils' career – were introduced in 2004.

SECTION I I – OBJECTIVES AND EVALUATION
75
Explanatory note (Figure B13) 'Low stakes tests used in national monitoring’ refers to the use of national-level data on the average results obtained by all pupils (or a representative sample of pupils) from a given age group in a national assessment. The tests are described as ‘low stakes’ because the results of this assessment are not used to award a certificate to pupils, stream them into the following level of education or award them a grade at the end of a school year. In most cases, the results obtained are compared with the skills or knowledge that should have been acquired at a given stage of education. 'High-stakes tests used in national monitoring’ refers to the use refers to the use of national-level data on the average results obtained by all pupils when they sit external examinations to mark the satisfactory completion of a given stage of education. The results of external examinations which are used solely to evaluate schools and are published only by the school or local authority are not considered here. For the definitions of external evaluation of schools, see the explanatory note of Figure B10. 'Findings from the external evaluation of schools used in national monitoring' refers to the use of national-level data which gather outcomes obtained by individual schools. Tests undertaken for the purpose of international evaluation projects are not considered here.
LOW STAKES TESTS ______ ARE INCREASINGLY USED IN MONITORING THE EDUCATION SYSTEM ______
Results of external examinations designed for pupil certification (high stakes tests) are often used for monitoring the education system (Figure B13). Furthermore, at primary and lower secondary levels of education, a growing number of countries use tests that are low stakes in terms of their consequences for individual pupils' career in order to report on the global state of the education system. These tests may be primarily aimed at monitoring the education system or may have some other purpose, such as supporting the learning of individual pupils or providing school accountability.
External tests designed specifically to monitor the education system are held in more than half of the countries, with Bulgaria, Italy, Austria and Norway having introduced them most recently. These tests make it possible to measure, at different times, how proficient pupils are in the skills and/or knowledge against nationally prescribed assessment scales.
Countries are split into two main groups, according to whether they organise these tests for all pupils or only for sample groups. The latter case is however the most frequent. It provides good evidence about the global quality of the education system while limiting the burden on pupils and teachers. However, administration of national tests to the full cohort may enable the fulfilment of additional objectives to national monitoring, such as informing improvement strategies at school level, providing comparative information to parents or school accountability.
Tests designed specifically to monitor the educational system are held either in the middle or at the end of the school year, except in Norway where they are held at the beginning of the school year. The number of years of schooling at ISCED levels 1 and 2 during which tests are applied varies from one country to another. Most countries test in two school years at both primary and lower secondary levels (ISCED levels 1 and 2) but testing is more frequent in Bulgaria, Italy, Lithuania and the United Kingdom (Scotland). In Romania and Slovakia, only one round of tests is held, in the last year of ISCED level 2 and primary school respectively. Ireland and Portugal concentrate tests at ISCED level 1, whereas other countries spread them over ISCED levels 1 and 2.
In the French Community of Belgium, Luxemburg, Hungary, Slovenia, Sweden, the United Kingdom (England) and Iceland, results from national tests which support the learning of individual pupils are also used to evaluate the state of the education system. Norway has also used such tests since 2007/08. Tests to support teaching and learning are held at the beginning of the school year in Luxembourg and Iceland, and

O R G A N I S A T I O N
76
later in the year in the other five aforementioned countries. They are more often set at ISCED level 1 than ISCED level 2 and are either compulsory or optional, but never sample-based.
Figure B14: Frequency and organisation of external low stakes tests, used for monitoring the education system, ISCED levels 1 and 2, 2006/07
At the beginning of the school year Point at which
tests are taken during the year At another time or times
in the school year
More than once Frequency of administration of tests during ISCED 1 and 2 Once
Sample of pupils All pupils are tested � No external low stakes tests used for monitoring the education system
Source: Eurydice. Additional notes Bulgaria: National tests were introduced in 2006 in the fourth and fifth years of compulsory education and were extended to the sixth year in 2008. Spain: National tests are held for samples of pupils, whereas tests by the Autonomous Communities cover all pupils. Italy: The introduction of national pilot tests began in 2001/02. Tests for the second and fifth years of primary education reached their final form in 2008/09. Tests in the first year of secondary education will reach their final form in 2009/10. Lithuania: Tests are held for samples of pupils in fourth year of primary education, second, fourth and sixth years of lower secondary. Optional tests are set in the sixth year of lower secondary. Hungary: National tests are set for all the pupils, although the national analysis shows the results for only a sample of pupils per school. Austria: Since 2005/06, national tests designed to monitor the education system have been progressively introduced in fourth and eight years of compulsory education. These will be fully implemented in 2012. Portugal: National tests have been held for all pupils since 2006/07. Slovenia: National tests held in the sixth year of compulsory education are optional, whereas those set in the final year of compulsory education must be taken by all pupils. Slovakia: Introduction of national testing started in 2003 on a project basis for pupils at the end of ISCED level 2. Full implementation will be reached in 2009. Sweden: The tests set in the fifth year of compulsory education are optional. Compulsory tests will be introduced in the third year of compulsory education from 2009/10. Norway: External tests introduced in 2004 are set in September for pupils of the fifth and eighth years of compulsory education. Since 2007/08, other tests for identifying learning difficulties in reading and mathematics have to be taken in the spring by all pupils in the second year of compulsory education, but only a sample of these is used to monitor the educational system. Explanatory note National tests covered in indicator B14 can be compulsory for all pupils, optional or sample-based. These tests aim to monitor the education system, or to support the learning of individual pupils if their results are also used to produce national-level data on the average results obtained by all pupils (or a representative sample of pupils) from a given age group. National tests used to award a certificate to pupils, stream them into the following level of education or allow their progression to the next school year are not considered here. A frequency of more than once during ISCED levels 1 and 2 refers to the countries which tested different grades in 2006/07 as well as the countries which alternatively test one or more grades every year.

77
O R G A N I S AT I O N
SECTION III – DECISION-MAKING LEVELS AND PROCESSES
SCHOOL AUTONOMY POLICIES ARE INCREASINGLY _____________________ WIDESPREAD ACROSS EUROPE _____________________
Although the policy of school autonomy now seems widespread in Europe, this has been the result of a gradual process of implementation. The process began in the 1980s in a few pioneering countries and then expanded massively during the 1990s. In the vast majority of cases, these reforms were imposed as part of a top-down decision making process.
The information provided in this figure comes from two in-depth studies that have been carried out in the last two years. For more details, refer to School Autonomy in Europe: Policies and Measures (Eurydice 2007) and Levels of Autonomy and Responsibilities of Teachers in Europe (Eurydice 2008).
Three broad areas of school activity are considered here, ranging from those purely concerned with the governance and management of schools to those concerned with the process of teaching and learning. Each of these areas is further broken down into a number of more detailed aspects.
Overall, there are marked differences across Europe in the underlying rationale and the implementation timescale of the school autonomy process. Therefore, it is not surprising that, in 2007, the areas in which schools have autonomy also differ considerably.
The detailed analysis of the autonomy granted to schools for the management of financial and human resources reveals that some countries allow more autonomy than others and, similarly, autonomy is likely to be given to schools in some specific areas of activity rather than in others.
Approximately 10 countries grant a large degree of autonomy in the two areas concerned. This is the case in the Baltic countries, in Belgium, Ireland (ISCED 2), Italy, Slovenia, Slovakia, Sweden and the United Kingdom (England, Wales and Northern Ireland). The situation is similar in Hungary and Poland but, in these countries, many decisions are subject to the approval of the higher authority or are taken within established guidelines.
In the Netherlands and Finland the situation is more variable as it is subject to the will and actual practice of the competent authorities. In effect, they can choose whether or not to formally delegate their powers to schools in all (the Netherlands) or some (Denmark and Finland) areas of management.
In contrast, in a minority of countries, little autonomy is granted. This occurs mainly in Germany, Greece, France (ISCED 1), Ireland (ISCED 1), Luxembourg, Malta, Austria, Portugal and Liechtenstein. In Cyprus, no autonomy is granted in these areas.
The area of human resource management reveals contrasting features. This may be a result of the fact that different administrative levels are responsible for employing teachers (Figure B18). The functions of the school head are very often under the control of the higher authority whilst more decisions are taken about the management of teaching staff at school level (selection of staff to replace absent teachers, defining duties and responsibilities and disciplinary measures). With regard to school heads, schools are granted full autonomy in Belgium (grant- aided schools), Ireland, Slovenia and the United Kingdom (England).

ORGANISATION
78
With respect to financial resources, autonomy is more widespread in the management of operating expenses, the raising of private funds via donations and sponsorship, the letting of premises and the use of private funds to purchase movable goods. In contrast, decisions are usually the prerogative of the higher authority with respect to capital expenditure (using public funds or private sources where possible), finance from loans, and the use of private funds to employ staff (where possible). Schools are granted full autonomy for loans in Belgium (grant- aided schools), Italy and the Netherlands (if delegation).
The analysis of the process of teaching and learning reveals that education systems appear to be based on a set of interrelated goals some of which are achieved by fairly flexible means.
Neither schools nor teachers can shape decision-making or act freely to any great extent in those areas which affect the structure of education systems and which here relate essentially to the (content- or goal-oriented) compulsory minimum curriculum and (where applicable) to examinations for certified qualifications. These areas are significant in ensuring some form of educational equality for pupils.
Teachers have relatively little say in determining the content of the compulsory minimum curriculum, either because this does not exist in schools (in around two-thirds of the countries considered), or because – where it does – the task is mainly the responsibility of the school head. Even where schools are fully autonomous, there are major national guidelines for determining the curriculum or the aims to be achieved. In contrast to procedures governing the compulsory curriculum, schools have greater freedom when it comes to determining the curricula of optional subjects.
In areas concerned with the daily pursuit of educational activities, school autonomy and the autonomy of teachers, who are often supported by their school heads, are greater. All countries leave schools free to decide what teaching methods to use even if monitoring mechanisms are often established, for example via inspections. In the great majority of countries, schools also choose their own textbooks, except in Greece, Cyprus (ISCED 1), Luxembourg (ISCED 1), Malta and Liechtenstein. All countries grant at least some freedom to schools in determining the basis on which pupils should be organised into groups for teaching and learning. Teachers possess extensive decision-making autonomy in another important area of their activity, namely the assessment of pupils.
In the majority of countries the decision whether pupils should retake a year is at the entire discretion of schools. In Cyprus (ISCED 1), Latvia, Luxembourg (ISCED 2), Liechtenstein (ISCED 1) and Norway, schools are not responsible for deciding whether pupils should retake a year. In Norway, they normally progress automatically to the next class throughout their compulsory education, while in Liechtenstein they do so at ISCED level 1. In the United Kingdom, it is for schools to decide how to organise pupils into teaching groups and there is an expectation that low attainment of individual pupils should be addressed through differentiated teaching and the provision of additional support, rather than by repeating a year. Pupils therefore almost always progress automatically to the next year.
Few European countries deliver certification at the end of primary education (ISCED 1) – for more details see Figure E21 (conditions of admission to lower secondary education). Among them, few countries hold written examinations. For those countries which hold examinations at ISCED level 2, they are only rarely devised at school level. However, schools are involved and perform this task autonomously in four countries, namely Belgium (Flemish Community), Greece, Italy and Cyprus.
Other figures provide complementary information related to some particular issues, such as decisions about whether pupils should retake a year (Figure E20), the transition from primary to secondary education (Figure E21), content of certifying examination (Figure E22), the acquisition of teaching equipment 'movables' and fixed capital assets 'immovables' (Figure B19 a, b, c), and the numbers of hours of teachers’ must be present in school (Figures D29 and D30).

SECTION I I I – DECISION-MAKING LEVELS AND PROCESSES
79
Figure B15: School autonomy relating to human and financial resources, teaching content and processes,
in the public sector, ISCED 1 and 2, 2006/07
HUMAN RESOURCES
With respect to school heads
Selection
Duties and responsibilities
With respect to teaching staff
Selection for teaching vacancies
Selection for substituting absent teachers
Dismissal of teachers
Duties and responsibilities of teachers
… overtime Offering additional salary payments for non-contractually stipulated… … duties and
responsibilities
FINANCIAL RESOURCES Use of public funds
Capital expenditure or acquisitions
Operating expenditure
Acquisition of computer equipment
Fund raising and use of private funds
Funding (seeking donations and sponsorship)
Leasing of school premises for out-of-hours activities
Loans
immovables to acquire
movables
teaching staff Use of private funds
to employ non-teaching staff
Full autonomy Limited autonomy No autonomy
Decision-making powers may be delegated by the local authority � Not applicable Source: Eurydice.

ORGANISATION
80
Figure B15 (continued): School autonomy relating to human and financial resources, teaching content and
processes, in the public sector, ISCED 1 and 2, 2006/07
TEACHING CONTENT AND PROCESSES
Content of the compulsory minimum curriculum
Curricula content of optional subjects
Choice of teaching methods
Choice of text books
Criteria for grouping pupils for compulsory learning activities
Setting internal assessment criteria of pupils
Decisions about whether pupils should repeat a year
Setting the content of examinations for certified qualifications
Full autonomy Limited autonomy No autonomy
Decision-making powers may be delegated by the local authority � Not applicable
Source: Eurydice.
Additional notes Belgium (BE fr): At ISCED level 1, heads of schools administered by the French Community, or the education provider in the case of grant-aided education, may raise the weekly timetable to 29, 30 or 31 periods; no further optional subjects may be selected. At ISCED level 2, the timetable includes four compulsory weekly periods of additional activities that the school must to choose from a list drawn up by the Community authorities. Belgium (BE fr, BE de): (a) refers to schools for which the Community is directly responsible and a minister is the responsible authority; and (b) refers to schools in the public and private grant-aided sector. In the grant-aided sector, the responsible authority is deemed to be the school-based management body. Belgium (BE de): Regarding capital expenditure, schools can decide within a certain level of expenditure, beyond this level decisions are taken by the ministry. At ISCED level 1, all subjects are specified in the decree and no further optional subjects may be selected. Bulgaria: Schools have autonomy for some operating expenditure. Czech Republic: The reform of the curriculum began in 2007/08. In 2006/07, selected schools tested their new ‘School Educational Programmes’. There are no optional subjects at ISCED level 1. Estonia: The age of pupils is the main criterion determining whether they may be placed in separate groups. It is recommended that boys and girls should be separated for lessons in physical education from the fifth year of school. Where schools have sufficient financial resources, groups may be formed within classes for other lessons (such as languages). Greece: Schools may be fully autonomous for some operating expenditure. Spain: Selection of school heads is carried out by a committee comprising representatives of the school and the education authority. Regarding capital expenditure, schools propose expenditure but the education authority approves and provides finances. France: ISCED 1: No autonomy with respect to use of public funds and teaching staff. ISCED 2: school is autonomous for substituting absent teachers for absences of 2 weeks or less. Only schools which have technology classes or a modified general/vocational strand (SEGPA) may receive funds from private enterprises. Cyprus: At ISCED level 1 there is either delegation or no autonomy for the choice of school books. Regarding decisions as to whether pupils should repeat a year, at ISCED level 1 there is no autonomy since pupils progress automatically from one class to the next in all but exceptional circumstances; in these cases the agreement of both the school head and the school inspector is required. Luxembourg: ISCED 1: In some municipalities the administration selects substitutes for absent teachers; the post of school head does not exist and there are no optional subjects; no autonomy is granted to schools regarding the management of public funds, the content of compulsory curricula and text books. Regarding decisions as to whether pupils should repeat a year, schools are autonomous in this area at ISCED level 1. Hungary: Other acquisitions can be financed from the annual budget provided by the maintaining body. The purpose has to be declared and the amount has to be separated within the budget. Planning annual acquisitions is a task of the school head, and it is approved by the maintainer.

SECTION I I I – DECISION-MAKING LEVELS AND PROCESSES
81
Additional notes (Figure B15 – continued) Malta: School heads have to consult the Ministry of Education to see whether it is possible to offer the chosen optional subject in accordance with the number of students in each group setting. Netherlands: Every school has its competent authority (bevoegd gezag) which may be responsible for one school or many schools. It has responsibility in all cases but it can delegate the power of decision-making to the school management or the school head. This delegation should be included in the management statute. Formally, the competent authority is responsible for everything and it is not possible to indicate which tasks are delegated or not in practice. Austria: Regarding the leasing of premises for community use, Allgemein bildende höhere Schule may decide within established education guidelines. Portugal: Schools may select staff only when posts are still vacant after the allocation of jobs at national level. Regarding disciplining and dismissing, schools begin and develop the procedures but the final decision is taken at a higher level. Pupils are submitted to exams in Portuguese and Mathematics only in ISCED2 and schools have no say in preparing the content of these examinations. Romania: Selection of substitute staff and disciplinary measures depend on the particular situation, schools may not have autonomy. Slovenia: Regarding the leasing of premises for community use, local councils (founders) have the right to draw up their own plan. Where premises are used for lessons in religion, the ministry of education must give approval. Investment is approved by the founding-municipality and/or the public financing body (ministry of education, ministry of finance). Autonomy depends on the source of the finance (the state, the municipality or the school). Teachers are free to choose textbooks from a list drawn up in advance. Slovakia: Regarding the roles and duties and disciplinary measures for teaching staff, some aspects may be governed by established guidelines. The Schools can decide on some capital expenditure with the approval of the higher authority. Sweden: Regarding disciplinary measures, some aspects may be governed by established guidelines. For the use of public funds, local authorities must follow national guidelines and therefore have to delegate at least a certain amount of decision-making powers to schools. United Kingdom (ENG/WLS/NIR): Regarding the leasing of premises for community use, schools do not have autonomy where the building has been provided through a public-private partnership. Statutory curricula contain the minimum required for all pupils. They do not seek to determine the curriculum in its entirety, for which the school is responsible. United Kingdom (SCT): The local education authority is ultimately responsible for disciplinary measures. In some cases, schools can widen the scope of a post which would lead to additional salary payments. Iceland: Roles and duties of school heads may be subject to delegation by the local authorities. Liechtenstein: Schools at ISCED 2 are only autonomous for raising and using private funds to finance minor projects. However, this practice is not common. They have full autonomy for expenditure below CHF 3 000; above this level their autonomy is limited or non-existent. At ISCED level 1 there is either delegation or no autonomy for the use of public funds. Schools have no autonomy regarding the content of optional subjects or the choice of school books. At this level, pupils progress automatically from one year to the next, i.e. schools are not autonomous. Norway: School may only receive donations. Explanatory note This indicator shows the degree of school autonomy with respect to local, regional and central educational authorities. Similarly, the way in which decision-making internal to the school (amongst school staff) is organised is not taken into account. ‘No autonomy’ means that decisions are taken only by the education authority, although the school may be consulted at a particular stage of the process. ‘Full autonomy’ means that the school alone takes decisions, within the limits set by national/local legislation or regulations. A recommendation by the education authority with no binding force does not restrict school autonomy. ‘Limited autonomy’ comprises four separate situations, namely:
� the school takes decisions together with the education authority or forwards its proposal to it for approval; � the school takes decisions based on a set of options predetermined by the education authority; � the school is autonomous with regard to some decisions relating to the aspect under consideration but must refer to
the education authority – or is not autonomous – as far as the remainder of decisions are concerned; � the school is autonomous in principle but is strongly encouraged to follow official recommendations.
‘Decision-making powers may be delegated by the local authority’ means that local authorities are responsible for decision-making and have discretionary powers, in law, to delegate decision-making to school level.

ORGANISATION
82
SCHOOL-LEVEL BODIES WHICH INCLUDE PARENT REPRESENTATIVES ___________ ARE INVOLVED IN SOME ASPECTS OF DECISION-MAKING ___________
The role of parents in decision-making at school level depends on whether parents are included on school
administrative councils or management bodies. Where this is the case, their sphere of influence across a
range of areas may vary considerably. They may have decision-making powers or exercise a consultative
function, or enjoy neither of these. In Finland, Sweden, and to a lesser extent the Netherlands and the United
Kingdom (Scotland), the powers given to school-level bodies which include parent representatives depend
on the school concerned.
Parent representatives have a consultative role (fifteen countries or regions) or decision-making powers
(eleven countries or regions) in the development of the school educational plan or school action plan. Only in
Denmark, Cyprus, Iceland, Liechtenstein and Turkey do parents' representatives have no intervention or
consultative role in this area.
With respect to rules governing everyday school activities, the situation also varies considerably from one
country to the next. There are decision-making powers for parents on school-level bodies in eleven
education systems and a consultative role in fifteen others. And in Cyprus, Slovakia, Iceland, Liechtenstein
and Turkey there are neither decision-making powers nor a consultative role in this area.
In contrast, parents do not have any formal influence on decisions with respect to the expulsion or
suspension of pupils in just over half of European education systems, and they have a consultative function
only in Belgium (German-speaking Community), Estonia, Cyprus, Lithuania, Hungary and Austria. Seven
countries give parent representatives access to full decision-making powers in this area, but in some
countries this power is restricted to lower secondary education.
The recruitment of teachers and the termination of teaching contracts is not commonly a matter for school-
level bodies which include parent representatives. Only in Belgium (Flemish community), Ireland and the
United Kingdom do such bodies have decision-making powers in this area. In Denmark, these bodies have
only a consultative role while in Finland the role played varies according to the school concerned. In all
countries, the arrangements responsibilities for teacher recruitment are mirrored, with only a few differences,
by the powers arrangements for the termination of teachers’ employment.
Similarly, decisions regarding teaching content are very rarely a matter for school-level bodies which include
parent representatives. The Czech Republic, Denmark, Germany, Estonia, Ireland, Luxembourg and
Hungary offer a consultative function and only the United Kingdom (England, Wales and Northern Ireland)
offers decision-making powers in that area.
The picture is rather more mixed with respect to whether school bodies which include parent representatives
contribute to deciding which optional lessons are to be provided in the school, and there is also some
variation in decision-making between educational levels: parents have consultative role regarding the
provision of optional lessons in primary education in the German-speaking Community of Belgium, Portugal
and in secondary education in France. There are no consultative or decision-making powers in fifteen
countries. Decision-making powers exist in Denmark, Germany and the United Kingdom (England, Wales
and Northern Ireland), while parents have a consultative role in Belgium (Flemish Community), the Czech
Republic, Ireland, Italy, Lithuania, Luxembourg, Hungary, Poland, Portugal (primary level), Slovakia and
Norway.

SECTION I I I – DECISION-MAKING LEVELS AND PROCESSES
83
In Denmark, Germany, Spain and Austria parent representatives do have decision-making powers in relation to the choice of textbook, while in Belgium, the three Baltic States, France (lower secondary education), Italy, Luxembourg, Poland, Portugal and the United Kingdom (Scotland) bodies including parents have a consultative role in this regard.
Figure B16: Power exercised in eight areas, by school council/boards which have parent representatives, compulsory education, 2006/07
School educational plan, school action plan
Rules governing everyday school activity
Expulsion and suspension of a pupil
Decisions regarding teaching content
Provision of optional lessons
Acquisition of textbooks, educational software, etc.
Recruitment of teachers
Termination of teachers’ employment
Left Primary
Right Secondary Decision-making power
Neither decision-making power nor consultative function
��Not applicable Consultative function Power depends on the school concerned
Source: Eurydice. Additional notes Belgium (BE nl): Parents on school bodies in the private grant-aided sector do not have decision-making or consultative powers with respect to the recruitment of teachers or the termination of their employment. Greece: Pupils in primary education may not be expelled or suspended. There are two boards: the School Committee (Sxoliki Epitropi), with responsibilities' for infrastructure and school finances and the School Council (Sxoliko Symboulio), with responsibilities for the school environment and climate. Spain: The 2006 Act on Education gives head teachers more powers in relation to expulsion and suspension of pupils, as it gives them the responsibility of guaranteeing mediation in resolving conflicts and of imposing the corresponding disciplinary measures on pupils although, when the disciplinary measures adopted by the head are the result of student misconduct seriously damaging to the school community, the School Council, at the request of parents or tutors, can review the decision taken and propose appropriate measures, if applicable Italy: The expulsion and suspension of pupils at secondary level is decided by a school-level body. The participation of parents in this body depends on internal school regulations. At primary level, expulsion and suspension is not regulated and rarely occurs in practice. Slovenia: Complaints concerning disruptive pupils may be made to the school council, which has decision-making powers over the transfer of such pupils. Slovakia: The powers of school councils with at least four parent representatives were extended in 2003 by legislation on state administration and self-government in education which came into force on 1st January 2004. United Kingdom (ENG/WLS/NIR): The school governing body establishes the strategic framework for school rules, curriculum and staffing. The head teacher takes decisions within this framework. Specific regulations apply to the decision to expel or suspend a pupil. In England and Wales, this decision is made only by the school head but must be reviewed by the governing body. In Northern Ireland, the decision to expel is made by the board of governors in all categories of school except controlled schools. United Kingdom (SCT): The responsibility for appointing senior teachers is shared with the local authority.

ORGANISATION
84
Additional notes (Figure B16 – continued) Turkey: Parents do not take part in school bodies regarding the above issues; regulations are made by the central bodies of the Ministry of National Education. School bodies do not have the authority to make arrangements on the above issues except in drafting a strategic plan. Every school has to produce a strategic plan including a school action plan. The nature of strategic planning requires the participation of all stakeholders including parents but it is not a common practice. Parent's participates in school activities via the School-Parents Union that may organise workshops in order to improve education and instruction and also co-operates with school administration on everyday activities.
AT CENTRAL LEVEL, PARENT CONSULTATION VIA PARTICIPATORY BODIES _____________ OCCURS IN ABOUT HALF OF EUROPEAN COUNTRIES _____________
In European countries, there is often one national or central participatory body that includes parents alongside representatives of other participants in the education system. Where such bodies exist, they act in a consultative capacity and do not have decision-making responsibilities.
In contrast, in seventeen countries and in the German-speaking Community of Belgium, there is no specific provision for the establishment of a national-level council with parent representation. In Italy, a consultative body exists at central level but does not include parents.
Figure B17: Parent participation in national or central level consultative bodies, compulsory education, 2006/07
Source: Eurydice. Additional notes Bulgaria: Following the adoption of the National Programme for School and Pre-school Education 2006-2015, the Ministry of Education and Science has launched as a pilot project in certain municipalities across the country, the so called national councils with parent participation. If the draft School Education Law is approved in 2009, such national bodies will be set up and certain powers will be assigned to them with regard to participation in school management and internal organisation of school life.
Parent participation in a consultative body
No parent participation in a consultative body

SECTION I I I – DECISION-MAKING LEVELS AND PROCESSES
85
Additional notes (Figure B17 – continued) Germany: The situation varies from one Länder to the next. School legislation and administration of the education system are the responsibility of the Länder. Lithuania: Representatives of parents designated to the Lithuanian Education Council implement expert assessment and offer consultation on strategic issues of Lithuanian education. The regulations of the Lithuanian Education Council are approved by the Government. Poland: A national council including parents is provided for in legislation (Act on the Education System of 1991 with further amendments) but has not yet been set up. Romania: Parents take part in consultative bodies such as the Board of Directors of Schools (Consiliul de Administra�ie al �colii) and in Representative Boards of Parents of School Classes (Consiliile Reprezentative ale p�rin�ilor pe clase, �coal�), but there is more limited participation at central level. Explanatory note Associations consisting solely of parents are not shown.
THE AUTHORITY WHICH EMPLOYS TEACHERS TENDS TO BE THE SAME ___________ AT PRIMARY AND SECONDARY LEVELS OF EDUCATION ____________
The administrative level which has responsibility for employing teachers is closely related to their employment status (Figure D26). Teachers who are career civil servants are employed by central or regional authorities where these correspond to the top-level authority for education. This is the case in fifteen European countries or regions. In the Nordic countries as well as in Hungary, the Netherlands and the United Kingdom (Scotland), the employer of teachers working in public establishments is the local authority. Schools are responsible for employing teachers in Bulgaria, the Czech Republic, the Baltic countries, Ireland, Poland, Romania and Slovakia. Finally, the responsibility for the employment of teachers varies depending on the category of school concerned in Belgium, Sweden and the United Kingdom (England, Wales and Northern Ireland).
In most cases, the level of education at which a teacher is employed has no bearing on the body responsible for employing them. Only in a limited number of countries, such as Malta, Iceland and Norway is the employer for teachers in the upper secondary education different from the one in primary and lower secondary education. In Malta (in some cases) and Iceland the employer is the school while in Norway, the authority responsible for employing upper secondary teachers is the County Education Committee.
The extent to which schools are involved in the decision-making process with respect to teacher recruitment (Figure B15) also has a close bearing on this information because the employer is taken to mean the authority that has responsibility for appointing the teacher. Schools may nonetheless have full autonomy to recruit their teachers even where the employer is not located at school level (in the Netherlands, Finland, Sweden and the United Kingdom (England and Wales) for some categories of schools). This means that they are free to select their teachers themselves although a higher authority has formal responsibility for the teaching appointment.

ORGANISATION
86
Figure B18: Administrative level with responsibility for employing teachers
in primary, lower secondary and upper secondary education, 2006/07
Source: Eurydice.
Additional notes Belgium: Teachers working in public-sector schools may be employed either by their respective Communities (which is the top level of education) or by the municipalities or provinces. Teachers working in the grant-aided private sector are employed by their competent authority. This latter situation is not shown on the Figure. Germany: With respect to the minority of teachers who are not career civil servants, the contracting party may either be the Land or the municipality. Malta: At general upper secondary level, the central authority is responsible for employing teachers in schools that fall under the Directorates of Education. Three other upper secondary education institutions which do not fall directly under the Education Directorates employ their own staff. These are the Junior College (general education), the Malta College of Arts, Science and Technology and the Institute of Tourism Studies (both vocational). Netherlands: Teachers are employed by the competent authority (the bevoegd gezag), which is the municipal executive for public education and administrative body governed by private law for private grant-aided education. Austria: Teachers working at primary level and in the Hauptschulen are employed by the Länder. Teachers working in the allgemein bildende höhere Schulen are employed by the Bund (central government). Slovenia: Teachers are employed by the Government, although some elements of the employment procedures are in the responsibility of schools. Sweden: The employer is the school organiser which for most public schools are the municipalities. For grant-aided independent schools the employer normally is the school board. United Kingdom (ENG/WLS/NIR): The employer varies according to the school's legal category. In England and Wales, it is the local authority or the school governing body. In Northern Ireland, it is the Education and Library Board, Council for Catholic Maintained Schools, or school board of governors.
Upper secondary
Employer is the central/regional government
Employer is the municipality/local education authority
Employer is the school

SECTION I I I – DECISION-MAKING LEVELS AND PROCESSES
87
Explanatory note (Figure B18) The term ‘employing authority’ refers to the authority with direct responsibility for appointing teachers, specifying their working conditions (in collaboration with other partners, if appropriate) and ensuring that these conditions are met. This includes ensuring payment of teachers’ salaries, although funds for this purpose may not necessarily derive directly from the authority’s budget. This should be distinguished from the responsibility for managing resources within the school itself, which lies (to a greater or lesser extent) with the school head or the school management board. The central government is the top-level authority for education in most countries. In three cases, however, decision-making occurs at a different level, namely that of the governments of the Communities in Belgium, the Länder in Germany and the governments of the Autonomous Communities in Spain.
EXPENDITURE ON TEACHING STAFF TENDS TO BE CENTRALLY DETERMINED HOWEVER, OTHER TYPES OF EXPENDITURE
____________ ARE DETERMINED JOINTLY WITH LOCAL AUTHORITIES ____________
Central and/or local governments make decisions regarding the overall amount of public expenditure earmarked for schools providing compulsory education according to the category of resources concerned. (Figure D9). In some countries, however, these bodies only decide on the overall amounts for educational expenditure, while decisions relating to specific categories of resource are taken at school level (Figure B15). Depending on the chosen method of distribution, the amount of funding for a particular resource is established either in terms of a lump sum to be shared out optimally among schools, or by means of a formula which, when applied to each school individually, gives the total level of funding required.
In many countries, overall public expenditure on teaching staff (or overall public expenditure on schools, in the case of those countries in which schools determine the allocation across categories or expenditure) is determined by central government or the top level authority for education. In France, Latvia, Hungary, Slovenia and the United Kingdom (England and Wales), decision-making is located at both the central/ top-level authority for education and the local level, while the local level has sole responsibility in Romania, Finland, Sweden, United Kingdom (Scotland), Iceland and Norway.
Decision-making procedures concerned with the expenditure to be earmarked for non-teaching staff, operational resources and movables may be examined together as, in almost all countries, they follow similar procedures. In general, these decisions are distributed between central and local levels or are taken at local level only. However, they remain centralised in Belgium (French and German-speaking Communities), Ireland, Cyprus, Malta, the Netherlands, the United Kingdom (Northern Ireland) and Turkey.
Depending on the country concerned, the distribution of decision-making for spending centrally determined resources varies very widely. In general, decisions relating to the resources intended for some or all teaching equipment and materials (including computers, which come under the ‘movables’ heading) are taken centrally, whereas the remainder are taken locally. In some countries in this group, school textbooks are always centrally produced and distributed.
Finally, regarding the responsible level for determining the overall amount of public expenditure earmarked for fixed capital assets (immovables), it can be noted that, in the majority of countries, the responsibilities are divided between local and central level authorities, but are held more often at the local level. Only in Belgium, Ireland, Cyprus, Malta, Slovakia, the United Kingdom (Northern Ireland) and Turkey is the central/top-level authority for education the only responsible authority for decision-making on investing in immovables. Specific situations can be seen in some countries, as, for example, in the Netherlands, where the amount a municipality receives from the central government for buildings is determined on the basis of a set of criteria. However, municipalities can use this amount at their discretion and merge it with other budgets. As a result,

ORGANISATION
88
they effectively determine the overall amount allocated to capital expenditure, whereas the government determines the overall amount for other resources.
From a comparison of the maps, it is clear that, on the one hand, there is a tendency for decisions relating to the financing of teaching staff to be taken by the central government or regional entity fully responsible for education and, on the other, for decisions concerned with the financing of operational resources (in the broad sense) to be shared with the local authorities. When the way decisions are divided between different administrative levels is analysed, it is also clear that, for each of the main resource categories (staff, operational resources and capital), there is a greater general tendency to decentralise decisions for determining the overall amounts to be allocated to resources not directly related to teaching.
Figure B19: Location of decision-making powers to determine the overall amount of public expenditure
earmarked for schools providing compulsory education, public sector or equivalent, 2006/07
Figure B19a: Teaching staff Figure B19b: Non-teaching staff, operational resources and movables
Figure B19c: Immovables
Local
Central/Top level
Source: Eurydice.

SECTION I I I – DECISION-MAKING LEVELS AND PROCESSES
89
Additional notes (Figures B19a, B19b and B19c) Belgium: In the case of schools administered by the municipalities and provinces, the latter may decide whether or not to earmark a budget specifically for operational resources and movables, in addition to the grants allocated by the Communities. Bulgaria, Czech Republic, Estonia, Greece, Latvia, Lithuania, Romania, Slovenia and Iceland: Amounts earmarked for books and/or audio-visual equipment or computers, if not all teaching materials and equipment, are fixed at central level. Czech Republic: The central level is responsible for determining the amount allocated for non-teaching staff, while the local level is responsible for other operational resources and movables. Germany: The Länder (the top decision-making level) issue their plans for school development which are used by the local- level authorities to allocates funds for immovables. Estonia: The state allocates resources to specific schools through the National Investment Programme and the local level makes allocations of a similar nature from its own budget. These two processes are not interdependent. Greece: Responsibility for immovables is shared between the Ministry of Education and the Ministry of Economic Affairs (central level) and the Prefectures (local level). Spain: In primary education, the responsibility for immovables is shared between the Autonomous Communities – who construct the school buildings – and the municipalities who provide for the land and are responsible for the maintenance and repairs to schools. At secondary level, all responsibility for expenditure on school buildings lies with the Autonomous Communities. France: A new organic law related to finance gives academic authorities (school regional authorities) the responsibility to define, in cooperation with the central authorities, the amount of the public expenditure allocated to schools, including the salary payments to the teaching staff. Italy: The local level is responsible for providing some operational resources (for example, textbooks for primary schools) out of their own budget. Latvia: The central level specifies the amount and the procedures for payment of salaries, and the local level allocates earmarked subsidies from the national budget and supplements this from local incomes. Similarly, both central and local levels share the overall amount of expenditures regarding immovables. Lithuania: A new system of financing which is based on a per capita model has been in force since 2002 for teaching and administrative staff, social pedagogues and librarians, textbooks and other teaching aids. Funds are allocated by central government. The other resource categories (other non-teaching staff, operational resources, movable and immovable goods) remain the responsibility of the municipalities. Luxembourg: The local level is responsible for other resources than teaching staff in primary education and the central level has responsibility for secondary education. Hungary: Local governments have broad rights concerning the distribution of block grants. Block grants are determined according to a performance indicators introduced in 2007 Austria: In primary education and in the Hauptschulen and Polytechnische Schulen, the local level is responsible for non-teaching staff resources, operational resources and capital; in the case of Allgemein bildende höhere Schulen, responsibilty lies with the central level. Poland: In determining the level of resources for teaching staff, local authorities must apply legislation relating to salaries, class size and pupil/teacher ratios, but they may supplement the amount from their own income. Portugal: The local level is responsible for operational resources and movables and capital resources in schools offering the first stage of ISCED level 1. Romania: New construction, rehabilitation, consolidation, utilisation and capital repairs are funded from the state budget and from local budgets. Slovenia: The local level provides funding for immovables with some assistance from the central level. The Ministry of Education runs a tendering process and approves local investment programmes upon the stated priority criteria. Finland: In order to receive government financing for investments in immovables, the project must be approved by the Ministry of Education as part of the national financing plan and in accordance with the budget. United Kingdom (ENG/WLS/NIR): Schools receive the majority of their revenue funding as a global amount which they are responsible for allocating across these different categories of expenditure. Liechtenstein: In primary education, the local level is responsible for operational resources with responsibility shared between local and central levels for capital resources, in the case of secondary education responsibility lies with the central level. Turkey: Local administrations must also allocate resources for expenditure other than teaching staff, but they are very minor compared to the central contributions.
Explanatory note The resource categories considered are as follows: teaching staff, non-teaching staff, operational resources required for teaching, other operational resources, movables and immovables. The gathering of financial data groups these six categories into three main ones, namely current expenditure on staff, other current expenditure and capital expenditure. However, from the standpoint of administrative decision-making, it is more helpful to adopt a different set of categories distinguishing between a) teaching staff, b) non-teaching staff, operational resources and movables and c) immovables.

ORGANISATION
90
Explanatory note (Figures B19a, B19b and B19c – continued) Current expenditure covers goods and services that are used during the year and have to be annually renewed. Capital expenditure covers assets that last longer than a year. It refers to construction, renovation or major repairs to buildings (immovables) as well to equipment, furniture and computers (movables). However, minor expenditure under a certain fixed amount is included in operational expenditure. Resources for schools with target populations corresponding to specific programmes of support (such as education action zones, programmes for pupils from ethnic minorities, etc.) are not included in this Figure. The central government is the top-level authority for education in most countries. In three cases, however, decision-making occurs at a different level, namely that of the governments of the Communities in Belgium, the Länder in Germany and the governments of the Autonomous Communities in Spain. Only schools in the public sector are considered. However, in the case of three countries (Belgium, Ireland and the Netherlands), grant-aided private schools are included as they enrol a substantial proportion of pupils and are regarded as equivalent to schools in the public sector.
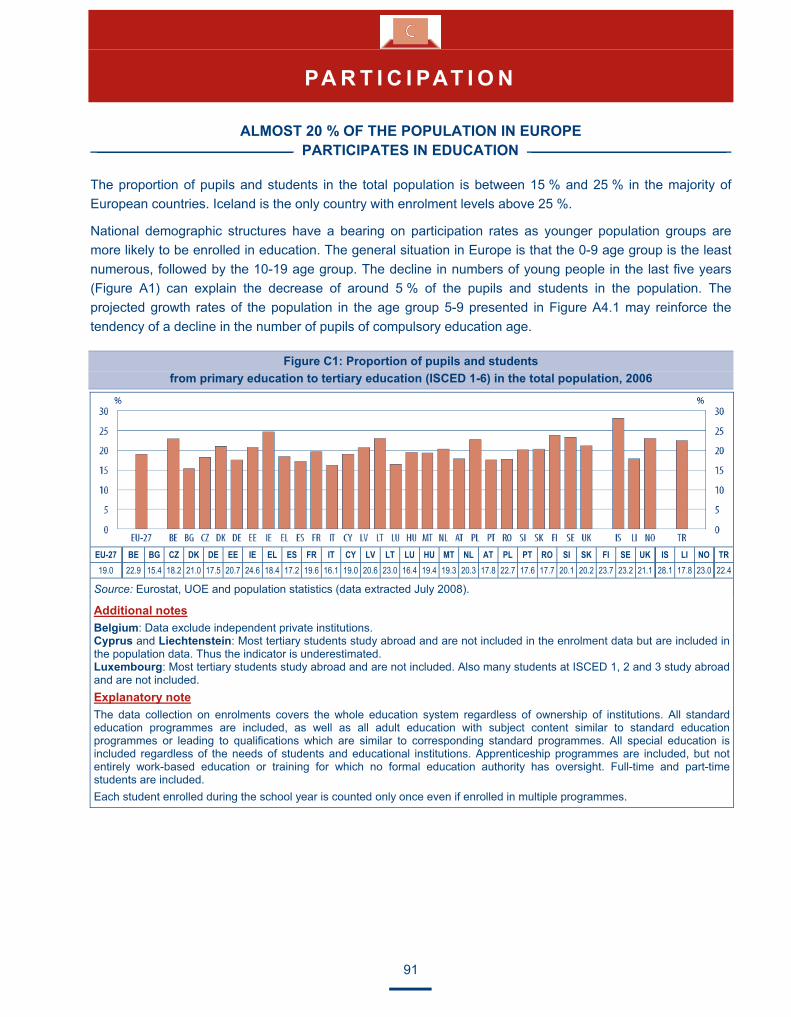
91
PA R T I C I PAT I O N
ALMOST 20 % OF THE POPULATION IN EUROPE ______________________ PARTICIPATES IN EDUCATION ______________________
The proportion of pupils and students in the total population is between 15 % and 25 % in the majority of European countries. Iceland is the only country with enrolment levels above 25 %.
National demographic structures have a bearing on participation rates as younger population groups are more likely to be enrolled in education. The general situation in Europe is that the 0-9 age group is the least numerous, followed by the 10-19 age group. The decline in numbers of young people in the last five years (Figure A1) can explain the decrease of around 5 % of the pupils and students in the population. The projected growth rates of the population in the age group 5-9 presented in Figure A4.1 may reinforce the tendency of a decline in the number of pupils of compulsory education age.
Figure C1: Proportion of pupils and students from primary education to tertiary education (ISCED 1-6) in the total population, 2006
EU-27 BE BG CZ DK DE EE IE EL ES FR IT CY LV LT LU HU MT NL AT PL PT RO SI SK FI SE UK IS LI NO TR 19.0 22.9 15.4 18.2 21.0 17.5 20.7 24.6 18.4 17.2 19.6 16.1 19.0 20.6 23.0 16.4 19.4 19.3 20.3 17.8 22.7 17.6 17.7 20.1 20.2 23.7 23.2 21.1 28.1 17.8 23.0 22.4
Source: Eurostat, UOE and population statistics (data extracted July 2008).
Additional notes Belgium: Data exclude independent private institutions. Cyprus and Liechtenstein: Most tertiary students study abroad and are not included in the enrolment data but are included in the population data. Thus the indicator is underestimated. Luxembourg: Most tertiary students study abroad and are not included. Also many students at ISCED 1, 2 and 3 study abroad and are not included. Explanatory note The data collection on enrolments covers the whole education system regardless of ownership of institutions. All standard education programmes are included, as well as all adult education with subject content similar to standard education programmes or leading to qualifications which are similar to corresponding standard programmes. All special education is included regardless of the needs of students and educational institutions. Apprenticeship programmes are included, but not entirely work-based education or training for which no formal education authority has oversight. Full-time and part-time students are included. Each student enrolled during the school year is counted only once even if enrolled in multiple programmes.

PARTICIPATION
92
____________ OVER 90 % OF 3 TO 19 YEAR-OLDS ARE IN EDUCATION ____________
In all European countries there is a high level of educational participation in the 3-19 age group: the proportion of young people studying at some level of education is over 90 % in sixteen countries and higher than 95 % in Belgium, Estonia and France.
A comparison of participation rates for young people in the 3-19 and 3-29 age groups shows a considerable drop in enrolment throughout Europe in the 3-29 age group, by an average of around 30 % in the majority of European countries. In contrast, the decrease is much less marked in Denmark, Finland and Turkey, with a drop of less than 20 % between the participation rates of the two age groups.
This means that significantly fewer young people are participating in education after the age of 19, irrespective of the type of education programme followed. The average in the European Union is around 65 % for the 3-29 age group (and over 92 % for the 3-19 age group). This decline in participation is clearly related to the end of compulsory education (Figure C10). Only Belgium and the Nordic countries have participation rates higher than 70 % for the 3-29 age group.
Figure C2: Proportion of pupils and students in the 3-19 and 3-29 age groups, 2006
3-19 age group 3-29 age group
EU-27 BE BG CZ DK DE EE IE EL ES FR IT CY LV LT LU HU MT NL AT PL PT RO SI SK FI SE UK IS LI NO TR
92.1 98.3 86.0 93.8 93.0 94.2 95.2 87.8 88.7 93.9 96.3 94.6 84.9 91.2 91.5 87.9 94.2 86.9 88.9 89.7 88.6 90.5 83.8 92.4 89.9 87.5 93.7 89.1 94.1 86.2 94.1 63.4
63.9 71.6 55.1 60.2 73.4 67.7 65.9 59.0 62.8 59.7 67.8 63.2 54.2 63.6 67.9 58.2 63.7 57.4 66.3 61.8 62.9 59.7 56.1 65.3 57.5 70.2 72.6 61.7 73.2 59.7 71.5 44.2
Source: Eurostat, UOE and population statistics (data extracted July 2008). Additional notes Belgium: Data exclude independent private institutions. Cyprus and Liechtenstein: Most tertiary students study abroad and are not included in the enrolment data but are included in the population data. Thus the indicator is underestimated. Luxembourg: Most tertiary students study abroad and are not included. Also, many pupils at ISCED 1, 2 and 3 study abroad and are not included in enrolments but are in population data; therefore all participation rates by age are underestimated. In ISCED 5, data by age are missing. Explanatory note All pupils and students at all ISCED levels in public and private institutions aged 3-19 and 3-29 years are included in the numerator. The student numbers are divided by the numbers in the population in the corresponding age groups. Population data refer to 1st January 2006. The data collection on enrolments covers the whole education system regardless of ownership of institutions. All standard education programmes are included, as well as all adult education with subject content similar to standard education programmes or leading to qualifications which are similar to corresponding standard programmes. Pre-primary education is included (ISCED 0). Pre-primary education designed to meet the educational and development needs of children at least 3 years old. Special education is included regardless of normal or special needs of students and the educational institutions. Apprenticeship programmes are included, but not entirely work-based education or training for which no formal education authority has oversight.

PARTICIPATION
93
A HIGHER PERCENTAGE OF WOMEN THAN MEN PARTICIPATE ______________________ IN EDUCATION OR TRAINING _______________________
In the European Union, on average, slightly more than 60 % of women in the 15 to 24 age group are in education or training, compared to 57 % of men. The difference in enrolment rates by sex is relatively high in Estonia, Greece, Spain, Italy, Latvia, Lithuania, Portugal, Slovenia and Sweden, where it was more than 7 percentage points. Only in Germany and the Netherlands was there a relative balance between the enrolment rates of men and women. In Liechtenstein the participation of men was higher than women, but here students studying abroad are not covered by the survey so the enrolment rates by sex may be underestimated or unreliable.
Figure C3: Percentage of young people aged 15-24 in education and training by sex, 2006
Females Males
EU-27 BE BG CZ DK DE EE IE EL ES FR IT CY LV LT LU HU MT NL AT PL PT RO SI SK FI SE UK IS LI NO TR
61.5 72.2 52.3 62.9 69.4 65.3 67.5 58.2 70.2 59.0 61.4 59.7 40.9 68.5 73.1 45.7 64.8 44.5 66.3 55.5 72.0 55.1 54.8 76.0 57.2 74.0 71.9 49.1 70.4 45.1 67.7 27.2
57.3 66.7 50.8 58.9 64.1 65.6 58.6 56.7 63.6 51.4 57.4 52.9 38.6 60.4 66.1 43.3 60.5 42.3 66.4 52.0 68.1 47.1 48.8 63.8 53.0 68.2 64.6 44.6 63.8 62.5 63.1 34.8
Source: Eurostat, Labour Force Survey (data extracted July 2008).
Additional notes Germany, Italy and Poland: Data exclude students in ISCED level 6. Cyprus and Liechtenstein: Students usually living in the country but studying abroad are not yet covered by the survey. Luxembourg: Partial coverage: the data is underestimated as coverage of ISCED 5A and ISCED 5B programmes is partial. Many pupils study abroad and are not included in enrolment figures but are in population data; therefore all participation rates by age are underestimated. Explanatory note A person in education or training has received some kind of education or training in the four weeks preceding the survey. The data collected refer to all education or vocational training whether or not relevant to the respondent’s current or future employment and any kind of education and training.

PARTICIPATION
94
IN MOST COUNTRIES LESS THAN 10 % OF 15-YEAR-OLDS HAVE ______________________ AN IMMIGRANT BACKGROUND ______________________
According to the PISA 2006 survey, 15-year-old pupils whose parents were born abroad constitute less than 10 % in the majority of countries for which data are available.
In Belgium (the French and German-speaking Communities), Germany, Estonia, France, the Netherlands, Austria, Slovenia and Sweden the proportion of pupils aged 15 with an immigrant background was between 10 % and 20 % of the school population of this age. The proportion of pupils with an immigrant background rises to more than a third of the total 15-year-old school population in Luxembourg and Liechtenstein.
These participation rates are consistent with demographic data showing the proportion of young foreigners in the total population (Figure A5) and reflect historic trends in immigration.
Figure C4: Proportion of pupils with an immigrant background in the total population of pupils aged 15, 2006
Countries that did not participate in the study
EU- 27
BE fr
BE de
BE nl BG CZ DK DE EE IE EL ES FR IT CY LV LT LU HU MT NL AT PL PT RO SI SK FI SE UK
(1) UK- SCT IS LI NO TR
7.9 21.5 18.6 7.0 0.2 1.9 7.6 14.2 11.6 5.6 7.6 6.9 13.0 3.8 7.1 2.1 36.1 1.7 11.3 13.2 0.2 5.9 0.1 10.3 0.5 1.5 10.8 9.2 2.6 1.8 36.8 6.1 1.5
UK (1): UK-ENG/WLS/NIR.
Source: OECD, PISA 2006 database.
Explanatory note In the pupil questionnaires, pupils were asked to state their place of birth as well as that of their parents. The category of pupils with an immigrant background was constructed by grouping together all those pupils who indicated that their parents were born abroad irrespective of the pupils’ place of birth. The sampling procedure involved selecting schools and then pupils (35 pupils aged 15). It sought to offer each pupil the same probability of being selected irrespective of the size of the school he or she attended. For further information on the PISA survey, see the Glossary and Statistical Tools section.

PARTICIPATION
95
THE PARTICIPATION OF 4-YEAR-OLDS IN EDUCATION ___________ IS INCREASING IN ALMOST ALL EUROPEAN COUNTRIES ___________
Enrolment in pre-primary education is almost always voluntary in European countries. Only two countries, Luxembourg and the United Kingdom (Northern Ireland), have made education compulsory for four-year-old children. The notional age of entry into educational pre-primary provision for all education systems varies from one country to another (Figure B1).
Participation rates in pre-primary education are dependent on the provision that is available, but the general trend almost everywhere in Europe is towards an increase in the number of 4-year-olds enrolled in pre-primary or primary education.
In 2006, almost all 4-year-old children were enrolled in education in Belgium, France and Italy. All these countries have traditionally had full enrolment at this age. Denmark, Germany, Spain, Luxembourg, Hungary, Malta, the United Kingdom, Iceland and Norway had participation rates above 90 %. Amongst this group of countries, increases in participation are especially marked in Germany and Norway, growing by more than 10 % in the last five years.
In all other countries, with the exception of Ireland, Poland and Finland, over 50 % of 4-year-olds were enrolled in pre-primary or primary education in 2005/06. Additionally, Cyprus, Latvia, Romania, Slovenia and Sweden have shown the biggest increase in enrolment, with growth in enrolments of more than 10 % in the last five years. Only in a very small group of countries can a decrease in the enrolments be seen, mainly explained by the yearly deviations in the population and education statistics time series. Finally, in 2006 Turkey had a very low enrolment level of 4-year-old children with only 7 % participation.

PARTICIPATION
96
Figure C5: Changes in the participation rate of 4-year-olds in pre-primary and primary education (ISCED 0-1), from 1979/80 to 2005/06
79/80 89/90 99/00 05/06 79/80 89/90 99/00 05/06
EU-27 : : 82.8 86.8 HU : : 89.5 92.8
BE 100.0 99.4 99.2 100.0 MT 84.0 97.6 100.0 95.5
BG : : 67.0 68.4 NL 96.2 98.1 99.5 74.2
CZ : : 81.1 86.5 AT 56.6 65.7 79.5 83.2
DK 53.4 73.9 90.6 93.4 PL : : 33.3 41.2
DE 64.2 72.9 81.4 93.1 PT 14.5 42.7 72.35 80.64
EE : : 78.2 86.1 RO : : 60.3 75.8
IE 53.8 55.0 51.1 46.9 SI : : 67.7 79.3
EL 38.2 51.1 53.9 56.1 SK : : : 73.1
ES 69.3 94.8 99.0 97.1 FI 18.1 26.0 41.9 48.5
FR 100.0 100.0 100.0 100.0 SE 27.6 48.4 72.8 86.5
IT : : 100.0 100.0 UK 83.0 91.0 100.0 91.3
CY : : 55.7 70.4 IS : 77.0 90.9 94.8
LV : : 60.6 73.5 LI : 96.8 : 52.7
LT : : 51.0 59.7 NO : : 78.1 91.8
LU 93.6 93.5 94.9 94.0 TR : : : 7.0
Source: Eurostat, UOE and population statistics (data extracted July 2008). Additional notes Belgium: Data exclude independent private institutions. Germany: Data for 1979/80 and 1989/90 refer to the Former Territory of the Federal Republic. Ireland: There is no public-sector provision at ISCED level 0. Many children follow a pre-primary curriculum in private institutions but data are lacking for the most part. The time-series break is caused by the introduction of ISCED 97 programmes that were classified as pre-primary in ISCED 76. (The typical duration is one year). Netherlands: The data is underestimated as figures are based on a pupil count in (pre-) primary education on the 1st October. Between 1st October and 31 December, a quarter of 3-year-olds turn 4 and therefore have the right to enter pre-primary education. Almost all of them do so. United Kingdom: Data for 2005/06 are based on a revised methodology. The Department for Children, Schools and Families estimates for previous years using the revised methodology are: 1979/80: 83.0 %; 1989/90: 85.0 %; 1999/2000: 87.1 %. Explanatory note Pre-primary education (ISCED 0) is designed to meet the educational and development needs of children at least 3 years of age. Pre-primary education must employ staff with specialised qualifications in education. Day nurseries, playgroups and day- care centres where staff is not required to hold a qualification in education are not included. The indicator is calculated by dividing the number of 4-year-olds in pre-primary or primary education by the number of 4-year-olds in the population. For some countries, enrolment rates appear to exceed 100 %. This is because they are calculated on the basis of two data sets (population and education) derived from different surveys carried out at different dates in the year. The figure has been proportionally rounded down to show 100. Population data refer to 1st January of the reference year.

PARTICIPATION
97
PRE-PRIMARY ENROLMENT INCREASES ______________________ WITH THE AGE OF CHILDREN ______________________
The age at which children may begin to attend pre-primary education varies between countries. Provision is generally available from at least 3 or 4 years of age (Figure B1). Over half of European countries have mass participation (over 80 %) in pre-primary education from this age.
In Greece, Cyprus, Latvia, Romania, Slovenia, Slovakia and Liechtenstein most children begin pre-primary education at the age of 5, while most Bulgarian, Lithuanian, Polish and Finnish children enrol for a year of pre-primary education at the age of 6.
The transition to ISCED 1 occurs at the age of 6 for more than 90 % of children in Belgium, Greece, Spain, France, Italy, Cyprus, Luxembourg, Malta, Portugal, Slovenia, Iceland and Norway. Participation rates thus coincide with the theoretical entry age for primary education in these countries, with the exception of Belgium, Luxembourg, Portugal and Slovenia, where few 6-year-old children (between 3 and 7 %) remain in pre-primary education. In Germany, Austria and Slovakia around 40 % of 6-year-olds are still in pre-primary provision. In Ireland, half of all children are already enrolled in primary education at the age of 4; this increases to almost full enrolment for 5-year-olds. All 5-year-old children in the United Kingdom and around 70 % of those in Malta are also already enrolled in primary education.
Entry into primary school occurs at the age of 7 for most children in Bulgaria, Denmark, the three Baltic States, Hungary, Poland, Romania, Finland and Sweden. However, more than 3 % of the 7-year-old children remain in pre-primary education in the Czech Republic, Denmark, Latvia, Lithuania, Hungary and Romania. In the case of the Czech Republic and Hungary, this may be explained by the requirement that children born after a given date must wait a year before entering compulsory education. In the Czech Republic, this may also be due to the fact that compulsory schooling is postponed (at the request of parents and on the decision of the school head) for approximately 20 % of children. In Latvia and Lithuania, this may be due to deferred entry on the grounds of lack of maturity (Figure B4).
Additional notes (Figure C6) Belgium: Data exclude independent private institutions. Ireland: There is no public-sector provision at ISCED level 0. Many children follow a pre-primary curriculum in private institutions but data are lacking for the most part. Netherlands: According to the national education system (see Figure B1), primary education starts at the age of four and is compulsory from the age of five. Nevertheless, the first two years of education are classified as ISCED 0 and ISCED level 1 starts at the age of 6. Explanatory note
Pre-primary education (ISCED 0) is designed to meet the educational and development needs of children of at least 3 years of age. Pre-primary education must employ staff with specialised qualifications in education. Day nurseries, playgroups and day-care centres where staff are not required to hold a qualification in education are not included. Primary education (ISCED 1) programmes are designed to give the basic education in reading, writing and mathematics along with an elementary understanding of other subjects. This indicator gives the participation rates in ISCED 0 and 1 for single years from ages 3 to 7 and shows the enrolment pattern in education at the early ages. For some countries, enrolment rates appear to exceed 100 %. This is because they are calculated on the basis of two data sets (population and education) derived from different surveys carried out at different dates in the year. The figure has been proportionally rounded down to show 100. Population data refer to 1st January 2006.

PARTICIPATION
98
Figure C6: Participation rates
in pre-primary and primary education (ISCED 0 and 1) by age, 2006
Ages Ages
ISCED 0 ISCED 1 Source: Eurostat, UOE and population statistics (data extracted July 2008).

PARTICIPATION
99
MOST YOUNG PEOPLE ARE ENROLLED IN UPPER SECONDARY EDUCATION __________________________ BY THE AGE OF 16 ___________________________
The path through school and into tertiary education for young people aged 15 to 19 reflects the different organisational structures of European education systems (Figure B1). In some countries, the duration of ISCED 2 is significantly longer with a more progressive transition to higher educational levels. In other countries, entry into ISCED 3 and successive levels generally takes place at a younger age.
On average, around half of young people in Europe are enrolled in ISCED 3 at the age of 15 and this participation increases to almost 80 % at the age of 17. By the age of 19, the young people participating in education are split between ISCED 3 and ISCED 5 and there is also a small proportion in ISCED 4 where this level exists (around 5 % of the population at the age of 19). In most of the countries of Europe, the transition to ISCED 3 takes place for all or almost all young people at the age of 16. In Belgium, Italy, Cyprus, Austria and Slovenia, this transition is already almost entirely complete at 15, while in the United Kingdom almost all 15-year-olds are enrolled in ISCED 3.
In some countries, the transition from ISCED 2 takes place at an older age. Participation rates at the age of 15 in ISCED 2 are above 90 % in eleven European countries. Between 10 % and 20 % of pupils are still enrolled in ISCED 2 at the age of 17 in Denmark, Germany, Spain, Lithuania, the Netherlands and Portugal. This is due to the length of lower secondary education in these countries (lasting in some cases until the age of 16, or 17 in Denmark or, in the case of the Netherlands up to the level of VMBO which, as a whole, is considered to be ISCED 2) and/or to the fact that pupils may be required to repeat a year if they fall short of attainment levels.
Throughout Europe, with the exception of Germany and Austria, more students are enrolled in ISCED 5 than in ISCED 4 at the ages of 19 or 18. There is, however, no specific provision for ISCED 4 at this age in a number of countries (Denmark, Cyprus, the Netherlands, Finland, Iceland and Liechtenstein) (Figure B1). Additional notes (Figure C7) Belgium: Data exclude independent private institutions and include education for ‘social advancement’. Germany and Poland: Data exclude ISCED level 6 Cyprus and Liechtenstein: Most tertiary students study abroad and are not included in the enrolment data but are included in the population data. Thus the indicator is underestimated. Luxembourg: Most tertiary students study abroad and are not included. Also many pupils at ISCED 1, 2 and 3 study abroad and are not included in enrolment but are included in population data; therefore all participation rates by age are underestimated. In ISCED 5, data by age are missing. Explanatory note The data collection on enrolments covers the whole education system regardless of ownership of individual institutions. All standard education programmes are included, as well as all adult education with subject content similar to standard education programmes or leading to qualifications which are similar to corresponding standard programmes. All special education is included. Apprenticeship programmes are included, but not entirely work-based education or training for which no formal education authority has oversight. Each student enrolled during the school year is counted only once even if enrolled in multiple programmes. For some countries, enrolment rates appear to exceed 100 %. This is because they are calculated on the basis of two data sets (population and education) derived from different surveys carried out at different dates in the year. The figure has been proportionally rounded down to show 100. Population data refer to 1st January 2006.

PARTICIPATION
100
Figure C7: Participation rates by age
from lower secondary education to tertiary education (ISCED 2 to 6), 2006
Ages Ages
ISCED 2 ISCED 3 ISCED 4 ISCED 5-6 Source: Eurostat, UOE and population statistics (data extracted July 2008).

PARTICIPATION
101
ENROLMENT IN GENERAL EDUCATION IS COMPARABLE AT REGIONAL ______________________ LEVEL FOR MOST COUNTRIES ______________________
Although there is considerable variation between countries with respect to the percentage of students enrolled in general (including pre-vocational) upper secondary education (Figure C9), the distribution of these students is fairly uniform across regions at national level. In other words, high national participation rates generally translate into high regional rates and vice-versa. The regions where the capital city is located demonstrate a higher participation in general education.
Figure C8: Percentage of upper secondary (ISCED 3) students following general education programmes by NUTS regions, 2006
Source: Eurostat, UOE and population statistics (data extracted July 2008).

PARTICIPATION
102
Additional notes (Figure C8) Belgium: Data exclude independent private institutions. Ireland and Sweden: Participation data is from 2005. United Kingdom: ISCED 4 is included in ISCED 3 vocational. Explanatory note This indicator shows the number of students, full-time and part-time, enrolled in general and pre-vocational upper secondary education as a proportion of all students in upper secondary education in the region. All standard education programmes are included, as well as all adult education with subject content similar to standard education programmes or leading to qualifications similar to corresponding standard programmes. All special education is included. Apprenticeship programmes are included, but not entirely work-based education or training for which no formal education authority has oversight. The regions are defined in accordance with the NUTS classification (see the Glossary and Statistical Tools section). The NUTS 1 level is used in all countries with the exception of Bulgaria, the Czech Republic, Ireland, Portugal, Slovakia, Finland and Sweden where the NUTS 2 level is used.
The greatest disparity between regions can be found in the larger European countries: in Germany the percentages in the regions range from 29.5 % (Sachsen) to 49.6 % (Nordrhein-Westfalen); in France they fluctuate between 52.4% in the overseas départements to 64.1 % in Île de France; and in the United Kingdom, with a greater proportion of students enrolled in general rather than vocational secondary education in Northern Ireland (65.3 %) compared with London (52.6 %) or North East region (52 %) than in the rest of the United Kingdom.
MORE MEN THAN WOMEN ARE _______________________ IN VOCATIONAL EDUCATION _______________________
At European level there is a relative balance between students in vocational and general education, nevertheless high variations exist between individual countries. In Belgium, Luxembourg, the Netherlands, Romania, Slovenia and Finland vocational education students account for more than 60 % of all students in upper secondary education. Exceptionally high participation rates in vocational upper secondary education (more than 70 % of all students) are found in the Czech Republic, Austria, Slovakia and Liechtenstein.
However, in Cyprus, Lithuania and Hungary, the proportion of students in general upper secondary education is greater than 70 % and in Estonia, Ireland, Greece, Latvia and Portugal it is between 60 and 70 %.
When participation rates are broken down by sex, this pattern is seen to be particularly marked for men. Male enrolment rates in vocational streams are universally higher, with almost all countries showing a difference of at least 10 percentage points between the participation of young men compared to women in vocational streams. The situation in Bulgaria, Estonia, Italy, Malta and Poland is especially striking, where male participation is 20 points higher than that of woman (although the overall participation rate in vocational training is almost the same as in general education). Especially high (more than 70 %) male participation in vocational education is registered in the Czech Republic, Italy, Austria, Romania, Slovenia, Slovakia and Liechtenstein. Only Belgium, Spain, the Netherlands and the United Kingdom show a relatively balanced distribution by sex, with a difference amounting to less than 5 percentage points.

PARTICIPATION
103
Figure C9: Distribution of upper secondary (ISCED 3) students
by programme type (general or vocational) overall and by sex, 2006
General Vocational a Males + females b Males c Females
a. Total EU-27 BE BG CZ DK DE EE IE EL ES FR IT CY LV LT LU HU MT NL AT PL PT RO SI SK FI SE UK IS LI NO TR
48.3 30.5 46.0 20.7 52.3 40.6 69.1 66.6 66.1 57.5 56.9 39.5 86.7 65.7 74.3 37.1 76.3 53.1 32.5 22.1 56.0 68.5 35.1 33.8 26.3 34.6 44.9 58.3 63.3 26.2 40.0 63.7
51.7 69.5 54.0 79.3 47.8 59.4 30.9 33.4 33.9 42.5 43.1 60.5 13.3 34.3 25.8 62.9 23.7 46.9 67.5 77.9 44.0 31.5 64.9 66.2 73.7 65.4 55.1 41.7 36.8 73.8 60.0 36.3
b. Males EU-27 BE BG CZ DK DE EE IE EL ES FR IT CY LV LT LU HU MT NL AT PL PT RO SI SK FI SE UK IS LI NO TR
43.0 29.3 35.8 16.2 44.7 35.1 57.9 68.5 59.0 54.9 51.2 28.9 78.3 58.2 68.0 33.5 71.2 44.0 30.6 17.9 46.1 62.3 27.9 27.5 21.3 31.4 41.2 59.4 56.3 19.1 33.9 60.5
57.1 70.7 64.2 83.8 55.3 64.9 42.1 31.5 41.0 45.1 48.8 71.1 21.7 41.8 32.0 66.5 28.8 56.0 69.4 82.1 53.9 37.7 72.1 72.5 78.7 68.6 58.8 40.6 43.8 80.9 66.1 39.5
c. Females EU-27 BE BG CZ DK DE EE IE EL ES FR IT CY LV LT LU HU MT NL AT PL PT RO SI SK FI SE UK IS LI NO TR
53.7 31.7 57.0 25.3 59.3 46.8 79.6 64.8 73.9 59.8 62.7 50.6 95.5 73.0 80.5 40.6 81.5 63.4 34.4 26.8 67.0 74.0 42.4 40.3 31.4 37.5 48.0 57.2 69.7 36.8 46.6 67.9
46.3 68.3 43.0 74.7 40.7 53.2 20.4 35.2 26.1 40.2 37.3 49.4 4.5 27.0 19.5 59.4 18.5 36.6 65.6 73.3 33.0 26.0 57.6 59.7 68.6 62.5 52.0 42.8 30.3 63.3 53.4 32.1
Source: Eurostat, UOE (data extracted July 2008).
Additional notes Belgium: Data exclude independent private institutions. United Kingdom: Pre-vocational is included in vocational. ISCED 4 is included in ISCED 3 vocational.
Explanatory note This indicator shows the number of males and females enrolled in general and vocational upper secondary education as a proportion of all students in upper secondary education (ISCED 3). Pre-vocational education is included in general education. The data collection on enrolments covers national education systems regardless of ownership of institutions. All standard education programmes are included, as well as all adult education with subject content similar to standard education programmes or leading to qualifications which are similar to corresponding standard programmes. All special education is included. Apprenticeship programmes are included, but not entirely work-based education or training for which no formal education authority has oversight. Vocational education covers education that prepares participants for direct entry, without further training, into specific occupations. General programmes are not designed for a specific class of occupations, and less than 25 percent of the programme content is vocational or technical. Pre-vocational programmes have at least 25 percent vocational or technical content, but are mainly designed to introduce participants to the world of work and do not lead to a relevant vocational or technical qualification. Both full-time and part-time students are included; the table shows head-counts.

PARTICIPATION
104
PARTICIPATION DECLINES AFTER ________________ COMPLETION OF COMPULSORY EDUCATION ________________
Compulsory education generally comes to an end with the completion of lower secondary education or, in some countries, during the upper secondary phase. The upper age limit for compulsory education varies from one country to another (Figure B1) and should be kept in mind when analysing the participation rates which are shown in total and by gender at three different points in time: at the end of compulsory education and one and two years later.
For European countries with available data, participation rates decline at different rates at the end of compulsory education. Participation rates decline particularly slowly in the Czech Republic, Ireland, Latvia, Lithuania, Austria, Poland, Slovenia, Finland, Sweden, Liechtenstein and Norway: in these countries, they still exceeded 85 % in the second year after the end of compulsory education. In contrast, in Germany, Malta and the United Kingdom less than 50 % of young people are still enrolled in education two years after the end of compulsory education.
In most countries, young women stay in education longer than young men. This trend is particularly marked in Belgium, Spain, Ireland, Romania and Iceland, where two years after the end of compulsory schooling, female participation rates were around ten percentage points or higher than those of young men. On the other hand, in Bulgaria, the Czech Republic, Malta and Sweden male participation rates are slightly higher than those of young women. The difference between the sexes is even more pronounced when the data from the first and the second year after the compulsory participation are compared. In Belgium, Greece, Latvia, Lithuania, Portugal, Romania, Iceland and Norway the participation gap between the sexes increases by more than 3.5 percentage points in the second year compared with the first year after the end of compulsory education. Additional notes (Figure C10) Belgium: Data exclude independent private institutions. Ireland: The leaving age for compulsory education was raised to 16 following the Education Welfare Act 2000, with effect from 5 July 2002. Cyprus and Liechtenstein: Most tertiary students study abroad and are not included in the enrolment data but are included in the population data. Thus the indicator is underestimated. Luxembourg: Most tertiary students study abroad and are not included. Also many pupils at ISCED 2 and 3 study abroad and are not included in enrolment figures but are in population data; therefore all participation rates by age are underestimated. In ISCED 5, data by age are missing. Hungary: Compulsory education for pupils who began their first primary school year on 1 September 1998 or later lasts until the end of the school year in which they turn 18 years of age.
Explanatory note This indicator shows the enrolment rates in education (all ISCED levels) for each country, at the end of compulsory education. Both full-time and part-time students are included; the table shows head-counts.
The data collection on enrolments covers the whole education system regardless of ownership of institutions. All standard education programmes are included, as well as all adult education with subject content similar to standard education programmes or leading to qualifications which are similar to corresponding standard programmes. All special education is included. Apprenticeship programmes are included, but not entirely work-based education or training for which no formal education authority has oversight.

PARTICIPATION
105
Figure C10: Participation rates, overall and broken down by sex,
following compulsory education, 2006
Women Men Women + Men Age of end of compulsory education
Source: Eurostat, UOE and population statistics (data extracted July 2008).

PARTICIPATION
106
ON AVERAGE, A 5-YEAR-OLD CAN EXPECT TO REMAIN IN EDUCATION FOR _______________________________ 17 YEARS _______________________________
The expected duration of education is an estimate of the number of years a typical 5-year-old child can expect to be enrolled in the education system during his or her lifetime if current enrolment patterns remain unchanged. The expected duration of education may be used to predict future enrolment patterns in accordance with current models, and it is a means of cross-country comparison of participation rates in education.
The number of years of education that a 5-year-old child can expect to receive during his or her lifetime ranges from around 14 in Cyprus, Luxembourg and Malta (although many young people from these countries study abroad and are not included in the data) to 19 in Belgium, Sweden and Iceland. The expected duration of education is the highest in Finland with more than 20 years in education. Finally, Turkey is the only country where the expected duration of education is less than 13 years.
In comparison with 2002 (see Key data on Education in Europe 2005) there is a group of countries where the expected duration of education increased by more than a year; these include Bulgaria, Cyprus, Latvia, Lithuania, Hungary, Slovakia, Finland and Iceland.
These data should be interpreted with reference to the duration of compulsory education (Figures B1 and B13), the tendency of people to remain in education (Figure C 2), the extent to which pupils or students re-take particular years of school or study, the proportion of part-time enrolments and the provision of some types of adult education programmes.
Figure C11: Expected duration of education for 5-year-olds (ISCED 0 to 6), 2006
Years Years
EU-27 BE BG CZ DK DE EE IE EL ES FR IT CY LV LT LU HU MT NL AT PL PT RO SI SK FI SE UK IS LI NO TR 17.2 19.6 15.6 17.2 18.9 17.5 18.2 17.2 17.9 17.2 16.7 17.0 14.7 17.8 18.0 14.4 17.8 15.0 17.6 16.5 17.8 16.7 15.6 17.9 16.1 20.3 19.9 16.3 19.9 16.1 18.3 12.5
Source: Eurostat, UOE and population statistics (data extracted July 2008).
Additional notes Belgium: Data exclude independent private institutions. Germany: Advanced tertiary education research programmes (ISCED level 6) are excluded. Ireland: There is no public-sector provision at ISCED level 0. Many children follow a pre-primary curriculum in private institutions but data are lacking for the most part. Cyprus, Malta and Liechtenstein: Tertiary students studying abroad are not included Luxembourg: Most students in tertiary education study abroad and are not included. Many people enrolled at other ISCED levels also study abroad and are thus included in population data but not in enrolment data. In the case of ISCED level 5, data by age are lacking. United Kingdom: Only students participating in courses equal to or longer than a semester are included at ISCED levels 3 and 4.

PARTICIPATION
107
Explanatory note (Figure C11) The expected duration of education is an estimate of the number of years a typical 5-year-old child can expect to be enrolled in the education system during his or her lifetime if current enrolment patterns remain unchanged. Adding single-year net enrolment rates (expressed in years) gives us an estimate of the duration in years for the period covering those ages. Adding the single-year enrolment rates for all ages gives us an estimate of the expected number of years of education over a lifetime. This type of estimate will be accurate if current patterns of enrolment remain unchanged. Estimates are based on head-count data, meaning that there is no distinction between part-time and full-time studies. The net enrolment rates are calculated by dividing the number of pupils or students of a particular age or age group (corresponding to ISCED 0 to 6) by the number of persons of the same age or age group in the population. For students whose age is 'unknown', the net enrolment rate has been estimated by dividing these students by the total population aged 5-64 and multiplying by 60 (years).
OVER 17 % OF ALL PARTICIPANTS IN EDUCATION ARE ____________________ TERTIARY EDUCATION STUDENTS ____________________
In 2006, almost 19 million students were enrolled in tertiary education (ISCED 5-6) in the European Union, representing a little more than 17 % of those enrolled in education (at ISCED levels 0-6). Over the recent period, this percentage has been increasing from 15.6 % in 2002 to 17.4 % in 2006.
This indicator reflects a great variety of scenarios among countries which must be analysed in conjunction with the demographic profile (Figures A3 and C13), the structure of education (for example, the provision of pre-primary education, the variable duration of compulsory education and tertiary education, Figure B1), the number of places available in tertiary education institutions and possible restrictions on admission (Figure B14). In particular, a population experiencing a strong increase in the number of pupils of school age may normally be expected to have a lower percentage of students in tertiary education.
The highest proportion of tertiary level students is in Greece and also in the Baltic States, Poland, Slovenia and Finland where they account for more than a fifth of those enrolled in education. In contrast, it accounts for less than 10 % in Liechtenstein and Luxembourg and slightly over 10 % in Malta. The position in these countries and also Cyprus (12.4 %) is largely attributable to the fact that the majority of students in these countries study abroad (Figure C19). In the other countries, the percentage of students varies around the EU average, between 13.6 % (Germany) and 19.8 % (Spain).
In many countries, most of the students enrolled in tertiary education are aged between 20 and 22 (Figure C15).
Figure C12: Students in tertiary education (ISCED 5 and 6) as a percentage of all pupils and students, 2006
EU-27 BE BG CZ DK DE EE IE EL ES FR IT CY LV LT LU HU MT NL AT PL PT RO SI SK FI SE UK IS LI NO TR 17.4 14.0 17.4 15.7 16.4 13.6 21.0 17.9 29.9 19.8 14.7 18.2 12.4 24.4 22.8 2.9 19.3 10.3 15.8 15.0 22.6 17.3 18.6 25.7 16.1 22.3 17.4 17.0 16.3 9.1 17.5 13.9
Source: Eurostat, UOE (data extracted July 2008).

PARTICIPATION
108
Additional notes (Figure C12) Belgium: Independent private institutions are not included. Germany: ISCED level 6 is not included. Cyprus, Luxembourg and Liechtenstein: Most students study abroad and are not included. Luxembourg: Data are underestimated as they do not cover all ISCED 5A and ISCED 5B programmes. United Kingdom: Only students participating in courses equal to or longer than a semester are included at ISCED levels 3 and 4. Explanatory note All (full-time and part-time) students at ISCED levels 5 and 6 are included. The denominator consists of all pupils and students enrolled in the education system of each country (ISCED 0-6).
THE NUMBER OF TERTIARY EDUCATION STUDENTS IN EUROPE
__________________ INCREASED BY 25 % FROM 1998 TO 2006 __________________
Over the period 1998 to 2006, the student population in tertiary education has continued to rise steadily in the European Union. In all, the number of students in the European Union grew in these years by 25 % (2.8 % annual growth rate) and henceforth amounts to 18.7 million individuals.
During this time, almost all Central and Eastern European countries (except Bulgaria), the Baltic States, Greece, Sweden, Iceland and Turkey recorded a very significant rise in the number of students. In all these countries, their numbers have increased by at least 50 % over the period, more than doubling in the case of Romania and Lithuania. Nevertheless for most of them the rate of increase has tended to diminish during the latter years. Indeed in Malta and Sweden the number of students even dropped slightly in this period. While a decrease in the number of students can be observed in recent years in Luxembourg following a dynamic period up to 2003, during the last three years in Liechtenstein the number of students actually increased by more than 40 %.
In most western European and some Nordic countries, the increase in the number of students has been limited and rests below the EU-27 average in Belgium, Germany, Spain, France, Italy, Austria, Portugal and to a lesser extent in Finland, the United Kingdom and Norway. Over the whole period, the number of students may be considered almost stable in Spain, Austria and Portugal, due in both cases to a period of decline over several years.
In Bulgaria the number of students has decreased over the whole period particularly up to 2002. Since then the trend is again positive but this has not yet compensated for the loss observed during the first phase.
In the remaining countries (Denmark, Ireland and the Netherlands) the number of students has been growing at a rate similar to the EU-27 average even if the trend seems to level off at the end of the period in Denmark and Ireland.

PARTICIPATION
109
Figure C13: Trends in the index, of student numbers
in tertiary education (ISCED 5 and 6), 2002-2006 (compared to 1998)
(1998=
100) EU- 27 BE BG CZ DK DE EE IE EL ES FR IT CY LV LT LU HU MT NL AT PL PT RO SI SK FI SE UK IS LI NO TR
2002 114 104 88 132 107 103 141 123 141 105 100 99 128 157 154 162 139 126 112 90 160 113 161 146 135 114 136 116 143 : 108 1152003 118 107 88 133 110 107 148 127 150 105 105 102 169 169 174 168 153 155 114 93 167 114 179 149 140 117 148 118 165 90 116 1312004 121 110 88 148 118 111 152 132 160 105 107 106 192 182 190 : 166 136 118 96 172 112 190 153 146 120 153 116 182 108 117 1352005 123 111 91 156 127 108 157 131 173 104 108 108 185 186 203 : 171 164 122 99 178 108 205 165 161 122 152 118 187 107 117 1442006 125 112 93 157 125 109 159 130 175 102 109 109 190 187 206 147 172 155 126 102 180 104 232 169 175 124 151 121 194 130 117 160
Source: Eurostat, UOE (data extracted July 2008). Additional notes EU-27: 1998 includes 1999 data for Belgium, Cyprus and Malta. Belgium: Independent private institutions are not included. Germany: ISCED level 6 is not included. Cyprus, Luxembourg and Liechtenstein: Most students study abroad and are not included. Luxembourg: Data are underestimated as they do not cover all ISCED 5A and ISCED 5B programmes. Explanatory note The annual growth index is calculated by dividing the number of students for the year concerned by the number of students in 1998, and multiplying the result by 100. 1998 = 100 except in the case of Belgium, Cyprus, Malta and Turkey (1999) and Liechtenstein (2000). All (full-time and part-time) students at ISCED levels 5 and 6 are included.

PARTICIPATION
110
THE DENSITY OF THE TERTIARY STUDENT POPULATION _____________________ IN SOME REGIONS IS VERY HIGH _____________________
The high density of the student population in some regions becomes apparent when the proportion of students in tertiary education within a particular region is compared with the proportion of the total population in the same region. From the comparison it is clear that some regions attract a proportion of students that is far greater than the regional share of the total population, whereas in others the corresponding proportion is very modest compared to the demographic strength of the region concerned. The indicator is derived from data on where students are studying, and not on where they come from or live. Consequently regions with universities and other tertiary education institutions – often in big towns or cities – invariably score over 1. This is strongly indicative of the uneven regional distribution of the tertiary education infrastructure and its corollary, interregional student mobility.
In several countries, some regions (according to NUTS 2) have relatively few students indeed compared to the size of their population. In Bulgaria (Severozapaden), the Czech Republic (St�ední �echy which belongs to the catchment area of Prague), Greece (Notio Aigaio), the Netherlands (Drenthe), and Austria (Vorarlberg) the regional proportion of students does not exceed one tenth of the regional share in the total population. At the other extreme, some regions containing extensive urban areas or – more often than not – capital cities attract students in very large numbers. In Belgium (Brussels), the Czech Republic (Prague), Germany (Bremen), the Netherlands (Groningen), Austria (Vienna), Romania (Bucharest) and Slovakia (Bratislava), the proportion of the student population is over twice as high as their share of the total population.
Additional notes (Figure C14) Belgium: Independent private institutions are not included. Germany and Romania: ISCED level 6 is not included. Cyprus: Most students in tertiary education study abroad and are not counted in the enrolment data but are included in the population data. The ratio is thus an underestimate. Ireland: Only full-time regional enrolments are available. Ireland, Greece and Sweden: Participation data from 2005. United Kingdom: Participation data from 2004. Explanatory note In this indicator ‘the proportion of the country’s tertiary education students (ISCED 5 and 6) enrolled in the region’ is divided by ‘the proportion of the country’s population in the region’. A region will therefore score more than 1 if it is over-represented in terms of its student population and below 1 if it is under-represented in either case with respect to the regional share of the total population. All (full-time and part-time) students at ISCED levels 5 and 6 are included. Enrolment data relate to the 2005/06 academic year, and population data to 1st January 2006 except for the indicated countries. As a result, the indicator tends to reflect the uneven distribution of tertiary education institutions across the regions more than regional differences in participation in tertiary education. The regions are defined in accordance with the NUTS classification (see the definition of statistical tools in the Glossary). The NUTS 1 level is used in all countries with the exception of Bulgaria, the Czech Republic, Ireland, Portugal, Slovakia, Finland and Sweden where the NUTS 2 level is used.
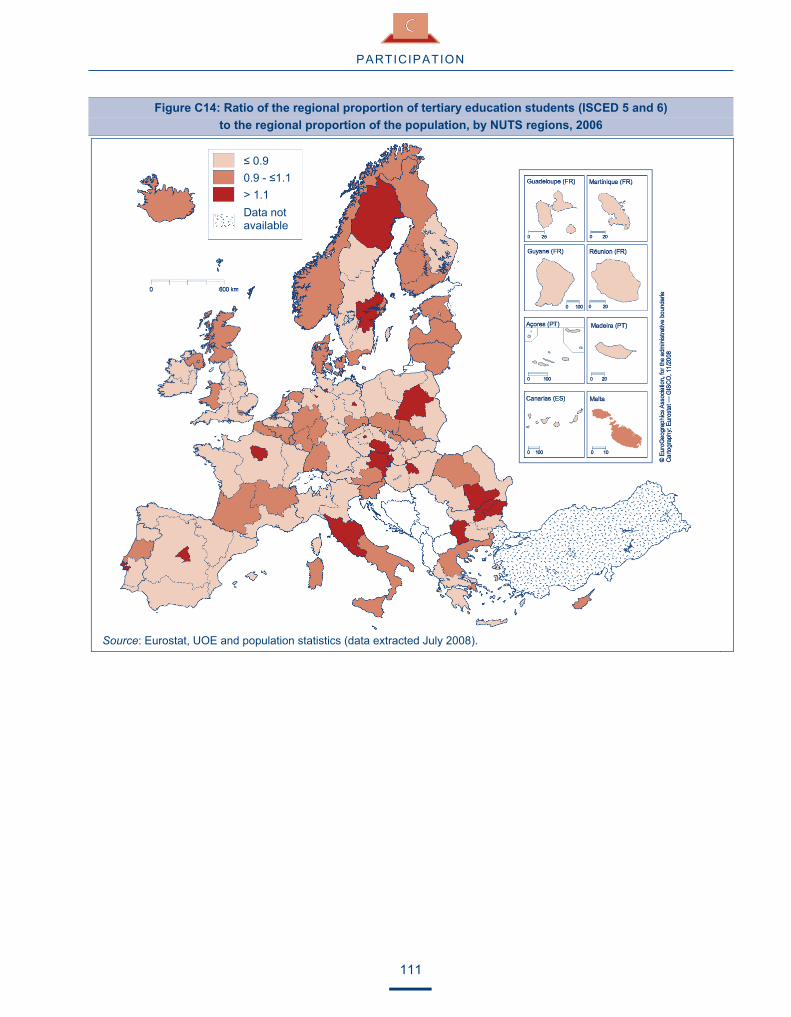
PARTICIPATION
111
Figure C14: Ratio of the regional proportion of tertiary education students (ISCED 5 and 6)
to the regional proportion of the population, by NUTS regions, 2006
Source: Eurostat, UOE and population statistics (data extracted July 2008).
� 0.9 0.9 - �1.1 > 1.1
Data not available

PARTICIPATION
112
A THIRD OF ALL 20 TO 22-YEAR-OLDS ARE ________________________ IN TERTIARY EDUCATION ________________________
The participation rate in tertiary education strongly depends on the age group of the population concerned. In all countries, it reaches its peak for the population aged 20-22 and to a lesser extent 24, as in Denmark. In the EU-27, approximately one third of the population aged 20-22 is enrolled in tertiary education. In contrast, the rate amounts to 15 % for 18-year-olds and drops quickly after the age of 24.
However, there are different patterns in the breakdown by age of students in different countries underlining national differences in terms of education systems and, in particular, the age when young people transfer from ISCED level 3 to ISCED level 5 and the duration of studies at ISCED 5. Peaks in participation rates thus occur at different ages and their values then decrease more or less sharply, depending on particular ages and countries.
Approximately one third of the population aged 18 participates in tertiary education in Belgium, Ireland and to a lesser extent in Spain and France. At the other end of the spectrum, the rate of participation in tertiary education still exceeds 10 % of the population aged 28 in the Nordic countries and Germany. In Latvia, Finland, Sweden and Iceland, more than 5 % of the population aged 35-39 still participates in tertiary education (EU-27 average: 2.0).
In countries such as Belgium, Ireland, Greece, France, Cyprus, Malta, Slovakia, the United Kingdom, Liechtenstein or Turkey, the participation rate drops off sharply after age 22 and does not amount to more than 15 % of the population aged 24. In Denmark, Slovenia, Finland and Sweden and to a lesser extent Iceland and Norway, more than 30 % of the population aged 24 is still enrolled in tertiary education. In comparison with other countries, in the Nordic countries (Denmark, Finland, Sweden, Iceland and Norway) this rate remains at a relatively high level for the population aged 24 and over. Germany follows the same pattern, even if at a lower level, showing a bell-shaped curve.
With respect to age, changes in participation rates for men and women in tertiary education follow a similar pattern in most countries. Almost everywhere, with the exception of Germany, Luxembourg, the Netherlands, Austria and Portugal, the rates for young men and women reach their highest levels at the same age. In these five countries, participation among men peaks two years later than for women. This is partly due to the fact that men are obliged to complete their military or civil service (except in Luxembourg and the Netherlands where neither exists). Cyprus is the only case where the rate for women reaches its peak at 18.
Between 18 and 39 years old, participation rates for women are usually higher than those for men, a difference that is especially marked in the Baltic States, in Slovenia and Iceland whereas in Germany, Greece, Cyprus, Luxembourg, the Netherlands and Austria there is not much difference. Liechtenstein and Turkey are the only exceptions where men outnumber women in all age categories.
Differences in participation rates between men and women decrease with age to a point where they become virtually non-existent. Nevertheless, in some countries, the participation rate among men is higher than the rate for women after the age of 22, particularly in Germany, Greece, Cyprus, Luxembourg, the Netherlands and Austria. Nevertheless, it is worth noting that for the population aged 18, the female tertiary education enrolment rate exceeds the rate for males by 4 or 5 times in Germany, Cyprus and Austria.

PARTICIPATION
113
Figure C15: Participation rates in tertiary education (ISCED 5 and 6) by age and by sex, 2006
Women Men Total Source: Eurostat, UOE (data extracted July 2008). Additional notes Belgium: Independent private institutions are not included. Germany, Italy and Poland: ISCED level 6 is not included. Ireland: The 30-34 age group includes those aged 35 and over. Greece: The high participation rate is partly attributable to the number/high proportion of Cypriot students in Greece. Cyprus: Most tertiary students study abroad and are not included. Luxembourg: Partial coverage. The data is underestimated as coverage of ISCED 5A and ISCED 5B programmes is partial. Poland: Age 18 – ISCED 5: enrolment data include those aged 17. Age 26 and 28 – ISCED 5B: enrolment data missing. Age 30-34 – ISCED 5: enrolment data include those aged 35 and above. Liechtenstein: Most students study abroad and are not included. Explanatory note
The number of male and female students at specific ages or in specific age groups are divided by the numbers of males and females at the corresponding age or in the corresponding age groups in the total population. All (full-time and part-time) students at ISCED levels 5 and 6 are included.

PARTICIPATION
114
IN MOST COUNTRIES MORE WOMEN THAN ________________ MEN PARTICIPATE IN TERTIARY EDUCATION _________________
In almost all European countries, more women than men enrol in tertiary education. For the EU-27 in 2006, there were, on average, 123 women enrolled for every 100 men. In Germany and to a lesser extent in Greece, Cyprus, Luxembourg and the Netherlands, the distribution of women and men is rather balanced. In all other countries there were more than 115 women for every 100 men enrolled in tertiary education. This numerical superiority is the highest in the Nordic (Sweden, Iceland and Norway) and Baltic States where more than 150 women are enrolled for every 100 men. In Belgium, Ireland, France, Portugal and Romania the ratio corresponds to the EU average. Nevertheless it is worth noting that differences in participation rates between men and women decrease with age to a point where they become virtually non-existent (Figure C15).
Apparent since the mid-1970s, this trend has been evolving favourably particularly since 1998 (see Key Data on Education in Europe 2005) and over the recent period (2002-2006) the average EU-27 ratio has still further increased from 119 to 123.
Whereas the majority of countries have not experienced much change during this recent period (2002-2006), Slovakia (from 109 to 136) but also the Czech Republic, Hungary and Liechtenstein and to a lesser extent Belgium and Latvia have shown a significant increase in the number of women enrolled for every 100 men. In contrast it fell in Cyprus, Luxembourg and Portugal. Despite its very low ratio, Turkey experienced a very limited change.
The fact that more women than men enrol in tertiary education may be attributable to the increased activity of women in the workforce and labour market qualification requirements. However, other factors of an educational nature may also be relevant. The participation rate of girls one or two years after the notional age for the completion of compulsory education is higher than for boys in many countries (Figure C10) whereas the percentage of boys who receive vocational upper secondary education qualifying them for direct entry to the labour market (and who are thus less likely to embark on tertiary education) is generally higher than in the case of girls (Figure C9).
The majority representation of women in tertiary education clearly has an impact on the number of women graduates for every 100 men (Figure F5).

PARTICIPATION
115
Figure C16: Trends in the number of women per 100 men enrolled in tertiary education (ISCED 5 and 6), 2002-2006
EU- 27 BE BG CZ DK DE EE IE EL ES FR IT CY LV LT LU HU MT NL AT PL PT RO SI SK FI SE UK IS LI NO TR
2002 119 113 117 105 135 96 159 123 105 113 121 129 121 160 153 : 124 132 103 111 138 133 119 136 109 118 147 123 172 : 148 71 2003 120 114 112 103 138 98 160 126 104 113 122 129 98 161 150 114 131 132 104 113 137 130 119 128 113 115 147 127 175 37 148 70 2004 121 116 110 105 137 98 162 123 107 117 122 128 92 165 150 : 134 127 104 114 136 128 121 132 118 115 147 133 182 36 147 71 2005 122 119 109 111 135 98 160 122 105 116 123 130 108 172 151 : 140 129 104 116 135 126 120 137 124 115 148 134 185 41 147 72 2006 123 121 115 117 135 99 160 123 104 117 124 132 104 173 149 107 141 133 105 117 135 123 124 140 136 117 147 134 180 44 148 73
Source: Eurostat, UOE (data extracted July 2008).
Additional notes Belgium: Independent private institutions are not included. Germany: ISCED 5A part-time students included for the first time (3.8 % of ISCED 5A). Germany and Romania: ISCED level 6 is not included. Greece: Programmes supervised by ministries other than the Ministry of Education are reported for the first time. Spain: Data include for the first time students in ISCED 5A-second degrees of more than 6 years duration. Cyprus and Liechtenstein: Most students study abroad and are not included. Luxembourg: The data is underestimated as coverage of ISCED 5A and ISCED 5B programmes is partial. Explanatory note All (full-time and part-time) students at ISCED levels 5 and 6 are included. The ratio of the number of women for every 100 men enrolled in tertiary education has been calculated by dividing the number of female students enrolled by the corresponding number of male students and multiplying the result by 100.

PARTICIPATION
116
THE SHARE OF OLDER STUDENTS IS INCREASING __________ IN MANY COUNTRIES BUT SIGNIFICANT VARIATIONS REMAIN __________
In 2006, 70 % of full-time students in tertiary education in the European Union were between 18.7 and 27 years old and half are older than 21.5. The situation remains globally stable in comparison with 2002 (Key data on Education in Europe 2005). Nevertheless the breakdown of the student population by age varies very widely throughout Europe and the median age for students ranges from 19.9 in Belgium to 24.9 in Denmark. In some countries, the age range is fairly limited and most students are relatively young (Belgium, Bulgaria, Ireland, Lithuania, Hungary, Malta, The Netherlands, Poland, Slovenia and Slovakia), whereas in other countries the spectrum is much broader and may include much higher age groups. This pattern is typical of most of the Nordic countries, Portugal and to a lesser extent Italy and Liechtenstein. At least 15 % of full time students in tertiary education are older than 30 in Denmark, Estonia, Portugal, Sweden, Iceland and Norway. In Iceland, 15 % of students are aged over 35.8.
Figure C17: Distribution by age of full-time students in tertiary education (ISCED 5 and 6), 2006
Ages Ages
� Percentile 15 Median age � Percentile 85
EU-27 BE BG CZ DK DE EE IE EL ES FR IT CY LV LT LU HU MT NL AT PL PT RO SI SK FI SE UK IS LI NO TR� 18.7 18.0 18.8 19.4 21.3 20.1 18.9 18.0 18.0 18.6 18.3 19.0 18.2 18.8 18.5 : 18.6 19.4 18.3 : 18.9 19.0 18.6 18.9 18.9 20.2 20.3 18.0 20.9 20.3 20.0 18.2
21.4 19.9 20.8 22.0 24.9 23.4 21.7 20.0 20.5 21.7 20.7 22.0 20.8 21.0 20.3 : 20.6 21.3 20.9 : 20.8 22.2 21.1 21.1 20.6 22.9 23.5 20.1 24.6 23.4 23.4 20.9� 27.0 23.2 24.0 27.8 32.9 28.6 31.2 24.4 28.2 27.2 25.6 29.1 25.1 27.9 22.9 : 23.4 24.1 24.4 : 22.9 30.4 25.9 23.9 22.9 29.0 32.9 26.4 35.8 28.7 33.8 26.8
Source: Eurostat, UOE (data extracted July 2008). Additional notes Belgium: Independent private institutions are not included. Germany and Romania: ISCED level 6 is not included. Cyprus and Liechtenstein: Most students study abroad and are not included. Explanatory note The median age is the age that divides the student population precisely into two halves. The age corresponding to percentile 15 of the population is the age that divides students into two groups such that 15 % of them are younger than that age and 85 % of them are older.
In Denmark and Iceland the population under 21 represents approximately 15 % of the overall student population whereas in Belgium, Bulgaria, Ireland, Greece, Cyprus, Latvia, Lithuania, Hungary, the Netherlands, Poland, Slovakia, the United Kingdom and Turkey, more than 50 % of tertiary students are under 21. Lithuania, Poland and Slovakia are the countries where the student population is the most homogeneous, over 85 % of them being under 23.
In comparison with 2002, the share of older students has tended to increase in most countries, particularly in those where their numbers were limited. In contrast it decreases in Germany, a country characterised in 2002 by a significant number of older students (P85 decreases from 31.6 to 28.6 between 2002 and 2006) and to a limited extent in Finland and Sweden.

PARTICIPATION
117
When part-time students are taken into account (Figure C15), the age spectrum in tertiary education becomes even more marked.
The reasons for such age differences among full-time students between the various countries are numerous and complex and may be linked to structural factors. They include the fact that secondary education is completed at different ages, the length of tertiary education programmes (Figure B1), the customary financial independence of students, which is encouraged by public policies for financial assistance (Figure D18), the existence of active policies to encourage those who have already gained experience in the workplace (and who are thus typically older than most students) to enrol for tertiary education, the time given over to experience abroad and, finally, the obligation to do military service.
__________ LIMITED CHANGES IN THE GENDER BALANCE SINCE 2002 ___________
Overall, women are in the majority in tertiary education but the breakdown in enrolments by sex varies considerably with the field of study and country concerned.
Women account for a very large majority of enrolments in three main fields of studies, namely 'education', 'health and welfare', 'humanities and arts'. In 'education' and 'health' they represent in the EU-27 approximately 75 % of the total number of students in tertiary education and this percentage has remained stable since 2002. In all countries they represent more than 66 % of the students, except in Turkey ('education' – 53 %, 'health' – 61 %) and Liechtenstein ('Health' – 21 %). In Estonia, they far outnumber men and reach 90 % of the population in these two fields. In the Nordic countries and Slovakia they represent more than 80 % of the population studying 'health'. In 'humanities', women are in the majority as well (66 % in average in the EU-27) but the situation varies a lot between countries. Whereas in Liechtenstein and Turkey women represent approximately 45 % of students in this field, they reach between 70 and 80 % of the population in the Baltic States, Italy, Cyprus, Poland, Slovenia and Finland.
In comparison with the previous subject areas, ‘social sciences business and law’ are a little behind, although the situation has improved slightly since 2002 (Key data on Education in Europe 2005). Women represent 58 % of the population in this field at tertiary level with large variations between countries. In Liechtenstein, men far outnumber women with more than 70 % of the population in this area and in Germany, Cyprus, the Netherlands and Turkey women still represent less than half of students. In the Baltic States, Hungary and Slovenia, women comprise approximately two thirds of students.
At the other extreme, men largely outnumber women in 'engineering, manufacturing, construction' and 'science, mathematics, computing' and the situation has not changed much since 2002. In 'engineering' (EU-27 average: 24 %) women do not represent more than 40 % of the student population in any country. Bulgaria, Denmark, Iceland and Liechtenstein (with 37 %) are the only countries where women represent more than 30 % whereas in Ireland, the Netherlands and Cyprus, the percentage of woman amounts to approximately 15 %. In 'science maths and computing' (EU-27 average: 37 %) the ratio is balanced in Bulgaria, Italy, Portugal and Romania but women represent only 15 % of this group in the Netherlands. In all other countries, men outnumber women and represent approximately 60 to 70 % of students in this field.
In the middle ground, gender balance is achieved in 'services' and 'agriculture and veterinary science' with little movement (slight increase in 'agriculture') since 2002. In 'services', a balance is reached or is about to be reached in many countries except in Denmark (22 %) and Turkey (31 %). Women represent more than 60 % of students in this field in Finland, the United Kingdom, Iceland (82 %), and to a lesser extent Hungary and Sweden. In 'agriculture', apart from Malta (18 %), almost all countries have achieved above 40 % of women students, with a special situation in Austria, Sweden and the United Kingdom which have reached 60 %.

PARTICIPATION
118
Figure C18: Percentage of women students enrolled in different fields of study
in tertiary education (ISCED 5 and 6), 2006
A B C D E F G H
A B C D E F G H
A Education B Humanities and arts C Social sciences, business and law D Science, mathematics, computing
E Engineering, manufacturing, construction F Agriculture and veterinary science G Health and welfare H Services
EU-27 BE BG CZ DK DE EE IE EL ES FR IT CY LV LT LU HU MT NL AT PL PT RO SI SK FI SE UK IS LI NO TR
A 75.3 73.3 68.0 75.3 70.9 68.5 90.3 77.9 : 78.2 75.5 87.3 87.8 85.3 77.8 : 72.5 78.0 74.1 74.6 72.9 82.2 74.8 80.1 75.3 80.6 75.8 74.1 83.4 : 74.2 52.7B 66.1 56.1 62.7 64.9 62.4 66.3 75.2 64.2 : 60.8 68.6 72.3 75.7 77.5 73.3 : 66.4 54.8 54.1 66.2 70.1 60.6 69.5 72.5 58.6 71.3 62.3 61.6 66.3 44.4 62.2 46.2C 58.2 53.3 60.3 61.1 50.4 48.7 65.5 56.3 : 58.8 61.4 57.2 47.8 66.7 67.9 : 65.2 56.6 46.8 55.3 62.4 59.4 61.8 65.9 63.1 62.7 61.0 55.2 58.8 28.0 56.4 44.8D 37.2 31.9 48.9 32.5 32.6 34.8 39.1 42.3 : 34.1 35.7 49.7 35.9 30.5 33.8 : 31.1 36.2 15.6 34.3 36.7 49.5 53.9 33.0 35.8 39.8 42.9 36.9 38.2 : 33.4 39.5E 24.4 24.2 31.8 24.0 32.9 18.2 27.3 16.4 23.6 28.0 23.4 28.3 14.0 20.8 25.2 : 18.7 29.1 15.0 21.3 27.1 25.7 29.7 24.1 28.5 18.8 27.8 19.8 32.0 37.1 24.0 18.6F 49.7 50.6 42.9 57.0 52.5 46.8 52.9 44.6 : 54.0 41.0 45.1 48.7 47.1 : 45.0 17.7 50.2 60.9 53.5 56.0 37.4 55.5 39.5 51.5 59.5 61.1 42.5 : 56.3 43.9G 74.2 72.1 67.4 74.5 80.4 73.6 89.1 79.3 : 76.0 71.2 65.6 69.1 86.1 84.5 : 76.3 68.5 73.5 66.8 73.2 77.1 66.8 79.7 81.4 84.4 80.6 78.2 86.8 21.4 80.6 60.8H 50.2 45.0 46.9 47.8 21.7 51.2 51.0 48.1 : 57.1 40.5 47.9 38.8 51.5 42.9 : 58.8 57.0 49.0 50.7 48.9 49.1 46.3 47.1 43.9 70.2 59.4 65.1 81.8 : 48.2 31.0
Source: Eurostat, UOE(data extracted July 2008). Additional notes Belgium: Independent private institutions are not included. Germany: ISCED level 6 is not included. Cyprus and Liechtenstein: Most students study abroad and are not included. Explanatory note This indicator is calculated by dividing the number of women enrolled in a given field of study by the total number of those enrolled in the same field, and then multiplying the result by 100.

PARTICIPATION
119
THE PERCENTAGE OF TERTIARY EDUCATION STUDENTS WHO STUDY __________ IN ANOTHER EUROPEAN COUNTRY HAS BEEN INCREASING __________
Across the European Union in 2006, around 2.6 % of those enrolled in tertiary education studied for at least a year in another EU Member State, a candidate country or one of the EFTA/EEA countries. This proportion has been increasing from 2.1 to 2.6 between 2002 and 2006. The statistics only include those enrolled for at least a year in a foreign university and are based exclusively on the nationality of students. This means that foreign students permanently resident in a host country are counted here as foreign students even though they have not moved abroad to study at tertiary level. Figure C19, therefore, provides no information about student mobility in the broad sense and should be interpreted with caution. Indeed, in the case of most countries, the data shown here do not take into account students who were involved in a European mobility programme.
Figure C19: Percentage of tertiary education students (ISCED 5 and 6) studying in another EU Member State, candidate country or EFTA/EEA country, 2002-2006
Source: Eurostat, UOE (data extracted July 2008).

PARTICIPATION
120
Data (Figure C19)
EU- 27 BE BG CZ DK DE EE IE EL ES FR IT CY LV LT LU HU MT NL AT PL PT RO SI SK FI SE UK IS LI NO TR
2002 2.1 2.4 6.0 1.6 2.6 1.9 3.0 7.4 8.6 1.1 1.9 1.6 52.2 1.3 2.2 66.0 1.7 12.4 1.7 4.7 1.0 2.3 2.1 1.7 6.4 3.1 2.4 0.5 15.3 : 4.6 2.12003 2.2 2.6 7.4 1.8 2.7 2.0 3.2 7.5 7.9 1.2 1.9 1.6 53.6 1.7 2.4 66.7 1.7 5.9 1.8 4.7 1.1 2.5 2.2 2.4 7.9 3.0 2.3 0.5 15.7 : 4.5 1.82004 2.2 2.6 8.6 1.8 2.5 1.9 3.5 8.5 7.3 1.2 2.0 1.6 54.8 1.6 2.3 : 1.5 8.4 1.8 4.7 1.2 2.7 2.4 2.1 8.2 2.9 2.2 0.6 15.5 : 4.8 1.82005 2.3 2.7 8.7 1.8 2.3 2.3 3.6 9.3 6.0 1.1 2.1 1.5 56.5 1.7 2.6 : 1.5 7.8 1.8 4.4 1.3 2.9 2.3 2.0 8.6 2.8 2.3 0.5 17.0 77.1 4.8 1.62006 2.6 2.5 8.9 2.0 2.6 2.8 4.1 13.8 5.5 1.3 2.4 1.7 53.2 2.2 3.0 80.9 1.7 10.0 2.1 4.6 1.6 3.7 2.3 2.1 10.2 3.0 2.7 0.7 17.4 73.6 4.9 1.6
Source: Eurostat, UOE (data extracted July 2008).
Additional notes Belgium: Independent private institutions are not included. Germany and Romania: ISCED level 6 is not included. Cyprus: The percentage of students studying in another EU-27/EEA country is underestimated as Cypriot students studying in Greece are not included (data on foreign students in Greece are missing). Luxembourg: Most tertiary students study abroad and are not included. Data is underestimated as coverage of ISCED 5A and ISCED 5B programmes is partial. Slovenia: ISCED level 6 is not included for the academic years before 2004/05. Explanatory note Students undertaking short periods of study (less than a full academic year) at tertiary education institutions in other countries and who remain enrolled in their home country institution and/or continue to pay their fees to it are not regarded as foreign students in the host country. For a given nationality, the number of students abroad is calculated by adding up the data provided for this nationality by the host countries. This number is then divided by the total number of students of this nationality (including those studying in their own country). The lack of data on the distribution of students by nationality in some countries leads to underestimates in the values for certain countries. Data on foreign students relate to citizenship. This means that permanent residents in a (host) country with citizenship of another country are counted and reported as foreign students in the data collection.
Apart from Liechtenstein, Cyprus and Luxembourg whose great majority of students study abroad because of the limited provision for tertiary education in their own country, Ireland, Malta, Slovakia, Iceland, and to a lesser extent Bulgaria are the five countries in which the greater proportion of students study abroad (approximately more than 9 to 10 %). Conversely, the United Kingdom (0.65 % – in progression since 2002) but also Spain, Italy, Hungary, Poland and Turkey are the countries in which the students are the least mobile (less than 2 % of students study abroad).
Over the latest period (2002-2006), the situation has remained broadly stable in ten countries (Belgium, Denmark, Italy, Cyprus, Hungary, Austria, Romania, Finland, Sweden and Norway) but there has been a decline in the proportion of students studying abroad in a few countries, most notably in Greece but also in Malta and Turkey. In all other countries for which data is available, the mobility of students has been improving, especially in Ireland, Latvia, Poland, Portugal and Slovakia. In these countries the proportion of mobile students increased by more than 60 %. Nevertheless, Latvia and Poland still remain under the EU-27 average whereas in Ireland and Slovakia more than 10 % of the students study abroad.
Such variations reflect the current trend in student numbers, the increased provision for tertiary education in some countries but also the determination of students to take advantage of opportunities available to them to study abroad, in particular, financial assistance such as extra support earmarked for mobility, portability of national financial support, etc.

121
R E S O U R C E S
SECTION I – INVESTMENT AND EQUIPMENT
PUBLIC EXPENDITURE ON EDUCATION AS PERCENTAGE __________________ OF GDP REMAINS STABLE SINCE 2001 ___________________
In the period 2001-2006, the overall proportion of EU-27 GDP given over to education remains stable around 5.1 %. However, this average rate hides disparities between countries some of which experienced significant changes during the period.
In Cyprus, Hungary and Iceland the proportion of GDP earmarked for education increased by over 20 % between 2001 and 2006. That growth was above 10 % also in the Czech Republic, Ireland, the Netherlands and the United Kingdom.
In 2006 the share of public expenditure on education was more than 5 % of GDP in just over half the European countries. In the Nordic countries and Cyprus it was even above 6 %. Elsewhere, public expenditure on education as a share of GDP was below 5 %.
Figure D1: Total public-sector expenditure on education (ISCED 0 to 6) as a percentage of GDP, 2006
EU-27 BE BG CZ DK DE EE IE EL ES FR IT CY LV LT LU HU MT NL AT PL PT RO SI SK FI SE UK IS LI NO TR
2001 5.0 6.0 3.8 4.1 8.4 4.5 5.3 4.3 3.5 4.2 5.9 4.9 5.9 5.6 5.9 3.7 5.0 4.5 5.1 5.8 5.4 5.6 3.3 5.9 4.0 6.0 7.1 4.6 6.2 : 7.2 2.7 2002 5.1 6.1 4.0 4.3 8.4 4.7 5.5 4.3 3.6 4.3 5.9 4.6 6.6 5.7 5.8 3.8 5.4 4.4 5.2 5.7 5.4 5.5 3.5 5.8 4.3 6.2 7.4 5.1 6.8 3.0 7.6 2.8 2003 5.1 6.1 4.2 4.5 8.3 4.7 5.3 4.4 3.6 4.3 5.9 4.7 7.3 5.3 5.2 3.8 5.9 4.7 5.4 5.6 5.4 5.6 3.5 5.8 4.3 6.4 7.3 5.2 7.7 2.5 7.5 3.0 2004 5.1 6.0 4.5 4.4 8.4 4.6 4.9 4.7 3.8 4.3 5.8 4.6 6.7 5.1 5.2 3.9 5.4 4.8 5.5 5.5 5.4 5.3 3.3 5.8 4.2 6.4 7.2 5.2 7.5 2.4 7.5 3.1 2005 5.0 6.0 4.5 4.3 8.3 4.5 4.9 4.8 4.0 4.2 5.7 4.4 6.9 5.1 4.9 3.8 5.5 6.8 5.5 5.5 5.5 5.4 3.5 5.7 3.9 6.3 7.0 5.4 7.6 2.3 7.0 : 2006 5.1 6.0 4.2 4.6 8.0 4.4 4.8 4.9 : 4.3 5.6 4.7 7.0 5.1 4.8 3.4 5.4 : 5.5 5.4 5.3 5.3 : 5.7 3.8 6.1 6.9 5.5 7.6 2.1 6.6 2.9
Source: Eurostat, UOE and National Accounts (data extracted June 2009).

R E S O U R C E S
122
Additional notes (Figure D1) EU-27: Estimated figures. Belgium: Expenditure does not include independent private institutions and the German-speaking Community. Denmark: 2001-2002: Expenditure on ISCED 4 is not included; 2005 and 2006: research/development expenditure is not included. Greece: 2001-2002: Allocated retirement pension costs are not included; 2003-2006: public sector student loans are not included. Cyprus: Financial support for students abroad is included. Lithuania: 2003-2006: Public sector transfers to ‘other private entities’ are not included. Luxembourg: 2001 and 2002: expenditure on ISCED 5 and 6 and allocated retirement pension costs are not included; 2003-2006: Public sector transfers to ‘other private entities’, expenditure on ISCED 4, 5 and 6 and on ancillary provision is not included. Poland and Slovakia: Expenditure on pre-primary childcare provision is included. Portugal: Local level expenditure and allocated retirement pension costs are not included; 2003-2006: Public sector student loans and ISCED 4 expenditure are not included. United Kingdom: GDP adjusted in line with the financial year which runs from 1 April to 31 March. Iceland: 2001-2002: expenditure on ISCED 0 is not included; 2003-2006: Expenditure on ISCED 5B and ancillary provision is not included. Liechtenstein: The GDP of Liechtenstein derives to a considerable extent from the work done by personnel domiciled abroad. In 2005, 48.1 % of people at work in Liechtenstein were cross-border commuters from abroad. For this reason, it is not possible to calculate per capita GDP on the basis of the resident population in Liechtenstein. GDP and GDP per capita represent underestimated proportions and cannot be directly compared with other countries. Norway: 2001-2002: expenditure on pre-primary childcare provision is included. Turkey: 2001-2003: expenditure on ISCED 0 is not included; 2000 and 2002: direct regional and local level expenditure is not included; 2003: public-sector transfers to ‘other private entities’ are not included; 2001 and 2003: regional and local level expenditure is not included. Explanatory note In general, the public sector funds education expenditure by assuming direct responsibility for schools' current and capital expenditure (direct public funding of schools) or by providing support for pupils/students and their families (public-sector grants and loans) and by subsidising training activities by the private business sector or non-profit associations (transfers to households and firms). Direct public funding of educational institutions and transfers to households and firms are included in total public expenditure on education. Total public expenditure on education is correlated with gross domestic product (GDP). That figure is multiplied by 100.
ALMOST 11 % OF TOTAL PUBLIC EXPENDITURE ______________________ IS ALLOCATED TO EDUCATION ______________________
In terms of the EU-27, public-sector investment in education remained stable overall in the 2001-2006 period with public expenditure on education representing around 11 % of total public expenditure. Although in 2006 some three-quarters of countries earmark more than 10 % of their public expenditure for education, only a few (Denmark, Estonia, Ireland, Cyprus, Lithuania, Iceland and Norway) come near to or exceed the 14 % threshold. In Germany, Italy and Luxembourg the percentage does not reach 10 %. When interpreting these figures, however, it should be noted that this indicator does not take into account the number of pupils/students and gives no information on the unit cost per pupil/student (Figure D4).
In the majority of countries for which data are available, the share of public expenditure on education in total public expenditure has stayed relatively stable since 2001, except in Bulgaria, the Czech Republic, Ireland, Slovakia and Iceland where it has increased significantly. Only the Baltic countries, France, Luxembourg and Portugal have recorded falls in the expenditure on education as a proportion of public expenditure.

SECTION I – INVESTMENT AND EQUIPMENT
123
Figure D2: Public expenditure on education (ISCED 0 to 6)
as a percentage of total public expenditure, 2006
EU-27 BE BG CZ DK DE EE IE EL ES FR IT CY LV LT LU HU MT NL AT PL PT RO SI SK FI SE UK IS LI NO TR
2001 10.9 12.2 9.4 9.2 15.6 9.4 15.1 12.8 7.7 11.0 11.5 10.1 15.6 16.3 16.0 9.8 10.6 10.4 11.2 11.2 12.4 12.6 9.0 12.4 9.0 12.7 12.8 11.6 14.6 : 16.3 : 2002 11.0 12.3 10.0 9.3 15.5 9.8 15.3 12.8 7.9 10.9 11.2 9.8 16.3 16.0 16.8 9.1 10.5 10.1 11.1 11.2 12.2 12.5 10.0 12.5 9.6 12.7 13.1 12.7 15.3 : 16.1 : 2003 11.0 11.8 10.5 9.5 15.1 9.7 15.2 13.2 8.0 11.1 11.1 9.8 16.2 15.3 15.6 9.0 11.9 9.8 11.5 10.8 12.0 12.2 10.3 12.5 10.7 12.8 12.8 12.7 16.9 : 15.7 : 2004 10.9 12.1 11.4 9.7 15.5 9.8 14.5 14.0 8.4 10.9 10.9 9.6 15.7 14.2 15.6 9.1 11.1 10.6 11.8 10.2 12.7 11.4 9.8 12.6 11.1 12.8 12.9 12.2 17.0 : 16.4 : 2005 10.9 11.4 11.5 9.5 15.7 9.7 14.5 14.1 9.2 11.0 10.6 9.2 15.9 14.2 14.7 9.1 10.9 15.2 12.2 10.9 12.6 11.3 10.4 12.7 10.1 12.6 12.6 12.4 18.0 : 16.7 : 2006 11.0 12.4 11.6 10.5 15.5 9.7 14.0 14.3 : 11.1 10.6 9.7 16.2 13.3 14.4 8.8 10.4 : 12.0 11.0 12.0 11.3 : 12.8 10.3 12.6 12.7 12.4 18.1 : 16.2 :
Source: Eurostat, UOE and National Accounts (data extracted June 2009). Additional notes EU-27: Estimated figures. Belgium: Expenditure does not include independent private institutions and the German-speaking Community. Denmark: 2006: research/development expenditure is not included; 2000-2002: expenditure on ISCED 4 is not included. Estonia: 2001: expenditure on pre-primary childcare provision is included. Greece: 2001-2002: allocated retirement pension expenses are not included; 2003, 2004: public-sector student loans are not included. Cyprus: Financial support for students abroad is included. Lithuania and Luxembourg: 2003-2006: public-sector transfers to ‘other private entities’ are not included. Luxembourg: 2001, 2002: expenditure on ISCED 5 and 6 and allocated retirement pension expenses are not included; 2003-2006: expenditure on ISCED 4, 5 and 6 and on ancillary provision is not included. Poland, Slovakia and Norway: Expenditure on pre-primary childcare provision is included. Portugal: Local level expenditure and allocated retirement pension expenses are not included; 2003-2006: public-sector student loans and expenditure on ISCED 4 are not included. United Kingdom: Total public expenditure adjusted in line with the financial year which runs from 1 April to 31 March. Iceland: 2001, 2002: expenditure on pre-primary childcare provision is included; 2003-2006: expenditure on ISCED 5B and ancillary provision is not included. Liechtenstein: See note for Figure D1. Explanatory note Total public expenditure on education, taking all educational levels as a whole, includes direct public-sector funding for educational institutions and transfers to households and firms. Expressed as a percentage of total public expenditure, it gives the share of the total budget, meaning the budget of all administrative levels combined (i.e. central, regional and local levels and the social security system) which is spent on education.
MORE THAN A THIRD OF TOTAL PUBLIC-SECTOR FUNDING OF EDUCATION ________________ IS ALLOCATED TO SECONDARY EDUCATION ________________
Public expenditure on education by educational level differs from country to country depending on various factors, including the duration of the educational levels (Figure B1) and the rates of participation for the levels subsequent to compulsory education (Figure C15). At the educational levels covering compulsory education (in most countries primary and lower secondary levels), demographic changes (Figures A1 and A2) also have an impact but with a delayed effect. Furthermore, one must exercise caution in interpreting the position in many countries because expenditure cannot always be fully broken down by educational level. Finally, it

R E S O U R C E S
124
should also be borne in mind that this indicator does not take into account the number of pupils/students and gives no information on the unit cost per pupil/student (Figures D4-D5).
In nearly all European countries the total public expenditure on education allocated to secondary education represents a greater proportion of GDP than expenditure on other educational levels, but never goes above 3.1 % (Cyprus). In Bulgaria, Greece, Spain, Luxembourg, Malta, Romania, Slovenia, Slovakia, Liechtenstein and Turkey it is below 2 % of GDP. Total public expenditure on education allocated to the primary level is generally less than 2 % of GDP with the exception of Slovenia and Iceland where it peaks at 2.6 %.
At European level (EU-27), the share of GDP represented by expenditure on education allocated to primary education and to tertiary education is almost the same (1.2 %). This also applies to Spain, France, Hungary, the Netherlands and Sweden. The share of GDP given over to tertiary education varies markedly from country to country. Only Denmark and Norway reach or exceed 2 %.
Figure D3: Total public expenditure on education by educational level (ISCED 1, 2-4 and 5-6), as a percentage of GDP, 2006
ISCED 0 and not allocated ISCED 1 ISCED 2-4 ISCED 5-6
EU-27 BE BG CZ DK DE EE IE EL ES FR IT CY LV LT LU HU MT NL AT PL PT RO SI SK FI SE UK IS LI NO TR
0.5 0.7 0.8 0.5 0.9 0.5 0.4 0.0 : 0.6 0.6 0.5 0.3 0.7 0.6 : 1.0 0.6 0.4 0.4 0.5 0.5 0.6 0.5 0.5 0.3 0.6 0.4 1.0 0.3 0.5 :
1.2 1.4 0.8 0.6 1.9 0.7 1.2 1.6 1.1 1.1 1.1 1.2 2.0 1.3 0.7 1.8 1.1 0.6 1.4 1.0 1.7 1.6 1.3 2.6 0.7 1.3 1.7 1.6 2.6 0.6 1.7 1.3
2.2 2.6 1.9 2.2 3.0 2.2 2.3 2.1 1.4 1.7 2.6 2.2 3.1 2.2 2.5 1.6 2.3 1.3 2.2 2.6 2.1 2.1 0.8 1.4 1.8 2.6 2.7 2.4 2.5 1.0 2.3 0.6
1.1 1.3 0.7 1.2 2.3 1.1 0.9 1.1 1.4 1.0 1.2 0.8 1.7 0.9 1.0 : 1.0 0.5 1.5 1.5 1.0 1.0 0.8 1.2 0.9 1.9 1.8 1.1 1.4 0.2 2.1 0.9
Source: Eurostat, UOE and National Accounts (data extracted June 2009). Additional notes EU-27: Estimated figures. Belgium: Expenditure does not include independent private institutions and the German-speaking Community. Denmark: ISCED 5-6: research/development expenditure is not included. Expenditure on ISCED 4 is partially included in expenditure on ISCED 5-6. Greece: ISCED 5-6: local level expenditure is not included. Expenditure on ISCED 0 is included in that on ISCED 1. Ireland and Spain: ISCED 5-6: expenditure on ancillary provision is not included. Cyprus: Financial support to pupils and students abroad is included. Lithuania: Public-sector transfers to ‘other private entities’ are not included.

SECTION I – INVESTMENT AND EQUIPMENT
125
Additional notes (Figure D3 – continued) Luxembourg: Expenditure on ISCED 0 is included in that on ISCED 1; ISCED 1 and ISCED 2-4: public-sector transfers to ‘other private entities’ and expenditure on ancillary provision are not included. Expenditure on ISCED 4 is not included. Poland and Slovakia: ISCED 0: expenditure on childcare provision is included. Portugal: Allocated retirement pension expenses and expenditure on ISCED 4 are not included; ISCED 0, 1 and 2-4: local level expenditure, public-sector student loans and public-sector transfers to ‘other private entities’ are not included; ISCED 5-6: expenditure at local and regional levels is not included; ISCED 0, 5-6: expenditure on ancillary provision is not included. Romania: Expenditure on ISCED 2 is included in that on ISCED 1; ISCED 5-6: local level expenditure is not included. Slovenia: Expenditure on ISCED 2 and a part of the expenditure on ISCED 0 are included in that on ISCED 1. Slovakia: Expenditure on ISCED 5B is included in that on ISCED 3. United Kingdom: Total public expenditure adjusted in line with the financial year which runs from 1 April to 31 March. ISCED 5-6: expenditure on ancillary provision is not included. Iceland: Expenditure on ISCED 5B and ancillary provision is not included. Liechtenstein: See note for Figure D1. Norway: ISCED 0: expenditure on ancillary provision is not included. Explanatory note In general, the public sector funds education expenditure by assuming direct responsibility for schools' current and capital expenditure (direct public funding of schools), or by providing support for pupils/students and their families (public-sector grants and loans) and by subsidising training activities by the private business sector or non-profit associations (transfers to households and firms). Direct public funding of educational institutions and transfers to households and firms are included in total public expenditure on education.
UNIT COST PER PUPIL/STUDENT ______________ CAN VARY BY A PROPORTION OF ONE TO FOUR _______________
The total annual unit cost of a pupil/student which is on average PPS EUR 5 748 in the EU-27 varies widely between countries.
One group of countries (Bulgaria, Estonia, Latvia, Lithuania, Malta, Poland, Romania and Slovakia) is characterised by unit costs per pupil/student which are relatively modest compared to the Community average and do not go beyond PPS EUR 4 000 (ranging from Romania with 1 467 to Poland with 3 278).
There is a second group of countries in which the unit costs vary from PPS EUR 7 000 to 8 000, namely Belgium, Spain, Cyprus, the Netherlands, Sweden and Liechtenstein and to a lesser extent Ireland, France and Italy (slightly below).
In a third group the unit costs are more than PPS EUR 8 000, as in Denmark, Iceland, Norway or Luxembourg, which is way ahead with more than PPS EUR 14 000 per pupil/student.

R E S O U R C E S
126
Figure D4: Annual expenditure in public-sector institutions (ISCED 0 to 6) by pupil/student, in
PPS EUR (thousands), 2006
EU-27 BE BG CZ DK DE EE IE EL ES FR IT CY LV LT LU HU MT NL AT PL PT RO SI SK FI SE UK IS LI NO TR
5.7 7.5 2.1 4.5 8.3 6.0 3.3 6.8 4.6 7.1 6.7 6.8 7.9 2.9 2.8 14.0 4.0 2.6 7.0 : 3.3 5.2 1.5 6.4 3.0 6.4 7.4 6.4 8.1 7.2 9.5 1.3
Source: Eurostat, UOE and National Accounts (data extracted June 2009). Additional notes (Figures D4 and D5) EU-27: Estimated figures. Belgium: Expenditure does not include independent private institutions and the German-speaking Community; ISCED 1, ISCED 2-4: payments from ‘other private entities’ to public-sector institutions are not included. Denmark: ISCED 5-6: research/development expenditure is not included and payments from ‘other private entities’ to public- sector institutions are not included. Expenditure on ISCED 4 is partially included in expenditure on ISCED 5-6. Estonia: Payments from international agencies and other foreign sources and those from households and ‘other private entities’ to public-sector educational institutions are not included. Ireland: ISCED 1, ISCED 2-4: payments from ‘other private entities’ to public-sector institutions are not included. Greece: ISCED 1, ISCED 2-4: payments from ‘other private entities’ to public-sector institutions are not included. Expenditure on ISCED 0 is included in that on ISCED 1. Greece, Malta and Romania: Data corresponds to 2005. Spain: ISCED 1, ISCED 2-4: payments from ‘other private entities’ and households to public-sector institutions are not included. Spain and Ireland: ISCED 5-6: expenditure on ancillary provision is not included. Italy: Expenditure on ISCED 4 is not included; ISCED 2-4; payments from international agencies and other foreign sources are not included. Luxembourg: Payments from international agencies and other foreign sources and from households to public-sector institutions are not included. Expenditure on ISCED 0 is included in that on ISCED 1. Expenditure on ISCED 4, 5 and 6 is not included; ISCED 1, ISCED 2-4: expenditure on ancillary provision is not included. Poland: Payments from international agencies, other foreign sources and from ‘other private entities’ to public-sector institutions are not included. Portugal: Allocated retirement pension expenses and expenditure on ISCED 4 are not included. ISCED 0, 1 and 2-4: local level expenditure is not included; ISCED 5-6: expenditure at local and regional levels and on ancillary provision is not included. Payments from international agencies, other foreign sources and from ‘other private entities’ to public-sector institutions are not included. Romania: Expenditure on ISCED 2 is included in that on ISCED 1. ISCED 5-6: payments from households to public-sector educational institutions are not included. Slovenia: Expenditure on ISCED 2 is included in that on ISCED 1. Slovakia: Expenditure on ISCED 5B is included in that on ISCED 3. Sweden: ISCED 1, ISCED 2-4: payments from international agencies and other foreign sources to public-sector education institutions are not included. United Kingdom: Total public expenditure adjusted in line with the financial year which runs from 1 April to 31 March. Universities in the UK are classified as government-dependent private institutions, and for that reason there is no indication on public-sector institution expenditure for ISCED levels 5-6. Iceland: Expenditure on ancillary provision is not included. Payments from international agencies, other foreign sources and ‘other private entities’ to public-sector education institutions are not included; ISCED 5-6: expenditure on ISCED 5B is not included. Liechtenstein: ISCED 1, ISCED 2-4: payments from ‘other private entities’ and from households to public-sector education institutions are not included. Norway: Payments from ‘other private entities’ to public-sector education institutions are not included; ISCED 2-4, ISCED 5-6: payments from households to public-sector education institutions are not included.

SECTION I – INVESTMENT AND EQUIPMENT
127
Explanatory note (Figures D4 and D5) Annual expenditure per pupil/student on public-sector institutions measures how much central, regional and local administration, households and other private bodies (businesses and non-profit organisations) spend per pupil/student. Annual expenditure includes staff costs, current expenditure and capital expenditure. The indicator has been calculated by dividing the total amount of annual expenditure by the number of full-time equivalent pupils/students. The annual expenditure figures have been converted into purchasing power standard (PPS – see the ‘Glossary and Statistical Tools’ section) to eliminate price differences between countries. The PPS is based on the euro.
EXPENDITURE PER STUDENT IN TERTIARY EDUCATION _____ IS ALMOST DOUBLE THE EXPENDITURE PER PUPIL AT PRIMARY LEVEL _____
Analysis of annual expenditure per pupil/student in public-sector institutions by educational level reveals the same disparities between countries in terms of sums spent as are observed in relation to total expenditure per pupil/student (Figure D4).
Figure D5: Annual expenditure in public-sector institutions by pupil/student and educational level (ISCED 1, 2-4 and 5-6), in PPS EUR (thousands), 2006
ISCED 1 ISCED 2-4 ISCED 5-6
EU-27 BE BG CZ DK DE EE IE EL ES FR IT CY LV LT LU HU MT NL AT PL PT RO SI SK FI SE UK IS LI NO TR
4.9 6.6 1.8 2.7 7.7 4.5 3.1 5.3 3.8 5.6 4.7 6.4 5.9 3.9 2.1 8.0 3.7 1.3 5.3 : 3.1 4.3 1.1 7.0 2.7 4.9 6.4 6.0 7.7 7.3 8.0 0.9
5.7 7.9 1.7 4.4 8.3 5.1 3.8 7.1 4.9 7.7 8.2 7.1 9.0 2.6 2.5 15.4 3.3 2.2 7.1 : 2.8 5.7 1.3 5.3 2.5 6.3 7.0 6.8 7.3 7.7 9.3 1.5
8.4 10.6 3.8 8.4 12.8 11.3 5.2 10.4 5.2 9.5 9.8 7.0 18.4 2.6 4.1 : 5.3 3.9 12.4 : 4.4 8.1 2.7 6.7 5.0 11.0 14.4 : 7.5 : 14.5 3.9
Source: Eurostat, UOE and National Accounts (data extracted June 2009).
Additional notes and Explanatory note (see Figure D4)
A breakdown of annual expenditure per pupil/student by educational level reveals two phenomena: in almost all countries the unit cost increases with the educational level, and the disparities between countries widen with educational level. The figures for Denmark, Greece, Luxembourg, Romania, Slovenia and Slovakia should be interpreted with caution because total public expenditure on education cannot always be fully broken down by educational level.

R E S O U R C E S
128
In the EU-27, the average annual cost per secondary school pupil (ISCED 2 to 4) is higher (PPS EUR 5 663) than that of a primary school pupil (ISCED 1, PPS EUR 4 896). With an EU-27 average of PPS EUR 8 388, tertiary education is more expensive. However, certain countries display relatively slight differences between the educational levels. This is particularly so in Italy, Slovenia and Iceland where the unit cost in tertiary education is comparable to that in primary education. The largest differences are found in Germany, Cyprus, the Netherlands, Finland, Sweden and Norway.
PRIVATE FUNDING OF EDUCATION __________________________ REMAINS MARGINAL __________________________
Education expenditure is financed by two distinct types of funding: public funding and private funding. Public expenditure includes all direct purchasing of education resources by the public sector (at whatever administrative level), whereas private expenditure includes the payment of tuition fees (and all other payments) primarily by households, businesses and non-profit associations.
Figure D6: Proportions of educational expenditure (ISCED 0 to 6) from public and private sources, 2006
Public funding Private funding
EU-27 BE BG CZ DK DE EE IE EL ES FR IT CY LV LT LU HU MT NL AT PL PT RO SI SK FI SE UK IS LI NO TR
87.5 94.4 84.8 88.9 91.9 85.2 : 94.0 94.0 88.9 90.9 92.3 83.4 88.0 90.8 : 90.5 94.7 84.3 89.2 90.5 92.0 : 87.0 85.2 97.5 97.3 75.3 89.8 : 100 :
12.5 5.6 15.2 11.1 8.1 14.8 : 6.0 6.0 11.1 9.1 7.7 16.6 12.0 9.2 : 9.5 5.3 15.7 10.8 9.5 8.0 : 13.0 14.8 2.5 2.7 24.7 10.2 : 0 :
Source: Eurostat, UOE (data extracted June 2009).
Additional notes EU-27: Estimated figures. Belgium: Expenditure does not include independent private institutions and the German-speaking Community. Denmark: Research/development expenditure is not included. Greece and Malta: Data corresponds to 2005. Poland and Slovakia: Expenditure on pre-primary childcare provision is included. Portugal: Local level expenditure is not included. Allocated expenditure on retirement pensions and expenditure on non-tertiary post-secondary education is not included. Iceland: Expenditure on ISCED 5B and ancillary provision is not included. Explanatory note The indicator gives the share of public and private expenditure on (public and private) educational institutions. The proportion of public or private final expenditure corresponds to the percentage of direct spending on education by private and public consumers of education resources. The final public expenditure includes the direct purchasing of education resources by the public sector and transfers to educational institutions and to other private bodies. The final private expenditure includes tuition fees and all other payments to educational institutions. Payments to education institutions from the 'other private entities' category are not available in the majority of the countries

SECTION I – INVESTMENT AND EQUIPMENT
129
Education expenditure is financed to a very large extent from public funds. Indeed, in all countries, public financing meets at least 75 % of education expenditure, taking all educational levels together. Small as it is, the share of private funding varies significantly from one country to another. At the same time and with reference to trends between 2002 and 2006, that share seems not to have grown significantly in most countries and has even fallen in some (see Key Data on Education in Europe 2005).
The share of public funding in education expenditure is slightly below the EU-27 average (87.5 %) in Bulgaria, Germany, Cyprus, Slovakia and the United Kingdom. Private funding represents more than 15 % of expenditure on education in Bulgaria, Cyprus, the Netherlands and the United Kingdom.
The position is perhaps similar in other countries for which not all the data on private funding are available and where the share of private funding may be underestimated (see additional notes to Figure D7).
The share of private funding depends, among other factors, on whether or not access to education-oriented pre-primary schooling is free (Figure D7) and whether registration and tuition fees are payable by students in tertiary education (Figure D15) and, if so, on the amount of those fees (Figure D16).
The relative shares of (public and private) funding for education are also linked to institutional autonomy in raising private funds and to the types of resources to which schools providing compulsory education can allocate such funds (Figure B19), as well as to the methods of financing grant-aided private schools (Figure D8) in each country.
PUBLIC INSTITUTIONS FOR PRE-PRIMARY EDUCATION _________ OFTEN RECEIVE CONTRIBUTIONS FROM PRIVATE SOURCES __________
In the majority of countries, education-oriented pre-primary institutions tend to be fee-paying, regardless of whether they are run by the public authorities or private bodies.
Belgium is the only country where admission to pre-primary education is free of charge for everyone. In several countries (Ireland, Greece, Spain, France, Italy, Latvia, Luxembourg, Hungary, Malta, Portugal, Romania and Liechtenstein), public-sector provision is free, whereas enrolment fees are payable in the private sector. In the United Kingdom, public-sector provision is free. In the private sector, provision may also be free when it is wholly government-funded; otherwise it is fee-paying.
In five countries, admission to public-sector pre-primary education-oriented institutions is sometimes free and sometimes involves payment of a fee (the amount of which may be means-tested). The private sector may require a financial contribution from parents as a matter of course (as in the Czech Republic, Poland, Slovenia and Slovakia), or in certain cases depending on the institution concerned (as in Spain).
Figure D7: Free and fee-paying pre-primary provision offered in education-oriented institutions, 2006/07
BE BG CZ DK DE EE IE EL ES FR IT CY LV LT LU HU MT NL AT PL PT RO SI SK FI SE UK IS LI NO TR
Public � � � � � � � � � � � � � � � � � � � � Free
Private � � � � � �
Public � � � � � � � � � � � � � � � Fee-paying Private � � � � � � � � � � � � � � � � � � � � � � � � � � � � � �
� There are no pre-primary education institutions of this kind Source: Eurydice.�

R E S O U R C E S
130
Additional notes (Figure D7) Ireland: Only pupils in the publicly funded Early Start units (catering for very small numbers) are considered to receive public pre-primary provision. Spain: In private non-government funded pre-primary education, parents have to pay fees, but in grant-aided private education no fees need to be paid. France: Almost all private schools are grant-aided and the fees are very low. Luxembourg: In 2006/07, approximately 1000 children attended private pre-primary settings, non-subsidised by the State. Malta: In the private sector, admission is free in institutions which are government dependent. Netherlands: From the age of 4 onwards, pupils are catered for in the first years of basisonderwijs (primary school). Austria: In one province (Lower Austria) pre-primary education is provided free of charge in the morning. A further province (Carinthia) has been offering free half-day kindergarten for children attending the last year since 2007, and for all children aged 3 to 6 since September 2008. In other provinces negotiations concerning free (half-day) kindergartens are under way Portugal: In public and non-profit private institutions the educational provision is always free. The state also supports families with low incomes who opt for non-profit private institutions in special statute association contracts with the Ministry of Education. Parents may or may not pay for meals and extra-curricular activities, depending on their income. Municipalities may also support this kind of expenditure. Finland: Provision for six-year-olds, whether organised by private or public institutions, is free of charge. Sweden: The universal pre-school for four- and five-year-olds is free of charge up to 525 hours a year. United Kingdom (ENG/WLS/NIR): Voluntary and private pre-primary settings (day nurseries, pre-school groups, playgroups) are considered here to be education-oriented as they are required to provide an educational programme which follows government guidelines as a condition of funding. These settings are funded to provide five two-and-a-half-hour sessions per week free of charge. They may also offer additional hours on a fee-paying basis. Turkey: In public schools, the children of martyrs, the disabled, war veterans and poor families are admitted to institutions free of charge in the ratio of 1/10. Institutions under Social Services and Child Protection Institutions are also free. Private education institutions should devote at least 2 % of their capacity free of charge to poor families.
Explanatory note Only so-called ‘education-oriented’ pre-primary institutions, in which staff have to hold qualifications in education, are shown here. Day-care centres, day nurseries and playgroups (in which the staff are not required to hold a qualification in education) are not shown. Primary schools catering for very young pupils counted in ISCED level 0, from the ages of either 4 or 6, have not been included. Fee-paying admission to a pre-primary institution relates to the enrolment fee requested from parents for their children to take part in its programme and not to the payment for meals or certain (specific or additional) optional extra-curricular provision. Public-sector institutions are directly or indirectly administered by a public education authority. Private institutions (whether grant-aided or not) are directly or indirectly administered by a non-governmental organisation (church, trade union, a private business concern or other body).
PRIVATE SCHOOLS ARE FUNDED BY THE SAME METHOD _______ AS USED FOR PUBLIC EDUCATION IN THE MAJORITY OF COUNTRIES _______
In some countries, schools in the grant-aided private sector receive the same funding for all the resource categories as those in the public sector, in terms of the amounts involved. Thus, in Belgium, the Netherlands, Poland and Sweden, there is no difference between the subsidy for schools administered by the public authorities and the amount allocated to grant-aided private schools. Similarly, in Finland, the same principles apply to the funding of schools in the public and grant-aided private sectors.
The Czech Republic, Denmark, Germany, Spain, Italy – for primary schools – Cyprus and Luxembourg, the three EFTA/EEA countries and Romania offer subsidies to grant-aided private schools. The amounts of these subsidies and the methods of calculation differ from those applicable to public-sector schools, regardless of the resource category involved. In certain cases, the subsidy is equivalent to a fixed percentage of the allocation for public-sector schools.
In 12 European countries, private schools receive a subsidy whose amount or method of calculation is similar to that of some public-sector schools for the different categories (teaching staff, or all staff and/or operational resources).

SECTION I – INVESTMENT AND EQUIPMENT
131
In general, grant-aided private schools receive direct central government funding. This means that the source of funding differs in all countries where the local authorities contribute to the funding of one or more particular categories of public-sector school resources (Figure B28). However, certain exceptions should be noted. In Estonia and Sweden the local authorities are responsible for the funding of both grant-aided private schools and public-sector schools. In the Netherlands, grant-aided private schools and public-sector schools are funded by the same public authorities. Figure D8: Public funding of grant-aided private schools for primary and lower secondary education compared
to public-sector schools (in terms of amounts or the method used to calculate them), 2006/07
for all resource categories (including immovables) for teaching and non-teaching staff SAME amount/method of calculation
for teaching and non-teaching staff and operational resources for teaching staff
DIFFERENT amount/ method of calculation in the case of all resource categories Private schools are not grant-aided
Source: Eurydice. Additional notes Belgium: Grant-aided private institutions may use their allocation for operational resources to remunerate their non-teaching staff in the same way as schools administered by the provinces and municipalities and in contrast to Community-administered schools, which receive more resources for non-teaching staff. Germany: Either the Länder allocate a flat-rate subsidy with due regard for certain statistical data and the type of school concerned or, alternatively, schools may itemise their financial requirements and receive a subsidy to cover a certain proportion of them in return. Italy: Private secondary schools receive grants for projects or if they are attended by pupils with special needs. Latvia: Private schools may sign an agreement with local authorities and receive funding according to the determinate costs per pupil. These costs are defined by the central authority. Lithuania: A new funding system based on a per capita model has existed since 2002 in the case of staff and some operational resources (Figure B28). Only resources included in this model receive subsidies that are the same as those in the public sector.
Lower secondary education

R E S O U R C E S
132
Additional notes (Figure D8 – continued) Portugal: The figure shows the situation of grant-aided private schools with partnership contracts. Grant-aided private schools with sponsorship contracts receive subsidies that are sometimes less than in the case of public-sector schools, regardless of the category of resources. Romania: Some specific funds are distributed to all schools in order to buy computer-related teaching materials. United Kingdom (ENG): Although the majority of private schools are not grant-aided, some, known as Academies, are. These schools, established in the last two decades to serve mainly deprived communities, receive heavy capital investment when being established. Their revenue funding is similar to that of public schools in similar circumstances, but the methodology differs as they are funded by central government rather than the local authority. Turkey: Only private special education schools are grant-aided. The amount is determined by the government every year on a unit cost per student basis. Explanatory note Public-sector schools are directly or indirectly administered by a public education authority. Private schools (whether grant-aided or not) are directly or indirectly administered by a non-governmental organisation (church, trade union, a private business concern or other body).
THE SOURCES OF EDUCATION FUNDING REFLECT ________ THE ADMINISTRATIVE STRUCTURE OF THE VARIOUS COUNTRIES ________
Various administrative levels come into play in funding education. Central, regional and local authorities redistribute some of the funds collected by them, making them available to other (usually decentralised) levels of administration which then become the final users of those funds. By comparing the initial available funds by administrative level and the administrative levels which use them, one can distinguish the contributing administrative authorities from those which receive the financial transfers.
In almost all countries funding for education is used directly either by central or local authorities. Management of financial resources is rather more centralised in Ireland, Greece, France, Italy, Cyprus, Malta, the Netherlands, Portugal, Slovenia and Liechtenstein where more than 70 % of resources are made available to and used by the central authority.
The regional level is the main funder and user of education-related budgets in only four countries (Belgium, Germany, Spain and to a lesser extent the Czech Republic) in which more than 70 % of funds allocated to education (45.5 % in the Czech Republic) are raised and spent at regional level. In three of those countries the regional body (the Communities in Belgium, the Autonomous Communities in Spain and the Länder in Germany) constitutes the top-level education authority.
In Austria the picture is a little more complex – nearly 75 % of resources are contributed by the central level which however spends only 53 % of the available funds. In Estonia, Slovakia and Finland, the central authorities provide the major share of resources but use less than 40 %.
Education funding is more decentralised in Latvia, Lithuania, Poland, Romania, the United Kingdom and Iceland. In those countries it is the local level which provides and deploys most of the financial resources allocated to education. This is because of the organisational structure of the education system in those countries, and because the regional level is not involved (except in Poland).
Transfers between the central level and regional or local levels are most significant in Bulgaria, Estonia, Hungary, Slovakia and Finland, and to a lesser extent in Ireland, the Netherlands and Austria. There are very few transfers in other countries.

SECTION I – INVESTMENT AND EQUIPMENT
133
Figure D9: Sources of public funding of education by administrative level
before and after transfers (ISCED 0 to 6), 2006
Central Regional Local
Initial funding Final funding CENTRAL
EU-27 BE BG CZ DK DE EE IE EL ES FR IT CY LV LT LU HU MT NL AT PL PT RO SI SK FI SE UK IS LI NO TR
49.0 18.3 93.0 34.8 41.3 11.7 71.2 98.6 92.3 12.6 76.5 82 100 32.6 36.9 75.3 70 100 92.3 74.7 23.5 93.6 34.1 82.1 75.8 56.5 : 36.0 39.2 76.4 : :
45.7 18.0 46.8 34.8 44.4 8.7 35.4 84.1 89.3 11.9 75.1 81 100 32.6 36.8 71.0 34 100 85.0 53.4 22.0 93.6 34.1 81.2 39.6 31.2 : 36.0 38.7 76.4 : : REGIONAL
EU-27 BE BG CZ DK DE EE IE EL ES FR IT CY LV LT LU HU MT NL AT PL PT RO SI SK FI SE UK IS LI NO TR
: 78.1 - 45.5 8.4 71.5 - - 5.6 82.3 9.2 6.8 - - - - : 0.0 0.0 15.5 2.4 6.3 0.0 - - - : - - - : :
: 78.5 - 45.6 9.7 69.5 - - 8.7 83.0 10.5 6.1 - - - - : 0.0 0.0 35.4 1.8 6.3 0.0 - - - : - - - : : LOCAL
EU-27 BE BG CZ DK DE EE IE EL ES FR IT CY LV LT LU HU MT NL AT PL PT RO SI SK FI SE UK IS LI NO TR
25.5 3.6 7.0 19.6 50.4 16.8 28.8 1.4 2.0 5.1 14.4 11.5 - 67.4 63.1 24.7 30.4 0.0 7.6 9.9 74.1 0.0 65.9 17.9 24.2 43.5 : 64.0 60.8 23.6 : :
28.4 3.6 53.2 19.6 45.9 21.8 64.6 15.9 2.0 5.1 14.4 12.6 - 67.4 63.2 29.0 65.9 0.0 15.0 11.1 76.3 0.0 65.9 18.8 60.4 68.8 : 64.0 61.3 23.6 : :
Source: Eurostat, UOE (data extracted June 2009).

R E S O U R C E S
134
Additional notes (Figure D9) EU-27: Estimated figures. Belgium: Expenditure does not include independent private institutions and the German-speaking Community. Denmark: Research/development expenditure is not included. Greece, Malta and Romania: Data corresponds to 2005. Cyprus: Support for students abroad is included. Lithuania and Luxembourg: Public-sector transfers to ‘other private entities’ are not included. Luxembourg: Expenditure on ISCED 4 and ISCED 5-6 and on ancillary provision is not included. Hungary: Expenditure at regional administrative level is included in expenditure at local level. Poland and Slovakia: Expenditure on pre-primary childcare provision is included. Portugal: Local level expenditure, allocated retirement pension expenses, public-sector student loans and expenditure on ISCED 4 are not included. Iceland: Expenditure on ancillary provision and on ISCED 5B is not included. Explanatory note Funds set aside for education are transferred between the central, regional and local administrative levels. The net flows are given here. Initial funding represents the share of total education resources made available by each administrative level. Final funding represents the share of total direct expenditure by each administrative level. Both types of funding include direct public expenditure and transfers to the private sector.
STAFF EXPENDITURE REPRESENTS ________________________ THE LARGEST COST ITEM ________________________
Spending by public-sector educational institutions falls into two main categories – current expenditure and capital expenditure. Current expenditure includes wages and costs relating to staff and ‘other current expenditure’ such as the costs of maintaining buildings, purchasing educational materials and operational resources. One can see from analysis of the categories of expenditure that spending on staff overshadows all the other categories.
Current expenditure represents more than 85 % of total expenditure by public-sector institutions in nearly all countries, the exception being Greece in which the share of current expenditure is slightly below 80 %. In all countries staff costs represent the largest share of total expenditure on education, namely an average of 71 % of annual expenditure in the EU-27. The proportion is more around 85 % in Belgium and Portugal.
However, there remain significant differences between countries in terms of the proportion of capital expenditure. Some countries, such as Belgium, Austria and Portugal, allocate almost all their resources to current expenditure, thereby confining capital expenditure to less than 5 %. In contrast, capital expenditure amounts to around 21 % in Greece, reflecting significant investment in infrastructure.

SECTION I – INVESTMENT AND EQUIPMENT
135
Figure D10: Distribution of total annual expenditure in public sector institutions (ISCED 0 to 6)
across major categories of expenditure, 2006
Capital Current expenditure – Staff Current expenditure – Other
EU-27 BE BG CZ DK DE EE IE EL ES FR IT CY LV LT LU HU MT NL AT PL PT RO SI SK FI SE UK IS LI NO TR
8.1 2.8 10.1 9.7 5.3 7.2 : 8.4 21.7 9.8 9.9 7.2 13.4 11.5 6.9 21.0 7.4 6.4 : 4.7 7.1 3.6 7.2 9.9 5.6 7.0 6.6 8.0 8.5 : 10.7 :
72.0 85.5 63.2 56.0 74.1 74.6 : 74.2 67.3 73.5 74.5 71.9 76.9 66.2 72.7 67.7 71.6 74.5 : 72.1 60.1 86.2 58.7 69.5 60.2 60.9 65.0 73.5 67.9 : 66.9 :
19.9 11.7 26.7 34.4 20.7 18.2 : 17.3 11.0 16.7 15.6 20.9 9.8 22.3 20.4 11.4 21.0 19.1 : 23.2 32.8 10.2 34.1 20.6 34.1 32.1 28.4 18.5 23.6 : 22.4 :
Source: Eurostat, UOE (data extracted June 2009). Additional notes EU-27: Estimated figures. Belgium: Expenditure does not include independent private institutions and the German-speaking Community. Denmark: Research/development expenditure is not included. Greece, Malta and Romania: Data corresponds to 2005. Lithuania: Breakdown by type of expenditure on public and private institutions. Luxembourg: Expenditure on ISCED 4, 5 and 6 and on ancillary provision is not included. Payments from international agencies and other foreign sources and households to public-sector institutions are not included. Austria and Poland: Payments from international agencies, other foreign sources and ‘other private entities’ to public sector institutions are not included. Portugal: Local level expenditure is not included. Allocated retirement pension expenses and expenditure on ISCED 4 are not included. Portugal and Iceland: Payments from ‘other private entities’, international agencies and other foreign sources to public sector institutions are not included. Iceland: Expenditure on ancillary provision is not included. Norway: Payments from ‘other private entities’ to public sector institutions are not included. Explanatory note Total expenditure in educational institutions can generally be divided between current expenditure and capital expenditure. Current expenditure can itself be broken down into two categories – staff costs and other current expenditure. The breakdown of costs varies depending on teacher salary levels and the pupil/teacher ratio, and also on whether institutions own or rent the buildings used by them, and whether they provide textbooks or services (meals or boarding facilities, for example) in addition to teaching. The percentages for each category of expenditure are all calculated as percentages of total annual expenditure.
SCHOOL OR CLASSROOM LIBRARIES ARE AVAILABLE ______________ ALMOST EVERYWHERE IN PRIMARY EDUCATION ______________
Learning to read is one of the essential aspects of primary education and access to books is important for that purpose. This is why the presence of a library in a school or reading corner in the classroom are indicators of school resources.
According to replies from teachers and school heads in the PIRLS (2006) survey, the proportion of pupils in the fourth year of primary education who attend a school with a library or classroom library/reading corner is around 90 %. In the majority of countries, there is a higher proportion of school libraries than classroom reading corners. Nevertheless, in countries such as Belgium, the Netherlands and Austria, pupils have

R E S O U R C E S
136
libraries or reading corners in the classroom more frequently than school libraries. Additionally, in Germany and the United Kingdom (Scotland) the proportion of school and classroom libraries is very similar.
The percentage of pupils who, according to teachers or school heads, have no library either in the school or in their classroom is negligible in most countries. However, where the proportion of pupils with access to a library in school is relatively low, there is provision for a similar service elsewhere. For example, the local authorities in Germany or Austria run numerous libraries which include sections for children.
Figure D11: Proportions of pupils in the fourth year of primary school who, according to the teacher and school head, have access to a school library and a classroom library or
reading corner, public and private sectors combined, 2006
Library or reading corner in the classroom School library Country that did not contribute to data collection
EU-27 BE fr BE de BE nl BG CZ DK DE EE IE EL ES FR IT CY LV LT LU
76.2 91.2 96.1 42.7 35.4 83.6 84.8 84.9 69.3 60.2 80.3 87.5
89.2 72.5 42.9 88.1 97.1 78.7 97.7 89.7 93.7 99.7 98.6
HU MT NL AT PL PT RO SI SK FI SE UK-ENG UK-SCT IS LI NO TR
70.2 87.6 73.2 54.9 62.4 58.3 71.2 48.2 83.7 93.3 51.2 57.6
98.1 75.9 52.5 96.5 98.4 100 98.6 90.1 96.3 92.9 98.6 98.1
Source: IEA, PIRLS 2006 database. Explanatory note School heads were asked in the questionnaire sent to them to indicate whether or not there was a library in the school. Teachers were asked in the questionnaire sent to them to indicate whether the classroom had a library or reading corner. The Figure compares the responses to these questions in each of the questionnaires weighted by the number of pupils that the school head and teachers represent. The sampling procedure involved selecting schools and then the pupils from a class in the fourth year of primary education. It sought to offer each pupil the same probability of being selected irrespective of the size of the school he or she attended. For this purpose, schools were weighted in such a way that the probability that they would be selected was inversely proportional to their size. This explains why the Figure does not directly show the proportions of teachers who gave a particular reply, but the proportions of pupils whose teachers gave this reply. For further information on the PIRLS survey, see the Glossary and Statistical Tools section.

SECTION I – INVESTMENT AND EQUIPMENT
137
PUBLIC-SECTOR FINANCIAL SUPPORT FOR STUDENTS IS _________ A MAJOR STRAND OF PUBLIC EXPENDITURE ON EDUCATION _________
All countries have public-sector systems of financial support in place, but its nature, the requirements for its award and the educational levels for which it is granted vary from one national system to another (Figures D13 and D14). Direct public-sector support for pupils/students (in the form of grants and/or loans) represents financial support to the families of pupils enrolled in compulsory education, but can also be an incentive to continue studies beyond compulsory schooling. Direct public support for pupils/students therefore represents a strand of public-sector education investment which is conducive to equality of opportunity.
On average for all educational levels, the countries of the European Union earmark nearly 6 % of their public expenditure for direct support for pupils and students although the figure varies from country to country. Whereas Bulgaria, Denmark and Norway allocate between 14 % and 20 % respectively of their public expenditure on education to support for pupils/students, almost half of European countries allocate less than the EU-27 average. Those differences need qualifying, since differences between the national systems mean that national data on public-sector support are not completely compatible. The figures analysed here relate only to direct public support for pupils/students which, alone, does not fully measure the true level of support which may be received. The data do include study grants and other transfers paid to pupils/students and to households and, where they exist, public-sector loans to students. On the other hand, the tax relief and/or family allowances available at ISCED levels 1 to 3 (Figures D13 and D14) are not taken into account.
At the same time, this contribution is not spread equally between educational levels. A comparison between the share of direct support allocated to primary, secondary and post-secondary level pupils combined and the support allocated to students in tertiary education shows marked disparities. The European average share that direct support represents as a percentage of public expenditure on tertiary education is more than 16 %, whereas the direct support allocated to pupils as a percentage of public expenditure on primary and secondary education amounts to only 3.2 %. That position reflects in particular the fact that education is free for ISCED 1, 2 and 3.
Exceptions are Poland, Romania and to a lesser extent the Czech Republic where the level of direct support differs little between the two educational levels in question (ISCED 1-4 and ISCED 5-6). That situation should in fact be interpreted as a weakness of support for tertiary education. Similarly, Bulgaria is the only country in which the school level receives an appreciably larger proportion of support than tertiary education.
Taking primary and secondary levels together, direct support for pupils is less than 8 % of expenditure on education in almost all European countries. Bulgaria (16.3 %), Denmark (10.5 %) and Ireland (9 %) record the highest percentages. On the other hand, Greece and Austria return proportions of less than 1 %.
In tertiary education, support for students generally represents more than 10 % of total expenditure and must be seen in conjunction with the charging of registration and tuition fees (Figures D15 and D16). Greece and Poland have the lowest percentages with 1.4 % and 1.7 % respectively. Denmark, Cyprus, the Netherlands, Sweden, the United Kingdom and Norway devote 25 % or more of public expenditure on tertiary education to direct financial support for students. The position in Cyprus is associated in particular with the mechanism for support provided to the large number of students who study abroad.

R E S O U R C E S
138
Figure D12: Direct public-sector support (grants and loans) to pupils and students
as a percentage of total public expenditure on education, by educational level overall (ISCED 0 to 6), school level (ISCED 1, 2, 3 and 4) and tertiary level (ISCED 5 and 6), 2006
ISCED 1-4 ISCED 5-6 Source: Eurostat, UOE (data extracted June 2009).
EU-27 BE BG CZ DK DE EE IE EL ES FR IT CY LV LT LU HU MT NL AT PL PT RO SI SK FI SE UK IS LI NO TR
3.2 1.9 16.3 4.3 10.5 4.7 3.5 9.0 0.2 1.8 3.1 1.7 : 5.5 5.6 2.2 4.4 : 7.2 0.8 2.0 1.6 5.2 4.0 2.8 3.0 6.3 1.7 1.1 : 8.3 2.2
16.6 13.6 9.5 4.0 29.5 19.5 8.9 14.4 1.4 7.9 8.0 16.6 55.1 7.7 15.2 : 15.1 : 29.5 17.0 1.7 11.6 5.6 23.3 14.1 16.2 26.1 26.4 24.0 : 41.7 16.9O 5.9 4.6 15.2 4.3 17.5 7.9 4.5 10.7 0.6 3.0 3.9 4.5 13.2 6.3 8.4 2.2 6.0 : 11.6 5.1 1.3 2.6 4.6 8.3 4.8 7.2 11.2 5.8 5.2 5.1 19.3 :
O = ISCED 0 to 6 Additional notes EU-27: Estimated figures. Belgium: Expenditure does not include independent private institutions and the German-speaking Community. Bulgaria, Czech Republic, Estonia, Spain, France, Hungary, Austria, Poland, Romania, Slovenia and Finland: There are no publicly-funded loans to pupils/students. Denmark: Financial support to pupils/students from ‘other private entities’ is not included. Expenditure on ISCED 4 is partially included in that on ISCED 5-6. Ireland, Italy, Lithuania, Luxembourg and Slovakia: ISCED 1-4: there are no publicly-funded loans to pupils/students. Greece: ISCED 5-6: local level expenditure is not included. Greece and Luxembourg: Expenditure at ISCED 0 is included in ISCED 1. Greece and Romania: Data corresponds to 2005. Spain, Ireland, Luxembourg, Portugal and United Kingdom: ISCED 5-6: expenditure on ancillary provision is not included. Cyprus: ISCED 5-6: financial support for students abroad is included. Lithuania and Luxembourg: public-sector transfers to ‘other private entities’ are not included. Luxembourg: Expenditure on ISCED 4 and ISCED 5 and 6 is not included. Poland and Slovakia: Expenditure on ISCED 5B is included in that on ISCED 3. Portugal: Allocated retirement pension expenses and loans to pupils/students are not included. ISCED 1-4: local level expenditure and public sector transfers to ‘other private entities’ are not included. ISCED 5-6: expenditure at local and regional level is not included. Expenditure on ISCED 4 is not included. Romania: ISCED 5-6: local level expenditure is not included. Iceland: There are no grants. Expenditure on ISCED 4 is partially included in that on ISCED 5-6. Expenditure on ISCED 5B is included in ISCED 5-6. Expenditure on ancillary provision is not included. Explanatory note Financial support for students corresponds to transfers funded by the public sector in the form of study grants, loans and family allowances linked to status as a pupil or student. The indicator does not fully measure support provided to pupils and students since they may also receive financial support such as loans from private banks, benefit from specific welfare services (such as assistance with meals, transport, health and housing) or enjoy tax relief. Financial support for pupils/students varies from country to country according to differences in the education systems.

SECTION I – INVESTMENT AND EQUIPMENT
139
FINANCIAL SUPPORT FOR THE PARENTS OF CHILDREN IN ______ COMPULSORY EDUCATION IS AVAILABLE EVERYWHERE IN EUROPE ______
Family allowances for studying exist in all European countries without exception. In general, they are awarded when children are born and paid up to the end of compulsory education (see Figure D14 for information on support for students in tertiary education).
Figure D13: Types of financial support for parents with children in primary and lower secondary education, 2006/07
Solely family allowances Family allowances + Study grants
Family allowances + Tax relief Family allowances + Tax relief + Study grants
Source: Eurydice.
Additional notes Bulgaria: The combined approach of family allowances and tax relief was introduced on a provisional basis for the 2006/07 school year. Estonia: One resident parent or guardian of a child or other person who maintains three or more minors may deduct increased basic exemption from his or her income in the period of taxation for each child of up to 17 years of age, starting with the second child Malta: Families receive tax reductions only for tuition fees payable at private schools. Poland: Tax relief was introduced in 2007 and its amount depends on the number of children Liechtenstein: Parents may receive study grants for lower secondary education only for boarding schools. The amount of the grant is adjusted according to family income and number of children. Turkey: For families with a low income a 'conditional fund transfer' is payable. There is additional specific daily support for students staying in pensions, and for boarding and bussed schools. Since 2003/04 textbooks are provided by the government free of charge. Explanatory note A study grant is equivalent to an education grant or student grant and means an award to finance an educational course. The indicator does not cover support for pupils who study abroad.
Primary education

R E S O U R C E S
140
In all cases, the amounts awarded vary depending on the number and age of the children concerned. In Bulgaria, the Czech Republic, Italy, Portugal, Slovakia and Iceland, the amounts are proportional to family income. Furthermore, families above a certain income level do not receive support in the Czech Republic, Spain, Malta, Poland, Slovenia and Slovakia.
Tax relief exists in most countries with the exception of Cyprus, Malta and the Nordic countries. Unlike family allowances, it is generally granted irrespective of the number or age of children. A few countries are exceptions to this rule. In Belgium, Greece, Luxembourg and Romania, the number of children is taken into account, while in Estonia these benefits are only available on the birth of the third child. Additionally, in many cases tax relief is linked to parental income, as in Germany, Greece, France, Luxembourg, Portugal and the United Kingdom.
Study grants for children in the compulsory school age range exist in only a few countries. In four of them (Belgium, France, Luxembourg and the Netherlands), they are only available from lower secondary education onwards and they are always family means tested.
In various countries other specific complementary measures are implemented to support parents with children in compulsory education. Some of these approaches involve reduced-price or free transport or meals in school, specific aid for teaching materials, distribution of free textbooks, etc.
FINANCIAL SUPPORT TO MEET THE COST OF LIVING IS AWARDED TO _________________ ISCED 5 STUDENTS ALMOST EVERYWHERE _________________
Students in tertiary education and/or their parents may benefit from a range of financial support, the existence and possible combination of which are based on two social principles, namely that of wide (or, alternatively, limited) access to tertiary education, and the financial independence (or otherwise) of students vis-à-vis their family. Three major categories of support are considered here:
� Financial support to students to cover the cost of living, in the form of loans and/or grants;
� Financial support for the payment of administrative fees and contributions to tuition costs, in the form of loans and/or grants, exemptions and/or reductions;
� Financial assistance to the parents of students in tertiary education, in the form of family allowances and/or tax relief.
Everywhere in Europe, financial support for students enrolled in programmes at ISCED level 5 for a first qualification is roughly the same, whether they are enrolled in public or government-dependent private institutions. A first model is based on the principle of student financial independence (1) which is sometimes granted to young people from the age of 18 onwards. Support here is targeted exclusively at students, and their parents thus receive neither family allowances nor tax relief. The situation of countries in this group may differ depending on whether or not they have adopted the principle of education free of charge (Figure D15).
In the Nordic countries (except Iceland), Hungary, Malta and the United Kingdom (Scotland), students with state-subsidised places do not contribute financially to administrative or tuition costs. Admission to tertiary
(1) Here, students are regarded as financially independent when their parents receive no assistance and only the student income is
taken into account for the award of support. Such independence is partial if parents receive no support but their income is means-tested in awarding support to students. The concept of financial independence as used here does not necessarily correspond to its definition in national legislation.

SECTION I – INVESTMENT AND EQUIPMENT
141
education is thus free or almost free (where students pay solely contributions to student organisations). Consequently, in these countries financial support towards the cost of living of students is awarded.
In the other countries in this first group, students have to pay administrative fees and/or contributions to tuition costs, as in Bulgaria, Spain, the Netherlands, Romania, the United Kingdom (England, Wales and Northern Ireland) and Iceland. Financial support to cover the cost of living and/or to pay administrative fees and contributions to tuition costs is awarded in these countries.
In a second model, support is awarded to the parents of students, as long as the latter remain financially dependent on them (generally up to the age of 23 or 26 according to the country concerned). In this group also, one may distinguish between countries in which tertiary education is free and those in which contributions have to be paid.
In the Czech Republic, Estonia, Greece, Cyprus, Poland and Slovenia, students for a first qualification with state-subsidised places pay little or nothing towards administrative fees or tuition costs. Support specifically meant to cover the cost of living is awarded to students in addition to financial assistance for parents.
The other countries belonging to this model require that students should pay contributions. Almost all these countries provide for the three categories of financial support whether or not they combine support to help meet the cost of living with support to help pay for tuition. Only Portugal awards support intended solely to cover the living costs of students with state-subsidised places.
Figure D14: Recipients and purpose of public financial support for full-time study in tertiary education for a first qualification (ISCED 5) in the public and/or government-dependent private sectors, 2006/07
Support for students to cover the cost of living Support for the parents of students
Support for students to pay administrative fees and contributions to tuition costs
Italics = countries which award comprehensive support (i.e. arrangements for support do not dissociate support to cover student living costs from support for the payment of administrative fees and/or contributions to tuition costs).
Source: Eurydice.

R E S O U R C E S
142
Additional notes (Figure D14) Czech Republic: Support for students to cover the cost of living relates solely to those at vysoká škola (ISCED 5A), while support for parents applies to students at both ISCED levels 5A and 5B. Germany: Only support offered by the BAföG is considered here. Estonia: Financial support for students considered to be in real poverty is not taken into account here. Ireland: Tax relief is awarded to parents of students who must pay tuition fees (i.e. in case they have a previous qualification to the same level or they are repeating the year). Greece: Financial support awarded by IKY (State Scholarship Foundation) is shown here. It affects just 1-2 % of students in tertiary education. Spain: Comprehensive forms of financial support exist alongside specific forms of support (to cover the cost of living and pay student contributions). France: Grants based on academic criteria also exist (13 000 compared to 520 000 awarded in accordance with social criteria), as well as 10 000 study allowances awarded to assist students who encounter particular difficulties during their year of study (such as break-up of their family, proven independence from their family, or who return to study after the age limit of 26). Italy: Financial support for students in all private institutions (government-dependent or otherwise) is taken into account. Cyprus: Support for contributions to administrative fees and tuition costs is also awarded to students other than those for whom tertiary education is virtually free already (i.e. those who only pay contributions to student organisations). Latvia: The Figure illustrates the situation of students without subsidised places (77 % of the total). Education is free of charge for students with subsidised places. Luxembourg: Support for the payment of administrative fees and contributions to tuition costs is paid if the amount of private contributions exceeds PPS EUR 90.3. Hungary: Tax relief is offered to parents of students without subsidised places. Netherlands: Tax relief (in the form of tax allowances) is awarded to the parents of students who receive no direct financial support, as long they can provide evidence of the expenditure incurred. Poland: A new law was adopted in 2005 and is currently being implemented. Sweden: The aim of financial support is to cover the cost of living and contributions to student organisations. Only the ‘cost of living’ component is shown in the diagram. United Kingdom (SCT): Most students however have to repay the SAAS an amount of PPS EUR 2 977 before April of the year following completion of their studies (Figure C9). Loans exist for those unable to do so in one go. Norway: The Figure takes account only of students in public institutions. Contributions to tuition fees have to be paid in government-dependent private institutions and special forms of support are available for students to pay them. Explanatory note Unless there is any indication to the contrary in the additional notes, the Figure takes account of the situation of full-time students who are citizens of the country concerned and/or permanently resident in the country, and who are enrolled with a state-subsidised place in daytime courses for a first qualification (ISCED 5). See the Glossary for definitions of support.
FREE ACCESS TO PUBLIC TERTIARY EDUCATION AT ISCED LEVEL 5 _________________________ IN A DOZEN COUNTRIES _________________________
Everywhere, the public authorities contribute to expenditure in tertiary education. The amounts allocated to institutions often only partially cover tuition costs. In most countries, their budget is also partly dependent on private household contributions representing a fairly significant share of their income. In such cases, students enrolled full time for a first qualification at ISCED level 5 are obliged to contribute financially to the cost of their studies. Only the situation of students with a state-subsidised place is considered here.
A distinction may be drawn between two major categories of contribution sometimes present in combination, namely administrative fees and tuition fees. Contributions to administrative costs may include fees that have to be paid just once when students enrol for the first time (entrance fees) or annually (registration fees), and certification fees meant to cover the organisation of examinations and the provision of administrative documents relating to the final qualification. Furthermore, students may have to pay contributions to their tuition costs that are often higher than administrative fees (Figure D16).
Considered here are contributions to be paid by students irrespective of any financial support due to some of them in accordance with certain criteria.

SECTION I – INVESTMENT AND EQUIPMENT
143
Figure D15: Types of private contribution annually paid by full-time daytime students
for a first qualification (ISCED 5) in the public and/or government-dependent private sectors, 2006/07
Annual contributions to student organisations
Annual registration fees (and possible contributions to student organisations)
Annual tuition fees (and possible administrative fees and/or contributions to student organisations)
Neither annual fees nor compulsory contributions
Source: Eurydice.
Additional notes Belgium (BE fr, BE nl): The annual amount requested from students covers registration fees and tuition fees. Germany: Since 2006/07, the Länder have been free to request contributions of up to PPS EUR 944 to tuition costs. As of January 2007, seven Länder had decided to require these contributions. Estonia, Hungary, Romania and Slovenia: Students without a subsidised place pay contributions to tuition costs. Greece: The Hellenic Open University is the only institution to charge contributions to tuition costs. Italy: Students also have to pay a regional tax for student welfare. Certification fees are only due in the institutes of art and music offering alta formazione artistica e musicale (higher level artistic and musical training). Cyprus: Contributions to student organisations are paid just once, when students are first admitted to tertiary education. Latvia: The Figure relates to students without a state-subsidised place (around three-quarters of all students). Subsidised students benefit from access free of charge. Lithuania: Contributions to tuition costs are due from first-cycle students for a Bachelor qualification and second-cycle Master students irrespective of whether they receive a state subsidy. Austria: Universities may waive payment of tuition fees, but cannot request them from students legally exempt from them. The Austrians and the students from EU countries currently do not pay tuition fees at universities (since September 2008). Slovenia: Higher education institutions may charge students for enrolment fees, administrative costs, selection procedure costs or field training costs. Finland: University students have to pay contributions to student organisations; by contrast, such payments are optional for students in the polytechnic faculties. United Kingdom (SCT): The SAAS (Student Awards Agency for Scotland) pays the contributions of students who request this. Most students who complete their course are liable to make a compulsory payment after graduation – the ‘graduate endowment’. Nevertheless the Scottish Government has legislated to abolish the Graduate Endowment Fee from 1st April 2008 Norway: In some institutions in the government-dependent private sector, students also have to pay administrative entrance fees, annual registration fees, and a contribution to their tuition costs.
ISCED 5B

R E S O U R C E S
144
Explanatory note (Figure D15) Administrative entrance fees (payable just once) and certification fees are not considered. Only annual registration fees, contributions to student organisations and contributions to tuition costs are included. They are fully defined in the Glossary. The types of contribution reported here are those payable by full-time students with a subsidised place (or, in Latvia, with a non-subsidised place) and on time with their studies. Any financial support they may receive is disregarded.
Independently of or in addition to those contributions, a system of compulsory payments to student organisations may have been established. These are contributions to costs associated with student life or services, such as those arising from cultural activities or for certain kinds of insurance. Where they are required, these amounts are much lower than contributions to the funding of education.
In some countries, special measures may apply to students who have to redo a year, or who take longer than a certain fixed length of time to complete their studies.
Tuition fees are a widespread form of contribution, which is adopted in 16 countries. In seven of them – Belgium (French and Flemish Communities), Bulgaria, the Czech Republic (ISCED 5B programmes only), Lithuania, the Netherlands, the United Kingdom (England, Wales and Northern Ireland) and Liechtenstein – such fees are the only financial contribution required of students.
Annually paid registration fees are also very widespread. They are due in 12 countries, either in combination with tuition fees as in Belgium (German-speaking Community), in Spain (for ISCED 5A programmes), Italy, Portugal, Norway (some institutions in the government-dependent private sector) and Turkey, or alone (Germany, France, Luxembourg, Romania, Slovakia and Iceland).
In Finland (public-sector university institutions), Sweden and Norway (in the public sector), students pay only an annual contribution to their own organisations. In Cyprus, they are required to pay a small contribution to the student organisation just once when they first enrol for study. In Poland they have to pay very low registration fees once when they first enter tertiary education.
In seven countries, namely the Czech Republic (ISCED 5A), Denmark, Greece (excluding the Open University), Spain (ISCED 5B), Hungary, Malta and the United Kingdom (Scotland), students doing their first qualification who keep within the normal course schedule are entitled to free tertiary education. The same applies to students in the polytechnic faculties in Finland and to students with a subsidised place in Estonia and Latvia. The United Kingdom (Scotland) is regarded as a country in which access to tertiary education is free, as a government agency pays the officially determined registration fee for all reference students irrespective of their social classification, provided they so request and do not repeat their year of study. However, until April 2008, once they have graduated, these students have to make a compulsory payment in recognition of the support they have received. In all, therefore, a dozen countries provide tertiary education access to which may be regarded as free of charge (with neither tuition fees nor annual registration fees payable).
Finally, it should be noted that the current trend in contributions to tertiary education in Europe is towards tuition fees. Besides the fact that this applies to many countries, some of which have recently introduced such fees, a few more are discussing whether or not to introduce them or have decided that they will (the Czech Republic, Germany and Hungary), or are arranging for all students to pay them (Lithuania). By contrast, Slovenia is abolishing the payment of all tuition fees in ISCED level 5 programmes by 2009.

SECTION I – INVESTMENT AND EQUIPMENT
145
TUITION FEES FOR ISCED 5 PROGRAMMES OFTEN VARY _____________ BETWEEN PPS EUR 200 AND PPS EUR 1 000 A YEAR _____________
In countries with data available on the size of contributions, tuition fees are in general higher than other forms of contribution: the annual administrative fees reported are never above the PPS EUR 200 mark except in two countries in which registration fees are relatively high. In France, the latter may reach almost PPS EUR 1 000, but this is in the exceptional case of students training for the state qualification of specialist in psychomotor treatment (for most students annual registration fees are fixed at PPS EUR 149). In Iceland, registration fees stand at PPS EUR 361. However, in both France and Iceland, registration fees are the only contributions required from students.
Contributions paid to student organisations are still lower, not exceeding PPS EUR 100. In particular, in Finland (universities) and Norway, in which such a contribution is all that students have to pay, a sum of between PPS EUR 51 and PPS EUR 78 is due. In Sweden, these contributions are fixed by different student organisations but generally stand at PPS EUR 27 a year.
Where tuition fees have to be paid by state-subsidised students, their amount – or at least their maximum amount – is in most cases fixed at central level. In only two countries out of 16 are the amounts concerned at the discretion of institutions, in the government-dependent private sector (Norway) and in the public sector (Italy). Differences between countries in the amounts required are substantial. They range from under PPS EUR 200 in some programmes in Belgium (French Community) and Turkey, to over PPS EUR 1 000 in all programmes at ISCED level 5 (first qualification) in the Netherlands and the United Kingdom (England, Wales and Northern Ireland), as well as in some programmes in Spain and Portugal. This contribution may be as high as almost PPS EUR 12 000 in the government-dependent private sector in Latvia for students without a state-subsidised place. However, in the majority of countries, financial support for payment of these fees is awarded to students at a socio-economic disadvantage.

R E S O U R C E S
146
Figure D16: Amounts of fees and other contributions in PPS EUR paid by full-time daytime students enrolled for a first qualification (ISCED 5) in the public and/or government-dependent private sectors, 2006/07
Type of contribution Min Max BE fr Tuition fees (short non-university, ISCED 5B) 155 201 Tuition fees (long non-university, ISCED 5A) 310 402
Tuition fees (university, ISCED 5A) 742
BE de Registration fees (ISCED 5B) 94
Tuition fees (ISCED 5B) 347
BE nl Tuition fees 433 492
BG Tuition fees: Bachelor ISCED 5A programmes : :
CZ Tuition fees (ISCED 5B) 147 294
ISCED 5A programmes � �
DK � �
DE Entrance fees : : Registration fees 76 96 Student contributions 15 25
EE � �
IE Registration fees 645
EL � �
ES ISCED 5B programmes � � Tuition fees (ISCED 5A) 497 1060 Registration fees (ISCED 5A) : : Certification fees (ISCED 5A) : :
FR RF: university licence (ISCED 5A) and Instituts Universitaires de Technologie (ISCED 5B) 149
Registration fees: health – university (ISCED 5A) 149 994 RF: grande école preparatory classes (ISCED 5A) and
Section de Techniciens Supérieurs (ISCED 5B) � �
IT Registration fees 167
Tuition fees
CY Student entrance contributions 19
LV Entrance fees
(students without a state-subsidised place) Certification fees
Tuition fees: public sector (ISCED 5A) 841 8601
Tuition fees: public sector (ISCED 5B) 1035 1501
LT Tuition fees 594
LU Registration fees 181
Min PPS EUR
Max PPS EUR
Tuition fees Student contributions
Administrative fees: Registration fees Entrance or certification fees
Source: Eurydice. � Amount fixed by institutions � No private contributions

SECTION I – INVESTMENT AND EQUIPMENT
147
Figure D16 (continued): Amounts of fees and other contributions in PPS EUR paid by full-time daytime students enrolled for a first qualification (ISCED 5) in the public and/or government-dependent private sectors, 2006/07
Type of contribution Min Max
HU � �
MT � �
NL Tuition fees 1496
AT Contributions to student organisations 29
Tuition fees 701
PL Entrance fees 4 10
Certification fees 26 44
PT Registration fees
Tuition fees 582 1079
RO Registration fees
SI Entrance fees 15 285
SK Entrance fees (public sector) 19 73 Registration fees (public sector) Certification fees (public sector)
FI Contributions to student organisations (ISCED 5A) 51 78
SE Contributions to student organisations
UK- ENG/WLS/NIR Tuition fees 3869
UK- WLS Tuition fees 1548
UK- SCT � �
IS Registration fees 361
LI Tuition fees 740
NO Contributions to student organisations 78 Entrance fees (government-dependent private sector) Tuition fees (government-dependent private sector) Certification fees (government-dependent private sector)
TR Tuition fees (ISCED 5A) 54 451
Tuition fees (ISCED 5B) 145 Tuition fees (ISCED 6) 197 Tuition fees (ISCED 5A)-Second-shift education 735 3257
Tuition fees (ISCED 5B) Second-shift education 588
Min PPS EUR
Max PPS EUR
Tuition fees Student contributions
Administrative fees: Registration fees Entrance or certification fees
Source: Eurydice. � Amount fixed by institutions � No private contributions

R E S O U R C E S
148
Additional notes (Figure D16) Belgium (BE fr): In non-university programmes, the maximum amount corresponds to the sum that final-year students have to pay. From the 2006/07 academic year, the total fees that university students pay cannot exceed PPS EUR 762, except in the Écoles supérieures des Arts, the Instituts Supérieurs d’Architecture and some sections in other Hautes écoles (higher education institutions). Belgium (BE fr, BE nl): The amount covers registration fees as well as the student contribution to tuition costs. Belgium (BE de): The only higher education institution, the Autonome Hochschule, requires a PPS EUR 242 contribution to tuition costs, which thus falls short of the official maximum of PPS EUR 358. Czech Republic and Malta: An application fee (around PPS EUR 30 in the Czech Republic and PPS EUR 34 in Malta) is charged by tertiary education institutions (ISCED 5A). However, payment of the fee is not necessarily followed by full registration. Estonia: In the case of non-subsidised students, each institution is free to fix the amount payable in administrative fees. In practice, however, very few institutions do so and, where this occurs, very often only a token amount is requested. Neither is the level of contribution to tuition costs for non-subsidised places regulated in absolute values, but in terms of an authorised increase in the rate from one academic year to the next. Spain: The amount of the fees varies in each Autonomous Community and, within each Community, from one programme to the next. The tuition fees reported here (for ISCED 5A programmes) are estimates based on a 60-credit study programme in the two Autonomous Communities with highest and lowest prices, respectively (the Canary Islands and Navarre). France: Only programmes under the Ministry of Higher Education and Research are considered here. Institutions attached to other ministries are not included. As a supplement to nationally established fees, each university may charge special fees approved by its administrative board (between PPS EUR 9 and PPS EUR 28) to cover sports activities, services provided by the Service Universitaire de Médecine Préventive et de Promotion de la Santé (SUMPPS, or university service for preventive medicine and health promotion), or the Service Universitaire d'Information et d'Orientation (SUIO, or the university information and guidance service). Italy: Students must also pay a regional tax for student welfare, the amount of which is fixed at regional level. Latvia: Contributions to tuition costs are due solely from students without a state-subsidised place (around three-quarters of all students). The amounts are not fixed at central level but left to the discretion of institutions. Those reported here are estimates provided by the Ministry of Education and Science. Lithuania: Contributions to tuition costs are due from first-cycle students for a Bachelor qualification irrespective of whether they receive a state subsidy, whereas second-cycle Master students with a state-subsidised place (one-third of all students) do not have to pay this kind of contribution. Hungary: Students without a subsidised place (non-state-funded) pay an annual tuition fee. The annual tuition fee is calculated by each higher education institution individually with respect to central regulations. Non-state-funded students with outstanding exam results can gain state-funded status. Those state-funded students who fail to get a certain amount of credits required drop out of the circle of state-funded students and become non-state-funded students. Austria: Universities may waive payment of tuition fees, but cannot request them from students legally exempt from them. The Austrians and the students from EU countries currently do not pay tuition fees at universities (since September 2008). Poland: For the 2007/08 academic year, different entrance fees must be paid following a national ministerial regulation. For programmes requiring testing in artistic predispositions as well as architecture, interior design and urban planning, the maximum amount is set at PPS EUR 67; for programmes requiring testing in sports abilities, the maximum amount is set at PPS EUR 44; the remaining programmes have a maximum entrance fee set at PPS EUR 38. Romania: At the University of Bucharest, registration fees vary from PPS EUR 32 to PPS EUR 127, and contributions to tuition costs (for non-subsidised places) from PPS EUR 1 109 to PPS EUR 1 273. Sweden: The size of contributions is fixed by the student unions and varies from one institution to the next. The average amount is around PPS EUR 27. United Kingdom (SCT): Most reference students are liable to pay a graduate endowment on successful completion of their course. The amount (PPS EUR 2 977 for a student starting in reference year 2005/06) is not means tested and is payable the April after graduation. Nevertheless the Scottish Government has legislated to abolish the Graduate Endowment Fee from 1 April 2008. Explanatory note Contributions to administrative costs (annual registration fees, entrance and certification fees), contributions to student organisations and contributions to tuition costs (tuition fees) are defined in the Glossary. Contributions reported here are those paid annually (except in the case of entrance and certification fees) by full-time students with a subsidised place (or, in Latvia, with a non-subsidised place) and on time with their studies. Any financial support they may receive is disregarded. The ‘others’ category covers entrance fees and certification fees. The � symbol indicates that the amount is left to the discretion of institutions. If a minimum and/or maximum level is indicated, amounts may be fixed freely within the corresponding range. Amounts are converted by means of ‘purchasing power parities’ (see the Glossary for a definition and conversion table).

149
R E S O U R C E S
SECTION II – TEACHERS
THE CONCURRENT MODEL PREVAILS __________ IN TEACHER EDUCATION FOR COMPULSORY EDUCATION ___________
Teacher education may be organised in various ways, but usually includes a general and a professional component. The general component is the part given over to courses covering general education and study of the one or more specific subjects to be taught and may also refer to the degree obtained in a particular subject.
The professional part provides prospective teachers with both the theoretical and practical skills needed to be a teacher and includes in-class placements.
Two main models of initial teacher education can be distinguished on the basis of the way in which these two components are combined. The professional component may be provided either at the same time as the general component (the concurrent model) or after it (the consecutive model). The upper secondary school leaving certificate is the qualification required to undertake training in accordance with the concurrent model as well as, in some cases, a certificate of aptitude for tertiary and/or teacher education. In the consecutive model, students who have undertaken tertiary education in a particular field then move on to professional training in a separate phase. In the concurrent model, students are involved in specific teacher education right from the start of their studies, whereas in the consecutive model this occurs after their degree.
In almost all European countries, teachers at the pre-primary and primary levels of education are trained in accordance with the concurrent model. However, in France, all such teachers undergo a consecutive form of training. In the United Kingdom (England, Wales and Northern Ireland), the concurrent route was the traditional route for intending pre-primary and primary teachers, but both routes are available and the consecutive route is now common.
For general lower secondary education, the concurrent model exists either alongside the consecutive model or is the only possible option. In Latvia, Lithuania, Malta, Slovenia, Finland and Iceland, the concurrent model is the most widespread model for this level of education. In these countries, with the exception of Lithuania and Malta, primary and lower secondary education are organised in a single structure (Figure B1). In Spain, France, Italy, Cyprus and Hungary however, the consecutive model is the only possible pattern of training for lower secondary education.
The consecutive model is more often adopted for teacher education for general upper secondary education. However, all teachers studying to teach at this level in Germany, Slovakia and Sweden receive education provided in accordance with the concurrent model. Many countries offer both routes. In Bulgaria, Ireland, Portugal, Slovenia and the United Kingdom, the consecutive model is however the most widespread model for this level of education.
In Malta, Finland and Lithuania, the majority of all (lower and upper) secondary teachers are trained in accordance with the concurrent model. In Germany, Slovakia, Sweden and Turkey, the concurrent model is the only possible route into teaching for all levels of education. In France, only the consecutive model is available.

RESOURCES
150
Figure D17: Structure of initial teacher education
for pre-primary, primary and general secondary education (ISCED 0, 1, 2 and 3), 2006/07
Pre-primary and primary education
Concurrent model
Consecutive model
Teacher education abroad
Professional phase not compulsory
Lower secondary education Upper secondary education
Source: Eurydice. Additional notes (Figure D17) Belgium (BE de): Initial teacher education for secondary level is provided outside the German-speaking Community. Most teachers are trained in the French Community of Belgium. Denmark: For teachers at upper secondary level, professional training only becomes mandatory within the first year of actual employment. Greece: The provision of professional teacher training for secondary education depends on the institution and the subjects in which prospective teachers intend to specialise. Latvia: Teachers of music, physical education, foreign language, visual arts, Latvian language and literature in primary education may complete a programme according to the consecutive model. Luxembourg: For secondary education, only the professional training phase is provided within the country. Hungary: For general lower secondary education, the concurrent model still exists until the full implementation of the new consecutive model (2009). United Kingdom: The most common training route is the consecutive route, although the concurrent route is also widely available, particularly for intending pre-primary and primary teachers. In England and Wales, other routes to Qualified Teacher Status are also available, including part-time, flexible and employment-based training. Liechtenstein: Prospective teachers are trained mostly in Switzerland and Austria. Turkey: An ISCED level 2 does not exist. The entire single structure (eight years for pupils aged from 6 to 14) is considered to be ISCED 1. The map for lower secondary education illustrates the situation within this single structure.

SECTION I I – TEACHERS
151
PRE-PRIMARY TEACHER EDUCATION PROGRAMMES INCLUDE _________ A SUBSTANTIAL PROPORTION OF PROFESSIONAL TRAINING _________
Initial teacher education for pre-primary provision (ISCED 0) occurs in most cases at tertiary level. In Austria, it is provided either at upper secondary level or non-tertiary post-secondary level. In Malta, prospective teachers for pre-primary education are trained solely at upper secondary level. In the Czech Republic and Slovakia, teacher education for this level takes two forms, one provided at upper secondary level and the other at tertiary level.
In several European countries (Belgium, Bulgaria, France, Spain, Italy, Greece, Poland, Portugal, Romania and the United Kingdom), teacher education for those intending to work in pre-primary education is similar to or the same as initial teacher education for primary teachers. In Ireland and the Netherlands, where a distinct, school-based pre-primary level does not exist (Figure B1), four-year-olds are in primary school and taught by primary school teachers.
In most cases, the length of initial teacher education for pre-primary education is between three and four years. However, provision is five years in France and Poland (one of three possible routes), whereas in Malta it is two years. In Austria, teacher education for pre-primary education lasts five years at upper secondary level (the most widespread route) and two years at post-secondary level.
A compulsory minimum period for professional training is stipulated in almost all countries with however strong variations between countries.
The time spent on professional training seems to be linked to the level at which teacher education is provided as well as the model followed (Figure D17). For example, it is 60 % or more of the total time allocation in the German-speaking Community of Belgium, Latvia, Luxembourg, Romania and Slovenia, where it is provided at occupationally-oriented tertiary level (ISCED 5B) or upper secondary level. Provided at either of these two levels, the proportion of professional training is never less than 30 % and often at least 50 %. Conversely, at ISCED 5A- tertiary level, the proportion of professional training is often less than 50 %, except in Denmark, Hungary, Finland and Norway. In all countries providing teacher education in accordance with the concurrent model, the proportion of professional training is always at least 30 %, except in Poland and Portugal.
In many countries, providers may add professional training over the indicated minimum. Teacher education providers are free to decide the time to be spent on it solely in Bulgaria, the Czech Republic (at ISCED level 5A), Greece, Slovakia and Iceland.

RESOURCES
152
Explanatory note relating to Figures D18, D19, D20, D21 When determining the proportion of professional training in the full period of initial teacher education, only the compulsory minimum curriculum for all prospective teachers is taken into account. Within this compulsory minimum curriculum, a distinction is drawn between general education and professional training. General education: In the concurrent model, this refers to general education courses and mastery of the subject(s) that trainees will teach when qualified. The purpose of these courses, therefore, is to provide trainees with a thorough knowledge of one or more subjects and broad general education. In the case of the consecutive model, general education refers to the degree obtained in a particular subject. Professional training: Provides prospective teachers with both the theoretical and practical skills needed to be a teacher. In addition to courses in psychology and teaching methods and methodology, it includes in-class placements. In a few countries, professional training takes the form of the final ‘on-the-job’ qualifying phase (Figure D22). The Figures show only the compulsory minimum length of initial teacher education, and include the final ‘on-the-job’ qualifying phase only in those countries in which it is considered an integral part of initial teacher education. The length of initial teacher education is expressed in years. For countries providing teacher education that follows different routes, only the most widespread route is shown. In some countries, the amount of time in initial teacher education to be devoted to specifically professional training may be decided by the individual institution. The autonomy of providers may be total (meaning that no minimum amount of time is required). In these cases, only the symbol 0 has been added. However, autonomy may also be limited. In such instances, providers have to set aside a minimum amount of time for professional training as determined by the central/top-level authorities but may also increase the share of it if they wish. Here, the minimum proportion is shown, and the possibility providers have of increasing it is also indicated by the symbol 0.
Figure D18: Level and minimum length of initial teacher education for pre-primary level (ISCED 0),
and the compulsory minimum proportion of time devoted to professional training, 2006/07
Years Years
ISCED 3 or 4 ISCED 5A ISCED 5B
Compulsory minimum proportion of professional training Teacher education abroad 0 Institutional autonomy
Compulsory minimum proportion of professional training in percentages BE fr
BE de CZ DK DE EE ES FR IT CY LV LT LU HU MT NL AT PL PT RO SI FI SE UK
(1) UK-SCT NO TR
51.4 72.2 54.8 55.7 33.3 30.0 40.0 20.0 30.0 34.5 76.3 65.0 30.0 30.0 62.5 50.6 42.6 25.0 54.4 100 18.2 23.5 25.0 30.6 90.0 89.0 50.0 42.9 25.0 25.0 50.0 28.6
UK (1) = UK-ENG/WLS/NIR
Source: Eurydice. Additional notes Belgium (BE nl): Gradual implementation of at least 45 ECTS of in-class placements started in 2007. Bulgaria: Both forms of tertiary provision (at ISCED 5B and ISCED 5A) exist, with the prevalence of ISCED 5A. Czech Republic: Teacher education may also last three years at ISCED level 5B. Germany: The information refers to qualified youth or community workers (Erzieher), who do not have the status of teachers. Ireland and Netherlands: The proportion of professional training figure indicates an average, as institutions decide on the time devoted to professional training. Children aged between 4 and 6 attend primary schools. The diagram relates to initial teacher education for the primary level. France: Professional training occurs during the final 'on-the-job' qualifying phase lasting one year. Austria: The first 4 years of the five-year period of teacher education are ISCED 3, while the fifth year is ISCED 4. Two-year teacher education is ISCED 4.

SECTION I I – TEACHERS
153
Additional notes (Figure D18 – continued) Poland: A three-year route at ISCED 5A, ending with a bachelor's degree, is also possible for this level. Portugal: Both forms of tertiary provision (at ISCED 5B and ISCED 5A) exist. Slovakia: Providers may decide on the amount of professional training, but the minimum number of in-class placements is defined. Finland: Within the framework of national regulations, universities decide on the content and structure of their degrees, and variations in the percentage exist as a result. United Kingdom (ENG/WLS/NIR): The professional component is defined in relation to standards and skills rather than duration, although all trainees are required to spend a minimum period in schools. Information is provided for the consecutive route, but the concurrent route is also common. In England and Wales, part-time, flexible and employment-based training routes are also available.
MORE PROFESSIONAL TRAINING IN OCCUPATIONALLY-ORIENTED COURSES _______________________ FOR PRIMARY TEACHERS ________________________
In all European countries but one, initial teacher education for the primary level (ISCED 1) occurs at tertiary level (ISCED 5A or ISCED 5B). In Bulgaria, Lithuania, Poland and Portugal, both forms of tertiary provision exist side by side. In Belgium, Luxembourg, Austria and Romania, inital teacher education for this level occurs solely at occupationally-oriented tertiary level (ISCED 5B). The one exception is Romania, where teacher shortages have prompted the reintroduction of a teacher education programme at upper secondary level alongside a tertiary level programme.
Figure D19: Level and minimum length of initial teacher education for the primary level (ISCED 1), and the compulsory minimum proportion of time spent on professional training, 2006/07
Years Years
ISCED 3 or 4 ISCED 5A ISCED 5B
Compulsory minimum proportion of professional training Teacher education abroad 0 Institutional autonomy Compulsory minimum proportion of professional training in percentages BE fr
BE de DK DE EE IE ES FR IT CY LV LT LU HU MT NL AT PL PT RO SI FI SE UK
(1) UK-SCT NO TR
51.4 72.2 25.0 52.0 20.0 33.3 40.0 20.0 30.0 29.6 76.3 25.0 25.0 62.5 51.1 90.8 25.0 85.0 18.2 23.5 25.0 30.6 90.0 54.2 50.0 43.0 25.0 25.0 37.5 27.3
UK (1) = UK-ENG/WLS/NIR
Source: Eurydice. Additional notes Belgium (BE nl): Gradual implementation of at least 45 ECTS credits for in-class placements started in 2007. Bulgaria: Teacher education may last five years depending on the institution. It also lasts three years in a very limited form of provision at ISCED 5B. Czech Republic: Teacher education is organised only in Master´s programmes, which may last 4 to 6 years. In 2006/07 the newly opened programmes usually lasted 5 years. France: Professional training occurs during the final 'on-the-job' qualifying phase lasting one year. Poland: A three-year route at ISCED 5A, ending with a Bachelor's degree, is also possible for this level. Portugal: Both forms of tertiary provision (at ISCED 5B and at ISCED 5A) exist. Romania: Since 2005/06, courses at ISCED 5B have been undergoing a reorganisation process, aiming at their transformation into ISCED 5A.

RESOURCES
154
Additional notes (Figure D19 – continued) Slovenia: A new study programme which extends training to 5 years is being introduced in 2009. Finland: Within the framework of national regulations, universities decide on the content and structure of their degrees, and variations in the percentage exist as a result. This information relates mainly to teachers in the first six years of the perusopetus/grundläggande utbildning. Sweden: This information relates to teachers in the first six years of grundskola. United Kingdom (ENG/WLS/NIR): The professional component is defined in relation to standards and skills rather than duration, although all trainees are required to spend a minimum period in schools. Information is provided for the consecutive route, but the concurrent route is also common. In England and Wales, part-time, flexible and employment-based training routes are also available. Turkey: Faculties may have the liberty of designating up to 25 % of the programme. Explanatory note: see 'Explanatory note relating to Figures D18, D19, D20, D21'.
The length of initial teacher education for primary school and the proportion of time spent on specifically professional training depend on the level of provision. Three years is the norm in countries where teacher education is provided in occupationally-oriented tertiary education (ISCED 5B), and normally over 50 % of this period is spent on professional training, with particularly high percentages in Austria and Romania. ISCED 5A training for primary teachers usually lasts four years (five in Estonia, France, Poland and Finland). The share earmarked for professional training is between 13-90 %, thus varying very widely from one country to the next, with high percentages in Slovenia, Malta and Finland. Providers are free to decide how much time should be spent on professional training in Bulgaria, the Czech Republic, Greece, Slovakia and Iceland. In several other countries, only a minimum amount of professional training is prescribed and additional provision may vary between providers.
TEACHER EDUCATION ___ FOR LOWER SECONDARY LEVEL IS GENERALLY ACADEMICALLY-ORIENTED ____
In all countries, initial teacher education for the lower secondary level (ISCED 2) is provided in tertiary education and in most cases leads to an academically-oriented qualification (ISCED 5A). However, in Belgium and Austria (in the case of Hauptschulen), teachers enter the teaching profession on completion of occupationally-oriented tertiary education (ISCED 5B).
Initial teacher education for lower secondary level generally lasts between four and five years, except in Belgium and Austria (in the case of Hauptschule teachers), where it lasts three years. In Iceland, education according to the concurrent model lasts three years, and in the consecutive model four. Routes which follow the consecutive model tend in general to be longer as in Italy and Luxembourg.
Where teacher education conforms to the concurrent model (Figure D17), the proportion earmarked for professional training is generally greater, often higher than 30 %, as in Malta and Sweden and even more than 50 % in the French Community of Belgium, Latvia and Austria. By contrast, in the consecutive model it never exceeds 40 %, except in Hungary.
In some countries, initial teacher education for lower secondary level is provided in accordance with both models. In Austria (teachers in allgemein bildenden höheren Schulen), Latvia and Lithuania, teacher education based on the consecutive model lasts longest, but the proportion of professional training is greater in the concurrent model. By contrast, in Lithuania, the relative proportion of professional training within initial teacher education does not depend on the particular model of provision.
In several countries, providers are completely free to organise the time earmarked for different components of teacher education as they wish. However, many national policies lay down certain specific minimum periods for in-class placements in schools.

SECTION I I – TEACHERS
155
Figure D20: Level and minimum length of initial teacher education for general lower secondary level (ISCED 2),
and the compulsory minimum proportion of time devoted to professional training, 2006/07
Years Years
ISCED 5A ISCED 5B
Compulsory minimum proportion of professional training Teacher education abroad 0 Institutional autonomy
Compulsory minimum proportion of professional training in percentages BE fr DK DE EE IE ES FR IT CY LV LT LU HU MT NL AT PL PT RO SI FI SE UK
(1) UK-SCT NO TR
51.4 25.0 57.0 20.0 25.0 9.1 20.0 33.3 20.0 76.3 20.0 20.0 33.3 48.5 37.5 25.0 30.0 75.0 18.2 20.0 25.0 25.0 21.9 33.3 25.0 20.0 25.0 27.3
UK (1) = UK-ENG/WLS/NIR
Source: Eurydice. Additional notes Belgium: Teachers in lower secondary education may teach in the first three years of general secondary school. Belgium (BE nl): Gradual implementation of at least 45 ECTS credits for in-class placements started in 2007. Czech Republic: According to the Act on Higher Education, two-cycle programmes may last from 4 to 7 years. In 2006/07, most universities opened such programmes, those for teacher education usually lasting 5 years. However, old programmes lasting four years are still provided. Greece: The provision of professional training depends on the institution and the subjects in which prospective teachers intend to specialise. Spain: Teacher education may also last five or six-and-a-half years. Following the new education Act (2006), a reorganisation of professional training is awaited. France: Professional training occurs during the final ‘on-the-job’ qualifying phase lasting one year. Luxembourg: The general component of teacher education has to be undertaken abroad. Professional training occurs during the final ‘on-the-job’ qualifying phase lasting one year. Hungary: According to new legislation, initial teacher education for this level may only be organised at Master’s level. This means that the former Bachelor-level qualification will no longer be acceptable for teaching at general lower secondary level after full implementation of this legislation in 2009. Malta: The consecutive model may last four or five years. The proportion of professional training shown here applies solely to the concurrent model. Netherlands: There are many possibilities to shorten the training; in certain cases, a certificate of secondary vocational education at a relevant level enables a reduction from half-a-year to one year. For persons qualified at higher education level, the possibility exists to do a one-year postgraduate course. Austria: This diagram illustrates teacher education for (a) the Hauptschule and (b) the allgemein bildende höhere Schule. In the case of the latter, it lasts four-and-a-half years and is followed by a final ‘on-the-job’ qualifying phase (Figure D22) lasting one year which is an integral part of initial teacher education. Poland: A three-year route at ISCED 5A, ending with a bachelor's degree, is also possible for this level. Romania: As a result of the implementation of the three-cycle structure, the duration of initial teacher education corresponding to the first cycle may vary between 3 to 4 years, depending on the field of study. The variable part concerns general education. Slovenia: New teacher study programmes will be introduced in 2009, extending teacher education from 4 to 5 years. There is also a route following the consecutive model, lasting four-and-a-half years. Finland: The information relates mainly to specialist subject teachers in the last three years of the perusopetus/grundläggande utbildning. The consecutive model lasts longer but the relative proportion of professional training does not substantially change.Sweden: The information relates to teachers working in the final years of the grundskola.

RESOURCES
156
Additional notes (Figure D20 – continued) United Kingdom (ENG/WLS/NIR): The professional component is defined in relation to standards and skills rather than duration, although all trainees are required to spend a minimum period in schools. Information is provided for the consecutive route, but the concurrent route is also common. In England and Wales, part-time, flexible and employment-based training routes are also available. Iceland: The diagram illustrates the concurrent model. The consecutive model lasts four years. Norway: At the Universitet, teacher education may last from four to seven years depending on the subject chosen. Turkey: An ISCED level 2 does not exist. The entire single structure (eight years for pupils aged from 6 to 14) is considered to be ISCED 1. The Figure illustrates the situation within this single structure. Explanatory note: see 'Explanatory note relating to Figures D18, D19, D20, D21'.
PROPORTION OF PROFESSIONAL TRAINING IN TEACHER EDUCATION ______________ FOR THE UPPER SECONDARY LEVEL RATHER LOW ______________
In all European countries, initial teacher education for those intending to work at upper secondary level (ISCED 3) is provided in academically-oriented (ISCED 5A) programmes. It lasts between four and five years in most countries. Longer periods of study (six years), organised according to the consecutive model (Figure D17), exist however in Denmark, Italy and Luxembourg.
Irrespective of the model followed (consecutive or concurrent), the proportion of professional training only exceeds 30 % in Italy, Latvia, Luxembourg, Hungary, Malta and Sweden. In most countries, the percentage of time for acquiring teaching skills varies between 11 % and 30 %.
Certain countries (Denmark and Spain) devote an even smaller proportion of time (less than 10 %) to specifically professional training.
As with the other levels of education (Figures D18, D19, D20), providers in several countries are completely free to organise the time for different components of teacher education as they wish. Figure D21: Level and minimum length of initial teacher education for general upper secondary level (ISCED 3),
and the compulsory minimum proportion of time devoted to professional training, 2006/07
Years Years
ISCED 5A
Compulsory minimum proportion of professional training Teacher education abroad 0 Institutional autonomy Compulsory minimum proportion of professional training in percentages BE fr
BE nl DK DE EE IE ES FR IT CY LV LT LU HU MT NL AT PL PT RO SI FI SE UK
(1) UK- SCT NO TR
20.0 13.0 8.3 48.0 20.0 25.0 9.1 20.0 33.3 20.0 76.3 20.0 33.3 48.8 37.5 20.0 30.0 18.2 20.0 25.0 11.0 21.9 33.3 25.0 20.0 25.0 27.0
UK (1) = UK-ENG/WLS/NIR
Source: Eurydice.

SECTION I I – TEACHERS
157
Additional notes (Figure D21) Belgium: Subject to special dispensation, teachers trained for lower secondary education (Figure D20) may also teach in upper secondary education but this is limited to practical/technical subjects. Belgium (BE nl): Gradual implementation of at least 30 ECTS of in-class placements started in 2007. Czech Republic: According to the Act on Higher Education two-cycle programmes may last from 4 to 7 years. In 2006/07, most universities opened such programmes, those for teacher education usually lasting 5 years. However, old programmes lasting four years are still provided. Denmark: The general education phase lasts 5 years followed by up to two years of professional training which only becomes mandatory within the first year of actual employment. Greece: The provision of professional teacher training depends on the institution and the subjects in which prospective teachers intend to specialise. Spain: Teacher education may also last five or six-and-a-half years. Following the new education Act (2006), a reorganisation of professional training is awaited. France: Professional training occurs during the final ‘on-the-job’ qualifying phase lasting one year. Luxembourg: The general component of teacher education has to be undertaken abroad. Professional training occurs during the final ‘on-the-job’ qualifying phase lasting one year. Malta: The proportion of professional training applies solely to the concurrent model. Netherlands: There are many possibilities to shorten the training; in certain cases, a certificate of secondary vocational education at a relevant level enables a reduction that depends on the institution. For persons qualified at higher education level, the possibility exists to do a one-year postgraduate course. Austria: The final ‘on-the-job’ qualifying phase lasting one year is an integral part of intial teacher education. Poland: For teachers of foreign languages, a three-year course is also provided. Romania: As a result of the implementation of the three-cycle structure, the duration of initial teacher education corresponding to the first cycle may vary between 3 to 4 years, depending on the field of study. The variable part concerns general education.Slovenia: New teacher study programmes will be introduced in 2009, extending teacher education from 4 to 5 years. There is also a route following the concurrent model, lasting 4 years. Finland: The consecutive model lasts longer but the relative proportion of professional training does not substantially change. United Kingdom (ENG/WLS/NIR): The professional component is defined in relation to standards and skills rather than duration, although all trainees are required to spend a minimum period in schools. Information is provided for the consecutive route, but the concurrent route is also common. In England and Wales, part-time, flexible and employment-based training routes are also available. Norway: Depending on the subject chosen, teacher education may last from four to seven years. The relative proportion for professional training ranges from 25 % in the case of a four-year course to 14.3 % for a seven-year one. Turkey: Faculties may have the liberty of designating up to 25 % of the programme. Explanatory note: see 'Explanatory note relating to Figures D18, D19, D20, D21'.
A FINAL ‘ON-THE-JOB’ QUALIFYING PHASE INTRODUCED ________ IN SLIGHTLY LESS THAN HALF OF ALL EUROPEAN COUNTRIES _________
Provided in several countries to facilitate support to teacher trainees and to introduce them to their new working environment, this compulsory period (often called ‘induction’) forms a transition from initial teacher education to fully-fledged professional life. It should help teacher trainees to become successful teachers and thus to prevent new teachers from leaving their jobs. During this phase, teachers are still not considered to be fully qualified and are usually regarded as ‘candidate teachers’ or ‘trainees’. They carry out wholly or partially the tasks incumbent on fully qualified teachers, and are remunerated for their activity. This phase includes an important supportive and supervisory dimension provided by a ‘mentor’, and normally also a formal evaluation of teaching skills. It also includes formal theoretical training. In most cases, candidate teachers become fully qualified teachers at the end of this stage after satisfying a set of formal evaluation criteria.
Eleven countries organise such a phase, in seven of them for work at all four levels of education considered here (pre-primary, primary, general lower and upper secondary). In Luxembourg and Austria, such a phase is organised only for the secondary levels, while in Germany and the United Kingdom (Scotland), such periods exist also for work at primary, but not at pre-primary level.

RESOURCES
158
Usually lasting a year, its length is of ten months in Slovenia, two years in Germany, and up to two years in Luxembourg, the United Kingdom (Scotland) and Turkey. Due to differing forms of organisation, the amounts of time future teachers have to spend in schools and on theoretical training vary.
In some countries, this period is an integral part of initial teacher education (Figures D18, D19, D20 and D21) and constitutes its final phase. This is the case in Austria, France and Luxembourg. Most countries provide this ‘induction phase’ in addition to the compulsory professional training received before the acquisition of a teaching diploma. The situation is somewhat different in France and Luxembourg. In these two countries, prospective teachers have to pass a competition before entering this phase which constitutes at the same time their professional training.
Figure D22: Final 'on-the-job' qualifying phase for pre-primary, primary and general secondary education (ISCED 0, 1, 2 and 3), 2006/07
Length DE EE IE FR LU AT PT SI UK-ENG/WLS/NIR UK-SCT TR 2
years 1
year 1
year 1
year 21
months 1
year 1
year 10
months 1
year 1
year 1 to 2 years
Source: Eurydice.
Additional notes Cyprus: Since October 2008, an induction programme specifically designed for both new teachers and mentors in primary and secondary education has been introduced. Malta: The amendments made to the Education Act in 2006 stipulate that, before a teacher is awarded the teacher's warrant and takes up permanent employment, s/he will have to receive adequate experience in the practice of the teaching profession under supervision for an aggregate period of at least two school years full-time or its part-time equivalent, following the completion of the degree. This article of the Education Act has still not come into force. Netherlands: Students in the final year of initial teacher education can be employed part time under a training and employment contract for a limited period (equivalent to no more than five months full time), provided the school has a vacancy. The trainee teacher is supervised by a qualified teacher and does everything a regular member of staff would do.
Final 'on-the-job' qualifying phase in place
No final 'on-the-job' qualifying phase
ISCED 0 ISCED 0 and 1

SECTION I I – TEACHERS
159
Additional notes (Figure D22 – continued) Austria: The final 'on-the-job' qualifying phase only concerns teachers intending to work at the allgemeinbildende höhere Schule. Slovenia: The Organisation and Financing Act stipulates that the final ‘on-the-job’ qualifying phase lasts no less than six months and no more than ten in principle, but school heads may decide to finish it prematurely and employ a candidate teacher on a permanent basis before the end of the traineeship. Turkey: An ISCED level 2 does not exist. The entire single structure (eight years for pupils aged from 6 to 14) is considered to be ISCED 1. The map illustrates the situation within this single structure. Explanatory note Final ‘on-the-job’ qualifying phase: A compulsory period of transition from initial teacher education to fully-fledged professional life usually lasting at least several months. During this period, teachers are still not considered to be fully qualified and are usually regarded as ‘teacher-candidates’ or ‘trainees’. They carry out wholly or partially the tasks incumbent on fully qualified teachers, and are remunerated for their activity. This phase includes an important supportive and supervisory dimension (provided by a ‘mentor’), and normally a formal evaluation of teaching skills. Teacher-candidates become fully qualified teachers at the end of this stage after satisfying a set of formal evaluation criteria. It is therefore a phase which must be completed successfully in order to acquire the fully qualified status essential for recognition as full members of the teaching profession. In some countries, this period is an integral part of initial teacher education and constitutes its final phase.
SUPPORT MEASURES FOR NEW TEACHERS ___________________ ARE BECOMING MORE WIDESPREAD ___________________
Teachers may face many challenges in the early years of their career. Special support measures can help them to overcome difficulties they may have as newcomers to the profession, and reduce the likelihood that they will leave the profession early. In 2006, around 20 countries offered new teachers formal assistance during this time.
In Estonia and Austria, all support measures for new entrants are provided in the framework of the final ‘on- the-job’ qualifying phase (Figure D22).
Where available, support measures for new teachers in primary education and (lower and upper) secondary education generally take the form of assistance with the planning of lessons and their assessment, meetings with their supervisors for the discussion of problems, classroom observation or specifically designed training for them. A mentor is usually appointed to take responsibility for assisting new teachers – in general an experienced teacher who has completed a significant period in service and/or the school head.
Wherever there are such arrangements, this support is offered to all of them unconditionally.
In the United Kingdom (Wales and Northern Ireland), a formal early professional development phase exists lasting two years and is considered an essential stage in the professional development of all teachers.
In Greece, Spain, Italy and Cyprus, teachers have to follow compulsory training during their probationary period, the length of which varies very widely. Compulsory training for new entrants also exists in France, the United Kingdom, Liechtenstein and Turkey.
Support measures for teachers later in their career also exist (Figure D27).

RESOURCES
160
Figure D23: Regulations and/or recommendations on types of support available to new entrants to the teaching
profession in primary and general (lower and upper) secondary education (ISCED 1, 2 and 3), 2006/07
DE EE IE ES EL FR IT CY LU MT AT PL PT RO SI SK UK IS LI TR
Regular meetings for the discussion of progress or problems � � � � � � � � � � � � �
Assistance with the planning of lessons � � � � � � � � � � � � � � �
Assistance with the assessment of lessons � � � � � � � � � � � � � �
Participation in classroom activity and/or classroom observation � � � � � � � � � � � �
Organisation of optional training � � � � � � � �
Special compulsory training � � � � � � � �
Visits to other schools/resource centres � � � � � � � �
Existence of a final ‘on-the-job’ qualifying phase � � � � � � � � � �
No current measures BE, BG, CZ, DK, LV, LT, HU, NL, FI, SE, NO
Source: Eurydice.
Additional notes Belgium (BE nl): In September 2007 mentoring was introduced for new teachers. Spain: The organisation of the first year of work is the responsibility of the Autonomous Communities and may vary slightly from one Community to the next. Luxembourg: Participation in classroom activity and/or classroom observation and a final ‘on-the-job’ qualifying phase are support measures in place only for secondary level teachers. Austria: The final 'on-the-job' qualifying phase only concerns teachers intending to work at the allgemeinbildende höhere Schule. Poland: In accordance with the legal regulations, school heads are obliged to appoint a mentor (an experienced teacher) for each new entrant. Turkey: An ISCED level 2 does not exist. The entire single structure (eight years for pupils aged from 6 to 14) is considered to be ISCED 1. The Figure illustrates the situation within this single structure. Explanatory note The support measures listed here are examples of the type of activities that a school would be expected to offer depending on an individual’s specific development needs.
CONTINUING PROFESSIONAL DEVELOPMENT IS AMONG THE PROFESSIONAL ______ DUTIES OF TEACHERS IN OVER HALF OF ALL EUROPEAN COUNTRIES ______
Continuing professional development (CPD) is considered a professional duty for teachers in more than 20 European countries and regions. However, teachers are not explicitly obliged to engage in CPD in all of them.
For example, while CPD is a professional duty in France, the Netherlands, Sweden, Iceland and Norway, participation in it is in practice optional.
In Spain, Luxembourg, Poland, Portugal, Slovenia and Slovakia, CPD is optional, but clearly linked to career advancement and salary increases. In Spain and Luxembourg, teachers who enrol for a certain amount of training are eligible for a salary bonus. In the other four countries, credits may be acquired via participation in CPD programmes and are taken into account for purposes of promotion.
Specific CPD linked to the introduction of new educational reforms and organised by the relevant authorities is in general a professional duty for teachers in all countries.

SECTION I I – TEACHERS
161
Figure D24: Status of continuing professional development for teachers
in primary and general (lower and upper) secondary education (ISCED 1, 2 and 3), 2006/07
Source: Eurydice. Additional note Luxembourg: Since 2007, CPD has been compulsory for teachers in secondary education. Explanatory note Professional duty: Task described as such in working regulations/contracts/legislation or other regulations on the teaching profession.
THE MAJORITY OF TEACHERS SPENT LESS THAN 35 HOURS ON _________ TRAINING FOR TEACHING READING IN THE LAST TWO YEARS _________
Participation in continuing professional development (CPD) is considered part of a teacher’s professional duties in many countries (Figure D24). At the same time, the importance of instruction in reading in primary education, in terms of teaching time allocated to it in the curriculum, is widely acknowledged (Figure E2). The PIRLS (2006) survey provides some useful information on actual participation in in-service training activities for teaching reading for those countries which participated.
In eight countries, namely Belgium (French and Flemish Communities), Bulgaria, Germany, France, Luxembourg, Netherlands, Slovakia and the United Kingdom (England and Scotland), over 60 % of fourth-year pupils had teachers who said that, in the preceding two years, they had not taken part in any in-service training activity in this area or had done so for less than six hours.
Around 40 % of pupils in Lithuania, Hungary, Romania, Slovenia, Sweden, Iceland and Norway had teachers who said they had spent 6 to 35 hours on in-service training for the teaching of reading. In Austria and Poland the proportion was higher, with over 70 % and 60 % of pupils, respectively, whose teachers had been
Professional duty
Optional, but necessary for promotion
Optional

RESOURCES
162
spending 6 to 35 hours of training for teaching reading. In comparison with the 2000/01 school year, this percentage has increased substantially in 2005/06 for several countries such as Germany, France, Hungary, Sweden and Norway, with over 10 % more pupils whose teachers had taken part in training activities for teaching reading for 6 to 35 hours per week in the last two years.
In the majority of countries, the share of pupils with teachers who reported having taken part in more than 35 hours of in-service training for teaching reading in the last two years is below 10 %. The exceptions are Latvia, Romania and Iceland where the proportion is over 20 %.
Figure D25: Proportions of pupils in the fourth year of primary education whose teachers report having taken part in in-service training for teaching reading in the last two years, 2006
No participation or less than 6 hours
Between 6 and 35 hours
More than 35 hours
Country that did not contribute to data collection
EU-27 BE fr BE de BE nl BG CZ DK DE EE IE EL ES FR IT CY LV LT LU
55.9 69.5 84.2 65.9 48.3 60.4 51.6 75.3 51.1 35.8 44.0 73.7
35.2 28.8 14.3 24.4 34.1 35.6 32.2 20.5 36.3 38.5 52.8 21.8
8.9 1.7 1.6 9.6 17.6 4.1 16.1 4.3 12.6 25.7 3.2 4.5
HU MT NL AT PL PT RO SI SK FI SE UK- ENG
UK-SCT IS LI NO TR
37.2 62.2 25.3 20.4 37.1 43.9 68.0 49.2 67.4 72.1 38.1 46.0
47.9 32.9 70.1 60.7 41.1 46.5 27.7 43.1 30.0 27.2 40.6 40.7
14.9 4.9 4.6 19.0 21.8 9.6 4.3 7.7 2.6 0.7 21.3 13.4
Source: IEA, PIRLS 2006 database. Explanatory note Teachers were asked in the questionnaire sent to them to indicate how many hours they had spent in the last two years in in-service training or professional development workshops or seminars dealing directly with reading or the teaching of reading. The sampling procedure involved selecting schools and then pupils from a class in the fourth year of primary education. It sought to offer each pupil the same probability of being selected irrespective of the size of the school he or she attended. For this purpose, schools were weighted in such a way that the probability that they would be selected was inversely proportional to their size. This explains why the Figure does not directly show the proportions of teachers who gave a particular reply regarding one or other of the options indicated, but the proportions of pupils whose teachers gave this reply. For further information on the PIRLS survey, see the Glossary and Statistical Tools section.

SECTION I I – TEACHERS
163
TEACHERS ARE CAREER CIVIL SERVANTS ______________ IN ONLY A MINORITY OF EUROPEAN COUNTRIES ______________
In European countries, the employment status of fully qualified teachers (whether in primary, lower secondary or upper secondary education) falls into two main categories. In more than half of these countries, teachers have civil servant status, although in only a minority of those countries are they appointed for life (as career civil servants). In the remaining countries, teachers are employed under contract and subject to general employment legislation. These two categories of employment status exist alongside each other in a few countries.
In the first category, teachers are civil servants employed by the public authorities whether at central, regional or local level. Teachers with this status are employed in accordance with a regulatory framework distinct from legislation governing contractual relations in the public or private sectors.
Figure D26: Types of employment status available to teachers in primary education and general (lower and upper) secondary education (ISCED 1, 2 and 3), 2006/07
Source: Eurydice. Additional notes Belgium: Teachers working in schools administered by each of the three Communities are appointed as civil servants. Teachers working in the grant-aided private sector are considered to be ‘assimilated’ to civil servant status although they are employed under general employment legislation. Germany: Teachers in some of the new Länder are employed under permanent government contracts. Broadly speaking, their status is comparable to that of a civil servant. Luxembourg: Certain teachers in primary and secondary education (chargés d’éducation) are recruited on temporary contracts by the public authority. Hungary: A small proportion of teachers working part-time are not civil servants.
Civil servant status
Career civil servant status
Public sector employee with contractual status
RESOURCES
164
Additional notes (Figure D26 – continued) Netherlands: Teachers in public-authority schools are civil servants within the meaning of the Central and Local Government Personnel Act. Teachers in private schools sign a (private law) contract with the board of the legal entity whose employment they enter. However, these staff may be deemed to share the status of public-sector personnel in respect of those working conditions that are determined by the government; collective agreements cover the whole education sector (both public-authority and private schools). Austria: Teachers are employed via a service contract (contract teachers) or by public law (career civil servants). Poland: The Figure refers to teachers in the first and second categories on the teacher promotion scale (contractual status) and those in the third and fourth categories (‘assimilated’ with career civil servant status). Iceland: Teachers at primary and lower secondary levels are appointed as public-sector employees while those at upper secondary level are civil servants. Norway: Some elements of civil service legislation apply to teachers. Explanatory note Only fully qualified teachers in the public sector are considered here (i.e. those who work in schools that are funded, managed and directly controlled by the public authorities), except in Belgium, Ireland and the Netherlands in which the majority of pupils attend grant-aided private schools (i.e. schools over half of whose basic funding is from the public purse). The temporary status prior to securing permanent tenure, which exists in some countries, is not considered here. The status of civil servant is that of a teacher employed by the public authorities (at central, regional or local level), in accordance with legislation distinct from that governing contractual relations in the public or private sector. In structured career systems, teachers are appointed for life as career civil servants by the appropriate central or regional authorities where these correspond to the top-level authority for education. Public-sector employee with contractual status refers to teachers employed generally by local or school authorities on a contractual basis in accordance with general employment legislation and with or without central agreements on pay and conditions.
Nevertheless, closer examination reveals that their employment on this basis varies from one country to the next and has to be defined more precisely. It is clear that career civil servants represent a sub-category. In career-based systems, teachers are recruited and employed by the central or regional authorities where these correspond to the top-level authority for education in a country (as do the Länder in Germany, the Autonomous Communities in Spain and the Communities in Belgium, as well as the Bundesländer in Austria in the case of compulsory school teachers). The concept of permanent appointment for life is very important, and teachers lose their jobs only under very exceptional circumstances. Belgian, German, Greek, Spanish, French, Cypriot, Luxemburger, Maltese, Dutch, Austrian, Polish, Portuguese teachers may be regarded as civil servants who are part of a structured career system.
Teachers who possess the third type of status are identified as ‘employees’. They are engaged on a contractual basis established in accordance with the general provisions of employment legislation. As public-sector employees, teachers may be employed by the public authorities (generally at local or school level), although the most common situation is for them to be directly employed by the school concerned.
As far as job security is concerned, the really sharp distinction is not between the status of civil servant and contractual employee but between that of career civil servant and the two other status categories.

SECTION I I – TEACHERS
165
SUPPORT FOR TEACHERS _____________________ IS INCREASINGLY REGULATED ______________________
Apart from specific problems encountered at the beginning of their careers and support measures to deal with them (Figure D23), teachers may be confronted at a particular point in their careers by situations that hinder them from performing their duties to full capacity. Under such circumstances, they may feel the need for assistance, and the provision of one or more types of support is normally very helpful. Four situations frequently encountered by teachers are identified here, namely problems of a personal nature, interpersonal conflicts involving pupils, parents and/or colleagues, difficulties related to teaching activity as such (for example, the introduction of a new subject into the curriculum, or the use of new teaching equipment or materials, etc.) and work with pupils with additional needs.
At the three levels of education concerned (primary, lower secondary and upper secondary), the majority of countries mainly offer special support (whether or not this is formal) to teachers who face problems of a specifically educational nature or more generally in their work with mixed groups of pupils. While support for teachers coping with conflicts is also a widespread situation, this kind of support does not however exist in three countries (namely Italy, Hungary and Romania). By contrast, psychological support in case of problems of a personal nature is less common. In certain countries it is even felt that support of this kind might presuppose explicit acknowledgement that teachers have a psychological problem.
In 2006/07, the various arrangements for supporting teachers confronted with the different kinds of situations listed below appear to be formally regulated in a wider number of countries than in 2002/03 (Figure D31 of Key Data on Education in Europe 2005). More than half of countries have established regulations or official recommendations for problem situations in which special support might be required. In the remaining countries, a regulatory framework establishing procedures for supporting teachers in difficulty applies solely to certain specific situations or is not provided for at all. Nevertheless, where the need arises, teachers who request help generally receive it on an informal basis.
Five countries or regions (the Flemish Community of Belgium, Bulgaria, Ireland, Cyprus and Turkey) have moreover indicated that reforms specifically focused on support for teachers are ongoing.
Figure D27: Regulations and/or recommendations on certain forms of support for teachers in primary education and general (lower and upper) secondary education (ISCED 1, 2 and 3), 2006/07
BE fr
BE de
BE nl BG CZ DK DE EE IE EL ES FR IT CY LV LT LU HU MT NL AT PL PT RO SI SK FI SE UK
(1) UK-SCT IS LI NO TR
A �� � � � � � � �� �� � � �� � � � � � � � � � �� � � � � � � � �
B � � � � � � � � � � � � � � � � � � � � � � � � � � � � � � �
C � � � � � � � � � � � � � � � � � � � � � � � � � � � � � � � � �
D � � � �� � � � � � � � � � � � � � � � � � � � � � � � � � � � � �
A Personal problems � Existence of regulations, recommendations and/or guidelines
(at central/regional/local level) B Conflicts
� Support exists but is not formal (not systematically organised) C Teaching problems
Kind of support not provided D Work with pupils with additional needs
UK (1): UK-ENG/WLS/NIR
Source: Eurydice.

RESOURCES
166
Additional notes (Figure D27) Denmark: In addition to existing permanent arrangements for the provision of guidance to members who have psychological problems with the working environment, the Danish Union of Teachers now offers guidance in connection with psychological problems as such. France: In primary education, there is formal support for teaching problems. Malta: Support from psychologists for personal problems arising in school situations was introduced during the 2002/03 school year. Netherlands: The forms of support shown in the Figure are organised at the discretion of the institutions. Iceland: In upper secondary education, informal support is arranged for categories C and D. Explanatory note For the purposes of this Figure, neither continuing professional development (CPD) nor salary bonuses are regarded as special assistance measures for teachers in service. Problems of a personal nature relate in particular to burnout, a form of stress characterised by physical and nervous exhaustion making it hard for the teachers concerned to carry out their duties effectively. Interpersonal conflicts involving pupils, parents and/or colleagues are primarily conflicts of a disciplinary nature with pupils (disruptive classroom behaviour, verbal and/or physical attacks on teachers, etc.). Teaching problems relate to problems teachers may have in adapting to new teaching methods, etc. Work with pupils with additional needs includes involvement with pupils in one or several specific categories such as those with special educational needs, pupils from immigrant backgrounds, those with social problems (disadvantaged backgrounds, social difficulties) and pupils of different learning ability (in that they either have considerable problems or perform to an exceptionally high level). Support from mainstream medical facilities in the national public health service (particularly in the event of personal problems) is not considered here.
SPECIALIST SUPPORT FOR READING DIFFICULTIES ______________ IS PROVIDED MOSTLY OUTSIDE THE CLASSROOM ______________
In primary education, the most important subject in terms of the amount of time spent on teaching it is the language of instruction. Generally, between one-quarter and one-third of teaching time is spent on it (Figure E2). Where reading difficulties arise for pupils, support from specialist personnel may prove helpful.
In those countries for which PIRLS 2006 data are available, some support for pupils with reading difficulties is available within classrooms. In most countries, less than 5 % of pupils in the fourth year of primary education have teachers who report that reading specialists are on hand in their classrooms to look after pupils with reading difficulties. In Belgium (Flemish Community), Poland and the United Kingdom (England) the proportion is slightly higher, with more than 10 % of pupils whose teachers report the availability of reading specialists in their classrooms.
Other specialists from outside the classroom, such as learning specialists or speech therapists, are more frequently available to support pupils with reading difficulties. In Belgium (Flemish Community), Denmark, Spain, Hungary, Netherlands, Poland, Slovenia, United Kingdom (Scotland) and Iceland, the teachers of more than 20 % of pupils report that such support staff are available. In both Latvia and Lithuania, the percentage amounts to over 40 %.
Teachers of around 5 % of pupils on average report the availability of other adults to help pupils with reading difficulties. This proportion ranges from less than 1 % in Germany, France and Romania to more than 10 % in Hungary and the United Kingdom (England and Scotland).
In some countries such as Italy, Austria, Sweden and Norway, there is little support available inside or outside the classroom, for pupils with reading difficulties.

SECTION I I – TEACHERS
167
Figure D28: Proportions of pupils in the fourth year of primary education whose teachers report
that specialists or other adults are on hand to look after pupils with reading difficulties, 2006
Reading specialists in class
Reading or other specialists out of class
Another adult
Country that did not contribute to data collection
EU-27 BE fr BE de BE nl BG CZ DK DE EE IE EL ES FR IT CY LV LT LU
4.9 0.4 11.5 2.8 4.0 0.1 5.1 2.7 0.0 8.2 1.9 4.2
15.2 18.0 20.6 9.9 28.8 7.2 37.8 3.9 1.7 42.1 45.8 11.0
5.2 4.0 5.2 6.1 2.1 0.2 1.5 0.7 9.1 1.9 1.6 2.7
HU MT NL AT PL PT RO SI SK FI SE UK-ENG UK-SCT IS LI NO TR
1.9 8.5 1.1 10.3 2.1 4.3 1.8 1.3 17.4 6.0 6.8 2.1
28.5 29.1 3.3 36.5 4.4 26.9 13.8 7.9 17.4 24.4 32.7 7.9
13.0 4.2 1.7 3.8 0.4 1.4 1.3 6.1 19.0 21.1 13.4 8.8
Source: IEA, PIRLS 2006 database. Explanatory note Teachers were asked in the questionnaire sent to them to indicate whether they received help when dealing with pupils who had difficulty reading. Replies from teachers were placed into three categories. The first category, ‘reading specialist in class’, consisted of replies from teachers who said that a reading specialist was on hand to provide help for pupils in difficulty in the classroom. The second category, ‘reading or other specialists out of class’ represents the availability of reading or learning specialists, speech therapists, etc., in remedial reading classrooms or special groups. Finally the third category, ‘another adult’, consisted of the replies from teachers who reported that an assistant or another adult was available to help pupils in difficulty in the classroom. The sampling procedure involved selecting schools and then pupils from a class in the fourth year of primary education. It sought to offer each pupil the same probability of being selected irrespective of the size of the school he or she attended. For this purpose, schools were weighted in such a way that the probability that they would be selected was inversely proportional to their size. This explains why the Figure does not directly show the proportions of teachers who gave a particular reply regarding the factor at issue, but the proportions of pupils whose teachers gave this reply. For further information on the PIRLS survey, see the Glossary and Statistical Tools section.

RESOURCES
168
IN THE MAJORITY OF COUNTRIES, THE EMPLOYMENT CONTRACT OF TEACHERS INCLUDES
_____________ COMMITMENTS OTHER THAN TIME SPENT TEACHING _____________
In most countries, working time is defined as the time allocated to two main activities, namely teaching in lessons on the one hand and the preparation of lessons and marking on the other. In many countries, additional activities are also included.
Overall working time corresponds to the number of hours a week negotiated in accordance with collective bargaining agreements or established otherwise. This concept is used in over half the countries covered.
A precise number of hours of availability at school for other activities, such as meetings or management duties, may also be specified as occurs in 14 countries. Most of them also specify the teaching hours and/or overall working time. In either case, the situation is the same in primary and secondary education.
The working time of teachers is contractually defined in terms of the number of teaching hours only, in just three European countries (Belgium, Ireland and Liechtenstein), while it includes both teaching hours and hours of availability at school in Greece, Italy, Cyprus, Luxembourg, Malta and Finland. A great many countries apply an overall number of working hours, which in principle covers all services performed by teachers, over and above the specified number of teaching hours.
Figure D29: Official definitions of the working time of teachers, primary and general (lower and upper) secondary level (ISCED 1, 2 and 3), 2006/07
Teaching hours Overall working hours
Hours of availability at school
Source: Eurydice.
Additional notes Belgium (BE fr, BE de): In primary education, a maximum number of hours of required presence at school (including time spent giving lessons) is also specified. Denmark: The time during which teachers have to be available at school is not shown because it is expressed solely in days (during the school year). Estonia: The time that teachers have to be available at school has not been shown because it is fixed at the discretion of each school.Italy: The overall number of working hours is not considered because this time is fixed solely in terms of a number of days (during the school year) and (non-quantifiable) activities that teachers have to carry out.

SECTION I I – TEACHERS
169
Additional notes (Figure D29 – continued) Luxembourg: Only teachers who are civil servants are shown. In the case of those on temporary contracts (chargés d’éducation), a number of hours of availability other than teaching hours is specified. Hungary: Since amendments to the legislation in September 2006, the hours of availability at school have been determined by the employer but not as clear-cut working hours. These amendments specify the tasks which might be completed by the teacher at the school and those which might be completed outside it. Turkey: No ISCED level 2 exists. The entire single structure (eight years for pupils aged from 6 to 14) is considered to be ISCED 1.
Explanatory note All information refers to situations in which teachers are working on a full-time basis. Teachers who are not yet qualified or who are beginning their career are not taken into account if they are subject to special timetable requirements. Official definitions relate to working time as defined in teachers’ contracts of employment, job descriptions or other official documents. These definitions are issued by the central authorities or regional authorities in countries in which the latter correspond to the top-level authority for education. The number of teaching hours refers to the time spent by teachers with groups of pupils. In some countries, this is the only contractually specified working time. It can be defined on a weekly or annual basis. The number of hours of availability at school refers to the time available for performing duties at school or in another place specified by the school head. In some cases, this refers to a specified amount of time further to the specified number of teaching hours and, in others, to a global amount of hours of availability that include the time spent teaching. It can be defined on a weekly or annual basis. Overall working hours are the number of teaching hours, the number of hours of availability at school and an amount of working time spent on preparation and marking activities which may be done outside the school. The number of hours may be either earmarked specifically for different activities or defined globally. It can be defined on a weekly or annual basis.
Finally, in three countries, namely the Netherlands, Sweden and the United Kingdom (England, Wales and Northern Ireland), the number of teaching hours that may be required of teachers is not specified at central level. In the Netherlands, only the overall working time is specified in the legislation. In Sweden, an overall annual amount of working time in hours is specified, along with time during which teachers should be present at school. However, it is worth noting that, in some Swedish schools, earlier calculations for determining the number of teaching lessons are still used within the new framework of working time. In the United Kingdom (England, Wales and Northern Ireland), the regulations specify the amount of time for which teachers should be available to perform duties at school or in another place as may be determined by the headteacher. These duties include teaching, planning, preparation and assessment (PPA), other activities connected with pupil well-being and progress, staff meetings, continuing professional development (CPD), meetings with parents and management duties. Maximum teaching time is not specified as such but, in England and Wales, there are now regulations on the balance between teaching on the one hand, and PPA on the other.
Where separate activities are specifically defined in hours in the weekly workload of full-time teachers, they may vary considerably from one country to the next (Figure D30).

RESOURCES
170
THE NUMBER OF WEEKLY TEACHING HOURS REQUIRED OF TEACHERS ________________ VARIES VERY WIDELY BETWEEN COUNTRIES ________________
In most countries, the number of teaching hours is specified in teachers' employment contracts (Figure D29). In general, countries specify either a number of teaching periods a week and their duration, or a number of hours of teaching per week. In 2006/07, the majority of teachers in Europe had to be actively engaged in teaching pupils between 18 and 20 hours a week, excluding normally planned breaks and any other contact time with pupils which does not involve teaching. There are however considerable variations between countries.
In general, countries tend to reduce the weekly teaching time of their teachers in lower and/or upper secondary education. Only Bulgaria and Romania substantially increase the number of hours concerned for teachers in secondary education. In a dozen countries, teachers are required to teach the same amount of hours for both lower and upper secondary education. Four countries, namely Latvia, Lithuania, Poland and the United Kingdom (Scotland), prescribe exactly the same amount of teaching time a week in both primary and secondary education.
Thirteen countries prescribe a precise amount of time that teachers should be available at school each week. Often these requirements are defined on an annual basis or in terms of a number of days rather than hours. However, notional weekly averages have been calculated wherever possible. In general, the amount of time that teachers are required to be present at school each week does not exceed 30 hours, except in Portugal, the United Kingdom (England, Wales and Northern Ireland) and Iceland.
Over half of all European countries also fix an overall number of working hours a week generally based on the corresponding amount of time for other workers and specified in collective bargaining agreements or established otherwise. This is in the great majority of these countries between 35 to 40 hours.
As far as the amount of time available at school and overall number of working hours are concerned, the situation is very similar between different levels of education in many countries.

SECTION I I – TEACHERS
171
Figure D30: Breakdown of the weekly workload of full-time teachers in hours
for primary and secondary education (ISCED 1, 2 and 3), 2006/07
ISCED 1 ISCED 2 ISCED 3
Overall working time Time available at school Teaching time
Source: Eurydice.

RESOURCES
172
Figure D30: Breakdown of the weekly workload of full-time teachers in hours
for primary and secondary education (ISCED 1, 2 and 3), 2006/07
ISCED 1 ISCED 2 ISCED 3
Overall working time Time available at school Teaching time Source: Eurydice.

SECTION I I – TEACHERS
173
Additional notes (Figure D30) Belgium (BE fr): The total annual amount of time for all services performed by teachers in primary education may not exceed 962 hours. It includes lessons, supervisory duties, meetings and consultation with colleagues (which correspond to at least 60 periods). Only time spent teaching is shown. Belgium (BE nl): The time shown in the ISCED 3 column relates to teachers working in the second year of the Algemeen Secundair Onderwijs; in the case of those working in the third and fourth years, the amount of teaching time each week is 16.7 hours. Denmark: The number of days per school year and the length of the breaks are not regulated by the ministry, but left to the discretion of the individual institutions. There might therefore be variations in the teaching hours. Germany: The 40 hours of overall time represent the average for all Länder. Estonia: The overall working time is 35 hours a week. Teachers may be required to stay in school for these 35 hours, but this is at the discretion of the individual school or school head. France: The ISCED level 2 data correspond to professeurs certifiés and ISCED level 3 data to professeurs agrégés. The professeurs certifiés also teach at ISCED level 3. Cyprus: The number of hours of teaching a week is the maximum number of hours, and depends on the number of years of service. Malta: The Figure shows teaching time, as well as time teachers should be available at school on full days. On half days, teaching time is 17.5 hours a week in primary education, 13 hours a week in general lower secondary education and 13 hours a week in general upper secondary education. Available time is 18.75 hours a week in all three cases. Netherlands: Only the number of days for teaching each year (200) and the overall number of hours each year (1 659) are specified. Portugal: Since 2007/08, teaching time for upper secondary level teachers has been 22 hours. Slovenia: In the case of teachers of the language of instruction, the amount of teaching time per week is 15.8 hours in ISCED 1 and 2, and 14.3 hours in ISCED 3. Time devoted to ‘other activities’ is included in teaching time. Finland: The time that teachers should be available at school does not include the annual 3-5 days of additional working time for teachers specified in collective bargaining agreements. United Kingdom (ENG/WLS/NIR): The Figure shows a notional weekly average based on the 1265 hours over 195 days that teachers must be available for teaching, planning and preparation, assessment and reporting, staff meetings and professional development etc. United Kingdom (SCT): Under the 2001 agreement on teachers’ pay and conditions, all tasks which do not require the teacher to be on the school premises can be carried out at a time and place of the teacher's choosing. Liechtenstein: Data for ISCED 3 do not relate to teachers of sports, music or arts who have 26 lessons a week, corresponding to 19.5 hours. Norway: The total number of working hours is expressed solely in hours per year (1 687.5). Turkey: Other than the compulsory teaching time, teachers may be required to teach extra hours subject to an extra payment. An ISCED level 2 does not exist. The entire single structure (eight years for pupils aged from 6 to 14) is considered to be ISCED 1. The Figure illustrates the situation within this single structure. Explanatory note The Figure shows the situation of a teacher working full-time who does not have other duties, such as management duties. Variations within a country are shown where they relate to specific factors such as the subject taught or the employment status of the teacher, or where they represent flexibility at school level to establish the number of teaching hours or time available at school for each teacher. Reduced timetable conditions for teachers who are not yet qualified or who are newly qualified are not shown; neither is the flexibility to reduce the number of hours in accordance with the length of service or when taking on other duties. The Figure gives information solely in hours per week. The real working time of teachers may also vary in accordance with the annual number of days of service. Official definitions relate to working time as defined in teachers' contracts of employment, job descriptions or other official documents. These definitions are issued by the central authorities, or regional authorities in countries where the latter correspond to the top-level authority for education. The number of hours of teaching a week refers to the time spent by teachers with groups of pupils. This number is calculated to exclude time for breaks or time spent with pupils that does not involve teaching. It is obtained by multiplying the number of lessons by the time each lesson lasts and dividing the product by 60. The number of hours of availability at school a week refers to the amount of time available, other than teaching time, for performing duties at school or in another place specified by the school head. Overall working hours a week are the number of teaching hours, the number of hours of availability at school, and the amount of working time spent on preparation and marking activities, which may be done outside the school.

RESOURCES
174
Explanatory note (Figure D30 – continued) Estimates have been made for countries where the status or contract of teachers does not refer to teaching time, time that teachers should be available at school, and/or overall working time. Where the obligations of teachers are determined on an annual basis, an average weekly number of hours has been calculated from the required number of days of presence at school and/or of overall working time, where possible. Estimates have been made for Germany (overall working time), Spain (teaching time), Romania (teaching time), Finland (time available at school, ISCED 2), Norway (time available at school) and Iceland (overall working time, ISCED 3).
_________ THE OFFICIAL RETIREMENT AGE FOR TEACHERS IS OFTEN 65 _________
In virtually all European countries, there is an official age of retirement which sets the limit beyond which teachers no longer continue their occupational activity, except in special circumstances. This upper age limit is in most cases 65 years of age. It is 60 in France and Poland (only for women), 64 in Liechtenstein and 67 in Norway. This official retirement age is the same for all three levels of education considered here.
In Bulgaria, the Czech Republic, Latvia, Lithuania, Slovenia and Slovakia, the official age of retirement corresponds to a lower age limit following which teachers may cease their occupational activity and secure a pension. The official age of retirement is below 65. Reforms are underway to place it between 60 and 65 years of age depending on the country concerned.
In more than half of the European countries, teachers are able to retire before they reach official retirement age. In general, the minimum age at which they can retire is around 60 and carries with it full pension entitlement when they have completed the number of years of service required. However, this number varies widely from one country to the next and is, for example, 15 years of service in Liechtenstein, 25 in Turkey and 40 in Belgium, Austria and Ireland. It should be noted that Italy and Portugal (until 2007) have retained arrangements for retirement after a certain number of years of service without specifying a minimum retirement age.
In Finland (in the case of teachers appointed after 1993) reaching the official age is the sole acceptable criterion for retirement, and it is not possible to retire any earlier.
In the majority of countries, the criteria governing the age of retirement are the same for both men and women. However, differences exist in Malta and in several central and east European countries. While, in most of these cases, women may secure their pension earlier than men, the tendency has been to lessen this difference between them. Ongoing reforms in the Czech Republic, Latvia, Slovenia and Slovakia are aiming to minimise it or abolish it altogether.

SECTION I I – TEACHERS
175
Figure D31: Retirement age of teachers
in primary and secondary education (ISCED 1, 2 and 3), 2006/07
Years Years
Women Men Both
Minimum retirement age (with full pension entitlement subject to completion of the number of years of service required)
Official retirement age(s) Number of years of service required for full pension entitlement in cases where retirement at a minimum age is possible
BE BG DE EE IE EL ES FR IT CY LV LT LU HU MT
41.25 ��� 35-37 �� 40 35 35 38.5 –39.5 40 33.3 �� �� 35 34-38 ��
NL AT PL PT RO SI SK FI SE UK IS LI NO TR
�� 40 30 36 25 (w), 30 (m)
36.3 (w), 40 (m) �� �� �� �� 35 15 30 25
� Retirement with full pension entitlement before the official retirement age is not possible Source: Eurydice.
Additional notes Belgium: The 41.25 years of service shown in the table contain the normal number of years necessary in order to obtain the diploma, the length of military service (if applicable) and the time potentially spent in other public services or equivalent. Bulgaria: In 2007, earlier retirement was possible for women at the age of 56, for men at 60. Czech Republic: Data relate to 2006. It is also possible to retire two or three years earlier but with a reduced pension. The retirement age for women shown relates to a childless woman. It is reduced in accordance with the number of children. According to existing legislation, the retirement age is gradually being raised with the aim of reaching 63 for men and for women without children. Denmark: At the minimum retirement age, all public-sector employees are entitled to a pension whose amount rises with the number of years of service. Estonia: In the case of women, the real retirement age depends on the year of birth. In 2007, women whose year of birth was 1947 (60 years) had the right to retire; in 2016 the official retirement age and the real retirement age will coincide. Ireland: Since 1 April 2004 new entrants and existing public servants who left or leave public service on or after 1 April 2004, and return following a break in service of at least 26 weeks, cannot in general receive pension benefits before attaining 65 years of age. France: 55 years for teachers in primary schools who still have instituteur status. Since 2003, the number of years of service required has been changing progressively and reached 40 in 2008. Cyprus: There is no legal minimum retirement age. A teacher receives a full pension when s/he has completed 400 months of service (or 33.33 years). Latvia: The retirement age for women is being gradually increased until it reaches 62 in 2009. Austria: The Figure illustrates the situation of teachers who are civil servants. In the case of teachers employed under contract, the retirement age is 60 for women and 65 for men. The number of years required for full pension entitlement is 40 and 45 years respectively for contract teachers.

RESOURCES
176
Additional notes (Figure D31 – continued)
Poland: The arrangement for retirement with full pension entitlement before the official retirement age was valid until the end of 2008. Portugal: From January 2006, the retirement age of teachers is being brought gradually closer to 65 at a rate of 6 months a year over 10 years. For full pension entitlement, 36 years and 6 months of service are required, with 6 months a year added until 40 years of service are reached. Romania: The law of 2000, which is being progressively implemented between 2000 and 2013, sets the retirement age at 60 for women and 65 for men. The number of years of service required is being raised to 30 for women and 35 for men. Slovenia: The 1999 law, which is being progressively implemented up to 2014, fixes the official age of retirement at 58 for both women and men, subject to their having completed 38 and 40 years of service respectively. Slovakia: According to existing legislation, the retirement age is 62 years for women and men, but the retirement age for men has been gradually raised over a period of 2 years, and for women over a period of 10 years. Finland: Retirement is at 65 years for those who entered service on or after 1 January 1993. For those who were employed before that date, the retirement age alternates between 60 and 65 years. United Kingdom (ENG/WLS/NIR): The retirement age for new teachers is 65. Teachers who were pension scheme members prior to 1 January 2007 (1 April 2007 in Northern Ireland) can retire with an unreduced pension at 60. Iceland: Teachers appointed before 1997 may retire after 35 years of service provided they have reached the age of 60, after 34 years of service if they have reached the age of 61, and so on.
LENGTH OF SERVICE ___________ IS THE MAIN FACTOR INFLUENCING TEACHER SALARIES ___________
In order to compare the financial situation of teachers in the various countries, Figure D32 sets out the
minimum and maximum basic gross teacher salaries, by educational level, as a percentage of per capita
Gross Domestic Product (GDP), which is an indicator of the standard of living of a country’s population.
However, it should be however noted that the basic salary excludes salary allowances and benefits other
than those linked to length of service. These elements, which may represent a significant proportion of a
teacher’s salary in some countries, are not taken into account in Figure D32.
Except in Sweden, teacher salaries in all countries are fixed with reference to a salary scale generally
determined at national level. Where teachers are career civil servants (Figure D26), the salary scale may be
established for the entire civil service, even if it includes special features related to the particular
characteristics of the teaching profession. Criteria governing progression on the scale, as well as the speed
of movement up it and the number of grades vary from one country to the next. The most common criteria
include the number of years of service, additional qualifications and merit, etc. In some countries, salaries
may rise in accordance with individual criteria considered separately, whereas in other cases the same
criteria are considered in combination. For this reason, the salaries of teachers at the beginning and end of
their career may vary. The Figure therefore illustrates the minimum and maximum extremes of the basic
salary scale without taking account of criteria other than the length of service.
In 15 countries or regions, minimum and maximum basic teacher salaries are identical at all three
educational levels (primary, lower secondary and upper secondary). The majority are noteworthy for offering
single structure education (Figure B1).
The basic salaries of teachers are also observed to be the same in both primary and lower secondary
education in Belgium, Denmark, Germany, Austria (Volksschulen and Hauptschulen teachers) and Iceland. A
comparable situation exists in both lower and general upper secondary education in Spain, France, Cyprus,
Luxembourg, Austria (allgemein bildenden höheren Schulen teachers) and Romania. Finally, in three other
countries (Italy, Finland and Sweden), salaries rise with the level of education at which teachers work.

SECTION I I – TEACHERS
177
Figure D32: Minimum and maximum basic gross annual teacher salaries
relative to per capita GDP (ISCED 1, 2 and 3), 2006/07
ISCED 1 ISCED 2 ISCED 3
Minimum Maximum UK (1): UK-ENG/WLS/NIR
Sources: Eurostat and Eurydice.

RESOURCES
178
Data (Figure D32)
BE fr BE de BE nl BG CZ DK DE a DE b EE IE EL ES FR IT CY LV LT LU HU
ISCED 1 Min 85.1 85.1 88.7 56.1 53.6 87.8 108.9 0.0 51.4 72.8 65.0 115.2 75.1 66.5 72.7 68.6 42.9 64.6 63.1 Max 146.0 149.9 151.5 69.6 90.5 103.9 149.9 0.0 75.6 141.5 112.6 166.4 149.0 97.4 140.7 71.0 63.0 134.0 122.0
ISCED 2 Min 85.1 85.1 88.7 56.1 53.6 87.8 108.9 122.6 51.4 72.8 65.0 132.4 79.3 72.2 72.7 68.6 42.9 94.7 63.1 Max 146.0 149.9 151.5 69.6 90.5 103.9 149.9 166.8 75.6 141.5 112.6 187.6 153.1 108.0 159.2 71.0 63.0 164.6 150.3
ISCED 3 Min 105.7 106.5 110.1 56.1 53.6 100.7 122.6 0.0 51.4 72.8 65.0 132.5 79.3 72.2 72.7 68.6 42.9 94.7 67.8 Max 184.5 190.1 191.1 69.6 90.5 119.1 209.1 0.0 75.6 141.5 112.6 187.6 187.3 113.3 159.2 71.0 63.0 164.6 150.3
MT NL AT a AT b PL PT RO SI SK FI SE UK (1) UK-SCT IS LI NO a NO b TR
ISCED 1 Min 47.4 91.9 79.3 0.0 37.0 97.3 54.4 113.4 50.0 92.1 70.7 109.7 92.5 65.3 : 65.3 0.0 99.0 Max 56.7 144.6 158.0 0.0 162.6 282.5 103.2 161.7 72.2 122.5 88.6 186.1 147.5 80.8 : 77.0 0.0 120.2
ISCED 2 Min 47.4 95.3 79.3 90.0 37.0 97.3 61.8 113.4 50.0 101.3 73.3 109.7 92.5 65.3 : 65.3 70.3 99.0 Max 56.7 191.2 158.0 190.7 162.6 282.5 126.8 161.7 72.2 134.2 103.7 186.1 147.5 80.8 : 77.0 92.1 120.2
ISCED 3 Min 47.4 95.3 90.0 0.0 37.0 97.3 61.8 113.4 50.0 104.0 81.4 109.7 92.5 68.4 : 65.3 70.3 99.0 Max 56.7 191.2 190.7 0.0 162.6 282.5 126.8 161.7 72.2 142.4 112.0 186.1 147.5 86.9 : 77.0 92.1 120.2
UK (1): UK-ENG/WLS/NIR
Sources: Eurostat and Eurydice. Additional notes
Belgium: National per capita GDP is taken into account (instead of per capita GDP in each Community). Denmark: The main part of the salary is based on collective agreements decided at central level. The maximum basic salary shown in the Figure is only the amount agreed on at central level. Germany: Given the complexity and wide variety of circumstances, teacher salaries are calculated with reference to the average age at the start of a career (which depends on the age at which studies begin and how long they last) and to salaries in the west German Länder. The data relating to ISCED 3 refer to Gymnasium teachers. (a): At ISCED 2, data correspond to the salaries of Realschule and Gymnasium teachers. Teachers at Gymnasium receive the same salary, regardless of the level (ISCED 2 or 3). (b): At ISCED 2, data correspond to the salaries of Hauptschule teachers. Estonia: The amount of the minimum salary (according to occupational grade) which is established at central level is not mandatory for establishing the actual amount. Establishment of salary conditions and amounts for school personnel are subject to the participation of the local authorities. Those authorities must first reach an agreement on salaries with schools before following the minimum salary amount established at central level. Spain: The total amounts correspond to average salaries in public education, calculated as the mean of the salaries in the different Autonomous Communities weighted by the number of teachers in each Autonomous Community. France: For ISCED level 2, salaries refer to professeurs certifiés. They may become professeurs agrégés (through competition or promotion). For ISCED 3, the minimum salaries shown are those of professeurs certifies whereas maximum salaries refer to the situation of professeurs agrégés. Latvia: Teacher salaries are based on seniority and workload. There are three grades of seniority: less than 5 years, 5 to 10 years and more than 10 years. Hungary: These data include bonuses, increases and allowances, and correspond to estimates of average salaries for all teachers. Netherlands: Minimum and maximum salaries refer to salaries at the start of the career and after 18 years respectively. Austria: The data refer to the 2006 calendar year. Data relating to ISCED 3 relate to teachers in Hauptschulen. (a): Data relating to ISCED 2 correspond to the salaries of Hauptschule teachers. (b): Data relating to ISCED 2 correspond to the salaries of allgemein bildenden höheren Schulen teachers. Poland: Since January 2008, the minimum basic salary has been increased by 19 %. Portugal: Only the salaries of teachers who hold a Licenciatura are shown. The food allowance is included. Romania: Only the salaries of institutor are shown. Basic salaries are calculated in accordance with the following criteria: teaching position and rank, the level of initial training and seniority. Finland: The amount of maximum salaries may vary extensively depending on teachers’ years of service and individual increments. The information shown provides an estimate of the annual basic gross maximum salary. Sweden: There is no salary scale. Salaries are based on individual agreements between the teachers and the employers. No information is available on either minimum and maximum salaries, or on teachers’ experience counted as years in the occupation. The data refer to average teacher salaries per educational level in November 2006 (2006/07 school year), while the information on the minimum and maximum salaries corresponds to the 10th and 90th percentiles respectively.

SECTION I I – TEACHERS
179
Additional notes (Figure D32 – continued) United Kingdom (ENG/WLS/NIR): Salaries shown include inner London allowance. Allowances are also payable in outer London and the London fringe. The rest of England, Wales and Northern Ireland operate common pay scales. The maximum shown is the top of the upper pay scale. This is the level to which all good classroom teachers may aspire, although progression to the maximum is not automatic. Iceland: Only basic salaries are shown. Possible additional payments (for overtime, extra responsibilities) are generally considerable. Liechtenstein: Per capita GDP not available. Norway: (a): Data relating to ISCED 2 refer to the salaries of adjunkt. (b): Data relating to ISCED 2 refer to the salaries of lektors. Turkey: No ISCED level 2 exists. The entire single structure (eight years for pupils aged from 6 to 14) is considered to be ISCED 1. Teacher salaries are increased twice a year (on 1 January and 1 July). The information shown in the Figure is calculated on the basis of June 2006 and January 2007 salaries with equal weightings.
Explanatory note The data relate to teachers with the minimum qualifications required who are single, childless and work in the capital city of their country. The reference calendar year for per capita GDP is 2006. The reference period for salaries is the calendar year 2006 or the 2006/07 school year. The values indicated in the diagram are obtained by establishing a relation between the (minimum and maximum) basic gross annual salary in national currency and per capita GDP (at current prices in national currency) in the country concerned. The basic gross annual salary is the amount paid by the employer in a year, including general increases to salary scales, the 13th month and holiday pay (where applicable), etc. less employers’ social security and pension contributions. This salary does not include other salary allowances or financial benefits (related for example to further qualifications, merit, overtime, additional responsibilities, geographical location, the obligation to teach classes in challenging circumstances, or accommodation, health or travel costs). The minimum salary is the salary received by teachers in the above-mentioned circumstances, at the start of their career. The maximum salary is the salary received by teachers in the above-mentioned circumstances on retirement or after a certain number of years of service, without taking into account salary adjustments or financial benefits linked to any criteria other than length of service.
In the majority of countries, minimum basic teacher salaries in primary and general lower secondary education are lower than per capita GDP. Teachers therefore need to have completed a certain number of years in service and/or to have satisfied other conditions before their salary is higher than per capita GDP. In Bulgaria, the Czech Republic, Estonia, Latvia, Lithuania, Malta, Slovakia, Iceland and Norway, the basic gross annual salaries of teachers working in primary, lower and upper secondary education remain less than per capita GDP.
The relation between maximum and minimum basic annual salaries is a pointer to the long-term prospects of teachers in terms of salary increases they can reasonably expect throughout their careers if only their length of service is taken into account. On this basis, maximum and minimum levels generally differ by less than a factor of two. In Bulgaria, Estonia, Latvia, Lithuania, Malta, Slovakia and Norway, teachers may hope for no more than very modest salary increases. However, in Cyprus, Hungary, Austria, Poland and Portugal for instance, salaries may reach more than double their original level.
This fact, together with the frequency of salary increases, may explain why teaching may be more attractive at some stages of a career than others. Clearly, teachers whose salaries rise significantly throughout their entire career may be less inclined to leave the profession than those whose salaries do not progress beyond the first few years of experience.

RESOURCES
180
TEACHERS REPRESENT ON AVERAGE 2 % OF THE ACTIVE POPULATION ________________________ IN EUROPEAN COUNTRIES ________________________
In 2006, teachers in primary and lower secondary education generally accounted for at least 1.5 % of the economically active population in all European countries. Teachers were weakly represented in Bulgaria (1.2 %) and accounted for 3.2 % of the active population in Lithuania and Malta. The proportion of teachers in the total active population varies by a factor of between one and almost two, depending on the country concerned. In 2005/06, teachers in primary and lower secondary education accounted for between 1.2 % of the active population (Bulgaria) and at least 2.5 % (Iceland and Norway). It is in Lithuania and Malta that they represent the highest proportion of the active population (3.2 %).
However, cross-country comparison of the percentages should be treated with caution because of the very different ways in which education systems are organised (in terms of the length of compulsory education and teachers’ working time) and demographic factors (variations in the active population as a proportion of the total population).
Figure D33: Teachers in primary and lower secondary education (ISCED 1 and 2) as a percentage of the total active population, public and private sectors combined, 2006
EU-27 BE BG CZ DK DE EE IE EL ES FR IT CY LV LT LU HU MT NL AT PL PT RO SI SK FI SE UK IS LI NO TR
: 2.3 1.2 1.4 : 1.6 1.8 1.3 2.1 1.6 1.7 1.8 1.7 1.9 3.2 1.6 2.1 3.2 1.6 1.7 2.1 2.1 1.4 1.4 1.5 1.7 2.2 1.3 2.5 : 2.7 1.6
Source: Eurostat, UOE and Labour force survey (data extracted July 2008). Additional notes Belgium: Teachers in the German-speaking Community and those working in independent private institutions are not included. Luxembourg: The Figure relates solely to the public sector. Netherlands: ISCED 0 is included. Explanatory note Only teachers involved in providing direct instruction are taken into account. The data include teachers in special education and others who work with pupils as a whole class in a classroom, with small groups in a resource room, or on a one-to-one basis inside or outside a regular classroom. Staff assigned tasks other than teaching, and trainees or teachers’ assistants are not included. Both full-time and part-time working teachers in the public and private sectors at ISCED levels 1 and 2 are included in the numerator. The active population corresponds to the total number of employed and unemployed persons in the population. Data concerning the active population (in the denominator) are derived from the Labour Force Survey.

SECTION I I – TEACHERS
181
WOMEN TEACHERS OUTNUMBER MEN IN PRIMARY AND SECONDARY EDUCATION __________ BUT ARE UNDER-REPRESENTED IN TERTIARY EDUCATION __________
Women account for the majority of teachers in primary and secondary education. However, their representation decreases markedly the higher the level of education in all countries for which data are available.
In 2006 in all European countries (except Greece, Luxembourg, Liechtenstein and Turkey) over 60 % of teachers in primary and secondary education (ISCED 1, 2 and 3) were women. In four countries (Bulgaria, Estonia, Latvia and Lithuania), 80 % of teachers at these levels were women.
This contrasts sharply with the representation of women at tertiary education levels (ISCED 5 and 6). Women teachers represent less than 50 % of all teachers in tertiary education in all countries with the exception of Latvia and Lithuania. In half of the countries their participation is below 40 %. The drop in female representation at tertiary level compared to ISCED levels 1-3 is very marked in Malta and Slovenia.
Figure D34: Percentage of women teachers in primary and secondary education (ISCED 1, 2 and 3) and tertiary education (ISCED 5 and 6), public and private sectors combined, 2006
ISCED 1-3 ISCED 5-6 EU-27 BE BG CZ DK DE EE IE EL ES FR IT CY LV LT LU HU MT NL AT PL PT RO SI SK FI SE UK IS LI NO TR
: 66.1 81.2 72.2 : 64.4 85.5 72.8 59.7 62.5 65.7 77.8 69.3 85.6 84.3 58.2 78.7 70.2 66.3 69.7 75.9 72.0 71.9 78.4 76.4 69.4 68.5 67.8 72.1 59.2 66.2 45.2
: 41.4 45.8 37.6 : 34.8 : 38.3 34.8 38.9 37.1 34.1 39.8 57.0 52.8 - 39.1 28.4 36.3 34.6 41.5 43.0 42.8 33.8 42.0 47.7 43.1 40.8 44.3 - 39.9 38.8
Source: Eurostat, UOE (data extracted July 2008). Additional notes Belgium: Teachers in the German-speaking Community and those working in independent private institutions are not included. ISCED 3 includes ISCED 4. Ireland, Finland and United Kingdom: ISCED 3 includes ISCED 4. Luxembourg: The Figure relates solely to the public sector. Netherlands: ISCED 1 includes ISCED 0. Finland: At ISCED levels 5-6 the data on academic staff includes only teaching personnel. Research personnel are excluded. Previously research personnel were also included in academic staff at ISCED levels 5-6. Sweden: Postgraduate students performing teaching tasks are included in academic staff. Iceland: ISCED 3 partially includes ISCED 4. Explanatory note Only teachers involved in providing direct instruction are taken into account. Data include teachers in special education and all others who work with pupils as a whole class in a classroom, with small groups in a resource room, or on a one-to-one basis inside or outside a regular classroom. Both full-time and part-time working teachers in the public and private sectors are included. Trainees or teachers’ assistants are not included.
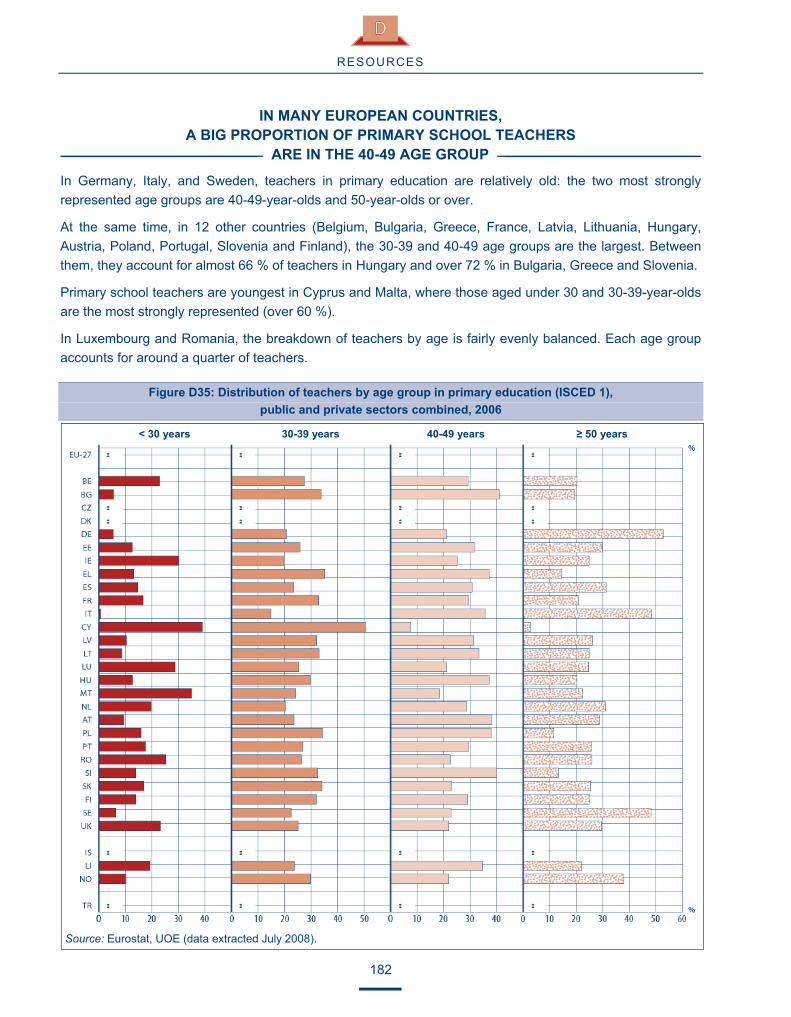
RESOURCES
182
IN MANY EUROPEAN COUNTRIES, A BIG PROPORTION OF PRIMARY SCHOOL TEACHERS
______________________ ARE IN THE 40-49 AGE GROUP ______________________
In Germany, Italy, and Sweden, teachers in primary education are relatively old: the two most strongly represented age groups are 40-49-year-olds and 50-year-olds or over.
At the same time, in 12 other countries (Belgium, Bulgaria, Greece, France, Latvia, Lithuania, Hungary, Austria, Poland, Portugal, Slovenia and Finland), the 30-39 and 40-49 age groups are the largest. Between them, they account for almost 66 % of teachers in Hungary and over 72 % in Bulgaria, Greece and Slovenia.
Primary school teachers are youngest in Cyprus and Malta, where those aged under 30 and 30-39-year-olds are the most strongly represented (over 60 %).
In Luxembourg and Romania, the breakdown of teachers by age is fairly evenly balanced. Each age group accounts for around a quarter of teachers.
Figure D35: Distribution of teachers by age group in primary education (ISCED 1), public and private sectors combined, 2006
< 30 years 30-39 years 40-49 years � 50 years
Source: Eurostat, UOE (data extracted July 2008).

SECTION I I – TEACHERS
183
Data (Figure D35)
EU- 27 BE BG CZ DK DE EE IE EL ES FR IT CY LV LT LU HU MT NL AT PL PT RO SI SK FI SE UK IS LI NO TR
<30 years : 22.9 5.7 : : 5.5 12.6 30.2 13.2 14.7 16.8 0.8 39.1 10.5 8.7 28.8 12.9 35.0 19.8 9.5 16.0 17.6 25.3 13.9 17.1 14.0 6.6 23.4 : 19.4 10.3 :
30-39 years : 27.5 33.8 : : 20.7 25.9 20.0 35.3 23.4 32.9 15.0 50.5 32.1 33.1 25.5 29.7 24.3 20.4 23.6 34.4 27.1 26.3 32.7 34.2 32.0 22.6 25.3 : 23.9 29.9 :
40-49 years : 29.2 41.0 : : 21.0 31.7 25.1 37.2 30.7 29.5 35.8 7.6 31.2 33.4 21.1 37.1 18.4 28.8 38.3 37.9 29.6 22.5 40.1 23.2 29.0 22.7 21.8 : 34.7 21.9 :
� 50 years : 20.3 19.5 : : 52.7 29.8 24.8 14.4 31.2 20.8 48.5 2.8 26.2 24.9 24.6 20.3 22.3 31.0 28.6 11.7 25.7 25.9 13.2 25.5 25.0 48.2 29.5 : 22.0 37.9 :
Source: Eurostat, UOE (data extracted July 2008). Additional notes Belgium: Teachers in the German-speaking Community and those working in independent private institutions are not included.Luxembourg: The Figure relates solely to the public sector. Netherlands: Teachers at ISCED level 0 are included. Explanatory note Only teachers involved in providing direct instruction are taken into account. Data include teachers in special education and others who work with pupils as a whole class in a classroom, with small groups in a resource room, or on a one-to-one basis inside or outside a regular classroom. Both full-time and part-time working teachers in the public and private sectors are included. Trainees or teachers’ assistants are not included.
FEW TEACHERS IN SECONDARY EDUCATION ____________________________ ARE UNDER 30 ____________________________
In the majority of countries with the exception of Malta, teachers in secondary education are older than those in primary education (see Figure D35), where the percentage of those aged 40 is not as high.
In Germany, Italy, the Netherlands, Sweden and Norway, teachers aged 50 or over account for more than 40 % of all teachers. Very low numbers of teachers under 30 years of age are to be found in Bulgaria, Germany, Italy, Austria, Finland, Sweden and Norway.
Teachers in secondary education are youngest in Malta and Portugal. In Portugal, the 30-39-year-old age group is the most strongly represented numerically, while in Malta those aged under 30 account for a third of all teachers.

RESOURCES
184
Figure D36: Distribution of teachers by age group in secondary education (ISCED 2 and 3), public and private sectors combined, 2006
< 30 years 30-39 years 40-49 years � 50 years
EU-27 BE BG CZ DK DE EE IE EL ES FR IT CY LV LT LU HU MT NL AT PL PT RO SI SK FI SE UK IS LI NO TR
<30 years : 15.8 9.8 : 10.3 3.2 10.3 13.9 5.4 7.8 10.0 0.0 15.6 15.3 13.1 19.1 14.0 31.3 10.7 6.2 20.8 12.1 23.5 10.4 16.3 8.5 8.9 17.6 10.3 11.7 6.8 :
30-39 years : 22.7 26.3 : 27.3 20.7 17.8 27.7 23.9 31.5 29.1 6.0 25.8 22.1 24.3 25.3 26.9 31.8 17.3 21.2 32.7 35.8 23.9 31.6 22.0 25.2 24.8 25.7 25.9 30.1 24.0 :
40-49 years : 29.0 32.5 : 21.9 26.7 32.0 25.7 41.3 34.8 24.6 30.9 38.6 30.9 32.2 25.3 29.6 15.5 28.9 42.9 28.1 32.0 19.6 34.0 25.7 29.4 24.0 26.2 29.9 31.3 23.6 :
� 50 years : 32.4 31.5 : 40.5 49.5 39.9 32.7 29.4 25.9 36.3 63.0 19.9 31.8 30.4 30.3 29.5 21.4 43.2 29.8 18.4 20.1 33.0 24.0 36.0 36.9 42.4 30.5 34.0 27.0 45.7 :
Source: Eurostat, UOE (data extracted July 2008).
Additional notes Belgium: Teachers in the German-speaking Community and those working in independent private institutions are not included. Teachers at ISCED level 4 are included. Denmark: Teachers at ISCED level 1 are included. Ireland, Finland and United Kingdom: Teachers at ISCED level 4 are included. Luxembourg: The Figure relates solely to the public sector. Iceland: Teachers at ISCED level 4 are partially included. Explanatory note Data take account of teachers involved in providing direct instruction. They include teachers in special education and others who work with pupils as a whole class in a classroom, with small groups in a resource room, or on a one-to-one basis inside or outside a regular classroom. Both full-time and part-time working teachers in the public and private sectors are included. Trainees or teachers’ assistants are not included.

SECTION I I – TEACHERS
185
A MAJORITY OF TEACHERS _____________________ RETIRE AS EARLY AS POSSIBLE _____________________
Overall, in countries for which data are available, the great majority of teachers retire from their profession as soon as they are offered an opportunity to do so, whether in primary or secondary education. Teachers thus retire when they have completed the required number of years and/or reached the minimum age for full pension entitlement. However, in Denmark (in secondary education), Germany, Ireland, Romania and Slovenia (in secondary education), a significant percentage of teachers remain in their occupation after the minimum retirement age.
Estonia, Lithuania and Slovakia (secondary education) are the only countries where a significant proportion of teachers (around 5 %) continue working beyond official retirement age. In these countries, teachers close to retirement receive fairly low basic salaries (relative to per capita GDP), which may partially explain this situation if other existing salary adjustments or financial benefits are not taken into account (Figure D32).
The same data may also be used to forecast which countries risk experiencing problems of teacher shortage in the years ahead, if the situation remains unchanged in all other respects. Countries where proportions of teachers in successive age groups over 40 first peak at a high level and then fall, as in Germany or Italy (especially in the case of secondary education), will experience teacher retirement on a very large scale in the near future. The demographic bulge in the diagrams for these countries indicates that the age groups closest to retirement are over-represented. In Germany and Italy (in secondary education), almost 70 % of teachers will retire in the next 20 years. By contrast, in countries where the proportions tend to decrease through the older age groups, as in Belgium (in the case of primary education), Bulgaria, Ireland, Greece (in primary education), Spain, Latvia, Lithuania, Hungary, Austria, Portugal (in secondary education in particular), Slovenia, Iceland or Liechtenstein, retirements will occur more evenly over time.
Cyprus (in the case of primary education) and Malta are two of the very few countries for which the diagrams represent a very gentle slope and low percentages in the age groups close to retirement. This indicates that their teachers as a whole are evenly spread across these age groups and are fairly young. Indeed, almost 90 % of Cypriot teachers in primary education and 60 % of Maltese teachers are under 40. In these countries, few teachers will retire in the next 20 years and almost the same numbers will do so annually.
Additional notes (Figure D37) Belgium: Teachers in the German-speaking Community and those working in independent private institutions are not included. Teachers in the French Community working in education for ‘social advancement’ are not included. Belgium and United Kingdom: Teachers at ISCED 4 are included. Denmark and Iceland: Teachers at ISCED level 1 are included in ISCED 2. Luxembourg: The Figure relates solely to the public sector. Netherlands: Teachers at ISCED 0 are included in ISCED 1. Finland: ISCED 3 includes ISCED 4 Iceland: Teachers at ISCED 4 are partially included in ISCED 3. Explanatory note Data take account of teachers involved in providing direct instruction. They include teachers in special education and others who work with pupils as a whole class in a classroom, with small groups in a resource room, or on a one-to-one basis inside or outside a regular classroom. Both full-time and part-time working teachers in the public and private sectors are included. Trainee or auxiliary teachers are not included. Further information on the representation of teachers by age group is given in Figures D35 and D36.

RESOURCES
186
Figure D37: Proportions of teachers in age groups close to retirement
in primary education (ISCED 1) and secondary education (ISCED 2 and 3), public and private sectors, 2006
ISCED 1 ISCED 2 and 3 ISCED 1 ISCED 2 and 3
Women Men and women/men only
Official retirement age � Minimum retirement age with full pension entitlement Sources: Eurostat, UOE (data extracted July 2008); Eurydice: 2006/07.
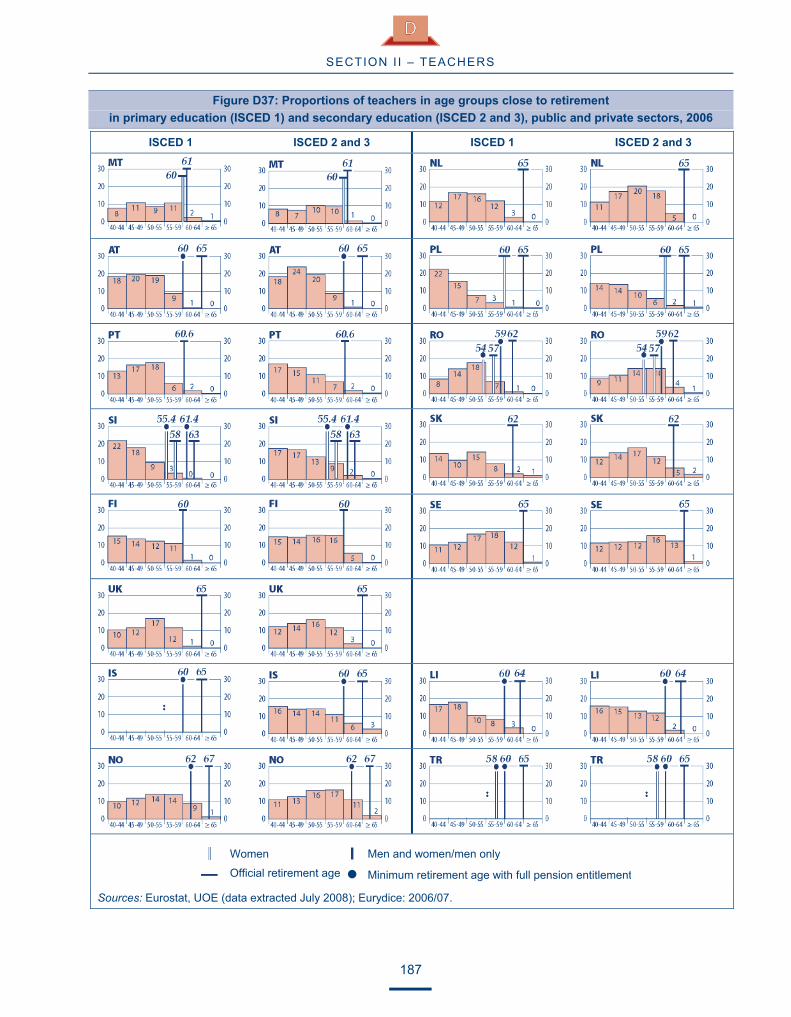
SECTION I I – TEACHERS
187
Figure D37: Proportions of teachers in age groups close to retirement in primary education (ISCED 1) and secondary education (ISCED 2 and 3), public and private sectors, 2006
ISCED 1 ISCED 2 and 3 ISCED 1 ISCED 2 and 3
Women Men and women/men only
Official retirement age � Minimum retirement age with full pension entitlement Sources: Eurostat, UOE (data extracted July 2008); Eurydice: 2006/07.


189
R E S O U R C E S
SECTION III – MANAGEMENT STAFF
PROFESSIONAL EXPERIENCE AND SPECIFIC TRAINING OFTEN REQUIRED ________________________ TO BECOME A SCHOOL HEAD ______________________
With growing school autonomy in many countries (Figure B15), school heads are confronted today with more tasks concerning management of the teaching staff, funding and curricular content. Selection criteria are therefore crucial and a number of different preconditions are considered in appointing someone as a school head. They may include in particular professional teaching experience, administrative/managerial experience or special training for headship. In nearly all European countries, there are official documents which set out the requirements expected of those wishing to become school heads, regardless of whether the school concerned provides the whole of compulsory education or a single level of education.
Only five countries, namely Latvia, the Netherlands, Sweden, Iceland (in upper secondary education) and Norway do not officially stipulate any requirement other than having a teaching qualification as a condition for appointment to the position of school head. However in practice, those who become school heads have professional teaching experience. In Sweden, those who have acquired skills in the educational field as a result of training or experience may be promoted to headships, and it is recommended that they should undergo special training after taking up their post.
In countries where official documents set out requirements that have to be met by future school heads, professional teaching experience is the minimum condition for appointment. However its required duration varies (Figure D39). In several countries, this condition is supplemented by one or more other conditions. In Belgium (French and German-speaking Communities, the Czech Republic, Estonia, Spain, France (for secondary levels), Italy, Austria, Poland, Slovenia and Liechtenstein, applicants for a post as school head must have worked as teachers and received special training. A qualification as a counsellor or mentor is also part of the professional experience required in Slovenia. Prospective school heads in Malta must not just have teaching and administrative experience but also have undergone special training prior to appointment. In the United Kingdom (England, Wales and Northern Ireland), a specific qualification, the National Professional Qualification for Headship is mandatory for all first-time headteachers. In Cyprus, Portugal, Finland and Turkey, school heads must have both teaching and administrative experience.
In 12 countries, prospective school heads must have received special training for headship. In most cases, they must also have fulfilled this requirement before taking up their responsibilities. However, in the Czech Republic, training takes place following their appointment. In Austria, prospective school heads are obliged to take several training modules if they wish to secure permanent appointment. In France, those who perform successfully in the competitive examination for management staff receive training in two stages, on successful completion of which they are admitted with full tenure. The minimum duration of compulsory training for school heads varies very widely from one country to the next. It lasts only a few hours in some of the Spanish Autonomous Communities, but one year full-time in Malta and Liechtenstein.
In many European countries, school heads are able to receive optional training after they have been appointed and it is strongly recommended that they do so. Its content and length depend on the body providing it.
All countries providing special training for headship include in it educational or teaching aspects, administrative aspects, and aspects relating to the management of school resources, including finances.

RESOURCES
190
Figure D38: Professional experience and training for headship officially required in order to be a school head
in primary, general lower and upper secondary education (ISCED 1, 2 and 3), 2006/07
Countries requiring a minimum period of compulsory training before or after appointment to the post of school head. Primary and general secondary education, 2006/07 BE fr 120 hours � FR 70 days � PL 200 hours � CZ 100 hours � IT 160 hours � SI 144 hours � EE (a) 160 hours; (b) 240 hours � MT 1 year � UK ENG/WLS Variable � ES Variable � AT 200 hours LI 1 year ��
� Before appointment � After appointment �Source: Eurydice.
Additional notes Belgium (BE fr): The new training has been in force since February 2007. Belgium (BE de): To be appointed permanently to the position of school head in an establishment administered by the Community, a management certificate is required. Czech Republic: Teaching experience can be substituted by experience in activities requiring the same or similar knowledge, or in a senior management position. This applies also to school heads in the entire grant-aided private sector. Training is compulsory only for heads of public schools or schools established by the Ministry of Education, Youth and Sports. Estonia: Duration of training for (a) algkool school heads and (b) põhikool school heads. Since 2004, persons who have at least three years of management experience and have passed the special training may also apply to be school heads. Spain: Duration of training depends on the Autonomous Community and the training institution concerned. Luxembourg: The post of school head does not exist in primary education. Hungary, Netherlands, Slovenia, Slovakia and Iceland: The information also applies to school heads in the entire grant-aided private sector.
ISCED 1 ISCED 3
Professional experience in teaching
Professional experience in teaching and administrative experience
Professional experience in teaching and training for headship
Professional experience in teaching, administrative experience and training for headship
Teaching qualification only

SECTION I I I – MANAGEMENT STAFF
191
Additional notes (Figure D38 – continued) Malta: Part-time training lasting two years is also possible. Netherlands: At large secondary schools with a central management board (centraal school bestuur), teaching qualifications are not required for board members, who do not perform teaching activities. Austria: Since 2008/09 the amount of compulsory training has been 12 ECTS. Poland: 20 hours may be added at the discretion of the training institution. Finland: The school head is required to be a qualified teacher at the particular level of education, to have sufficient experience in teaching, and a qualification in educational administration or knowledge of it acquired otherwise. Sweden: 30 days of training over a period of 2-3 years are recommended. United Kingdom (ENG/WLS/NIR): In England and Wales, the National Professional Qualification for Headship is mandatory for all first-time headteachers. In Wales, the programme must be completed before appointment. In England, until April 2009, transitional arrangements allow those with a place on the programme to be appointed. In Northern Ireland, the equivalent programme is the Professional Qualification for Headship which is not mandatory. Turkey: An ISCED level 2 does not exist. The entire single structure (eight years for pupils aged from 6 to 14) is considered to be ISCED 1. The map illustrates the situation within this single structure. Explanatory note School head is any person heading a school or a group of schools who, alone or within an administrative body such as a board or council, is responsible for its leadership/management/administration. Depending on circumstances, the person concerned may also exercise educational responsibilities (which may include teaching tasks), but also responsibility for the general functioning of the institution in areas such as the timetable, implementation of the curriculum, decisions about what is to be taught and the materials and methods used, and management of staff and/or financial responsibilities. Professional experience in teaching is a certain number of years working professionally as a teacher, most of the time at the level of education at which the person concerned is seeking appointment as a school head. Administrative experience is experience in school administration/management acquired, for example, in the post of deputy school head. Training for headship is a specific training which takes place subsequent to initial teacher education and qualification as a teacher. Depending on circumstances, training may be provided either prior to the application for a post as school head or to involvement in the recruitment procedure, or during the one or more early years after taking up a post. Its aim is to equip future school heads with the skills required to carry out their new duties. It is not to be confused with the continuing professional development of school heads.

RESOURCES
192
GENERALLY A MINIMUM OF THREE TO FIVE YEARS TEACHING EXPERIENCE ________________ ARE REQUIRED TO BECOME A SCHOOL HEAD ________________
Among the requirements for becoming a school head (Figure D38), a minimum period of professional teaching experience required is most common. It ranges from at least one year in Turkey and two years in Iceland (primary level) to 12 years in Greece and 13 years in Cyprus. In most cases, the requisite minimum period is between three and five years. In some countries (Greece, Spain, Italy, Slovenia, Slovakia and Romania), only full-time teaching is taken into account in determining the period of professional experience. In Denmark, Germany, Austria (primary education), Finland and the United Kingdom (England, Wales and Northern Ireland), teaching experience is required but the official documents do not state precisely how much.
Figure D39: Minimum number of years of professional teaching experience required to become a school head in primary, general lower and upper secondary education (ISCED 1, 2 and 3), 2006/07
Years Years
ISCED 1-2 �� Teaching experience is required but its duration is not stipulated in official documents
ISCED 3 �� Professional teaching experience is not explicitly required
BE fr
BE de
BE nl BG CZ DK DE EE IE EL ES FR IT CY LV LT LU HU MT NL AT PL PT SI SK FI SE UK
(1) UK (2) IS LI NO TR
7.0 6.0 : 3.0 4.0 � � 3.0 5.0 12.0 5.0 5.0 7.0 13.0 � 3.0 � 5.0 10.0 � � 5.0 5.0 5.0 5.0 � � � 5.0 2.0 3.0 � 1.0
7.0 6.0 : 3.0 5.0 � � 3.0 5.0 12.0 5.0 5.0 7.0 13.0 � 3.0 5.0 5.0 10.0 � 6.0 5.0 5.0 5.0 5.0 � � � 5.0 � 3.0 � 1.0
UK (1) = UK ENG/WLS/NIR; UK (2) = UK-SCT
Source: Eurydice. Additional notes Belgium (BE de): In institutions managed by the Community, the minimum length of professional teaching experience required is 10 years. However since 1 September 2007 and only for institutions of secondary education, the conditions for becoming a school head no longer include a minimum number of years of teaching experience. Cyprus: In addition, candidates need working experience as an assistant principal (three years in primary education and two years in secondary education). Malta: There is no formal indication of the number of years of teaching experience expected from an applicant. S/he must have four years of experience as an assistant head of school, and the Diploma in Educational Administration and Management. For the post of Assistant Head of School, teaching experience of at least ten years is necessary. Since 2007/08, Heads of Department, School Counsellors and Inclusive Education Coordinators have also been able to apply for the post of Head of School if they satisfy the same conditions as those for an Assistant Head of School. Turkey: One to three years of experience in school administration are also required, according to the type of institution. An ISCED level 2 does not exist. The entire single structure (eight years for pupils aged from 6 to 14) is considered to be ISCED 1. The Figure refers to the situation within this single structure.

SECTION I I I – MANAGEMENT STAFF
193
BESIDES BEING HIGHER THAN TEACHER SALARIES, SCHOOL HEAD ________ SALARIES ARE OFTEN INFLUENCED BY THE SIZE OF SCHOOLS ________
As in the case of the gross annual minimum and maximum basic salaries of teachers, the salaries of school
heads in primary and secondary education are related to per capita GDP in each country. In 14 countries or
regions, the size of schools has a direct bearing on the salaries of school heads in that the higher the
enrolment at a school, the higher the salary of its head.
By contrast, the educational level of the schools they manage is generally of little significance. In nine
countries (namely the Czech Republic, Ireland, Lithuania, Malta, Poland, Portugal, Slovenia, the United
Kingdom and Turkey), the basic salaries of school heads are exactly the same at all three levels of
education. However, in the United Kingdom (England, Wales and Northern Ireland), school heads share the
same overarching salary scale, but within that scale each head has his/her own salary range. This range is
related both to the size of the school and the ages of its pupils. This means that secondary school heads
tend to be paid more than primary school heads. It should be noted that several of the countries with the
same basic salary for all three levels offer single-structure education, which means that there is no break
between the two levels corresponding elsewhere to primary and general lower secondary education and only
one salary scale for school heads.
The same salary scales apply to heads in both primary and lower secondary education in five countries
(Denmark (solely within small schools), Italy (for minimum salaries), Austria, Slovakia and Iceland). Similarly,
in 13 countries, similar scales apply to heads in both lower and upper secondary education.
On the other hand, in Belgium, Germany, Spain, France and Hungary, the basic salaries of school heads rise
with the level of education offered by the school they manage. The same applies to the salaries of teachers
(Figure D32) in France.
In all countries, the basic salaries of school heads are higher than those of teachers working at the same
educational level.
Regardless of the number of pupils in schools or the level of education, the minimum basic salaries of school
heads are in general equivalent to or higher than per capita GDP in each country. However, in Lithuania
(within small schools), Poland, Romania, Slovakia and Sweden, only the maximum basic salaries of school
heads working within small schools at both lower and upper secondary levels are above per capita GDP. In
the Netherlands and the United Kingdom in particular, the minimum basic salaries are almost twice as high
as per capita GDP.
The contrast between the maximum and minimum basic salaries of school heads as a means of assessing
their prospects for an increase in their basic salary throughout their careers is not as marked as in the case
of teachers. In financial terms, the careers of school heads progress more evenly in most countries. Although
the salary increases of school heads during their career are not exceptional, their maximum salaries remain
higher than those of their teacher colleagues, given that their starting salaries are higher.
These particularities may be put down to the fact that, in most countries, a certain number of years’ teaching
experience are required in order to become a school head (Figure D39). Other conditions, such as the
obligation in some countries to have received special training (Figure D38) may also be relevant. The
careers of school heads are also shorter given the additional years of experience required, so that the period
over which their salaries can increase is correspondingly shorter.

RESOURCES
194
Figure D40: Minimum and maximum basic gross annual salaries of school heads,
ISCED 1, 2 and 3, relative to per capita GDP, 2006/07
ISCED 1 ISCED 2 ISCED 3
Minimum Maximum a. Small schools b. Large schools UK (1): UK-ENG/WLS/NIR
Sources: Eurostat and Eurydice.

SECTION I I I – MANAGEMENT STAFF
195
Data (Figure D40)
BE fr BE de BE nl BG CZ DK DE EE IE EL ES FR
a b a b a b a b a b a b a b ISCED 1 Min 110.1 120.1 110.9 129.8 115.3 118.3 74.1 93.2 64.0 120.1 140.3 125.7 : 94.7 65.5 133.3 140.8 81.8 92.8 Max 165.0 170.9 166.5 189.5 178.2 181.1 90.5 149.9 : 211.4 113.0 184.5 192.0 138.8 162.6ISCED 2 Min 124.8 129.8 118.3 : 64.0 120.1 143.6 151.1 : 94.7 66.0 159.4 164.5 131.5 156.2 Max 184.5 189.5 191.1 : 90.5 185.0 : 211.4 113.5 214.6 219.7 212.1 227.9ISCED 3 Min 155.3 168.9 143.4 : 64.0 160.4 179.9 183.5 : 94.7 66.3 159.4 164.5 165.2 197.1 Max 220.0 227.0 227.5 : 90.5 233.2 : 211.4 113.8 214.6 219.7 215.9 250.9
IT CY LV LT LU HU MT NL AT PL PT RO SI a b a b a b a b a b a b
ISCED 1 Min 159.9 133.5 : 91.9 112.5 (-) 87.1 57.2 109.0 113.1 98.2 111.6 89.1 100.2 100.8 65.8 71.5 178.5 242.7 Max : 189.6 : 135.7 172.4 (-) 154.4 69.5 174.0 202.2 167.5 182.7 162.6 158.4 171.1 196.5 267.4ISCED 2 Min 159.9 158.0 : 91.9 112.5 87.1 57.2 190.9 98.2 111.6 89.1 100.2 100.8 82.0 88.6 178.5 242.7 Max : 207.9 : 135.7 172.4 181.1 182.7 69.5 249.4 167.5 182.7 162.6 158.4 171.1 196.5 267.4ISCED 3 Min 159.9 158.0 : 91.9 112.5 93.4 57.2 190.9 127.3 139.1 89.1 100.2 100.8 82.0 88.6 178.5 242.7 Max : 207.9 : 135.7 172.4 181.1 182.7 69.5 249.4 210.8 224.3 162.6 158.4 171.1 196.5 267.4
SK FI SE UK-ENG/ UK- IS LI NO TR a b a b WLS/NIR SCT a b a b
ISCED 1 Min 65.5 104.9 119.7 : 183.9 182.4 93.2 164.2 : 87.4 92.1 100.7 Max 99.7 139.6 161.7 : 270.0 270.0 96.0 169.1 : 120.9ISCED 2 Min 65.5 115.2 130.0 78.5 110.9 183.9 182.4 93.2 164.2 : 87.4 92.1 100.7 Max 99.7 155.5 175.5 136.8 164.6 270.0 270.0 96.0 169.1 : : 120.9ISCED 3 Min 65.5 131.9 164.5 78.5 110.9 183.9 182.4 175.9 194.3 : 92.1 100.9 100.7 Max 102.5 178.1 222.1 136.8 164.6 270.0 270.0 179.1 215.5 : : 120.9Sources: Eurostat and Eurydice. Additional notes
Belgium: National per capita GDP is taken into account (instead of per capita GDP in each Community). Belgium (BE de): Institutions offering just lower secondary education have been replaced by institutions offering both lower and upper secondary education. They are managed by a single school head. Czech Republic: Minimum and maximum salaries are the same as those of teachers. A school head is entitled to an allowance for leadership, which is awarded by the founder within limits stipulated by law. Denmark: The main part of the salary is based on collective agreements. Maximum salaries are not indicated as they depend on additional payments negotiated at local level. Germany: Given the complexity and wide variety of individual circumstances, the salaries of school heads have been calculated on the basis of salaries in the Länder of former West Germany. There is no age or minimum number of years’ experience required in order to become a school head, and the minimum salary is calculated on the basis of a hypothetical age of 40 years. There is no difference in the salaries of school heads working in small and big schools. Very small rural schools have no school heads, but teachers with leadership tasks. The data relating to ISCED level 2 refer to the salaries of Realschule school heads. Estonia: Data are shown as not available, as salaries may vary extensively depending on the municipality. Greece and Latvia: Data are shown as not available, as salaries may vary extensively depending on salary scales and additional individual allowances. Spain: The total amounts are calculated by adding a ‘headship supplement’ at each educational level to the mean salaries of teachers at the corresponding level. The ‘headship supplement’ has been calculated as the mean of this supplement in each Autonomous Community weighted by the number of school heads (working within both small and big schools) in each. Lithuania: Annual gross basic salaries are calculated on the basis of the basic monthly salary and senority and managerial status-based coefficients. Luxembourg: There are no school heads in primary education. Minimum salaries are shown as not available, as they may vary extensively depending on salary scales and additional individual allowances. Netherlands: At ISCED level 1, a distinction also exists as regards the salaries of schools heads who work within intermediate-sized schools. The values relating to minimum and maximum salaries relative to per capita GDP are 113.09 and 194.37 respectively. Austria: The statutory allowance for school heads is determined on the basis of the number of classes at the specific school. The data relating to ISCED levels 2 and 3 refer to the salaries of Hauptschulen school heads. Poland: The amount of the functional allowance depends on the size of the schools and is decided by school management bodies.

RESOURCES
196
Additional notes (Figure D40 – continued) Portugal: In the data shown, the food allowance is included in the salary. Finland: The amount of maximum salaries may vary extensively depending on principals’ years of service and individual increments. The information shown in the Figure provides an estimate of the annual basic gross maximum salary. Sweden: There is no salary scale. Salaries are based on individual agreements between the school heads and the employers. No information is available on either minimum and maximum salaries, or on teachers’ experience counted as years in the occupation. The data refer to average school head salaries in lower and upper secondary schools in November 2006 (2006/07 school year), while the information on the minimum and maximum salaries corresponds to the 10th and 90th percentiles respectively. United Kingdom (ENG/WLS/NIR): The minimum and maximum salaries shown represent the extremes of the 43-point leadership spine for inner London; lower scales apply outside this area in England and throughout Wales and Northern Ireland. Individual school heads are paid on a range of seven consecutive points within the spine. The range is normally related to school group size which depends on the number of pupils and their ages, so the minimum shown would apply only to the smallest primary schools while the maximum would apply only to the largest secondary schools. Governing bodies can pay more than the maximum to recruit and retain headteachers in challenging schools. United Kingdom (SCT): The index-linked changes in salary take place on 1 April each year. The salaries shown in the Figure refer to the index used from early April 2007 for teachers who have not been promoted. Iceland: Figures for upper secondary school heads are estimated. Liechtenstein: Per capita GDP not available. Norway: Very few school heads receive minimum amounts. The maximum salary depends on additional payments received by school heads. These payments vary from one incumbent to the next, so values could not be provided. Turkey: No ISCED level 2 exists. The entire single structure (eight years for pupils aged from 6 to 14) is considered to be ISCED 1. School head salaries are increased twice a year (on 1 January and 1 July). The information shown in the Figure is calculated on the basis of June 2006 and January 2007 salaries with equal weightings. Explanatory note The data relate to school heads with the minimum qualifications required who are single, childless and work in the capital city of their country. The reference year for per capita GDP is 2006. The reference period for salaries is the calendar year 2006 or the 2006/07 school year. The values indicated in the diagram are obtained by establishing a relation between the (minimum and maximum) basic gross annual salary in national currency and per capita GDP (at current prices in national currency) in the country concerned. The basic gross annual salary is the amount paid by the employer in a year, including general increases to salary scales, the 13th month and holiday-pay (where applicable), etc. less employers’ social security and pension contributions. This salary does not include other salary allowances or financial benefits (related for example to further qualifications, merit, overtime, additional responsibilities, geographical location, the obligation to teach classes in challenging circumstances, or accommodation, health or travel costs). Given the number of national-level criteria in some countries for determining upward progression on the salary scale, it has not always been possible to indicate salaries at the beginning and end of a career. In such cases, the minimum and maximum salaries correspond to the two extremes of the salary scale. The real salaries may vary with respect to factors such as the size of the school, the ages of pupils, the teacher/pupil ratio, etc. In countries where the minimum and/or maximum salaries vary depending on whether the school head works in a small or large school, the salaries are indicated in each case. Definitions of school size vary from one country to the next. For this reason, small schools represent the smallest schools with respect to the definition of the country concerned and, similarly, large schools correspond to its definition of the largest. The minimum salary is the salary received by school heads in the above-mentioned circumstances, at the start of their careers as school heads. The maximum salary is the salary received by school heads in the above-mentioned circumstances on retirement or after a certain number of years of service, without taking into account salary adjustments or financial benefits linked to any criteria other than length of service.

SECTION I I I – MANAGEMENT STAFF
197
HEADS OF SCHOOLS SPEND MOST WORKING TIME ON MANAGEMENT ______ ACTIVITIES AND ON COMMUNICATING WITH PARENTS AND STUDENTS ______
School heads are generally qualified through professional teaching and administrative experience and/or special training for headship (Figure D38). Even though this covers some of their professional activities, school heads may also devote their working time to other activities that they are entrusted with. The time spent on the different activities carried out by them is fairly similarly distributed across countries in Europe.
In most countries, school heads in primary education spend the majority of their time, on average more than 40 %, on management and administrative activities such as appointing and managing staff, and budgeting. In Belgium (French Community), Denmark, Italy, Sweden and Norway the proportion is higher, with 50 % or more of their time spent on management and administrative activities.
Figure D41: Proportion of the time spent in a range of activities by the heads of schools attended by pupils in the fourth year of primary education, 2006
Developing curriculum and pedagogy Teaching Management and
administration Communication with parents and students Other
Country that did not contribute to data collection
Source: IEA, PIRLS 2006 database.

RESOURCES
198
Data (Figure D41)
EU-27 BE fr BE de BE
nl BG CZ DK DE EE IE EL ES FR IT CY LV LT LU
Developing curriculum and pedagogy 12.4 9.1 16.1 29.2 14.7 9.2 14.4 6.3 15.2 16.5 19.3 Teaching 21.7 7.5 2.5 10.7 4.1 37.8 27.9 46.7 1.6 14.5 12.5 Management and administration 37.9 57.2 45.0 28.6 52.7 29.9 32.6 27.4 50.0 37.3 37.1 Communication with parents and students 21.6 21.1 21.4 23.3 20.7 17.6 21.4 17.1 29.4 22.4 23.2 Other 6.3 4.7 14.7 8.2 7.7 5.5 3.6 2.3 3.8 9.2 7.7
HU MT NL AT PL PT RO SI SK FI SE UK-ENG
UK-SCT IS LI NO TR
Developing curriculum and pedagogy 11.4 13.1 10.7 14.8 12.5 22.2 11.1 14.7 15.9 16.0 11.8 14.7 Teaching 13.9 7.3 19.3 12.4 20.8 3.5 14.8 2.2 7.8 9.1 3.5 5.8 Management and administration 35.6 46.2 43.0 41.8 34.7 48.4 46.1 51.4 43.2 42.6 48.1 54.6 Communication with parents and students 26.7 18.2 21.1 21.6 24.4 19.1 20.7 23.1 23.8 25.9 26.3 17.7 Other 12.1 14.9 5.9 9.2 7.5 6.7 7.3 8.5 9.3 6.3 10.2 7.2
Source: PIRLS 2006 database.
Additional note Luxembourg: There are no school heads in primary schools. Explanatory note School heads were asked in the questionnaire sent to them to indicate approximately what percentage of their time is devoted to a range of professional activities in school. Replies from school heads were collected into seven categories. In the Figure, ‘management and administration’ covers the original responses given as ‘managing staff/staff development’ and ‘administrative duties (hiring, budgeting, etc.)’. The category ‘communication with parents and students’ aggregates the original responses given as ‘parent and community relations’ and ‘interacting with individual students’. The sampling procedure involved selecting schools and then pupils from a class in the fourth year of primary education. It sought to offer each pupil the same probability of being selected irrespective of the size of the school he or she attended. For this purpose, schools were weighted in such a way that the probability that they would be selected was inversely proportional to their size. This explains why the Figure does not directly show the proportions of school heads who gave a particular reply regarding the factor at issue, but the proportions of pupils in the school whose school head gave this reply. For further information on the PIRLS survey, see the Glossary and Statistical Tools section.
In the majority of countries, another significant share of the working time of school heads – over 20 % on average – is devoted to communication with parents and pupils, which includes maintaining parent and community relations as well as interacting with individual pupils. This is followed by professional activities related to developing the curriculum and pedagogy for the school, which is among the most time-consuming work in Bulgaria and Slovenia.
School heads spend on average only 13 % of their time on teaching activities, with Belgium (Flemish Community), Italy and Sweden among those countries where the least amount of time is devoted to teaching. In two countries however, Germany and France, the majority of time spent by school heads is concentrated on teaching activities. The differences in working time spent on teaching activities may be partly explained by the fact that, in many countries, school heads have few if any teaching responsibilities, depending for example on the size of their schools.

199
E D U C AT I O N A L P R O C E S S E S
SECTION I – TAUGHT TIME
IN MOST COUNTRIES, ____ TAUGHT TIME INCREASES AS CHILDREN PROGRESS THROUGH SCHOOL _____
European countries organise annual taught time differently during primary and lower secondary education. In most countries, the total number of hours in primary education is different to that in lower secondary education. In many countries, the official timetable is less intensive at the beginning of primary education (generally for the first two years), then steadily increases through compulsory education, with a significant increase in hours at lower secondary level. Taught time is generally spread over five days a week, except in Italy, where it is six. The amount of time spent by pupils in the classroom and the length of their lessons also vary according to the country and the years of education.
Other countries have a uniform amount of annual taught time within each of these levels. In Belgium (French and German-speaking Communities), Spain, Italy, Cyprus and Portugal, the annual amount is constant throughout primary and lower secondary education. Nonetheless, the workload does increase from one level to the next. In Belgium for example, it increases from about 850 hours a year in primary education to 971 a year in lower secondary education. In Spain, the increase is from 875 to 1 050 hours a year.
Finally, the total annual workload is identical at primary and lower secondary levels (ISCED 1 and 2) in Belgium (Flemish Community), Luxembourg and Turkey. In Estonia, the Netherlands, Poland, Sweden and Norway, the number of hours for all compulsory education (or some stages of it) is set by the competent authorities, which are responsible for allocating them to the different years.
Additional notes (Figure E1) Germany: Hauptschule. Spain: The new law of 2006 called the 'Ley Orgánica de Educación' (LOE, or the Organic Act on Education) provides for a reorganisation of compulsory education, which will be implemented progressively from 2006/07 to 2009/10. Romania: �coala primar� + Gimnaziu + Liceu. Liechtenstein: Primarschule + Gymnasium. Explanatory note The taught time illustrated in this Figure corresponds to the notional minimum workload of pupils and is based on minimum national recommendations for the first nine years of primary and secondary education, in line with the structure of the national education systems (Figure B1). For each year the workload is calculated by taking the average minimum daily load multiplied by the number of teaching days a year. Recreational or other breaks of any kind, as well as the time given over to optional lessons, are not taken into account. The total annual amounts of minimum taught time are added up to give the total minimum workload in hours for each year

EDUCATIONAL PROCESSES
200
Figure E1: Recommended minimum annual taught time per year
during the first 9 years of primary and secondary education, 2006/07
NL: minimum 1 040 hours/year for years 9 and 10; NO: total 2 564 hours for years 8 to 10
� Flexible time
Number of hours distributed between various school years Number of hours per school year
Source: Eurydice.

SECTION I – TAUGHT TIME
201
LANGUAGE LEARNING, MATHEMATICS AND THE APPLICATION OF FLEXIBLE TAUGHT ___________ TIME ARE THE MAIN ELEMENTS IN PRIMARY EDUCATION ___________
By and large, in primary education, the compulsory subjects specified in official curricula are the same in all countries. The main differences at this level relate to flexible timetables and the obligation to provide ICT instruction and religious or moral instruction.
Most countries provide for a flexible timetable to allow schools the freedom to determine all or part of their time allocation for certain subjects. They are entirely autonomous in this respect in the Netherlands and the United Kingdom. Between 90 % and 75 % of primary level taught time is decided on by schools in Belgium and Italy. In Spain and Poland, the proportion of flexible time corresponds to between one third and half of the total timetable (see Figure E1 for more details on total taught time allocation). In Poland, this is attributable to the fact that subjects are taught in an integrated manner during the first three years of primary education. They have been included in the ‘flexible timetable’ category.
In the other countries, it is possible to compare the relative amount of time officially earmarked for different subjects during primary education. The language of instruction is clearly the most important subject in terms of taught time, which is generally between one-quarter and one-third of the recommended total amount. The only exception is Luxembourg, where the situation is most unusual in that German and French, both of which are official languages, are regarded by the curriculum as foreign languages and are taught from the beginning of primary education onwards. This explains the very high proportion of time allocated to foreign languages (39 %).
In most countries, mathematics takes second place in terms of recommended taught time. Malta is the only country in which compulsory mathematics teaching is allocated proportionally more time than the language of instruction (19 % compared to 15 %). Malta also has its own particular reasons for spending more time on foreign language teaching – Maltese and English are both official languages.
During primary education, the share of total time allocated to natural and social sciences taken together generally varies between 9 % and 15 %. In Sweden and Turkey, it is 25 % and 21 % respectively. In Bulgaria, however, these subjects occupy just over 6 % of total taught time.
Finally, the proportion of time allocated to physical education generally ranges from 7 % to 12 %, except in Ireland and Turkey with less than 5 %.
While foreign languages are mandatory in almost all countries, they account for less than 10 % of taught time. Exceptions are the German-speaking Community of Belgium, Luxembourg and Malta, where they are introduced from the first year of primary education. For further information, see Key Data on Teaching Languages at School in Europe – 2008 Edition.
In countries in which religious or moral instruction is a compulsory subject, the share of total taught time earmarked for it generally varies between 4 % and 8 %. Finally, elements of information and communication technology (ICT) are often included in compulsory studies. ICT is very rarely taught as a subject in its own right during primary education, but tends to be used as a resource for working on other subjects.

EDUCATIONAL PROCESSES
202
Figure E2: Recommended minimum time allocation as a percentage of total recommended taught time for compulsory subjects or general domains throughout primary education considered as a whole, 2006/07
Lang
uage
of
instru
ction
Mathe
matic
s
Natur
al
scien
ces
Socia
l sc
ience
s
Fore
ign
langu
ages
Spor
t
Artis
tic
activ
ities
Relig
ious/m
oral
instru
ction
ICT
Tech
nolog
y
Core
curri
culum
op
tions
Othe
r
Flexib
le tim
etable
� Compulsory subject with flexible timetable Included in other subjects Included in 'Technology'
Source: Eurydice. Additional notes Belgium (BE fr): The teaching of compulsory foreign languages is significantly different in the Brussels-Capital Region. Dutch language teaching begins in the third year of primary school and occupies the most taught time in primary school. Czech Republic: The new Framework Educational Programme (2007) to be fully implemented in 2011/12 will involve a higher percentage of flexible timetabling. Spain: The compulsory curriculum laid down by the central government for the entire country represents 55 % of taught time in Autonomous Communities with a second joint official language and 65 % in the others. The remaining taught time is set by each Autonomous Community. The new law of 2006 called the Ley Orgánica de Educación (LOE, or the Organic Act on Education) provides for a reorganisation of compulsory education, which will be implemented progressively from 2006/07 to 2009/10. This reform will include education in citizenship and human rights and will reorganise taught time by subjects. Cyprus: In rural areas, the time allocated to each subject depends on the number of teachers in the school concerned. Lithuania: Artistic activities are taught in an integrated way during the first two years of primary school. The 2007/08 reform will alter the taught time allocated to subjects and reorganise the powers of local players (head teachers and decision-making bodies) to decide how school time is organised. Luxembourg: The 'other subjects' category includes Letzeburgesch, creative activities and music.

SECTION I – TAUGHT TIME
203
Additional notes (Figure E2 – continued) Hungary: The National Core Curriculum (NCC) does not stipulate subjects but it identifies ‘cultural domains’ providing a recommended framework for the allocation of total taught time by each cultural domain. Several subject-based framework curricula (centrally developed or accredited by the minister responsible for education) are put at the disposal of schools that make further recommendations relating to time allocation. The 'other subjects' category includes life management and practical studies. Austria: During the first two years, foreign language teaching is linked to other subjects (50 minutes per week) as part of an integrated approach. Slovenia: The 'other subjects' category includes home economics and class discussion. Slovakia: ICT is being taught from the first year of primary school from 2007/08. Sweden: The data also include ISCED 2. Iceland: The 'other subjects' category includes home economics and life skills. Liechtenstein: English is being taught from the second year of primary education from 2008/09. Turkey: The 'other subjects' category includes 'road safety and first aid' and 'guidance and social activities'. Explanatory note The percentages by domain for the entire period of primary education are obtained by calculating the relationship between the time allocated to individual compulsory subjects and the total number of hours recommended for all of them. The calculation is based on official national minimum recommendations. Black bullet points are used to indicate that certain subjects are compulsory in countries where the curriculum stipulates merely that they should be taught, with no reference to time allocated, leaving schools entirely free to decide how much time should be devoted to them. Taught time for ICT is shown in the diagram if it is a subject in its own right. A red bullet point indicates that it is included in other subjects. The ‘core curriculum options’ category indicates that pupils have to choose one or more subjects from a group of subjects within the compulsory curriculum. The ‘flexible timetable’ category indicates either that the time to be allocated to the various compulsory subjects has not been set, or that the curriculum provides for a number of supplementary hours that pupils or the school can devote to subjects of their choice.
A MORE VARIED TIMETABLE FOR PUPILS ______________ DURING COMPULSORY SECONDARY EDUCATION ______________
The official breakdown of taught time for obligatory subjects during compulsory general secondary education is very different to that applied in primary education (Figure E2). It is especially noteworthy that the share of time earmarked for the language of instruction and mathematics is decreasing, while time given over to the natural and social sciences is increasing in nearly all countries. In the Czech Republic, Estonia, Slovenia, Slovakia and Finland, ‘natural sciences’ is becoming the subject with the greatest number of teaching hours allocated to it (along with mathematics in the case of Slovakia), while in Liechtenstein this applies to the social sciences. A greater relative share of time is also devoted to foreign languages, which have to be taught in all countries. In general, 10 % to 20 % of taught time is set aside for foreign languages during full-time compulsory general secondary education.
As a result of this and in spite of differences between the various education systems, or even within a single country, taught time for the language of instruction, mathematics, the natural sciences, the human sciences and foreign languages is distributed relatively more evenly than in primary education.
The relative amount of time allocated to artistic activities in the recommendations decreases in comparison with primary education. While such activities generally account for 10 % to 20 % of total taught time in the first stage of compulsory education, the corresponding proportion during compulsory general secondary education is normally no more than 10 %. However, more time is earmarked for artistic activities in Italy, Austria (Allgemeinbildende Höhere Schule), Finland and Liechtenstein (Gymnasium).

EDUCATIONAL PROCESSES
204
Figure E3: Recommended minimum time allocation as a percentage of total recommended taught time
for compulsory subjects or general domains in the entire period of full-time compulsory general secondary education considered as a whole, 2006/07
Lang
uage
of
instru
ction
Mathe
matic
s
Natur
al sc
ience
s
Socia
l sc
ience
s
Fore
ign
langu
ages
Spor
t
Artis
tic ac
tivitie
s Re
ligiou
s/mor
al ins
tructi
on
ICT
Tech
nolog
y
Core
curri
culum
op
tions
Othe
r
Flexib
le tim
etable
Compulsory subject with flexible timetable Included in other subjects Included in 'Technology' Source: Eurydice.
Additional notes Czech Republic: The new Framework Educational Programme (2007) to be fully implemented in 2011/12 will involve a higher percentage of flexible timetabling. Germany: a) Gymnasium, b) Hauptschule. Greece: The 'other subjects' category includes Ancient Greek language and literature, home economics and career guidance education. Spain and Hungary: See note for Figure E2. Lithuania: The 2007/08 reform will alter the taught time allocated to subjects and reorganise the powers of local players (head teachers and decision-making bodies) to decide how school time is organised. Luxembourg: The 'other subjects' category includes Letzeburgesch, music and handicrafts. Malta: Secondary schools. Austria: a) Hauptschule and Polytechnische Schule; b) Allgemeinbildende Höhere Schule (AHS) (sub-section Realgymna-sium).

SECTION I – TAUGHT TIME
205
Additional notes (Figure E3 – continued) Poland: At this level the flexible timetable no longer relates to integrated teaching (as in primary school) but to a few extra hours left to the school head’s discretion by legislators. Romania: a) Gimnaziu + Liceu, b) Gimnaziu + �coala de arte �i meserii. Sweden: The data also includes ISCED level 1. Iceland: The 'other subjects' category includes home economics and life skills. Liechtenstein: Oberschule Turkey: The 'other subjects' category includes 'road safety and first aid' and 'guidance and social activities'. Explanatory note The percentages by domain for the entire period of full-time compulsory general secondary education are obtained by calculating the relationship between the time allocated to individual compulsory subjects and the total number of hours recommended for all of them. The end of full-time compulsory general secondary education usually coincides with the completion of general lower secondary education or the single structure, except in Belgium, Bulgaria, France, Hungary, the Netherlands (VWO and HAVO), Slovakia and the United Kingdom (England, Wales and Northern Ireland) (see Figure B1). Taught time for ICT is shown only if it is a subject in its own right. A red bullet point indicates that it is included in other subjects. The ‘core curriculum options’ category indicates that pupils have to choose one or more subjects from a group of subjects within the compulsory curriculum. The ‘flexible timetable’ category indicates either that the time to be allocated to the various compulsory subjects has not been set or that the curriculum provides for a number of supplementary hours that pupils or the school can devote to subjects of their choice.
Study time in compulsory secondary education remains totally flexible in the Netherlands and the United Kingdom and is almost entirely so in the Flemish Community of Belgium. Spain exhibits a similar situation in primary and secondary education, while the proportion of flexible timetables plummets from 47 % (primary) to 6 % (secondary) in Poland. Furthermore, in the majority of countries, pupils in compulsory general secondary education are free to choose their subjects up to a point, as ‘core curriculum options’ enable them to select certain subjects from a predetermined list.
Information and communication technology (ICT) is taught as a subject in its own right in almost half of all countries, but accounts for a very small proportion of taught time. Very often, ICT is included in other subjects or taught as part of technology studies (Spain, France, Italy, Slovenia and Finland).
TAUGHT TIME FOR THE LANGUAGE OF INSTRUCTION IN PRIMARY _____ EDUCATION GENERALLY EXCEEDS THE MINIMUM RECOMMENDATIONS _____
Across Europe, the language of instruction is generally the compulsory subject for which the highest minimum number of hours is recommended (Figure E2). In countries that took part in the PIRLS 2006 survey, a relation may be established between these official recommendations and the time that teachers said they actually spend teaching the language of instruction in the fourth year of primary education.
In the majority of countries, three-quarters of fourth-year pupils are taught the language of instruction for a minimum of six hours a week, except in Luxembourg and Slovenia. Half of the pupils in Belgium (French Community), France and the Netherlands have more than 8 hours a week for lessons on the language of instruction. In all countries for which data are available, except Latvia, this correlates with the minimum amount of time (in hours) recommended for teaching the language of instruction, i.e. at least 75 % of pupils in the fourth year of primary education receive the recommended number of hours of teaching (or more) a week in this subject.

EDUCATIONAL PROCESSES
206
Figure E4: Distribution of fourth-year pupils in primary education according to
the number of hours a week they are taught the language of instruction, compared to the official minimum recommended time, public and private sectors combined, 2006
� Flexible Recommended minimum (indicated in the table)
BE fr
BE nl BG DK DE ES FR IT LV LT LU HU NL AT PL RO SI SK SE UK-
ENG UK- SCT IS NO
P10 6.5 5.0 4.7 4.0 4.2 4.0 6.0 6.0 3.3 5.3 4.2 5.3 5.0 5.8 5.0 4.2 3.8 6.0 4.0 5.0 5.0 4.0 4.5 P25 7.9 5.8 5.3 4.5 5.0 4.5 7.5 6.5 4.3 5.3 4.2 6.0 6.3 7.0 5.5 5.0 3.8 6.8 5.0 6.0 5.5 4.8 6.0 P50 9.0 6.7 6.0 5.3 6.0 5.0 9.0 7.0 5.3 5.4 4.2 7.0 8.0 7.5 7.0 6.0 5.0 6.8 6.0 7.0 6.5 6.0 7.0 P75 10.0 8.0 8.0 6.0 9.0 6.0 10.8 8.0 7.0 7.0 4.2 8.5 10.0 9.0 8.0 7.2 5.5 6.8 8.0 8.0 7.5 7.3 9.0 P90 12.0 10.0 10.0 6.8 11.5 7.5 12.5 10.0 9.7 7.9 4.2 10.0 10.5 12.0 10.0 8.0 8.4 6.9 10.0 8.5 9.8 10.0 12.0Min � � 4.7 3.7 3.9 3.6 6.0 � 6.0 4.1 � 5.4 � 5.8 4.0 4.2 3.8 6.8 � � � 4.0 �
Sources: Percentile: IEA, PIRLS 2006 database; Recommended minimum at national level: Eurydice, 2006/07.
Explanatory note Teachers were asked in the questionnaire sent to them to indicate how many hours a week they spend teaching the language of instruction. The sampling procedure involved selecting schools and then pupils from a class in the fourth year of primary education. It sought to offer each pupil the same probability of being selected irrespective of the size of the school he or she attended. For this purpose, schools were weighted in such a way that the probability that they would be selected was inversely proportional to their size. This explains why the Figure does not directly show the proportions of teachers who gave a particular reply, but the proportions of pupils whose teachers gave this reply.

SECTION I – TAUGHT TIME
207
Explanatory note (Figure E4 – continued) For further information on the PIRLS survey, see the Glossary and Statistical Tools section. In the interests of clarity, the Figure only shows values corresponding to the percentiles 25, 50 and 75 in the distribution. Values for the percentiles 10 and 90 are shown in the table under the Figure. The minimum recommended time per week is calculated taking in consideration the annual estimation of the time dedicated to teaching the language of instruction and dividing it to the number of weeks in the school year.
The distribution of pupils in accordance with the number of hours per week that teachers say they spend teaching them the language of instruction varies from one country to the next. The deviation between percentile 25 and percentile 75 is in general two to three hours a week, while between percentiles 10 and 90 it is generally between four and six hours. Relatively small deviations can be seen in Denmark, Spain, Italy, Lithuania and Romania, whereas in Luxembourg and Slovakia almost all pupils are taught the language of instruction for the same number of hours. Additionally in Slovakia this taught time corresponds to the officially recommended minimum.
IN PRIMARY EDUCATION, COMPUTER SOFTWARE AND ___ INTERNET MATERIALS ARE STILL NOT ACTIVELY USED TO TEACH READING ___
Teaching and encouraging pupils to read are basic activities, especially in primary education. The wide variety of reading materials used in the fourth year of primary education and the frequency with which they are used have been analysed on the basis of data from the PIRLS 2006 survey, for those countries which participated.
Textbooks are the main resource for pupils learning to read in the fourth year of primary education. In all countries except Belgium (French Community), Denmark, France and the United Kingdom (England), over three-quarters of pupils have a teacher who uses textbooks at least once a week. In Bulgaria, Latvia, Lithuania, Hungary, Poland and Slovakia, textbooks are in all cases used as primary materials to teach reading.
Teachers of over half of the pupils rely on a variety of books from children’s literature. In the Netherlands, Sweden, the United Kingdom, Iceland and Norway, around 80 % or more of pupils have teachers who often use a variety of children's books. In France, Sweden, the United Kingdom (England) and to a lesser extent Belgium (French Community), the use of children’s literature to teach reading is even more frequent than that of textbooks.
By contrast, the frequent use of educational software or Internet materials for teaching reading is less widespread. Nevertheless, in comparison with the situation in 2001 (see Key Data on Education in Europe 2005), the use of new technologies to teach reading at school has increased. A high incidence is registered in the Netherlands, Austria, the United Kingdom (England and Scotland) and Norway, where more than 30 % of pupils use reading software or Internet materials more than once a week. This increase is expected to speed up in subsequent years, with the growth of specialised software and on-line materials intended specifically for teaching reading in primary education.

EDUCATIONAL PROCESSES
208
Figure E5: Percentages of pupils in the fourth year of primary education whose teachers say
they use textbooks, children's literature, educational software or Internet materials for teaching reading at least once a week, public and private sectors combined, 2006
Textbooks A variety of children’s books
Computer software (e.g. CD-ROM)
Internet material
Country that did not contribute to data collection
EU-27
BE fr
BE nl BG DK DE ES FR IT LV LT LU HU NL AT PL RO SI SK SE UK-
ENG UK-SCT IS NO
84.2 50.2 92.1 100 68.7 83.4 98.6 62.3 98.7 100 100 94.8 100 94.0 87.1 100 99.9 94.2 100 81.6 65.6 80.9 96.2 98.2
62.1 53.0 51.8 60.5 59.9 41.7 71.5 71.8 54.4 44.7 45.5 34.1 63.5 79.2 51.9 36.0 66.2 32.7 49.8 88.9 93.2 79.6 82.5 83.9
10.9 4.3 8.0 4.3 3.6 15.4 9.1 2.9 5.0 2.2 2.2 3.2 1.9 25.7 26.3 3.4 1.2 4.6 3.9 9.9 31.6 20.0 12.4 19.9
10.7 3.8 5.2 10.6 6.4 8.7 6.2 5.3 2.1 3.7 2.3 6.8 6.2 13.7 13.7 5.2 10.3 2.5 7.1 11.7 39.8 17.4 17.1 15.2
Source: IEA, PIRLS 2006 database. Explanatory note Teachers were asked in the questionnaire sent to them to indicate the frequency with which they used various materials to help them teach reading: (a) ‘Textbooks’, (b) ‘Reading series’, (c) ‘Workbooks or worksheets’, (d) ‘Children’s newspapers and magazines’, (e) ‘Computer software for reading instruction (e.g. CD-ROM)’, (f) ‘Reading material on the Internet (Web pages)’, (g) ‘A variety of children’s books (e.g. novels, collections of stories, etc.)’, (h) ‘Materials from other subjects’ and (i) ‘Materials written by students’. The Figure shows only (a), (e), (f) and (g). Possible replies were (i) ‘every day or almost every day’, (ii) ‘once or twice a week’, (iii) ‘once or twice a month’ and (iv) ‘never or almost never’. The Figure shows categories (i) and (ii) combined. The sampling procedure involved selecting schools and then pupils from a class in the fourth year of primary education. It sought to offer each pupil the same probability of being selected irrespective of the size of the school he or she attended. For this purpose, schools were weighted in such a way that the probability that they would be selected was inversely proportional to their size. This explains why the Figure does not directly show the proportions of teachers who gave a particular reply, but the proportions of pupils whose teachers gave this reply. For further information on the PIRLS survey, see the Glossary and Statistical Tools section.

SECTION I – TAUGHT TIME
209
IN PRIMARY EDUCATION, PUPILS GET HOMEWORK IN THE LANGUAGE OF ___________ INSTRUCTION BETWEEN ONE AND FOUR TIMES A WEEK ___________
Learning the language of instruction is commonly among the extra-school learning activities of pupils in the fourth year of primary education. The Netherlands is an exception as most pupils have to do homework in this subject less than once a week. The teachers of around 53 % of the pupils in countries for which PIRLS 2006 data are available report that they give them homework in this subject between one and four times a week. In Sweden and the United Kingdom (Scotland), more than 70 % of pupils have to do homework in the language of instruction between one and four times a week. Additionally, in Bulgaria, Lithuania, Iceland and Norway, around 60 % of pupils have to do homework in the language of instruction every day.
Figure E6: Percentage of pupils in the fourth year of primary education, whose teachers say they give them homework in the language of instruction, public and private sectors combined, 2006
No reading for homework
Less than once a week
Between one and four times a week
Every day
Country that did not contribute to data collection
EU-27
BE fr
BE nl BG DK DE ES FR IT LV LT LU HU NL AT PL RO SI SK SE UK-
ENG UK-SCT IS NO
4.3 11.7 11.2 0 0.6 1.2 0.4 5.5 0.4 0 0 4.5 0.2 35.3 0.7 1 2.0 0.5 1 2.1 10.7 4.3 3.8 1.2
11.5 42.6 43.2 4.5 1.7 8.7 4.5 20.0 1.0 0.9 4.3 28.4 1.7 42.1 6.1 4.2 9.4 8.3 2.4 20.1 16.2 5.2 1.7 0.0
53.1 40.5 44.7 29.9 52.0 64.6 45.0 62.8 50.6 49.8 33.8 65.7 49.9 22.6 67.5 41.8 49.2 64.9 51.1 72.0 48.4 80.7 19.3 32.1
31.1 5.2 0.8 65.6 45.7 25.5 50.1 11.7 48.0 49.3 61.9 1.5 48.2 0.0 25.7 53.4 39.4 26.4 45.9 5.8 24.6 9.8 75.2 66.7
Source: IEA, PIRLS 2006 database. Explanatory note Teachers were asked in the questionnaire sent to them to indicate the frequency with which they gave their pupils homework in the language of instruction (on reading, writing, the spoken language, literature, and other language skills). The sampling procedure involved selecting schools and then pupils from a class in the fourth year of primary education. It sought to offer each pupil the same probability of being selected irrespective of the size of the school he or she attended. For this purpose, schools were weighted in such a way that the probability that they would be selected was inversely proportional to their size. This explains why the Figure does not directly show the proportions of teachers who gave a particular reply, but the proportions of pupils whose teachers gave this reply. For further information on the PIRLS survey, see the Glossary and Statistical Tools section.

EDUCATIONAL PROCESSES
210
OVER A THIRD OF 15-YEAR-OLDS SPEND TWO OR MORE HOURS A WEEK ON ______________ BOTH LANGUAGE AND MATHEMATICS HOMEWORK _______________
The average time spent on homework and study at home, as reported by 15-year-old pupils who took part in the PISA 2006 survey, varies considerably from one country to the next. As a general rule, proportionally fewer pupils have homework in the Nordic countries, and proportionally more in central and southern Europe. Furthermore, the time devoted to homework activities is different in the three subjects considered (language, mathematics and science).
More than one-third of pupils aged 15 spend more than two hours a week on language or mathematics homework. In Bulgaria, Poland, Romania and Turkey this percentage represents more than 40 % of pupils and in Italy over 60 %. On the other hand, in Belgium (Flemish Community), the Czech Republic, the Netherlands, Finland and Sweden, more than 80 % of pupils declare that they do less than two hours a week of homework on the language of instruction, or even that they receive no homework on it.
In the majority of countries, more pupils devote over two hours a week to homework in mathematics than to homework on the language of instruction. In seven countries, the percentage of pupils who devote four or more hours to homework on the language of instruction or mathematics is almost the same (a difference of less than 3 %), while in Denmark, Italy, Poland and the United Kingdom (England), more pupils devote more time to homework on the language of instruction than to homework in mathematics.
In general, a lower percentage of pupils devote more than two hours a week to homework in science subjects. Nevertheless, in Bulgaria, Greece, Italy, Latvia, Poland and Portugal, over 35 % of pupils spend at least two hours a week on homework in science. Additionally, in Belgium (Flemish Community), the Netherlands, Poland and Slovenia, more students spend more time doing homework in science subjects than they do on homework on the language of instruction.
Explanatory note (Figure E7) Pupils were asked in the questionnaire sent to them to indicate how many hours a week they spent on homework and study at home on Science, Mathematics and Language. There were five categories that are grouped in the Figure in the following categories: (a) no time and less than two hours, (b) between two and four hours and (c) more than four hours. The sampling procedure involved selecting schools and then pupils (35 pupils aged 15). It sought to offer each pupil the same probability of being selected irrespective of the size of the school he or she attended. For further information on the PISA survey, see the Glossary and Statistical Tools section.

SECTION I – TAUGHT TIME
211
Figure E7: Distribution of 15-year-old pupils by number of hours a week that they report spending on homework and study at home, public and private sectors combined, 2006
No time or less than 2 hours
Between 2 and 4 hours
More than 4 hours
Language Mathematics Science Country that did not contribute to data collection UK (1) = UK-ENG/WLS/NIR
Source: OECD, PISA 2006 database.


213
E D U C AT I O N A L P R O C E S S E S
SECTION II – GROUPING OF PUPILS AND SCHOOL CLIMATE
GROUPING OF CHILDREN BY AGE IS A COMMON _________________ PRACTICE IN PRE-PRIMARY EDUCATION __________________
In institutions for pre-primary education (ISCED 0), children are grouped together in accordance with two main procedures:
� The first offers a foretaste of primary school arrangements, with children grouped by age. This is referred to as the ‘school model’.
� The second is more reminiscent of a ‘family’ arrangement, with children of different ages belonging to the same group.
Figure E8: Principal methods of grouping children
in pre-primary education (ISCED 0), 2006/07
Source: Eurydice.
Additional notes Belgium (BE fr, BE nl), Luxembourg and Iceland: The family model exists but is less widespread. Czech Republic: The regulation on pre-primary education issued in 2005, sets the organisation of groups by age; children from different years may be placed in one class of a mate�ská škola. It is up to the school head to decide. Netherlands: There is no pre-primary education in the strict sense. The Figure shows the situation in the first years of basisonderwijs (primary schools) which are attended by nearly all children aged 4. Portugal: Public institutions tend to organise groups according to the family model. In the private network, groups are usually organised according to the school model. United Kingdom (ENG/WLS/NIR): Although the school model predominates, the grouping of children is a matter for the institution, so practice can vary.
School model (groups of the same age)
Family model (mixed age grouping)

EDUCATIONAL PROCESSES
214
The most widespread practice in Europe is for groups to be formed from children of the same age, in accordance with the school model. Institutions in which this occurs are mainly the responsibility of the ministry of education. By definition, this is also the situation in pre-primary classes exclusively for children of one particular age (6-year-olds) in Denmark, Finland and Sweden.
By contrast, in Germany and in education-oriented institutions for those aged under 6 in Denmark, Finland and Sweden, children of different ages are in most cases grouped together in accordance with a more ‘family-like’ model (also referred to as ‘vertical grouping’). It should be noted that in all the foregoing countries except Sweden, this model is observed in institutions for which ministries other than the ministry of education are responsible (Figure B1).
Elsewhere, both models exist side by side as in Belgium (German-speaking Community), the Czech Republic, Estonia, Italy, Cyprus, Latvia, Lithuania, Austria, Poland, Portugal, Slovenia, Slovakia, Norway and Turkey. In some countries, mixed age grouping occurs mainly in very small schools in rural areas. In these cases, therefore, the school model is clearly the most widespread.
UPPER LIMITS OF BETWEEN 20 AND 25 CHILDREN PER ADULT _________ ARE A COMMON REQUIREMENT IN PRE-PRIMARY EDUCATION _________
For pre-primary education, most countries adopt requirements specifying a maximum number of children for whom an adult can be responsible. If this number is exceeded, either the group of children is divided into two, or supervised by two qualified adults working simultaneously.
For children aged 4, the most widespread formal requirements specify a maximum of 20-25 children per qualified adult. These limits are lower than 10 pupils in Latvia, Finland, the United Kingdom (Scotland) and Iceland. However, they are significantly higher (up to 30 children per qualified adult) in the United Kingdom (Northern Ireland) in the first year of primary school.
Stricter requirements may sometimes be established for special situations, such as the reception of children aged under 3 (Malta and Finland), the presence of children of different ages within the same group (Estonia and Slovenia), the location of schools in disadvantaged areas (France and Slovenia), or the presence of children with special needs in a group (Czech Republic, Ireland, Italy and Slovenia).
In countries with no regulations governing child/adult ratios, a variety of arrangements are adopted. In Belgium and the Netherlands, the total number of teachers that an institution can have is based on the size of its enrolment. School heads themselves determine how classes should be constituted. In the Netherlands schools are however free to decide on the number of teachers they employ. In France, the académie inspectors annually identify the average number of children per class for their département and may also fix the maximum number of children per class in accordance with its own criteria.

SECTION I I – GROUPING OF PUPILS AND SCHOOL CLIMATE
215
Figure E9: Recommended maximum numbers of 4-year-old children per qualified adult in schools or
other education-oriented pre-primary institutions, 2006/07
� No regulations on the number of adults per group
BE BG CZ DK DE EE IE EL ES FR IT CY LV LT LU HU MT NL AT PL PT RO SI SK FI SE UK- ENG/WLS
UK- NIR
UK- SCT IS LI NO TR
����24 ��25 20 27 25 25 ��25 26 8 20 26 25 20 � 25 25 25 20 12 24 7 �� 13 30 8 8 20 18 �
Source: Eurydice. Additional notes Bulgaria: There is no central regulation on the number of pupils per adult, but in general the maximum group size is limited to 24 pupils. Estonia: The requirement is for groups of children of the same age, and is reduced to 18 when groups contain children of different ages. Ireland: The Figure relates to infant classes in primary schools. France: Even if there is no regulation, the average is 26 students per class supervised by a professor of schools attended by an agent territorial spécialisé d'école maternelle (ATSEM). Cyprus: Since September 2008 the maximum number of children has become 25. Netherlands: There is no pre-primary education in the strict sense. The Figure shows the situation in the first years of basisonderwijs (primary schools) which are attended by nearly all children aged 4. Slovenia: The requirement specifying 12 children per adult covers 4 hours each day. For the remaining time, a single adult looks after the entire group (a maximum of 22 children). Slovakia: Following the new Education Act valid from 1 September 2008, the recommended maximum becomes 21. United Kingdom (ENG/WLS): The recommendation specifying a maximum of 26 children per two adults (where one is a qualified teacher and one a qualified nursery assistant) applies to nursery schools and classes in the public sector. The maximum is 20 if the teacher also has administrative duties. Other pre-school groups may adopt this ratio if their staff have the same qualifications; otherwise the recommendation is a maximum of eight children per adult. Many 4-year-olds are in primary school reception classes, where there is a statutory class size limit of 30. United Kingdom (NIR): The diagram relates to the first year of primary school. Although most 4-year-olds are in the first year of primary school, younger 4-year-olds may be in nursery schools and other pre-school settings where the recommendations are similar to those that apply in England and Wales. United Kingdom (SCT): The requirement has been in force since 2002. Previously the ratio was a maximum of 10 children per adult. Iceland: The requirement relates solely to qualified teachers in pre-primary education. Turkey: Even if there is no specific regulation for 4-year-old children the recommended class size for pre-primary settings in general is between 10 and 20. Explanatory note The Figure refers to official recommendations on the maximum number of children aged 4 for one qualified adult. In some countries this qualified adult can be supported by an assistant or auxiliary staff member.

EDUCATIONAL PROCESSES
216
IN THE MAJORITY OF COUNTRIES, PUPILS AGED 7 ARE TAUGHT ____________ BY THE SAME TEACHER FOR ALMOST ALL SUBJECTS _____________
At the start of primary education in the majority of countries (see Figure B1 for relations with ISCED level 1), classes are the responsibility of one particular teacher who gives lessons in most subjects, but may be replaced by other teachers for certain specific subjects (such as foreign languages, physical education and sports, music or religious instruction).
In ten countries individual class teachers assume the responsibility for all subjects taught to the group of pupils assigned to them, but can be replaced by a specialist for some specific subjects. In Bulgaria, France, Latvia, the Netherlands, Austria, Portugal, Sweden, Iceland and Norway, class teachers will be fully responsible for all subjects in some cases whereas, in others, specialist teachers will take over from them for certain subjects.
The way in which school subjects are shared among teachers directly depends on how far they have specialised. This does not necessarily mean that classes will always be rigidly compartmentalised. For example, in the United Kingdom (England, Wales and Northern Ireland), many schools use their teaching staff flexibly, providing for some exchange of staff between classes for particular activities.
Figure E10: Main models for dividing teaching and subjects among the teachers of pupils aged around 7, 2006/07
Source: Eurydice.
One teacher alone is responsible for all subjects
One teacher is routinely replaced by others for specific subjects
Two or more teachers share different subjects

SECTION I I – GROUPING OF PUPILS AND SCHOOL CLIMATE
217
Additional notes (Figure E10) Bulgaria: Only one teacher, who is the ‘primary teacher’, is responsible for the education of pupils aged 7 in all school subjects. However, other teachers who are supposed to be specialists in the field concerned are employed to teach some subjects such as music, physical education, foreign languages and crafts. In the case of full-day educational provision, children are taken care of and get pedagogical assistance from an educator-counsellor for their preparation of the lessons. Lithuania: In some schools, teachers may be assisted by specialists in certain subjects such as music, art, physical education or foreign languages. Netherlands: The responsible teacher is replaced for the subjects of music and physical education, because regular primary school teachers are not entitled to teach those two subjects. Slovenia: In the first year of compulsory education (pupils aged 6 to 7), the one main teacher accounts for half of the teaching time and is assisted by a second teacher who is usually qualified as a pre-primary teacher. Where 3 or more Roma pupils are included in the same group, two teachers work with the group all the time.
Two countries have a specific profile in the division of subjects in primary education. In Denmark, the division of teaching duties reflects specific arrangements in schools, but in the majority of cases two or several teachers share different subjects. However, in many cases teachers work as a team and the teaching of some subjects is interdisciplinary. In Italy, several arrangements are possible. In schools that have opted for so-called classi a modulo (or ‘modular classes’), three or four teachers are responsible for two or three classes respectively, and share their subjects. They take turns to teach one of these classes, and then work with it together for a few hours each day. In schools that have opted for classi a tempo pieno (or ‘full-time classes’), two teachers are responsible for a single class.
Teaching responsibilities tend to be shared among several teachers at the end of primary education in a number of countries. In Finland for example, pupils are increasingly taught by specialist teachers, so as to prepare them for the transition to the final years of the single structure (perusopetus/grundläggande utbildning) in which this practice is the norm. In the second stage of ensino básico in Portugal, teachers are each responsible for a group of subjects. The PIRLS 2006 survey revealed that this form of organisation was the most widespread in the fourth year of primary education in Germany and Hungary (Figure E11).
SUBJECTS MAY BE DIVIDED AMONG TEACHERS ______________ IN THE FOURTH YEAR OF PRIMARY EDUCATION _______________
On average in Europe, more pupils in the fourth year of primary education are taught by different teachers for different subjects, but relevant differences between countries exist. In nine countries that took part in the PIRLS 2006 survey, classes are assigned to a group of teachers each responsible for one or more different subjects (for example, mathematics, science and languages). In Bulgaria, Denmark, Germany, Italy, Hungary, Poland and Romania, this is the most widespread practice. In Denmark different teachers are responsible for different subjects for more than 95 % of the pupils in the fourth year of primary education, an arrangement already present in the first year of primary education (see Figure E10). However, in 13 countries the majority of pupils in the fourth year of primary education belong to a class with a teacher responsible for (almost) all subjects. In Belgium (Flemish Community), Latvia, Lithuania, Luxembourg, Austria, Slovenia, the United Kingdom and Iceland this applies to more than 50 % of pupils.
In the Netherlands, Sweden and Norway and to a lesser extent in the United Kingdom (Scotland), a third approach is relatively widespread. It involves two teachers sharing responsibilities by working either simultaneously (so-called ‘team teaching’) or in turns (‘job sharing’). In the first years of compulsory education in Sweden, teachers are encouraged to undertake team teaching which, depending on the school concerned, may assume a variety of forms (for example, simultaneous work with a group of pupils either all

EDUCATIONAL PROCESSES
218
together in one place, or split into two groups). The situation in the Netherlands is attributable both to the particularly high proportion of teachers in primary education who work part-time, and to ministry of education recommendations that encourage team teaching (while leaving final decisions on this matter to schools themselves).
Figure E11: Breakdown of pupils in the fourth year of primary education in accordance with how teaching and school subject responsibilities are divided among teachers,
as reported by teachers themselves, public and private sectors combined, 2006
One teacher responsible for all or most of the school week
Different teachers for different subjects (for example, mathematics, science, languages, etc.)
Two teachers sharing teaching responsibilities (e.g. team teaching or job-sharing)
Country that did not contribute to data collection
EU-27
BE fr
BE nl BG DK DE ES FR IT LV LT LU HU NL AT PL RO SI SK SE UK-
ENG UK-SCT IS NO
33.7 26.8 50.4 25.7 2.0 29.6 48.1 29.7 14.2 57.2 75.2 59.3 32.5 49.2 66.7 17.1 40.5 52.5 : 37.6 51.1 58.6 69.2 42.7
44.6 42.0 20.2 54.9 96.8 60.1 23.3 43.6 63.2 31.8 1.2 10.3 47.9 2.7 9.8 70.5 52.2 34.8 : 32.6 20.0 6.5 8.3 20.9
13.5 16.9 21.6 17.6 : 3.3 11.5 21.0 20.5 : 9.3 9.6 7.3 41.7 8.7 6.4 1.0 3.0 : 26.1 13.8 23.4 17.5 32.6
Source: IEA, PIRLS 2006 database.
Additional note Slovakia: This question was not included in the questionnaire sent to the teachers in that country. Explanatory note Teachers were asked in the questionnaire sent to them to indicate whether other teachers took their class for a significant period of the week and, if so, to distinguish between a situation in which pupils had different teachers for different subjects and another in which the teacher shared responsibility for lessons with another teacher. The sampling procedure involved selecting schools and then pupils from a class in the fourth year of primary education. It sought to offer each pupil the same probability of being selected irrespective of the size of the school he or she attended. For this purpose, schools were weighted in such a way that the probability that they would be selected was inversely proportional to their size. This explains why the Figure does not directly show the proportions of teachers who gave a particular reply, but the proportions of pupils whose teachers gave this reply. For further information on the PIRLS survey, see the Glossary and Statistical Tools section.

SECTION I I – GROUPING OF PUPILS AND SCHOOL CLIMATE
219
MANY COUNTRIES LIMIT THE SIZE OF _____________ CLASSES IN PRIMARY EDUCATION TO AROUND 25 ______________
Around one-third of all countries have no official recommendations regarding the maximum number of pupils in a class regardless of the subject taught, and two-thirds have no regulations regarding the minimum number. In the remaining countries, the central (or top-level) authorities have placed maximum and/or minimum limits on the size of classes. These official specifications do not necessarily correspond to real average class size which, for example, in the countries that took part in the PIRLS 2006 survey, was smaller than the recommended maximum (Figure E14).
Maximum group or class size norms for teaching most subjects may vary significantly from one country to the next, but never exceed 33-34 pupils, the maximum in the United Kingdom (Scotland) and Slovakia respectively. As a rule, the foregoing upper limits stand at between 25 and 30 pupils per class and the lowest maximum size (less than 22 pupils) can be seen in Bulgaria. In 11 countries, a minimum number of pupils is also required, but in the Czech Republic, Italy, Latvia, Austria and Romania this number is lower or equivalent to 10 pupils per class.
At primary level generally countries with no recommendations for maximum class sizes are the same as those that have no recommendations on the maximum number of children per adult in pre-primary education (Figure E9). In all these countries, the local authorities or schools have the power to decide how pupils should be grouped into classes.
In general, class size requirements do not distinguish between different subjects in the curriculum or the grades; nevertheless, in a few countries special recommendations exist in certain circumstances. For example, in Cyprus and Slovakia, the requirements for the first year of primary education are for smaller groups and in Poland recommendations for maximum class size exist only in the case of foreign language teaching. In the Czech Republic, Spain, Latvia and Lithuania, the maximum recommended number of pupils for foreign language classes is as much as 30 per cent lower than the recommended maximum for other subjects in the curriculum (see Key Data on Teaching Languages at School in Europe – 2008 Edition).
Figure E12: Class size regulations or recommendations in primary education, 2006/07
Number of pupils Number of pupils
Minimum Maximum � No recommendation
BE BG CZ DK DE EE IE EL ES FR IT CY LV LT LU HU MT NL AT PL PT RO SI SK FI SE UK- (1)
UK-SCT IS LI NO TR
Min � 16 10 � 17 � � 15 � � 10 � 8 � 18 � � � 10 � � 10 � 15 � � � � � 12 � �
Max � 22 30 28 29 24 � 25 25 � 25 25 30 24 28 26 30 � 30 � 24 25 28 34 � � � 33 � 24 � �
Source: Eurydice. UK (1): UK-ENG/WLS/NIR.

EDUCATIONAL PROCESSES
220
Additional notes (Figure E12) Czech Republic: Under exceptional circumstances, classes may contain more than 30 pupils. Germany: Average of the limits given for class size in the different Länder. Ireland: Although there are no centrally enforced regulations regarding maximum class size, the Department of Education and Science requests school authorities to keep the number of pupils in classes as low as possible and recommends an average mainstream class size of 28. Spain: The only regulations at national level concern the maximum class sizes; the recommendations regarding a reduction in the number of students per group for foreign languages are a competence of the Autonomous Communities. France: The estimated average number of students per class is 23. Cyprus: In the first two years, the requirement is 30. In the last four years, it is 32. Latvia: Minimum class size norms may vary from 8 to 15 depending on the location of the school. For schools in cities, the minimum size is 15. Hungary: Classes in all subjects may be divided into groups in each of which student numbers are no more than half the authorised maximum class size. Austria: In August 2008 the Austrian Länder were obliged by federal law to reduce the maximum class size from 30 to 25. Poland: According to the legislation adopted in 2008, it is recommended that the number of pupils in a class should be restricted to a maximum of 26 pupils in grades 1 to 3 of the primary school. Portugal: In the second cycle of ensino básico (ISCED 1), the requirement specifies a minimum of 25 pupils and a maximum of 28. Slovakia: Following the new Education Act valid from 1 September 2008, there is no regulation for minimum class size but only for maximum size which depends on the grade: 1st grade, 22 pupils; 2nd to 4th grades, 25 pupils; and 5th to 9th grades, 28 pupils. United Kingdom (ENG/WLS/NIR): A maximum class size of 30 applies only to pupils aged 5-7 (ENG/WLS) or 4-8 (NIR). United Kingdom (SCT): Scotland has a statutory maximum class size of 30 for the first 3 years of primary school (ages 5-7). The current Scottish Government is working with local governments to reduce the maximum class size to 18 in the first 3 years of primary school. Explanatory note Regulations or recommendations on the size of classes including children with special educational needs are not taken into account.
THERE ARE BETWEEN 10 AND 15 PUPILS __________________ PER TEACHER IN PRIMARY EDUCATION ___________________
In primary education, 19 countries have a ratio of between 10 and 15 pupils per teacher and almost all the rest a ratio below 20 pupils per teacher. Only Turkey has a considerably higher proportion of over 25 pupils per teacher.
On the whole, the pupil/teacher ratio declined between 2001 and 2006 in all countries with the exception of Slovenia where the ratio increased by 1.82 percentage points. This tendency may be explained mainly by the relative reduction of the young population (Figure A1) and the stable trend in the number of teachers in primary education. In eight countries (the Czech Republic, Greece, Cyprus, Latvia, Lithuania, Malta, Slovakia and Turkey) this ratio decreased by more than two percentage points, but in the case of Lithuania the decrease was in part due to a new methodology for the calculation of full-time equivalent teachers since 2002.
The pupil/teacher ratio should not be confused with the size of classes (Figure E12). The sharing of responsibility for a class among several teachers working simultaneously, or the presence of specialised tutors responsible for supporting pupils with special educational needs, are among factors with a bearing on pupil/teacher ratios without however affecting the size of classes.
In general, class sizes (Figure E14) are greater than pupil/teacher ratios. If all countries are considered as a whole, a relation may however be identified between both indicators in that, wherever pupil/teacher ratios are higher, class sizes increase. However in Hungary and Slovakia, for example, class sizes are relatively similar, but the pupil/teacher ratio is higher than the average in Slovakia and lower in Hungary.

SECTION I I – GROUPING OF PUPILS AND SCHOOL CLIMATE
221
Figure E13: Changes in the ratio of pupils to teaching staff in primary education (ISCED 1),
2001 and 2006
2001 2006
EU-27 BE BG CZ DK DE EE IE EL ES FR IT CY LV LT LU HU MT NL AT PL PT RO SI SK FI SE UK IS LI NO TR
2001 : 13.4 17.7 19.4 10.2 19.4 14.7 20.3 12.7 14.7 19.5 10.8 21.1 17.6 16.9 11.0 11.3 19.0 17.2 14.3 12.5 11.6 : 13.1 20.7 16.1 12.5 20.8 12.6 : : 29.8
2006 : 12.6 15.8 17.3 : 18.7 14.1 19.4 10.6 14.2 19.4 10.7 16.8 11.8 10.7 : 10.4 13.7 15.3 13.9 11.4 10.6 17.1 14.9 18.6 15.0 12.1 19.9 9.5 10.5 10.9 26.7
Source: Eurostat, UOE (data extracted July 2008). Additional notes Belgium: Private schools that are not government-dependent are not included. France: 2006 data relate to 2005 Cyprus: The data for 2006 include personnel teaching in special education schools. Lithuania: The calculation of full-time equivalent teachers has been improved since 2002; data are therefore not completely comparable with previous years. Luxembourg: The data for 2001 include only the public sector. Netherlands: The data also include ISCED 0. Portugal: The data for 2001 include all teachers (head counts) in the denominator. Data on full-time equivalent teachers are not available. Iceland: The data also include ISCED 2. The figure for 2006 is a national estimate.
Explanatory note The pupil/teacher ratio is obtained by dividing the number of pupils (expressed in full-time equivalents) at a given level of education by the number of full-time equivalent teachers working at the same level. With very few exceptions, only teachers in service are taken into account. Staff who are assigned tasks other than teaching (inspectors, school heads who do not teach, teachers on secondment, etc.) and prospective teachers doing teaching practice in schools are not included. Support teachers or other teachers working with an entire class in a single classroom, with small groups in a library or providing individual tuition within or outside a conventional classroom are included.
AROUND 23 PUPILS PER CLASS IN PRIMARY EDUCATION IN EUROPE, BUT WITH LARGE DISPARITIES
Class size can have an influence on the interaction between teachers and pupils. Smaller classes are often perceived as beneficial for pupil performance as they allow teachers to focus more on the individual pupil's needs. However, evidence suggests that the relationship between class size and pupil performance is non-linear and may depend on other factors.
Class sizes in the fourth year of primary education, as reported by teachers in the PIRLS 2006 survey, vary from one country to the next but also within countries. Data from schools generally reveal class sizes that are within the official mandatory or recommended maximum sizes (Figure E12). Bulgaria, Spain, Lithuania and Hungary are the only countries where the real size of classes in certain schools may exceed the maximum recommended sizes.

EDUCATIONAL PROCESSES
222
Figure E14: Distribution of pupils in the fourth year of primary education with respect to the size of their class,
as reported by teachers and compared to officially recommended or required maximum sizes, 2006
Regulations or recommendations concerning maximum size
Country that did not contribute to data collection Percentile 25 Percentile 50 Percentile 75 (P) EU-
27 BE fr
BE nl BG DK DE ES FR IT LV LT LU HU NL AT PL RO SI SK SE UK
ENG UK-SCT IS NO
10 16 15 16 15 15 16 17 20 15 10 12 13 15 16 15 15 12 14 15 17 21 20 15 12 25 20 19 19 17 18 19 20 22 17 16 17 15 18 21 18 18 16 17 19 20 25 23 17 16 50 23 22 21 20 20 22 24 24 20 20 22 17 23 25 22 22 20 20 23 23 29 26 21 20 75 26 24 24 22 23 25 25 26 22 26 24 18 26 28 25 25 23 23 26 25 30 30 23 25 90 29 26 26 25 25 27 27 28 24 28 26 20 28 31 26 27 26 25 30 29 32 32 26 28 (P) = Percentile. Source: IEA, PIRLS 2006 database and Eurydice 2006/07.
Explanatory note Teachers were asked in the questionnaire sent to them to indicate the number of pupils in the class. The sampling procedure involved selecting schools and then pupils from a class in the fourth year of primary education. It sought to offer each pupil the same probability of being selected irrespective of the size of the school he or she attended. For this purpose, schools were weighted in such a way that the probability that they would be selected was inversely proportional to their size. This explains why the Figure does not directly show the distribution of teachers with respect to the size of their class, but the distribution of pupils. For further information on the PIRLS survey, see the Glossary and Statistical Tools section. In the interests of clarity, the Figure only shows values corresponding to the percentiles 25, 50 and 75 in the distribution. Values for the percentiles 10 and 90 are shown in the table under the Figure. The regulations or recommendations concerning maximum class size are taken from Figure E12.

SECTION I I – GROUPING OF PUPILS AND SCHOOL CLIMATE
223
For countries with no recommendation or regulation on maximum class sizes, such as Belgium, France, the Netherlands, Poland, Sweden, the United Kingdom (England), Iceland or Norway, Figure E14 gives an overview of the situation. There is a relative disparity in the number of pupils per class, in that countries start with a median of 20 pupils per class in Norway and reach 29 pupils per class in the United Kingdom (England).
Particularly large classes can be found mainly in France, Hungary, the Netherlands, Slovakia and Sweden. Additionally in the United Kingdom (England and Scotland), at least 75 % of all classes are bigger than the European median and no less than 10 % of them have 32 or more pupils. On the other hand, in Latvia, Luxembourg, Romania and Norway, a quarter of classes have 15 or 16 pupils. These small class sizes are partly attributable to the location of the schools concerned, which tend to be situated in rural areas.
However, class size differs from the pupil/teacher ratio (the number of pupils per teacher). In general, class sizes clearly exceed this pupil/teacher ratio (Figure E13), given that several teachers may be responsible for a single class. Nevertheless, the relation between the two indicators is apparent in countries with relatively small classes in the fourth year of primary education, in which there is also a low pupil/teacher ratio for the whole of primary level. However two countries depart from this trend, as classes in Sweden and Hungary tend to be big (with a median of 23 pupils) and pupil/teacher ratios relatively small (12.1 and 10.4 pupils per teacher respectively).
COMBINING ORGANISATIONAL APPROACHES TO TEACH READING ________________________ IS A COMMON PRACTICE ________________________
Teachers may employ various strategies in classroom organisation, mainly based on the student's knowledge of different subjects. In general, 10 countries predominantly use whole-class teaching with further limited use of other forms of class grouping. In a second group of countries like Bulgaria, Hungary, the Netherlands, Poland, Romania and Slovakia, the use of three different methods is widely present. Finally in some countries specific arrangements can be seen.
If each type of grouping is analysed separately, whole-class teaching which enables teachers to communicate with all pupils at the same time appears to be the most common organisational approach. This method in many countries is also complemented by some other methods, such as organising ability groups or individualised instruction.
According to the replies from teachers in Bulgaria, Spain, Italy, Latvia and Romania, whole-class teaching is the method of instruction adopted for almost all pupils. At the other extreme in the United Kingdom (Scotland), whole-class teaching appears to be far less widespread than in other countries. The same situation is also apparent in the United Kingdom (England) and Iceland where less than 50 % of pupils are taught reading as a whole class.
Teaching for small groups based on ability is the preferred approach in the United Kingdom (England and Scotland) and a common complementary method of teaching in Bulgaria, Hungary and Romania.
Finally, individual tuition is the most popular approach to teaching reading in Iceland (for more than 70 % of pupils) and also a frequent complementary method in Bulgaria, Hungary, Poland, Romania and Slovakia.

EDUCATIONAL PROCESSES
224
Figure E15: Breakdown of pupils in the fourth year of primary education in accordance
with the organisational approach used to teach reading, as reported by their teachers, public and private sectors combined, 2006
Whole-class teaching of reading
Ability groups
Individualised instruction
Country that did not contribute to data collection
EU-27
BE fr
BE nl BG DK DE ES FR IT LV LT LU HU NL AT PL RO SI SK SE UK-
ENG UK-SCT IS NO
76.2 84.2 56.4 98.0 59.1 66.5 93.6 85.7 98.7 97.3 75.9 85.0 79.1 55.7 59.4 78.8 95.3 59.6 77.1 55.9 48.9 24.6 45.8 61.1
31.3 16.0 25.6 45.7 23.6 20.3 13.6 25.6 12.6 23.5 25.5 7.7 39.6 33.5 23.9 26.3 60.9 17.8 26.7 21.4 76.0 92.5 25.8 28.2
31.8 16.9 9.4 64.9 50.0 24.1 24.0 17.4 30.6 31.3 40.0 6.7 59.7 34.2 25.2 65.2 62.3 26.2 58.8 14.1 25.6 18.2 71.3 21.8
Source: IEA, PIRLS 2006 database. Explanatory note Teachers were asked in the questionnaire sent to them to indicate how often they taught reading (always or almost always, often, sometimes, never) using the following different organisational approaches: whole-class teaching; teaching same-ability groups; teaching mixed-ability groups; teaching groups formed in accordance with other arrangements; individualised instruction. The Figure is concerned with three parameters, namely whole-class teaching, same-ability groups and individualised instruction, and the possible answers ‘always or almost always’ and ‘often’ combined under a single heading. Ability groups here refer to pupils grouped within classes by teachers themselves for instruction in a given subject. The sampling procedure involved selecting schools and then pupils from a class in the fourth year of primary education. It sought to offer each pupil the same probability of being selected irrespective of the size of the school he or she attended. For this purpose, schools were weighted in such a way that the probability that they would be selected was inversely proportional to their size. This explains why the Figure does not directly show the proportions of teachers who gave a particular reply, but the proportions of pupils whose teachers gave this reply. For further information on the PIRLS survey, see the Glossary and Statistical Tools section.

SECTION I I – GROUPING OF PUPILS AND SCHOOL CLIMATE
225
INTEGRATION OF NON-NATIVE SPEAKERS: _________ SUPPORT WITHIN MAINSTREAM AND/OR SEPARATE CLASSES _________
In almost all education systems, non-native children of foreign mother tongue receive special assistance intended to meet their particular needs in mastering the language of instruction. It is only in Turkey that such measures have not yet been introduced. The majority of these language support measures have been devised for immigrant children who have recently arrived in the host country. This support is provided in accordance with two main models and different combinations between them.
Figure E16: Arrangements for integrating non-native pupils of foreign mother tongue within schools for full-time compulsory education, 2006/07
Source: Eurydice. Additional notes Czech Republic: Schools are not obliged to offer assistance with learning the Czech language to pupils from non-EU countries that are integrated within mainstream classes but, in practice, special support is offered to them. For pupils from the EU the regional authorities organise free preparatory language classes. Estonia: The specific measures mainly affect immigrant children whose mother tongue is Russian. Ireland: In order for a school to provide separate ‘initiation/immersion’ classes, over 20 % of its pupils must be of immigrant origin. Only a small number of schools are in this category. Spain: The central government issues general guidelines, following which the regional authorities decide on specific measures that are implemented by schools with due regard for the specific needs of every pupil. Latvia: The Figure relates solely to schools/classes providing special educational programmes (involving a bilingual approach) for pupils from Russian, Polish, Ukrainian, Hebrew, Lithuanian, Estonian, Romany and Byelorussian language minorities. Austria: Separate classes for pupils who have recently arrived in Austria are formed only on an exceptional basis and require the consent of the federal ministry. United Kingdom (ENG/WLS/NIR): Although central authorities provide funding for support measures and guidance on good practice, this funding is devolved to local authorities and (in England and Wales) to schools so that measures can be put into place according to local circumstances. Direct integration with additional support is the predominant model but not the only model.
Direct integration with language support
Formation of separate groups/classes (special programme with language support)
No official measures

EDUCATIONAL PROCESSES
226
Explanatory note (Figure E16) Only support measures implemented in mainstream schools are considered. Pupils who receive instruction in their mother tongue are not taken into account. Formation of separate groups/classes: temporary attendance in classes/lessons specially organised for eligible immigrant children of foreign mother tongue. In these classes, they follow a programme geared specifically to their needs, which includes time devoted to teaching the language of instruction. Direct integration: eligible immigrant children of foreign mother tongue enrol directly in classes in mainstream education. These children receive special support with learning the language of instruction during normal school hours.
The first approach involves immediately integrating pupils into mainstream education, sometimes by enrolling them in a school year preceding the one corresponding to their age, so that they have time to improve their knowledge of the language of instruction. Here they follow methods and the curricular content intended for all pupils. Language support measures are implemented on an individual basis for each immigrant pupil during normal school hours.
The second approach involves offering support to pupils individually or in groups separately from other children for a limited period (ranging from a few weeks to one or two school years) so that they can receive special tuition tailored to their needs. However, they may attend some lessons in the corresponding mainstream classes with all other pupils.
A complementary approach combining some elements from the previous two methods is used in the majority of countries. Its aim is to provide these pupils with separate instruction focusing on their special requirements – particularly their linguistic ones – and to integrate them gradually into mainstream education. Immigrant pupils are thus integrated in a ‘transition class’, ‘reception class’ or ‘immersion class’ for a period varying from a few weeks to several months but generally no longer than a school year. In certain cases, they join the mainstream class for lessons in which advanced proficiency in the language of instruction is not required (in artistic subjects, sports activities or foreign languages). It is sometimes subject to certain conditions such as a sufficient proportion of immigrant pupils at the school, or provision for specific groups (for example, children of asylum seekers or from a particular language group).
In just two countries, Germany and Romania, the main means of providing language support is through the formation of separate classes for children of foreign mother tongue for maximum periods of four years and one year respectively.
BETWEEN 10 AND 15 PUPILS PER TEACHER _______________________ IN SECONDARY EDUCATION _______________________
In secondary education, the majority of countries have pupil/teacher ratios that vary between 10 and 15 pupils per teacher. These ratios are generally lower than in primary education, except in Germany and Poland with 18.7 and 11.4 pupils per teacher in primary education respectively (Figure E13).
Greece, Lithuania and Portugal record ratios lower than 10 pupils per teacher for both levels of secondary education. Additionally, Belgium, Malta, Finland and Liechtenstein have fewer than 10 pupils per teacher in lower secondary education, but these ratios are higher in upper secondary education. By contrast, Germany, the Netherlands, Romania (upper secondary level), Finland (upper secondary), the United Kingdom (lower secondary) and Turkey have more than 15 pupils per teacher.

SECTION I I – GROUPING OF PUPILS AND SCHOOL CLIMATE
227
Pupil/teacher ratios should not be confused with the size of classes. The difference between the number of hours taught statutorily by teachers and the number of hours of teaching earmarked for pupils, as well as the presence of support teachers who have no teaching load and assist pupils with special educational needs, are among factors with a bearing on the pupil/teacher ratio without however affecting the size of classes. As a rule, class sizes are always greater than the foregoing ratios.
Figure E17: Ratio of pupils to teaching staff in secondary education (ISCED 2 and 3), 2006
ISCED 2 ISCED 3
EU-27 BE BG CZ DK DE EE IE EL ES FR IT CY LV LT LU HU MT NL AT PL PT RO SI SK FI SE UK IS LI NO TR
ISCED 2 : 9.4 12.3 12.3 11.4 15.5 12.3 : 8.0 12.5 14.2 10.3 11.6 10.6 8.5 : 10.2 9.3 : 10.4 12.6 8.3 12.2 10.2 13.7 9.7 11.4 16.7 10.6 7.3 10.2 :
ISCED 3 : 10.2 11.7 11.9 : 19.5 13.4 14.6 8.3 7.8 10.3 11.0 12.7 11.7 : : 12.3 14.3 15.8 11.3 12.7 7.5 15.7 14.0 14.2 15.8 13.8 11.4 10.8 11.4 9.7 15.8
Source: Eurostat, UOE (data extracted July 2008). Additional notes Belgium: Data exclude independent private institutions. Belgium, Finland and United Kingdom: ISCED 3 data include all or some of the students and teaching staff at ISCED 4. Denmark: ISCED 2 data include all or some of the students and teaching staff at ISCED 1. Ireland and Netherlands: ISCED 3 data include the students and teaching staff at ISCED 2 and 4. France: 2006 data relate to 2005. Lithuania: ISCED 3 general programmes are included in ISCED 2. Iceland: ISCED 2 data include all or some of the students and teaching staff at ISCED 1. Teachers at ISCED 3 partly include those at ISCED 4. Liechtenstein: Data show the students studying in Liechtenstein (e.g. using the domestic concept). Many pupils/students study and graduate abroad, mainly in Switzerland and Austria (ISCED 3 to 6 after obligatory schooling). Explanatory note The pupil/teacher ratio is obtained by dividing the number of pupils (expressed in full-time equivalents) at a given level of education by the number of full-time equivalent teachers working at the same level. With very few exceptions, only teachers in service are taken into account. Staff who are assigned tasks other than teaching (inspectors, school heads who do not teach, teachers on secondment, etc.) and prospective teachers doing teaching practice in schools are not included. ‘Support teachers or other teachers working with an entire class in a single classroom, with small groups in a library or providing individual tuition within or outside a conventional classroom are included.

EDUCATIONAL PROCESSES
228
ONE FIFTH OF PUPILS IN THE FOURTH YEAR OF PRIMARY ________ EDUCATION HAVE BEEN THE VICTIM OF SOME KIND OF OFFENCE ________
School climate can affect many areas of the interpersonal relations within schools and also have an important impact on the pupils' achievement. Positive interpersonal relationships and few offences among pupils stimulate optimal learning opportunities and reduce negative behaviour.
Figure E18: Breakdown of pupils in the fourth year of primary school according to the number of offences that they have reported in their school, 2006
Something was stolen from me
I was bullied by another student
I was injured by another student
Country that did not contribute to data collection
EU-27 BE fr BE nl BG DK DE ES FR IT LV LT LU HU NL AT PL RO SI SK SE UK-
ENG UK-SCT IS NO
23.4 35.9 18.1 15.9 8.4 20.6 28.5 32.2 28.5 19.9 10.0 17.8 25.6 12.9 23.0 13.5 13.6 19.9 22.1 13.4 26.3 22.6 16.1 10.3
25.1 39.4 38.1 19.6 15.3 14.2 22.4 30.5 22.6 31.3 37.5 20.6 48.3 30.7 19.2 15.0 46.8 19.8 35.1 13.2 30.1 27.7 29.4 17.7
28.2 43.7 39.9 17.1 14.4 33.4 43.9 30.2 15.0 35.2 34.6 26.1 18.5 24.3 24.2 15.4 14.8 18.4 20.2 20.8 38.9 35.4 24.2 18.2
Source: IEA, PIRLS 2006 database. Explanatory note Pupils were asked in the questionnaire sent to them to indicate if any of the following things had happened at school in the month immediately prior to the survey: 'Something was stolen from me', 'Something was stolen from someone in my class', 'I was bullied by another student', 'Someone in my class was bullied by another student', 'I was injured by another student' and 'Someone in my class was injured by another student'. The Figure is concerned with three parameters, namely 'Something was stolen from me', 'I was bullied by another student', and 'I was injured by another student', as these responses give a more direct perception of the school climate. The sampling procedure involved selecting schools and then pupils from a class in the fourth year of primary education. It sought to offer each pupil the same probability of being selected irrespective of the size of the school he or she attended. For further information on the PIRLS survey, see the Glossary and Statistical Tools section.
In the countries that participated in the PIRLS 2006 survey pupils were asked to indicate if something was stolen from them, or if they were bullied or injured during the month immediately prior to the survey. The responses to those questions represent the pupils' perception of their safety at school and can be used as a proxy for school climate analysis. However, due to differences in culture and educational traditions, the social perception of the impact of an offence on the school environment and its interpretation may vary considerably between countries. For that reason, the responses must be analysed with caution.

SECTION I I – GROUPING OF PUPILS AND SCHOOL CLIMATE
229
In Bulgaria, Denmark, Poland, Slovenia and Norway, less than 20 % of the pupils interviewed reported some offence associated with the three elements related to school climate. The situation is similar in Sweden, except for the category 'I was injured' to which 20.8 % of the pupils replied.
On the other hand in Belgium (French Community), Spain, France, Slovakia and the United Kingdom (England and Scotland), more than 20 % of the pupils reported that all the offences analysed had occurred in their school.
Finally, in some countries, only one of the offences has been mentioned by a high percentage of pupils. This is the case for example in Germany, in which more than 30 % of the pupils reported that they were injured by another student, or in Hungary and Romania, where more than 45 % of the pupils reported that they were bullied by another student.
LESS THAN 20 % OF PUPILS ATTEND A SCHOOL WHERE THE SCHOOL HEAD _____________ REPORTS CONSIDERABLE DISCIPLINE PROBLEMS ______________
In the PIRLS (2006) international survey school heads were asked to identify potential problems with an impact on the school climate. They were asked to report on twelve different discipline issues. As a proxy for the everyday school atmosphere, three kinds of problem are considered here, namely 'student tardiness', 'student absenteeism' and 'classroom disturbance'. In some cases, the school head response may be based on individual observations and, in others, on specific rules or regulations for recording late arrivals or classroom disturbance. For that reason, the data must be interpreted with caution.
In Belgium (Flemish Community), Spain, France, Poland and Sweden, school heads representing less than 20 % of pupils in the fourth year of primary education reported having problems with these three issues. Additionally, school heads in Denmark, Slovenia, Iceland and Norway claimed that ‘student tardiness’ or ‘student absenteeism’ was a problem among only small proportions of their school intake, but reported that classroom disturbance was a ‘moderate’ or ‘serious’ problem for around a third of the same pupil population.
On average, classroom disturbance is the issue most frequently cited as a moderate or serious problem among around 25 % of pupils in the fourth year of primary education who attend a school at which this happens. Nevertheless the disparity between countries is significant. In Germany, Austria and Slovakia, classroom disturbance is reported by school heads to be a moderate or serious problem for more than 40 % of the students, corresponding to a major problem with a significantly higher incidence in those countries.
On the other hand, school heads representing 20 to 40 % of the pupils in countries like Bulgaria, Italy, Latvia, Lithuania and Romania stated that all three factors are a moderate or serious problem in their school. All these countries have relatively large schools (Figure B5), which may explain the overall high level of student tardiness or classroom disturbance. Moreover, student absenteeism is reported to be a moderate or serious problem for more than 40 % of the students in the schools concerned in Bulgaria, Lithuania and Romania. In all three countries, this is the most frequently indicated discipline issue.
A low percentage of student absenteeism (under 5 %) is reported in Belgium (Flemish Community), Poland, the United Kingdom (Scotland) and Norway.
The three school climate factors must be evaluated in combination with the class and school size and also the level of education provided. In some countries the school heads who replied to the PIRLS questionnaire are in charge of a school providing some kind of secondary education. Consequently it can be assumed that in those schools the recorded rates for the three factors analysed might be higher.

EDUCATIONAL PROCESSES
230
Figure E19: Breakdown of pupils in the fourth year of primary education attending a school in which issues like
tardiness, absenteeism and classroom disturbance are declared to be moderate or serious problems, according to the school head, 2006
Student tardiness Student absenteeism Classroom disturbance Country that did not contribute to data collection
EU-27 BE fr BE nl BG DK DE ES FR IT LV LT LU HU NL AT PL RO SI SK SE UK-
ENG UK-SCT IS NO
15.0 19.9 10.8 32.8 11.7 8.1 8.6 12.6 26.0 49.5 24.3 10.1 22.2 8.5 9.7 26.7 5.8 6.6 9.7 21.4 6.7 13.4 3.0
15.0 20.1 3.1 46.9 11.5 7.9 9.0 11.2 21.6 36.1 43.4 13.0 6.1 6.0 3.8 52.4 11.3 29.6 8.5 23.7 2.3 5.4 0.6
25.1 5.9 13.3 28.3 24.2 47.9 11.9 13.1 34.7 24.1 20.8 21.9 20.6 42.1 18.5 37.4 38.2 46.5 14.6 9.9 9.9 31.1 33.3
Source: IEA, PIRLS 2006 database. Additional note Luxembourg: There are no school heads in primary schools. Explanatory note School heads were asked in the questionnaire sent to them to indicate to what degree twelve different discipline issues are problems in their school. Replies from school heads were collected into four different categories. The Figure shows the responses indicating that three of the disciplinary issues, namely ‘Student tardiness’, ‘Student absenteeism (i.e. unjustified absences)’ and ‘Classroom disturbance’ are a ‘Moderate problem’ or ‘Serious Problem’. The sampling procedure involved selecting schools and then pupils from a class in the fourth year of primary education. It sought to offer each pupil the same probability of being selected irrespective of the size of the school he or she attended. For this purpose, schools were weighted in such a way that the probability that they would be selected was inversely proportional to their size. This explains why the Figure does not directly show the proportions of school heads who gave a particular reply regarding the factor at issue, but the proportions of pupils in the school whose school head gave this reply. For further information on the PIRLS survey, see the Glossary and Statistical Tools section.

231
E D U C AT I O N A L P R O C E S S E S
SECTION III – ASSESSMENT OF PUPILS
THE POSSIBILITY OF REPEATING A YEAR EXISTS _______________ IN THE MAJORITY OF EUROPEAN COUNTRIES ________________
Countries vary in the way they manage under-attainment by individual pupils, which may affect their progression from one year to the next, in accordance with one of two standard procedures. The first involves them redoing the year they have just completed, whereas in the second they move on to the following year as a matter of course.
In many countries, pupils who have not acquired an adequate mastery of the curriculum at the end of a school year have to repeat the year. The decision to make pupils redo a year is at the discretion of the school concerned. This may occur in Belgium, Bulgaria, the Czech Republic, Germany, Estonia, Latvia, Lithuania, Luxemburg, the Netherlands, Austria, Romania, Slovakia, Finland and Turkey. It should be noted that while it may be theoretically possible in these countries for pupils to redo a year, in practice this may sometimes happen only very rarely. In Finland, for example, pupils may only repeat a year in two possible cases, either when they are deemed to have ‘failed’ in one or more subjects following assessment, or when their overall study progress is such that doing the year again is considered appropriate. However, in the first case pupils must have been given an opportunity to demonstrate, without further instruction, that they have reached the level required for them to move on. In the second, a parent or guardian must be given an opportunity to express an opinion before any decision is taken.
In countries where it is possible to take a year again, pupils are not allowed to do so an unlimited number of times (Belgium, Spain, Cyprus and Liechtenstein). Furthermore, they may only be able to do so at certain stages of their school career. In two countries, Spain and France, pupils can only repeat a year at the end of each stage lasting, in these countries, between two and four years. In some countries, including Bulgaria, Germany, Hungary, Austria, Poland and Portugal pupils, cannot redo the initial year or the first years of primary school.
By contrast, in Denmark, Ireland, Italy, Greece, Cyprus, Hungary, Malta, Slovenia, Sweden, the United Kingdom, Iceland, Liechtenstein and Norway, pupils normally progress automatically from one year to the next throughout compulsory education, with supplementary teaching support measures provided for those with under-attainment. Nevertheless, even in countries that have opted for automatic progression, it may be possible for pupils to repeat a year under exceptional circumstances. Depending on the country concerned, these may range from a very long period of absence during the school year (for example due to illness) to a recommendation by suitably qualified persons external to the school (psychologists, doctors, social workers, etc.). Such decisions are usually taken with the agreement of the school head and the parents concerned.

EDUCATIONAL PROCESSES
232
Figure E20: Main official recommendation for the progression to the next year
during mainstream primary education (ISCED 1), 2006/07
Source: Eurydice. Additional notes Belgium: It is possible to redo a year only twice during primary education. Bulgaria: It is possible to repeat any year except the first year of primary school, following which summer courses are organised for children experiencing difficulty. Czech Republic: According to the Educational Act (2005), a pupil who in the first stage of basic school (ISCED 1) repeats a year shall, regardless of the pupil's results, proceed to the upper grade during the second stage. Denmark and Greece: It is only possible for children to repeat a year if there are exceptional reasons for concluding that they will benefit from this. Germany and Austria: Pupils move on automatically from the first to the second year of primary school. Subsequently, they may be made to repeat a year depending on their results. Estonia: Pupils only have to redo the first or second year under exceptional circumstances (e.g. for medical reasons). Spain: Pupils can only repeat a year once, although this may occur at the end of any of the three ciclos. Italy: Non-admission to the following year is authorised only in exceptional cases. The decision not to admit a student to the next class is the responsibility of the group of teachers involved in the class. Cyprus: Pupils can repeat a year only once during primary education. Hungary: Progression is automatic in the first three years; however, pupils can repeat a year under exceptional circumstances and with parental consent. It is possible to fail and redo a year in the fourth year. Malta: In primary education, pupils only have to repeat a year in exceptional cases. The head of school recommendation is crucial in deciding whether this should occur. Parents whose children fail the Junior Lyceum examination at the end of primary education can request that they redo the final year with a view to retaking the examination the following year. Netherlands: The option of repeating a year is avoided as far as possible. It usually happens only when a child is considerably behind classmates in his/her level of attainment and development and the school has been unable to find any other solution. Poland: During the first three years, pupils may only do their year again under exceptional circumstances and after the school has consulted their parents and specialist staff at centres for psychological assistance. Portugal: It is possible to redo a year except in the first year of schooling. Slovenia: The basic school legislation stipulates that pupils in the first 6 years of basic education do not repeat a year. It is possible to repeat a year only in very exceptional cases (e.g. due to illness or relocation. United Kingdom (ENG/WLS/NIR): It is for schools to decide how to organise pupils into teaching groups. However, there is an expectation that low attainment of individual pupils should be addressed through differentiated teaching and the provision of additional support, rather than by repetition of a year. Pupils therefore almost always progress automatically to the next year.
Automatic progression
Possible to redo a year
Possible to redo a year at the end of a particular stage

SECTION I I I – ASSESSMENT OF PUPILS
233
Additional notes (Figure E20 – continued)) Liechtenstein: If a pupil is lacking significantly in performance and personal development, teachers and parents together may decide to let the pupil redo a year (once at primary level). Turkey: In integrated classes (a practice in less populated rural areas), students can redo a year only in third and fifth grades.
Explanatory note Decisions arising from the assessment of children with special educational needs in mainstream classes are not covered.
ONLY A FEW COUNTRIES REQUIRE A PRIMARY SCHOOL CERTIFICATE _______________ FOR ADMISSION TO SECONDARY EDUCATION ________________
The organisation of compulsory education varies widely throughout Europe (Figure B1). In a first group of countries, pupils complete all – or nearly all – of their compulsory education within a single structure. In a second group of countries, there are two successive levels of education, primary and secondary, and in most of them there is a ‘common core’ at the start of secondary education, offering all pupils a common basic course. However, in some of them, pupils at this point may choose between several branches or types of school.
Figure E21: Conditions of admission to lower secondary education (ISCED 2), public and government-dependent private sectors, 2006/07
Source: Eurydice. Additional notes Belgium: Pupils who have not obtained the primary school leaving certificate on completion of the sixth year of primary education and/or who are at least 12 years old may be admitted to the first stage of lower secondary education where they can still obtain the certificate. Belgium (BE fr): The primary school certificate is being awarded based on an external standardised examination at the end of this education level. From 2008/2009, the external examination constitutes the only way to obtain the certificate. Hungary: Where the pupil chooses one school out of the catchment area or one with special curriculum, the school can lay down admission criteria.
Continuation of single structure without transition
Successful completion of primary school/reaching a certain age
Educational guidance by a class or school council and/or examination
Primary school certificate required

EDUCATIONAL PROCESSES
234
Additional notes (Figure E21 – continued) Malta: Admission to a number of government-dependent church secondary schools is by means of a nationally based examination called the Common Entrance Examination. Pupils, who wish to continue their secondary education in Junior Lyceums, have to pass a special Junior Lyceum examination. However, it is planned to phase out the Junior Lyceum Entrance Examination in the school year 2010/11. Poland: At the end of primary school, pupils are obliged to sit an external test which has a diagnostic rather than a selective function. However sitting this test, regardless of the results obtained, is required for the completion of primary school and admission to lower secondary school. United Kingdom (ENG/NIR): In Northern Ireland, and in some areas of England, there are selective schools for which admission depends on the results of a competitive examination. In Northern Ireland, the system is changing and the last centrally organised tests for admission to secondary schools were taken in 2008 for entry in 2009.
Depending on the organisation and structure of the education system, in some countries the results of pupils may have an impact on arrangements for their transition from primary to secondary education. There are four main groups of countries.
In the first group, in which compulsory education forms a single structure, admission to lower secondary education is automatic with no transition (12 countries). Thus pupils progress to the next year if they have fulfilled the requirements of the previous one. However, when pupils in the Czech Republic, Hungary and Slovakia choose to complete their compulsory education in a secondary school rather than within the single-structure system, they have to take an examination set by the school concerned.
To gain admission to lower secondary education in the second group of countries, pupils must have successfully completed the last year of primary school. This applies to Ireland, Spain, Italy, Malta, Portugal and Romania. In France and the United Kingdom, children are normally admitted to secondary level when they reach the appropriate age.
In the third group of countries, the transition to lower secondary education depends on the decision of a class council or school council, in addition to the completion of primary education. In all these countries, lower secondary education is divided into different types of educational provision. Pupils who have completed primary education are therefore steered towards different types of secondary school depending on their results at primary level. In Germany, the primary school recommendation forms the basis for deciding which type of subsequent provision pupils should receive or advising them or their parents in this respect. Indeed, the recommendation involves full consultation with parents in all cases. Depending on the Land concerned, the final decision is taken by the parents, the prospective school or the school supervisory authority. In Luxembourg, a guidance recommendation is issued at the end of the sixth year of primary school. If the parents decide not to accept it, the pupil has to take a national entrance examination for admission to general secondary education. In the Netherlands, the primary school leaving report depends partly on the assessment of the pupil which, in most cases, involves a centrally organised, non-compulsory test during the final year of basisonderwijs. The test helps to indicate a pupil's level and to inform the choice of differentiated secondary education. Admission to the allgemein bildende höhere Schule in Austria depends on pupils having successfully completed the fourth year of primary school with the grade ‘excellent’ or ‘good’ in German and mathematics. Pupils who are not automatically admitted to the allgemein bildende höhere Schule can take an entrance examination set by it.
Finally, in a small number of countries where primary and secondary education are separate, the decision to transfer pupils to the next level depends on whether or not they have a primary school leaving certificate. This is awarded on the basis of work during the school year in Bulgaria, Greece, Cyprus, Lithuania and Poland (along with the requirement to sit an external test). In Belgium, the certificate is awarded usually at

SECTION I I I – ASSESSMENT OF PUPILS
235
the end of the sixth year by the class council if the targets from the core curriculum (study plan) are attained. In virtually all these countries, it is issued by the individual school with no external oversight.
CERTIFICATES AWARDED AT THE END OF COMPULSORY EDUCATION _____________ ARE GENERALLY BASED ON FINAL EXAMINATIONS _____________
In most European countries, a certificate or certificates are awarded to pupils at the end of general lower secondary education or to those who complete full-time compulsory education. The information given here relates solely to the award of certificates in general education, which in most countries corresponds to a transition to upper secondary education. Only pupils who attend VWO and HAVO schools in the Netherlands, as well as pupils in Slovakia, do not receive a certificate at this stage of their education.
In most cases, this certificate is awarded to pupils, at least partly, on the basis of results obtained in a final examination. It is even awarded wholly on the basis of an external final exam in a few Länder in Germany (in the case of the Hauptschule and Realschule), Ireland and Romania (until 2007/08). However, in Bulgaria, the Czech Republic, most German Länder, Spain, Luxembourg, Hungary, Austria, Slovenia, Finland, Sweden and Turkey the certificate is awarded only on the basis of the pupil's marks and work over the year.
When a final examination is set it includes at least one written part. Sometimes the tests, written and/or oral, are compiled by a team from outside the school but they are usually administered by the school. It is only in Belgium, Greece, Cyprus and Liechtenstein that the written part is prepared within the school, which is entirely responsible for it.
In 12 countries, internal assessments, e.g. in the form of final internal tests or an evaluation of the marks and work over the year, are combined with external or externally mediated examinations. For example, in Italy the chair of the examination board, who is not a member of the school, gives his or her opinion on the tests set by the teachers and supervises the correction and marking. In the Netherlands, the final examination consists of two tests: an internal test (schoolexamen), which is oral and/or written, and a written test set by an external body (centraal examen). Finally, in Portugal, pupils take internal and external examinations at the end of the single structure.
Where the certificate is awarded on the basis of marks and work during the year or the results of an examination set by the school, teachers are generally responsible for the mark shown on the certificate. In several countries, the mark given by teachers is either weighted by an external grade (for example, the results obtained in the external examination) or decided on the basis of criteria established by an external authority (Estonia, Latvia, Netherlands and Portugal). In Ireland, Malta, Poland, Romania and the United Kingdom, the final grade is awarded by examiners from outside the school.

EDUCATIONAL PROCESSES
236
Figure E22: Certified assessment at the end of general lower secondary education
or full-time compulsory education, 2006/07
Source: Eurydice.
The certificate is awarded on the basis of a final examination DE (in certain Länder for the Hauptschule and the Realschule), IE, RO the grades and work over the year BG, CZ, DE (most Länder), ES, LT, LU, HU, AT, SI, SK, FI, SE, TR a final examination and the grades and work over the year BE, DK, EE, EL, FR, IT, CY, LV, MT, NL, PL, PT, UK, IS, LI, NO When there is an examination, it is written BE de, EL, FR, IE (+ optional oral), CY, NL (centraal examen), PL, PT, RO, LI
written and oral BE fr, BE nl, DK, DE (in certain Länder for the Hauptschule and the Realschule), EE, IT, LV, MT (oral for languages and the practical component of some subjects, e.g. sciences, arts, etc.), NL (schoolexamen), UK (oral/practical examinations for some programmes only), IS, NO
When there is a written examination, it is set by the school (internally) BE, EL, CY, NL (schoolexamen), PT, IS, LI the school with external verification DE (in certain Länder for the Hauptschule and the Realschule), IT, SI
an external body/authority DK, DE (in certain Länder for the Hauptschule and the Realschule), EE, FR, IE, LV, MT, NL (centraal examen), PL, PT, RO, UK, IS, NO
When there is an oral examination, it is set by
the school (internally) BE fr, BE nl, DK, DE (in certain Länder for the Hauptschule and the Realschule), NL (schoolexamen), IS
the school with external verification IT, NO an external body/authority EE, IE, UK, LV, MT The final grade is awarded by only the pupil's teachers BE, BG, CZ, DE (most Länder), EL, ES, CY, LT, LU, HU, AT, SK, FI, SE, LI, TR
the teachers, but weighted by an external grade DK, DE (in certain Länder for the Hauptschule and the Realschule), FR (work of 2 years and examination), IT, IS, NO
the teachers, on the basis of criteria defined by an external body EE, LV, NL, PT
external examiners IE, MT, PL, RO, UK
Final grade based only on the marks and the work over the year
Final grade based on work over the year and an internal final examination
Final grade combining internal assessment and an external (or externally verified) final examination
Final grade based only on an external final examination
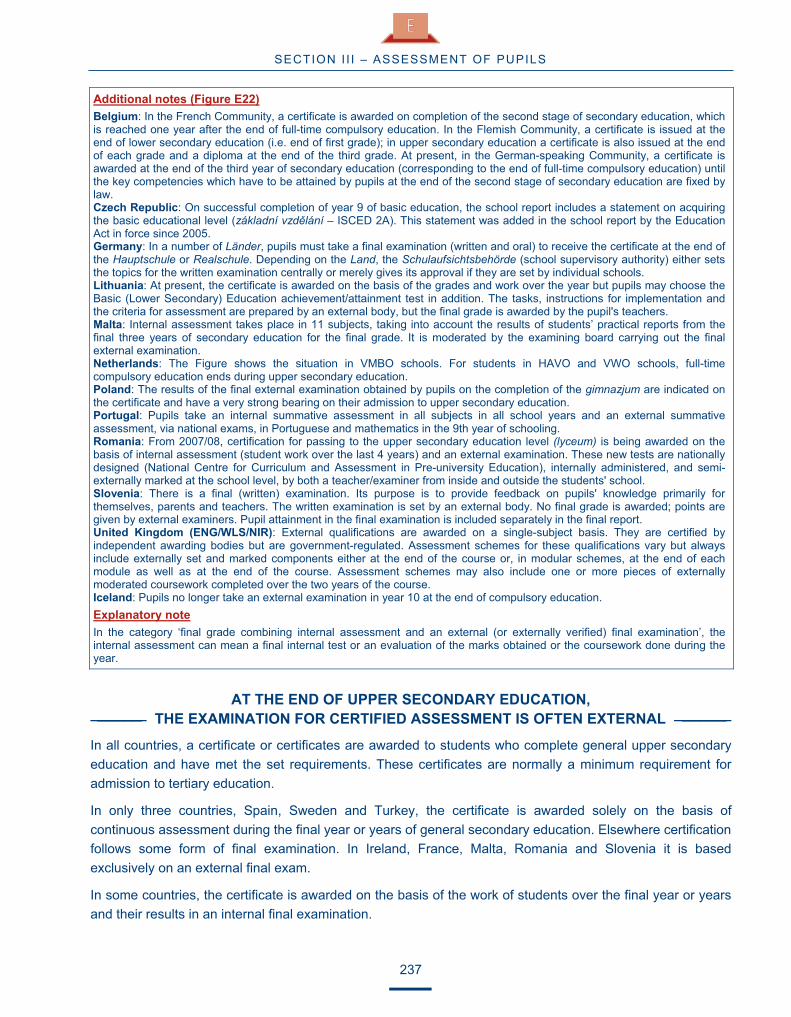
SECTION I I I – ASSESSMENT OF PUPILS
237
Additional notes (Figure E22) Belgium: In the French Community, a certificate is awarded on completion of the second stage of secondary education, which is reached one year after the end of full-time compulsory education. In the Flemish Community, a certificate is issued at the end of lower secondary education (i.e. end of first grade); in upper secondary education a certificate is also issued at the end of each grade and a diploma at the end of the third grade. At present, in the German-speaking Community, a certificate is awarded at the end of the third year of secondary education (corresponding to the end of full-time compulsory education) until the key competencies which have to be attained by pupils at the end of the second stage of secondary education are fixed by law. Czech Republic: On successful completion of year 9 of basic education, the school report includes a statement on acquiring the basic educational level (základní vzd�lání – ISCED 2A). This statement was added in the school report by the Education Act in force since 2005. Germany: In a number of Länder, pupils must take a final examination (written and oral) to receive the certificate at the end of the Hauptschule or Realschule. Depending on the Land, the Schulaufsichtsbehörde (school supervisory authority) either sets the topics for the written examination centrally or merely gives its approval if they are set by individual schools. Lithuania: At present, the certificate is awarded on the basis of the grades and work over the year but pupils may choose the Basic (Lower Secondary) Education achievement/attainment test in addition. The tasks, instructions for implementation and the criteria for assessment are prepared by an external body, but the final grade is awarded by the pupil's teachers. Malta: Internal assessment takes place in 11 subjects, taking into account the results of students’ practical reports from the final three years of secondary education for the final grade. It is moderated by the examining board carrying out the final external examination. Netherlands: The Figure shows the situation in VMBO schools. For students in HAVO and VWO schools, full-time compulsory education ends during upper secondary education. Poland: The results of the final external examination obtained by pupils on the completion of the gimnazjum are indicated on the certificate and have a very strong bearing on their admission to upper secondary education. Portugal: Pupils take an internal summative assessment in all subjects in all school years and an external summative assessment, via national exams, in Portuguese and mathematics in the 9th year of schooling. Romania: From 2007/08, certification for passing to the upper secondary education level (lyceum) is being awarded on the basis of internal assessment (student work over the last 4 years) and an external examination. These new tests are nationally designed (National Centre for Curriculum and Assessment in Pre-university Education), internally administered, and semi-externally marked at the school level, by both a teacher/examiner from inside and outside the students' school. Slovenia: There is a final (written) examination. Its purpose is to provide feedback on pupils' knowledge primarily for themselves, parents and teachers. The written examination is set by an external body. No final grade is awarded; points are given by external examiners. Pupil attainment in the final examination is included separately in the final report. United Kingdom (ENG/WLS/NIR): External qualifications are awarded on a single-subject basis. They are certified by independent awarding bodies but are government-regulated. Assessment schemes for these qualifications vary but always include externally set and marked components either at the end of the course or, in modular schemes, at the end of each module as well as at the end of the course. Assessment schemes may also include one or more pieces of externally moderated coursework completed over the two years of the course. Iceland: Pupils no longer take an external examination in year 10 at the end of compulsory education. Explanatory note In the category ‘final grade combining internal assessment and an external (or externally verified) final examination’, the internal assessment can mean a final internal test or an evaluation of the marks obtained or the coursework done during the year.
AT THE END OF UPPER SECONDARY EDUCATION, _____ THE EXAMINATION FOR CERTIFIED ASSESSMENT IS OFTEN EXTERNAL _____
In all countries, a certificate or certificates are awarded to students who complete general upper secondary education and have met the set requirements. These certificates are normally a minimum requirement for admission to tertiary education.
In only three countries, Spain, Sweden and Turkey, the certificate is awarded solely on the basis of continuous assessment during the final year or years of general secondary education. Elsewhere certification follows some form of final examination. In Ireland, France, Malta, Romania and Slovenia it is based exclusively on an external final exam.
In some countries, the certificate is awarded on the basis of the work of students over the final year or years and their results in an internal final examination.

EDUCATIONAL PROCESSES
238
In the Czech Republic, Estonia, Hungary, Poland, Slovakia and Finland, two certificates may be awarded at the end of general upper secondary education. In most of these countries, the first certificate is based solely on the marks received for the work during the final school year, whereas the second one is awarded on the basis of a final examination. The situation is slightly different in Estonia, where the first certificate is based on work during the final years and the results of final internal examinations, and the second certificate on the results obtained in external examinations. In all these countries, except Finland (in the case of polytechnics), the first certificate on its own does not provide for admission to tertiary education.
In the majority of countries, the final examination is in two parts, written and oral. In Bulgaria, Greece, Cyprus, Lithuania, Portugal and Finland, it is exclusively written. At this level of education, the written examination is very often compiled by a body external to the school, while sometimes it is administered by the institution and externally verified.
However, in Belgium, the Czech Republic, Slovakia and Iceland, the final written examination is set by a teacher or a team of teachers within the school. In Greece, students take two written examinations, one internal and one external. In Portugal, the external final examination is only scheduled for subjects studied until the end of upper secondary education. As regards the written part of the examination in Austria, the school inspector responsible within the education authority selects the examination questions from those proposed by the school. As regards the oral part, the chairman of the examination committee selects the questions from those proposed by the examiners.
In most countries where the final examination is in two parts (written and oral), these are organised in the same manner, either within the school or by an external body. In the Netherlands, the final examination consists of two tests: an internal test (schoolexamen), which is oral and/or written and set and marked by the teacher, and an external test (centraal examen), which is written, set by an external body and marked by the teachers according to the standards established by the external body.
In the majority of countries, the final grade is awarded by teachers within the school who decide what marks students should get. Teachers decide whether to award the certificate on their own initiative, or on the basis of externally defined criteria or by weighting the student marks with reference to an external grade. To obtain the certificate following the external written matriculation examination in Finland, assessment is initially conducted by teachers and then by an external body, the Matriculation Examination Board. In several countries, the final grade is awarded by an examining body or persons from outside the school. In Estonia, only the external examinations are marked by external examiners. Similarly, in Latvia and Lithuania, external examiners mark subjects assessed in centrally devised examinations while, in the case of other subjects, teachers correct tests with reference to norms established by an external body. In the Netherlands, the final grade is the average of the results in the two examinations (internal and external).

SECTION I I I – ASSESSMENT OF PUPILS
239
Figure E23: Certified assessment
at the end of general upper secondary education, 2006/07
Source: Eurydice.
The certificate is awarded on the basis of a final examination CZ (maturitní zkouška), EE (riigieksamitunnistus), FR, IE, HU (Érettségi Bizonyítvány), MT, AT, SI, SK
(maturitná skúška), FI (Matriculation Examination), RO the grades and work over the year CZ (vysv�d�ení), ES (continuous assessment), HU (Évvégi Bizonyítvány), PL (�wiadectwo uko�czenia liceum),
SK (vysved�enie), FI (leaving certificate), SE (marks in the final three years), TR a final examination and the grades and work over the year
BG, BE, CZ, DK, DE, EE (gümnaasiumi lõputunnistus), EL, IT, CY, LV, LT, LU, NL, PL (�wiadectwo maturalne), PT, UK, IS, LI, NO
When there is an examination, it is written BG, EL, CY, LT, NL (centraal examen), PT, FI (Matriculation Examination) written and oral BE, CZ, DK, DE, EE (riigieksamitunnistus and gümnaasiumi lõputunnistus, oral for second and foreign
languages only), FR, IE, IT, LV, LU, HU (Érettségi Bizonyítvány), MT (oral for languages and the practical component of some subjects, e.g. sciences, arts, etc.), NL (schoolexamen), AT, PL (�wiadectwo maturalne), RO, SI, SK (maturitná skúška), UK (oral/practical examinations for some programmes only), IS, LI, NO
When there is a written examination, it is set by the school (internally) BE, CZ (maturitní zkouška), EE (gümnaasiumi lõputunnistus), EL, NL (schoolexamen), PT, IS the school with external verification DE (in some Länder), IT, AT, LI an external body/authority BG, DK, DE (in some Länder), EE (riigieksamitunnistus), EL, FR, IE, IT, CY, LV, LT, LU, HU (Érettségi
Bizonyítvány), MT, NL (centraal examen), PL (�wiadectwo maturalne), PT, RO, SI, SK, FI (Matriculation Examination), UK, NO
When there is an oral examination, it is set by the school (internally) BE, CZ (maturitní zkouška), DK, EE (gümnaasiumi lõputunnistus), NL (schoolexamen), PL (�wiadectwo
maturalne), SK (maturitná skúška), IS the school with external verification DE, IT, HU (Érettségi Bizonyítvány), AT, LI, NO an external body/authority EE (riigieksamitunnistus), FR, IE, IT, LV (for centralised examinations), LU, MT, RO, SI, UK
Final grade based only on marks and work during the year or over several years
Final grade based on work over the year and an internal final examination
Final grade combining internal assessment and an external (or externally verified) final exam
Final grade based only on an external final examination

EDUCATIONAL PROCESSES
240
The final grade is awarded by only the student's teachers BE, CZ, EE (gümnaasiumi lõputunnistus), ES, HU (Évvégi Bizonyítvány), PL (�wiadectwo uko�czenia liceum),
SK (vysved�enie and maturitne vysved�enie – internal part), FI (leaving certificate), SE, IS, TR the teachers, but weighted by an external grade BG (marks in 3 final years + in the examination), DK (oral), DE (results in Abitur), EL, CY (marks of the year +
final examination), AT, LI, NO (marks obtained in coursework + in the examination) the teachers, on the basis of criteria defined by an external body
IT, LV, LT, HU (Középszint� Érettségi Vizsga), NL, PT
external examiners DK (written), EE (riigieksamitunnistus), FR (jury), IE, IT, LV (for centralised examinations), LT (in the case of centrally devised examinations), LU, HU (Emelt Szint� Érettségi Vizsga), MT, PL (�wiadectwo maturalne), RO, SI, SK (maturitné vysved�enie- external part), FI (Matriculation Examination), UK
Additional notes (Figure E23) Czech Republic: Pupils receive two certificates, one with the marks for the last school year (vysv�dení) and a second one after they have also passed the final internal examination (maturitní zkouška). Only the second certificate gives access to tertiary education. Denmark: The Figure relates to the certificate obtained at the end of the Gymnasium. The certificate also indicates marks for work over the year. No certificate is issued if the leaving examination has not been passed. Germany: In seven Länder, the Schulaufsichtsbehörde (school supervisory authority) sets the topics for the written examination. Estonia: Pupils receive two certificates, one based on work during the final year or years and the results of final internal examinations (gümnaasiumi lõputunnistus), and the other on the results obtained in external national examinations (riigieksamitunnistus). Both certificates are required for the continuation of studies. Italy: Law No 1 (11 January 2007) ruled that starting from 2006/07, one half of the examination committee would be formed from teachers at the school, and the other half from external teachers with an external president. Hungary: In Hungary there are two types of certificate. The certificate for the national secondary school leaving examination (Gimnáziumi Érettségi Bizonyítvány) is awarded on the basis of a final examination, which is either the középszint érettségi vizsga (standard national secondary school leaving examination) or the emelt szint érettségi vizsga (advanced national secondary school leaving examination). These examinations are written (set by an external body) and oral (set by the school with external verification in the case of the standard examination, and set by an external body in the case of the advanced examination). The final grade is awarded by the teachers at the school on the basis of criteria defined by an external authority (standard examination) or by external examiners (advanced examination). In the case of the certificate awarded on the basis of the grades and work over the years at upper secondary school (Gimnáziumi Bizonyítvány), the final grade is awarded only by the student’s teachers. Malta: In certain subjects (art, computing, geography, information technology, and systems of knowledge), the final grade includes marks given for coursework. Austria: As of 2014 the written part of the certified assessment at the end of general upper secondary education is planned to be held as an external examination for all examinees. Poland: The �wiadectwo maturalne certificate, which gives access to tertiary education, is awarded on the basis of the external matura examination (introduced in 2005) and the grades obtained in the final year. The written part of the matura examination is set by the Central Examination Commission, and external examiners are responsible for the assessment and awarding marks. Those pupils who do not wish to take the matura examination are awarded the �wiadectwo uko�czenia liceum certificate, which is based solely on the grades and work over the year and which does not permit admission to higher education. Portugal: The external assessment, via national exams, is set only in scientific-humanistic courses in 4 subjects, with Portuguese obligatory for all courses. Other types of upper secondary course, such as technological, artistic and vocational courses, only involve external examinations if pupils want to go on to higher education. Slovakia: After receiving the vysvedenie certificate based on the grades obtained for their work over the last school year, students have to pass a final examination to receive the school-leaving certificate. The final grades are awarded by their teachers in the internal part of the school leaving examination, while external examiners allocate percentages and percentiles in the external part. Finland: All students receive a certificate for which the final grades are awarded on the basis of work in upper secondary school. Students who pass the external matriculation examination receive the matriculation certificate. Either of the two certificates gives eligibility for the polytechnics, but the matriculation certificate is required for admission to university. United Kingdom (ENG/WLS/NIR): External qualifications are awarded on a single-subject basis. They are certified by independent awarding bodies but are government-regulated. Assessment schemes for these qualifications vary but always include externally set and marked components either at the end of the course or, in modular schemes, at the end of each module as well as at the end of the course. Assessment schemes may also include one or more pieces of externally moderated coursework completed over the two years of the course. Explanatory note The map shows the certified assessment at the end of general upper secondary education giving access to tertiary education. In the case of countries where two certificates are awarded, both have been taken into account when choosing the categories for the map, even if one certificate on its own does not provide for admission to tertiary education. In the category ‘final grade combining internal assessment and an external (or externally verified) final exam’, the internal assessment can mean a final internal test or an evaluation of the marks obtained or the coursework done during the year or over several years.

241
G R A D U AT E S A N D Q U A L I F I C AT I O N L E V E L S
THE MAJORITY OF YOUNG PEOPLE IN EUROPE HOLD AT LEAST ____________ AN UPPER SECONDARY EDUCATION QUALIFICATION _____________
Over 78 % of young people in Europe aged 20-24 have successfully completed upper secondary education. In the Czech Republic, Poland, Slovenia and Slovakia this proportion rises to more than 90 %. Only Malta, Portugal, Iceland and Turkey have recorded a qualification rate of less than 60 %.
Figure F1: Proportion of the population in the 20-24 age group having completed at least upper secondary education (ISCED 3), 2007
EU-27 BE BG CZ DK DE EE IE EL ES FR IT CY LV LT LU HU MT NL AT PL PT RO SI SK FI SE UK IS LI NO TR
78.1 82.6 83.3 91.8 70.8 72.5 80.9 86.7 82.1 61.1 82.4 76.3 85.8 80.2 89.0 70.9 84.0 54.7 76.2 84.1 91.6 53.4 77.4 91.5 91.3 86.5 87.2 78.1 49.3 : 93.3 46.4
Source: Eurostat, Labour Force Survey (data extracted July 2008).
Additional notes Cyprus: Students in tertiary education abroad are not yet covered by the survey. United Kingdom: National Vocational Qualifications (NVQ) level 1 and Foundation General National Vocational Qualifications (GNVQ) are not regarded as ISCED level 3 qualifications. Iceland and Norway: Data is from 2006 Labour force survey. Explanatory note Levels of education are defined in accordance with the International Standard Classification of Education, or ISCED (see the Glossary and Statistical Tools section). Persons who have completed upper secondary education are those whose highest qualification may be at ISCED level 3, 4, 5 or 6. The data relate to a sample of the resident population at the time of the Labour Force Survey (or LFS, see the Glossary and Statistical Tools section), including people who had been educated outside their present country of residence. The indicator cannot therefore be regarded as reflecting the performance of the national education systems concerned. This has to be borne in mind especially for countries that experience significant migration.
Upper secondary education consists of both general and vocational programmes (Figure B1) which lead either to qualifications for the labour market or to tertiary education.
From 2002 to 2007 there was a clear rise in the number of young people with upper secondary qualifications. Malta and Portugal show an important positive tendency as the proportion of young people with upper secondary education rose by 15.7 % and 9 % respectively. In only three countries (Denmark, Slovakia and Spain) were there more than 2 percentage points fewer students with upper-secondary qualifications in the 20-24 age group than in 2002.
This fact also partly explains why the percentage of young people in tertiary education (Figure C15) is not directly related to the percentage of those qualified at ISCED level 3, since those with a secondary education qualification at ISCED level 3C leading directly to the labour market or further studies at ISCED level 4 are, in principle, unable to access tertiary education directly.

GRADUATES AND QUALIFICATION LEVELS
242
In spite of the general improvement in the level of education attained by younger people, major variations persist from one country to the next when the entire population is considered. Nevertheless, in only two European countries, namely Malta and Portugal, do less than half of those in the 25-64 age group have an upper secondary education qualification.
YOUNGER AGE GROUPS ARE MORE LIKELY TO HAVE ________________ COMPLETED UPPER SECONDARY EDUCATION ________________
People in younger age groups (between 25-34 years old) appear, on average, to be better qualified than those who are older. In most countries the proportion of people without at least an upper secondary education qualification increases in the higher age groups.
Figure F2: Proportion of the population without at least an upper secondary education (ISCED 3), by age group, 2007
25-34 years 35-44 years 45-54 years 55-64 years EU-27 BE BG CZ DK DE EE IE EL ES FR IT CY LV LT LU HU MT NL AT PL PT RO SI SK FI SE UK IS LI NO TR
20.7 18.4 18.2 5.8 14.9 15.0 13.8 16.5 24.8 35.6 17.1 31.8 14.8 19.2 14.4 22.9 14.7 55.2 17.4 13.5 7.9 55.6 21.2 7.7 6.0 10.0 9.0 19.6 32.7 : 5.5 63.7
25.7 24.7 16.8 6.3 20.0 13.8 5.9 27.5 32.4 44.0 25.8 44.3 19.3 9.0 6.4 33.1 17.3 68.9 22.8 16.4 9.7 72.7 14.4 15.5 7.2 13.1 9.9 26.6 33.1 : 7.6 76.6
31.3 37.5 21.2 11.5 29.0 15.0 7.5 40.0 46.1 56.6 37.2 51.6 32.8 9.6 5.1 37.8 21.5 82.0 29.0 22.1 13.8 79.5 24.4 22.4 13.0 18.7 16.8 28.9 35.8 : 12.9 80.6
41.6 49.7 35.1 15.1 34.3 19.3 17.6 57.8 63.2 71.9 46.7 66.2 52.9 24.4 21.5 46.7 31.5 87.7 38.7 29.6 25.9 86.8 45.7 28.9 20.3 34.9 26.0 32.6 49.3 : 21.9 87.8
Source: Eurostat, Labour Force Survey (data extracted July 2008). Additional notes United Kingdom: National Vocational Qualifications (NVQ) level 1 and Foundation General National Vocational Qualifications (GNVQ) are not regarded as ISCED level 3 qualifications. Iceland and Norway: data is from 2006 Labour force survey. Explanatory note Levels of education are defined here in accordance with the International Standard Classification of Education, or ISCED (see the Glossary and Statistical Tools section). Persons who have not obtained an upper secondary education qualification correspond to those who have at best completed ISCED levels 0-2. For almost all countries the collected data refer to the second quarter of the year. The exceptions are Germany, Ireland and the United Kingdom with data from different quarters or average data. The data relate to a sample of the resident population at the time of the Labour Force Survey (or LFS, see the Glossary and Statistical Tools section), including people who had been educated outside their present country of residence. The indicator cannot therefore be regarded as reflecting the performance of the national education systems concerned. This has to be borne in mind especially for countries that experience significant migration.

GRADUATES AND QUALIFICATION LEVELS
243
In all age groups combined, the percentage of those without an upper secondary education qualification in Malta, Portugal and Turkey was double the EU-27 average.
During 2007, around 20 % of young people aged 25-34 in the European Union had not obtained an upper secondary education qualification, compared with 41.6 % of people aged 55-64. The proportion of young people without lower secondary education was considerably lower than the EU average (20.7) in many of the Central and Eastern European Member States, in particular in the Czech Republic (5.8 %) and Slovakia (6 %). The qualification levels of young people have mostly improved between 2002 and 2007 in Belgium, Ireland, Spain, Italy, Luxembourg and the United Kingdom. Malta showed the most significant reduction in the numbers of young people with only a lower secondary education in the last five years, with a drop of around 15 percentage points for those between 25 and 34 years old. The improvement is far less striking in countries where the levels were already relatively high. In contrast, the numbers of young people with only lower secondary education has increased in the corresponding period in six EU countries, namely Germany, Estonia, Latvia, Lithuania, Romania and Sweden (for more information see Key Data on Education in Europe 2005).
In Bulgaria, Estonia, Latvia, Lithuania and Romania and to a lesser extent Germany, the proportion of people without upper secondary education in the age group 25-34 was higher than in the 35-44 age group. For some countries this effect may be partly attributable to the changes experienced by the transition to a market economy that forced some pupils to leave school once they had completed compulsory education.
MORE WOMEN THAN MEN ARE GAINING _________ GENERAL UPPER SECONDARY EDUCATION QUALIFICATIONS _________
In 2006, the number of women who gained general upper secondary education qualifications was greater than the corresponding number of men in all European countries, the only exception being Turkey.
Figure F3: Number of women for every 100 men obtaining a general upper secondary education (ISCED 3) qualification, 2002-2006
2002 2006 EU-27 BE BG CZ DK DE EE IE EL ES FR IT CY LV LT LU HU MT NL AT PL PT RO SI SK FI SE UK IS LI NO TR
: 133 175 161 142 117 154 105 123 131 143 179 131 147 127 135 148 : 121 146 164 : 159 146 136 145 114 : 153 : 141 90
: 131 128 163 140 121 150 102 120 136 131 178 123 138 129 140 120 130 115 145 139 157 150 158 146 136 134 : 144 147 148 93
Source: Eurostat, UOE (data extracted July 2008). Additional note Denmark, France and Austria: Data are for 2001 and 2006.

GRADUATES AND QUALIFICATION LEVELS
244
Explanatory note (Figure F3)
The ratio of the number of women to every 100 young men with a qualification is calculated by dividing the number of women successfully completing upper secondary education by the number of men who have done so. The result is multiplied by 100. The conditions governing successful completion of upper secondary education (ISCED 3) are determined in accordance with national criteria.
Between 2002 and 2006, the situation appeared to change little in the majority of countries, with the average ratio remaining roughly the same. However, this overall picture was less the outcome of general stability than of contrasting trends within the EU. In fact, half of the Member States for which data is available recorded a decrease in this ratio, while the other half recorded an increase. During this period Bulgaria, Hungary and Poland experienced a rapid decrease in the number of women gaining upper-secondary qualifications. However, the number of women with this level of qualification in these countries is still higher than the number of men.
The high proportion of women is especially noteworthy in the Czech Republic, Estonia, Italy, Portugal, Romania and Slovenia where at least three women for every two men hold a general upper secondary education qualification.
YOUNGER AGE GROUPS ARE TWICE AS LIKELY TO HOLD A TERTIARY _____________ EDUCATION QUALIFICATION AS OLDER AGE GROUPS _____________
There are approximately twice as many people with tertiary education qualifications in the younger age groups as in the older age groups. In 2007, in the European Union, almost 30 % of 30-34-year-olds held graduate or postgraduate qualifications, as compared to around 17 % in the 55-64 age group.
In some countries, there has been a remarkable increase in the proportion of qualified people from one generation to the next. This proportion is more than 60 % higher among 30-34 year-olds than in the 60-64 age group in France, Cyprus, Malta and Portugal. In the rest of the European countries the difference between the youngest and oldest age groups is similar to the EU-27 average. Only in four countries, namely the Czech Republic, Germany, Romania and Slovakia do the different generations have roughly similar proportions of tertiary-level qualifications, but even in those countries the youngest age group (30-34 years old) have a greater proportion of tertiary graduates.
Notwithstanding the increase in the percentage of young people with tertiary education qualifications, significant differences remain between countries. In some Member States (Belgium, Denmark, Ireland, France, Cyprus, Finland and Sweden) and also in Norway over 40 % of those aged 30-34 have qualified from tertiary education in contrast to a corresponding proportion of no more than 20 % in the Czech Republic, Italy, Portugal, Romania and Slovakia.

GRADUATES AND QUALIFICATION LEVELS
245
Figure F4: Percentage of the population with
tertiary education qualifications (ISCED 5 and 6) in the population aged 30-64, by age group, 2007
30-34 years 35-39 years 40-44 years 45-49 years 50-54 years 55-64 years EU-27 BE BG CZ DK DE EE IE EL ES FR IT CY LV LT LU HU MT NL AT PL PT RO SI SK FI SE UK IS LI NO TR
29.9 41.5 26.0 13.3 41.2 26.5 33.3 40.6 26.2 39.5 41.5 18.6 46.3 25.6 38.0 35.2 20.1 21.6 35.8 21.1 27.0 19.8 13.9 31.0 14.8 47.3 40.7 37.9 26.8 : 43.7 11.8
25.9 37.4 23.1 14.4 35.1 26.0 33.1 36.2 25.3 34.2 32.4 15.9 38.0 22.7 29.8 30.6 17.5 13.1 32.4 20.1 20.1 14.9 10.4 25.2 13.3 43.7 32.9 32.9 26.6 : 39.9 9.5
23.5 33.8 22.9 14.1 31.5 25.4 34.3 30.2 25.3 30.1 25.0 12.2 32.5 22.9 26.5 23.9 18.1 10.0 28.7 18.3 15.2 12.2 9.6 20.0 12.9 41.9 29.0 31.9 23.0 : 33.7 7.8
21.5 30.3 23.1 15.8 29.8 24.9 37.2 26.5 20.8 24.6 21.0 11.1 27.2 23.4 25.5 23.0 17.0 8.8 30.1 17.9 13.2 10.5 10.6 21.1 14.0 38.1 28.8 30.4 23.6 : 30.8 7.0
20.2 26.1 22.2 12.8 29.4 25.2 33.8 22.7 19.2 20.4 18.6 11.6 26.2 20.2 26.9 20.8 15.3 7.7 29.6 17.0 12.4 10.3 11.4 17.7 13.9 33.6 28.8 30.1 18.8 : 32.4 8.3
17.1 22.3 18.8 10.7 23.5 23.1 28.4 17.2 13.2 15.9 16.6 9.4 17.9 18.2 21.0 18.9 15.7 7.7 25.6 13.9 12.3 7.4 9.0 15.6 12.1 28.2 25.7 21.3 15.1 : 26.6 6.0
Source: Eurostat, Labour Force Survey (data extracted July 2008). Additional note Iceland: Data for graduates is from 2006. Explanatory note The data relate to a sample of the resident population at the time of the Labour Force Survey (or LFS, see the Glossary and Statistical Tools section), including people who had been educated outside their present country of residence. The indicator cannot therefore be regarded as reflecting the performance of the national education systems concerned. This has to be borne in mind especially for countries that experience significant migration.
___________ 60 % OF TERTIARY EDUCATION GRADUATES ARE WOMEN ___________
In 2006, the number of women graduating from tertiary education was greater than that of men in all countries of the EU-27. In Estonia, Latvia, Lithuania, Hungary, Poland and Portugal it was roughly twice as high.
The number of women tertiary education graduates is one-and-a-half times greater than that of men in sever-al countries, namely Bulgaria, Greece, Cyprus, Romania, Slovenia, Slovakia, Finland, Sweden, Iceland and Norway. Only in Turkey is the percentage of women graduating in tertiary education inferior to that of men.
During the period 2002-2006, there were approximately three women tertiary graduates for every two men and this proportion was relatively stable.
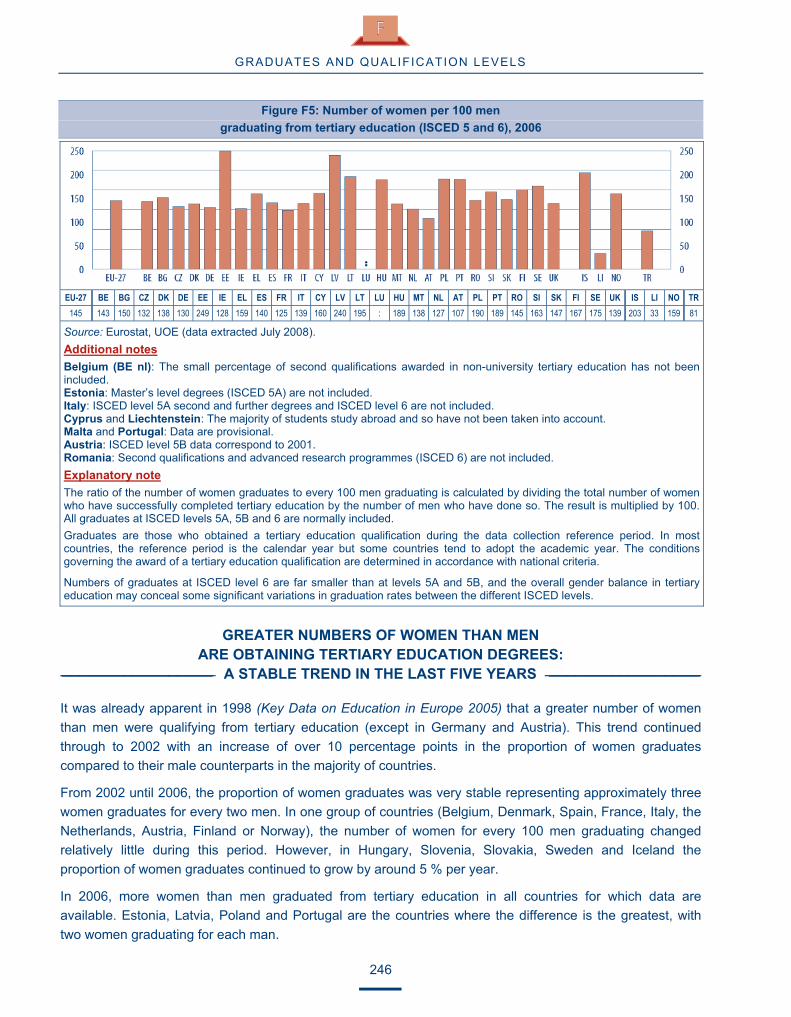
GRADUATES AND QUALIFICATION LEVELS
246
Figure F5: Number of women per 100 men
graduating from tertiary education (ISCED 5 and 6), 2006
EU-27 BE BG CZ DK DE EE IE EL ES FR IT CY LV LT LU HU MT NL AT PL PT RO SI SK FI SE UK IS LI NO TR
145 143 150 132 138 130 249 128 159 140 125 139 160 240 195 : 189 138 127 107 190 189 145 163 147 167 175 139 203 33 159 81
Source: Eurostat, UOE (data extracted July 2008). Additional notes Belgium (BE nl): The small percentage of second qualifications awarded in non-university tertiary education has not been included. Estonia: Master’s level degrees (ISCED 5A) are not included. Italy: ISCED level 5A second and further degrees and ISCED level 6 are not included. Cyprus and Liechtenstein: The majority of students study abroad and so have not been taken into account. Malta and Portugal: Data are provisional. Austria: ISCED level 5B data correspond to 2001. Romania: Second qualifications and advanced research programmes (ISCED 6) are not included. Explanatory note The ratio of the number of women graduates to every 100 men graduating is calculated by dividing the total number of women who have successfully completed tertiary education by the number of men who have done so. The result is multiplied by 100. All graduates at ISCED levels 5A, 5B and 6 are normally included. Graduates are those who obtained a tertiary education qualification during the data collection reference period. In most countries, the reference period is the calendar year but some countries tend to adopt the academic year. The conditions governing the award of a tertiary education qualification are determined in accordance with national criteria.
Numbers of graduates at ISCED level 6 are far smaller than at levels 5A and 5B, and the overall gender balance in tertiary education may conceal some significant variations in graduation rates between the different ISCED levels.
GREATER NUMBERS OF WOMEN THAN MEN ARE OBTAINING TERTIARY EDUCATION DEGREES:
_________________ A STABLE TREND IN THE LAST FIVE YEARS _________________
It was already apparent in 1998 (Key Data on Education in Europe 2005) that a greater number of women than men were qualifying from tertiary education (except in Germany and Austria). This trend continued through to 2002 with an increase of over 10 percentage points in the proportion of women graduates compared to their male counterparts in the majority of countries.
From 2002 until 2006, the proportion of women graduates was very stable representing approximately three women graduates for every two men. In one group of countries (Belgium, Denmark, Spain, France, Italy, the Netherlands, Austria, Finland or Norway), the number of women for every 100 men graduating changed relatively little during this period. However, in Hungary, Slovenia, Slovakia, Sweden and Iceland the proportion of women graduates continued to grow by around 5 % per year.
In 2006, more women than men graduated from tertiary education in all countries for which data are available. Estonia, Latvia, Poland and Portugal are the countries where the difference is the greatest, with two women graduating for each man.

GRADUATES AND QUALIFICATION LEVELS
247
Ireland and Portugal were the only two countries for which the ratio of women graduates in 2006 was lower than in 2002, but Portugal is still one of the countries with the higher ratios of women graduates among the EU-27 Member states. On the other hand, Bulgaria and Cyprus, the only two countries where the ratio of women graduates per 100 men graduates had decreased in the period 1998-2002, reversed the trend in the period since 2002. Indeed by 2006 both countries had reached ratios higher than the EU-27 average (150 for Bulgaria and 160 for Cyprus).
Figure F6: Variation in the number of women per 100 men graduating from tertiary education (ISCED 5 and 6), 2002-2006
2002 2003 2004 2005 2006
EU-27 BE BG CZ DK DE EE IE EL ES FR IT CY LV LT LU HU MT NL AT PL PT RO SI SK FI SE UK IS LI NO TR
137 131 137 130 138 109 207 133 : 133 : 131 121 227 181 : 153 121 124 100 185 204 135 146 124 160 150 129 159 : 152 74
140 132 141 123 138 113 228 136 : 134 130 132 158 223 189 : 164 134 127 104 187 205 134 156 126 163 158 132 180 33 157 80
143 133 140 138 143 111 252 133 156 136 : 144 148 225 198 : 174 : 128 102 190 193 134 153 131 162 156 137 199 30 152 79
142 140 143 130 144 113 235 125 160 138 127 140 156 239 198 : 181 154 130 107 193 188 133 162 133 163 173 138 208 33 162 78
145 143 150 132 138 130 249 128 159 140 125 139 160 240 195 : 189 138 127 107 190 189 145 163 147 167 175 139 203 33 159 81
Source: Eurostat, UOE (data extracted July 2008).
Additional notes Belgium (BE nl): The small percentage of second qualifications awarded in non-university tertiary education has not been included. Estonia: Master’s-level degrees (ISCED 5A) are not included in 2002. Italy: ISCED level 5A second and further degrees and ISCED level 6 are not included in 2006. Cyprus and Liechtenstein: The majority of students study abroad and so have not been taken into account. Austria: ISCED level 5B data correspond to the preceding year. Romania: Second qualifications and advanced research programmes (ISCED 6) are not included. United Kingdom: A methodological change in 2001 limits the extent to which 2001 and 2002 data may be compared with those for 2000 and earlier. This change does not affect the gender-based distribution of graduates but the total number of graduates. Explanatory note The ratio of the number of women graduates to every 100 men graduating is calculated by dividing the total number of women who have successfully completed tertiary education by the number of men who have done so. The result is multiplied by 100. All graduates at ISCED levels 5A, 5B and 6 are normally included. Graduates are those who obtained a tertiary education qualification during the data collection reference period. In most countries, the reference period is the calendar year but some countries adopt the academic year. The conditions governing the award of a tertiary education qualification are determined in accordance with national criteria.

GRADUATES AND QUALIFICATION LEVELS
248
Explanatory note (Figure F6 – continued)
Double counting of country data has been avoided wherever possible. Where a particular student obtains several qualifications at the same level (first cycle of ISCED 5A, second cycle of ISCED 5A, first cycle of ISCED 5B, second cycle of ISCED 5B or ISCED 6), (s)he is counted just once.
The European average is calculated using the data available for each year
TERTIARY GRADUATES IN SOCIAL SCIENCES, BUSINESS AND LAW REPRESENT ____________________ OVER A THIRD OF ALL GRADUATES ____________________
In 2006 graduates in ‘social sciences, business and law’ represented over 35 % of all graduates in Europe, followed by the graduates in 'health and welfare' with 14.4 % and 'engineering' and 'humanities' with a little more than 12 %. In a small number of countries (Latvia, Romania, Slovenia and Liechtenstein) graduates in 'social sciences' represent almost half of all graduates. In all the remaining countries with the only exception of Germany, Finland and Sweden, at least 25 % of those holding tertiary education qualifications graduate in these fields.
Five states (Denmark, Germany, Portugal, Sweden and Norway) had more than 20 % of graduates in ‘health and welfare’ in 2006. The graduates in 'engineering, manufacturing and construction' represented more than 15 % in ten countries with a highest value of 19.7 % for Austria and 34.9 % in Liechtenstein.
The proportion of graduates in the field of ‘science, mathematics and computing’, despite growing in numbers by around 4.5 % per year, corresponds to no more than 10 % of all the tertiary graduates in the vast majority of the countries. There are also important deviations between countries. In Latvia, Romania and Slovenia graduates in this field accounted for less than 5 % of the total, while Ireland, Austria and the United Kingdom registered more than 12 %.
The comparison of the proportion of graduates in different disciplines between 2002 and 2006 (Key Data on Education in Europe 2005) demonstrates a slight increase (between 4 and 8 points for the five-year period) in the percentage of graduates in the area of 'social sciences, business and law' in Bulgaria, Denmark, Cyprus, Latvia, Lithuania, the Netherlands, Slovenia and the United Kingdom. During the same period another group of countries (the Czech Republic, Germany, Estonia, Hungary, Malta, Austria, Poland and Portugal) showed a trend of increasing numbers of graduates in 'science, mathematics and computing' and 'engineering, manufacturing and construction', but the rates of growth were modest with no more than a 4 % increase in the proportion of these graduates compared to 2002.
Since the number of students in tertiary education increased up to 2006 (see Figure C13), it can be expected that the number of graduates will also continue to increase in the next few years. However it is important to bear in mind the distribution of those students among the different disciplines (see Figure C17) to adjust the forecasts of tertiary education graduates in the different fields.

GRADUATES AND QUALIFICATION LEVELS
249
Figure F7: Tertiary education graduates (ISCED 5 and 6) by
fields of education and training, 2006
A B C D E F G H
A B C D E F G H
A Education and training B Humanities and
arts C Social sciences, business and law D Science, mathematics and
computing
E Engineering, manufacturing and construction F Agriculture and
veterinary science G Health and welfare H Services
EU-27 BE BG CZ DK DE EE IE EL ES FR IT CY LV LT LU HU MT NL AT PL PT RO SI SK FI SE UK IS LI NO TRA 10.1 18.0 6.9 15.4 8.4 9.6 10.2 6.3 : 12.3 2.1 4.9 11.2 15.2 16.4 : 18.1 12.1 15.9 13.9 17.3 12.9 2.8 9.2 16.1 6.5 16.5 11.2 26.5 : 17.9 17.4B 12.2 10.2 8.4 7.9 13.8 16.0 11.5 19.1 : 9.2 12.1 17.0 10.0 6.2 6.7 : 7.4 15.5 8.2 8.7 8.7 8.8 12.2 5.1 6.3 13.5 6.0 15.7 11.2 3.0 8.8 6.5 C 35.4 29.6 47.9 30.2 30.4 23.9 36.6 34.8 : 28.3 41.6 38.7 43.7 56.1 40.9 : 42.7 44.2 38.3 29.6 42.6 27.4 49.4 49.6 27.4 23.4 24.1 31.0 34.1 54.6 27.1 37.9D 9.9 8.0 5.3 8.0 7.2 11.5 9.4 13.8 : 10.1 11.1 6.8 9.7 4.6 5.9 : 5.6 6.3 6.8 12.5 8.5 9.7 4.6 3.5 8.6 8.7 7.9 13.6 8.0 : 8.2 7.8 E 12.5 9.8 15.6 15.7 10.9 13.6 9.9 12.1 : 16.5 14.7 15.9 4.2 6.8 15.9 : 6.5 4.8 8.3 19.7 8.4 12.9 16.2 12.7 15.0 20.7 17.9 8.4 6.4 34.9 7.5 14.4F 1.7 2.4 2.1 3.8 2.1 1.9 2.2 0.6 : 1.8 1.5 1.7 0.2 1.0 1.8 : 2.6 1.0 1.5 2.1 1.7 1.6 2.8 2.4 2.9 2.3 1.0 0.9 0.7 : 1.1 4.0 G 14.4 19.8 6.2 13.1 23.8 20.5 11.6 11.0 : 14.3 13.0 12.4 6.7 5.2 9.0 : 8.6 13.0 16.5 9.9 7.8 20.6 9.9 9.9 17.1 19.1 24.6 18.6 11.7 7.6 24.6 5.7 H 3.9 2.2 7.7 5.9 3.3 3.2 8.6 2.4 : 7.6 3.9 2.6 14.3 4.9 3.5 : 8.5 3.1 4.5 3.7 5.0 6.2 2.2 7.7 6.7 6.0 2.1 0.8 1.4 : 4.8 6.3
Source: Eurostat, UOE (data extracted July 2008).

GRADUATES AND QUALIFICATION LEVELS
250
Additional notes (Figure F7) EU-27: The average for the EU-27 is an estimation made by Eurostat. Belgium (BE nl): The small percentage of second qualifications awarded in non-university tertiary education has not been included. Estonia: Master’s-level degrees (ISCED 5A) are not included. Italy: ISCED level 5A second and further degrees and ISCED level 6 are not included. Cyprus and Liechtenstein: The majority of students study abroad and so have not been taken into account. Romania: Second qualifications and ISCED level 6 programmes are not included. Explanatory note This indicator is calculated by dividing the number of graduates in a given subject field by the total number of graduates in tertiary education. The result is multiplied by 100. It excludes the number of graduates in ‘fields of study unknown’ from the denominator. Graduates are those who obtained a tertiary education qualification during the data collection reference period. In most countries, the reference period is the calendar year but some countries adopt the academic year. The conditions governing the award of a tertiary education qualification are determined in accordance with national criteria. All graduates at ISCED levels 5A and 5B (first and second cycles), as well as at ISCED level 6 are taken into account.
MANY SOCIAL SCIENCE GRADUATES ARE WOMEN BUT MORE __________ MEN GRADUATE IN THE NATURAL AND APPLIED SCIENCES __________
In all countries, women easily outnumber men graduating in the fields of ‘education’, ‘humanities and arts’, ‘social sciences, business and law’ and ‘health and welfare’.
At least 70 % of graduates in the field of ‘education’ were women, except in Malta and Turkey with 69 % and 54 % respectively. In Estonia, Italy and Latvia, the proportion of women stands at over 90 %. A higher number of women is also apparent in the fields of ‘health and welfare’ where they account for over 75 % of graduates in the great majority of European countries. In Estonia, Latvia and Iceland the numbers of women graduating in this field reach 90 %.
The areas of 'humanities and arts' and 'social sciences, business and law' show similar patterns in 2006 as, in both fields, the EU-27 average indicates that more than 60 % of the graduates were women, but there are some significant national variations especially in the area of 'social sciences, business and law'. Estonia, Latvia, Lithuania and Finland have more than 70 % of women graduates in 'social sciences' while Denmark, Germany and the Netherlands have a relatively even balance between men and women graduates.
Given that almost everywhere, more men than women study ‘engineering, manufacturing and construction’ and ‘science, mathematics and computing’ (Figure C18), this reality is also reflected in the statistics for graduates in these fields. The EU-27 average indicates that more than 75 % of these graduates were men. However in Bulgaria, Denmark, Estonia, Portugal and Romania and to a lesser extent in Greece, Poland, Slovakia and Slovenia there were more than 30 % of women graduating in 'engineering'. The other field with a clear numerical prevalence of male graduates is ‘science, mathematics and computing’. With the exception of the Netherlands – where 80 % of graduates are male – the percentage of male graduates in this field never exceeds 75 %. The countries where the gender balance is most even in this field are Bulgaria, Italy and Romania.
Finally, an interesting development can be seen in the area of 'services' where the average number of women graduates in the EU-27 countries is around 55 %, and there has been a significant increase in female graduates in this field between 2002 and 2006 in Estonia, Italy, Cyprus, Latvia, Hungary, Malta and Austria with proportional growth of more than 5 % per year in some of these countries.

GRADUATES AND QUALIFICATION LEVELS
251
Figure F8: Proportion of tertiary education qualifications (ISCED 5 and 6)
awarded to women, by field of education and training, 2006
A B C D E F G H
A B C D E F G H
A Education and training B Humanities and
arts C Social sciences, business and law D Science, mathematics and
computing
E Engineering, manufacturing and construction F Agriculture and
veterinary science G Health and welfare H Services
EU-27 BE BG CZ DK DE EE IE EL ES FR IT CY LV LT LU HU MT NL AT PL PT RO SI SK FI SE UK IS LI NO TR
A 78.5 74.0 74.3 77.3 73.2 77.7 93.7 77.8 : 82.6 73.4 91.5 84.0 90.1 84.2 : 78.7 69.8 80.1 78.1 78.3 84.0 72.2 81.8 72.9 84.6 81.8 74.3 83.9 : 72.6 54.9B 69.3 59.3 69.5 66.5 65.1 72.7 80.6 68.0 : 62.3 71.7 74.2 75.3 83.2 76.8 : 70.5 63.4 58.0 64.7 77.2 67.4 70.6 72.7 56.6 74.6 61.3 62.3 64.6 25.0 60.8 47.3C 61.8 58.0 64.9 64.3 52.2 52.5 74.2 58.7 : 63.8 63.2 57.4 61.1 72.0 73.5 : 69.5 57.8 51.9 58.1 69.1 66.0 63.2 67.7 63.8 71.1 62.8 56.1 59.1 22.2 55.4 47.0D 39.7 31.8 58.2 37.1 33.4 41.8 48.5 42.1 : 36.0 35.9 52.3 48.0 39.5 40.4 : 27.9 31.0 20.2 34.2 45.8 46.8 58.8 38.9 40.7 44.6 43.0 36.7 40.6 : 33.3 46.4E 25.1 22.1 35.5 21.1 34.6 17.5 37.5 14.3 32.5 26.3 21.9 29.2 8.0 27.6 28.3 : 27.8 19.4 16.9 18.3 32.4 34.3 32.9 22.1 31.4 21.7 30.6 21.2 37.9 19.6 23.1 20.7F 47.6 48.2 46.3 58.5 35.7 38.0 66.8 52.8 : 45.4 38.3 43.3 0.0 54.5 45.4 : 46.8 42.3 50.7 44.4 58.7 60.4 41.6 51.9 39.5 54.1 62.7 60.9 36.0 : 53.3 49.5G 76.4 77.6 73.2 78.8 81.5 75.0 91.8 81.7 : 79.0 71.7 68.9 77.3 90.6 86.2 : 80.4 64.9 75.3 69.4 70.6 79.7 75.3 84.3 84.3 86.9 83.6 80.1 90.0 70.0 83.4 69.3H 53.4 60.1 51.1 50.8 19.1 54.8 58.4 39.9 : 57.9 48.7 51.0 53.9 49.7 48.6 : 58.1 78.6 56.3 64.4 54.4 57.5 51.6 43.5 44.5 71.7 61.3 62.9 78.3 : 49.0 26.6
Source: Eurostat, UOE (data extracted July 2008).

GRADUATES AND QUALIFICATION LEVELS
252
Additional notes (Figure F8) EU-27: The average for the EU-27 is a Eurostat estimate. Belgium (BE nl): The small percentage of second qualifications awarded in non-university tertiary education has not been included. Estonia: Master’s-level degrees (ISCED 5A) are not included. Italy: ISCED level 5A second and further degrees and ISCED level 6 are not included. Cyprus: Students who graduated abroad have not been taken into account. Romania: Second qualifications and ISCED level 6 programmes are not included.
Explanatory note This indicator is obtained by dividing the number of women graduates in a particular field by the total number of graduates in the same field. The result is multiplied by 100. Graduates are those who obtained a tertiary education qualification during the data collection reference period. In most countries, the reference period is the calendar year but some countries adopt the academic year. The conditions governing the award of a tertiary education qualification are determined in accordance with national criteria. All graduates at ISCED levels 5A and 5B (first and second cycles), as well as at ISCED level 6 are taken into account.
THE DISPARITY BETWEEN COUNTRIES IN THE PROPORTION OF __________ GRADUATES IN SCIENCE AND TECHNOLOGY IS DECREASING __________
The number of tertiary education graduates in ‘science and technology’ per 1 000 inhabitants aged 20-29 rose in most countries during the period from 2002-2006. In the EU, the number of graduates in 'science and technology' per 1 000 inhabitants aged 20-29 rose from 11 in 2002 to 13 in 2006.
In 2006, there were between 10 and 15 graduates in ‘science and technology’ for every 1 000 inhabitants aged 20-29 in most countries for which data are available. However, two groups of countries sit at opposite ends of the spectrum. At one end, France, Ireland, Lithuania, Finland, Sweden and the United Kingdom had more than 15 graduates in 'science and technology' for each 1 000 inhabitants between 20 and 29 years old, whilst at the other end, Greece, Cyprus, Hungary and Malta have the lowest proportions of graduates in this area with only 6 graduates per 1 000 citizens aged 20-29. In Malta and Cyprus these findings are partly explained by the limited possibilities for university study in these fields.
Despite this generally positive trend over the period, Denmark, Estonia, Ireland, France Italy and Latvia experienced a decrease of more than 5 percentage points of the proportion of 'science and technology' graduates per 1 000 inhabitants in 2006. However, all of these countries (except Italy) remain above the EU-27 average. Analysing the five-year period (2002-2006), only four countries (Bulgaria, Spain, Slovenia and the United Kingdom) experienced a decrease in the proportion of graduates in 'science and technology'.

GRADUATES AND QUALIFICATION LEVELS
253
Figure F9: Variation in the number of tertiary-level graduates (ISCED 5 and 6)
in science and technology per 1 000 inhabitants aged 20-29, 2002-2006
2002 2003 2004 2005 2006 EU-27 BE BG CZ DK DE EE IE EL ES FR IT CY LV LT LU HU MT NL AT PL PT RO SI SK FI SE UK IS LI NO TR
11.1 10.5 11.7 6.0 11.7 8.1 8.0 20.5 : 11.9 : 7.4 3.8 8.1 14.6 : 4.8 3.1 6.6 7.9 8.3 7.4 5.9 9.5 7.8 17.4 13.3 20.3 9.2 : 7.7 5.0
12.1 11.0 8.3 6.4 12.5 8.4 8.8 24.2 : 12.6 22.0 9.1 3.6 8.6 16.4 : 4.8 3.6 7.3 8.2 9.0 8.2 9.4 8.7 8.3 17.4 13.9 21.0 9.5 5.6 9.3 5.2
12.5 11.2 8.5 7.4 13.8 9.0 8.9 23.1 8.0 12.5 : 10.8 4.2 9.4 17.5 : 5.1 : 7.9 8.7 9.4 11.0 9.8 9.3 9.2 17.8 15.9 18.1 10.8 0.9 9.0 5.6
13.2 10.9 8.6 8.2 14.7 9.7 12.1 24.5 10.1 11.8 22.5 12.4 3.6 9.8 18.9 : 5.1 3.4 8.6 9.8 11.1 12.0 10.3 9.8 10.2 17.7 14.4 18.4 10.1 12.7 9.0 5.7
13.0 10.6 8.5 10.0 13.8 10.7 11.2 21.4 5.8 11.5 20.7 9.1 4.3 8.9 19.5 : 5.8 5.0 9.0 10.8 13.3 12.6 10.5 9.5 10.3 17.9 15.1 17.8 11.3 10.4 9.3 6.2
Source: Eurostat, UOE (data extracted July 2008). Additional notes Belgium (BE nl): The small percentage of second qualifications awarded in non-university tertiary education has not been included. Estonia: Master’s-level degrees (ISCED 5A) are not included. Italy: ISCED level 5A second and further degrees and ISCED level 6 are not included. Cyprus and Liechtenstein: Students who graduated in ‘science and technology’ abroad have not been included in the number of graduates but they are counted in the total population, so the ratio is underestimated. Romania: Second qualifications and ISCED level 6 programmes are not included. Explanatory note This indicator is obtained by dividing the number of graduates of all ages in ‘science, mathematics and computing’ and ‘engineering, manufacturing and construction’ by the total population aged 20-29. The result is multiplied by 1 000. Graduates are those who obtained a tertiary education qualification during the data collection reference period. In most countries, the reference period is the calendar year but some countries adopt the academic year. The conditions governing the award of a tertiary education qualification are determined in accordance with national criteria.
All graduates at ISCED levels 5A and 5B (first and second cycles), as well as at ISCED level 6 are taken into account. The denominator corresponds to the population on 1 January.


255
G L O S S A R Y A N D S T A T I S T I C A L T O O L S
I. Classifications
International Standard Classification of Education (ISCED 1997)
The International Standard Classification of Education (ISCED) is an instrument suitable for compiling statistics on education internationally. It covers two cross-classification variables: levels and fields of education with the complementary dimensions of general/vocational/pre-vocational orientation and educational/labour market destination. The current version, ISCED 97 (1) distinguishes seven levels of education. Empirically, ISCED assumes that several criteria exist which can help allocate education programmes to levels of education. Depending on the level and type of education concerned, there is a need to establish a hierarchical ranking system between main and subsidiary criteria (typical entrance qualification, minimum entrance requirement, minimum age, staff qualification, etc.).
� ISCED 0: Pre-primary education
Pre-primary education is defined as the initial stage of organised instruction. It is school- or centre-based and is designed for children aged at least 3 years.
� ISCED 1: Primary education
This level begins between 5 and 7 years of age, is compulsory in all countries and generally lasts from four to six years.
� ISCED 2: Lower secondary education
It continues the basic programmes of the primary level, although teaching is typically more subject-focused. Usually, the end of this level coincides with the end of compulsory education.
� ISCED 3: Upper secondary education
This level generally begins at the end of compulsory education. The entrance age is typically 15 or 16 years. Entrance qualifications (end of compulsory education) and other minimum entry requirements are usually needed. Instruction is often more subject-oriented than at ISCED level 2. The typical duration of ISCED level 3 varies from two to five years.
� ISCED 4: Post-secondary non-tertiary education
These programmes straddle the boundary between upper secondary and tertiary education. They serve to broaden the knowledge of ISCED level 3 graduates. Typical examples are programmes designed to prepare pupils for studies at level 5 or programmes designed to prepare pupils for direct labour market entry.
� ISCED 5: Tertiary education (first stage)
Entry to these programmes normally requires the successful completion of ISCED level 3 or 4. This level includes tertiary programmes with academic orientation (type A) which are largely theoretically based and tertiary programmes with occupation orientation (type B) which are typically shorter than type A programmes and geared for entry into the labour market.
� ISCED 6: Tertiary education (second stage)
This level is reserved for tertiary studies that lead to an advanced research qualification (Ph.D. or doctorate).
(1) http://www.uis.unesco.org/ev.php?ID=3813_201&ID2=DO_TOPIC

K e y D a t a o n E d u c a t i o n i n E u r o p e 2 0 0 9
256
Nomenclature of Territorial Units for Statistics (NUTS)
See the Eurostat's Classifications Server (RAMON): http://europa.eu.int/comm/eurostat/ramon
International Standard Classification of Occupations, 1988 (ISCO-88)
See the Eurostat's Classifications Server (RAMON): http://europa.eu.int/comm/eurostat/ramon
II. Definitions
Active population (economically active population/labour force): In accordance with the definition in the Labour Force Survey, the total of persons in employment and unemployed persons.
Basic gross annual salary: The amount paid by the employer in a year, including bonuses, increases and allowances, such as those related to the cost of living, the 13th month (where applicable), and holidays, etc. less employers’ social security and pension contributions. This salary does not take account of any taxation at source, or other salary adjustment or financial benefit (related for example to further qualifications, merit, overtime or additional responsibilities, geographical area or the obligation to teach mixed or difficult classes, or accommodation, health or travel costs).
Capital expenditure: Assets that last longer than a year. This refers to construction, renovation or major repairs to buildings (immovables) as well to equipment, furniture, computers (movables). Minor expenditure under a certain fixed amount is, however, included in operational expenditure.
Civil servant: A teacher employed by the public authorities (at central, regional or local level), in accordance with legislation distinct from that governing contractual relations in the public or private sector. In structured career systems, teachers are appointed for life as career civil servants by the appropriate central or regional authorities where these correspond to the top-level authority for education.
Concurrent model: An initial teacher education programme which, from the outset, combines general teacher education in one or more subjects with theoretical and practical professional training.
Consecutive model: A two-stage initial teacher education programme. Students first receive general education in order to obtain a degree in a particular subject or branch of study. At or near the end of this period of study, they enrol in a programme of initial professional training, enabling them to qualify as teachers.
Current expenditure: Goods and services that are used during the ongoing year and have to be annually renewed. This includes expenditure on staff and operational expenditure.
Education-oriented pre-primary institutions or settings: Institutions or settings in which staff (responsible for a group of children) have to hold qualifications in education are shown here, irrespective of whether those institutions or settings come under the ministry of education.
Employed persons: In accordance with the definition in the Labour Force Survey, those who did any work for pay or profit during the reference week (even for as little as one hour), or were not working but had jobs from which they were temporarily absent. Family workers are included.

G l o s s a r y a n d S t a t i s t i c a l T o o l s
257
Employees with fixed-term contracts: In accordance with the definition in the Labour Force Survey, a job may be considered temporary if employer and employee agree that its end is determined by objective conditions such as a specific date, the completion of a task or the return of another employee who has been temporarily replaced. Where there is a work contract of limited duration, it usually states the terms of the end of the contract.
Employing authority: An authority with direct responsibility for appointing teachers, specifying their working conditions (in collaboration with other partners, if appropriate) and ensuring that these conditions are met. This includes ensuring payment of teachers’ salaries, although funds for this purpose may not necessarily derive directly from the authority’s budget.
Evaluation of schools as entities: Evaluation that focuses on activities carried out by school staff without seeking to assign individual responsibility for those activities to one or more members of the school concerned. Evaluation of this kind seeks to monitor or improve the performance and results of schools, and its findings are presented in an overall report containing no individual appraisals. Where school heads are among the focal points of an evaluation covering all school activities (including those for which they are not themselves responsible) and its findings are used with a view to improving the quality of the school concerned, this is regarded as an evaluation of the school as an entity. By contrast, cases in which school heads are evaluated solely in relation to their own personnel management or resource management activities by the school board or council are not considered.
Evaluation of teachers on an individual basis: A judgement about teachers’ work in order to guide them and help them as individuals to improve it. The teacher subject to observation receives personal verbal or written feedback.
European Statistical System (ESS): Consists of Eurostat and the statistical institutes, ministries, bodies and central banks which collect official statistics in the EU Member States, Iceland, Liechtenstein, Norway and Switzerland.
Final ‘on-the-job’ qualifying or induction phase: A compulsory period of transition between the initial education of teachers and their entry into professional life as fully-fledged teachers. It is treated as the final phase of initial education. This phase includes an important supportive and supervisory dimension, as well as a formal evaluation of teaching skills. During this period, teachers are still not fully qualified and are usually regarded as ‘candidates’ or ‘trainees’. They spend a significant amount of time in a real working environment (a school) in which they carry out wholly or partially the tasks incumbent on fully qualified teachers, and are remunerated for their activity.
Financial support for students: In accordance with the definition in the UOE questionnaire, this is understood as covering grants and other assistance on the one hand, and student loans on the other. The first category theoretically includes grants in the strict sense, grants in the wider sense (endowments, prizes etc.), the value of any special assistance provided for students in cash or in kind (such as free travel or reduced prices on public transport) as well as family allowances and tax allowances for students who are dependent children. Tax advantages are not included. The second category comprises loans, of which the gross amount is considered here (i.e. without deducting repayments made by borrowers from previous years).

K e y D a t a o n E d u c a t i o n i n E u r o p e 2 0 0 9
258
Flexible timetable: Indicates either that the time to be allocated to the various compulsory subjects has not been fixed or that, as a supplement to the time allocated to them, the curriculum provides for a certain number of hours that pupils or the school can devote to subjects of their choice.
General teacher education: General courses and courses for mastery of the subject(s) that trainees will teach when qualified. The purpose of these courses, therefore, is to provide trainees with a thorough knowledge of one or more subjects and good general knowledge.
Gross domestic product (GDP): Final result of the production activity of resident producer units.
Gross national income (GNI): GDP minus primary income payable by resident units to non-resident units, plus primary income receivable by resident units from the rest of the world. It reflects the growing difference between the GDP and the GNI in small open economies, which is due to large and increasing profit repatriations by overseas companies that have installed their production plants there.
Inactive persons: In accordance with the definition in the Labour Force Survey, those not classified as either employed or unemployed.
Internal evaluation of schools: Evaluation which is carried out by members of the school community, meaning individuals or groups that are directly involved in school activities (such as the school head, teaching and administrative staff and pupils) or have a direct stake in them (such as parents or local community representatives).
Level successfully completed: In accordance with the definition in the LFS survey, an expression associated with obtaining a certificate or a diploma, where there is certification. In cases where there is no certification, successful completion must be associated with full attendance. When determining the highest level, both general and vocational education/training should be taken into consideration.
Monitoring of the education system: Such monitoring has several aims, which include that of examining the system closely, reporting on its quality and enabling it to adjust so as to improve its performance. It may be assumed that the standards and goals it should strive to achieve are clearly defined, as well as the regulatory mechanisms enabling it to adjust as appropriate. It may take place at school level, or at local, regional, or national levels. Different reference criteria may be used depending on the level concerned, as well as the particular country. They may relate to school development (or action) plans, the results of school self-evaluation, external examinations, specially prepared performance indicators, the definition of competence thresholds or final requirements, national or international evaluations (including PIRLS, TIMSS, PISA, etc.), or reliance on experts or a special authority (for example, a council set up to monitor a reform).
Overall working time (of teachers): The total of the number of teaching hours, the number of hours of availability at school, and the amount of working time spent on preparation and marking activities, which may be done outside the school. This overall weekly amount normally corresponds to the time negotiated in collective bargaining agreements (40 hours a week).
Part-time work: In accordance with the definition in the UOE questionnaire, a workload lower than 90 percent of the full-time workload. All degrees of part-time work are taken into account.
Professional training of teachers: Provides prospective teachers with both a theoretical and practical insight into their future profession. In addition to courses in psychology and teaching methods and

G l o s s a r y a n d S t a t i s t i c a l T o o l s
259
methodology, it includes (usually) unremunerated in-class placements (supervised by the teacher in charge of the class concerned and with periodic assessment by teachers at the training institution).
Private schools/institutions: Schools/institutions which are directly or indirectly administered by a non-governmental organisation (church, trade union, a private business concern or other body) and which, according to the definition in the UOE questionnaire, are considered to be government dependent if they receive over 50 % of their funding from the public authorities. Private schools are regarded as independent if they get less than 50 % of their funding from the public sector.
Public-sector employee with contractual status: A teacher employed generally by the local authorities or by schools on a contractual basis in accordance with general employment legislation.
Public-sector schools/institutions: Schools/institutions which are directly or indirectly administered by a public education authority.
Purchasing power parity (PPP): A currency conversion rate which converts economic indicators expressed in a national currency into an artificial common currency that equalises the purchasing power of different national currencies. In other words, PPP eliminates the differences in price levels between countries in the process of conversion to an artificial common currency, called Purchasing Power Standard (PPS).
Purchasing power standard (PPS): The artificial common reference currency unit used in the European Union to express the volume of economic aggregates for the purpose of spatial comparisons in such a way that price level differences between countries are eliminated. Economic volume aggregates in PPS are obtained by dividing their original value in national currency units by the respective PPP. PPS thus buys the same given volume of goods and services in all countries, whereas different amounts of national currency units are needed to buy this same volume of goods and services in individual countries, depending on the price level
Registration fees: Fees related to registration and/or certification, which are paid by students.
School: An entity represented either by a school head or a management body. The school management body is only considered if it is located at school level. It may, however, include persons outside the school, such as those who represent the local authority.
School expectancy: Estimate of the number of years a typical 5-year-old child can expect to be enrolled in the education system during his or her lifetime if current enrolment patterns remain unchanged. Adding single-year net enrolment rates for each age (expressed in years) gives an estimate (in years) for the period covering those ages. Adding the single-year enrolment rates for all ages gives us an estimate of the expected number of years of education over a lifetime. This type of estimate will be accurate if current patterns of enrolment remain unchanged. Estimates are based on head-count data, meaning that there is no distinction between part-time and full-time studies.
School head: Any person heading a school who, alone or within an administrative body such as a board or council, is responsible for its management/administration. Depending on circumstances, the person concerned may also exercise educational responsibilities (which may include teaching tasks, but also responsibility for the general functioning of the institution in areas such as the timetable, implementation of the curriculum, decisions about what is to be taught and the materials and methods used, appraisal of

K e y D a t a o n E d u c a t i o n i n E u r o p e 2 0 0 9
260
teachers and their performance, etc.) and/or financial responsibilities (often limited to responsibility for administering the resources allocated to the school).
Single structure system: Education is provided in a continuous way from the beginning to the end of compulsory schooling, with no transition between primary and lower secondary education and with general education provided in common for all pupils.
Teaching time of pupils: The notional minimum workload of pupils which is based on minimum national recommendations. For each year of primary education or full-time compulsory general secondary education, the workload is calculated by taking the average minimum daily load multiplied by the number of teaching days a year. Recreational or other breaks of any kind, as well as the time given over to optional lessons, are not taken into account. The total annual amounts of minimum teaching time are added up to give the total minimum workload in hours for primary education and full-time compulsory general secondary education. These values are divided by the number of years corresponding to each of the two levels.
Teaching time (of teachers): Number of teaching hours spent by teachers with groups of pupils (excluding time set aside for clearly identifiable breaks).
Time of availability at school (of teachers): Number of hours available for performing duties at school or in another place specified by the school head. In some cases, this refers to an amount of time further to the hours spent teaching and, in others, to hours of availability that include the time spent teaching (where the latter is not centrally determined).
Total public expenditure on education: Total public expenditure on education, which includes direct public funding for educational institutions and transfers to households and firms. In general, the public sector finances educational expenditure by assuming direct responsibility for the current and capital expenditure of schools (direct public financing of schools), or by offering financial support to pupils/students and their families (public-sector grants and loans) and by subsidising the education or training activities of the private business sector or non-profit organisations (transfers to households and firms). Direct public funding for tertiary education may include research and development expenditure in certain countries in which tertiary education institutions are funded from global budgets covering resources earmarked both for teaching and for research and development activities.
Tuition fees: Covers differing concepts from one country to the next. In some countries, it refers solely to the amounts paid by students. In others, it refers to the costs of education borne by tertiary education institutions, which may be paid on behalf of all or a majority of students by a public authority. In the present publication, the second of these two situations is regarded as equivalent to education being free of charge.
Unemployed persons: In accordance with the definition in the Labour Force Survey, persons aged 15 to 74 who during the reference week were a) without work, i.e. neither had a job nor were at work (for one hour or more) in paid employment or self-employment, b) currently available for work, i.e. were available for paid employment or self-employment before the end of the two weeks following the reference week, and c) actively seeking work, i.e. had taken specific steps in the four weeks period ending with the reference week to seek paid employment or self-employment, as well as those who found a job to start later, i.e. within a period of at most three months.
Unemployment rate: Unemployed persons as a percentage of the labour force.

G l o s s a r y a n d S t a t i s t i c a l T o o l s
261
III. Databases
UOE Database
The UOE (UNESCO/OECD/Eurostat) data collection is an instrument through which these three organisations jointly collect internationally comparable data on key aspects of education systems on an annual basis using administrative sources. Data are collected according to the ISCED 97 classification and cover enrolments, new entrants, graduates, educational personnel and educational expenditure. The specific breakdowns include level of education, sex, age, type of curriculum (general, vocational), mode (full-time/part-time), type of institution (public/private), field of study and nationality.
The methodology and questionnaires used for the 2006-2007 UOE collection, from which the data included in the present publication are taken, may be accessed by the public at the Eurostat Education, Training and Culture Statistics website (2).
Demography Database
Eurostat collects national demographic data from responses to an annual questionnaire sent to the national statistical institutes. The annual national population estimates are based either on the most recent census or on data extracted from the population register. The reference year for the demographic data in this edition of Key Data is 2006/07.
The Community Labour Force Survey (LFS)
The Community Labour Force Survey, which has been carried out annually since 1983, is the principal source of statistics on employment and unemployment in the European Union. This sample survey is directed at individuals and households. The questions mainly cover the characteristics of employment and job-seeking. The survey also includes questions on participation in education or training during the four weeks before it is carried out, and information on the level of education attained according to the ISCED 97 classification. The concepts and definitions used in the LFS are based on those contained in the Recommendations of the 13th Conference of Labour Statisticians convened by the International Labour Organization (ILO) in 1982.
Commission Regulation (EC) No 1897/2000 offers a precise definition of unemployment in order to improve the comparability of statistical data within the European Union. This definition is consistent with the recommendations of the International Labour Organization. All the following definitions are applicable to individuals aged 15 and over who live in private households. The definitions are therefore common for all countries.
In order to achieve maximum uniformity of the reference period for the various countries and ensure that data within the Key Data series remain consistent, the present edition contains the data for the second quarter of the reference year (April to June). The results for the United Kingdom and Ireland are those of the spring of the reference year while those for France and Austria correspond to the first quarter. The reference period for the statistics taken from the LFS is the spring of 2007.
Like all surveys, the LFS is based on a population sample. Its findings may thus be affected by sampling conditions and errors associated with them. The national data contained in the present edition conform to the
(2) http://epp.eurostat.ec.europa.eu/portal/page/portal/education/introduction

K e y D a t a o n E d u c a t i o n i n E u r o p e 2 0 0 9
262
highest reliability thresholds as recommended by Eurostat. Data that did not conform to an adequate reliability threshold have been regarded as not available and indicated with the sign (:).
National Accounts Database
The European System of National and Regional Accounts (abbreviated to ‘ESA 1995’, ‘ESA’, or sometimes also ‘the system’) is an internationally comparable accounting framework for systematic and detailed description of a ‘total economy’ (i.e. a region, a country or a group of countries), its components and its relationships with other ‘total economies’.
The reference year of data in this edition that involve national accounts is 2006.
OECD and IEA Databases (PISA 2006 and PIRLS 2006 respectively)
Besides measuring performance, the PISA and PIRLS surveys include questionnaires to identify variables in the school and family context which may shed light on their findings. The questionnaires were sent to school heads and pupils during the PISA survey, as well as to teachers and the parents of pupils in the case of PIRLS. The 30 indicators contained in the present publication have been prepared using replies from these further surveys.
� The sampling procedure involved selecting schools and then pupils (35 pupils aged 15 or a class in the fourth year of primary education). It sought to offer each pupil the same probability of being selected irrespective of the size or location of the school he or she attended. For this purpose, schools were weighted prior to sampling in such a way that the probability that they would be selected was inversely proportional to their size (3). The consequences of this procedure when interpreting the Figures are indicated in the explanatory notes.
� Where data is taken to apply to the entire population of countries, it is essential to comply with certain strict requirements such as standard error analysis (measurement of sampling-related errors), as a result of which a perceptible difference between two items of data may be considered insignificant in statistical terms. For a definition of standard error, see section IV (statistical terms).
� The survey response rate also has to be taken into account. If it is too low for the data to be regarded as representative, they are not included in the Figures but in an additional note underneath them. Where the response rate is too low in the case of a particular question and country, data for that country are said to be lacking.
(3) In PISA, small schools (with under 35 pupils aged 15 who had the same probability of being selected given that all of
them were selected) were sampled separately in countries in which they were sufficiently representative (over 5 % of schools in this category).

G l o s s a r y a n d S t a t i s t i c a l T o o l s
263
IV. Statistical Terms
Correlation coefficient: The degree of association between two variables, of which the values may vary within the limits from -1 to +1. Negative values of the correlation coefficient reflect an inverse relationship between the two variables: the values of one variable decrease as the values of the other variable increase. For instance, the coefficient of variation between the age of an individual and his remaining life expectancy tends to -1. When the values of two variables increase or decrease more or less simultaneously, the correlation coefficient is positive. For instance, there is a positive correlation between the size of an individual and the size of his feet. The closer a correlation approaches -1 or +1, the stronger the relationship between the two variables. A correlation coefficient with a value of 0 reflects the absence of any relationship between the two variables.
Decile: this divides the entire set of data into ten groups with equal frequencies.
Median: the middle value in a distribution, at which the number of values below and above that value is the same.
Percentile: a value on a scale of one hundred that indicates the percentage of a distribution that is equal to or below this value. The median is defined conveniently as the 50th percentile. For example, the smallest test score that is greater than 90 % of the scores of the people taking the test is said to be at the 90th percentile. In short, percentiles are the 99 values that divide a set of statistical data or a frequency distribution into 100 sub-divisions, each containing the same (or approximately the same) number of individuals.
Standard deviation: this measures the dispersion or spread in a distribution with respect to the mean.
Standard error: the standard deviation of the sampling distribution of a population parameter. It is a measure of the degree of uncertainty associated with the estimate of a population parameter inferred from a sample. Indeed, due to the randomness of the sampling procedure, one could have obtained a different sample from which more or less different results could have been inferred. Suppose that, on the basis of a given sample, the estimated population average were 10 and the standard error associated with this sample estimate were two units. One could then infer with 95 % confidence that the population average must lie between 10 plus and 10 minus two standard deviations, i.e. between 6 and 14.


265
T A B L E O F F I G U R E S
(1) Pre-primary education (2) Primary and secondary education (3) Tertiary education (1) (2) (3) Figures Sources P. A – CONTEXT x x x Figure A1: Variation of the population in the 0-9, 10-19 and 20-29 age groups
in the EU-27 (1985-2007) Eurostat, population statistics
27
x x x Figure A2: Percentage of young people in the 0-29 age group by NUTS regions, 2006
Eurostat, population statistics
28
x x x Figure A3: Proportion of the population in the 0-9, 10-19 and 20-29 age groups, 2007
Eurostat, population statistics
29
x x Figure A4a: Projected population changes for the 5-9 age group between 2000 and 2010, and between 2000 and 2020
Eurostat, population statistics
31
x Figure A4b: Projected population changes for the 10-14 age group between 2000 and 2010, and between 2000 and 2020
Eurostat, population statistics
31
x Figure A5: Proportion of non-nationals in the total population and in the population aged under 15, 2007
Eurostat, population statistics
32
x x Figure A6: Proportion of people in employment by age group and highest level of education attained, 2007
Eurostat, Labour force survey
34
x Figure A7: Tertiary education graduates in employment by occupational category and sex (ISCED 5 and 6), 2007
Eurostat, Labour force survey
36
x x Figure A8: Unemployment rates for the 25-64 age group of the population by level of education and by sex, 2007
Eurostat, Labour force survey
38
x x Figure A9: Unemployment rates for the 15-24 age group of the population, 2002-2007
Eurostat, Labour force survey
40
B – ORGANISATION Section I – Structures
x x x Figure B1: Description of the structures of the education systems from pre-primary to higher education (ISCED 0 to 5), 2006/07
Eurydice 42
x Figure B2: Education authorities responsible for pre-primary education-oriented institutions (ISCED 0), 2006/07
Eurydice 53
x Figure B3: Distribution of pupils/students (ISCED 1, 2 and 3) according to the type of institution they attend (public or private), 2006
Eurostat, UOE 54
x Figure B4: Degree of parental freedom in choice of school for compulsory education in the public sector, 2006/07
Eurydice 56
x Figure B5: Distribution of pupils in the fourth year of primary education (in terms of the median and percentiles) by size of school attended, public and private sectors combined, 2006
IEA, PIRLS 2006 database
57
Figure B6: Percentages of pupils in the fourth year of primary education who attend a school offering a childcare service on school premises before or after lesson times, public and private sectors combined, 2006
IEA, PIRLS 2006 database
59
x Figure B7: Structure and duration of lower secondary education compared to the age of pupils at the end of full-time compulsory education, 2006/07
Eurydice 60
x Figure B8: Levels of authority involved in limiting places or selecting students for the first cycle of higher education (ISCED 5A and 5B), 2006/07
Eurydice 63

K e y D a t a o n E d u c a t i o n i n E u r o p e 2 0 0 9
266
B – ORGANISATION Section II – Objectives and Evaluation
x Figure B9: Areas covered by official guidelines for education-oriented pre-primary institutions, 2006/07
Eurydice 65
x Figure B10: Elements of the education system subject to evaluation, compulsory general education, 2006/07
Eurydice 67
x Figure B11: Use of standard criteria for external evaluation of schools providing compulsory general education, 2006/07
Eurydice 69
x Figure B12: Publication of findings from the external evaluation of schools, compulsory general education, 2006/07
Eurydice 71
x Figure B13: National monitoring of education systems - use made of results of external evaluation of pupils and schools, ISCED levels 1 to 3, 2006/07
Eurydice 74
x Figure B14: Frequency and organisation of external low stakes tests, used for monitoring the education system, ISCED levels 1 and 2, 2006/07
Eurydice 76
B – ORGANISATION Section III – Decision-making Levels and Processes
x Figure B15: School autonomy relating to human and financial resources, teaching content and processes, in the public sector, ISCED 1 and 2, 2006/07
Eurydice 79
x Figure B16: Power exercised in eight areas, by school council/boards which have parent representatives, compulsory education, 2006/07
Eurydice 83
x Figure B17: Parent participation in national or central level consultative bodies, compulsory education, 2006/07
Eurydice 84
x Figure B18: Administrative level with responsibility for employing teachers in primary, lower secondary and upper secondary education, 2006/07
Eurydice 86
x Figure B19: Location of decision-making powers to determine the overall amount of public expenditure earmarked for schools providing compulsory education, public sector or equivalent, 2006/07
Eurydice 88
C – PARTICIPATION x x Figure C1: Proportion of pupils and students from primary education to tertiary education
(ISCED 1-6) in the total population, 2006 Eurostat, UOE and population statistics
91
Figure C2: Proportion of pupils and students in the 3-19 and 3-29 age groups, 2006
Eurostat, UOE and population statistics
92
Figure C3: Percentage of young people aged 15-24 in education and training by sex, 2006
Eurostat, Labour force survey
93
x Figure C4: Proportion of pupils with an immigrant background in the total population of pupils aged 15, 2006
OECD, PISA 2006 database
94
x x Figure C5: Changes in the participation rate of 4-year-olds in pre-primary and primary education (ISCED 0-1), from 1979/80 to 2005/06
Eurostat, UOE and population statistics
96
x x Figure C6: Participation rates in pre-primary and primary education (ISCED 0 and 1) by age, 2006
Eurostat, UOE and population statistics
98
x x Figure C7: Participation rates by age from lower secondary education to tertiary education (ISCED 2 to 6), 2006
Eurostat, UOE and population statistics
100
x Figure C8: Percentage of upper secondary (ISCED 3) students following general education programmes by NUTS regions, 2006
Eurostat, UOE and population statistics
101
x Figure C9: Distribution of upper secondary (ISCED 3) students by programme type (general or vocational) overall and by sex, 2006
Eurostat, UOE 103
x Figure C10: Participation rates, overall and broken down by sex, following compulsory education, 2006
Eurostat, UOE and population statistics
105
x x x Figure C11: Expected duration of education for 5-year-olds (ISCED 0 to 6), 2006
Eurostat, UOE and population statistics
106
x Figure C12: Students in tertiary education (ISCED 5 and 6) as a percentage of all pupils and students, 2006
Eurostat, UOE 107
x Figure C13: Trends in the index, of student numbers in tertiary education (ISCED 5 and 6), 2002-2006 (compared to 1998)
Eurostat, UOE 109

T a b l e o f F i g u r e s
267
x Figure C14: Ratio of the regional proportion of tertiary education students (ISCED 5 and 6) to the regional proportion of the population, by NUTS regions, 2006
Eurostat, UOE and population statistics
111
x Figure C15: Participation rates in tertiary education (ISCED 5 and 6) by age and by sex, 2006
Eurostat, UOE 113
x Figure C16: Trends in the number of women per 100 men enrolled in tertiary education (ISCED 5 and 6), 2002-2006
Eurostat, UOE 115
x Figure C17: Distribution by age of full-time students in tertiary education (ISCED 5 and 6), 2006
Eurostat, UOE 116
x Figure C18: Percentage of women students enrolled in different fields of study, in tertiary education (ISCED 5 and 6), 2006
Eurostat, UOE 118
x Figure C19: Percentage of tertiary education students (ISCED 5 and 6) studying in another EU Member State, candidate country or EFTA/EEA country, 2002-2006
Eurostat, UOE 119
D – RESOURCES Section I – Investment and Equipment
x x x Figure D1: Total public-sector expenditure on education (ISCED 0 to 6) as a percentage of GDP, 2006
Eurostat, UOE and National Accounts
121
x x x Figure D2: Public expenditure on education (ISCED 0 to 6) as percentage of the total public expenditure, 2006
Eurostat, UOE and National Accounts
123
x x Figure D3: Total public expenditure on education by educational level (ISCED 1, 2-4 and 5-6), as a percentage of GDP, 2006
Eurostat, UOE and National Accounts
124
x x x Figure D4: Annual expenditure in public-sector institutions (ISCED 0 to 6) by pupil/student, in PPS EUR (thousands), 2006
Eurostat, UOE and National Accounts
126
x x Figure D5: Annual expenditure in public-sector institutions by pupil/student and educational level (ISCED 1, 2-4 and 5-6), ), in PPS EUR (thousands), 2006.
Eurostat, UOE and National Accounts
127
x x x Figure D6: Proportions of educational expenditure (ISCED 0 to 6) from public and private sources, 2006
Eurostat, UOE 128
x Figure D7: Free and fee-paying pre-primary provision offered in education-oriented institutions, 2006/07
Eurydice 129
x Figure D8: Public funding of grant-aided private schools for primary and lower secondary education compared to public-sector schools (in terms of amounts or the method used to calculate them), 2006/07
Eurydice 131
x x x Figure D9: Sources of public funding of education by administrative level before and after transfers (ISCED 0 to 6), 2006
Eurostat, UOE 133
x x x Figure D10: Distribution of total annual expenditure in public sector institutions (ISCED 0 to 6) across major categories of expenditure, 2006
Eurostat, UOE 135
x Figure D11: Proportions of pupils in the fourth year of primary school who, according to the teacher and school-head, have access to a school library and a classroom library or reading corner, public and private sectors combined, 2006
IEA, PIRLS 2006 database
136
x x x Figure D12: Direct public-sector support (grants and loans) to pupils and students as a percentage of total public expenditure on education, by educational level, overall (ISCED 0 to 6), school level (ISCED 1, 2, 3 and 4) and tertiary (ISCED 5 and 6), 2006
Eurostat, UOE 138
x Figure D13: Types of financial support for parents with children in primary and lower secondary education, 2006/07
Eurydice 139
x Figure D14: Recipients and purpose of public financial support for full-time study in tertiary education for a first qualification (ISCED 5) in the public and/or government-dependent private sectors, 2006/07
Eurydice 141
x Figure D15: Types of private contribution annually paid by full-time daytime students for a first qualification (ISCED 5) in the public and/or government-dependent private sectors, 2006/07
Eurydice 143
x Figure D16: Amounts of fees and other contributions in PPS EUR paid by full-time daytime students enrolled for a first qualification (ISCED 5) in the public and/or government-dependent private sectors, 2006/07
Eurydice 146

K e y D a t a o n E d u c a t i o n i n E u r o p e 2 0 0 9
268
D – RESOURCES Section II – Teachers
x x Figure D17: Structure of initial teacher education for pre-primary, primary and general secondary education (ISCED 0, 1, 2 and 3), 2006/07
Eurydice 150
x x Figure D18: Level and minimum length of initial teacher education for pre-primary level (ISCED 0), and the compulsory minimum proportion of time devoted to professional training, 2006/07
Eurydice 152
x Figure D19: Level and minimum length of initial teacher education for the primary level (ISCED 1), and the compulsory minimum proportion of time spent on professional training, 2006/07
Eurydice 153
x Figure D20: Level and minimum length of initial teacher education for general lower secondary level (ISCED 2), and the compulsory minimum proportion of time devoted to professional training, 2006/07
Eurydice 155
x Figure D21: Level and minimum length of initial teacher education for general upper secondary level (ISCED 3), and the compulsory minimum proportion of time devoted to professional training, 2006/07
Eurydice 156
x Figure D22: Final 'on-the-job' qualifying phase for pre-primary, primary and general secondary education (ISCED 1, 2 and 3), 2006/07
Eurydice 158
x Figure D23: Regulations and/or recommendations on types of support available to new entrants to the teaching profession in primary and general (lower and upper) secondary education (ISCED 1, 2 and 3), 2006/07
Eurydice 160
x Figure D24: Status of continuing professional development for teachers in primary and general (lower and upper) secondary education (ISCED 1, 2 and 3), 2006/07
Eurydice 161
x Figure D25: Proportions of pupils in the fourth year of primary education whose teachers report having taken part in in-service training for teaching reading in the last two years, 2006
IEA, PIRLS 2006 database
162
x Figure D26: Types of employment status available to teachers in primary education and general (lower and upper) secondary education (ISCED 1, 2 and 3), 2006/07
Eurydice 163
x Figure D27: Regulations and/or recommendations on certain forms of support for teachers in primary education and general (lower and upper) secondary education (ISCED 1, 2 and 3), 2006/07
Eurydice 165
x Figure D28: Proportions of pupils in the fourth year of primary education whose teachers report that specialists or other adults are on hand to look after pupils with reading difficulties, 2006
IEA, PIRLS 2006 database
167
x Figure D29: Official definitions of the working time of teachers, primary and general (lower and upper) secondary level (ISCED 1, 2 and 3), 2006/07
Eurydice 168
x Figure D30: Breakdown of the weekly workload of full-time teachers in hours for primary and secondary education (ISCED 1, 2 and 3), 2006/07
Eurydice 171
x Figure D31: Retirement age of teachers in primary and secondary education (ISCED 1, 2 and 3), 2006/07
Eurydice 175
x Figure D32: Minimum and maximum basic gross annual teacher salaries relative to per capita GDP (ISCED 1, 2 and 3), 2006/07
Eurydice 177
x Figure D33: Teachers in primary and lower secondary education (ISCED 1 and 2) as a percentage of the total active population, public and private sectors combined, 2006
Eurostat and Eurydice
180
x x Figure D34: Percentage of women teachers in primary and secondary education (ISCED 1, 2 and 3) and tertiary education (ISCED 5 and 6), public and private sectors combined, 2006
Eurostat, UOE and Labour force survey
181
x Figure D35: Distribution of teachers by age group in primary education (ISCED 1), public and private sectors combined, 2006
Eurostat, UOE 182
x Figure D36: Distribution of teachers by age group in secondary education (ISCED 2 and 3), public and private sectors combined, 2006
Eurostat, UOE 184
x Figure D37: Proportions of teachers in age groups close to retirement in primary education (ISCED 1) and secondary education (ISCED 2 and 3), public and private sectors, 2006
Eurostat, UOE; Eurydice: 2006/07
186

T a b l e o f F i g u r e s
269
D – RESOURCES Section III – Management Staff
x Figure D38: Professional experience and training for headship officially required in order to be a school head in primary, general lower and upper secondary education (ISCED 1, 2 and 3), 2006/07
Eurydice 190
x Figure D39: Minimum number of years of professional teaching experience required to become a school head in primary, general lower and upper secondary education (ISCED 1, 2 and 3), 2006/07
Eurydice 192
x Figure D40: Minimum and maximum basic gross annual salaries of school heads, ISCED 1, 2 and 3, relative to per capita GDP, 2006/07
Eurostat and Eurydice
194
x Figure D41: Proportion of the time spent in a range of activities by the heads of schools attended by pupils in the fourth year of primary education, 2006
IEA, PIRLS 2006 database
197
E – EDUCATIONAL PROCESSES Section I – Taught Time
x Figure E1: Recommended minimum annual taught time per year during the first 9 years of primary and secondary education, 2006/07
Eurydice 200
x Figure E2: Recommended minimum time allocation as a percentage of total recommended taught time for compulsory subjects or general domains throughout primary education considered as a whole, 2006/07
Eurydice 202
x Figure E3: Recommended minimum time allocation as a percentage of total recommended taught time for compulsory subjects or general domains in the entire period of full-time compulsory general secondary education considered as a whole, 2006/07
Eurydice 204
x Figure E4: Distribution of fourth-year pupils in primary education according to the number of hours a week they are taught the language of instruction, compared to the official minimum recommended time, public and private sectors combined, 2006
IEA, PIRLS 2006 database and Eurydice, 2006/07
206
x Figure E5: Percentages of pupils in the fourth year of primary education whose teachers say they use textbooks, children's literature, educational software or Internet materials for teaching reading at least once a week, public and private sectors combined, 2006
IEA, PIRLS 2006 database
208
x Figure E6: Percentage of pupils in the fourth year of primary education, whose teachers say they give them homework in the language of instruction, public and private sectors combined, 2006
IEA, PIRLS 2006 database
209
x Figure E7: Distribution of 15-year-old pupils by number of hours a week that they report spending on homework and study at home, public and private sectors combined, 2006
OECD, PISA 2006 database
211
E – EDUCATIONAL PROCESSES Section II – Grouping of Pupils and School Climate
x Figure E8: Principal methods of grouping children in pre-primary education (ISCED 0), 2006/07
Eurydice 213
x Figure E9: Recommended maximum numbers of 4-year-old children per qualified adult in schools or other education-oriented pre-primary institutions, 2006/07
Eurydice 215
x Figure E10: Main models for dividing teaching and subjects among the teachers of pupils aged around 7, 2006/07
Eurydice 216
x Figure E11: Breakdown of pupils in the fourth year of primary education in accordance with how teaching and school subject responsibilities are divided among teachers, as reported by teachers themselves, public and private sectors combined, 2006
IEA, PIRLS 2006 database
218
x Figure E12: Class size regulations or recommendations in primary education, 2006/07 Eurydice 219 x Figure E13: Changes in the ratio of pupils to teaching staff in primary education (ISCED 1),
2001 and 2006 Eurostat, UOE 221
x Figure E14: Distribution of pupils in the fourth year of primary education with respect to the size of their class, as reported by teachers and compared to officially recommended or required maximum sizes, 2006
IEA, PIRLS 2006 database and Eurydice 2006/07
222

K e y D a t a o n E d u c a t i o n i n E u r o p e 2 0 0 9
270
x Figure E15: Breakdown of pupils in the fourth year of primary education in accordance with the organisational approach used to teach reading, as reported by their teachers, public and private sectors combined, 2006
IEA, PIRLS 2006 database.
224
x Figure E16: Arrangements for integrating non-native pupils of foreign mother tongue within schools for full-time compulsory education, 2006/07
Eurydice 225
x Figure E17: Ratio of pupils to teaching staff in secondary education (ISCED 2 and 3), 2006
Eurostat, UOE 227
x Figure E18: Breakdown of pupils in the fourth year of primary school according to the number of offences that they reported in their school, 2006
IEA, PIRLS 2006 database
228
x Figure E19: Breakdown of pupils in the fourth year of primary education attending a school in which issues like tardiness, absenteeism and classroom disturbance are declared as moderate or serious problems, according to the school head, 2006
IEA, PIRLS 2006 database
230
E – EDUCATIONAL PROCESSES Section III – Assessment of Pupils
x Figure E20: Main official recommendation for the progression to the next year during mainstream primary education (ISCED 1), 2006/07
Eurydice 232
x Figure E21: Conditions of admission to lower secondary education (ISCED 2), public and government-dependent private sectors, 2006/07
Eurydice 233
x Figure E22: Certified assessment at the end of general lower secondary education or full-time compulsory education, 2006/07
Eurydice 236
x Figure E23: Certified assessment at the end of general upper secondary education, 2006/07
Eurydice 239
F – GRADUATES AND QUALIFICATION LEVELS x Figure F1: Proportion of the population in the 20-24 age group having completed
at least upper secondary education (ISCED 3), 2007 Eurostat, Labour force survey
241
x Figure F2: Proportion of the population without at least an upper secondary education (ISCED 3), by age group, 2007
Eurostat, Labour force survey
242
x Figure F3: Number of women for every 100 men obtaining a general upper secondary education (ISCED 3) qualification, 2002-2006
Eurostat, UOE 243
x Figure F4: Percentage of the population with tertiary education qualifications (ISCED 5 and 6) in the population aged 30-64, by age group, 2007
Eurostat, Labour force survey
245
x Figure F5: Number of women per 100 men graduating from tertiary education (ISCED 5 and 6), 2006
Eurostat, UOE 246
x Figure F6: Variation in the number of women per 100 men graduating from tertiary education (ISCED 5 and 6), 2002-2006
Eurostat, UOE 247
x Figure F7: Tertiary education graduates (ISCED 5 and 6) by fields of education and training, 2006
Eurostat, UOE 249
x Figure F8: Proportion of tertiary education qualifications (ISCED 5 and 6) awarded to women, by field of education and training, 2006
Eurostat, UOE 251
x Figure F9: Variation in the number of tertiary-level graduates (ISCED 5 and 6) in science and technology per 1 000 inhabitants aged 20-29, 2002-2006
Eurostat, UOE 253
NB: Eurostat, Labour force survey: Data extracted July 2008
Eurostat, UOE: Data extracted July 2008 and June 2009
Eurostat, population statistics: Data extracted July 2008
Eurostat, National Accounts: Data extracted June 2009

271
A C K N O W L E D G E M E N T S
EDUCATION, AUDIOVISUAL AND CULTURE EXECUTIVE AGENCY
P9 EURYDICE
Avenue du Bourget 1 (BOU2) B-1140 Brussels
(http://www.eurydice.org)
Managing editor
Arlette Delhaxhe
Authors
Stanislav Ranguelov (Coordination)
Isabelle de Coster, Bernadette Forsthuber, Sogol Noorani, Philippe Ruffio
Layout and graphics
Patrice Brel
Production coordinator
Gisèle De Lel
EXTERNAL EXPERTS AND CO-AUTHORS Arnaud Desurmont, Christian Monseur, Stephanie Oberheidt
EUROSTAT (EDUCATION, SCIENCE AND CULTURE)
Provider of indicators from the Eurostat databases
Lene Mejer, Marta Beck-Domzalska, Eric Gere, Reigo Hirmo, Georgeta Istrate, Fernando Reis, Paolo Turchetti, Tomas Uhlar

K e y D a t a o n E d u c a t i o n i n E u r o p e 2 0 0 9
272
EURYDICE NATIONAL UNITS
BELGIQUE / BELGIË Unité francophone d’Eurydice Ministère de la Communauté française Direction des Relations internationales Boulevard Léopold II, 44 – Bureau 6A/002 1080 Bruxelles Contribution of the Unit: Joint responsibility Eurydice Vlaanderen / Internationale Projecten Ministerie Onderwijs en Vorming Hendrik Consciencegebouw 7C10 Koning Albert II – laan 15 1210 Brussel Contribution of the Unit: Elke Ghijssels (Secondary and Adult Education); Veronique Adriaens (Elementary and Part Time Arts Education); Ann Van Driessche (Departmental Staff); Isabelle Erauw (Division for Strategic Policy Support); Bieke Vander Elst (Inspection Division); Sabine Meuwis (Division for Employment Conditions Policy) Eurydice-Informationsstelle der Deutschsprachigen Gemeinschaft Agentur für Europäische Bildungsprogramme VoG Gospertstrasse 1 4700 Eupen Contribution of the Unit: Leonhard Schifflers, Johanna Schröder
BULGARIA Eurydice Unit European Integration and International Organisations Division European Integration and International Cooperation Department Ministry of Education and Science 2A, Kniaz Dondukov Blvd. 1000 Sofia Contribution of the Unit: Joint responsibility
�ESKÁ REPUBLIKA Eurydice Unit Institute for Information on Education Senovážné nám. 26 P.O. Box �.1 110 06 Praha 1 Contribution of the Unit: Joint responsibility
DANMARK Eurydice Unit CIRIUS Fiolstræde 44 1171 København K Contribution of the Unit: Joint responsibility
DEUTSCHLAND Eurydice-Informationsstelle des Bundes EU-Büro des Bundesministeriums für Bildung und Forschung (BMBF) / PT-DLR Carnotstr. 5 10587 Berlin
Eurydice-Informationsstelle der Länder im Sekretariat der Kultusministerkonferenz Lennéstrasse 6 53113 Bonn Contribution of the Unit: Brigitte Lohmar
EESTI Eurydice Unit SA Archimedes Koidula 13A 10125 Tallinn Contribution of the Unit: Kersti Kalmda (co-ordination) and joint responsibility with ministerial officials and experts of the Examinations and Qualifications Centre
ÉIRE / IRELAND Eurydice Unit Department of Education and Science International Section Marlborough Street Dublin 1 Contribution of the Unit: Joint responsibility
ELLÁDA Eurydice Unit Ministry of National Education and Religious Affairs Directorate of European Union Section C ‘Eurydice’ 37 Andrea Papandreou Str. (Office 2168) 15180 Maroussi (Attiki) Contribution of the Unit: Athina Plessa-Papadaki (Director of the Directorate for European Union Affairs); Dr. Anastasia Kostakis (Eurydice Unit)
ESPAÑA Unidad Española de Eurydice CIDE – Centro de Investigación y Documentación Educativa Ministerio de Educación c/General Oráa 55 E – 28006 Madrid Contribution of the Unit: Flora Gil Traver; expert: Alberto Alcalá Lapido
FRANCE Unité française d’Eurydice Ministère de l’Éducation nationale, de l'Enseignement supérieur et de la Recherche Direction de l’évaluation, de la prospective et de la performance Mission aux relations européennes et internationales 61-65, rue Dutot 75732 Paris Cedex 15 Contribution of the Unit: Nadine Dalsheimer; expert: Pierre Fallourd

A c k n o w l e d g e m e n t s
273
ÍSLAND Eurydice Unit Ministry of Education, Science and Culture Office of Evaluation and Analysis Sölvhólsgötu 4 150 Reykjavik Contribution of the Unit: Margrét Harðardóttir
ITALIA Unità italiana di Eurydice Agenzia Nazionale per lo Sviluppo dell’Autonomia Scolastica (ex INDIRE) Ministero della Pubblica Istruzione Ministero dell’Università e della Ricerca Via Magliabechi 1 50122 Firenze Contribution of the Unit: Alessandra Mochi, Antonella Turchi; expert: Dino Cristanini (dirigente tecnico, Ministero dell'Istruzione, dell'Universitá e della Ricerca)
KYPROS Eurydice Unit Ministry of Education and Culture Kimonos and Thoukydidou 1434 Nicosia Contribution of the Unit: Christiana Haperi; expert: Gregory Makrides (President, Thales Foundation)
LATVIJA Eurydice Unit LLP National Agency – Academic Programme Agency Blauma�a iela 28 1011 Riga Contribution of the Unit: Joint responsibility
LIECHTENSTEIN Informationsstelle Eurydice Schulamt Austrasse 79 9490 Vaduz Contribution of the Unit: Marion Steffens-Fisler, Eva-Maria Schädler
LIETUVA Eurydice Unit Ministry of Education and Science A. Volano g. 2/7 01516 Vilnius Contribution of the Unit: Joint responsibility with ministerial officials and experts of the Education Development Centre
LUXEMBOURG Unité d’Eurydice Ministère de l’Éducation nationale et de la Formation professionnelle (MENFP) 29, rue Aldringen 2926 Luxembourg Contribution of the Unit: Mike Engel
MAGYARORSZÁG Eurydice Unit Ministry of Education and Culture Szalay u. 10-14 1055 Budapest Contribution of the Unit: Katalin Zoltán, István Orbán, Sára Kun-Hatony, Dóra Demeter
MALTA Eurydice Unit Directorate for Quality and Standards in Education Ministry of Education, Culture, Youth and Sport Floriana VLT 2000 Contribution of the Unit: Joint responsibility
NEDERLAND Eurydice Nederland Ministerie van Onderwijs, Cultuur en Wetenschap Directie Internationaal Beleid IPC 2300 / Kamer 10.130 Postbus 16375 2500 BJ Den Haag Contribution of the Unit: Joint responsibility
NORGE Eurydice Unit Ministry of Education and Research Department of Policy Analysis, Lifelong Learning and International Affairs Akersgaten 44 0032 Oslo Contribution of the Unit: Joint responsibility
ÖSTERREICH Eurydice-Informationsstelle Bundesministerium für Unterricht, Kunst und Kultur – I/6b Minoritenplatz 5 1014 Wien Contribution of the Unit: Joint responsibility
POLSKA Eurydice Unit Foundation for the Development of the Education System LLP Agency Mokotowska 43 00-551 Warsaw Contribution of the unit: Anna Smoczynska in cooperation with experts from the Ministry of National Education
PORTUGAL Eurydice Portuguese Unit Ministry of Education Office for Education Statistics and Planning Av. 24 de Julho, 134 – 4º 1399-054 Lisboa Contribution of the Unit: Guadalupe Magalhães, Rosa Fernandes; experts: Carlos Ruela, Elsa Estêvão, Helder Guerreiro, João Matos

K e y D a t a o n E d u c a t i o n i n E u r o p e 2 0 0 9
274
ROMÂNIA
Eurydice Unit National Agency for Community Programmes in the Field of Education and Vocational Training Calea Serban Voda, no. 133, 3rd floor Sector 4 040205 Bucharest Contribution of the Unit: Veronica - Gabriela Chirea; experts: Maria Dornean (Director, Ministry of Education, Research and Innovation); Violeta Gogu (Romanian Agency for Quality Assurance in Pre-University Education – ARACIP); Anca Denisa Petrache (Ministry of Education, Research and Innovation)
SLOVENIJA
Eurydice Unit Ministry of Education and Sport Department for Development of Education (ODE) Masarykova 16/V 1000 Ljubljana Contribution of the Unit: Tatjana Plevnik, Barbara Kresal-Sterniša
SLOVENSKÁ REPUBLIKA
Eurydice Unit Slovak Academic Association for International Cooperation Staré grunty 52 842 44 Bratislava Contribution of the Unit: Joint responsibility
SUOMI / FINLAND
Eurydice Finland Finnish National Board of Education P.O. Box 380 00531 Helsinki Contribution of the Unit: Joint responsibility
SVERIGE
Eurydice Unit Ministry of Education and Research Utbildningsdepartementet 103 33 Stockholm Contribution of the Unit: Joint responsibility
TÜRKIYE
Eurydice Unit MEB, Strateji Geliştirme Başkanliği (SGB) Eurydice Birimi Merkez Bina Giriş Kat B-Blok NO 1 Kizilay 06100 Ankara Contribution of the Unit: Osman Yıldırım Uğur, Bilal Aday, Dilek Güleçyüz
UNITED KINGDOM
Eurydice Unit for England, Wales and Northern Ireland National Foundation for Educational Research (NFER) The Mere, Upton Park Slough SL1 2DQ Contribution of the Unit: Sigrid Boyd Eurydice Unit Scotland International Team Schools Directorate 2B South Victoria Quay Edinburgh EH6 6QQ Contribution of the Unit: National unit staff and Scottish Government colleagues
EUROSTAT CONTACT POINTS
European Commission – Eurostat
Unit F4: Education Statistics
Office address: Bech Buidling B3/434, 5 rue Alphonse Weicker, L-2721 Luxembourg
National contact points that have taken part in preparing this report
BELGIQUE / BELGIË
Ministère de la Communauté française Direction des Relations Internationales Boulevard Léopold II, 44 1080 Bruxelles Contribution: Nathalie Jauniaux
Department of Education and Training – Flemish Community (Belgium) Departmental Staff Koning Albert II-laan 15 1210 Brussels Contribution: Ann Van Driessche

A c k n o w l e d g e m e n t s
275
BULGARIA Statistics of Social Activities Division NSI of Bulgaria 2, P. Volov street 1038 Sofia Contribution: Stoyan Baev and Svilen Kateliev
�ESKÁ REPUBLIKA Czech Statistical Office Institute for information on Education Senovazne nam. 26 P.O.Box 1, 110 06 Prague 1 Contribution: Vladimir Hulik
DANMARK Ministry of Education Frekeriksholms Kanal 25 1220 København K Contribution: Julie Grunnet Hansen Statistics Denmark Sejrøgade 11 2100 København Ø Contribution: Leo Jensen
DEUTSCHLAND Statistisches Bundesamt Gustav-Stresemann-Ring 11 65189 Wiesbaden Contribution: Christiane Krueger-Hemmer
EESTI Statistical Office of Estonia Endla 15 15174 Tallinn Contribution: Tiiu-Liisa Rummo-Laes
ÉIRE / IRELAND Department of Education and Science Marlborough Street Dublin 1 Contribution: Gillian Golden and Nicola Tickner
ELLÁDA Ministry of National Education and Religious Affairs Directorate of Planning and Operational Research Andrea Papandreou 37 15180 Maroussi (Athens) Contribution: Angelos Karagiannis and Chrysa Drydaki
ESPAÑA Ministerio de Educación y Ciencia Plaza del Rey 6 28004 Madrid Contribution: Jesus Ibáñez Milla
FRANCE Ministère de l’Éducation nationale et Ministère de l’Enseignement supérieur et de la Recherche 61 rue Dutot 75732 Paris Cedex 15 Contribution: Cedric Afsa
ÍSLAND Statistics Iceland Education and Culture Statistics Borgartuni 21a 150 Reykjavik Contribution: Asta M. Urbancic
ITALIA Ministry of Education Statistical Office Via Michele Carcani 61 00153 Roma Contribution: Paola Di Girolamo and Maria Teresa Morana
KYPROS Statistics of Education Michalakis Karaolis Street 1444 Nicosia Contribution: Demetra Costa
LATVIJA Central Statistical Bureau of Latvia Lacpleša St. 1 1301 Riga Contribution: Anita Svarckopfa
LIECHTENSTEIN Office of Economic Affairs Contribution: Harry Winkler
LIETUVA Education and Culture Statistics Division, Statistics Lithuania Gedimino av.29, 01500 Vilnius Contribution: Daiva Marcinkeviviene and Gaile Dapsiene
LUXEMBOURG Ministère de l’Éducation nationale et de la Formation professionnelle (MENFP) 29, rue Aldringen 2926 Luxembourg Contribution: Jérôme Levy
MAGYARORSZÁG Hungarian Central Statistical Office Keleti Károly u. 5-7 1024 Budapest Contribution: Katalin Janak

K e y D a t a o n E d u c a t i o n i n E u r o p e 2 0 0 9
276
MALTA National Statistics Office Lascaris Valletta Contribution: Joslyn Magro Cuschieri
NEDERLAND Statistics Netherlands Education Statistics P.O Box 4000 2270 JM Voorburg Contribution: Dick Takkenberg
NORGE Statistics Norway – SSB Division for Population and Education Statistic Oterveien 23 2225 Kongsvinger Contribution: Terje Risberg
ÖSTERREICH Statistik Austria Guglgasse 13 1110 Wien Contribution: Wolfgang Pauli
POLSKA Central Statistical Office Poland Al. Niepodleglosci 208 00925 Warsaw Contribution: Chojnicka Malgorzata
PORTUGAL Ministry of Education Office for Education Statistics and Planning Av. 24 de Julho 134 – 2° 1399-054 Lisboa Contribution: Nuno Rodrigues and Mario Baptista
ROMÂNIA National Institute of Statistics General Direction of Social Statistics 16 Libertatii Boulevard 70 542 Bucharest, Sector 5 Contribution: Nicoleta Adamescu
SLOVENIJA Statistical Office of Slovenia Vožarski Pot 12 1000 Ljubljana Contribution: Tatjana Skrbec
SLOVENSKÁ REPUBLIKA Statistical Office of the Slovak Republic Stare grunty 52 842 44 Bratislava Contribution: Pavol Baxa and Alzbeta Ferencicova
SUOMI / FINLAND Statistics Finland P.O. Box 4B 00022 Finland Contribution: Mika Tuononen
SVERIGE Statitiska centralbyran Stattistics Sweeden 701 89 Örebro Contribution: Kenny Petersson
TÜRKIYE Turkish Statistical Institute Education Statistics Team MEB Strateji Gelistirme Baskanligi Bakanliklar Ankara Contribution: Nilgün Duran and Fatima Tarpis
UNITED KINGDOM dcsf International Department for children, schools and families Room W606 Moorfoot Sheffield England SI 4PQ Contribution: Tony Clarke and Steve Hewitt

EACEA; Eurydice; Eurostat
Key Data on Education in Europe 2009 Edition
Brussels: Eurydice
2009 – 278 p.
(Key Data) ISBN 978-92-9201-033-1
DOI 10.2797/1715


