Kevlar Raman
31
1 Characterization of Kevlar Using Raman Spectroscopy Glenn Washer, Ph.D., P.E. 1 , Thomas Brooks 1 and Regor Saulsberry, P.E. 2 1 Department of Civil and Environmental Engineering University of Missouri-Columbia 2503 Lafferre Hall Columbia, MO 65211 2 Project Manager NASA - White Sands Test Facility Las Cruces, NM 88012 Abstract This paper explores the characterization of Kevlar composite materials using Raman spectroscopy. The goal of the research is to develop and understand the Raman spectrum of Kevlar materials to provide a foundation for the development of nondestructive evaluation (NDE) technologies based on the interaction of laser light with the polymer Kevlar. The paper discusses the fundamental aspects of experimental characterization of the spectrum of Kevlar, including the effects of incident wavelength, polarization and laser power. The effects of environmental exposure of Kevlar materials on certain characteristics of its Raman spectrum are explored, as well as the effects of applied stress. This data may provide a foundation for the development of NDE technologies intended to detect the in-situ deterioration of Kevlar materials used for engineering applications that can later be extended to other materials such as carbon fiber composites. Introduction The use of polymer composite materials for the design and construction of engineered components has increased steadily since Kevlar was first introduced by the Du Pont de Nemours Inc. in 1971. The materials are formed by a combination of high-strength fibers and polymer
-
Upload
eferrarijr -
Category
Documents
-
view
79 -
download
2
Transcript of Kevlar Raman

1
Characterization of Kevlar Using Raman Spectroscopy
Glenn Washer, Ph.D., P.E.1, Thomas Brooks1 and Regor Saulsberry, P.E.2
1 Department of Civil and Environmental Engineering University of Missouri-Columbia 2503 Lafferre Hall Columbia, MO 65211 2 Project Manager NASA - White Sands Test Facility Las Cruces, NM 88012
Abstract
This paper explores the characterization of Kevlar composite materials using Raman
spectroscopy. The goal of the research is to develop and understand the Raman spectrum of
Kevlar materials to provide a foundation for the development of nondestructive evaluation (NDE)
technologies based on the interaction of laser light with the polymer Kevlar. The paper discusses
the fundamental aspects of experimental characterization of the spectrum of Kevlar, including the
effects of incident wavelength, polarization and laser power. The effects of environmental
exposure of Kevlar materials on certain characteristics of its Raman spectrum are explored, as
well as the effects of applied stress. This data may provide a foundation for the development of
NDE technologies intended to detect the in-situ deterioration of Kevlar materials used for
engineering applications that can later be extended to other materials such as carbon fiber
composites.
Introduction
The use of polymer composite materials for the design and construction of engineered
components has increased steadily since Kevlar was first introduced by the Du Pont de Nemours
Inc. in 1971. The materials are formed by a combination of high-strength fibers and polymer

2
matrix resins that exhibit the composite mechanical properties of the materials used. The
materials have been used to replace a wide variety of metallic components in aerospace and
military structures, capitalizing on the high strength-to-weight ratio of the materials to realize mass
reductions in engineered components [1]. For civil engineering applications, composite materials
are increasingly used to strengthen structures and provide increased durability, benefiting from
both the formability of the materials in the field and the high strength-to-weight ratio [2]. For
example, in the state of Texas, it is common practice to repair bridges that have been damaged
from collision with over-height vehicles by patching the concrete with a carbon fiber/epoxy
composite. Other State Departments of Transportation are using these materials to improve the
seismic resistance of bridges, and to rehabilitate aging concrete structures [2].
The increasing use of these materials has introduced a need for the development of methods to
evaluate the condition of polymer composites during their service lives. This has led to the
development of a variety of nondestructive evaluation (NDE) technologies that are intended to be
used to evaluate the condition of polymer composite materials in-situ. This has included a
variety of acoustic/ultrasonic techniques, thermographic and electromagnetic methods that are
intended to detect damage to the composite [3, 4]. In general, these methods are intended to
detect mechanical damage in the materials caused by impact or overstress of the materials. The
effect of the environment on material properties has remained largely unexplored, due in part to
the complex interaction of composite materials with their environment. For example, polymer
composites typically exhibit a failure mode of creep rupture, a reduction in the mechanical
capacity of the material as a result of exposure to elevated stresses over time [5]. Additionally,
degradation of the fiber/matrix binding may result from water absorption and other environmental
effects, leading to a reduction in composite action between the fibers and the matrix that provide
the material its strength and durability [5]. For Kevlar, exposure to ultra-violet (UV) radiation can
also damage the fibers by altering its chemical structure [6].

3
Laser Raman spectroscopy is a light scattering technique that is widely known as a tool for
chemical characterization. This technique has been traditionally applied in the laboratory by
chemist, physicists and material scientists as means of determining the chemical structure of
materials. The technique generally involves analyzing a spectrum of scatter light that exhibits
certain peaks in light intensity that relate to the chemical structure of the tested material. For
Kevlar, preliminary experimental testing indicated that there are as many as 16 separate,
identifiable peaks in the Raman spectra of Kevlar, depending on the incident laser wavelength
used to initiate the scattering. Each of these peaks is associated with a vibrational mode of the
polymer that are generally effected by applied strain and molecular structure and bonding. These
effects have been successfully applied to evaluation of the stress and strain distribution of
composite materials, where shear stresses transfer load between individual fibers through the
matrix resin [6-13]. The research reported here explores the use the Raman technique to identify
environmental deterioration of Kevlar materials. The effects on certain characteristics of the
Raman spectra resulting from prolonged exposure to stress at elevated temperatures are
discussed, as well as the effects of applied elastic stresses. Experimental issues related to
evaluating the Raman spectra of Kevlar are also discussed, including the effect of fiber
orientation and laser power levels on the effective acquisition of the spectra. Fundamental data is
provided that could lead to the development of NDE techniques for the in-situ condition
assessment and materials characterization of composite materials.
Background
Raman spectroscopy can be used to study the chemical composition and structure of polymer
materials such as Kevlar. This method involves illuminating the surface of a material with an
incident laser light and observing the scattering characteristics. When an incident photon from
the laser interacts with a molecule, the photon can be absorbed, reflected or scattered.
Scattering may be elastic, known as Rayleigh scattering, or inelastic Raman scattering. For the
Rayleigh scattering process, the energy of the incident photon is equal to the emitted or scattered
photon. Raman spectroscopy is the measurement of the intensity and frequency of the

4
inelastically scattered light. Raman scattered photons are shifted from the incident energy due to
change from the vibrational energy of the molecule illustrated in Figure 1. The photon may lose
energy (Stokes scattering) from the incident photon depositing energy in the molecule or gain
energy (anti-Stokes scattering) due to the loss in energy of the molecule. In the case of Stokes
scattering, the photon will decrease in frequency and increase in wavelength. Stokes scattering
is typically used for analysis due to higher intensities when compared to anti-Stokes scattering
[14].
To produce a Raman spectrum, a laser provides incident light upon the surface of a
sample, and light is back-scattered over 180° and collected through optical lenses. Generally, for
rigid chain polymer analyses, the range of wavelengths of the incident laser is from 488 nm,
which is visible, blue light to 1064 nm, near infrared light. The inelastically scattered light is then
guided through a monochromator and dispersed onto a charge coupled device (CCD). For a
Raman spectrometer system, this process is shown on a schematic diagram in Figure 2. The
CCD output is the intensity of scattered light per wavelength, which is converted to a
wavenumber and subtracted from the wavenumber of the incident beam to create a spectrum of
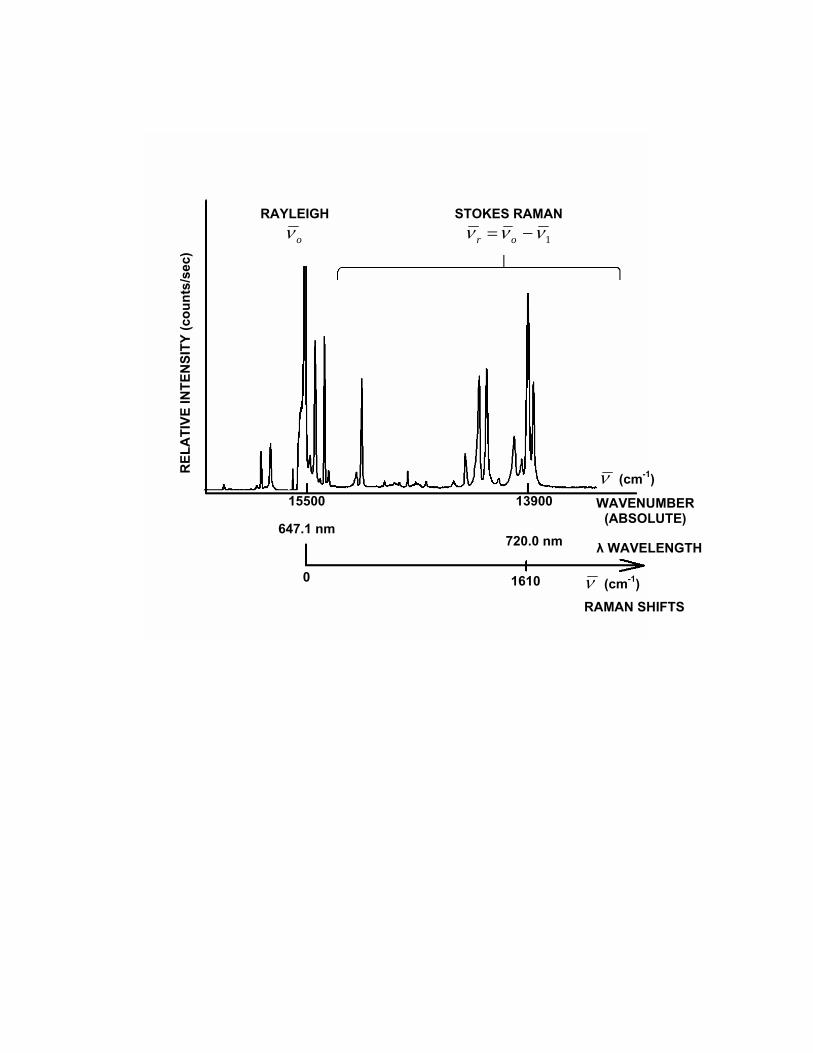
the shifted, Raman-scattered light. Figure 3 illustrates how a Raman spectrum is developed from
Stokes scattering. From the figure, the abscissa is the absolute wavenumber of the scattered
light resulting from an incident laser wavelength of 647.1 nm. A second abscissa shown indicates
the wavelength and relative wavenumber for the frequency shift from the incident laser light. The
wavenumber is simply the inverse of the wavelength. The ordinate represents the relative
intensity of the scattered photons per second, typically detected by a charge coupled device
(CCD) or photomultiplier tube. As shown in the figure, the absolute wavenumber of inelastic
scattered light, 1ν , is subtracted from the absolute wavenumber of incident light, oν , to calculate
a relative wavenumber to the incident light, rν . Therefore, the Stokes scattering equation
becomes 1ννν −= or .

5
The frequency shifts of the vibrational energy that occur in a Raman scattering process are
independent of the incident photon frequency but dependent upon the specific molecular
geometry of the material. For frequency shifts to occur such that certain vibrational modes are
Raman active, the polarizability of the molecules must change during vibration. The polarization
of the molecule is dependent upon the symmetry of the molecular vibration for a specific
scattering geometry [15]. A certain material of molecular structure could have many shifts in
frequency of the incident photons, revealing a Raman spectrum. For the molecular structure of
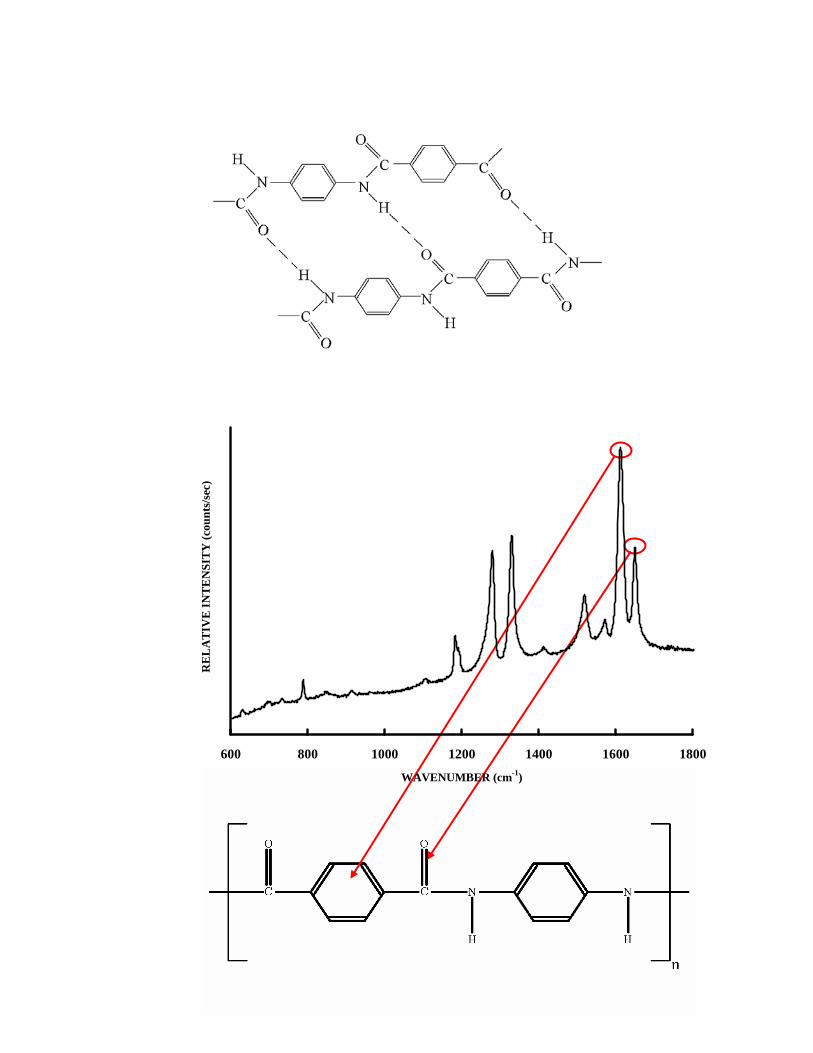
Kevlar, shown in Figure 4, a series of aromatic rings are bonded through oxygen and hydrogen
bonds in the monomer. As a result, the C-C aromatic ring has certain vibrational modes (e.g.
stretching, axial extension) as does the H-O and H-C bonds. Many of the vibrational modes
associated with these bonds are Raman active, such that Kevlar material produces a complex
and rich Raman spectrum. Changes in the bonding conditions, such as changes in interatomic
forces that might result from applied strain, create shifts in the wavenumber of peaks in the
spectrum [12].
A Raman spectrum of Kevlar yarn is presented in Figure 5. The abscissa is the wavenumber for
the frequency shift from the incident laser light, over a range of 600 to 1700 cm-1. The ordinate
represents the relative intensity of the scattered photons (laser light). A number of intense peaks,
or bands, are shown in the spectrum, each corresponding to a vibrational mode of the polymer
material. Analytical models have been developed that predict these peaks; for example; the peak
at ~1613 cm-1 stems from a stretching vibrational mode of the C-C phenyl ring, while the 1649
cm-1 peak stems from the stretching of the C=O bond (Figure 5). Raman scattering analyses of
Kevlar have determined a series of well defined peaks ranging from 600 to 1700 cm-1 as shown in
Table 1 [16, 17]. From these analytical models, specific peaks identified in the spectra can be
related to the structural configuration of the material.
Since Kevlar has a well-defined Raman response, there have been many studies performed that
characterize the structure of the polymer material and evaluate the material under applied

6
strain/stress [7-12, 16]. The majority of previous studies on the material have analyzed the
~1613 cm-1 peak which is produced from the C-C stretching of the phenyl ring due to the high
sensitivity of the peak shift under applied strain/stress, high intensity relative to other peaks in the
spectrum, and relevance to the fundamental structure of the polymer.
The relationship between the position of peaks in the spectrum and applied stress/strain has
been investigated by many researchers. Galiotis et al. [9] recorded Raman spectra of strained
Kevlar 49 fibers embedded in a matrix epoxy. A 514 nm argon ion laser operated at 5 mW with
the laser light polarized parallel to the fiber and polymer chain axis was used. It was observed
that the whole Raman spectrum between 1100 and 1700 cm-1 (six Raman bands) shifted to lower
wavenumber with applied tensile strain. Each of these peaks shifted at a different rate as a
function of applied tensile stress. It was also reported that broadening of the Raman bands was
observed. Both peak shifting and band broadening indicated that the ~1613 cm-1 Raman band
exhibited the highest sensitivity. Prasad and Grubb [6] found a decrease in wavenumber and an
increase in the Raman band width with applied tensile stress for Kevlar 49. At a molecular level,
when the fiber is stressed, changes occur in bond length and bond angle which could be
observed on the Raman spectrum as shifts in peak frequency. The band broadening is created
from defects in the fiber or defects being created in the fiber under stress. Furthermore, the load
is transferred by secondary hydrogen bonds between the long chains of molecules. If there are
defects present, the resulting stress redistribution creates a greater increase in band width. The
hydrogen bonds referred to are shown as dashed lines in Figure 4. It was also reported the
number of defects in a Kevlar fiber was increased by exposure to ultra violet light, and an
increase in band broadening under applied load was observed [6]. Other investigators have
explored the effect of water immersion on the Raman spectra of Kevlar [10, 18]. Kawagoe et al.
[10] applied tensile stress to a dried sample of Kevlar and to samples that had been immersed in
water for a 24 hour period. The rate of peak shifts as a function of applied loads appeared the
same in both samples. Another study by Stuart [18] examined the Raman spectra of Kevlar that
had been immersed in water. The intensity of bands appearing in the spectra relative to the

7
~1278 cm-1 band, rather than the position of peaks (shifting), was analyzed to determine if water
immersion was effecting the bonding within the Kevlar. A decrease in intensity of the ~1613 cm-1
band was found for the samples immersed in water when compared to samples that had not been
immersed. The loss of intensity for this band was attributed to the disruption of hydrogen bonding
in the Kevlar as a result of immersion in water.
These previous investigations indicate the spectrum characteristics such as peak position,
bandwidth and relative peak intensity can be related to external conditions such as applied load
and environmental exposures. This suggests that changes in the material on a molecular level
that result from damage induced by aging, i.e. exposure to environmental loadings such as
stress, temperature, moisture, etc., may be detectable by examining the characteristics of Raman
spectra. As such, the technique may provide the foundation for an NDE approach that examines
materials in-situ for purpose of detecting deterioration. The effects on characteristics of the
Raman spectra resulting from exposure to elevated temperature and stress are examined here to
evaluate the potential of the method as a tool for nondestructive evaluation of the material. Such
a method could potentially be extended to other polymer-based composites.
Kevlar
Kevlar fiber reinforced composite material is a strong, lightweight material consisting of high
modulus Kevlar yarn embedded in a matrix; the combined system is referred to as a fiber
reinforced polymer (FRP). Kevlar fibers consist of long molecular chains produced from a
synthetic polyamide in which the amide linkages are attached directly between two aromatic
rings. An amide linkage is an organic functional group characterized by a carbonyl group, C=O,
linked to a nitrogen atom, and an aromatic ring is a molecular structure consisting of six carbon
atoms connected by alternating single and double covalent bonds. These long chains are highly
oriented with many interchain hydrogen bonds and aromatic stacking interaction resulting in high
energy absorption. As a result, Kevlar 49 fibers have a high tensile strength-to-weight ratio. The

8
low-density material also has a high modulus-to-weight ratio; ideal for engineering composites.
The fibers (yarn) have an elastic modulus of 120 MPa, a diameter of 12 μm and an elongation of
2.8% [19]. Kevlar fibers have a low compressive strength and the mechanical properties vary
with temperature. The maximum temperature for Kevlar fiber usage is 250°C due to the polymer
decomposing at higher temperatures [19]. Kevlar fibers are embedded in a matrix of epoxy to
form composite strands suitable for engineering applications. The Kevlar strands are affected by
visco-elastic deformation under sustained loading i.e. creep and degradation as a result of
exposure to ultraviolet light, elevated temperature and water.
Experimental
Materials
A series of Kevlar samples have been evaluated to identify and characterize the Raman spectra.
This has included Kevlar yarn that is comprised solely of the Kevlar fibers in a tow, without matrix
materials such as epoxy to bind the individual fibers together into a composite material (1140
denier). The yarn material was tested to characterize the spectra of the Kevlar fibers without
epoxy, to provide baseline spectra for comparison and to develop methods for yielding spectra in
later tests on strand samples.
Strands of Kevlar consisting of a yarn tow impregnated in an epoxy matrix to form a composite
have also been tested. The strand specimens tested included “virgin” strands that have not been
exposed to any type of environmental loading, such as high temperature and stress. Virgin
samples of Kevlar yarn and composite strands consisting of Kevlar fibers impregnated in an
epoxy matrix were obtained from Texas Research International (TRI) for testing. Virgin strands
were used for direct comparison to strands that were “aged” by exposure to elevated temperature
and elevated stress. Among these aged strands, a series of strands that had been part of a
creep testing program were evaluated. These strands were loaded to 65% of their tensile

9
strength and held at load for various periods of time at different temperatures. Strands exposed to
this testing program are referred to as “creep” specimens. A virgin strand of the same materials
was used for comparison with the creep samples.
Another set of strands specimens labeled were evaluated as part of the study. These strands
were exposed to accelerated aging tests that attempted to determine the potential stress rupture
lifetime of the materials. The SIM (stepped isothermal method) specimens were loaded to 65% of
its tensile strength in a temperature-controlled chamber. Step-wise increases in the temperature
were imposed at sustained stress levels until failure [20].
In addition to the strand specimens, two sections of composite materials were also evaluated.
The composite sections were removed from aged composite over-wrapped pressure vessels
(COPVs) that were part of a NASA fleet leader program. The fleet leader program maintained a
population of COPVs under pressure for extended periods of time to provide data on lifetime
performance characteristics of in-service COPVs of similar design. One of these specimens, SN
032, was aged for ~17 years at 80°C while pressurized at 29 MPa. A second composite
specimen, SN 007, was cut from a fleet leader COPV that had been aged at a pressure of 29
MPa for 17 years at room temperature. Each of these fleet leader specimens were sectioned into
two pieces (a and b) for comparison.
Instrumentation
The Raman spectra reported here were measured using two separate instruments. A Renishaw
micro-Raman system was used to measure Kevlar 49 using an incident laser of 488 nm, 647 nm
and 752 nm. The multi-frequency spectrometer enables the study of wavelength effects that can
alter the appearance of the Raman spectra. The ability to evaluate the quality of the spectra
obtained over a range of frequency, e.g. wavelengths, allows for the evaluation of the optimum
frequency for experimental study. The laser source illuminates the sample surface through a 50x
microscope objective. Raman scattered light is collected from the surface and a spectrometer

10
with a CCD detector is used to evaluate the intensity of the Raman scattered light over a range of
wavelengths.
The collection time was generally averaged over two to three scans for 30 seconds each with a
pixel resolution of ~1.6 cm-1. Power was kept under 10 mW and the incident light was polarized
parallel to the fiber axis. The spectral region was tested from 600 to 1700 cm-1.
Raman measurements were also taken using a Fourier Transform (FT) Raman system with a
near-infrared incident laser of 1064 nm. The FT Raman system differs from the spectroscopic
system in the determination of the wavelength of scattered light, which is determined by an
interferometer rather than by a spectrometer. An interferometer is used due to the inefficient
gratings and throughput-limited slit configuration of spectrometers at longer wavelengths [21].
The interferometer has the ability to remove the Rayleigh scattering in the near-infrared range.
FT Raman systems use of the 1064 nm laser removes fluorescence completely. In the near-
infrared (IR) region of 1064 nm, the photon energy is usually not sufficient to cause transitions
between electronic states that give rise to fluorescence [22]. For each spectrum, 32 scans were
Fourier transformed with a resolution of 1.5 cm-1. All spectra were analyzed using the
commercial software Peakfit®.
Effects of Fiber Orientation
The individual monomers of Kevlar 49 are highly oriented within the material fibers, generally at a
10° angle from axial along the fiber length [6]. This is the primary reasons the material exhibits
such highly anisotropic elastic behavior, with very high axial tensile strength and nominal
compression strength. As a result of the orientation of the molecules within the polymer, the
polarizability of the material is highly dependent on its orientation relative to the polarization of
incident light. Testing was conducted to ensure the proper alignment of specimen in the micro-
Raman system to ensure the most intense Raman spectra from the material. A Kevlar strand
was mounted to a rotating device and scanned with the micro-Raman system from 0 to 360° in

11
10° intervals. Figure 6 displays two views of a Kevlar strand rotated at different angles under the
Raman microscope. Figure 7 illustrates the differences in appearance of the spectrum when the
laser is polarized parallel to the fiber axis and perpendicular to the fiber axis. Raman peaks are
nearly indistinguishable from the background noise when the laser is polarized perpendicular to
the fiber axis.
Figure 6 also shows the texture of the surface of a Kevlar strand as seen through the 50X
objective. As shown in the figure, the surface of the strand material is characterized by a series
of alternating fiber and matrix bands at the surface. These alternating surface textures have an
effect on intensity of the Raman spectra created, as discussed later in the next section entitled
Laser Power.
Laser power
Problems arise when too much laser power is incident upon Kevlar samples. Literature indicates
that the power of the incident laser may damage Kevlar fibers if above ~16 mW [6, 16]. Galiotis
et al. [23] also studied the effects of incident power levels by increasing the power up to 20 mW
for a set of scans while straining a Kevlar 49 fiber at 2.5%. The power was then decreased which
resulted in a significant shift to a higher wavenumber of the ~1610 cm-1 peak, corresponding to a
strain relaxation of 1.48%. These results indicated that the fibers had been damaged as a result
of being exposed to the higher incident laser power. In this study, the power levels have been
closely controlled and kept at less than 10 mW on the sample surface.
The lowest power that provided a suitable spectrum was determined experimentally using
a virgin strand of Kevlar 49. Figure 8 shows spectra at different power levels. From the figure it
is shown that a power level of 7 mW is adequate for providing a spectrum with high S/N ratio as
demonstrated by its intense Raman peaks relative to the background noise. Power
measurements were made at the sample surface using a handheld laser power meter to

12
supplement instrumentation readings. This handheld device was used to ensure the power
stayed well below 10 mW.
The intensity of the resulting spectrum overall can vary due to how well the microscope focuses
the incident laser on a fiber. As seen in Figure 6, the strand surface consists of areas of fibers at
the surface (light) and areas of epoxy at the surface (dark). If the incident laser is focused directly
on a fiber at the surface, the Raman peaks in the spectrum will be highly intense. However, if
the laser is focused in between two fibers i.e. the darker areas, the peaks in the spectrum will
appear lower in intensity. As a result, there is experimental variation in the intensity of spectra
obtained from different areas of the same material, requiring some normalization of the spectrum
characteristics as described in the following section.
Spectrum Analysis
Quantitative characterization of Raman spectra requires the specific characteristics of spectra be
identified, such that spectra from different samples can be normalized and compared. A common
method of comparing spectra is to analyze the shifting of individual peaks to either a higher or
lower wavenumber. Changes in the peak position may be indicative of changes in structure of
the material or stresses within the material [6-12, 24]. For the present study, peak positions were
analyzed as well as the bandwidth and the relative intensity of the peaks. This section describes
the primary characteristics of the spectra examined in this study and how these characteristics
were analyzed to compare spectra between strands with different histories of environmental
exposure associated with the aging processes used.
The position of peaks within the Raman spectra was determined by Lorentzian curve fitting, using
a best-fit curve with a Lorentzian fitting function. A Lorentzian fitting function is a continuous
probability density function that is commonly used in spectroscopy for its ability to manipulate line
shapes with scaled parameters. The process identifies the wavenumber of each peak in the
spectrum that can be separated from the background noise, which is always present at some

13
level. For Kevlar, there are between 8 and 16 individual peaks that can be identified in the range
from 600 to 1800 cm-1, depending on the wavelength of the incident laser. Some of these peaks
are quite low in intensity and therefore more difficult to locate on the spectrum consistently. To
evaluate the shifting of peaks, the peak positions, i.e. absolute wavenumbers, were normalized
by comparing the position of individual peaks with the peak located at ~1613 cm-1 within a
particular spectrum. Since each Raman peak stems from a different vibrational mode in the
polymer, if a defect is present in the polymer chain, certain vibrational modes may be effected
more than others. The normalized peak positions were calculated as follows:
1613kkk ii −=Δ
Where:
ik = Wavenumber of peak i, cm-1
ikΔ = Shifting peak ik relative to the 1613 peak, cm-1
1613k = Wavenumber of the ~1613 peak, cm-1
The position of the ~1613 cm-1 peak can vary slightly from one spectrum to another, particularly
when the instrument is recalibrated between measurements. In this case, the entire spectrum
may be shifted, such that the absolute position of a particular peak is inadequate for analysis.
The normalization of peak positions to the ~1613 cm-1 peak within the spectrum allowed for the
quantitative comparison of position.
A second characteristic of the spectra analyzed was the full width, half maximum (FWHM) of
individual peaks within the spectrum. For this measurement, the width of the fitting function is
determined at ½ of the maximum intensity of the peak. This value is then normalized by
determining the ratio of the individual peak’s FHWM to the FHWM of the ~1278 cm-1 peak for that
spectrum:
1278FWHM
FWHM ii =η

14
Where:
iη = FWHM ratio (dimensionless)
iFWHM = FWHM of peak i, cm-1
1278FWHM = FWHM of ~1278 cm-1 peak, cm-1
Finally, the relative intensity of the individual peaks was analyzed. Each intensity value was
determined then normalized by calculating the ratio of the individual peak’s intensity to the
intensity of the 1278 cm-1 peak for that spectrum:
1278II i
i =χ
Where:
iχ = Intensity ratio (dimensionless)
iI = Intensity of peak i, cm-1
1278I = Intensity for ~1278 cm-1 peak, cm-1
Mechanical Testing
In addition to evaluating the effects elevated temperature and stress, the effect of applied loads
on the Raman peak position was evaluated. Virgin Kevlar strands were placed in a miniature load
frame with a cylindrical load cell designed to fit on the Raman microscope stage. Individual virgin
Kevlar strands were mounted to tabs using a quick-setting epoxy to enable gripping of the strands
by aluminum grips. Loading was applied in a staircase fashion (10 lbs steps) until failure. Raman
spectra were obtained from the Kevlar strand at each load step using a 647 nm krypton laser with
the beam polarized parallel to the fiber axis for all measurements.

15
Results
Comparison of Spectra
Figure 9a indicates the Raman spectra at 647, 752 and 1064 nm, and Figure 9b indicates the
Raman response at 488 nm for virgin Kevlar strands. The latter illustrates the increased
background noise associated with fluorescence and specimen heating at shorter wavelengths
such as the 488 nm laser. As shown in the figure, clear Raman spectra can be obtained at each
incident wavelength, although the spectrum is saturated with fluorescence for the 488 nm laser.
Significant problems arise in obtaining a Raman spectrum due to fluorescence for most polymers
when using a 488 nm argon laser. Fluorescence is a luminescence in which the molecular
absorption of a photon triggers the emission of another photon with a longer wavelength. This
photon is then shifted relative to the incident laser light, and appears at the same wavelengths as
the Raman scattered photons. This change in energy between the absorbed photon and
emitted photon transforms as molecular vibrations or heat. It is possible to avoid fluorescence
problems by using a longer wavelength incident laser that sets the excitation frequency below the
fluorescent envelope[15]. In this study, incident laser wavelength of 647, 752 and 1064 nm were
used and found to successfully avoid these fluorescence effects.
Analytical peaks were previously calculated for Kevlar. Penn and Milanovich [16] used Raman
spectra of model monomeric compounds and known structure-absorption correlations to obtain
Raman band assignments for Kevlar. Kim et al. [17] used two model compounds to illustrate the
different environments associated with two different benzene ring and amide groups of the
chemical repeat unit in Kevlar. These models were used to calculate all vibrational modes of
Kevlar using vibrational spectroscopy. The Raman band assignments by Penn and Milanovich
correlated well with calculated values of Kim et al. The assignments determined by Penn and
Milanovich and Kim et al. are shown in Table 2.

16
Spectra obtained were compared to the analytical models in the literature to evaluate the
effectiveness of the experimental processes, and identify any difference between the predicted
peaks and those found experimentally. In general, there was good agreement between the
experimental spectra and the predicted spectra. As shown in Table 2, experimental peak values
could be related to 13 out of 14 of Penn and Milanovich analytical peaks, and 14 out of 15 for Kim
et al. analytical peaks using an incident laser wavelength of 752 nm. Using the FT Raman system
with an incident laser wavelength of 1064 nm, all theoretically predicted peaks could be identified.
There was slightly less agreement using an incident wavelength of 647 nm, finding 13 out 14
peaks predicted by Penn and Milanovich and 13 out 15 of the peaks predicted by Kim et al. It
appears that the 752 nm laser has a lower S/N ratio when compared to the 647 nm and 1064 nm
lasers. There was significantly less agreement to the literature with an incident laser of 488 nm
due to the fluorescence that saturates the spectrum. For shorter wavelengths, small peaks are
more difficult to identify and may be lost in the background noise evident in Figure 9b, and as a
result these peaks are not identified. It is interesting to note a peak was found at ~915 cm-1 using
the 647, 752 and 1064 nm lasers, but was absent in the literature. This peak was found in the
Kevlar yarn as well as strand, eliminating the possibility that this is a resin effect. This peak was
not identified in using an incident wavelength of 488 nm. This ~915 cm-1 peak was relatively low
in intensity, and is likely not apparent due to the low S/N ratio using the short wavelength laser.
Effects of Aging
Constant stress and elevated temperatures were used to “age” the Kevlar 49 specimens.
Incident lasers used to detect aging effects were at 647 nm and 1064 nm. The 752 nm laser was
not used for the investigation of aging effects due to the low S/N ratio as seen in Figure 9a.
Shifting of the peaks within the spectrum can be expected as a result of strain on the Kevlar fibers
[6, 8-13]. For the aged specimens studied, which were previously stressed then tested without
externally applied load, no significant peak shifting was detected relative to the ~1613 cm-1 peak.

17
It has been found that there are variations in the locations of peaks when using different
wavelengths of incident light, but this is believed to be a measurement artifact.
The full width at half maxima (FWHM) was analyzed for each major Raman band for the virgin,
creep tested, SIM, and the fleet leader samples. Figure 10 shows the FWHM ratio, iη , on the
vertical axis for each of the individual bands analyzed using the 647 nm incident laser for the
creep specimens compared to the virgin specimen. From the figure, each data point represents
an average of 3-5 measurements and illustrates the results for each of the Raman bands that
were analyzed. Particular attention is given to the ~1613 cm-1 band that is related to the ring
vibrations of the C-C phenyl ring and provides the backbone of the Kevlar microstructure. The
FWHM ratio for the creep and fleet leader specimens are not consistent for most of the bands,
with the exception of the 1613 and 1649 cm-1 band, in the spectrum relative to the virgin, unaged
specimen tested. Figure 11 shows a closer view of the ~1613 cm-1 band with the range of FWHM
values for the virgin specimen and the creep_2F12j specimen. The high and low or “range”
values are each single measurements of the virgin specimen and one random creep tested
specimen. The average FWHM ratios for other creep specimens are also included in Figure 11.
In contrast to the creep and fleet leader samples, the FWHM of the SIM samples appeared to
slightly decrease. This decrease may be due in part difficulties in measuring failed samples that
have a low thickness relative to virgin samples used for comparison. These samples were also
fractured during SIM testing, resulting in a frayed appearance. Proper orientation within the test
apparatus was difficult to achieve.
Intensity analysis was performed for virgin, creep, SIM and the fleet leader samples using a 647
nm laser and a FT setup with a 1064 nm laser. The relative intensity of each band was compared
with the relative intensity of bands from virgin specimens. Figure 12 shows the comparison of the
relative intensities, iχ , using the incident laser of the 647 nm for the fleet leader and virgin
specimens. The results shown in this figure indicate that there was a reduction in the relative

18
intensity of the 1613 cm-1 band. Figure 13 shows a closer view of the ~1613 cm-1 band with the
range of intensity values for the virgin specimen and the SN 032a fleet leader specimen. The
high and low or “range” values are each single measurements of the virgin specimen and one
random fleet leader specimen. In addition, the average FWHM ratios for other fleet leader
specimens are included in Figure 13. For the balance of the bands analyzed, there were mixed
results when compared with the virgin specimens. The effect appears more pronounced for
specimens SN032a and SN032b, which were sectioned from a tank that had been aged at an
elevated temperature of 80°C, up to 16.01613 ≈χ for one of the specimens. Significant reduction
was observed for the SIM and creep specimens as well.
Effects of Applied Load
The entire spectrum between 1100 and 1700 cm-1 shifted to lower wavenumbers under applied
tensile stress for a virgin Kevlar composite strand. The 1613 cm-1 band showed the highest
sensitivity with applied strain which is in direct agreement with the literature [14, 22]. The 1613
cm-1 band decreased ~1.5 cm-1 per 10 lbs of force. Figure 14 shows the decrease in
wavenumber of the 1613 cm-1 band with applied loading. A line of best-fit has been inserted into
the figure. The composite strand failed at ~59 lbs of applied tensile force. Another Kevlar
composite strand was loaded and unloaded in a staircase fashion. When the strand was
completely unloaded, the peak resorted back to the 1613 cm-1 position, concluding that the Kevlar
fibers behaved elastically under the applied loading.
Conclusions and Discussion
The goal of this study was to develop and understand the Raman spectrum of Kevlar materials to
provide a foundation for the development of NDE technologies based on laser light interaction
with the Kevlar polymer. This has been examined by studying Raman spectra of four incident
laser frequencies, correct Raman testing procedures, and effects of aging at increased
temperature and stress of the Raman spectra of Kevlar composite materials. The incident laser

19
frequency that provided the most suitable Raman spectra for analysis was the 647 nm laser. The
488 nm laser produced spectra that were saturated with fluorescence. At this frequency the
Raman peaks are not well-defined due to the impossibility of removing fluorescence; therefore
certain peaks could not be detected. For example, the 632, 698, 734 and 915 cm-1 peaks were
not detected at the 488 nm incident laser. The 752 nm laser experienced low fluorescence
effects but had a low S/N ratio. This problem may arise from the mechanical alignment in the
spectrometer. The 1064 nm laser uses a Fourier transform system that requires a small sample
size which is difficult to manipulate e.g. stress or strain. Another disadvantage using a long
wavelength laser is the decreasing sensitivity of the Raman scattering effect. Changes in the
spectra become less sensitive due to little reaction in the large cross section of the incident light
compared to the small cross section of Raman scattering [15].
Testing reveals that it would be prudent to perform Raman measurements with the incident light
polarized parallel to the polymer axis and the power kept under 10 mW. The laser was polarized
parallel to the polymer axis to create the strongest Raman scattering effect, and the power was
kept under 10 mW to ensure no damage to the Kevlar specimen.
It has been observed that aged strand materials from fleet leader, SIM and creep specimens
have decreased normalized intensity ratios ( iη ) for the 1613 cm-1 band when compared to
unaged, virgin specimens. It has also been observed that the FWHM ratios ( iχ ) have increased
for the fleet leader and creep specimens when compared with virgin strand specimens. In other
words, the peaks are generally broader and of lower intensity than for virgin, undamaged
specimens. Increases in FWHM may be attributed to defects in the fiber or defects being created
in the fiber under stress [6]. On a molecular level, rod-like crystallites within the Kevlar distribute
loading through hydrogen bonds between adjacent crystallites. Damage to crystallites due to
aging phenomena may result in a redistribution of stresses on a molecular level, as damaged
crystallites shed loading. As a result, variations in stresses between crystallites exist, leading to a
broader sprectrum of scattering.

20
It was also observed that peak position was invariant as a result of exposure to increased stress
and temperature. This is significant in that there is substantial literature to suggest that peak
shifting as a result of applied strain can be used experimentally to determine loading of Kevlar
fibers [6, 9, 12]. The observation that these peak positions are unaffected by this “aging”
suggests that the relationship between peak position and applied strain could be applied without
regard to the “age” of the material. Therefore, evaluation of peak position could form one
component of an NDE technique that compared the applied loads in-situ with loading estimated
by theoretical models, to locate areas of stress concentration or to analyze the effects of creep.
As reported, the entire spectrum shifted due to applied load.
Raman spectroscopy has been successfully applied to Kevlar composite materials to gain an
understanding of how the spectra changes with different experimental conditions. A foundation
has been created for further investigation into environmental degradation of Kevlar materials
using Raman spectroscopy.
References
1. Gerstle, F.P. Prediction of Long-term Failure in Kevlar 49 Composites. in SAND-81-2072C; CONF-820340-2. 1982. Sandia National Laboratories - Albuquerque, NM.
2. Mertz, D.R., Chajes, M.J., Gillespie, J.W., Kukich, D.S., Sabol, S.A., Hawkins, N.M., Aquino, W., Deen, T.B., Application of Fiber Reinforced Polymer Composites to the Highway Infrastructure, in NCHRP Report 503. 2003: Wasington D.C.
3. Washer, G., Allempalli, S. NDE Technologies for Condition Assessment of FRP Retrofits. in ASNT Fall Conference. 2005. Columbus, OH.
4. Duke, J.C., Horne, M.R. NDE of Polymeric Composite Material Bridge Components. in The International Society for Optical Engineering. 1998.
5. Karbhari, V.M., Chin, J.W., Hunston, D., Benmokrane, B., Juska, T., Morgan, R., Lesko, J.J., Sorathia, U., Reynaud, D., Durability Gap Analysis for Fiber-Reinforced Polymer Composites in Civil Infrastructure. Journal of Composites for Construction, 2003(August): p. 238-247.
6. Prasad, K., Grubb, D.T., Deformation Behavior of Kevlar Fibers Studied by Raman Spectroscopy. Journal of Applied Polymer Science, 1990. 41: p. 2189-2198.
7. Andrews, M.C., Bannister, D.J., Young, R.J., The Interfacial Properties of Aramid/Epoxy Model Composites. Journal of Materials Science, 1996. 31: p. 3893-3913.

21
8. Chang, C., Hsu, S. L., An Analysis of Strain-Induced Frequency Changes in Poly (p-phenylene terephthalamide) Single Fibers. Macromolecules, 1990. 23: p. 1484-1486.
9. Galiotis, C., Robinson, I.M., Young, R.J., Smith, B., Batchelder, D. N., Strain Dependence of the Raman Frequencies of a Kevlar 49 Fiber. Polymer Communications, 1985. 26: p. 354-355.
10. Kawagoe, M., Hashimoto, S., Nomiya, M., Morita, M., Qiu, J., Mizuno, W., Kitano, H., Effect of Water Absorption and Desorption on the Inerfacial Degradation in a Model Composite of an Aramid Fiber and Unsaturated Polyester Evaluated by Raman and FT Infra-red Microscopy. Journal of Raman Spectroscopy, 1999. 30: p. 913-918.
11. Parthenios, J., Katerelos, D. G., Psarras, G.C., Galiotis, C., Aramid fibers; a multifunctional sensor for monitoring stress/strain fields and damage development in composite materials. Engineering Fracture Mechanics, 2002. 69: p. 1067-1087.
12. Schadler, L.S., Galiotis, C., Fundamentals and Applications of Micro Raman Spectroscopy to Strain Measurements in Fiber Reinforced Composites. International Materials Reviews, 1995. 40(3): p. 116-133.
13. Young, R.J., Day, R.J., Zakikhani, The Structure and Deformation Behavior of poly (p-phenylene benzobisoxazole) Fibers. 1990: p. 127-136.
14. Ferraro, J.R., Nakamoto, K., Introductory Raman Spectroscopy. 1994, San Diego: Academic Press, Inc.
15. Koenig, J.L., Spectroscopy of Polymers. Koenig, J.L. 1992, Washington, DC: ACS Professional Reference Book.
16. Penn, L., Milanovich, F., Raman Spectroscopy of Kevlar 49 Fiber. Polymer, 1979. 20(1): p. 31-36.
17. Kim, P.K., Chang, C., Hsu, S.L., Normal Vibrational Analysis of a Rigid Rod Polymer: poly(p-phenylene terephthalamide). Polymer, 1986. 27(1): p. 34-46.
18. Stuart, B.H., A Fourier Transform Raman Study of Water Sorption by Kevlar-49. Polymer Bulletin, 1995. 35: p. 727-733.
19. Yang, H.H., Kevlar Aramid Fiber. 1993, New York: Wiley. 20. Alwis, K.G.N.C., Burgoyne, C. J. Stepped Isothermal Method for Creep Rupture Studies
of Aramid Fibers. in ACI Special Publications. 2005. 21. Chase, D.B., Rabolt, J. F., ed. Fourier Transform Raman Spectroscopy: From Concept to
Experiment. Fourier Transform Raman Spectroscopy, ed. D.B. Chase, Rabolt, J. F. 1994, Academic Press Inc.: San Diego.
22. Hallmark, V.M., ed. FT - Raman Spectroscopy as a Structural Probe of Polymers and Other Long-Chain Organic Molecules. Fourier Transform Raman Spectroscopy, ed. D.B. Chase, Rabolt, J. F. 1994, Academic Press, Inc.: San Diego.
23. Galiotis, C., Robinson, I.M., Young, R.J., Batchelder, D. N., ed. Strain Measurements in Aramid Fibers and Composites Using Raman Spectroscopy. Engineering Applications of New Composites. 1988.
24. Young, R.J., Day, R.J., Lu, D., Raman Spectroscopy of Kevlar Fibers during Deformation - Caveat Emptor. Polymer International, 1991. 24: p. 71-76.

Table 1. Raman scattering analyses of Kevlar have determined a series of well defined peaks ranging from 600 to 1700 cm-1 as shown in Table 1. Table 2. List of theoretical peaks compared to the experimental peaks.
Wavenumber (cm-1) Assignment 630, 732, 786 Ring vibrations 845 C-H out-of-plane bending 863 Ring vibrations 1103 C-H in-plane bending 1181, 1277, 1327, 1514 C-C ring stretching 1318 C-H in-plane bending 1569 Amide II (60% N-H bending; 40% C-N stretching 1610 C-C ring stretching
1648 Amide I (80% C=O stretching; 10% C-N stretching 10% N-H bending)
RAMAN PEAKS (cm-1)
TEST TYPE
Theoretical Kevlar yarn Kevlar strand Penn and
Milanovich Peaks
Kim et al. Peaks (647 nm) (488 nm) (647 nm) (752 nm) (1064 nm)
632 637 631 630 630 698 694 700 697 695 734 725 731 732 732 789 773 790 784 789 787 787
- 853 847 845 - - 914 915 913 918
1104 1106 1105 1105 1105 1108 1187 1187 1184 1186 1184 1185 1186 1192 1188 1194 1279 1283 1280 1278 1280 1278 1283 1331 1332 1331 1331 1330 1329 1332 1409 1400 1413 1411 1415 1417 1518 1516 1519 1520 1518 1517 1521 1570 1567 1572 1577 1571 1570 1574 1615 1615 1613 1612 1613 1612 1615 1649 1654 1649 1649 1649 1649 1651

Figure 1. Raman scattered photons are shifted from the incident energy due to change from the vibrational energy of the molecule. Figure 2. Schematic diagram of a Raman spectrometer system. Figure 3. Raman spectrum of Kevlar illustrating the wavenumber conversion process. Figure 4. The chemical structure of Kevlar. Figure 5. Raman spectrum of Kevlar. The vibrational modes of the 1613 and 1651 cm-1 bands are indicated. Figure 6. Two views of a Kevlar strand rotated at different angles under the Raman microscope. Figure 7. Differences in appearance of the spectrum when the laser is polarized parallel to the fiber axis and perpendicular to the fiber axis. Figure 8. Raman spectrum of Kevlar at different power levels. Figure 9. Raman spectra of Kevlar using an incident laser of (a) 647, 752 and 1064 nm and (b) 488 nm. Figure 10. The FWHM ratio, iη , using the 647 nm incident laser for the creep specimens compared to a virgin specimen. Figure 11. Average values compared with the range for FWHM ratios of creep specimens compared to a virgin specimen. Figure 12. Comparison of the relative intensities, iχ , using the incident laser of the 647 nm for the fleet leader and virgin specimens. Figure 13. Average values compared with the range for intensity ratios of fleet leader specimens compared to a virgin specimen. Figure 14. Decrease in wavenumber of the 1613 cm-1 band with applied tensile stress. A line of
best-fit has been inserted into the figure.

WAVENUMBER (ABSOLUTE)
λ WAVELENGTH
ν (cm-1) RAMAN SHIFTS
REL
ATI
VE IN
TEN
SITY
(cou
nts/
sec)
RAYLEIGH
oν STOKES RAMAN
1ννν −= or
15500
647.1 nm
13900
720.0 nm
0 1610
ν (cm-1)
(a)
40000
50000
60000
70000
80000
90000
100000
110000
120000
600 800 1000 1200 1400 1600 1800
WAVENUMBER (cm-1)
RE
LA
TIV
E IN
TE
NSI
TY
(cou
nts/
sec)

0
50000
100000
150000
200000
250000
300000
350000
600 800 1000 1200 1400 1600 1800WAVENUMBER (cm-1)
REL
ATI
VE IN
TEN
SITY
(cou
nts/
sec)
90°
0°

0
20000
40000
60000
80000
100000
120000
140000
160000
180000
200000
600 800 1000 1200 1400 1600 1800WAVENUMBER (cm-1)
REL
ATI
VE IN
TEN
SITY
7mW
5mW
3mW<1mW
0
200000
400000
600000
800000
1000000
1200000
1400000
1600000
1800000
2000000
600 800 1000 1200 1400 1600 1800WAVENUMBER (cm-1)
REL
ATI
VE IN
TEN
SITY
0
10000
20000
30000
40000
50000
60000
70000
80000
1064 nm
647 nm
752 nm
(a)

0
50000
100000
150000
200000
250000
300000
600 800 1000 1200 1400 1600 1800WAVENUMBER (cm-1)
REL
ATI
VE IN
TEN
SITY
488 nm laser
(b)

0.5
0.6
0.7
0.8
0.9
1
1.1
1.2
1.3
1.4
1.5
1300 1350 1400 1450 1500 1550 1600 1650 1700
WAVENUMBER (cm-1)
FWH
M R
AT
IOVIRGINcreep_2F1jcreep_2F9jcreep_2F10jcreep_2F11jcreep_2F12j
1613 cm-1 band
0.7
0.8
0.9
1
1.1
1.2
1.3
1.4
1550 1570 1590 1610 1630 1650
WAVENUMBER (cm-1)
FWH
M R
AT
IO
VIRGINcreep_2F1jcreep_2F9jcreep_2F10jcreep_2F11jcreep_2F12jVIRGIN_highVIRGIN_lowcreep_2F12j_highcreep_2F12j_low
1613 cm-1 band
VIRGIN
creep_2F12j

0
0.2
0.4
0.6
0.8
1
1.2
1.4
1.6
1.8
2
1300 1350 1400 1450 1500 1550 1600 1650 1700WAVENUMBER (cm-1)
INT
EN
SIT
Y R
AT
IO
VIRGINSN007aSN007bSN032aSN032b 1613 cm-1 band
1
1.1
1.2
1.3
1.4
1.5
1.6
1.7
1.8
1.9
2
1550 1570 1590 1610 1630 1650WAVENUMBER (cm-1)
INT
EN
SIT
Y R
AT
IO
VIRGINSN007aSN007bSN032aSN032bVIRGIN_highVIRGIN_lowSN032a_highSN032a_low
1613 cm-1 band
VIRGIN
SN032a
y = -0.1472x + 1612.5
1604
1605
1606
1607
1608
1609
1610
1611
1612
1613
1614
0 10 20 30 40 50 60FORCE (lbs)
PEA
K P
OST
ION
(cm
-1)