KERN RIVER GAS TRANSMISSION COMPANY Wyoming Pipeline Authority Casper, Wyoming August 21, 2007 John...
19
KERN RIVER GAS TRANSMISSION COMPANY Wyoming Pipeline Authority Casper, Wyoming August 21, 2007 John Dushinske Vice President of Marketing & Regulatory Affairs
-
Upload
barbra-robertson -
Category
Documents
-
view
228 -
download
4
Transcript of KERN RIVER GAS TRANSMISSION COMPANY Wyoming Pipeline Authority Casper, Wyoming August 21, 2007 John...
KERN RIVER GAS TRANSMISSION
COMPANY
Wyoming Pipeline AuthorityCasper, WyomingAugust 21, 2007
John DushinskeVice President of Marketing & Regulatory Affairs
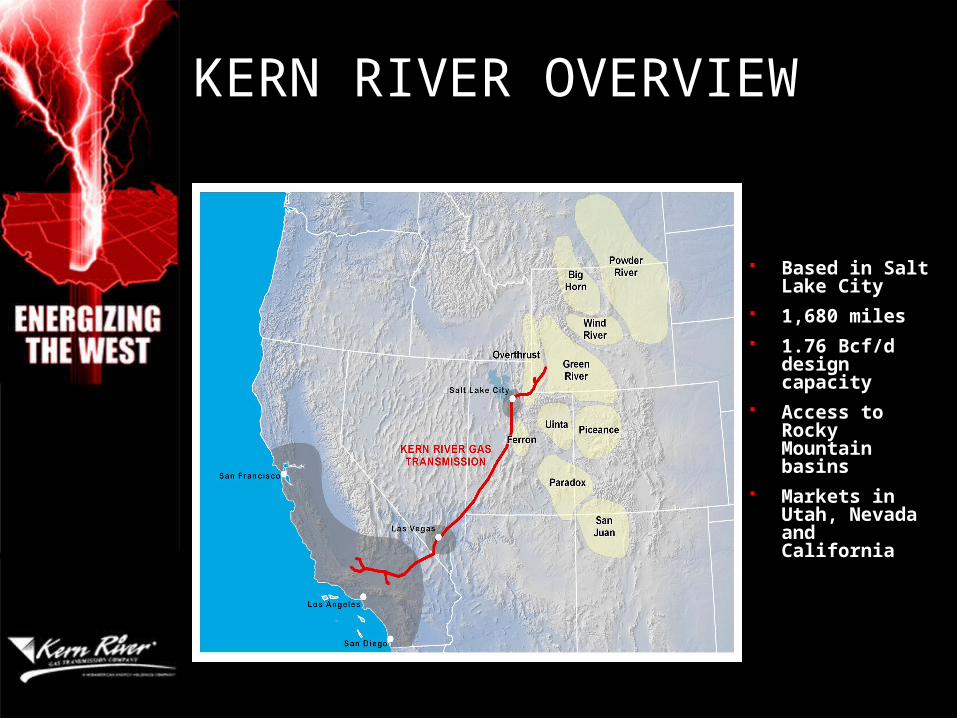
KERN RIVER OVERVIEW
Based in Salt Lake City
1,680 miles 1.76 Bcf/d
design capacity
Access to Rocky Mountain basins
Markets in Utah, Nevada and California
KERN RIVER SYSTEM
Kern River original build
In-service February 1992
724,500 Dth/d
California Action Plan / 2002 Expansion Projects
In-service July 2001/May 2002
124,500 Dth/d
Kern River 2003 Expansion Project
In-service May 2003
906,626 Dth/d
SYSTEM ACCESSIBILITYSystem design capacity is 1.76 Bcf/d
Average daily throughput in 2007 is 2.147 Bcf
Receipt point capacity is 5.45 Bcf/d
3 x system design capacity
2.5 Bcf/d of new receipt point capacity added since 2003 Expansion Project
Delivery point capacity is 7.33 Bcf/d
4 x system design capacity
1.4 Bcf/d of new delivery point capacity added since 2003 Expansion Project
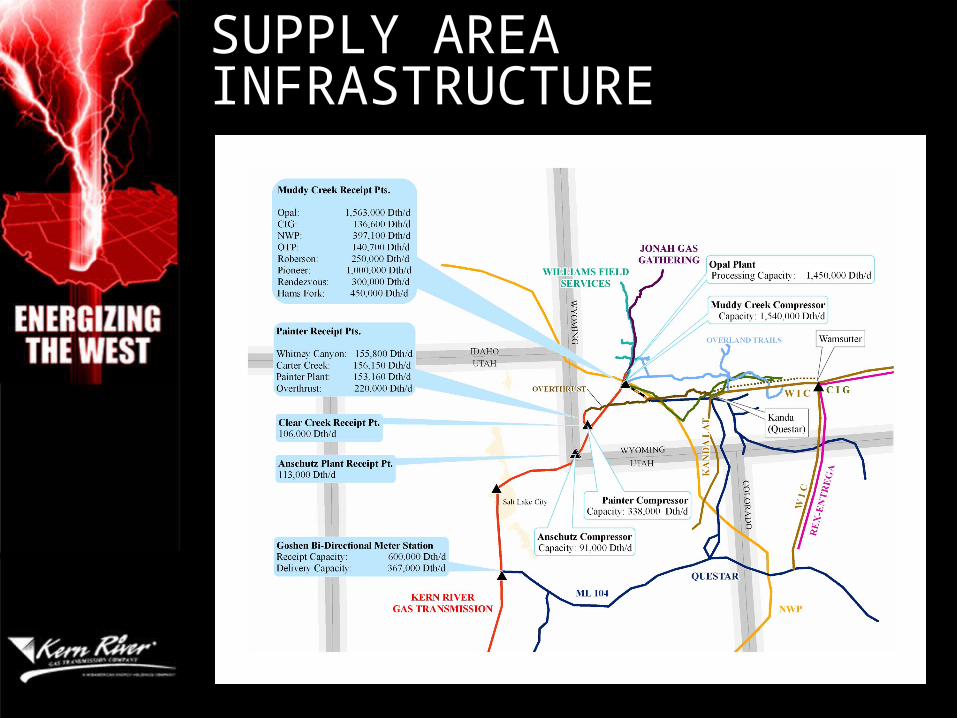
SUPPLY AREA INFRASTRUCTURE
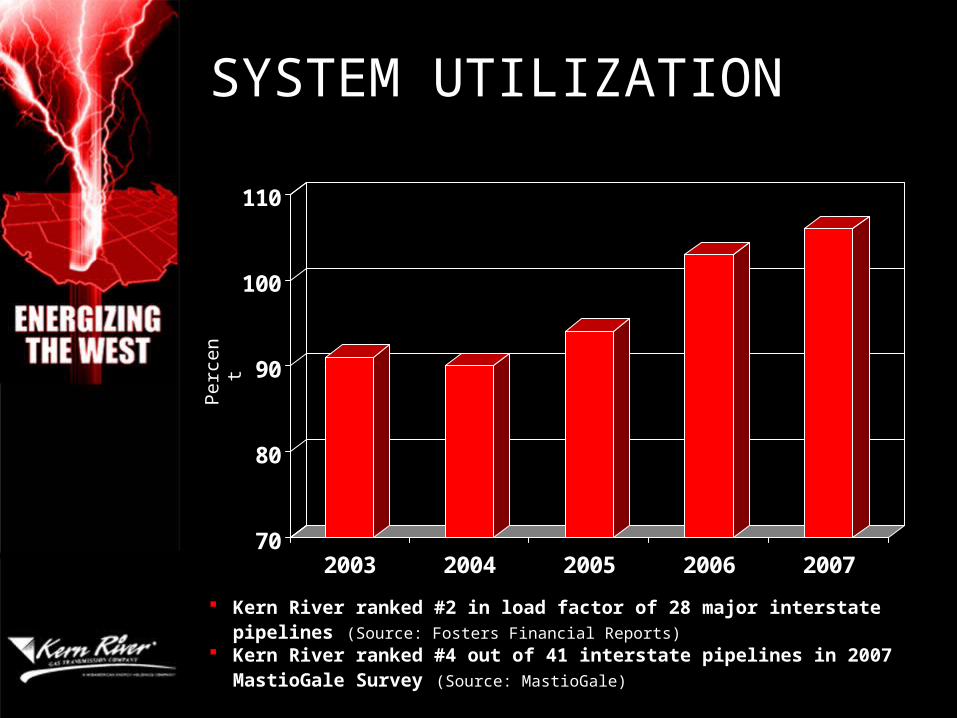
SYSTEM UTILIZATION
70
80
90
100
110
2003 2004 2005 2006 2007
Kern River ranked #2 in load factor of 28 major interstate pipelines (Source: Fosters Financial Reports)
Kern River ranked #4 out of 41 interstate pipelines in 2007 MastioGale Survey (Source: MastioGale)
Per
cen
t
KEY MARKETSPower Generation
Since 2001, 8,000 MW directly connected to Kern River
Peak load requirement of 1.55 Bcf/d
Service to another 18,000 MW behind local distribution companies
Peak load requirement of 3.4 Bcf/d
Local Distribution Companies
Kern River serves the Southern California Gas, Pacific Gas & Electric, and Southwest Gas natural gas utilities
Daily average requirement of 5.16 Bcf
KEY MARKETS cont.
Industrial
Kern River serves the enhanced oil recovery/cogeneration markets
Daily average requirement of .480 Bcf
Other Markets
Kern River serves the Phoenix market via El Paso’s Line 1903
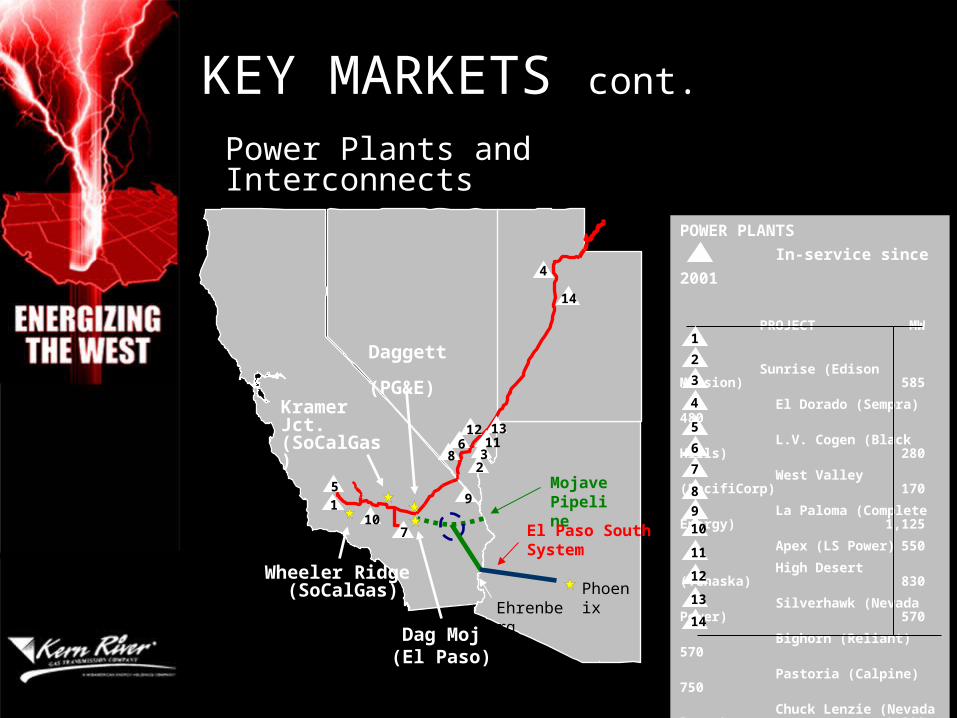
POWER PLANTS
In-service since 2001
PROJECT MW
Sunrise (Edison Mission) 585
El Dorado (Sempra) 480
L.V. Cogen (Black Hills) 280
West Valley (PacifiCorp) 170
La Paloma (Complete Energy) 1,125
Apex (LS Power) 550
High Desert (Tenaska) 830
Silverhawk (Nevada Power) 570
Bighorn (Reliant) 570
Pastoria (Calpine) 750
Chuck Lenzie (Nevada Power) 1,200
Harry Allen (Nevada Power) 160
NCA 1 & 2 (NV Cogen Ass.) 170
Lake Side (PacifiCorp) 535
TOTAL MW 7,975
1
2
3
4
7
8
9
5
6
12
11
10
13
14
Power Plants and Interconnects
KEY MARKETS cont.
Mojave Pipeline
EhrenbergPhoenix
El Paso South System
1
23
4
7
8
95
612
11
10
13
14
Kramer Jct. (SoCalGas)
Dag Moj(El Paso)
Wheeler Ridge (SoCalGas)
Daggett (PG&E)
2001 2006
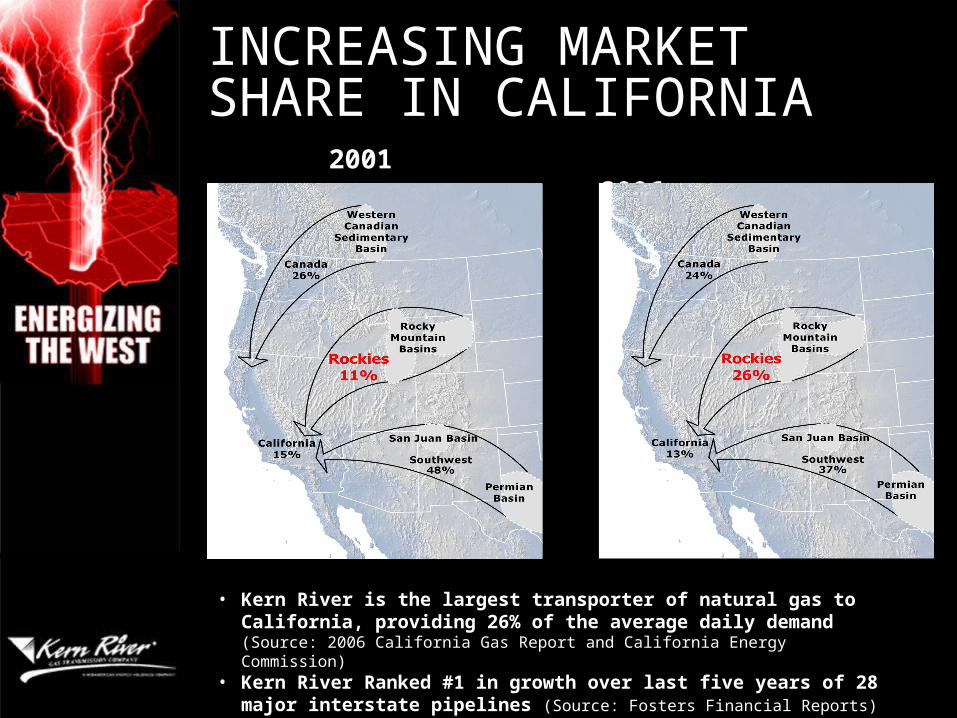
• Kern River is the largest transporter of natural gas to California, providing 26% of the average daily demand (Source: 2006 California Gas Report and California Energy Commission)
• Kern River Ranked #1 in growth over last five years of 28 major interstate pipelines (Source: Fosters Financial Reports)
INCREASING MARKET SHARE IN CALIFORNIA
2010 EXPANSION PROJECT
Market signals are now strong to proceed with an expansion
Rockies gas supply will exceed export capacity
Anticipate rolling-in costs and utilizing the 2003 expansion rates
MARKET ASSESSMENT
The expansion will be supported by:
Natural gas and electric utilities
Merchant power generators
Rocky Mountain natural gas producers
SIGNALS ARE STRONG
Core market demand is growing in states served by Kern River – 360,000 Dth/d by 2010
Markets seeking supply diversity
9,200 MW in development – 1.78 Bcf/d peak load
Power plants lacking firm transportation capacity. 2,500 MW – .420 Bcf/d peak load
Rocky Mountain production is projected to outpace export pipeline capacity
Limited availability of LNG supply
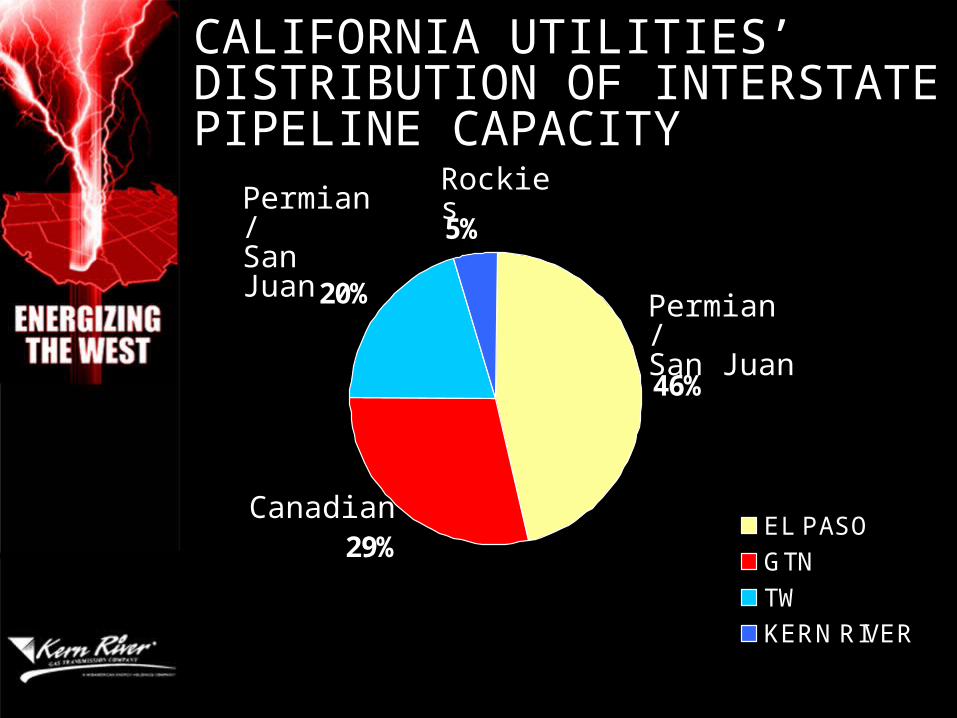
CALIFORNIA UTILITIES’ DISTRIBUTION OF INTERSTATE PIPELINE CAPACITY
46%
29%
20%
5%
EL PASO
GTN
TW
KERN RIVER
Rockies
Permian /San Juan
Permian /San Juan
Canadian
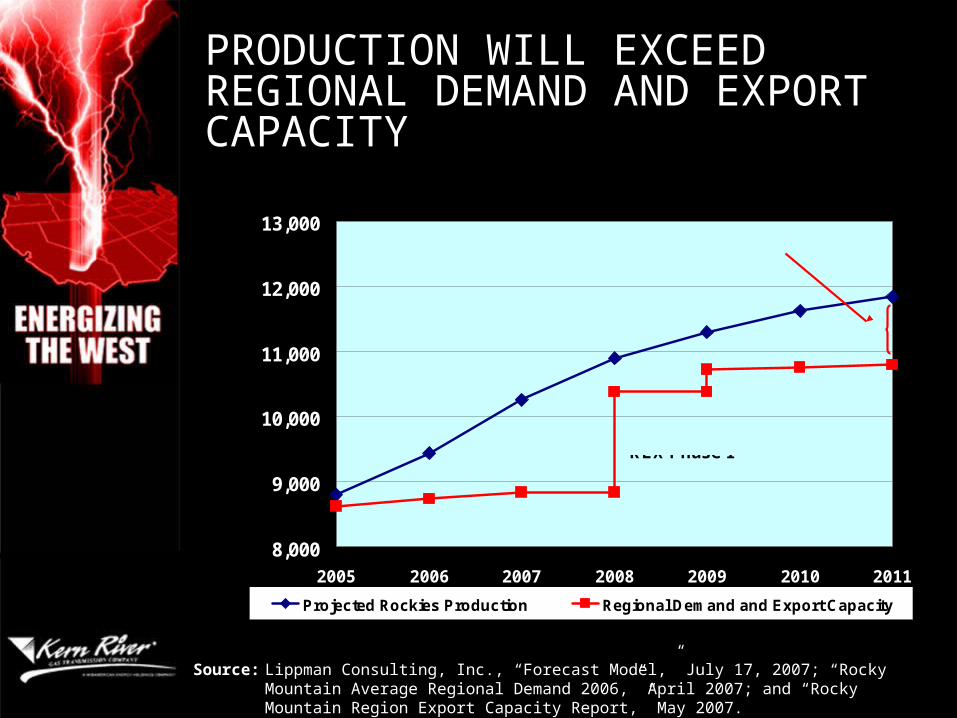
PRODUCTION WILL EXCEED REGIONAL DEMAND AND EXPORT CAPACITY
Source: Lippman Consulting, Inc., “Forecast Model,” July 17, 2007; “Rocky Mountain Average Regional Demand 2006,” April 2007; and “Rocky Mountain Region Export Capacity Report,” May 2007.
Rockies Production Forecast vs. Regional Demand / Export Capacity
8,000
9,000
10,000
11,000
12,000
13,000
2005 2006 2007 2008 2009 2010 2011
MD
th/d
Projected Rockies Production Regional Demand and Export Capacity
REX Phase I
REX Phase II
1,040 MDth/d Excess Production
MARKETING CAMPAIGN
Rationalize 94,000 Dth/d of available capacity and any unwanted shipper capacity
Solicit shipper support for 200-500 MMcf/d of incremental expansion capacity
Seek agency support for utilities to enter into long-term contracts
Finalize precedent agreements by mid-March 2008
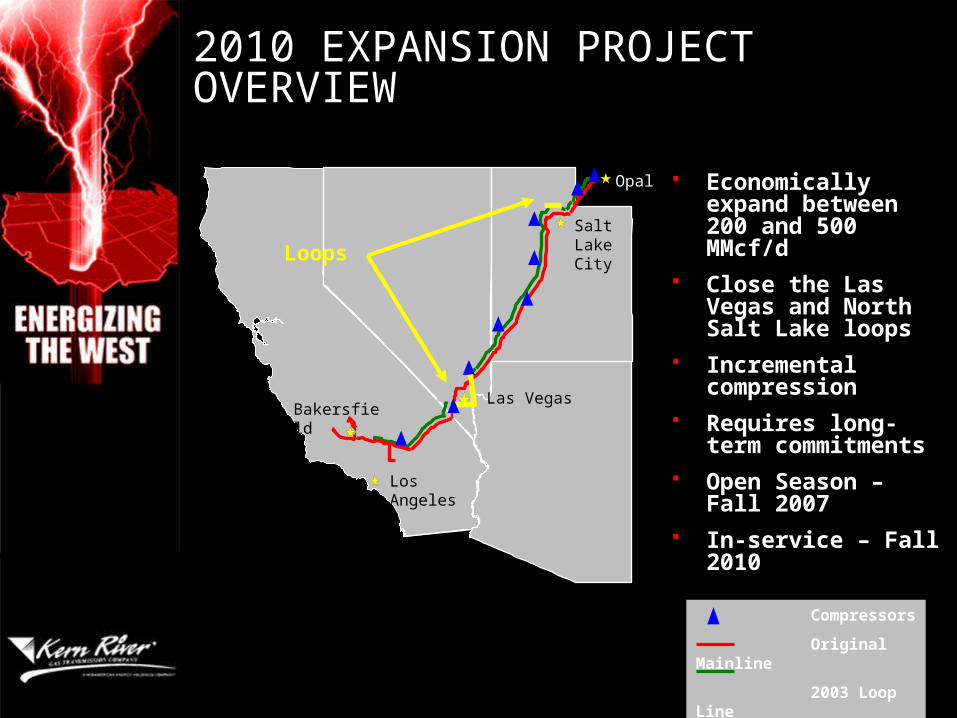
2010 EXPANSION PROJECT OVERVIEW
Economically expand between 200 and 500 MMcf/d
Close the Las Vegas and North Salt Lake loops
Incremental compression
Requires long-term commitments
Open Season – Fall 2007
In-service – Fall 2010
Compressors
Original Mainline
2003 Loop Line
SaltLakeCity
Opal
Las VegasBakersfield
Los Angeles
SaltLakeCity
Loops
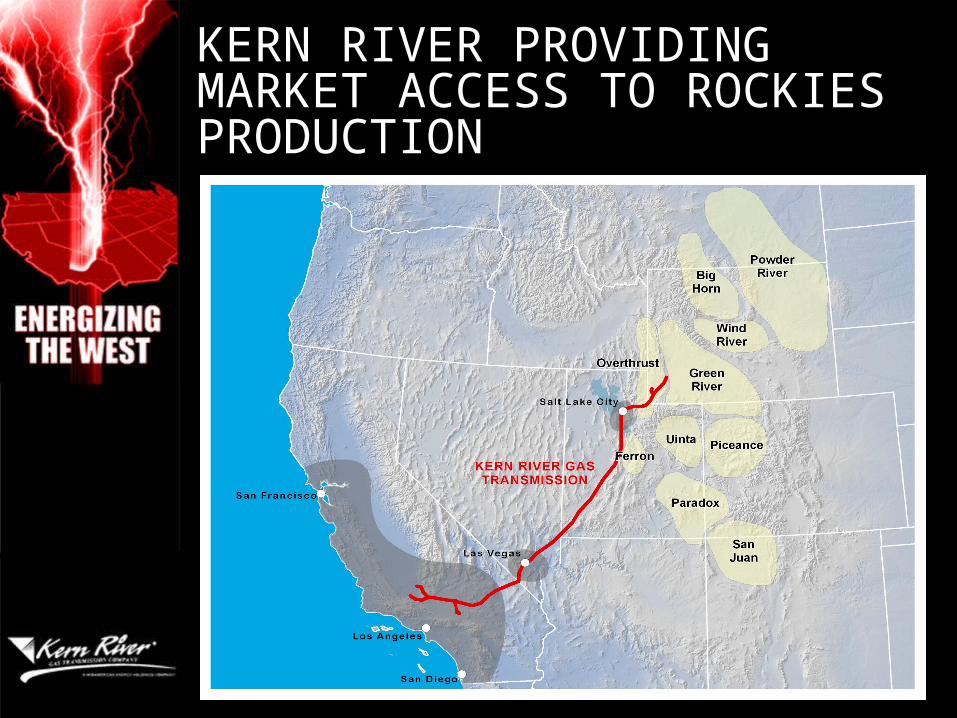
KERN RIVER PROVIDING MARKET ACCESS TO ROCKIES PRODUCTION

Questions?