Kern Community College District - Californiatrackprop30.ca.gov/AuditReport/CCD/2016/Kern FS Final...
90
Kern Community College District Bakersfield, California FINANCIAL STATEMENTS AND SUPPLEMENTARY INFORMATION WITH INDEPENDENT AUDITORS’ REPORTS June 30, 2016
-
Upload
phamkhuong -
Category
Documents
-
view
215 -
download
0
Transcript of Kern Community College District - Californiatrackprop30.ca.gov/AuditReport/CCD/2016/Kern FS Final...

Kern Community College District Bakersfield, California
FINANCIAL STATEMENTS AND SUPPLEMENTARY INFORMATION WITH INDEPENDENT AUDITORS’ REPORTS
June 30, 2016
Kern Community College District TABLE OF CONTENTS June 30, 2016
Page Number
Independent Auditors’ Report 1
FINANCIAL SECTION
Required Supplementary Information Management’s Discussion and Analysis 5
Basic Financial Statements Statement of Net Position 8 Statement of Revenues, Expenses, and Changes in Net Position 9 Statement of Cash Flows 10 Notes to the Financial Statements 12
Required Supplementary Information Schedule of Funding Progress for Other Postemployment Benefits 45 Schedule of District’s Proportionate Share of the Net Pension Liability –
California State Teachers’ Retirement System 46 Schedule of District Contributions ‐ California State Teachers’ Retirement System 47 Schedule of District’s Proportionate Share of the Net Pension Liability –
California Public Employees’ Retirement System 48 Schedule of District Contributions ‐ California Public Employees’ Retirement System 49 Note to the Required Supplementary Information 50
OTHER SUPPLEMENTARY INFORMATION SECTION
Organization Structure 52 Schedule of Workload Measures for State General Apportionment
Annual Attendance 53 Schedule of Expenditures of Federal Awards 54 Schedule of Expenditures of State Awards 55 Reconciliation of Annual Financial and Budget Report (CCFS‐311)
With Audited Financial Statements 56 Reconciliation of 50% Law Calculation 58 Reconciliation of Education Protection Account Expenditures 60 Combining Balance Sheet – District Funds
Included in the Reporting Entity 61 Combining Schedule of Revenues, Expenditures/Expenses,
and Changes in Fund Equity – District Funds Included in the Reporting Entity 66
Reconciliation of Fund Equity to Net Position 71 Reconciliation of Change in Fund Equity to Change in Net Position 72 Notes to the Supplementary Information 73
Kern Community College District TABLE OF CONTENTS June 30, 2016
Page Number
OTHER REPORTS SECTION
Independent Auditors’ Report on Internal Control Over Financial Reporting and on Compliance and Other Matters Based on an Audit of Financial Statements Performed in Accordance With Government Auditing Standards 76
Independent Auditors’ Report on Compliance For Each Major Federal Program and on Internal Control Over Compliance Required by the Uniform Guidance 78
Independent Auditors’ Report on State Compliance 81
FINDINGS AND QUESTIONED COSTS SECTION
Schedule of Findings and Questioned Costs 84 Corrective Action Plan 86 Summary Schedule of Prior Audit Findings 87
Page 1
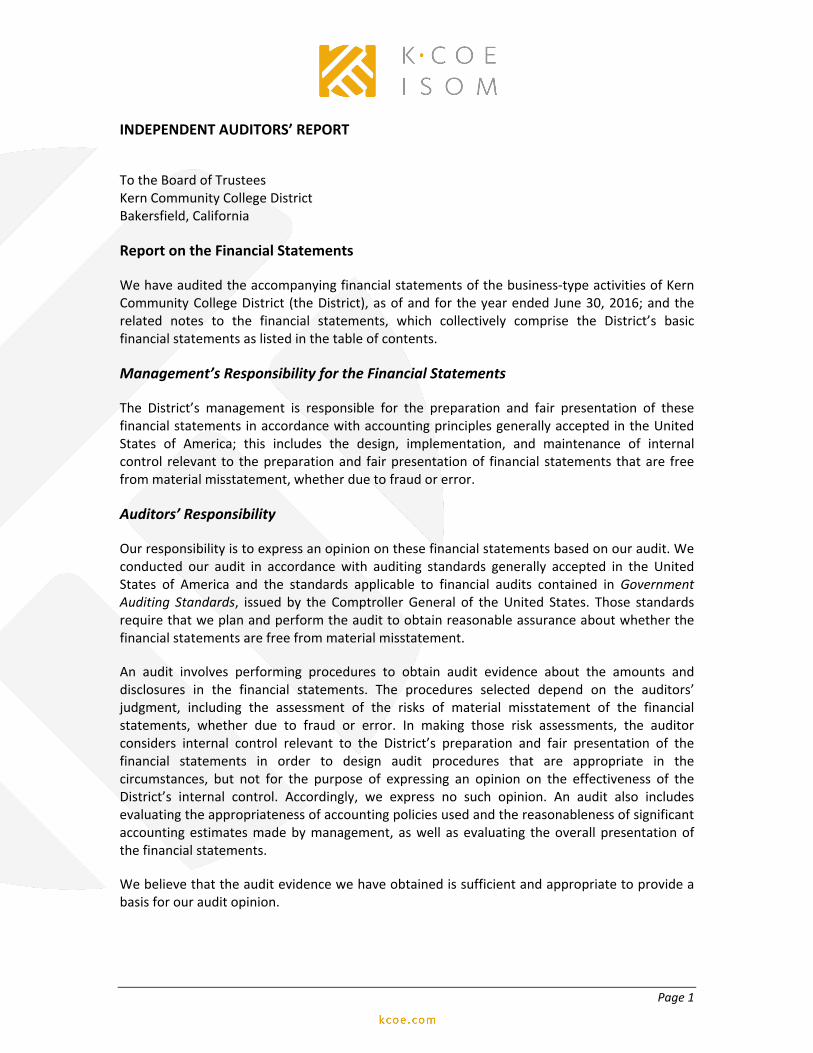
INDEPENDENT AUDITORS’ REPORT
To the Board of Trustees Kern Community College District Bakersfield, California
Report on the Financial Statements
We have audited the accompanying financial statements of the business‐type activities of Kern Community College District (the District), as of and for the year ended June 30, 2016; and the related notes to the financial statements, which collectively comprise the District’s basic financial statements as listed in the table of contents.
Management’s Responsibility for the Financial Statements
The District’s management is responsible for the preparation and fair presentation of these financial statements in accordance with accounting principles generally accepted in the United States of America; this includes the design, implementation, and maintenance of internal control relevant to the preparation and fair presentation of financial statements that are free from material misstatement, whether due to fraud or error.
Auditors’ Responsibility
Our responsibility is to express an opinion on these financial statements based on our audit. We conducted our audit in accordance with auditing standards generally accepted in the United States of America and the standards applicable to financial audits contained in Government Auditing Standards, issued by the Comptroller General of the United States. Those standards require that we plan and perform the audit to obtain reasonable assurance about whether the financial statements are free from material misstatement.
An audit involves performing procedures to obtain audit evidence about the amounts and disclosures in the financial statements. The procedures selected depend on the auditors’ judgment, including the assessment of the risks of material misstatement of the financial statements, whether due to fraud or error. In making those risk assessments, the auditor considers internal control relevant to the District’s preparation and fair presentation of the financial statements in order to design audit procedures that are appropriate in the circumstances, but not for the purpose of expressing an opinion on the effectiveness of the District’s internal control. Accordingly, we express no such opinion. An audit also includes evaluating the appropriateness of accounting policies used and the reasonableness of significant accounting estimates made by management, as well as evaluating the overall presentation of the financial statements.
We believe that the audit evidence we have obtained is sufficient and appropriate to provide a basis for our audit opinion.
Page 2
INDEPENDENT AUDITORS’ REPORT (Continued)
Opinion
In our opinion, the financial statements referred to above present fairly, in all material respects, the financial position of the business‐type activities of the District as of June 30, 2016; and the changes in financial position and cash flows thereof for the year then ended in accordance with accounting principles generally accepted in the United States of America.
Other Matters
Required Supplementary Information Accounting principles generally accepted in the United States of America require that the management’s discussion and analysis on pages 5 through 7 and the required supplementary information on pages 45 to 50 be presented to supplement the basic financial statements. Such information, although not a part of the basic financial statements, is required by the Governmental Accounting Standards Board who considers it to be an essential part of financial reporting for placing the basic financial statements in an appropriate operational, economic, or historical context. We have applied certain limited procedures to the required supplementary information in accordance with auditing standards generally accepted in the United States of America, which consisted of inquiries of management about the methods of preparing the information and comparing the information for consistency with management’s responses to our inquiries, the basic financial statements, and other knowledge we obtained during our audit of the basic financial statements. We do not express an opinion or provide any assurance on the information because the limited procedures do not provide us with sufficient evidence to express an opinion or provide any assurance.
Other Information Our audit was conducted for the purpose of forming an opinion on the financial statements that collectively comprise the District’s basic financial statements. The accompanying supplementary information on pages 53 to 74, and the schedule of expenditures of federal awards, as required by the Title 2 U.S. Code of Federal Regulations (CFR) Part 200, Uniform Administrative Requirements, Cost Principles, and Audit Requirements for Federal Awards, are presented for purposes of additional analysis and are not a required part of the basic financial statements.
Such information is the responsibility of management and was derived from, and relates directly to, the underlying accounting and other records used to prepare the basic financial statements. Such information has been subjected to the auditing procedures applied in the audit of the basic financial statements and certain additional procedures, including comparing and reconciling such information directly to the underlying accounting and other records used to prepare the basic financial statements or to the basic financial statements themselves, and other additional procedures in accordance with auditing standards generally accepted in the United States of America. In our opinion, the information on pages 53 to 74 and the schedule of expenditures of federal awards are fairly stated in all material respects in relation to the basic financial statements as a whole.
Page 3
INDEPENDENT AUDITORS’ REPORT (Continued)
The organization structure has not been subjected to the auditing procedures applied in the audit of the basic financial statements and, accordingly, we do not express an opinion or provide any assurance on it.
Other Reporting Required by Government Auditing Standards
In accordance with Government Auditing Standards, we have also issued our report dated December 23, 2016, on our consideration of the District’s internal control over financial reporting and on our tests of its compliance with certain provisions of laws, regulations, contracts and grant agreements, and other matters. The purpose of that report is to describe the scope of our testing of internal control over financial reporting and compliance and the results of that testing, and not to provide an opinion on internal control over financial reporting or on compliance. That report is an integral part of an audit performed in accordance with Government Auditing Standards in considering the District’s internal control over financial reporting and compliance. December 23, 2016 Redding, California
apotter
KCoe Isom

FINANCIAL SECTION
Kern Community College District MANAGEMENT’S DISCUSSION AND ANALYSIS
Page 5
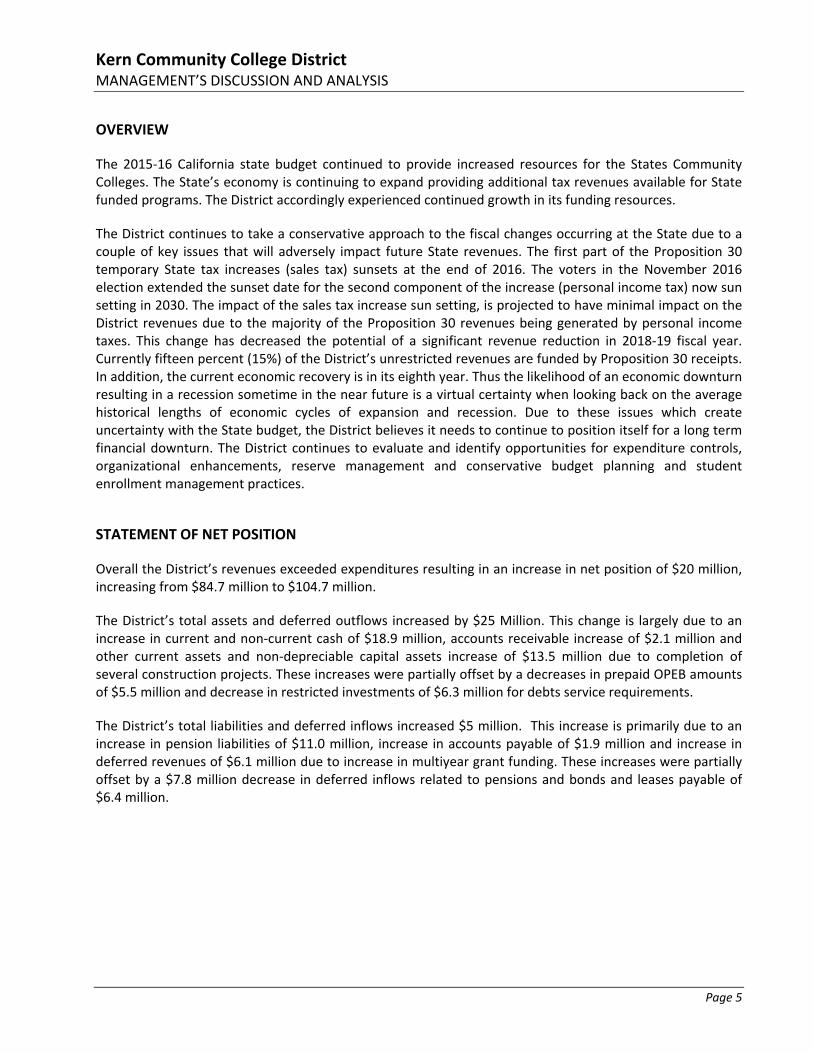
OVERVIEW
The 2015‐16 California state budget continued to provide increased resources for the States Community Colleges. The State’s economy is continuing to expand providing additional tax revenues available for State funded programs. The District accordingly experienced continued growth in its funding resources.
The District continues to take a conservative approach to the fiscal changes occurring at the State due to a couple of key issues that will adversely impact future State revenues. The first part of the Proposition 30 temporary State tax increases (sales tax) sunsets at the end of 2016. The voters in the November 2016 election extended the sunset date for the second component of the increase (personal income tax) now sun setting in 2030. The impact of the sales tax increase sun setting, is projected to have minimal impact on the District revenues due to the majority of the Proposition 30 revenues being generated by personal income taxes. This change has decreased the potential of a significant revenue reduction in 2018‐19 fiscal year. Currently fifteen percent (15%) of the District’s unrestricted revenues are funded by Proposition 30 receipts. In addition, the current economic recovery is in its eighth year. Thus the likelihood of an economic downturn resulting in a recession sometime in the near future is a virtual certainty when looking back on the average historical lengths of economic cycles of expansion and recession. Due to these issues which create uncertainty with the State budget, the District believes it needs to continue to position itself for a long term financial downturn. The District continues to evaluate and identify opportunities for expenditure controls, organizational enhancements, reserve management and conservative budget planning and student enrollment management practices.
STATEMENT OF NET POSITION
Overall the District’s revenues exceeded expenditures resulting in an increase in net position of $20 million, increasing from $84.7 million to $104.7 million.
The District’s total assets and deferred outflows increased by $25 Million. This change is largely due to an increase in current and non‐current cash of $18.9 million, accounts receivable increase of $2.1 million and other current assets and non‐depreciable capital assets increase of $13.5 million due to completion of several construction projects. These increases were partially offset by a decreases in prepaid OPEB amounts of $5.5 million and decrease in restricted investments of $6.3 million for debts service requirements.
The District’s total liabilities and deferred inflows increased $5 million. This increase is primarily due to an increase in pension liabilities of $11.0 million, increase in accounts payable of $1.9 million and increase in deferred revenues of $6.1 million due to increase in multiyear grant funding. These increases were partially offset by a $7.8 million decrease in deferred inflows related to pensions and bonds and leases payable of $6.4 million.
Kern Community College District MANAGEMENT’S DISCUSSION AND ANALYSIS (Continued)
Page 6
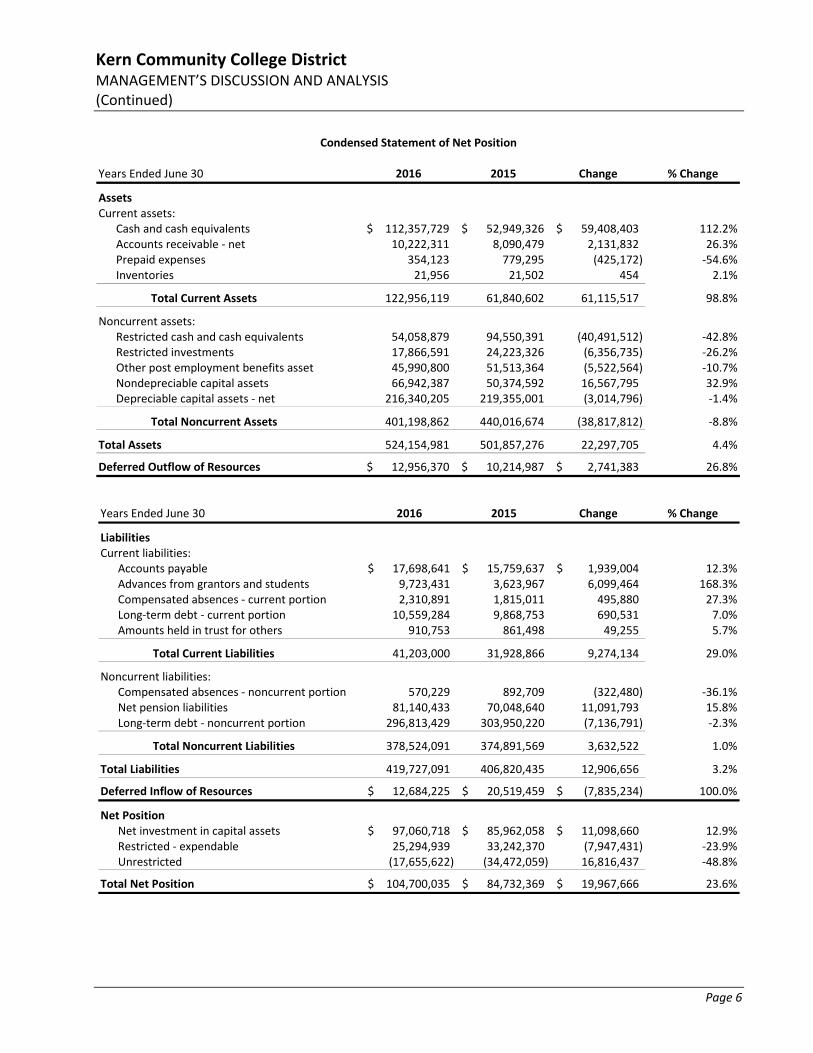
Years Ended June 30 2016 2015 Change % Change
Assets Current assets:
Cash and cash equivalents 112,357,729$ 52,949,326$ 59,408,403$ 112.2%Accounts receivable ‐ net 10,222,311 8,090,479 2,131,832 26.3%Prepaid expenses 354,123 779,295 (425,172) ‐54.6%Inventories 21,956 21,502 454 2.1%
Total Current Assets 122,956,119 61,840,602 61,115,517 98.8%
Noncurrent assets:Restricted cash and cash equivalents 54,058,879 94,550,391 (40,491,512) ‐42.8%Restricted investments 17,866,591 24,223,326 (6,356,735) ‐26.2%Other post employment benefits asset 45,990,800 51,513,364 (5,522,564) ‐10.7%Nondepreciable capital assets 66,942,387 50,374,592 16,567,795 32.9%Depreciable capital assets ‐ net 216,340,205 219,355,001 (3,014,796) ‐1.4%
Total Noncurrent Assets 401,198,862 440,016,674 (38,817,812) ‐8.8%
Total Assets 524,154,981 501,857,276 22,297,705 4.4%
Deferred Outflow of Resources 12,956,370$ 10,214,987$ 2,741,383$ 26.8%
Condensed Statement of Net Position
Years Ended June 30 2016 2015 Change % Change
LiabilitiesCurrent liabilities:
Accounts payable 17,698,641$ 15,759,637$ 1,939,004$ 12.3%Advances from grantors and students 9,723,431 3,623,967 6,099,464 168.3%Compensated absences ‐ current portion 2,310,891 1,815,011 495,880 27.3%Long‐term debt ‐ current portion 10,559,284 9,868,753 690,531 7.0%Amounts held in trust for others 910,753 861,498 49,255 5.7%
Total Current Liabilities 41,203,000 31,928,866 9,274,134 29.0%
Noncurrent liabilities:Compensated absences ‐ noncurrent portion 570,229 892,709 (322,480) ‐36.1%Net pension liabilities 81,140,433 70,048,640 11,091,793 15.8%Long‐term debt ‐ noncurrent portion 296,813,429 303,950,220 (7,136,791) ‐2.3%
Total Noncurrent Liabilities 378,524,091 374,891,569 3,632,522 1.0%
Total Liabilities 419,727,091 406,820,435 12,906,656 3.2%
Deferred Inflow of Resources 12,684,225$ 20,519,459$ (7,835,234)$ 100.0%
Net PositionNet investment in capital assets 97,060,718$ 85,962,058$ 11,098,660$ 12.9%Restricted ‐ expendable 25,294,939 33,242,370 (7,947,431) ‐23.9%Unrestricted (17,655,622) (34,472,059) 16,816,437 ‐48.8%
Total Net Position 104,700,035$ 84,732,369$ 19,967,666$ 23.6%
Kern Community College District MANAGEMENT’S DISCUSSION AND ANALYSIS (Continued)
Page 7
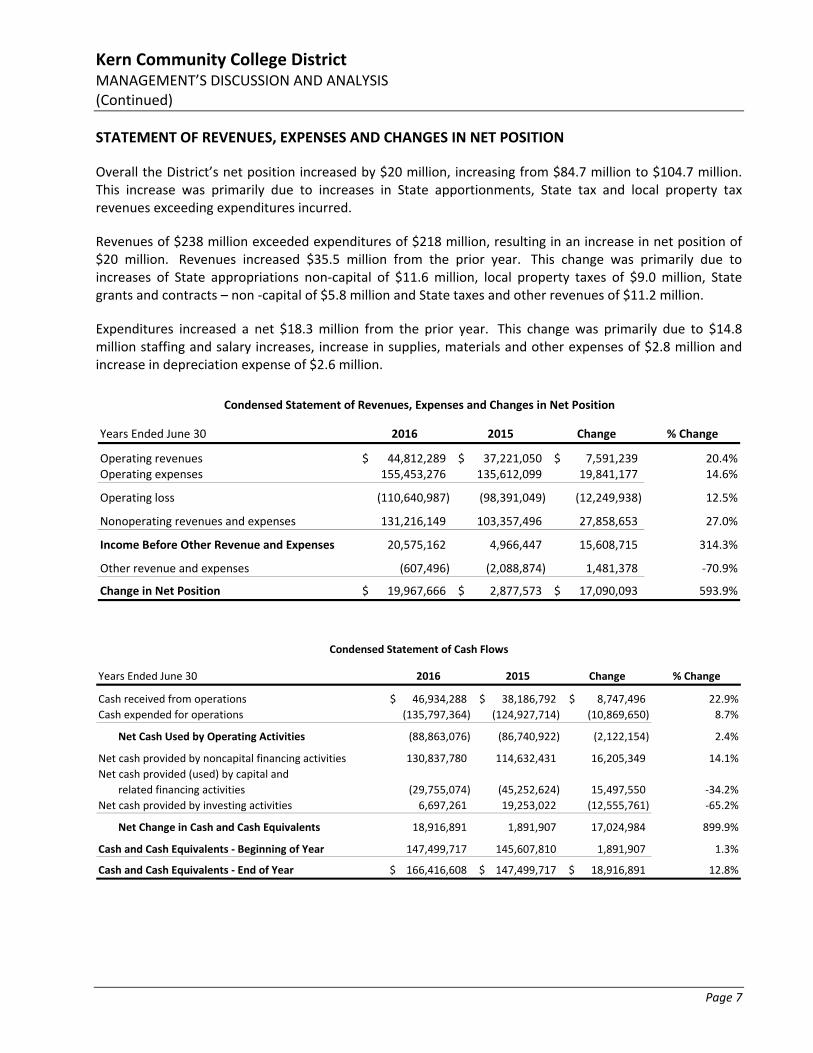
STATEMENT OF REVENUES, EXPENSES AND CHANGES IN NET POSITION
Overall the District’s net position increased by $20 million, increasing from $84.7 million to $104.7 million. This increase was primarily due to increases in State apportionments, State tax and local property tax revenues exceeding expenditures incurred.
Revenues of $238 million exceeded expenditures of $218 million, resulting in an increase in net position of $20 million. Revenues increased $35.5 million from the prior year. This change was primarily due to increases of State appropriations non‐capital of $11.6 million, local property taxes of $9.0 million, State grants and contracts – non ‐capital of $5.8 million and State taxes and other revenues of $11.2 million.
Expenditures increased a net $18.3 million from the prior year. This change was primarily due to $14.8 million staffing and salary increases, increase in supplies, materials and other expenses of $2.8 million and increase in depreciation expense of $2.6 million.
Years Ended June 30 2016 2015 Change % Change
Operating revenues 44,812,289$ 37,221,050$ 7,591,239$ 20.4%Operating expenses 155,453,276 135,612,099 19,841,177 14.6%
Operating loss (110,640,987) (98,391,049) (12,249,938) 12.5%
Nonoperating revenues and expenses 131,216,149 103,357,496 27,858,653 27.0%
Income Before Other Revenue and Expenses 20,575,162 4,966,447 15,608,715 314.3%
Other revenue and expenses (607,496) (2,088,874) 1,481,378 ‐70.9%
Change in Net Position 19,967,666$ 2,877,573$ 17,090,093$ 593.9%
Condensed Statement of Revenues, Expenses and Changes in Net Position
Years Ended June 30 2016 2015 Change % Change
Cash received from operations 46,934,288$ 38,186,792$ 8,747,496$ 22.9%
Cash expended for operations (135,797,364) (124,927,714) (10,869,650) 8.7%
Net Cash Used by Operating Activities (88,863,076) (86,740,922) (2,122,154) 2.4%
Net cash provided by noncapital financing activities 130,837,780 114,632,431 16,205,349 14.1%
Net cash provided (used) by capital and
related financing activities (29,755,074) (45,252,624) 15,497,550 ‐34.2%
Net cash provided by investing activities 6,697,261 19,253,022 (12,555,761) ‐65.2%
Net Change in Cash and Cash Equivalents 18,916,891 1,891,907 17,024,984 899.9%
Cash and Cash Equivalents ‐ Beginning of Year 147,499,717 145,607,810 1,891,907 1.3%
Cash and Cash Equivalents ‐ End of Year 166,416,608$ 147,499,717$ 18,916,891$ 12.8%
Condensed Statement of Cash Flows
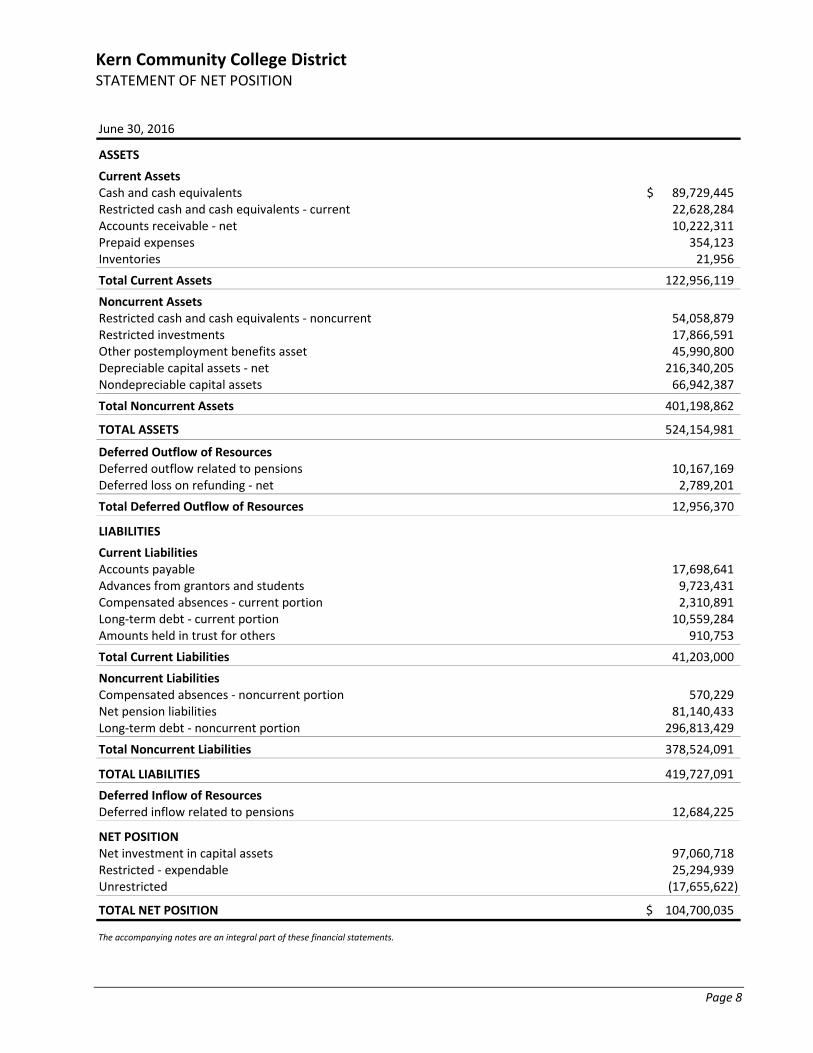
Kern Community College District STATEMENT OF NET POSITION
Page 8
June 30, 2016
ASSETS
Current AssetsCash and cash equivalents 89,729,445$ Restricted cash and cash equivalents ‐ current 22,628,284 Accounts receivable ‐ net 10,222,311 Prepaid expenses 354,123 Inventories 21,956
Total Current Assets 122,956,119
Noncurrent AssetsRestricted cash and cash equivalents ‐ noncurrent 54,058,879 Restricted investments 17,866,591 Other postemployment benefits asset 45,990,800 Depreciable capital assets ‐ net 216,340,205 Nondepreciable capital assets 66,942,387
Total Noncurrent Assets 401,198,862
TOTAL ASSETS 524,154,981
Deferred Outflow of ResourcesDeferred outflow related to pensions 10,167,169 Deferred loss on refunding ‐ net 2,789,201
Total Deferred Outflow of Resources 12,956,370
LIABILITIES
Current LiabilitiesAccounts payable 17,698,641 Advances from grantors and students 9,723,431 Compensated absences ‐ current portion 2,310,891 Long‐term debt ‐ current portion 10,559,284 Amounts held in trust for others 910,753
Total Current Liabilities 41,203,000
Noncurrent LiabilitiesCompensated absences ‐ noncurrent portion 570,229 Net pension liabilities 81,140,433 Long‐term debt ‐ noncurrent portion 296,813,429
Total Noncurrent Liabilities 378,524,091
TOTAL LIABILITIES 419,727,091
Deferred Inflow of ResourcesDeferred inflow related to pensions 12,684,225
NET POSITIONNet investment in capital assets 97,060,718 Restricted ‐ expendable 25,294,939 Unrestricted (17,655,622)
TOTAL NET POSITION 104,700,035$
The accompanying notes are an integral part of these financial statements.
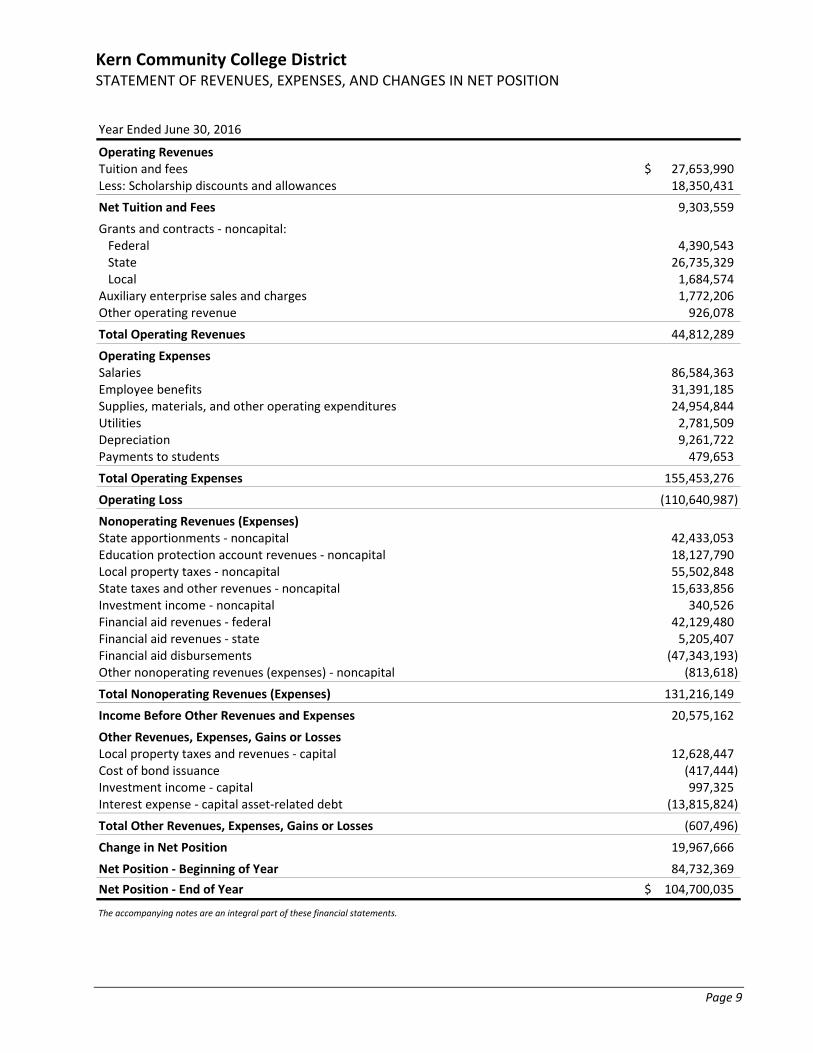
Kern Community College District STATEMENT OF REVENUES, EXPENSES, AND CHANGES IN NET POSITION
Page 9
Year Ended June 30, 2016
Operating RevenuesTuition and fees 27,653,990$ Less: Scholarship discounts and allowances 18,350,431
Net Tuition and Fees 9,303,559
Grants and contracts ‐ noncapital:Federal 4,390,543 State 26,735,329 Local 1,684,574
Auxiliary enterprise sales and charges 1,772,206 Other operating revenue 926,078
Total Operating Revenues 44,812,289
Operating ExpensesSalaries 86,584,363 Employee benefits 31,391,185 Supplies, materials, and other operating expenditures 24,954,844 Utilities 2,781,509 Depreciation 9,261,722 Payments to students 479,653
Total Operating Expenses 155,453,276
Operating Loss (110,640,987)
Nonoperating Revenues (Expenses)State apportionments ‐ noncapital 42,433,053 Education protection account revenues ‐ noncapital 18,127,790 Local property taxes ‐ noncapital 55,502,848 State taxes and other revenues ‐ noncapital 15,633,856 Investment income ‐ noncapital 340,526 Financial aid revenues ‐ federal 42,129,480 Financial aid revenues ‐ state 5,205,407 Financial aid disbursements (47,343,193) Other nonoperating revenues (expenses) ‐ noncapital (813,618)
Total Nonoperating Revenues (Expenses) 131,216,149
Income Before Other Revenues and Expenses 20,575,162
Other Revenues, Expenses, Gains or LossesLocal property taxes and revenues ‐ capital 12,628,447 Cost of bond issuance (417,444)Investment income ‐ capital 997,325 Interest expense ‐ capital asset‐related debt (13,815,824)
Total Other Revenues, Expenses, Gains or Losses (607,496)
Change in Net Position 19,967,666
Net Position ‐ Beginning of Year 84,732,369
Net Position ‐ End of Year 104,700,035$
The accompanying notes are an integral part of these financial statements.
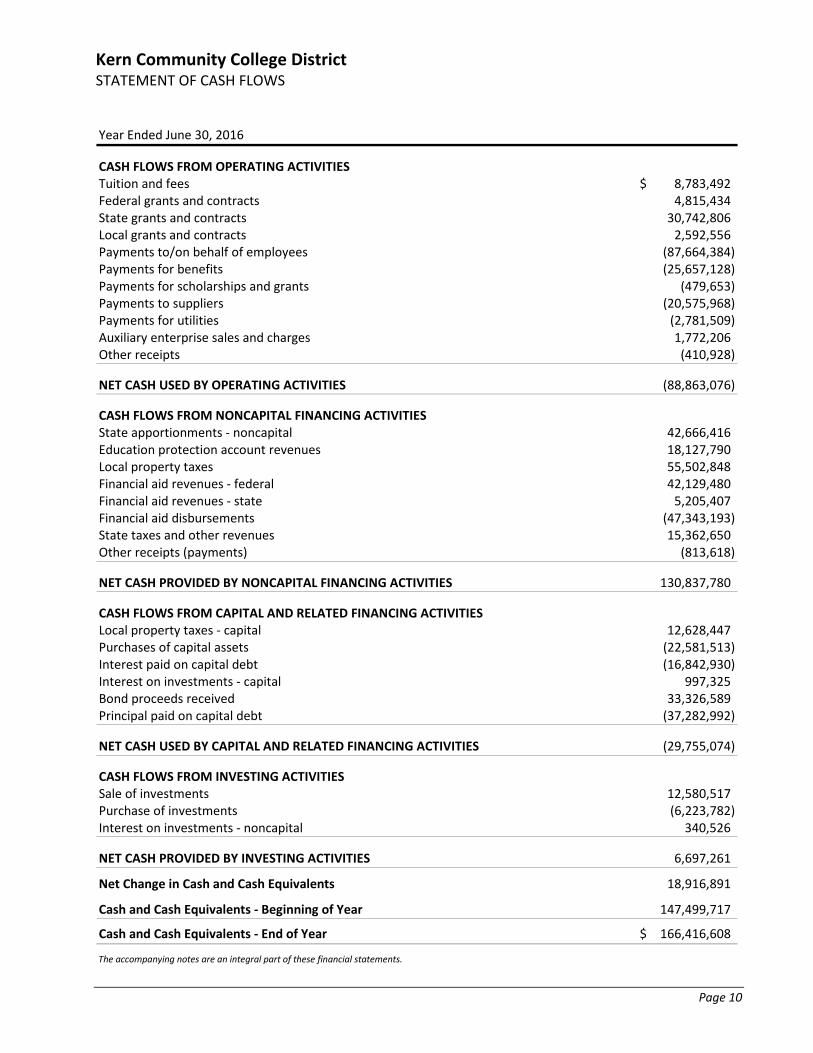
Kern Community College District STATEMENT OF CASH FLOWS
Page 10
Year Ended June 30, 2016
CASH FLOWS FROM OPERATING ACTIVITIESTuition and fees 8,783,492$ Federal grants and contracts 4,815,434 State grants and contracts 30,742,806 Local grants and contracts 2,592,556 Payments to/on behalf of employees (87,664,384) Payments for benefits (25,657,128) Payments for scholarships and grants (479,653) Payments to suppliers (20,575,968) Payments for utilities (2,781,509) Auxiliary enterprise sales and charges 1,772,206 Other receipts (410,928)
NET CASH USED BY OPERATING ACTIVITIES (88,863,076)
CASH FLOWS FROM NONCAPITAL FINANCING ACTIVITIESState apportionments ‐ noncapital 42,666,416 Education protection account revenues 18,127,790 Local property taxes 55,502,848 Financial aid revenues ‐ federal 42,129,480 Financial aid revenues ‐ state 5,205,407 Financial aid disbursements (47,343,193) State taxes and other revenues 15,362,650 Other receipts (payments) (813,618)
NET CASH PROVIDED BY NONCAPITAL FINANCING ACTIVITIES 130,837,780
CASH FLOWS FROM CAPITAL AND RELATED FINANCING ACTIVITIESLocal property taxes ‐ capital 12,628,447 Purchases of capital assets (22,581,513) Interest paid on capital debt (16,842,930) Interest on investments ‐ capital 997,325 Bond proceeds received 33,326,589 Principal paid on capital debt (37,282,992)
NET CASH USED BY CAPITAL AND RELATED FINANCING ACTIVITIES (29,755,074)
CASH FLOWS FROM INVESTING ACTIVITIESSale of investments 12,580,517 Purchase of investments (6,223,782) Interest on investments ‐ noncapital 340,526
NET CASH PROVIDED BY INVESTING ACTIVITIES 6,697,261
Net Change in Cash and Cash Equivalents 18,916,891
Cash and Cash Equivalents ‐ Beginning of Year 147,499,717
Cash and Cash Equivalents ‐ End of Year 166,416,608$
The accompanying notes are an integral part of these financial statements.
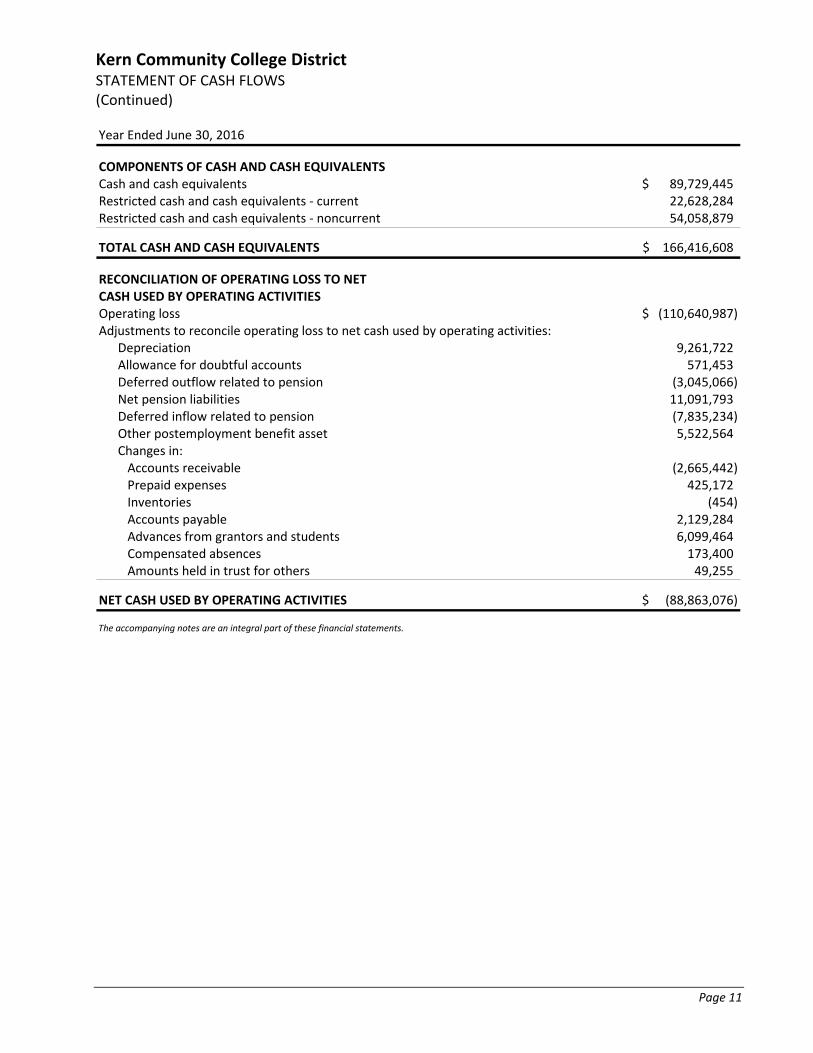
Kern Community College District STATEMENT OF CASH FLOWS (Continued)
Page 11
Year Ended June 30, 2016
COMPONENTS OF CASH AND CASH EQUIVALENTSCash and cash equivalents 89,729,445$ Restricted cash and cash equivalents ‐ current 22,628,284 Restricted cash and cash equivalents ‐ noncurrent 54,058,879
TOTAL CASH AND CASH EQUIVALENTS 166,416,608$
RECONCILIATION OF OPERATING LOSS TO NET CASH USED BY OPERATING ACTIVITIESOperating loss (110,640,987)$ Adjustments to reconcile operating loss to net cash used by operating activities:
Depreciation 9,261,722 Allowance for doubtful accounts 571,453 Deferred outflow related to pension (3,045,066) Net pension liabilities 11,091,793 Deferred inflow related to pension (7,835,234) Other postemployment benefit asset 5,522,564 Changes in:Accounts receivable (2,665,442) Prepaid expenses 425,172 Inventories (454) Accounts payable 2,129,284 Advances from grantors and students 6,099,464 Compensated absences 173,400 Amounts held in trust for others 49,255
NET CASH USED BY OPERATING ACTIVITIES (88,863,076)$
The accompanying notes are an integral part of these financial statements.
Kern Community College District NOTES TO THE FINANCIAL STATEMENTS
Page 12
1. SUMMARY OF SIGNIFICANT ACCOUNTING POLICIES
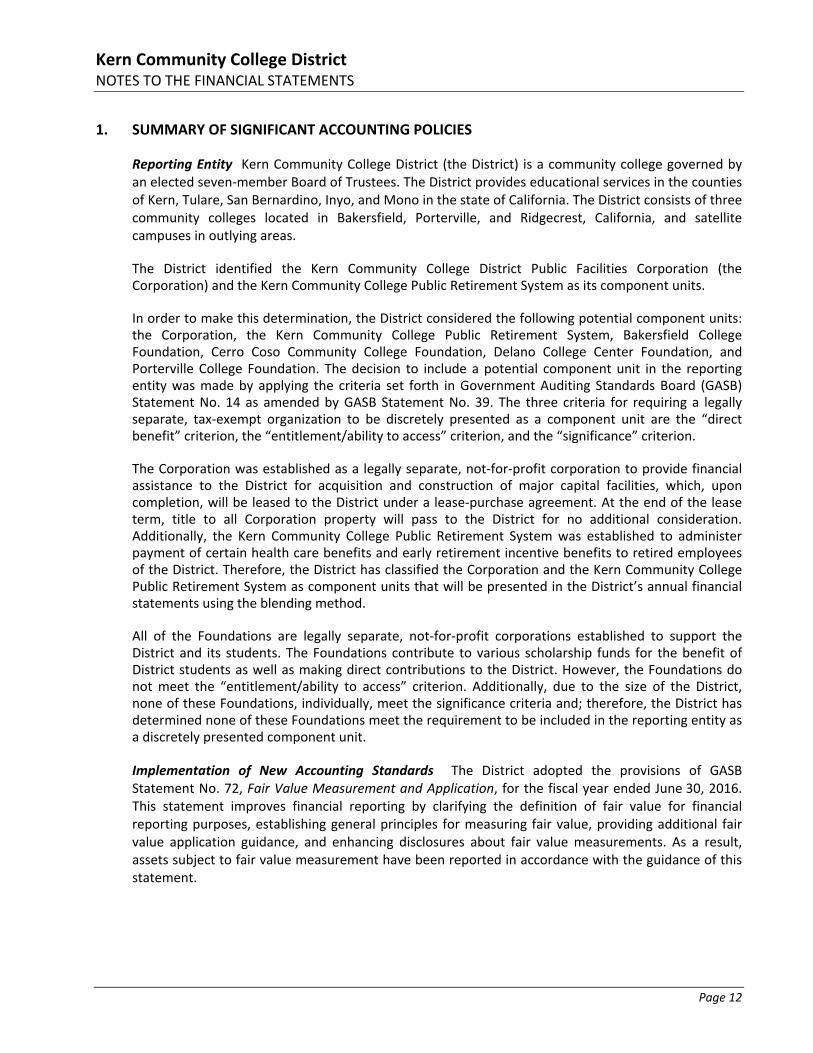
Reporting Entity Kern Community College District (the District) is a community college governed by an elected seven‐member Board of Trustees. The District provides educational services in the counties of Kern, Tulare, San Bernardino, Inyo, and Mono in the state of California. The District consists of three community colleges located in Bakersfield, Porterville, and Ridgecrest, California, and satellite campuses in outlying areas.
The District identified the Kern Community College District Public Facilities Corporation (the Corporation) and the Kern Community College Public Retirement System as its component units.
In order to make this determination, the District considered the following potential component units: the Corporation, the Kern Community College Public Retirement System, Bakersfield College Foundation, Cerro Coso Community College Foundation, Delano College Center Foundation, and Porterville College Foundation. The decision to include a potential component unit in the reporting entity was made by applying the criteria set forth in Government Auditing Standards Board (GASB) Statement No. 14 as amended by GASB Statement No. 39. The three criteria for requiring a legally separate, tax‐exempt organization to be discretely presented as a component unit are the “direct benefit” criterion, the “entitlement/ability to access” criterion, and the “significance” criterion.
The Corporation was established as a legally separate, not‐for‐profit corporation to provide financial assistance to the District for acquisition and construction of major capital facilities, which, upon completion, will be leased to the District under a lease‐purchase agreement. At the end of the lease term, title to all Corporation property will pass to the District for no additional consideration. Additionally, the Kern Community College Public Retirement System was established to administer payment of certain health care benefits and early retirement incentive benefits to retired employees of the District. Therefore, the District has classified the Corporation and the Kern Community College Public Retirement System as component units that will be presented in the District’s annual financial statements using the blending method.
All of the Foundations are legally separate, not‐for‐profit corporations established to support the District and its students. The Foundations contribute to various scholarship funds for the benefit of District students as well as making direct contributions to the District. However, the Foundations do not meet the “entitlement/ability to access” criterion. Additionally, due to the size of the District, none of these Foundations, individually, meet the significance criteria and; therefore, the District has determined none of these Foundations meet the requirement to be included in the reporting entity as a discretely presented component unit.
Implementation of New Accounting Standards The District adopted the provisions of GASB Statement No. 72, Fair Value Measurement and Application, for the fiscal year ended June 30, 2016. This statement improves financial reporting by clarifying the definition of fair value for financial reporting purposes, establishing general principles for measuring fair value, providing additional fair value application guidance, and enhancing disclosures about fair value measurements. As a result, assets subject to fair value measurement have been reported in accordance with the guidance of this statement.
Kern Community College District NOTES TO THE FINANCIAL STATEMENTS (Continued)
Page 13
Basis of Presentation and Accounting The basic financial statements of the District have been prepared in conformity with accounting principles generally accepted in the United States of America (GAAP) as applied to governmental units. The GASB is the accepted standard‐setting body for establishing governmental accounting and financial reporting principles.
For financial reporting purposes, the District is considered a special‐purpose government engaged only in business‐type activities (BTA). Accordingly, the District’s financial statements have been presented using the economic resources measurement focus and the accrual basis of accounting. Revenues are recorded when earned and expenditures are recorded when a liability is incurred, regardless of the timing of the related cash flows. All significant intra‐agency transactions have been eliminated.
Exceptions to the accrual basis of accounting are as follows:
In accordance with industry standards provided by the California Community Colleges Chancellor’s Office, summer session tuition and fees received before year end are recorded as advances from grantors and students as of June 30 with the revenue being reported in the fiscal year in which the program is predominately conducted.
The basic financial statements of the District have been prepared in conformity with accounting principles generally accepted in the United States of America (GAAP) as applied to governmental units. The GASB is the accepted standard‐setting body for establishing governmental accounting and financial reporting principles. The budgetary and financial accounts of the District are recorded and maintained in accordance with the Budget and Accounting Manual issued by the California Community Colleges Chancellor’s Office.
Cash and Cash Equivalents For purposes of the statement of cash flows, the District considers all highly liquid investments with an original maturity of three months or less to be cash equivalents. Funds invested in the County Treasurer’s investment pool are considered cash equivalents.
Investments GASB Statement No. 31, Accounting and Financial Reporting for Certain Investments and for External Investment Pools, provides that amounts held in external investment pools be reported at fair value. However, cash in the County treasury and investments in the Local Agency Investment Fund (LAIF) are recorded at the value of the pool shares held, which approximates the fair value of the underlying cash and investments of the pool.
All other investments are reported at fair value based on quoted market prices with realized and unrealized gains or losses reported in the statement of revenues, expenses, and changes in net position.
Restricted Cash and Investments Restricted cash and investments includes cash restricted for the repayment of debt, for use in the acquisition or construction of capital assets, for restricted programs, for any other restricted purpose, or in any funds restricted in purpose per the California Community Colleges Budget and Accounting Manual.
Kern Community College District NOTES TO THE FINANCIAL STATEMENTS (Continued)
Page 14
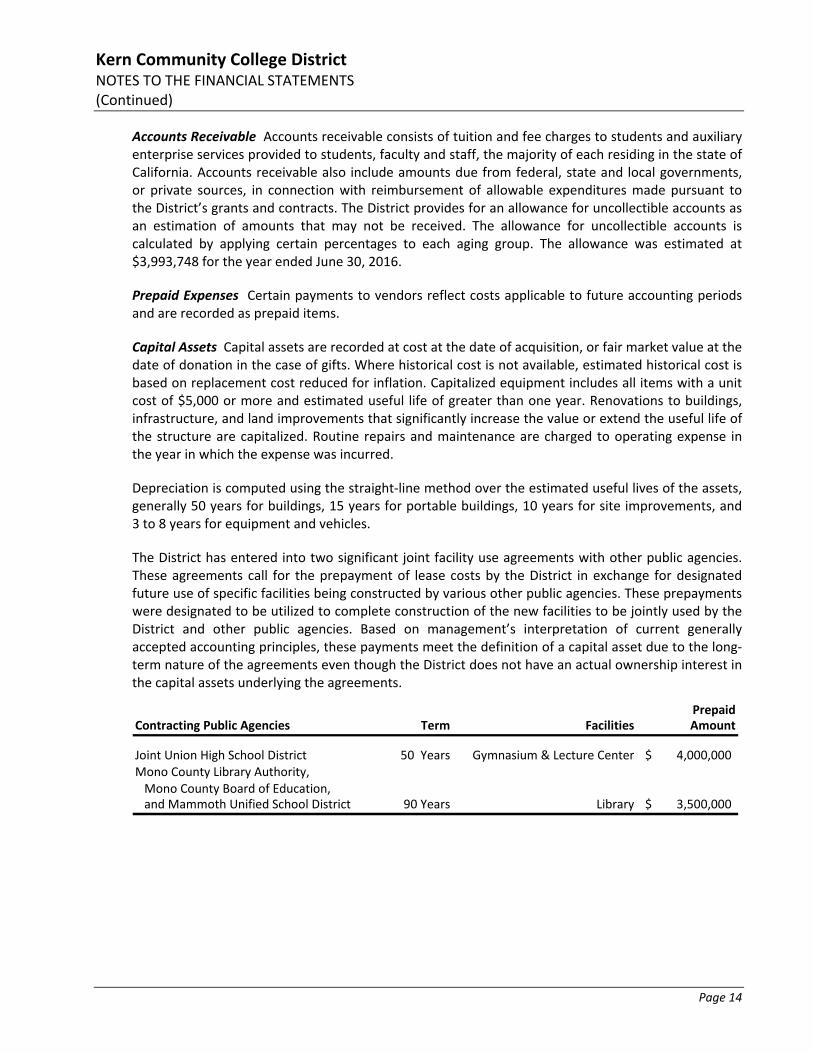
Accounts Receivable Accounts receivable consists of tuition and fee charges to students and auxiliary enterprise services provided to students, faculty and staff, the majority of each residing in the state of California. Accounts receivable also include amounts due from federal, state and local governments, or private sources, in connection with reimbursement of allowable expenditures made pursuant to the District’s grants and contracts. The District provides for an allowance for uncollectible accounts as an estimation of amounts that may not be received. The allowance for uncollectible accounts is calculated by applying certain percentages to each aging group. The allowance was estimated at $3,993,748 for the year ended June 30, 2016.
Prepaid Expenses Certain payments to vendors reflect costs applicable to future accounting periods and are recorded as prepaid items.
Capital Assets Capital assets are recorded at cost at the date of acquisition, or fair market value at the date of donation in the case of gifts. Where historical cost is not available, estimated historical cost is based on replacement cost reduced for inflation. Capitalized equipment includes all items with a unit cost of $5,000 or more and estimated useful life of greater than one year. Renovations to buildings, infrastructure, and land improvements that significantly increase the value or extend the useful life of the structure are capitalized. Routine repairs and maintenance are charged to operating expense in the year in which the expense was incurred.
Depreciation is computed using the straight‐line method over the estimated useful lives of the assets, generally 50 years for buildings, 15 years for portable buildings, 10 years for site improvements, and 3 to 8 years for equipment and vehicles.
The District has entered into two significant joint facility use agreements with other public agencies. These agreements call for the prepayment of lease costs by the District in exchange for designated future use of specific facilities being constructed by various other public agencies. These prepayments were designated to be utilized to complete construction of the new facilities to be jointly used by the District and other public agencies. Based on management’s interpretation of current generally accepted accounting principles, these payments meet the definition of a capital asset due to the long‐term nature of the agreements even though the District does not have an actual ownership interest in the capital assets underlying the agreements.
PrepaidContracting Public Agencies Term Facilities Amount
Joint Union High School District 50 Years Gymnasium & Lecture Center 4,000,000$ Mono County Library Authority, Mono County Board of Education, and Mammoth Unified School District 90 Years Library 3,500,000$
Kern Community College District NOTES TO THE FINANCIAL STATEMENTS (Continued)
Page 15
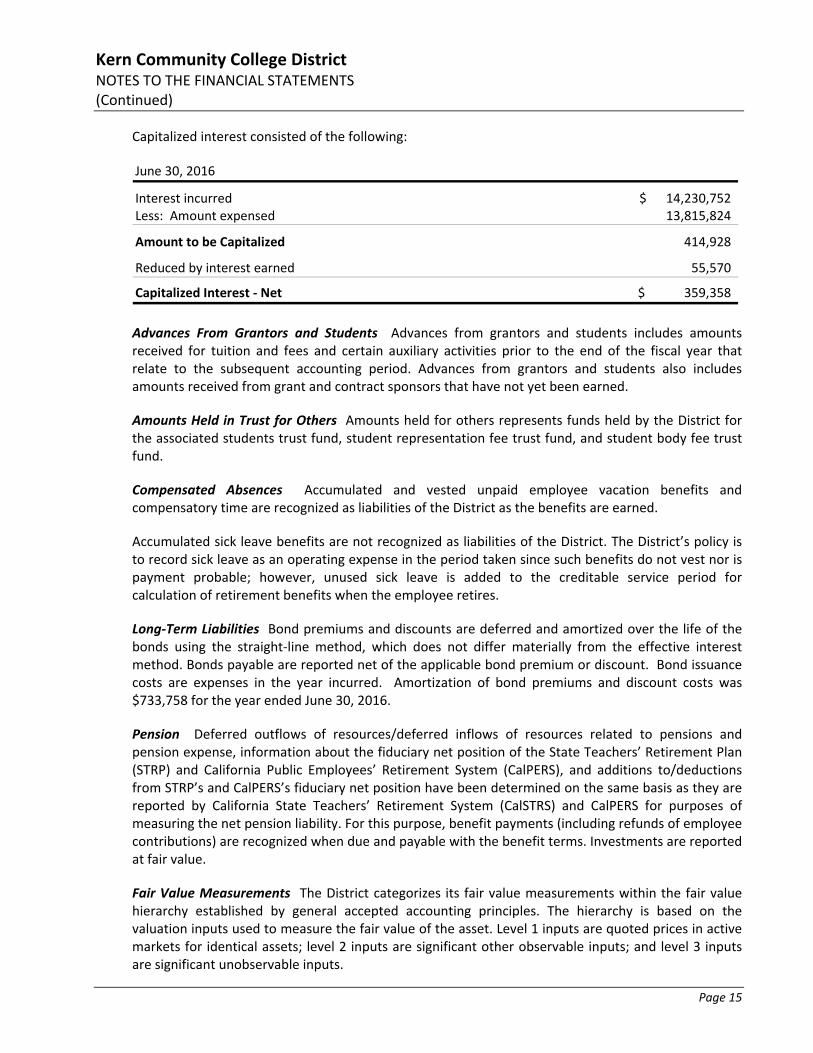
Capitalized interest consisted of the following:
June 30, 2016
Interest incurred 14,230,752$ Less: Amount expensed 13,815,824
Amount to be Capitalized 414,928
Reduced by interest earned 55,570
Capitalized Interest ‐ Net 359,358$
Advances From Grantors and Students Advances from grantors and students includes amounts received for tuition and fees and certain auxiliary activities prior to the end of the fiscal year that relate to the subsequent accounting period. Advances from grantors and students also includes amounts received from grant and contract sponsors that have not yet been earned.
Amounts Held in Trust for Others Amounts held for others represents funds held by the District for the associated students trust fund, student representation fee trust fund, and student body fee trust fund.
Compensated Absences Accumulated and vested unpaid employee vacation benefits and compensatory time are recognized as liabilities of the District as the benefits are earned.
Accumulated sick leave benefits are not recognized as liabilities of the District. The District’s policy is to record sick leave as an operating expense in the period taken since such benefits do not vest nor is payment probable; however, unused sick leave is added to the creditable service period for calculation of retirement benefits when the employee retires.
Long‐Term Liabilities Bond premiums and discounts are deferred and amortized over the life of the bonds using the straight‐line method, which does not differ materially from the effective interest method. Bonds payable are reported net of the applicable bond premium or discount. Bond issuance costs are expenses in the year incurred. Amortization of bond premiums and discount costs was $733,758 for the year ended June 30, 2016.
Pension Deferred outflows of resources/deferred inflows of resources related to pensions and pension expense, information about the fiduciary net position of the State Teachers’ Retirement Plan (STRP) and California Public Employees’ Retirement System (CalPERS), and additions to/deductions from STRP’s and CalPERS’s fiduciary net position have been determined on the same basis as they are reported by California State Teachers’ Retirement System (CalSTRS) and CalPERS for purposes of measuring the net pension liability. For this purpose, benefit payments (including refunds of employee contributions) are recognized when due and payable with the benefit terms. Investments are reported at fair value.
Fair Value Measurements The District categorizes its fair value measurements within the fair value hierarchy established by general accepted accounting principles. The hierarchy is based on the valuation inputs used to measure the fair value of the asset. Level 1 inputs are quoted prices in active markets for identical assets; level 2 inputs are significant other observable inputs; and level 3 inputs are significant unobservable inputs.
Kern Community College District NOTES TO THE FINANCIAL STATEMENTS (Continued)
Page 16
Deferred Outflows/Inflows of Resources In addition to assets, the statement of net position includes a separate section for deferred outflows of resources. This separate financial statement element, deferred outflows of resources, represents a consumption of net position that applies to a future period, which will only be recognized as an outflow of resources (expense/expenditures) in the future. District pension contributions, subsequent to the measurement date, are reported as deferred outflows of resources in the government‐wide statement of net position. District contributions, subsequent to the measurement date, will be amortized during the next fiscal year.
In addition to liabilities, the statement of net position includes a separate section for deferred inflows of resources. This separate financial statement element, deferred inflows of resources, represents an acquisition of net position that applies to a future period and would only be recognized as an inflow of resources (revenue) at that time.
Changes in proportion and differences between District contributions and proportionate share of pension contributions, the District’s proportionate share of the net difference between projected and actual earnings on pension plan investments, changes in assumptions, and the differences between the District expected and actual experience are reported as deferred inflows of resources or deferred outflows of resources in the government‐wide statement of net position. These amounts are amortized over the estimated service lives of the pension plan participants.
A deferred loss on refunding results from the difference in the carrying value of refunded debt and its reacquisition price. This amount is deferred and amortized over the shortened life of the refunded or refunding debt.
Net Position Net position represents the difference between assets and liabilities. The District’s net position is classified as follows:
Net Investment in Capital Assets: This represents the District’s total investment in capital assets, net of outstanding debt obligations related to those capital assets. To the extent debt has been incurred but not yet expended for capital assets, such amounts are not included as a component of net investment in capital assets.
Restricted Net Position ‐ Expendable: Restricted expendable net position represents resources which are legally or contractually obligated to be spent in accordance with restrictions imposed by external third parties.
Unrestricted Net Position: Unrestricted net position represents resources derived from student tuition and fees, state apportionments, and sales and services of educational departments and auxiliary enterprises. These resources are used for transactions relating to the educational and general operations of the District, and may be used at the discretion of the governing board to meet current expenses for any purpose.
When an expense is incurred that can be paid using either restricted or unrestricted resources, the District’s policy is to first apply the expense towards restricted resources, and then towards unrestricted resources.
Kern Community College District NOTES TO THE FINANCIAL STATEMENTS (Continued)
Page 17
Classification of Revenues The District has classified its revenues as either operating or non‐operating. Certain significant revenue streams relied upon for operations are recorded as non‐operating revenues, including state appropriations, local property taxes, and investment income. Revenues are classified according to the following criteria:
Operating Revenues: Operating revenues include activities that have the characteristics of exchange transactions, such as: (1) student tuition and fees, net of scholarship discounts and allowances; (2) sales and services of auxiliary enterprises; and (3) some federal, state, and local grants and contracts, and federal appropriations.
Nonoperating Revenues: Nonoperating revenues include activities that have the characteristics of nonexchange transactions, such as gifts and contributions, and other revenue sources, such as state appropriations and investment income.
Scholarship Discounts and Allowances Student tuition and fee revenue are reported net of scholarship discounts and allowances in the statement of revenues, expenses, and changes in net position. Scholarship discounts and allowances represent the difference between stated charges for goods and services provided by the District and the amount that is paid by students and/or third parties making payments on the students’ behalf.
State Apportionments Certain current‐year apportionments from the state are based on various financial and statistical information of the previous year as well as state budgets and other factors outside the District’s control. In February, subsequent to the year end, the state will perform a recalculation based on actual financial and statistical information for the year just completed. Any corrections determined by the state are recorded in the year computed by the state.
Estimates The preparation of financial statements in conformity with accounting principles generally accepted in the United States of America requires management to make estimates and assumptions that affect the amounts reported in the basic financial statements and accompanying notes. Actual results may differ from those estimates.
Property Taxes Secured property taxes attach as an enforceable lien on property as of March 1. Taxes are payable in two installments on November 1 and February 1 and become delinquent if paid after December 10 and April 10. Unsecured property taxes are payable in one installment on or before August 31. The County of Kern bills and collects the taxes for the District.
Budget and Budgetary Accounting By state law, the District’s governing board must approve a tentative budget no later than July 1, and adopt a final budget no later than September 15 of each year. A hearing must be conducted for public comments prior to adoption. The District’s governing board satisfied these requirements.
The budget is revised during the year to incorporate categorical funds that are awarded during the year and miscellaneous changes to the spending plans. The District’s governing board approves revisions to the budget.

Kern Community College District NOTES TO THE FINANCIAL STATEMENTS (Continued)
Page 18
On‐Behalf Payments GASB Statement No. 24 requires that direct on‐behalf payments for fringe benefits, and salaries made by an entity to a third‐party recipient for the employees of another, legally separate entity be recognized as revenue and expenditures by the employer government. The State of California makes direct on‐behalf payments for retirement benefits to CalSTRS and CalPERS on behalf of all community college districts in California. The amount reported in the basic financial statements as of June 30, 2016, was $357,425.
2. CASH, CASH EQUIVALENTS, AND INVESTMENTS
The cash and cash equivalents are as follows:
June 30, 2016
Cash and cash equivalents 89,729,445$ Restricted cash and cash equivalents 76,687,163
Total Cash and Cash Equivalents 166,416,608$
The carrying amount of the District’s cash is summarized as follows:
June 30, 2016
Cash in County treasury 160,329,806$ Cash on hand and in banks 6,082,498 Cash held by trustees 4,304
Total Deposits 166,416,608$
As provided for by California Education Code, Section 41001, a significant portion of the District’s cash balances of most funds is deposited with the Kern County Treasurer for the purpose of increasing interest earned through County investment activities. The County Treasury’s Pooled Money Investment account’s weighted average maturities were less than two years at June 30, 2016, and the pool is unrated.
Copies of the County’s audited financial statements can be obtained from the Kern County Auditor‐Controller’s Office, 1115 Truxtun Avenue, Bakersfield, California 93301‐4639.
The pooled treasury has regulatory oversight from the Kern County Treasury Oversight Committee in accordance with California Government Code requirements.
The California Government Code requires California banks and savings and loan associations to secure the District’s deposits by pledging government securities as collateral. The market value of pledged securities must equal 110% of an entity’s deposits. California law also allows financial institutions to secure an entity’s deposits by pledging first trust deed mortgage notes having a value of 150% of an entity’s total deposits.
Kern Community College District NOTES TO THE FINANCIAL STATEMENTS (Continued)
Page 19
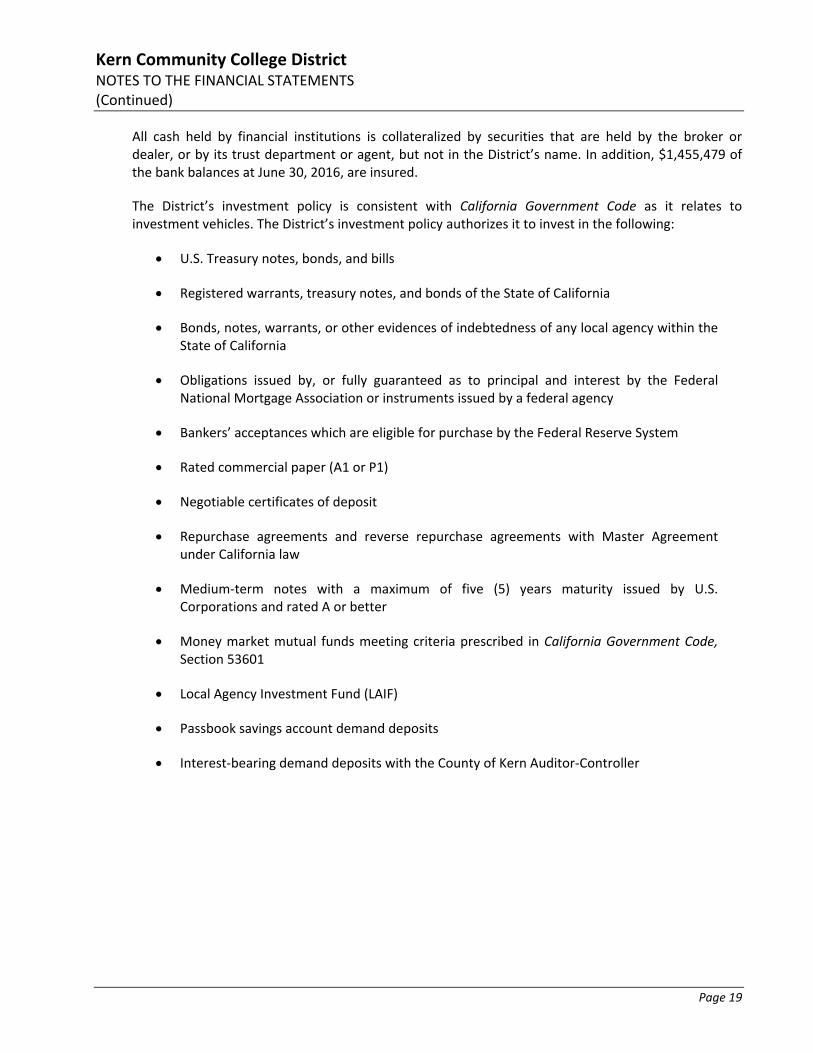
All cash held by financial institutions is collateralized by securities that are held by the broker or dealer, or by its trust department or agent, but not in the District’s name. In addition, $1,455,479 of the bank balances at June 30, 2016, are insured.
The District’s investment policy is consistent with California Government Code as it relates to investment vehicles. The District’s investment policy authorizes it to invest in the following:
U.S. Treasury notes, bonds, and bills
Registered warrants, treasury notes, and bonds of the State of California
Bonds, notes, warrants, or other evidences of indebtedness of any local agency within the State of California
Obligations issued by, or fully guaranteed as to principal and interest by the Federal National Mortgage Association or instruments issued by a federal agency
Bankers’ acceptances which are eligible for purchase by the Federal Reserve System
Rated commercial paper (A1 or P1)
Negotiable certificates of deposit
Repurchase agreements and reverse repurchase agreements with Master Agreement under California law
Medium‐term notes with a maximum of five (5) years maturity issued by U.S. Corporations and rated A or better
Money market mutual funds meeting criteria prescribed in California Government Code, Section 53601
Local Agency Investment Fund (LAIF)
Passbook savings account demand deposits
Interest‐bearing demand deposits with the County of Kern Auditor‐Controller
Kern Community College District NOTES TO THE FINANCIAL STATEMENTS (Continued)
Page 20
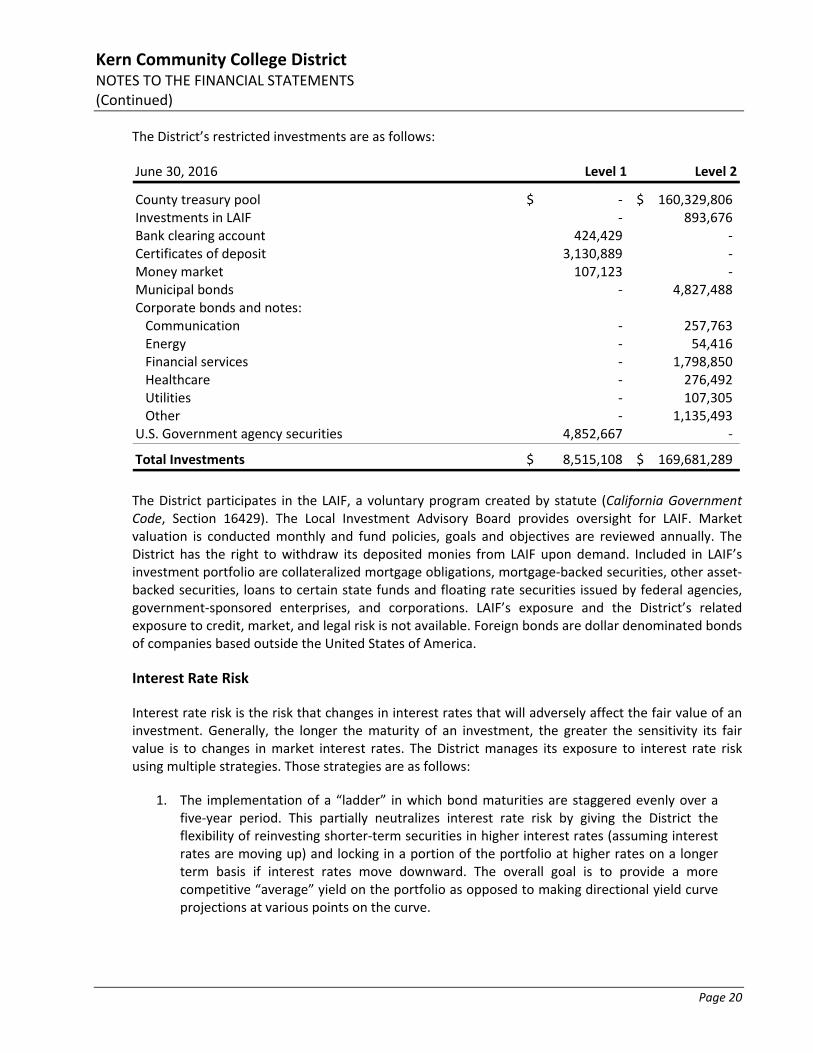
The District’s restricted investments are as follows:
June 30, 2016 Level 1 Level 2
County treasury pool ‐$ 160,329,806$ Investments in LAIF ‐ 893,676 Bank clearing account 424,429 ‐ Certificates of deposit 3,130,889 ‐ Money market 107,123 ‐ Municipal bonds ‐ 4,827,488 Corporate bonds and notes:Communication ‐ 257,763 Energy ‐ 54,416 Financial services ‐ 1,798,850 Healthcare ‐ 276,492 Utilities ‐ 107,305 Other ‐ 1,135,493
U.S. Government agency securities 4,852,667 ‐
Total Investments 8,515,108$ 169,681,289$
The District participates in the LAIF, a voluntary program created by statute (California Government Code, Section 16429). The Local Investment Advisory Board provides oversight for LAIF. Market valuation is conducted monthly and fund policies, goals and objectives are reviewed annually. The District has the right to withdraw its deposited monies from LAIF upon demand. Included in LAIF’s investment portfolio are collateralized mortgage obligations, mortgage‐backed securities, other asset‐backed securities, loans to certain state funds and floating rate securities issued by federal agencies, government‐sponsored enterprises, and corporations. LAIF’s exposure and the District’s related exposure to credit, market, and legal risk is not available. Foreign bonds are dollar denominated bonds of companies based outside the United States of America.
Interest Rate Risk
Interest rate risk is the risk that changes in interest rates that will adversely affect the fair value of an investment. Generally, the longer the maturity of an investment, the greater the sensitivity its fair value is to changes in market interest rates. The District manages its exposure to interest rate risk using multiple strategies. Those strategies are as follows:
1. The implementation of a “ladder” in which bond maturities are staggered evenly over a five‐year period. This partially neutralizes interest rate risk by giving the District the flexibility of reinvesting shorter‐term securities in higher interest rates (assuming interest rates are moving up) and locking in a portion of the portfolio at higher rates on a longer term basis if interest rates move downward. The overall goal is to provide a more competitive “average” yield on the portfolio as opposed to making directional yield curve projections at various points on the curve.
Kern Community College District NOTES TO THE FINANCIAL STATEMENTS (Continued)
Page 21
2. The District also diversifies through investing in credit quality securities. Over 48% of the portfolio is currently weighted in AAA‐rated securities. These securities tend to perform better in volatile interest rate environments. The District’s bias is to keep a solid majority of the portfolio in AAA‐rated securities at all times for capital preservation purposes.
3. The District invests in “step‐up” coupon bonds and some “floating‐rate” debt in the portfolio. This also assists in cushioning the portfolio from credit risk during periods of higher interest rates.
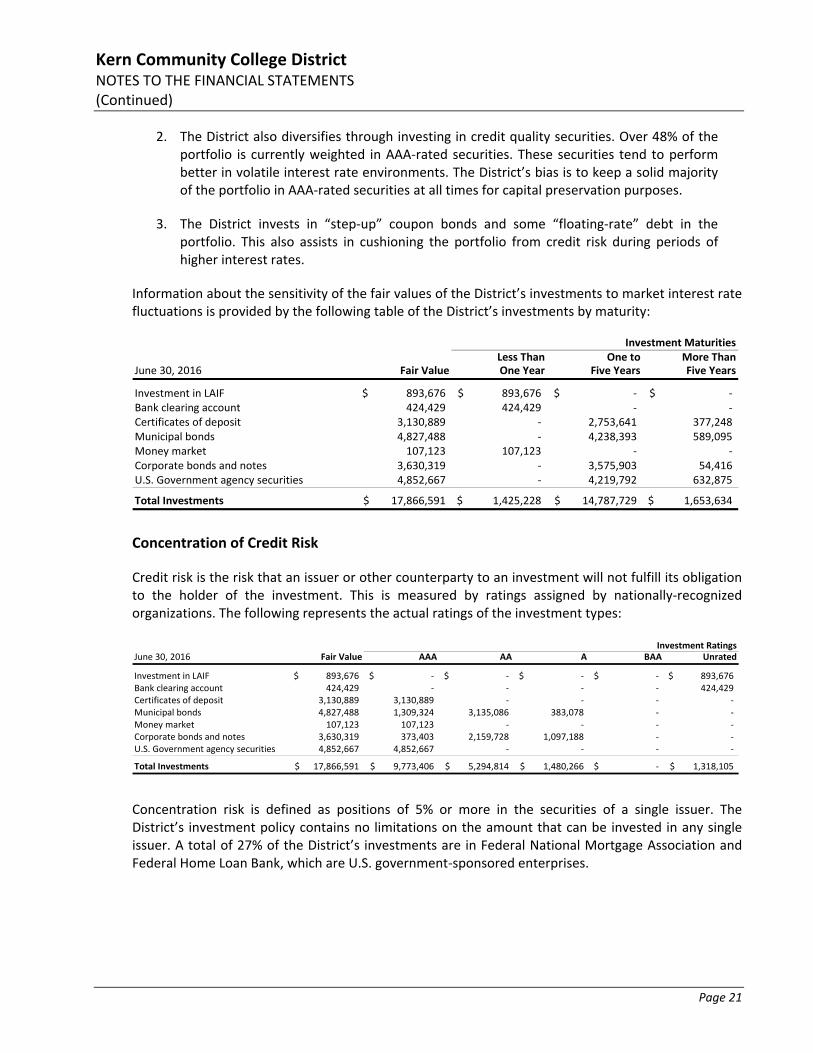
Information about the sensitivity of the fair values of the District’s investments to market interest rate fluctuations is provided by the following table of the District’s investments by maturity:
Investment MaturitiesLess Than One to More Than
June 30, 2016 Fair Value One Year Five Years Five Years
Investment in LAIF 893,676$ 893,676$ ‐$ ‐$ Bank clearing account 424,429 424,429 ‐ ‐ Certificates of deposit 3,130,889 ‐ 2,753,641 377,248 Municipal bonds 4,827,488 ‐ 4,238,393 589,095 Money market 107,123 107,123 ‐ ‐ Corporate bonds and notes 3,630,319 ‐ 3,575,903 54,416 U.S. Government agency securities 4,852,667 ‐ 4,219,792 632,875
Total Investments 17,866,591$ 1,425,228$ 14,787,729$ 1,653,634$
Concentration of Credit Risk
Credit risk is the risk that an issuer or other counterparty to an investment will not fulfill its obligation to the holder of the investment. This is measured by ratings assigned by nationally‐recognized organizations. The following represents the actual ratings of the investment types:
Investment RatingsJune 30, 2016 Fair Value AAA AA A BAA Unrated
Investment in LAIF 893,676$ ‐$ ‐$ ‐$ ‐$ 893,676$ Bank clearing account 424,429 ‐ ‐ ‐ ‐ 424,429 Certificates of deposit 3,130,889 3,130,889 ‐ ‐ ‐ ‐ Municipal bonds 4,827,488 1,309,324 3,135,086 383,078 ‐ ‐ Money market 107,123 107,123 ‐ ‐ ‐ ‐ Corporate bonds and notes 3,630,319 373,403 2,159,728 1,097,188 ‐ ‐ U.S. Government agency securities 4,852,667 4,852,667 ‐ ‐ ‐ ‐
Total Investments 17,866,591$ 9,773,406$ 5,294,814$ 1,480,266$ ‐$ 1,318,105$
Concentration risk is defined as positions of 5% or more in the securities of a single issuer. The District’s investment policy contains no limitations on the amount that can be invested in any single issuer. A total of 27% of the District’s investments are in Federal National Mortgage Association and Federal Home Loan Bank, which are U.S. government‐sponsored enterprises.
Kern Community College District NOTES TO THE FINANCIAL STATEMENTS (Continued)
Page 22
The U.S. government agency securities (Federal National Mortgage Association, Federal Home Loan Mortgage Corporation, Federal Farm Credit Bank and Federal Home Loan Bank) are mortgage‐backed securities which entitle the purchaser to receive a share of the cash flows, such as principal and interest payments, from a pool of mortgages. Mortgage securities are sensitive to interest rate changes because principal payments either increase (in a low interest rate environment) or decrease (in a high interest rate environment). A change, up or down, in the payment rate will result in a change in the security yield.
Custodial Credit Risk
Custodial credit risk is the risk that, in the event of the failure of the counterparty (e.g., financial institution, broker‐dealer) to a transaction, a government will not be able to recover the value of its cash and investments or collateral securities that are in the possession of another party.
For investments, the District’s policy requires that a third‐party bank trust department hold all securities owned by the District in the District’s name.
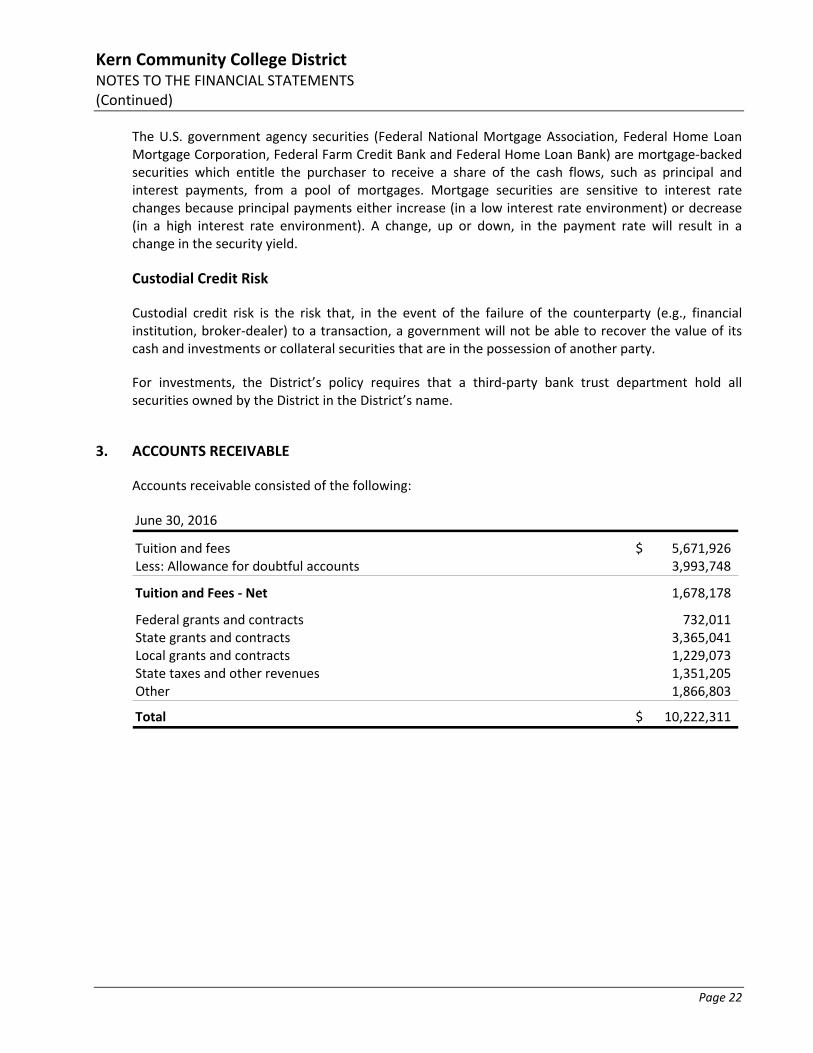
3. ACCOUNTS RECEIVABLE
Accounts receivable consisted of the following:
June 30, 2016
Tuition and fees 5,671,926$ Less: Allowance for doubtful accounts 3,993,748
Tuition and Fees ‐ Net 1,678,178
Federal grants and contracts 732,011 State grants and contracts 3,365,041 Local grants and contracts 1,229,073 State taxes and other revenues 1,351,205 Other 1,866,803
Total 10,222,311$

Kern Community College District NOTES TO THE FINANCIAL STATEMENTS (Continued)
Page 23
4. CAPITAL ASSETS
Capital assets activity is summarized as follows:
Balance BalanceJune 30, 2015 Additions Deductions Transfers June 30, 2016
Nondepreciable Capital AssetsLand 15,675,746$ ‐$ ‐$ 3,601,800$ 19,277,546$ Construction in progress 34,698,846 19,813,137 ‐ (6,847,142) 47,664,841
Total Nondepreciable Capital Assets 50,374,592$ 19,813,137$ ‐$ (3,245,342)$ 66,942,387$
Depreciable Capital AssetsSite improvements 7,142,579$ ‐$ ‐$ 858,366$ 8,000,945$ Joint use facilities agreements 7,448,375 ‐ ‐ ‐ 7,448,375 Buildings and improvements 269,149,312 477,393 ‐ 2,386,976 272,013,681 Equipment 19,100,597 1,609,858 ‐ ‐ 20,710,455 Computer equipment 17,947,528 687,214 ‐ ‐ 18,634,742 Vehicles 2,552,635 227,119 ‐ ‐ 2,779,754
Total Depreciable Capital Assets 323,341,026 3,001,584 ‐ 3,245,342 329,587,952
Less: Accumulated depreciation 103,986,025 9,261,722 ‐ ‐ 113,247,747
Total Depreciable Assets ‐ Net 219,355,001$ (6,260,138)$ ‐$ 3,245,342$ 216,340,205$
5. ACCOUNTS PAYABLE
Accounts payable consisted of the following:
June 30, 2016
Accrued payroll and related liabilities 3,751,422$ Construction payables 2,464,152Interest payable 2,342,827Other 9,140,240
Total 17,698,641$
Kern Community College District NOTES TO THE FINANCIAL STATEMENTS (Continued)
Page 24
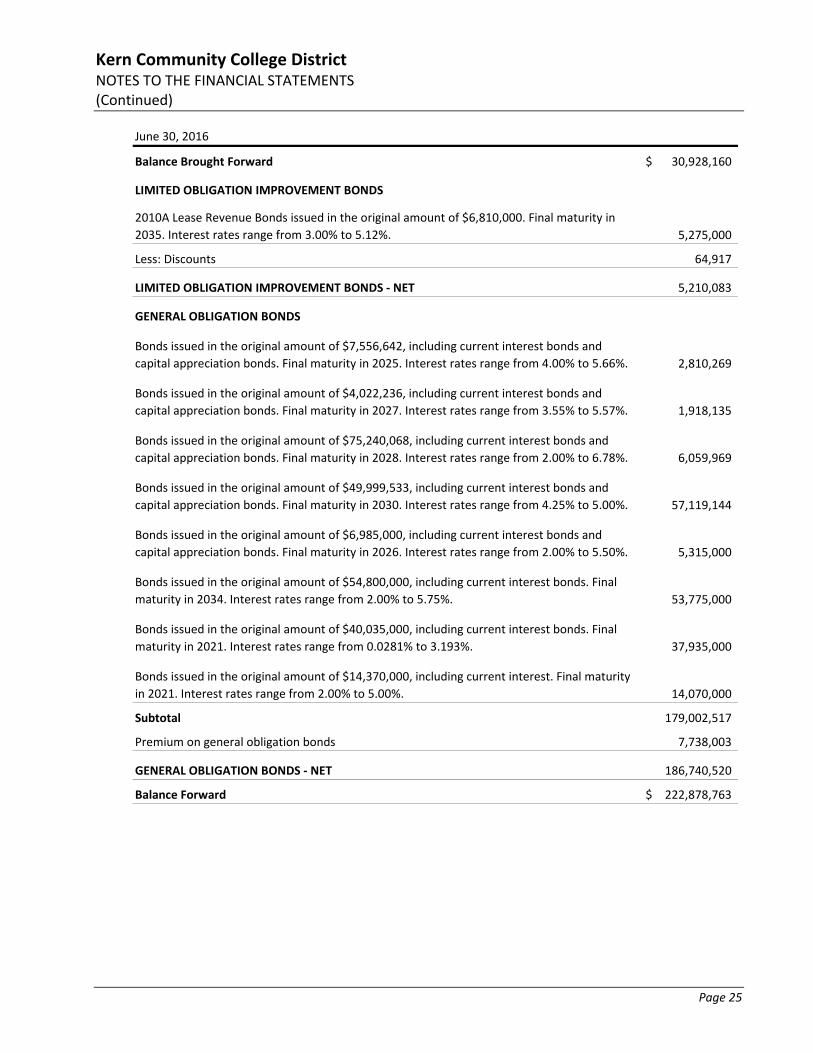
6. LONG‐TERM LIABILITIES
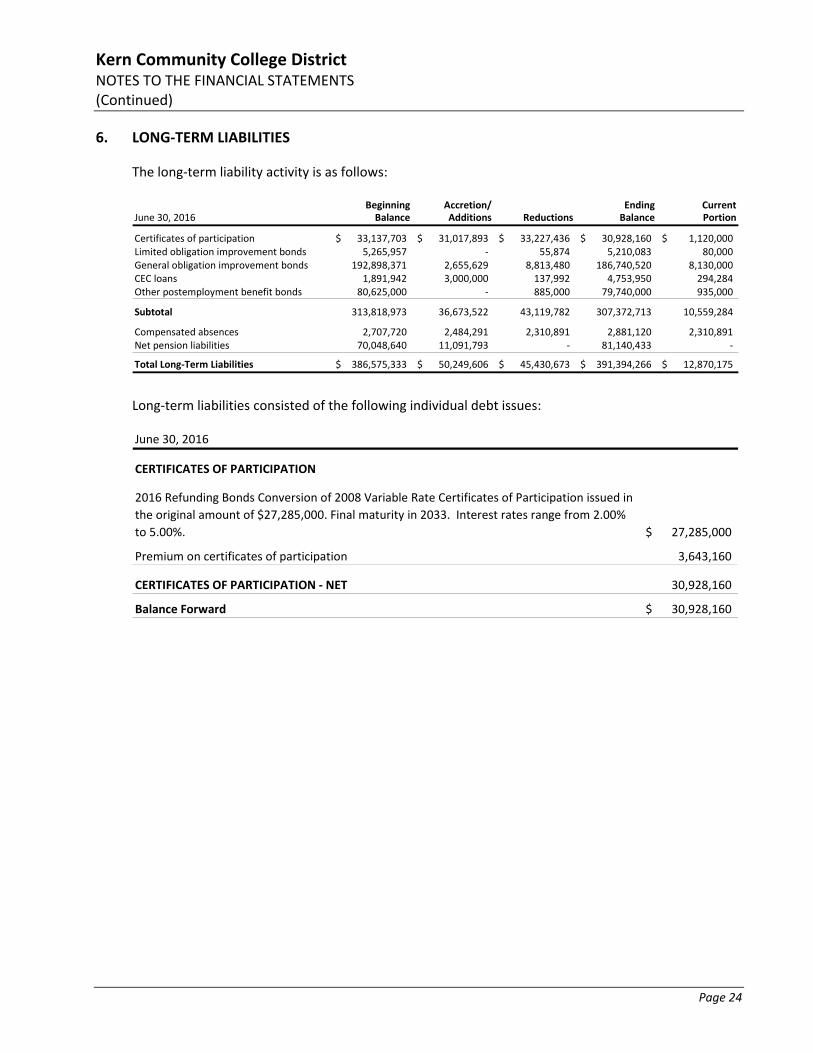
The long‐term liability activity is as follows:
Beginning Accretion/ Ending CurrentJune 30, 2016 Balance Additions Reductions Balance Portion
Certificates of participation 33,137,703$ 31,017,893$ 33,227,436$ 30,928,160$ 1,120,000$ Limited obligation improvement bonds 5,265,957 ‐ 55,874 5,210,083 80,000 General obligation improvement bonds 192,898,371 2,655,629 8,813,480 186,740,520 8,130,000 CEC loans 1,891,942 3,000,000 137,992 4,753,950 294,284 Other postemployment benefit bonds 80,625,000 ‐ 885,000 79,740,000 935,000
Subtotal 313,818,973 36,673,522 43,119,782 307,372,713 10,559,284
Compensated absences 2,707,720 2,484,291 2,310,891 2,881,120 2,310,891 Net pension liabilities 70,048,640 11,091,793 ‐ 81,140,433 ‐
Total Long‐Term Liabilities 386,575,333$ 50,249,606$ 45,430,673$ 391,394,266$ 12,870,175$
Long‐term liabilities consisted of the following individual debt issues:
June 30, 2016
CERTIFICATES OF PARTICIPATION
2016 Refunding Bonds Conversion of 2008 Variable Rate Certificates of Participation issued in
the original amount of $27,285,000. Final maturity in 2033. Interest rates range from 2.00%
to 5.00%. 27,285,000$
Premium on certificates of participation 3,643,160
CERTIFICATES OF PARTICIPATION ‐ NET 30,928,160
Balance Forward 30,928,160$
Kern Community College District NOTES TO THE FINANCIAL STATEMENTS (Continued)
Page 25
June 30, 2016
Balance Brought Forward 30,928,160$
LIMITED OBLIGATION IMPROVEMENT BONDS
2010A Lease Revenue Bonds issued in the original amount of $6,810,000. Final maturity in
2035. Interest rates range from 3.00% to 5.12%. 5,275,000
Less: Discounts 64,917
LIMITED OBLIGATION IMPROVEMENT BONDS ‐ NET 5,210,083
GENERAL OBLIGATION BONDS
Bonds issued in the original amount of $7,556,642, including current interest bonds and
capital appreciation bonds. Final maturity in 2025. Interest rates range from 4.00% to 5.66%. 2,810,269
Bonds issued in the original amount of $4,022,236, including current interest bonds and
capital appreciation bonds. Final maturity in 2027. Interest rates range from 3.55% to 5.57%. 1,918,135
Bonds issued in the original amount of $75,240,068, including current interest bonds and
capital appreciation bonds. Final maturity in 2028. Interest rates range from 2.00% to 6.78%. 6,059,969
Bonds issued in the original amount of $49,999,533, including current interest bonds and
capital appreciation bonds. Final maturity in 2030. Interest rates range from 4.25% to 5.00%. 57,119,144
Bonds issued in the original amount of $6,985,000, including current interest bonds and
capital appreciation bonds. Final maturity in 2026. Interest rates range from 2.00% to 5.50%. 5,315,000
Bonds issued in the original amount of $54,800,000, including current interest bonds. Final
maturity in 2034. Interest rates range from 2.00% to 5.75%. 53,775,000
Bonds issued in the original amount of $40,035,000, including current interest bonds. Final
maturity in 2021. Interest rates range from 0.0281% to 3.193%. 37,935,000
Bonds issued in the original amount of $14,370,000, including current interest. Final maturity
in 2021. Interest rates range from 2.00% to 5.00%. 14,070,000
Subtotal 179,002,517
Premium on general obligation bonds 7,738,003
GENERAL OBLIGATION BONDS ‐ NET 186,740,520
Balance Forward 222,878,763$
Kern Community College District NOTES TO THE FINANCIAL STATEMENTS (Continued)
Page 26
June 30, 2016
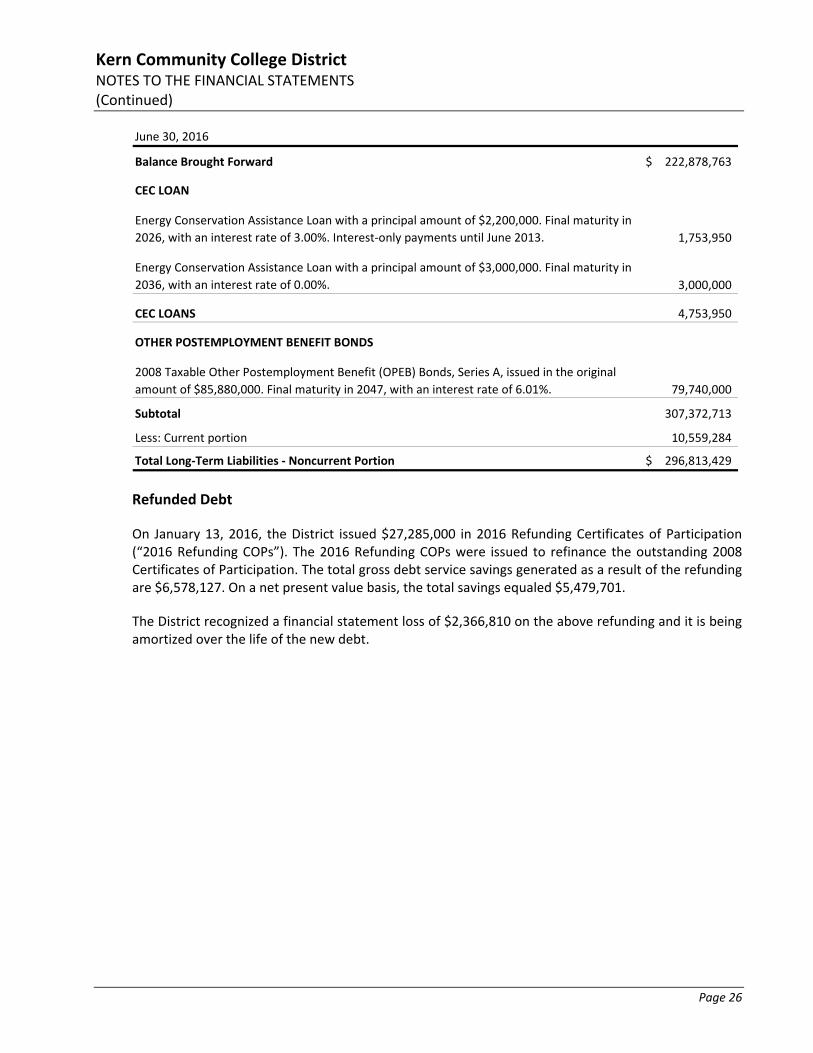
Balance Brought Forward 222,878,763$
CEC LOAN
Energy Conservation Assistance Loan with a principal amount of $2,200,000. Final maturity in
2026, with an interest rate of 3.00%. Interest‐only payments until June 2013. 1,753,950
Energy Conservation Assistance Loan with a principal amount of $3,000,000. Final maturity in
2036, with an interest rate of 0.00%. 3,000,000
CEC LOANS 4,753,950
OTHER POSTEMPLOYMENT BENEFIT BONDS
2008 Taxable Other Postemployment Benefit (OPEB) Bonds, Series A, issued in the original
amount of $85,880,000. Final maturity in 2047, with an interest rate of 6.01%. 79,740,000
Subtotal 307,372,713
Less: Current portion 10,559,284
Total Long‐Term Liabilities ‐ Noncurrent Portion 296,813,429$
Refunded Debt
On January 13, 2016, the District issued $27,285,000 in 2016 Refunding Certificates of Participation (“2016 Refunding COPs”). The 2016 Refunding COPs were issued to refinance the outstanding 2008 Certificates of Participation. The total gross debt service savings generated as a result of the refunding are $6,578,127. On a net present value basis, the total savings equaled $5,479,701.
The District recognized a financial statement loss of $2,366,810 on the above refunding and it is being amortized over the life of the new debt.
Kern Community College District NOTES TO THE FINANCIAL STATEMENTS (Continued)
Page 27
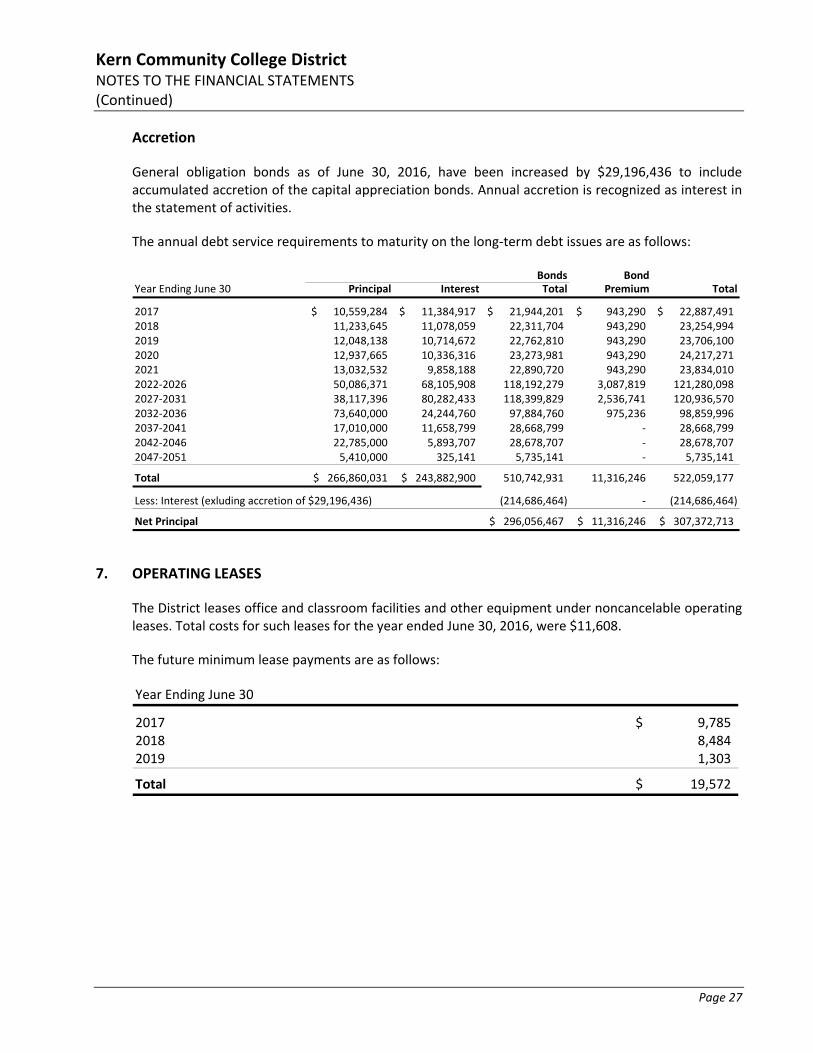
Accretion
General obligation bonds as of June 30, 2016, have been increased by $29,196,436 to include accumulated accretion of the capital appreciation bonds. Annual accretion is recognized as interest in the statement of activities.
The annual debt service requirements to maturity on the long‐term debt issues are as follows:
Bonds BondYear Ending June 30 Principal Interest Total Premium Total
2017 10,559,284$ 11,384,917$ 21,944,201$ 943,290$ 22,887,491$ 2018 11,233,645 11,078,059 22,311,704 943,290 23,254,994 2019 12,048,138 10,714,672 22,762,810 943,290 23,706,100 2020 12,937,665 10,336,316 23,273,981 943,290 24,217,271 2021 13,032,532 9,858,188 22,890,720 943,290 23,834,010 2022‐2026 50,086,371 68,105,908 118,192,279 3,087,819 121,280,098 2027‐2031 38,117,396 80,282,433 118,399,829 2,536,741 120,936,570 2032‐2036 73,640,000 24,244,760 97,884,760 975,236 98,859,996 2037‐2041 17,010,000 11,658,799 28,668,799 ‐ 28,668,799 2042‐2046 22,785,000 5,893,707 28,678,707 ‐ 28,678,707 2047‐2051 5,410,000 325,141 5,735,141 ‐ 5,735,141
Total 266,860,031$ 243,882,900$ 510,742,931 11,316,246 522,059,177
Less: Interest (exluding accretion of $29,196,436) (214,686,464) ‐ (214,686,464)
Net Principal 296,056,467$ 11,316,246$ 307,372,713$
7. OPERATING LEASES
The District leases office and classroom facilities and other equipment under noncancelable operating leases. Total costs for such leases for the year ended June 30, 2016, were $11,608.
The future minimum lease payments are as follows:
Year Ending June 30
2017 9,785$ 2018 8,484 2019 1,303
Total 19,572$

Kern Community College District NOTES TO THE FINANCIAL STATEMENTS (Continued)
Page 28
8. EMPLOYEE RETIREMENT SYSTEMS
Qualified employees are covered under cost‐sharing multiple‐employer defined benefit pension plans maintained by agencies of the state of California. Certificated employees are members of CalSTRS, and classified employees are members of CalPERS.
Summary
Net Pension Liability Net pension liability is reported in the accompanying statement of net position as follows:
June 30, 2016
CalSTRS State Teachers' Retirement Plan 51,765,066$ CalPERS School Employer Pool 29,375,367
Total Net Pension Liability 81,140,433$
Deferred Outflows of Resources Deferred outflows of resources are reported in the accompanying statement of net position as follows:
June 30, 2016 CalSTRS CalPERS Total
Difference between expected and actual experience ‐$ 1,761,761$ 1,761,761$
Employer contributions 5,248,922 3,156,486 8,405,408
Total Deferred Outflows of Resources 5,248,922$ 4,918,247$ 10,167,169$
Deferred Inflows of Resources Deferred inflows of resources are reported in the accompanying statement of net position as follows:
June 30, 2016 CalSTRS CalPERS Total
Net difference between projected and actual earnings on pension plan investments 5,103,840$ 1,055,514$ 6,159,354$
Changes in proportion and differences between District contributions and proportionate share of contributions 2,707,671 876,904 3,584,575
Changes in asssumptions 1,046,250 1,894,046 2,940,296
Total Deferred Inflows of Resources 8,857,761$ 3,826,464$ 12,684,225$
Kern Community College District NOTES TO THE FINANCIAL STATEMENTS (Continued)
Page 29
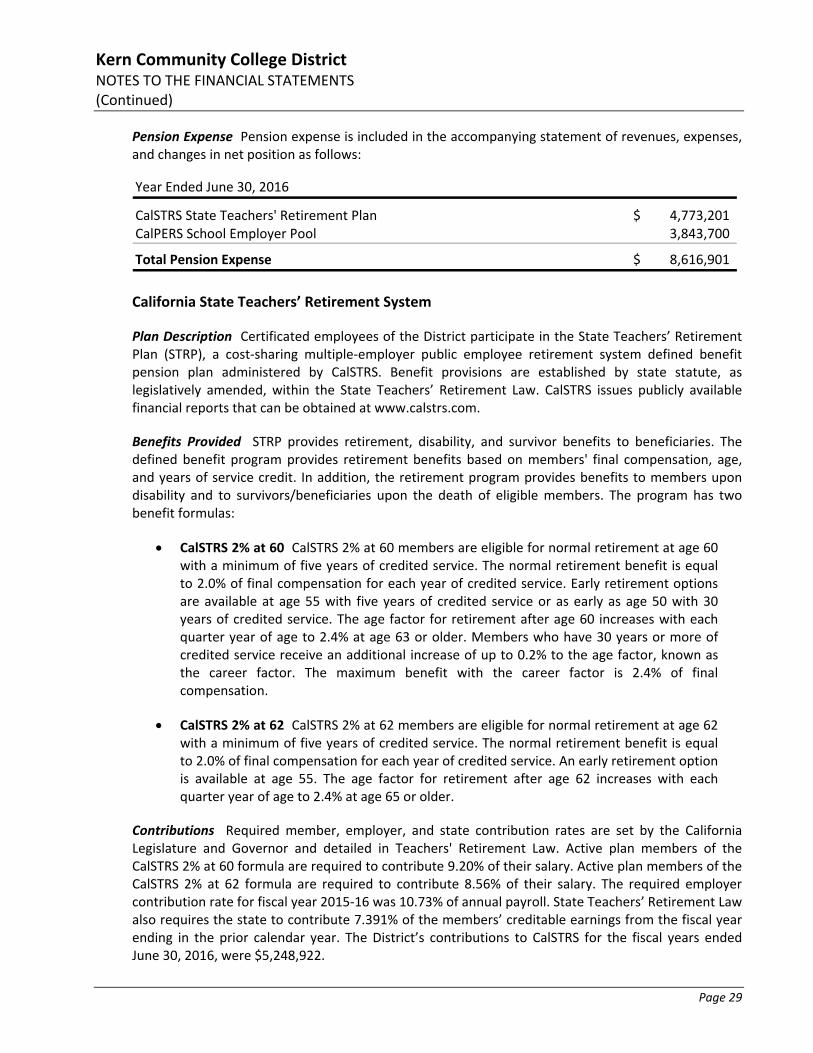
Pension Expense Pension expense is included in the accompanying statement of revenues, expenses, and changes in net position as follows:
Year Ended June 30, 2016
CalSTRS State Teachers' Retirement Plan 4,773,201$ CalPERS School Employer Pool 3,843,700
Total Pension Expense 8,616,901$
California State Teachers’ Retirement System
Plan Description Certificated employees of the District participate in the State Teachers’ Retirement Plan (STRP), a cost‐sharing multiple‐employer public employee retirement system defined benefit pension plan administered by CalSTRS. Benefit provisions are established by state statute, as legislatively amended, within the State Teachers’ Retirement Law. CalSTRS issues publicly available financial reports that can be obtained at www.calstrs.com.
Benefits Provided STRP provides retirement, disability, and survivor benefits to beneficiaries. The defined benefit program provides retirement benefits based on members' final compensation, age, and years of service credit. In addition, the retirement program provides benefits to members upon disability and to survivors/beneficiaries upon the death of eligible members. The program has two benefit formulas:
CalSTRS 2% at 60 CalSTRS 2% at 60 members are eligible for normal retirement at age 60 with a minimum of five years of credited service. The normal retirement benefit is equal to 2.0% of final compensation for each year of credited service. Early retirement options are available at age 55 with five years of credited service or as early as age 50 with 30 years of credited service. The age factor for retirement after age 60 increases with each quarter year of age to 2.4% at age 63 or older. Members who have 30 years or more of credited service receive an additional increase of up to 0.2% to the age factor, known as the career factor. The maximum benefit with the career factor is 2.4% of final compensation.
CalSTRS 2% at 62 CalSTRS 2% at 62 members are eligible for normal retirement at age 62 with a minimum of five years of credited service. The normal retirement benefit is equal to 2.0% of final compensation for each year of credited service. An early retirement option is available at age 55. The age factor for retirement after age 62 increases with each quarter year of age to 2.4% at age 65 or older.
Contributions Required member, employer, and state contribution rates are set by the California Legislature and Governor and detailed in Teachers' Retirement Law. Active plan members of the CalSTRS 2% at 60 formula are required to contribute 9.20% of their salary. Active plan members of the CalSTRS 2% at 62 formula are required to contribute 8.56% of their salary. The required employer contribution rate for fiscal year 2015‐16 was 10.73% of annual payroll. State Teachers’ Retirement Law also requires the state to contribute 7.391% of the members’ creditable earnings from the fiscal year ending in the prior calendar year. The District’s contributions to CalSTRS for the fiscal years ended June 30, 2016, were $5,248,922.
Kern Community College District NOTES TO THE FINANCIAL STATEMENTS (Continued)
Page 30
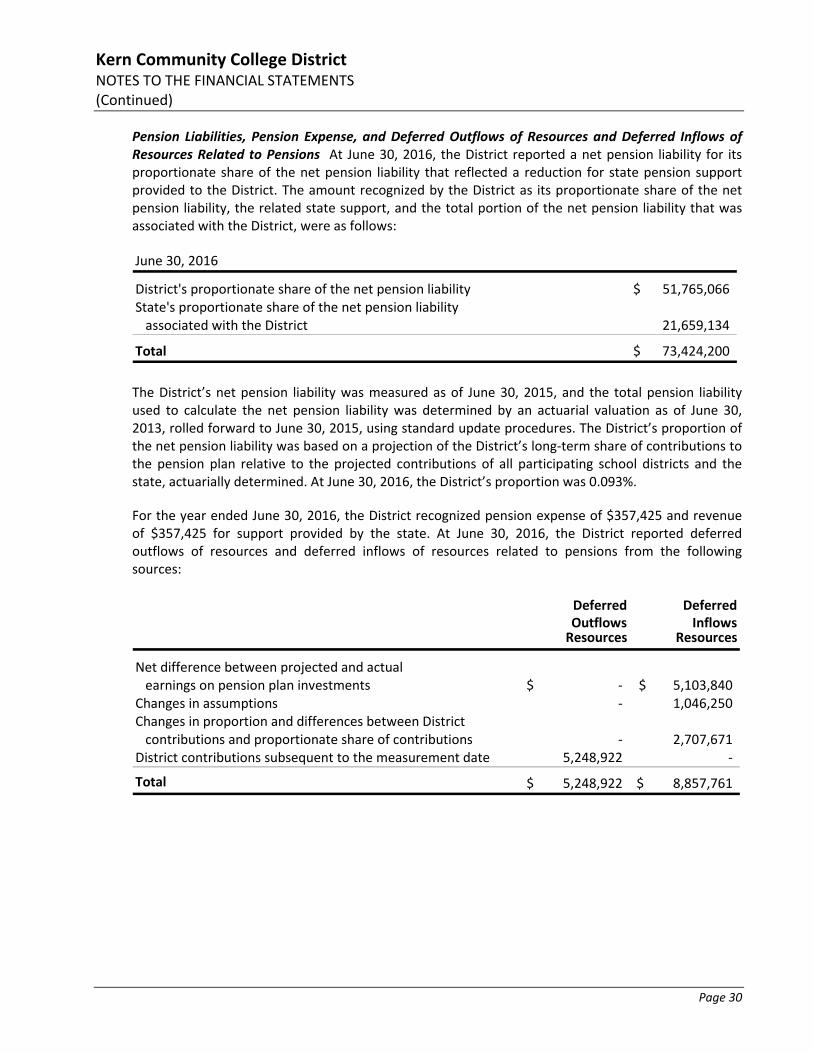
Pension Liabilities, Pension Expense, and Deferred Outflows of Resources and Deferred Inflows of Resources Related to Pensions At June 30, 2016, the District reported a net pension liability for its proportionate share of the net pension liability that reflected a reduction for state pension support provided to the District. The amount recognized by the District as its proportionate share of the net pension liability, the related state support, and the total portion of the net pension liability that was associated with the District, were as follows:
June 30, 2016
District's proportionate share of the net pension liability 51,765,066$ State's proportionate share of the net pension liability associated with the District 21,659,134
Total 73,424,200$
The District’s net pension liability was measured as of June 30, 2015, and the total pension liability used to calculate the net pension liability was determined by an actuarial valuation as of June 30, 2013, rolled forward to June 30, 2015, using standard update procedures. The District’s proportion of the net pension liability was based on a projection of the District’s long‐term share of contributions to the pension plan relative to the projected contributions of all participating school districts and the state, actuarially determined. At June 30, 2016, the District’s proportion was 0.093%.
For the year ended June 30, 2016, the District recognized pension expense of $357,425 and revenue of $357,425 for support provided by the state. At June 30, 2016, the District reported deferred outflows of resources and deferred inflows of resources related to pensions from the following sources:
Deferred DeferredOutflows InflowsResources Resources
Net difference between projected and actual earnings on pension plan investments ‐$ 5,103,840$
Changes in assumptions ‐ 1,046,250 Changes in proportion and differences between Districtcontributions and proportionate share of contributions ‐ 2,707,671
District contributions subsequent to the measurement date 5,248,922 ‐
Total 5,248,922$ 8,857,761$
Kern Community College District NOTES TO THE FINANCIAL STATEMENTS (Continued)
Page 31
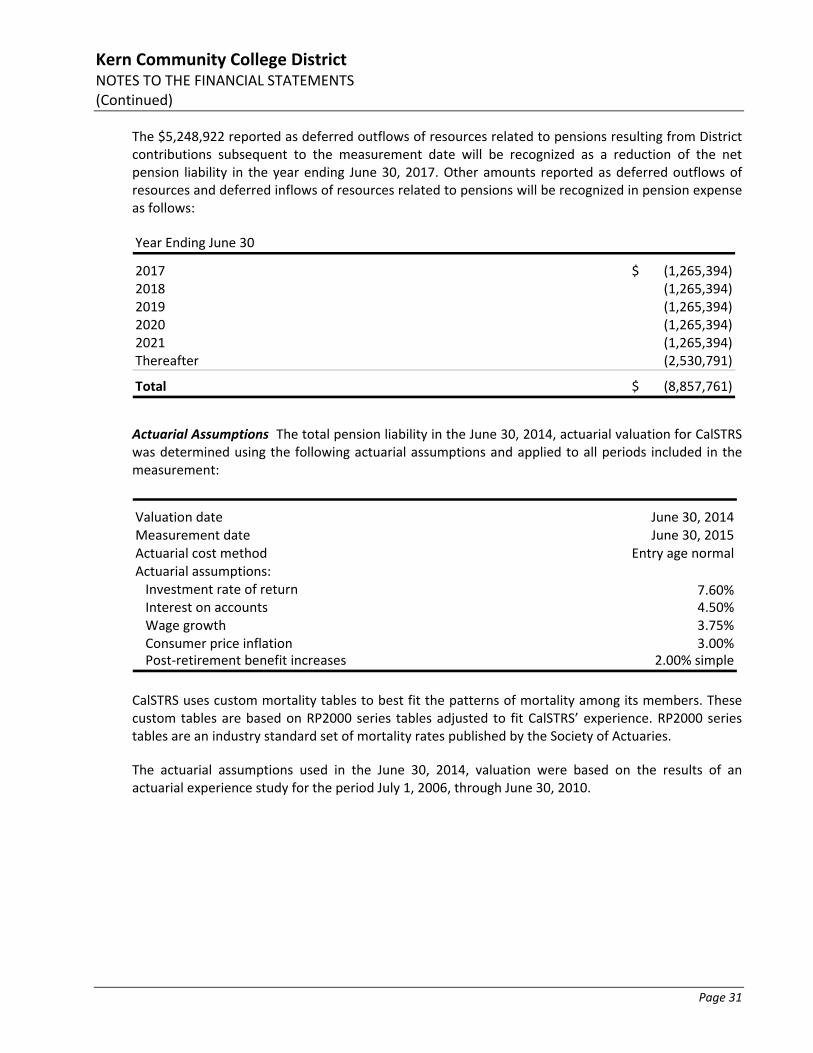
The $5,248,922 reported as deferred outflows of resources related to pensions resulting from District contributions subsequent to the measurement date will be recognized as a reduction of the net pension liability in the year ending June 30, 2017. Other amounts reported as deferred outflows of resources and deferred inflows of resources related to pensions will be recognized in pension expense as follows:
Year Ending June 30
2017 (1,265,394)$ 2018 (1,265,394) 2019 (1,265,394) 2020 (1,265,394) 2021 (1,265,394) Thereafter (2,530,791)
Total (8,857,761)$
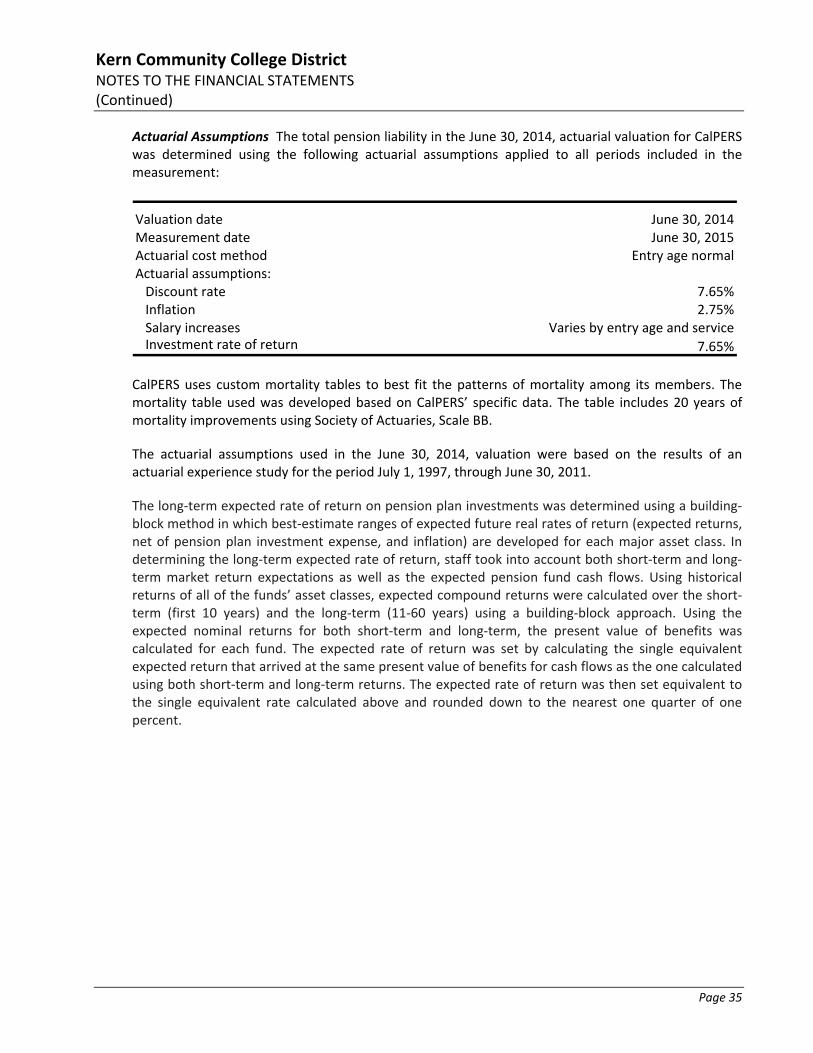
Actuarial Assumptions The total pension liability in the June 30, 2014, actuarial valuation for CalSTRS was determined using the following actuarial assumptions and applied to all periods included in the measurement:
Valuation date June 30, 2014Measurement date June 30, 2015Actuarial cost method Entry age normalActuarial assumptions:Investment rate of return 7.60%Interest on accounts 4.50%Wage growth 3.75%Consumer price inflation 3.00%Post‐retirement benefit increases 2.00% simple
CalSTRS uses custom mortality tables to best fit the patterns of mortality among its members. These custom tables are based on RP2000 series tables adjusted to fit CalSTRS’ experience. RP2000 series tables are an industry standard set of mortality rates published by the Society of Actuaries.
The actuarial assumptions used in the June 30, 2014, valuation were based on the results of an actuarial experience study for the period July 1, 2006, through June 30, 2010.
Kern Community College District NOTES TO THE FINANCIAL STATEMENTS (Continued)
Page 32
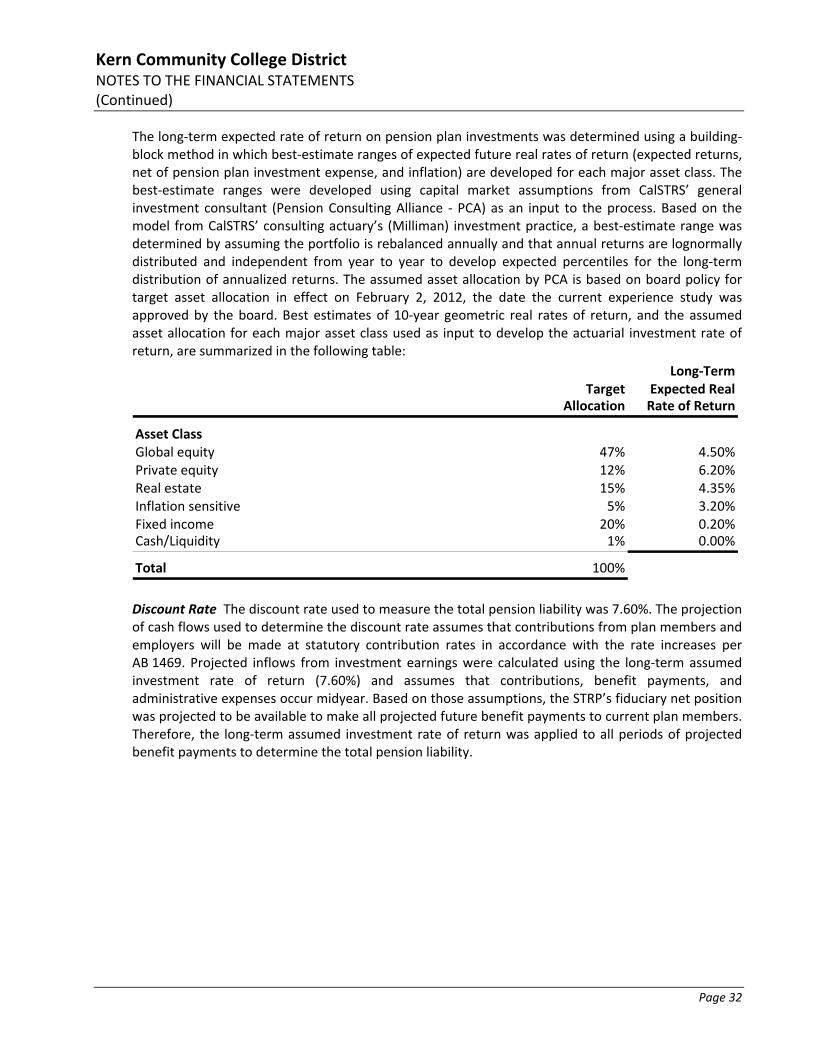
The long‐term expected rate of return on pension plan investments was determined using a building‐block method in which best‐estimate ranges of expected future real rates of return (expected returns, net of pension plan investment expense, and inflation) are developed for each major asset class. The best‐estimate ranges were developed using capital market assumptions from CalSTRS’ general investment consultant (Pension Consulting Alliance ‐ PCA) as an input to the process. Based on the model from CalSTRS’ consulting actuary’s (Milliman) investment practice, a best‐estimate range was determined by assuming the portfolio is rebalanced annually and that annual returns are lognormally distributed and independent from year to year to develop expected percentiles for the long‐term distribution of annualized returns. The assumed asset allocation by PCA is based on board policy for target asset allocation in effect on February 2, 2012, the date the current experience study was approved by the board. Best estimates of 10‐year geometric real rates of return, and the assumed asset allocation for each major asset class used as input to develop the actuarial investment rate of return, are summarized in the following table:
Long‐TermTarget Expected Real
Allocation Rate of Return
Asset ClassGlobal equity 47% 4.50%Private equity 12% 6.20%Real estate 15% 4.35%Inflation sensitive 5% 3.20%Fixed income 20% 0.20%Cash/Liquidity 1% 0.00%
Total 100%
Discount Rate The discount rate used to measure the total pension liability was 7.60%. The projection of cash flows used to determine the discount rate assumes that contributions from plan members and employers will be made at statutory contribution rates in accordance with the rate increases per AB 1469. Projected inflows from investment earnings were calculated using the long‐term assumed investment rate of return (7.60%) and assumes that contributions, benefit payments, and administrative expenses occur midyear. Based on those assumptions, the STRP’s fiduciary net position was projected to be available to make all projected future benefit payments to current plan members. Therefore, the long‐term assumed investment rate of return was applied to all periods of projected benefit payments to determine the total pension liability.
Kern Community College District NOTES TO THE FINANCIAL STATEMENTS (Continued)
Page 33
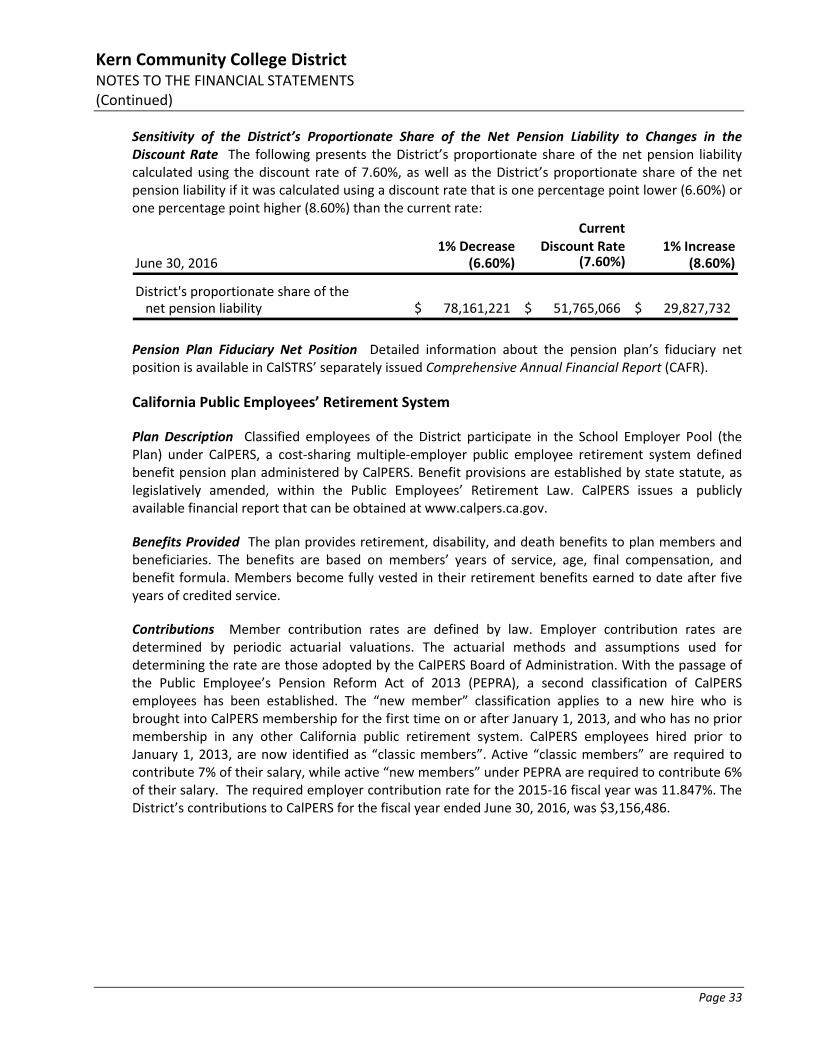
Sensitivity of the District’s Proportionate Share of the Net Pension Liability to Changes in the Discount Rate The following presents the District’s proportionate share of the net pension liability calculated using the discount rate of 7.60%, as well as the District’s proportionate share of the net pension liability if it was calculated using a discount rate that is one percentage point lower (6.60%) or one percentage point higher (8.60%) than the current rate:
Current1% Decrease Discount Rate 1% Increase
June 30, 2016 (6.60%) (7.60%) (8.60%)
District's proportionate share of the net pension liability 78,161,221$ 51,765,066$ 29,827,732$
Pension Plan Fiduciary Net Position Detailed information about the pension plan’s fiduciary net position is available in CalSTRS’ separately issued Comprehensive Annual Financial Report (CAFR).
California Public Employees’ Retirement System
Plan Description Classified employees of the District participate in the School Employer Pool (the Plan) under CalPERS, a cost‐sharing multiple‐employer public employee retirement system defined benefit pension plan administered by CalPERS. Benefit provisions are established by state statute, as legislatively amended, within the Public Employees’ Retirement Law. CalPERS issues a publicly available financial report that can be obtained at www.calpers.ca.gov.
Benefits Provided The plan provides retirement, disability, and death benefits to plan members and beneficiaries. The benefits are based on members’ years of service, age, final compensation, and benefit formula. Members become fully vested in their retirement benefits earned to date after five years of credited service.
Contributions Member contribution rates are defined by law. Employer contribution rates are determined by periodic actuarial valuations. The actuarial methods and assumptions used for determining the rate are those adopted by the CalPERS Board of Administration. With the passage of the Public Employee’s Pension Reform Act of 2013 (PEPRA), a second classification of CalPERS employees has been established. The “new member” classification applies to a new hire who is brought into CalPERS membership for the first time on or after January 1, 2013, and who has no prior membership in any other California public retirement system. CalPERS employees hired prior to January 1, 2013, are now identified as “classic members”. Active “classic members” are required to contribute 7% of their salary, while active “new members” under PEPRA are required to contribute 6% of their salary. The required employer contribution rate for the 2015‐16 fiscal year was 11.847%. The District’s contributions to CalPERS for the fiscal year ended June 30, 2016, was $3,156,486.
Kern Community College District NOTES TO THE FINANCIAL STATEMENTS (Continued)
Page 34
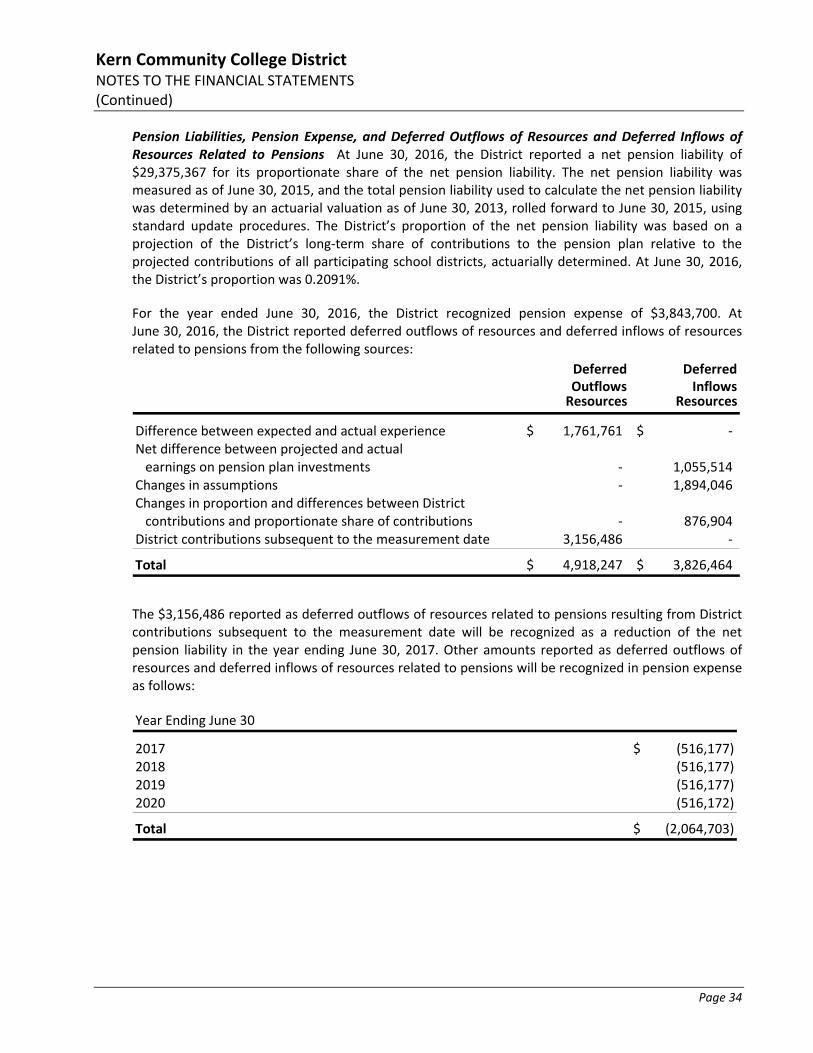
Pension Liabilities, Pension Expense, and Deferred Outflows of Resources and Deferred Inflows of Resources Related to Pensions At June 30, 2016, the District reported a net pension liability of $29,375,367 for its proportionate share of the net pension liability. The net pension liability was measured as of June 30, 2015, and the total pension liability used to calculate the net pension liability was determined by an actuarial valuation as of June 30, 2013, rolled forward to June 30, 2015, using standard update procedures. The District’s proportion of the net pension liability was based on a projection of the District’s long‐term share of contributions to the pension plan relative to the projected contributions of all participating school districts, actuarially determined. At June 30, 2016, the District’s proportion was 0.2091%.
For the year ended June 30, 2016, the District recognized pension expense of $3,843,700. At June 30, 2016, the District reported deferred outflows of resources and deferred inflows of resources related to pensions from the following sources:
Deferred DeferredOutflows InflowsResources Resources
Difference between expected and actual experience 1,761,761$ ‐$ Net difference between projected and actual earnings on pension plan investments ‐ 1,055,514
Changes in assumptions ‐ 1,894,046 Changes in proportion and differences between Districtcontributions and proportionate share of contributions ‐ 876,904
District contributions subsequent to the measurement date 3,156,486 ‐
Total 4,918,247$ 3,826,464$
The $3,156,486 reported as deferred outflows of resources related to pensions resulting from District contributions subsequent to the measurement date will be recognized as a reduction of the net pension liability in the year ending June 30, 2017. Other amounts reported as deferred outflows of resources and deferred inflows of resources related to pensions will be recognized in pension expense as follows:
Year Ending June 30
2017 (516,177)$ 2018 (516,177) 2019 (516,177) 2020 (516,172)
Total (2,064,703)$
Kern Community College District NOTES TO THE FINANCIAL STATEMENTS (Continued)
Page 35
Actuarial Assumptions The total pension liability in the June 30, 2014, actuarial valuation for CalPERS was determined using the following actuarial assumptions applied to all periods included in the measurement:
Valuation date June 30, 2014Measurement date June 30, 2015Actuarial cost method Entry age normalActuarial assumptions:Discount rate 7.65%Inflation 2.75%Salary increases Varies by entry age and serviceInvestment rate of return 7.65%
CalPERS uses custom mortality tables to best fit the patterns of mortality among its members. The mortality table used was developed based on CalPERS’ specific data. The table includes 20 years of mortality improvements using Society of Actuaries, Scale BB.
The actuarial assumptions used in the June 30, 2014, valuation were based on the results of an actuarial experience study for the period July 1, 1997, through June 30, 2011.
The long‐term expected rate of return on pension plan investments was determined using a building‐block method in which best‐estimate ranges of expected future real rates of return (expected returns, net of pension plan investment expense, and inflation) are developed for each major asset class. In determining the long‐term expected rate of return, staff took into account both short‐term and long‐term market return expectations as well as the expected pension fund cash flows. Using historical returns of all of the funds’ asset classes, expected compound returns were calculated over the short‐term (first 10 years) and the long‐term (11‐60 years) using a building‐block approach. Using the expected nominal returns for both short‐term and long‐term, the present value of benefits was calculated for each fund. The expected rate of return was set by calculating the single equivalent expected return that arrived at the same present value of benefits for cash flows as the one calculated using both short‐term and long‐term returns. The expected rate of return was then set equivalent to the single equivalent rate calculated above and rounded down to the nearest one quarter of one percent.
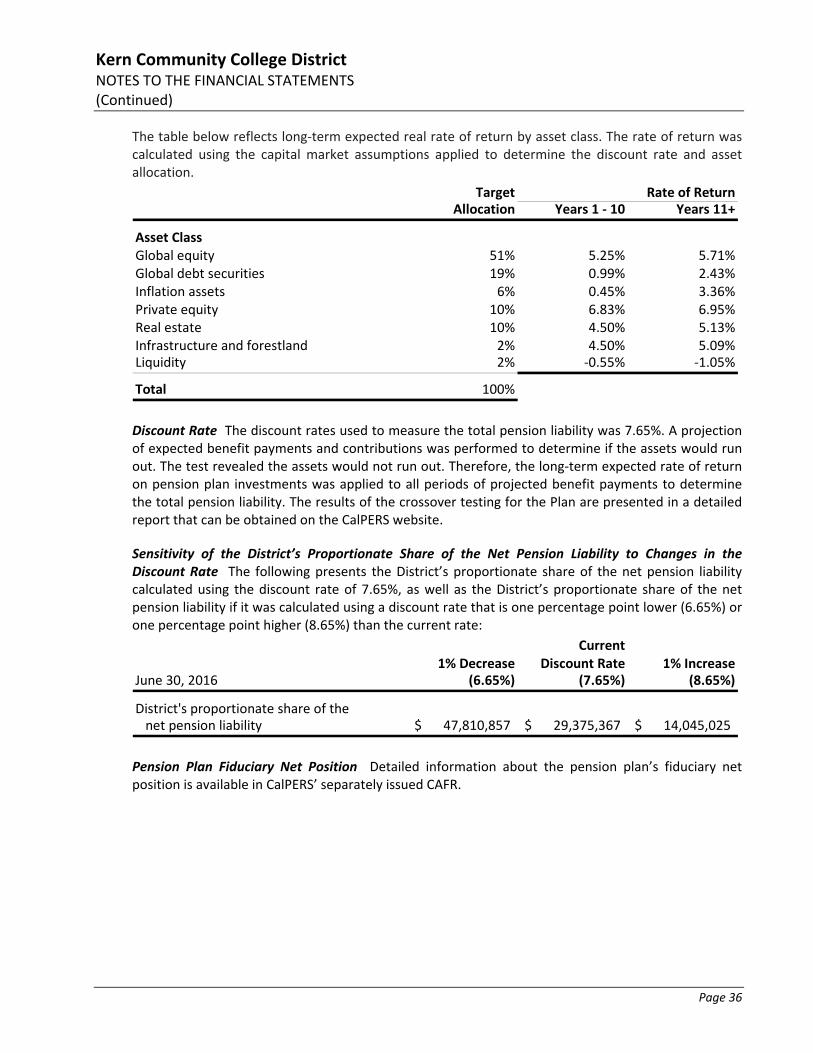
Kern Community College District NOTES TO THE FINANCIAL STATEMENTS (Continued)
Page 36
The table below reflects long‐term expected real rate of return by asset class. The rate of return was calculated using the capital market assumptions applied to determine the discount rate and asset allocation.
Target Rate of ReturnAllocation Years 1 ‐ 10 Years 11+
Asset ClassGlobal equity 51% 5.25% 5.71%Global debt securities 19% 0.99% 2.43%Inflation assets 6% 0.45% 3.36%Private equity 10% 6.83% 6.95%Real estate 10% 4.50% 5.13%Infrastructure and forestland 2% 4.50% 5.09%Liquidity 2% ‐0.55% ‐1.05%
Total 100%
Discount Rate The discount rates used to measure the total pension liability was 7.65%. A projection of expected benefit payments and contributions was performed to determine if the assets would run out. The test revealed the assets would not run out. Therefore, the long‐term expected rate of return on pension plan investments was applied to all periods of projected benefit payments to determine the total pension liability. The results of the crossover testing for the Plan are presented in a detailed report that can be obtained on the CalPERS website.
Sensitivity of the District’s Proportionate Share of the Net Pension Liability to Changes in the Discount Rate The following presents the District’s proportionate share of the net pension liability calculated using the discount rate of 7.65%, as well as the District’s proportionate share of the net pension liability if it was calculated using a discount rate that is one percentage point lower (6.65%) or one percentage point higher (8.65%) than the current rate:
Current1% Decrease Discount Rate 1% Increase
June 30, 2016 (6.65%) (7.65%) (8.65%)
District's proportionate share of the net pension liability 47,810,857$ 29,375,367$ 14,045,025$
Pension Plan Fiduciary Net Position Detailed information about the pension plan’s fiduciary net position is available in CalPERS’ separately issued CAFR.

Kern Community College District NOTES TO THE FINANCIAL STATEMENTS (Continued)
Page 37
9. STATE AND FEDERAL ALLOWANCES, AWARDS, AND GRANTS
The District has received state and federal funds for specific purposes that are subject to review and audit by the grantor agencies. Although such audits could generate expenditure disallowance under terms of the grants, management believes that any required reimbursements will not be material.
10. RISK MANAGEMENT
The District participates in three joint powers agreements (JPAs) with the Self‐Insured Schools of California Workers’ Compensation Program (SISC I), Self‐Insured Schools of California Property and Liability Program (SISC II), and Self‐Insured Schools of California Health Benefits Program (SISC III). Self‐Insured Schools of California (SISC) arranges for and provides insurance for its members. SISC groups are governed by boards consisting of representatives from member districts. The boards control the operations of SISC, including selection of management and approval of operating budgets, independent of any influence by the member districts beyond their representation on the board. Each member district pays a premium commensurate with the level of coverage requested and shares surpluses and deficits proportionate to their participation in SISC.
Coverage includes property, liability/auto, crime, and boiler/machinery insurance. Liability losses in excess of the District’s $1,000 retention amount are covered up to $1,500,000 per occurrence. Coverage above the $1,500,000 level up to $50,000,000 is afforded by three excess commercial insurers. Property losses in excess of the District’s $5,000 retention amount are covered up to $250,000 per occurrence. Coverage above the $250,000 level up to $140,000,000 is afforded by three excess commercial insurers. There has been no significant reduction in any of the insurance coverages from prior year. Settled claims resulting from these programs have not exceeded insurance coverage in each of the past three fiscal years.
The District has recorded no excess insurance reserves being held by SISC as of June 30, 2016.
11. OTHER POSTEMPLOYMENT BENEFITS (OPEB)
The District provides postemployment healthcare benefits for eligible employees who retire with CalSTRS or CalPERS pension benefits immediately upon termination of employment from the District through the Kern Community College District Postretirement Health Benefits Plan (the Plan). The Plan is a single employer OPEB plan and obligations of the Plan members and the District are based on negotiated contracts with the various bargaining units of the District.
Plan Description
Retirees are eligible for benefits depending on their most recent date of hire and their benefit eligibility service. The District pays up to 100% of the eligible retirees’ medical, dental, and vision plan premiums.
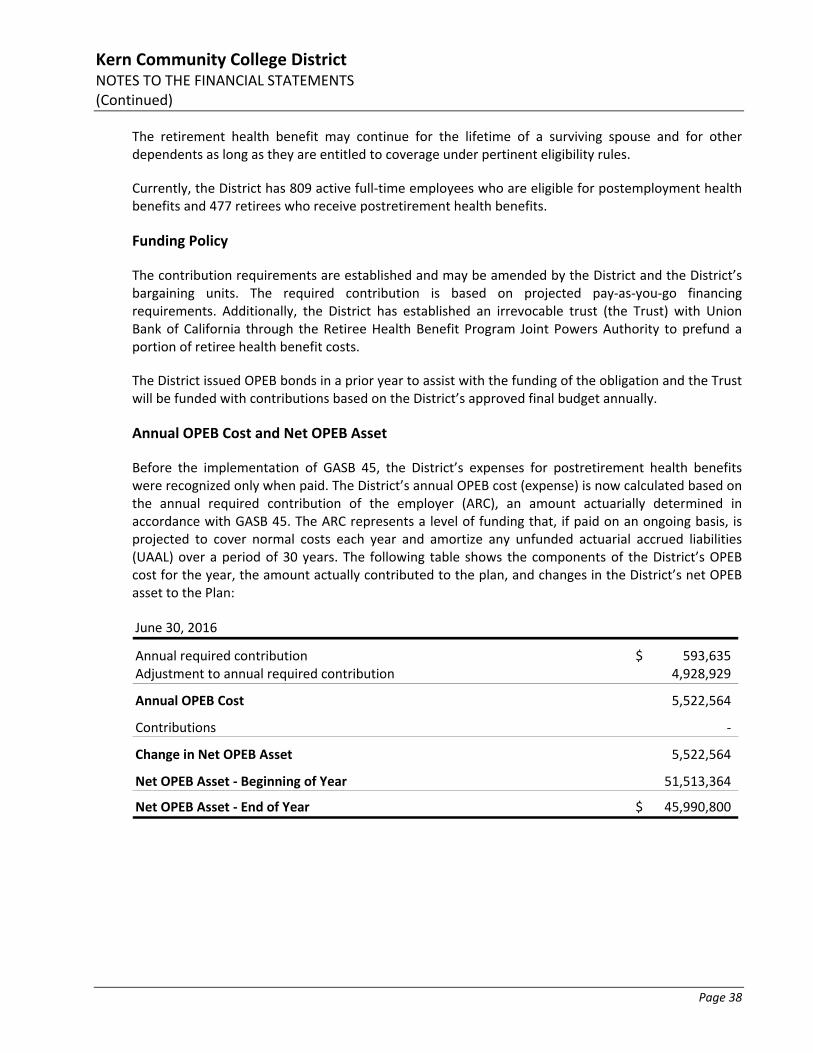
Kern Community College District NOTES TO THE FINANCIAL STATEMENTS (Continued)
Page 38
The retirement health benefit may continue for the lifetime of a surviving spouse and for other dependents as long as they are entitled to coverage under pertinent eligibility rules.
Currently, the District has 809 active full‐time employees who are eligible for postemployment health benefits and 477 retirees who receive postretirement health benefits.
Funding Policy
The contribution requirements are established and may be amended by the District and the District’s bargaining units. The required contribution is based on projected pay‐as‐you‐go financing requirements. Additionally, the District has established an irrevocable trust (the Trust) with Union Bank of California through the Retiree Health Benefit Program Joint Powers Authority to prefund a portion of retiree health benefit costs.
The District issued OPEB bonds in a prior year to assist with the funding of the obligation and the Trust will be funded with contributions based on the District’s approved final budget annually.
Annual OPEB Cost and Net OPEB Asset
Before the implementation of GASB 45, the District’s expenses for postretirement health benefits were recognized only when paid. The District’s annual OPEB cost (expense) is now calculated based on the annual required contribution of the employer (ARC), an amount actuarially determined in accordance with GASB 45. The ARC represents a level of funding that, if paid on an ongoing basis, is projected to cover normal costs each year and amortize any unfunded actuarial accrued liabilities (UAAL) over a period of 30 years. The following table shows the components of the District’s OPEB cost for the year, the amount actually contributed to the plan, and changes in the District’s net OPEB asset to the Plan:
June 30, 2016
Annual required contribution 593,635$ Adjustment to annual required contribution 4,928,929
Annual OPEB Cost 5,522,564
Contributions ‐
Change in Net OPEB Asset 5,522,564
Net OPEB Asset ‐ Beginning of Year 51,513,364
Net OPEB Asset ‐ End of Year 45,990,800$
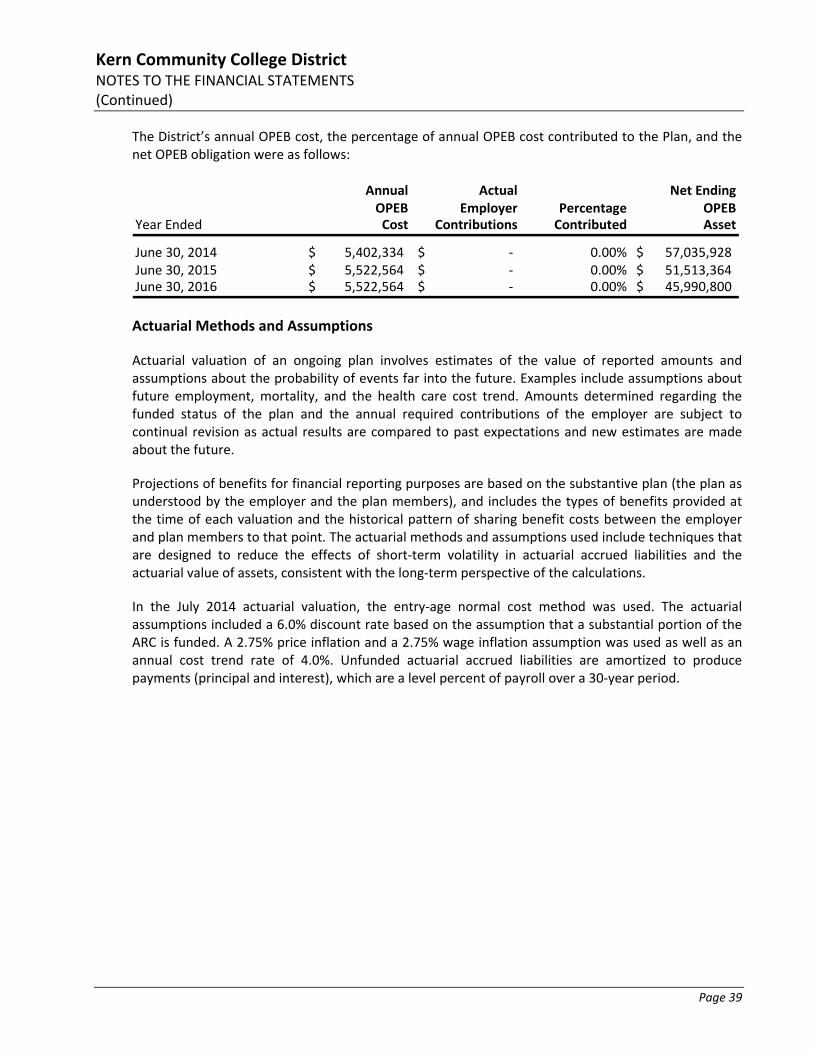
Kern Community College District NOTES TO THE FINANCIAL STATEMENTS (Continued)
Page 39
The District’s annual OPEB cost, the percentage of annual OPEB cost contributed to the Plan, and the net OPEB obligation were as follows:
Annual Actual Net EndingOPEB Employer Percentage OPEB
Year Ended Cost Contributions Contributed Asset
June 30, 2014 5,402,334$ ‐$ 0.00% 57,035,928$ June 30, 2015 5,522,564$ ‐$ 0.00% 51,513,364$ June 30, 2016 5,522,564$ ‐$ 0.00% 45,990,800$
Actuarial Methods and Assumptions
Actuarial valuation of an ongoing plan involves estimates of the value of reported amounts and assumptions about the probability of events far into the future. Examples include assumptions about future employment, mortality, and the health care cost trend. Amounts determined regarding the funded status of the plan and the annual required contributions of the employer are subject to continual revision as actual results are compared to past expectations and new estimates are made about the future.
Projections of benefits for financial reporting purposes are based on the substantive plan (the plan as understood by the employer and the plan members), and includes the types of benefits provided at the time of each valuation and the historical pattern of sharing benefit costs between the employer and plan members to that point. The actuarial methods and assumptions used include techniques that are designed to reduce the effects of short‐term volatility in actuarial accrued liabilities and the actuarial value of assets, consistent with the long‐term perspective of the calculations.
In the July 2014 actuarial valuation, the entry‐age normal cost method was used. The actuarial assumptions included a 6.0% discount rate based on the assumption that a substantial portion of the ARC is funded. A 2.75% price inflation and a 2.75% wage inflation assumption was used as well as an annual cost trend rate of 4.0%. Unfunded actuarial accrued liabilities are amortized to produce payments (principal and interest), which are a level percent of payroll over a 30‐year period.
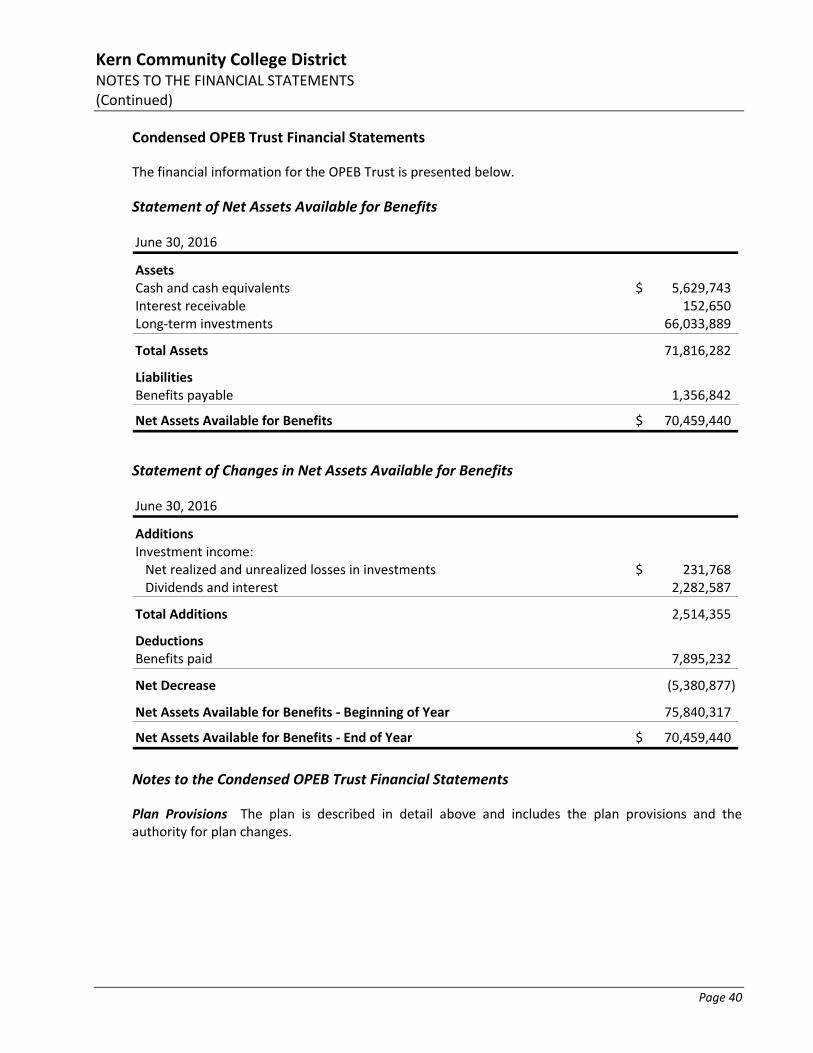
Kern Community College District NOTES TO THE FINANCIAL STATEMENTS (Continued)
Page 40
Condensed OPEB Trust Financial Statements
The financial information for the OPEB Trust is presented below.
Statement of Net Assets Available for Benefits
June 30, 2016
AssetsCash and cash equivalents 5,629,743$ Interest receivable 152,650 Long‐term investments 66,033,889
Total Assets 71,816,282
LiabilitiesBenefits payable 1,356,842
Net Assets Available for Benefits 70,459,440$
Statement of Changes in Net Assets Available for Benefits
June 30, 2016
AdditionsInvestment income:Net realized and unrealized losses in investments 231,768$ Dividends and interest 2,282,587
Total Additions 2,514,355
DeductionsBenefits paid 7,895,232
Net Decrease (5,380,877)
Net Assets Available for Benefits ‐ Beginning of Year 75,840,317
Net Assets Available for Benefits ‐ End of Year 70,459,440$
Notes to the Condensed OPEB Trust Financial Statements
Plan Provisions The plan is described in detail above and includes the plan provisions and the authority for plan changes.
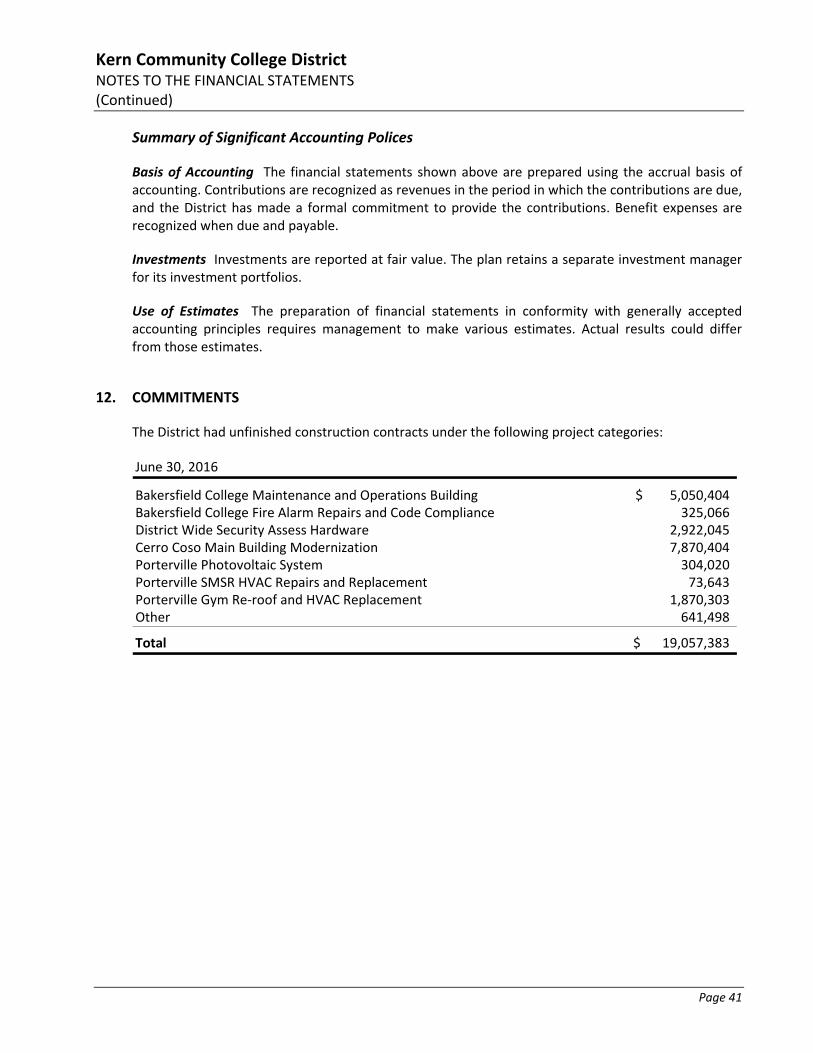
Kern Community College District NOTES TO THE FINANCIAL STATEMENTS (Continued)
Page 41
Summary of Significant Accounting Polices
Basis of Accounting The financial statements shown above are prepared using the accrual basis of accounting. Contributions are recognized as revenues in the period in which the contributions are due, and the District has made a formal commitment to provide the contributions. Benefit expenses are recognized when due and payable.
Investments Investments are reported at fair value. The plan retains a separate investment manager for its investment portfolios.
Use of Estimates The preparation of financial statements in conformity with generally accepted accounting principles requires management to make various estimates. Actual results could differ from those estimates.
12. COMMITMENTS
The District had unfinished construction contracts under the following project categories:
June 30, 2016
Bakersfield College Maintenance and Operations Building 5,050,404$ Bakersfield College Fire Alarm Repairs and Code Compliance 325,066 District Wide Security Assess Hardware 2,922,045 Cerro Coso Main Building Modernization 7,870,404 Porterville Photovoltaic System 304,020 Porterville SMSR HVAC Repairs and Replacement 73,643 Porterville Gym Re‐roof and HVAC Replacement 1,870,303 Other 641,498
Total 19,057,383$
Kern Community College District NOTES TO THE FINANCIAL STATEMENTS (Continued)
Page 42
13. FUTURE GASB IMPLEMENTATION
In June 2015, GASB issued Statement No. 73, Accounting and Financial Reporting for Pensions and Related Assets That Are Not Within the Scope of GASB Statement 68, and Amendments to Certain Provisions of GASB Statements 67 and 68. This statement will improve financial reporting by establishing a single framework for the presentation of information about pensions, which will enhance the comparability of pension‐related information reported by employers and nonemployer contributing entities. This statement establishes requirements for defined benefit pensions that are not within the scope of GASB Statement No. 68, Accounting and Financial Reporting for Pensions, as well as for the assets accumulated for purposes of providing for those pensions. In addition, it establishes requirements for defined contribution pensions that are not within the scope of GASB Statement No. 68. It also amends certain provisions of GASB Statement No. 67, Financial Reporting for Pension Plans, and GASB Statement No. 68 for pension plans and pensions that are within their respective scopes. The District’s management has not yet determined the impact that implementation of these standards, which was required on July 1, 2016, will have on the District’s financial statements, if any.
In June 2015, GASB issued Statement No. 74, Financial Reporting for Postemployment Benefits Other Than Pension Plans (OPEB). This statement will improve the usefulness of information about OPEB included in the general purpose external financial reports of state and local governmental OPEB plans for making decisions and assessing accountability. The scope of this statement includes OPEB plans administered through trusts that meet certain criteria. It also includes requirements to address financial reporting for assets accumulated for purposes of providing defined OPEB through OPEB plans that are not administered through trusts that meet specified criteria. The District’s management has not yet determined the impact that implementation of these standards, which is required on July 1, 2017, will have on the District’s financial statements, if any.
In June 2015, GASB issued Statement No. 75, Accounting and Financial Reporting for Postemployment Benefits Other Than Pensions. This statement will improve accounting and financial reporting by state and local governments for postemployment benefits other than pensions. It also improves information provided by state and local governmental employers about financial support for OPEB that is provided by other entities. GASB Statement No. 75 replaces the requirements of Statements No. 45, Accounting and Financial Reporting by Employers for Postemployment Benefits Other Than Pensions, as amended, and No. 57, OPEB Measurements by Agent Employers and Agent Multiple‐Employer Plans, for OPEB. This statement establishes standards for recognizing and measuring liabilities, deferred outflows of resources, deferred inflows of resources, and expense/expenditures. For defined benefit OPEB, this statement identifies the methods and assumptions that are required to be used to project benefit payments, discount projected benefit payments to their actuarial present value, and attribute that present value to periods of employee service. Note disclosure and required supplementary information requirements about defined benefit OPEB also are addressed. The District’s management has not yet determined the impact that implementation of these standards, which is required on July 1, 2017, will have on the District’s financial statements, if any.
Kern Community College District NOTES TO THE FINANCIAL STATEMENTS (Continued)
Page 43
In January 2016, GASB issued Statement No. 80, Blending Requirements for Certain Component Units—An Amendment of GASB Statement No. 14. This statement amends the blending requirements for the financial statement presentation of component units of all state and local governments. The additional criterion requires blending of a component unit incorporated as a not‐for‐profit corporation in which the primary government is the sole corporate member. The District’s management has not yet determined the impact that implementation of these standards, which was required on July 1, 2016, will have on the District’s financial statements, if any.
In March 2016, GASB issued Statement No. 82, Pension Issues—An Amendment of GASB Statements No. 67, No. 68, and No. 73. This statement addresses certain issues that have been raised with respect to Statements No. 67, Financial Reporting for Pension Plans, No. 68, Accounting and Financial Reporting for Pensions, and No. 73, Accounting and Financial Reporting for Pensions and Related Assets That Are Not Within the Scope of GASB Statement 68, and Amendments to Certain Provisions of GASB Statements 67 and 68. Specifically, it addresses issues regarding (1) the presentation of payroll‐related measures in required supplementary information, (2) the selection of assumptions and the treatment of deviations from the guidance in an Actuarial Standard of Practice for financial reporting purposes, and (3) the classification of payments made by employers to satisfy employee (plan member) contribution requirements. The District’s management has not yet determined the impact that implementation of these standards, which was required on July 1, 2016, will have on the District’s financial statements, if any.
REQUIRED SUPPLEMENTARY INFORMATION
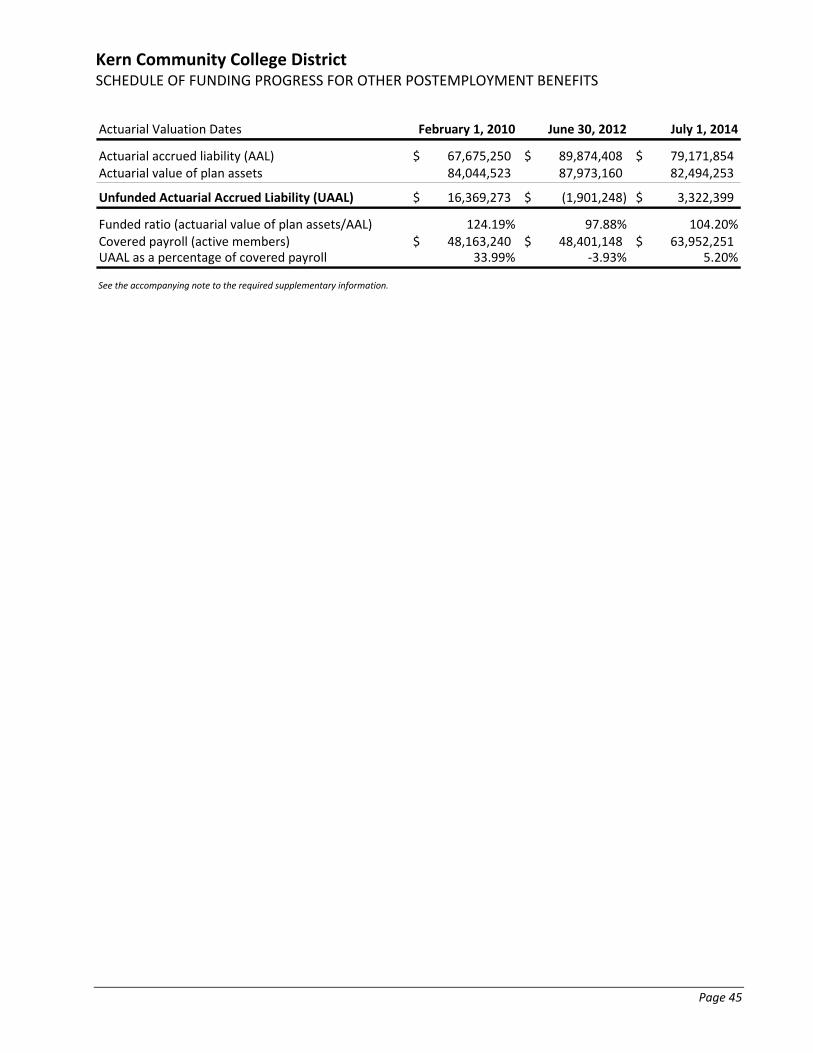
Kern Community College District SCHEDULE OF FUNDING PROGRESS FOR OTHER POSTEMPLOYMENT BENEFITS
Page 45
Actuarial Valuation Dates February 1, 2010 June 30, 2012 July 1, 2014
Actuarial accrued liability (AAL) 67,675,250$ 89,874,408$ 79,171,854$ Actuarial value of plan assets 84,044,523 87,973,160 82,494,253
Unfunded Actuarial Accrued Liability (UAAL) 16,369,273$ (1,901,248)$ 3,322,399$
Funded ratio (actuarial value of plan assets/AAL) 124.19% 97.88% 104.20%Covered payroll (active members) 48,163,240$ 48,401,148$ 63,952,251$ UAAL as a percentage of covered payroll 33.99% ‐3.93% 5.20%
See the accompanying note to the required supplementary information.
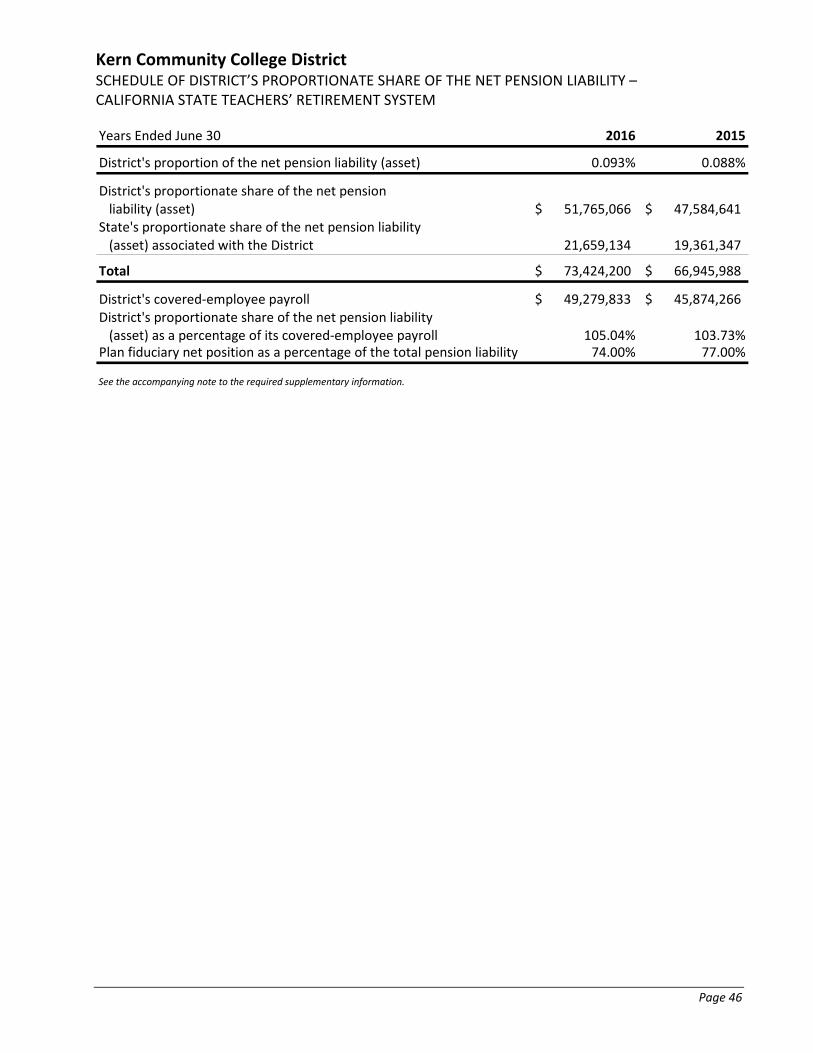
Kern Community College District SCHEDULE OF DISTRICT’S PROPORTIONATE SHARE OF THE NET PENSION LIABILITY – CALIFORNIA STATE TEACHERS’ RETIREMENT SYSTEM
Page 46
Years Ended June 30 2016 2015
District's proportion of the net pension liability (asset) 0.093% 0.088%
District's proportionate share of the net pension liability (asset) 51,765,066$ 47,584,641$
State's proportionate share of the net pension liability (asset) associated with the District 21,659,134 19,361,347
Total 73,424,200$ 66,945,988$
District's covered‐employee payroll 49,279,833$ 45,874,266$ District's proportionate share of the net pension liability (asset) as a percentage of its covered‐employee payroll 105.04% 103.73%
Plan fiduciary net position as a percentage of the total pension liability 74.00% 77.00%
See the accompanying note to the required supplementary information.
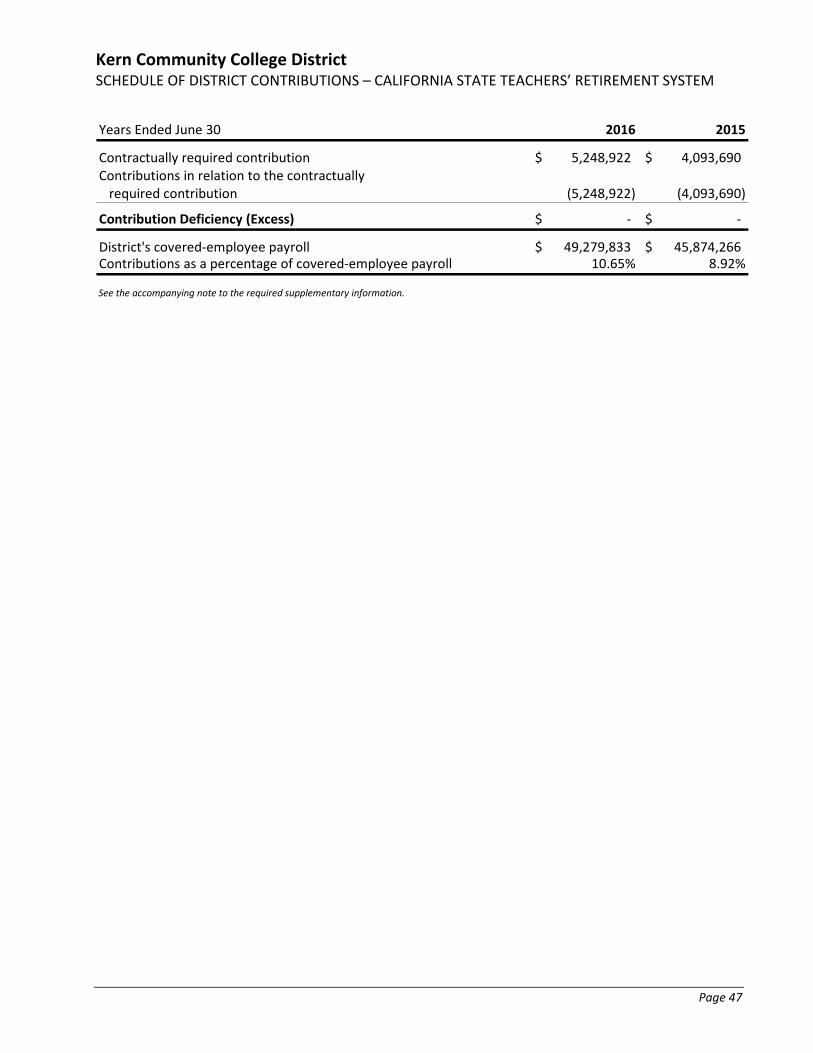
Kern Community College District SCHEDULE OF DISTRICT CONTRIBUTIONS – CALIFORNIA STATE TEACHERS’ RETIREMENT SYSTEM
Page 47
Years Ended June 30 2016 2015
Contractually required contribution 5,248,922$ 4,093,690$ Contributions in relation to the contractually required contribution (5,248,922) (4,093,690)
Contribution Deficiency (Excess) ‐$ ‐$
District's covered‐employee payroll 49,279,833$ 45,874,266$ Contributions as a percentage of covered‐employee payroll 10.65% 8.92%
See the accompanying note to the required supplementary information.
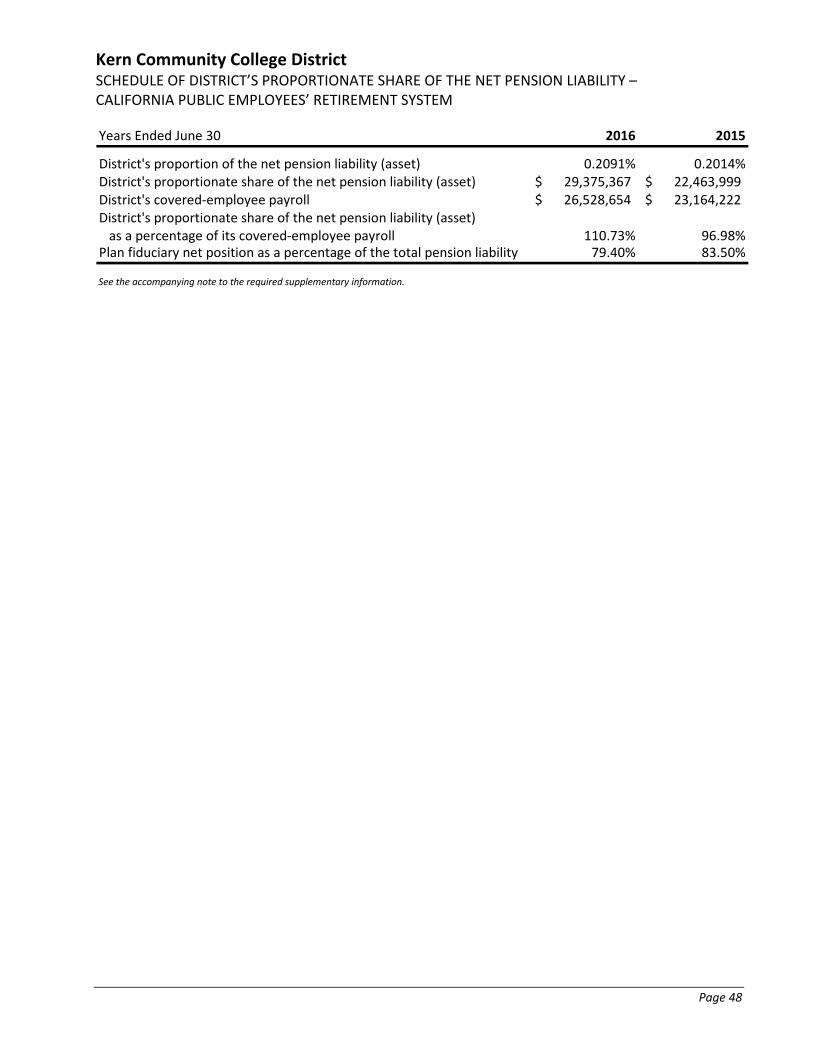
Kern Community College District SCHEDULE OF DISTRICT’S PROPORTIONATE SHARE OF THE NET PENSION LIABILITY – CALIFORNIA PUBLIC EMPLOYEES’ RETIREMENT SYSTEM
Page 48
Years Ended June 30 2016 2015
District's proportion of the net pension liability (asset) 0.2091% 0.2014%District's proportionate share of the net pension liability (asset) 29,375,367$ 22,463,999$ District's covered‐employee payroll 26,528,654$ 23,164,222$ District's proportionate share of the net pension liability (asset) as a percentage of its covered‐employee payroll 110.73% 96.98%
Plan fiduciary net position as a percentage of the total pension liability 79.40% 83.50%
See the accompanying note to the required supplementary information.

Kern Community College District SCHEDULE OF DISTRICT CONTRIBUTIONS – CALIFORNIA PUBLIC EMPLOYEES’ RETIREMENT SYSTEM
Page 49
Years Ended June 30 2016 2015
Contractually required contribution 3,156,486$ 2,725,027$ Contributions in relation to the contractually required contribution (3,156,486) (2,725,027)
Contribution Deficiency (Excess) ‐$ ‐$
District's covered‐employee payroll 26,528,654$ 23,164,222$ Contributions as a percentage of covered‐employee payroll 11.90% 11.76%
See the accompanying note to the required supplementary information.
Kern Community College District NOTE TO THE REQUIRED SUPPLEMENTARY INFORMATION
Page 50
CHANGES OF BENEFIT TERMS
California State Teachers’ Retirement System
There were no significant changes of benefit terms from the June 30, 2013, actuarial variation.
California Public Employees’ Retirement System
Public agencies can make changes to their plan provisions, and such changes occur on an ongoing basis. A summary of the plan provisions used for a specific plan can be found in the plan’s annual valuation report.
CHANGES OF ASSUMPTIONS
California State Teachers’ Retirement System
There were no changes in major assumptions from the June 30, 2013, actuarial valuation.
California Public Employees’ Retirement System
No changes have occurred to the actuarial assumptions since the CalPERS Board adopted new actuarial assumptions in February 2014. The most significant change to the actuarial assumptions that the Board adopted was the inclusion of future mortality improvement. The actuarial assumptions adopted by the Board are designed to ensure greater sustainability and soundness of the defined benefit pension plans, and they will be better at predicting future experiences resulting in more secure retirement benefits in the decades to come. The current experience study was based on demographic CalPERS data for years 1997 to 2011. The study focused on recent patterns of termination, death, disability, retirement and salary increases. These new assumptions were reflected in the total pension liabilities as of June 30, 2013.
GASB Statement No. 68, paragraph 68 states that the long‐term expected rate of return should be determined net of pension plan investment expense but without reduction for the pension plan administrative expense. The discount rate was changed from 7.50% (net of administrative expense in 2014) to 7.65% as of the June 30, 2015, measurement date to correct the adjustment which previously reduced the discount rate for administrative expense.

OTHER SUPPLEMENTARY INFORMATION SECTION

Kern Community College District ORGANIZATION STRUCTURE June 30, 2016
Page 52
BOARD OF TRUSTEES
Name Office Area Term Expires
Mr. Dennis L. Beebe President Southwest Bakersfield 2016
Mrs. Kay Meek Vice President Southwest Bakersfield 2016
Mr. John S. Corkins Member Porterville 2018
Mr. Romeo Abalog Member Northeastern Kern County 2016
Mr. Mark Storch Clerk Ridgecrest 2018
Dr. Richard Wright Member Central Bakersfield 2018
Mr. Kyle W. Carter Member Central Bakersfield 2018
ADMINISTRATION
Ms. Sandra V. Serrano Chancellor
Mr. Thomas J. Burke Chief Financial Officer
Mr. John Means Associate Chancellor, Economic and Workforce Development
Mr. Ibrahim Ali Vice Chancellor, Human Resources
Ms. Betty Inclan Interim Vice Chancellor, Educational Services
Ms. Michele Bresso Associate Vice Chancellor, Governmental and External Relations
Mr. Christopher Hine General Counsel
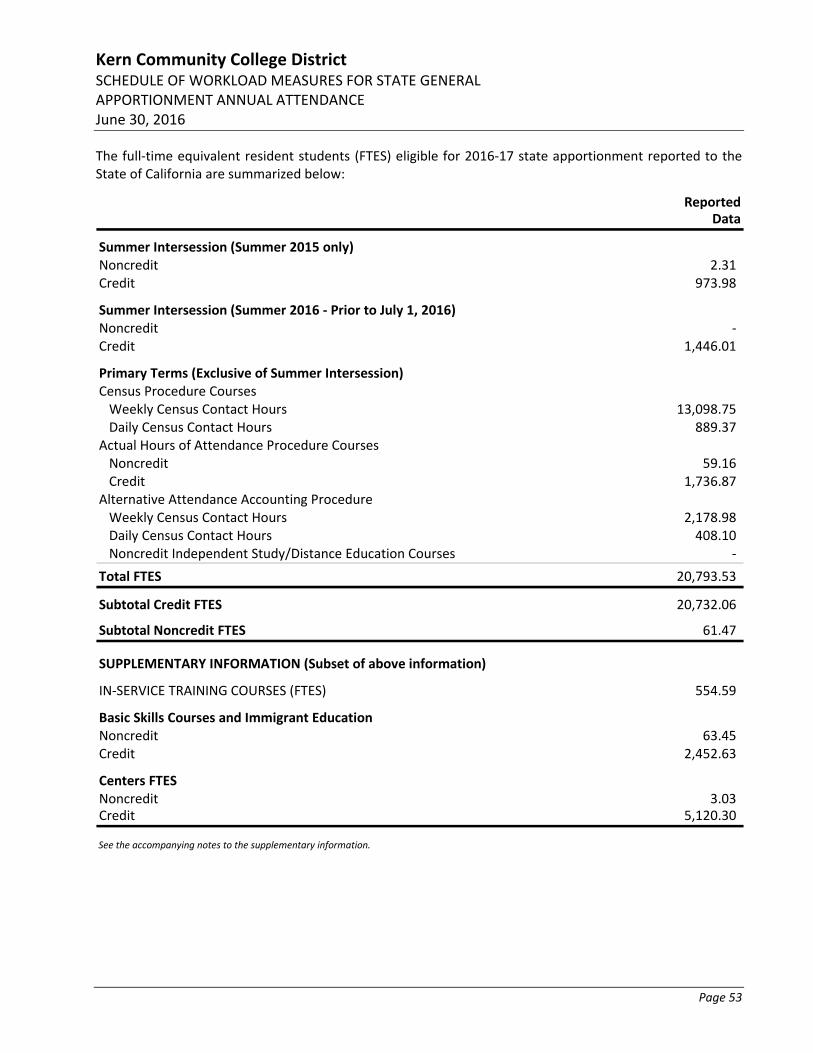
Kern Community College District SCHEDULE OF WORKLOAD MEASURES FOR STATE GENERAL APPORTIONMENT ANNUAL ATTENDANCE June 30, 2016
Page 53
The full‐time equivalent resident students (FTES) eligible for 2016‐17 state apportionment reported to the State of California are summarized below:
ReportedData
Summer Intersession (Summer 2015 only)Noncredit 2.31 Credit 973.98
Summer Intersession (Summer 2016 ‐ Prior to July 1, 2016)Noncredit ‐ Credit 1,446.01
Primary Terms (Exclusive of Summer Intersession)Census Procedure CoursesWeekly Census Contact Hours 13,098.75 Daily Census Contact Hours 889.37
Actual Hours of Attendance Procedure CoursesNoncredit 59.16 Credit 1,736.87
Alternative Attendance Accounting ProcedureWeekly Census Contact Hours 2,178.98 Daily Census Contact Hours 408.10 Noncredit Independent Study/Distance Education Courses ‐
Total FTES 20,793.53
Subtotal Credit FTES 20,732.06
Subtotal Noncredit FTES 61.47
SUPPLEMENTARY INFORMATION (Subset of above information)
IN‐SERVICE TRAINING COURSES (FTES) 554.59
Basic Skills Courses and Immigrant EducationNoncredit 63.45 Credit 2,452.63
Centers FTESNoncredit 3.03 Credit 5,120.30
See the accompanying notes to the supplementary information.
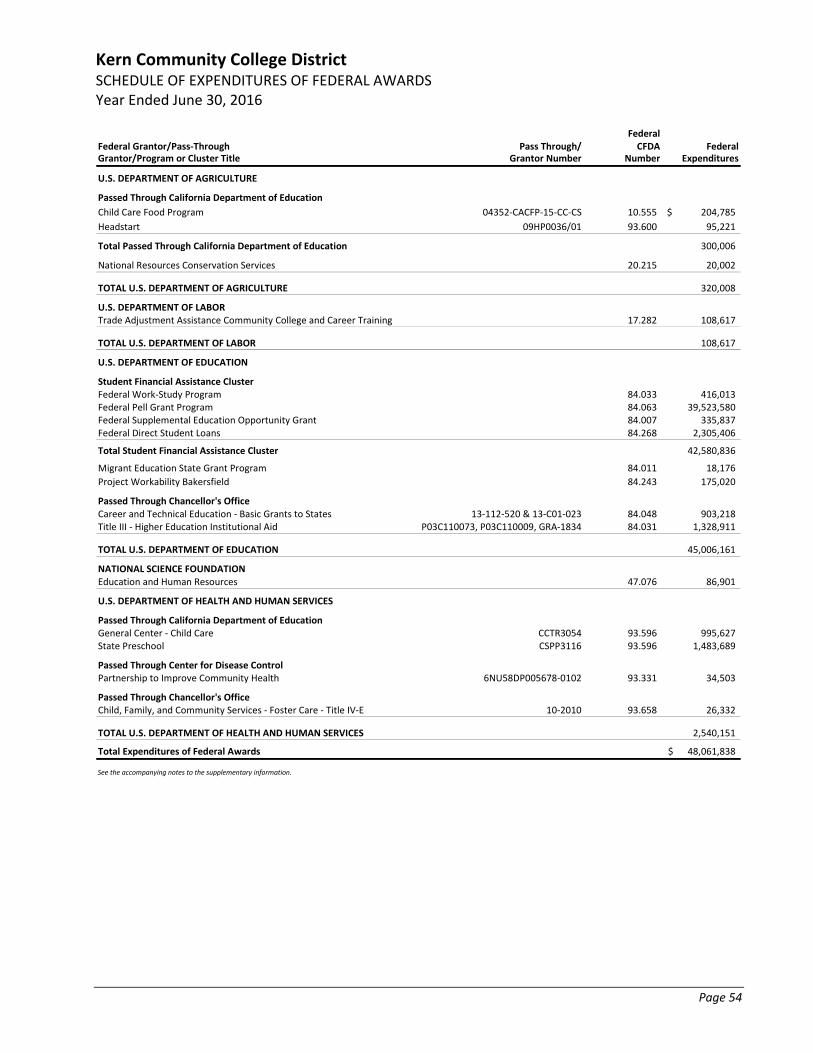
Kern Community College District SCHEDULE OF EXPENDITURES OF FEDERAL AWARDS Year Ended June 30, 2016
Page 54
FederalFederal Grantor/Pass‐Through Pass Through/ CFDA FederalGrantor/Program or Cluster Title Grantor Number Number Expenditures
U.S. DEPARTMENT OF AGRICULTURE
Passed Through California Department of Education
Child Care Food Program 04352‐CACFP‐15‐CC‐CS 10.555 204,785$
Headstart 09HP0036/01 93.600 95,221
Total Passed Through California Department of Education 300,006
National Resources Conservation Services 20.215 20,002
TOTAL U.S. DEPARTMENT OF AGRICULTURE 320,008
U.S. DEPARTMENT OF LABORTrade Adjustment Assistance Community College and Career Training 17.282 108,617
TOTAL U.S. DEPARTMENT OF LABOR 108,617
U.S. DEPARTMENT OF EDUCATION
Student Financial Assistance ClusterFederal Work‐Study Program 84.033 416,013 Federal Pell Grant Program 84.063 39,523,580 Federal Supplemental Education Opportunity Grant 84.007 335,837 Federal Direct Student Loans 84.268 2,305,406
Total Student Financial Assistance Cluster 42,580,836
Migrant Education State Grant Program 84.011 18,176
Project Workability Bakersfield 84.243 175,020
Passed Through Chancellor's OfficeCareer and Technical Education ‐ Basic Grants to States 13‐112‐520 & 13‐C01‐023 84.048 903,218 Title III ‐ Higher Education Institutional Aid P03C110073, P03C110009, GRA‐1834 84.031 1,328,911
TOTAL U.S. DEPARTMENT OF EDUCATION 45,006,161
NATIONAL SCIENCE FOUNDATIONEducation and Human Resources 47.076 86,901
U.S. DEPARTMENT OF HEALTH AND HUMAN SERVICES
Passed Through California Department of EducationGeneral Center ‐ Child Care CCTR3054 93.596 995,627 State Preschool CSPP3116 93.596 1,483,689
Passed Through Center for Disease ControlPartnership to Improve Community Health 6NU58DP005678‐0102 93.331 34,503
Passed Through Chancellor's OfficeChild, Family, and Community Services ‐ Foster Care ‐ Title IV‐E 10‐2010 93.658 26,332
TOTAL U.S. DEPARTMENT OF HEALTH AND HUMAN SERVICES 2,540,151
Total Expenditures of Federal Awards 48,061,838$
See the accompanying notes to the supplementary information.

Kern Community College District SCHEDULE OF EXPENDITURES OF STATE AWARDS Year Ended June 30, 2016
Page 55
Program RevenuesCash Accounts Deferred
Received Receivable Revenue Total
Extended Opportunity Programs and Services 2,542,268$ ‐$ ‐$ 2,542,268$ CalGrants 4,461,428 (128,421) ‐ 4,333,007 Disabled Student Programs and Services 1,628,864 ‐ ‐ 1,628,864 CalWORKS 562,197 ‐ ‐ 562,197 Matriculation 5,230,849 ‐ ‐ 5,230,849 Foster Parent 101,236 (46,045) ‐ 55,191 Project Care 419,450 ‐ ‐ 419,450 BFAP 1,039,442 9,347 ‐ 1,048,789 CTE Collaborative Projects 4,677,030 ‐ (3,401,096) 1,275,934 PC Development Center 315,102 ‐ ‐ 315,102 Basic Skills 477,339 ‐ ‐ 477,339 Enrollment Growth for Nursing 319,875 (130,438) ‐ 189,437 Prop 39 Clean Energy Workforce 1,272,673 41,645 ‐ 1,314,318 State Chancellor's Grants 1,054,845 79,797 (173,012) 961,630 Other State Grants 6,274,582 747,534 (2,613,439) 4,408,677 All other categorical 6,866,880 (5,187) (242,590) 6,619,103
Total State Programs 37,244,060$ 568,232$ (6,430,137)$ 31,382,155$
See the accompanying notes to the supplementary information.
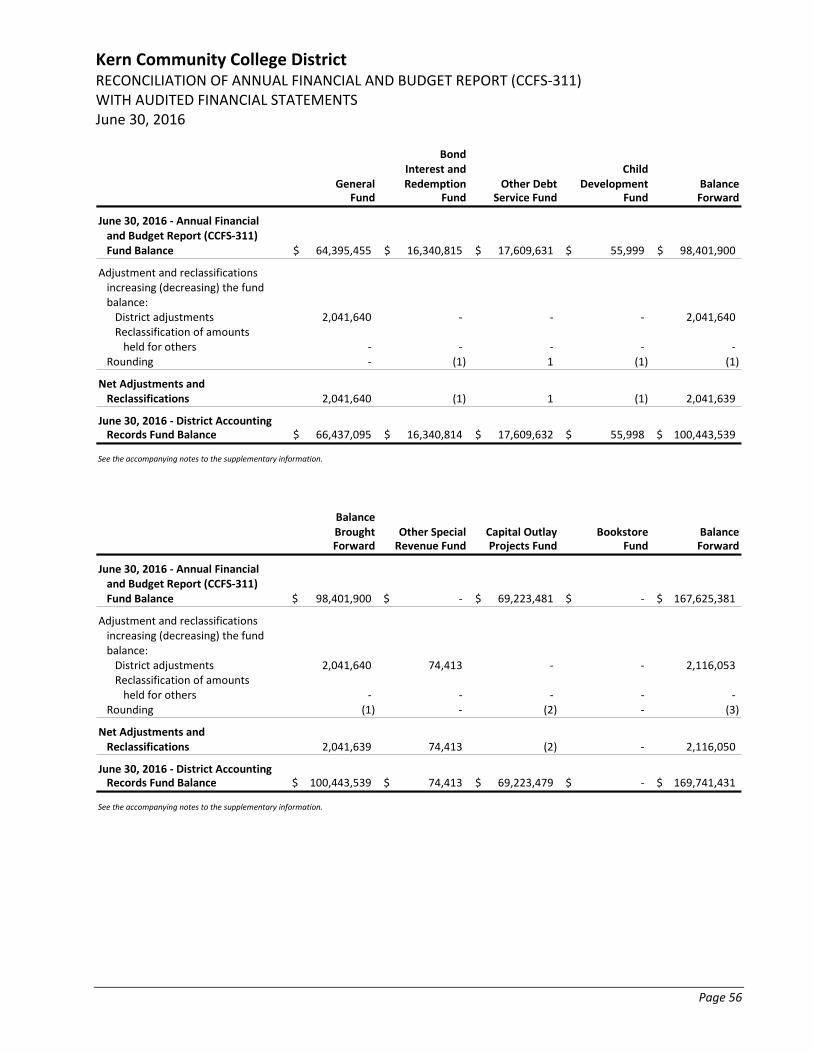
Kern Community College District RECONCILIATION OF ANNUAL FINANCIAL AND BUDGET REPORT (CCFS‐311) WITH AUDITED FINANCIAL STATEMENTS June 30, 2016
Page 56
BondInterest and Child
General Redemption Other Debt Development BalanceFund Fund Service Fund Fund Forward
June 30, 2016 ‐ Annual Financial and Budget Report (CCFS‐311)Fund Balance 64,395,455$ 16,340,815$ 17,609,631$ 55,999$ 98,401,900$
Adjustment and reclassificationsincreasing (decreasing) the fundbalance:District adjustments 2,041,640 ‐ ‐ ‐ 2,041,640 Reclassification of amountsheld for others ‐ ‐ ‐ ‐ ‐
Rounding ‐ (1) 1 (1) (1)
Net Adjustments andReclassifications 2,041,640 (1) 1 (1) 2,041,639
June 30, 2016 ‐ District AccountingRecords Fund Balance 66,437,095$ 16,340,814$ 17,609,632$ 55,998$ 100,443,539$
See the accompanying notes to the supplementary information.
BalanceBrought Other Special Capital Outlay Bookstore BalanceForward Revenue Fund Projects Fund Fund Forward
June 30, 2016 ‐ Annual Financial and Budget Report (CCFS‐311)Fund Balance 98,401,900$ ‐$ 69,223,481$ ‐$ 167,625,381$
Adjustment and reclassificationsincreasing (decreasing) the fundbalance:District adjustments 2,041,640 74,413 ‐ ‐ 2,116,053 Reclassification of amountsheld for others ‐ ‐ ‐ ‐ ‐
Rounding (1) ‐ (2) ‐ (3)
Net Adjustments andReclassifications 2,041,639 74,413 (2) ‐ 2,116,050
June 30, 2016 ‐ District AccountingRecords Fund Balance 100,443,539$ 74,413$ 69,223,479$ ‐$ 169,741,431$
See the accompanying notes to the supplementary information.
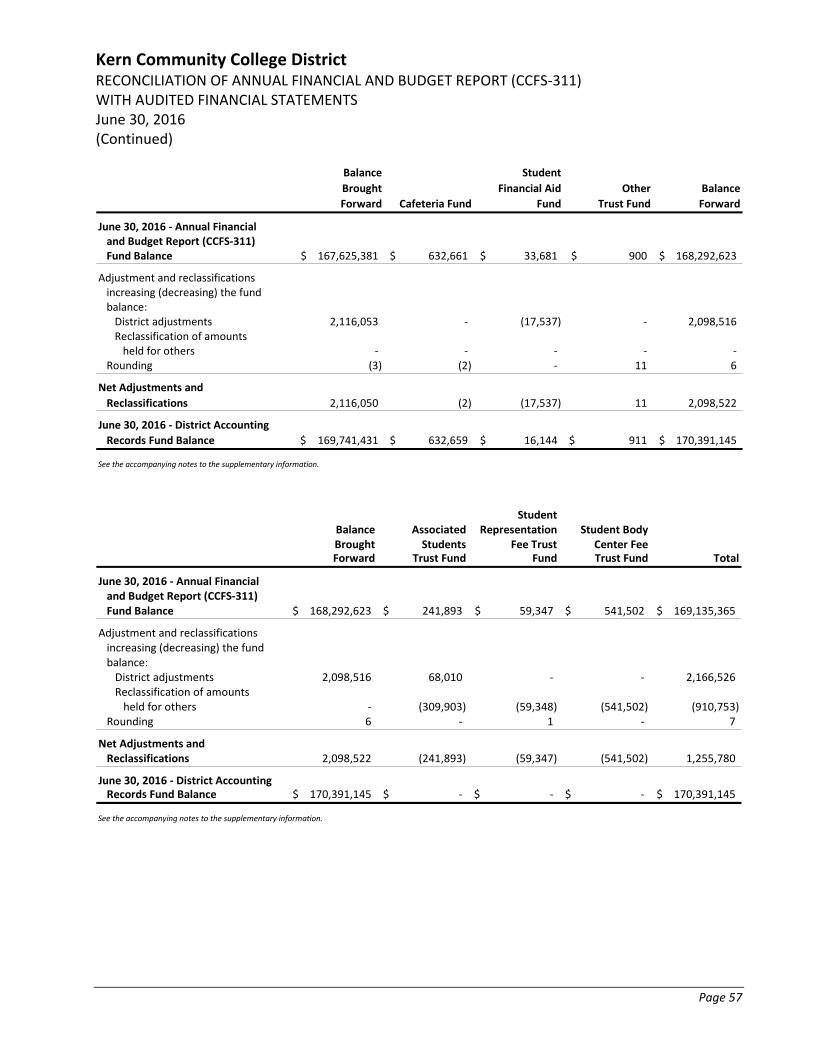
Kern Community College District RECONCILIATION OF ANNUAL FINANCIAL AND BUDGET REPORT (CCFS‐311) WITH AUDITED FINANCIAL STATEMENTS June 30, 2016 (Continued)
Page 57
Balance Student
Brought Financial Aid Other Balance
Forward Cafeteria Fund Fund Trust Fund Forward
June 30, 2016 ‐ Annual Financial and Budget Report (CCFS‐311)Fund Balance 167,625,381$ 632,661$ 33,681$ 900$ 168,292,623$
Adjustment and reclassificationsincreasing (decreasing) the fundbalance:District adjustments 2,116,053 ‐ (17,537) ‐ 2,098,516 Reclassification of amountsheld for others ‐ ‐ ‐ ‐ ‐
Rounding (3) (2) ‐ 11 6
Net Adjustments and
Reclassifications 2,116,050 (2) (17,537) 11 2,098,522
June 30, 2016 ‐ District Accounting
Records Fund Balance 169,741,431$ 632,659$ 16,144$ 911$ 170,391,145$
See the accompanying notes to the supplementary information.
StudentBalance Associated Representation Student BodyBrought Students Fee Trust Center FeeForward Trust Fund Fund Trust Fund Total
June 30, 2016 ‐ Annual Financial and Budget Report (CCFS‐311)Fund Balance 168,292,623$ 241,893$ 59,347$ 541,502$ 169,135,365$
Adjustment and reclassificationsincreasing (decreasing) the fundbalance:District adjustments 2,098,516 68,010 ‐ ‐ 2,166,526 Reclassification of amountsheld for others ‐ (309,903) (59,348) (541,502) (910,753)
Rounding 6 ‐ 1 ‐ 7
Net Adjustments andReclassifications 2,098,522 (241,893) (59,347) (541,502) 1,255,780
June 30, 2016 ‐ District AccountingRecords Fund Balance 170,391,145$ ‐$ ‐$ ‐$ 170,391,145$
See the accompanying notes to the supplementary information.
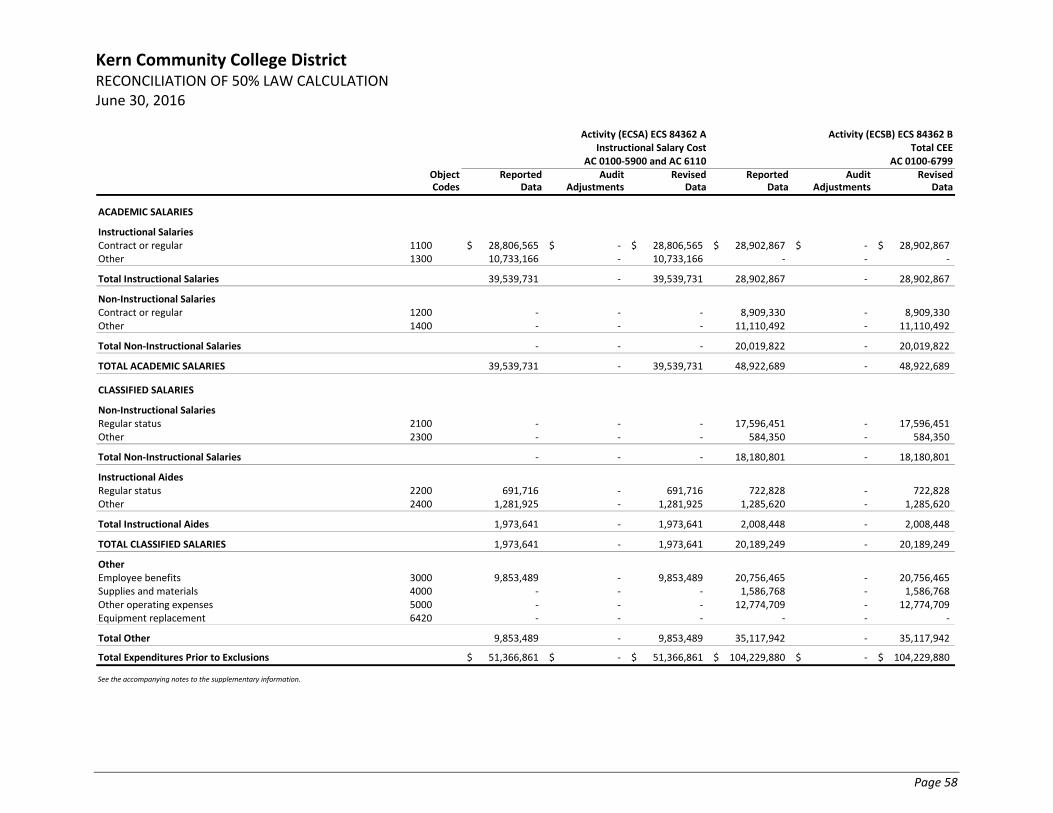
Kern Community College District RECONCILIATION OF 50% LAW CALCULATION June 30, 2016
Page 58
Activity (ECSA) ECS 84362 A Activity (ECSB) ECS 84362 BInstructional Salary Cost Total CEE
AC 0100‐5900 and AC 6110 AC 0100‐6799Object Reported Audit Revised Reported Audit RevisedCodes Data Adjustments Data Data Adjustments Data
ACADEMIC SALARIES
Instructional SalariesContract or regular 1100 28,806,565$ ‐$ 28,806,565$ 28,902,867$ ‐$ 28,902,867$ Other 1300 10,733,166 ‐ 10,733,166 ‐ ‐ ‐
Total Instructional Salaries 39,539,731 ‐ 39,539,731 28,902,867 ‐ 28,902,867
Non‐Instructional SalariesContract or regular 1200 ‐ ‐ ‐ 8,909,330 ‐ 8,909,330 Other 1400 ‐ ‐ ‐ 11,110,492 ‐ 11,110,492
Total Non‐Instructional Salaries ‐ ‐ ‐ 20,019,822 ‐ 20,019,822
TOTAL ACADEMIC SALARIES 39,539,731 ‐ 39,539,731 48,922,689 ‐ 48,922,689
CLASSIFIED SALARIES
Non‐Instructional SalariesRegular status 2100 ‐ ‐ ‐ 17,596,451 ‐ 17,596,451 Other 2300 ‐ ‐ ‐ 584,350 ‐ 584,350
Total Non‐Instructional Salaries ‐ ‐ ‐ 18,180,801 ‐ 18,180,801
Instructional AidesRegular status 2200 691,716 ‐ 691,716 722,828 ‐ 722,828 Other 2400 1,281,925 ‐ 1,281,925 1,285,620 ‐ 1,285,620
Total Instructional Aides 1,973,641 ‐ 1,973,641 2,008,448 ‐ 2,008,448
TOTAL CLASSIFIED SALARIES 1,973,641 ‐ 1,973,641 20,189,249 ‐ 20,189,249
OtherEmployee benefits 3000 9,853,489 ‐ 9,853,489 20,756,465 ‐ 20,756,465 Supplies and materials 4000 ‐ ‐ ‐ 1,586,768 ‐ 1,586,768 Other operating expenses 5000 ‐ ‐ ‐ 12,774,709 ‐ 12,774,709 Equipment replacement 6420 ‐ ‐ ‐ ‐ ‐ ‐
Total Other 9,853,489 ‐ 9,853,489 35,117,942 ‐ 35,117,942
Total Expenditures Prior to Exclusions 51,366,861$ ‐$ 51,366,861$ 104,229,880$ ‐$ 104,229,880$
See the accompanying notes to the supplementary information.
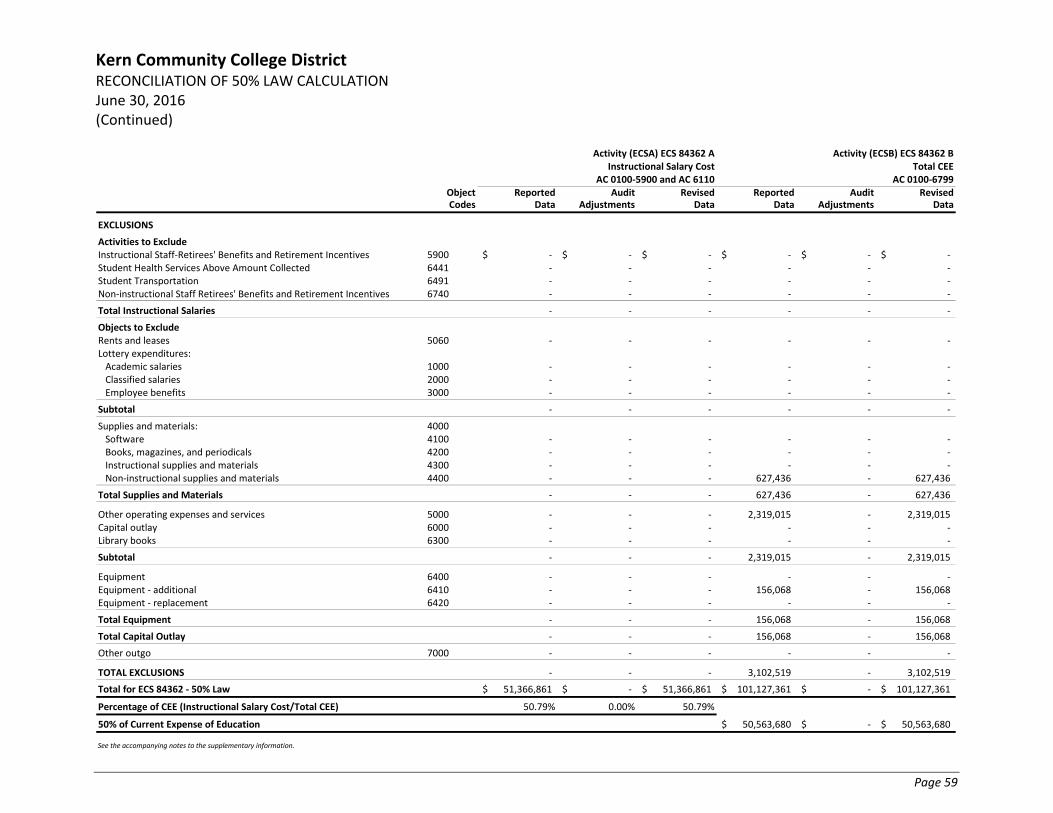
Kern Community College District RECONCILIATION OF 50% LAW CALCULATION June 30, 2016 (Continued)
Page 59
Activity (ECSA) ECS 84362 A Activity (ECSB) ECS 84362 BInstructional Salary Cost Total CEE
AC 0100‐5900 and AC 6110 AC 0100‐6799Object Reported Audit Revised Reported Audit RevisedCodes Data Adjustments Data Data Adjustments Data
EXCLUSIONS
Activities to ExcludeInstructional Staff‐Retirees' Benefits and Retirement Incentives 5900 ‐$ ‐$ ‐$ ‐$ ‐$ ‐$ Student Health Services Above Amount Collected 6441 ‐ ‐ ‐ ‐ ‐ ‐ Student Transportation 6491 ‐ ‐ ‐ ‐ ‐ ‐ Non‐instructional Staff Retirees' Benefits and Retirement Incentives 6740 ‐ ‐ ‐ ‐ ‐ ‐
Total Instructional Salaries ‐ ‐ ‐ ‐ ‐ ‐
Objects to ExcludeRents and leases 5060 ‐ ‐ ‐ ‐ ‐ ‐ Lottery expenditures:Academic salaries 1000 ‐ ‐ ‐ ‐ ‐ ‐ Classified salaries 2000 ‐ ‐ ‐ ‐ ‐ ‐ Employee benefits 3000 ‐ ‐ ‐ ‐ ‐ ‐
Subtotal ‐ ‐ ‐ ‐ ‐ ‐
Supplies and materials: 4000Software 4100 ‐ ‐ ‐ ‐ ‐ ‐ Books, magazines, and periodicals 4200 ‐ ‐ ‐ ‐ ‐ ‐ Instructional supplies and materials 4300 ‐ ‐ ‐ ‐ ‐ ‐ Non‐instructional supplies and materials 4400 ‐ ‐ ‐ 627,436 ‐ 627,436
Total Supplies and Materials ‐ ‐ ‐ 627,436 ‐ 627,436
Other operating expenses and services 5000 ‐ ‐ ‐ 2,319,015 ‐ 2,319,015 Capital outlay 6000 ‐ ‐ ‐ ‐ ‐ ‐ Library books 6300 ‐ ‐ ‐ ‐ ‐ ‐
Subtotal ‐ ‐ ‐ 2,319,015 ‐ 2,319,015
Equipment 6400 ‐ ‐ ‐ ‐ ‐ ‐ Equipment ‐ additional 6410 ‐ ‐ ‐ 156,068 ‐ 156,068 Equipment ‐ replacement 6420 ‐ ‐ ‐ ‐ ‐ ‐
Total Equipment ‐ ‐ ‐ 156,068 ‐ 156,068
Total Capital Outlay ‐ ‐ ‐ 156,068 ‐ 156,068
Other outgo 7000 ‐ ‐ ‐ ‐ ‐ ‐
TOTAL EXCLUSIONS ‐ ‐ ‐ 3,102,519 ‐ 3,102,519
Total for ECS 84362 ‐ 50% Law 51,366,861$ ‐$ 51,366,861$ 101,127,361$ ‐$ 101,127,361$
Percentage of CEE (Instructional Salary Cost/Total CEE) 50.79% 0.00% 50.79%
50% of Current Expense of Education 50,563,680$ ‐$ 50,563,680$
See the accompanying notes to the supplementary information.
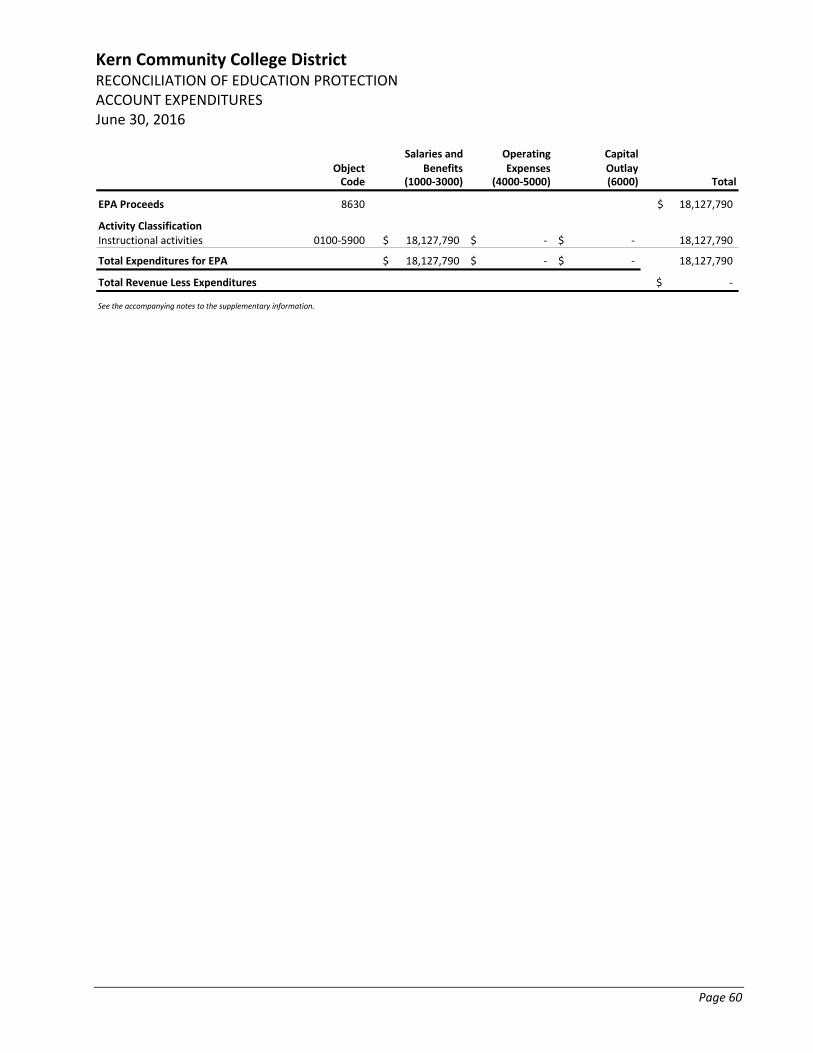
Kern Community College District RECONCILIATION OF EDUCATION PROTECTION ACCOUNT EXPENDITURES June 30, 2016
Page 60
Salaries and Operating CapitalObject Benefits Expenses OutlayCode (1000‐3000) (4000‐5000) (6000) Total
EPA Proceeds 8630 18,127,790$
Activity ClassificationInstructional activities 0100‐5900 18,127,790$ ‐$ ‐$ 18,127,790
Total Expenditures for EPA 18,127,790$ ‐$ ‐$ 18,127,790
Total Revenue Less Expenditures ‐$
See the accompanying notes to the supplementary information.
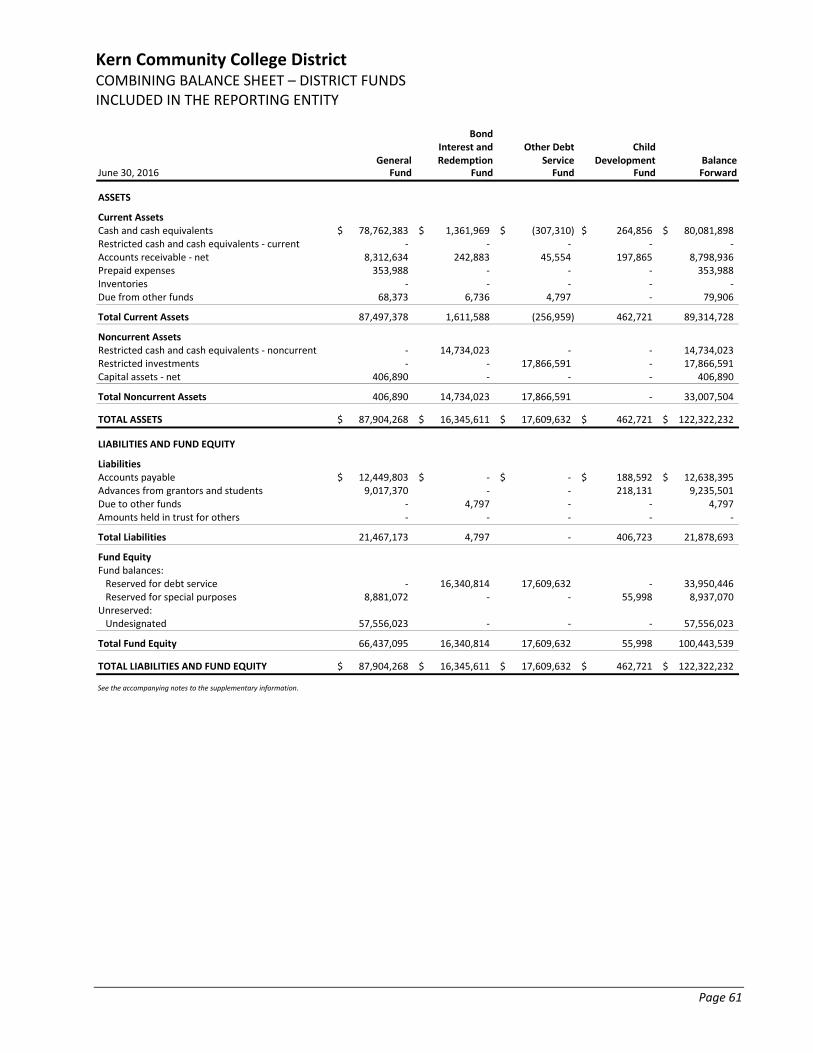
Kern Community College District COMBINING BALANCE SHEET – DISTRICT FUNDS INCLUDED IN THE REPORTING ENTITY
Page 61
BondInterest and Other Debt Child
General Redemption Service Development BalanceJune 30, 2016 Fund Fund Fund Fund Forward
ASSETS
Current AssetsCash and cash equivalents 78,762,383$ 1,361,969$ (307,310)$ 264,856$ 80,081,898$ Restricted cash and cash equivalents ‐ current ‐ ‐ ‐ ‐ ‐ Accounts receivable ‐ net 8,312,634 242,883 45,554 197,865 8,798,936 Prepaid expenses 353,988 ‐ ‐ ‐ 353,988 Inventories ‐ ‐ ‐ ‐ ‐ Due from other funds 68,373 6,736 4,797 ‐ 79,906
Total Current Assets 87,497,378 1,611,588 (256,959) 462,721 89,314,728
Noncurrent AssetsRestricted cash and cash equivalents ‐ noncurrent ‐ 14,734,023 ‐ ‐ 14,734,023 Restricted investments ‐ ‐ 17,866,591 ‐ 17,866,591 Capital assets ‐ net 406,890 ‐ ‐ ‐ 406,890
Total Noncurrent Assets 406,890 14,734,023 17,866,591 ‐ 33,007,504
TOTAL ASSETS 87,904,268$ 16,345,611$ 17,609,632$ 462,721$ 122,322,232$
LIABILITIES AND FUND EQUITY
LiabilitiesAccounts payable 12,449,803$ ‐$ ‐$ 188,592$ 12,638,395$ Advances from grantors and students 9,017,370 ‐ ‐ 218,131 9,235,501 Due to other funds ‐ 4,797 ‐ ‐ 4,797 Amounts held in trust for others ‐ ‐ ‐ ‐ ‐
Total Liabilities 21,467,173 4,797 ‐ 406,723 21,878,693
Fund EquityFund balances:Reserved for debt service ‐ 16,340,814 17,609,632 ‐ 33,950,446 Reserved for special purposes 8,881,072 ‐ ‐ 55,998 8,937,070
Unreserved:Undesignated 57,556,023 ‐ ‐ ‐ 57,556,023
Total Fund Equity 66,437,095 16,340,814 17,609,632 55,998 100,443,539
TOTAL LIABILITIES AND FUND EQUITY 87,904,268$ 16,345,611$ 17,609,632$ 462,721$ 122,322,232$
See the accompanying notes to the supplementary information.
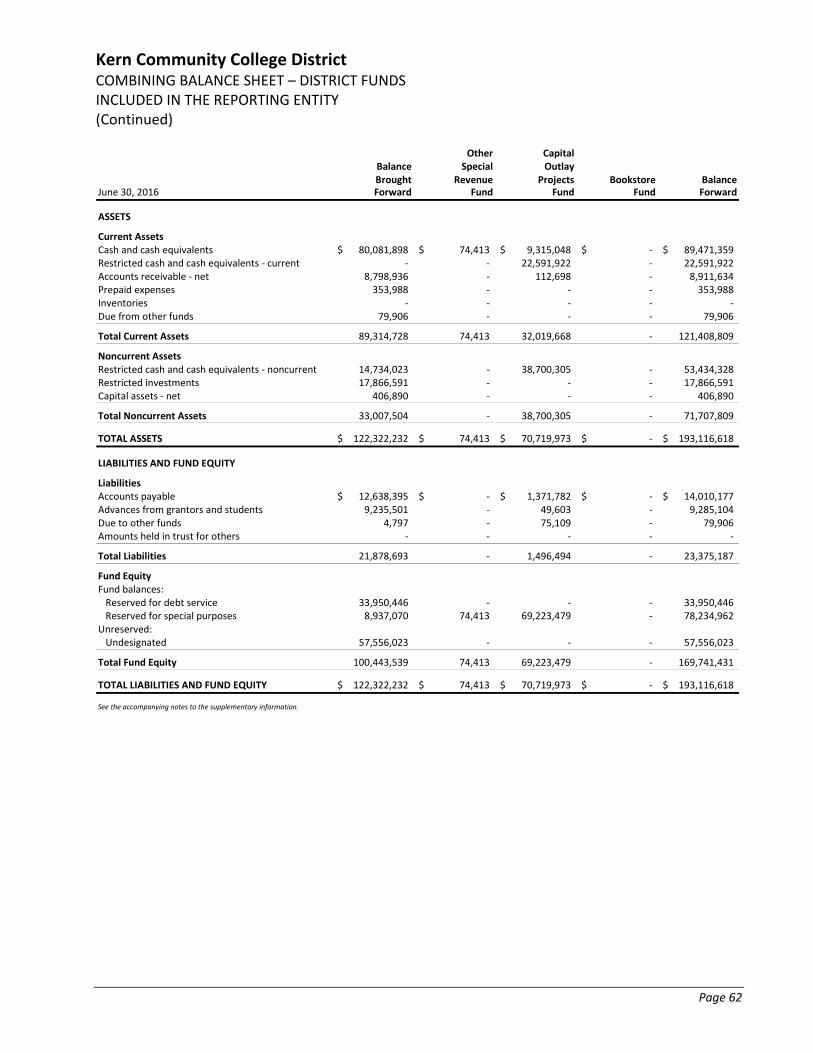
Kern Community College District COMBINING BALANCE SHEET – DISTRICT FUNDS INCLUDED IN THE REPORTING ENTITY (Continued)
Page 62
Other CapitalBalance Special OutlayBrought Revenue Projects Bookstore Balance
June 30, 2016 Forward Fund Fund Fund Forward
ASSETS
Current AssetsCash and cash equivalents 80,081,898$ 74,413$ 9,315,048$ ‐$ 89,471,359$ Restricted cash and cash equivalents ‐ current ‐ ‐ 22,591,922 ‐ 22,591,922 Accounts receivable ‐ net 8,798,936 ‐ 112,698 ‐ 8,911,634 Prepaid expenses 353,988 ‐ ‐ ‐ 353,988 Inventories ‐ ‐ ‐ ‐ ‐ Due from other funds 79,906 ‐ ‐ ‐ 79,906
Total Current Assets 89,314,728 74,413 32,019,668 ‐ 121,408,809
Noncurrent AssetsRestricted cash and cash equivalents ‐ noncurrent 14,734,023 ‐ 38,700,305 ‐ 53,434,328 Restricted investments 17,866,591 ‐ ‐ ‐ 17,866,591 Capital assets ‐ net 406,890 ‐ ‐ ‐ 406,890
Total Noncurrent Assets 33,007,504 ‐ 38,700,305 ‐ 71,707,809
TOTAL ASSETS 122,322,232$ 74,413$ 70,719,973$ ‐$ 193,116,618$
LIABILITIES AND FUND EQUITY
LiabilitiesAccounts payable 12,638,395$ ‐$ 1,371,782$ ‐$ 14,010,177$ Advances from grantors and students 9,235,501 ‐ 49,603 ‐ 9,285,104 Due to other funds 4,797 ‐ 75,109 ‐ 79,906 Amounts held in trust for others ‐ ‐ ‐ ‐ ‐
Total Liabilities 21,878,693 ‐ 1,496,494 ‐ 23,375,187
Fund EquityFund balances:Reserved for debt service 33,950,446 ‐ ‐ ‐ 33,950,446 Reserved for special purposes 8,937,070 74,413 69,223,479 ‐ 78,234,962
Unreserved:Undesignated 57,556,023 ‐ ‐ ‐ 57,556,023
Total Fund Equity 100,443,539 74,413 69,223,479 ‐ 169,741,431
TOTAL LIABILITIES AND FUND EQUITY 122,322,232$ 74,413$ 70,719,973$ ‐$ 193,116,618$
See the accompanying notes to the supplementary information.
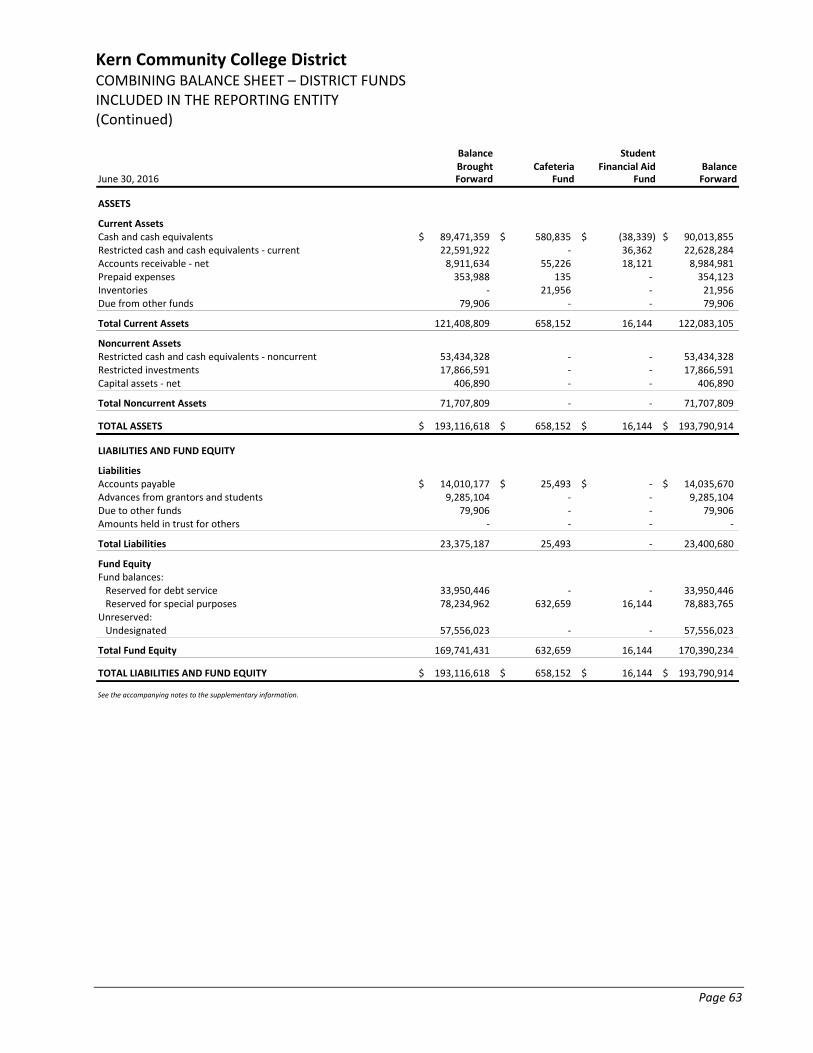
Kern Community College District COMBINING BALANCE SHEET – DISTRICT FUNDS INCLUDED IN THE REPORTING ENTITY (Continued)
Page 63
Balance StudentBrought Cafeteria Financial Aid Balance
June 30, 2016 Forward Fund Fund Forward
ASSETS
Current AssetsCash and cash equivalents 89,471,359$ 580,835$ (38,339)$ 90,013,855$ Restricted cash and cash equivalents ‐ current 22,591,922 ‐ 36,362 22,628,284 Accounts receivable ‐ net 8,911,634 55,226 18,121 8,984,981 Prepaid expenses 353,988 135 ‐ 354,123 Inventories ‐ 21,956 ‐ 21,956 Due from other funds 79,906 ‐ ‐ 79,906
Total Current Assets 121,408,809 658,152 16,144 122,083,105
Noncurrent AssetsRestricted cash and cash equivalents ‐ noncurrent 53,434,328 ‐ ‐ 53,434,328 Restricted investments 17,866,591 ‐ ‐ 17,866,591 Capital assets ‐ net 406,890 ‐ ‐ 406,890
Total Noncurrent Assets 71,707,809 ‐ ‐ 71,707,809
TOTAL ASSETS 193,116,618$ 658,152$ 16,144$ 193,790,914$
LIABILITIES AND FUND EQUITY
LiabilitiesAccounts payable 14,010,177$ 25,493$ ‐$ 14,035,670$ Advances from grantors and students 9,285,104 ‐ ‐ 9,285,104 Due to other funds 79,906 ‐ ‐ 79,906 Amounts held in trust for others ‐ ‐ ‐ ‐
Total Liabilities 23,375,187 25,493 ‐ 23,400,680
Fund EquityFund balances:Reserved for debt service 33,950,446 ‐ ‐ 33,950,446 Reserved for special purposes 78,234,962 632,659 16,144 78,883,765
Unreserved:Undesignated 57,556,023 ‐ ‐ 57,556,023
Total Fund Equity 169,741,431 632,659 16,144 170,390,234
TOTAL LIABILITIES AND FUND EQUITY 193,116,618$ 658,152$ 16,144$ 193,790,914$
See the accompanying notes to the supplementary information.
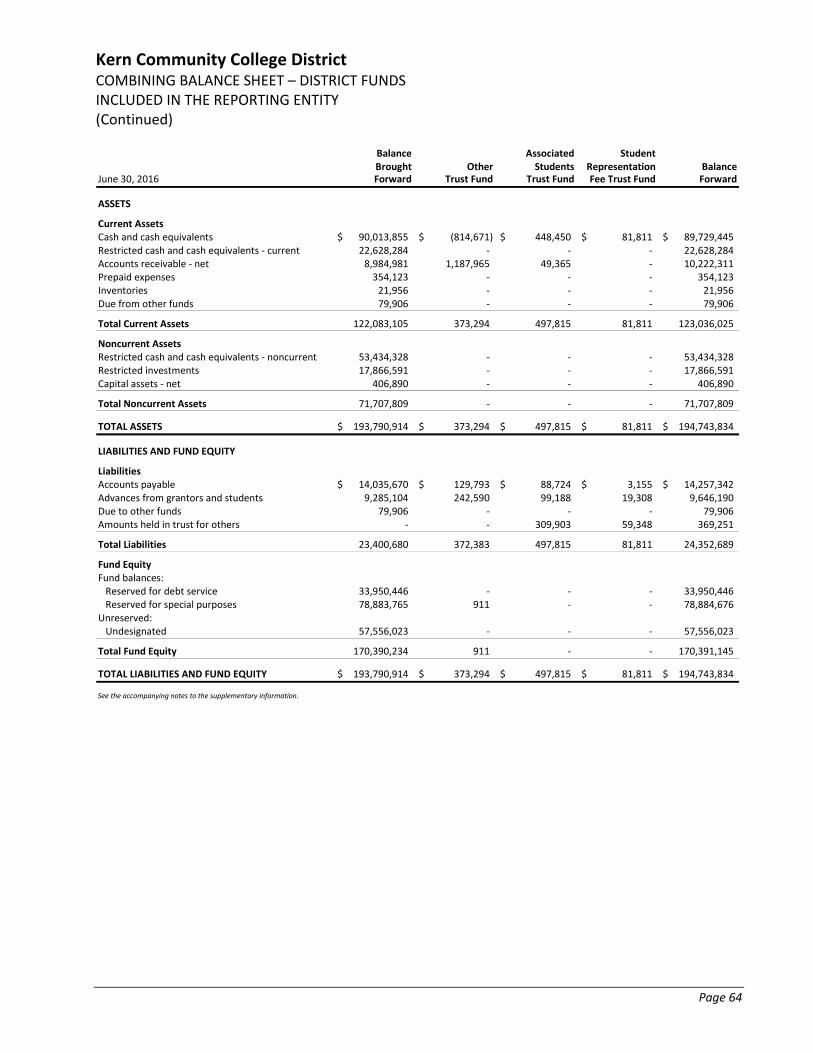
Kern Community College District COMBINING BALANCE SHEET – DISTRICT FUNDS INCLUDED IN THE REPORTING ENTITY (Continued)
Page 64
Balance Associated StudentBrought Other Students Representation Balance
June 30, 2016 Forward Trust Fund Trust Fund Fee Trust Fund Forward
ASSETS
Current AssetsCash and cash equivalents 90,013,855$ (814,671)$ 448,450$ 81,811$ 89,729,445$ Restricted cash and cash equivalents ‐ current 22,628,284 ‐ ‐ ‐ 22,628,284 Accounts receivable ‐ net 8,984,981 1,187,965 49,365 ‐ 10,222,311 Prepaid expenses 354,123 ‐ ‐ ‐ 354,123 Inventories 21,956 ‐ ‐ ‐ 21,956 Due from other funds 79,906 ‐ ‐ ‐ 79,906
Total Current Assets 122,083,105 373,294 497,815 81,811 123,036,025
Noncurrent AssetsRestricted cash and cash equivalents ‐ noncurrent 53,434,328 ‐ ‐ ‐ 53,434,328 Restricted investments 17,866,591 ‐ ‐ ‐ 17,866,591 Capital assets ‐ net 406,890 ‐ ‐ ‐ 406,890
Total Noncurrent Assets 71,707,809 ‐ ‐ ‐ 71,707,809
TOTAL ASSETS 193,790,914$ 373,294$ 497,815$ 81,811$ 194,743,834$
LIABILITIES AND FUND EQUITY
LiabilitiesAccounts payable 14,035,670$ 129,793$ 88,724$ 3,155$ 14,257,342$ Advances from grantors and students 9,285,104 242,590 99,188 19,308 9,646,190 Due to other funds 79,906 ‐ ‐ ‐ 79,906 Amounts held in trust for others ‐ ‐ 309,903 59,348 369,251
Total Liabilities 23,400,680 372,383 497,815 81,811 24,352,689
Fund EquityFund balances:Reserved for debt service 33,950,446 ‐ ‐ ‐ 33,950,446 Reserved for special purposes 78,883,765 911 ‐ ‐ 78,884,676
Unreserved:Undesignated 57,556,023 ‐ ‐ ‐ 57,556,023
Total Fund Equity 170,390,234 911 ‐ ‐ 170,391,145
TOTAL LIABILITIES AND FUND EQUITY 193,790,914$ 373,294$ 497,815$ 81,811$ 194,743,834$
See the accompanying notes to the supplementary information.

Kern Community College District COMBINING BALANCE SHEET – DISTRICT FUNDS INCLUDED IN THE REPORTING ENTITY (Continued)
Page 65
Balance Student BodyBrought Center Fee
June 30, 2016 Forward Trust Fund Total
ASSETS
Current AssetsCash and cash equivalents 89,729,445$ ‐$ 89,729,445$ Restricted cash and cash equivalents ‐ current 22,628,284 ‐ 22,628,284 Accounts receivable ‐ net 10,222,311 ‐ 10,222,311 Prepaid expenses 354,123 ‐ 354,123 Inventories 21,956 ‐ 21,956 Due from other funds 79,906 ‐ 79,906
Total Current Assets 123,036,025 ‐ 123,036,025
Noncurrent AssetsRestricted cash and cash equivalents ‐ noncurrent 53,434,328 624,551 54,058,879 Restricted investments 17,866,591 ‐ 17,866,591 Capital assets ‐ net 406,890 ‐ 406,890
Total Noncurrent Assets 71,707,809 624,551 72,332,360
TOTAL ASSETS 194,743,834$ 624,551$ 195,368,385$
LIABILITIES AND FUND EQUITY
LiabilitiesAccounts payable 14,257,342$ 5,808$ 14,263,150$ Advances from grantors and students 9,646,190 77,241 9,723,431 Due to other funds 79,906 ‐ 79,906 Amounts held in trust for others 369,251 541,502 910,753
Total Liabilities 24,352,689 624,551 24,977,240
Fund EquityFund balances:Reserved for debt service 33,950,446 ‐ 33,950,446 Reserved for special purposes 78,884,676 ‐ 78,884,676
Unreserved:Undesignated 57,556,023 ‐ 57,556,023
Total Fund Equity 170,391,145 ‐ 170,391,145
TOTAL LIABILITIES AND FUND EQUITY 194,743,834$ 624,551$ 195,368,385$
See the accompanying notes to the supplementary information.
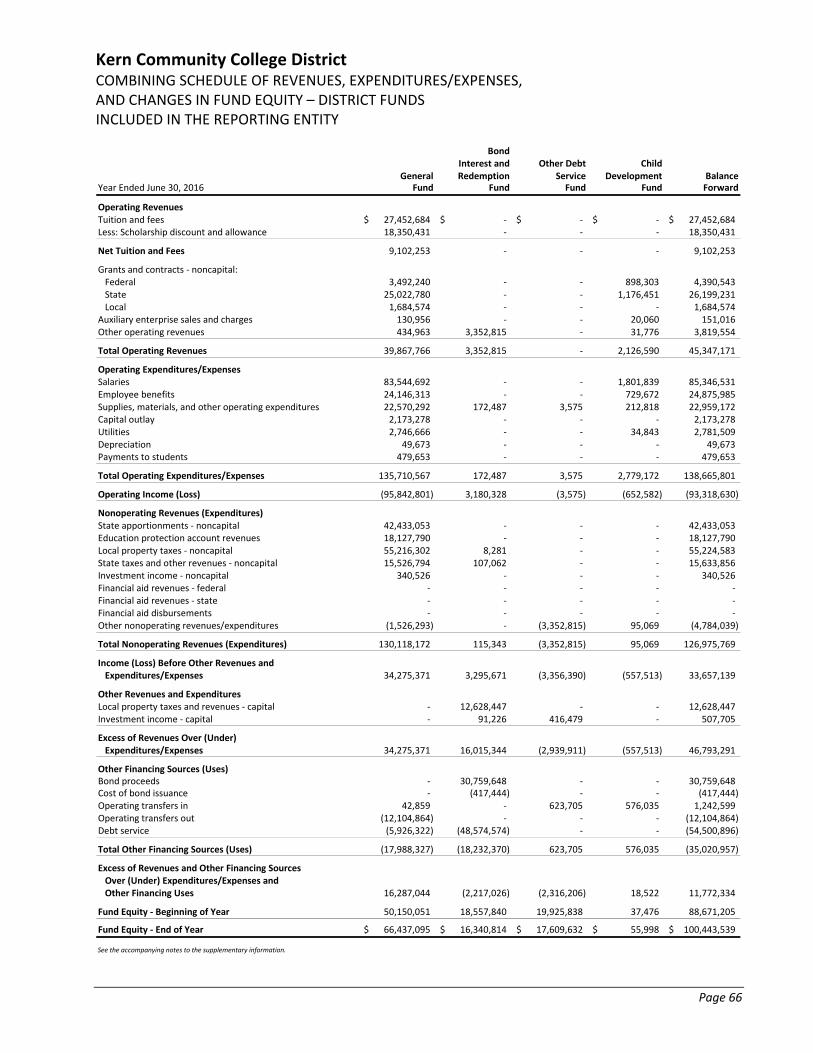
Kern Community College District COMBINING SCHEDULE OF REVENUES, EXPENDITURES/EXPENSES, AND CHANGES IN FUND EQUITY – DISTRICT FUNDS INCLUDED IN THE REPORTING ENTITY
Page 66
BondInterest and Other Debt Child
General Redemption Service Development BalanceYear Ended June 30, 2016 Fund Fund Fund Fund Forward
Operating RevenuesTuition and fees 27,452,684$ ‐$ ‐$ ‐$ 27,452,684$ Less: Scholarship discount and allowance 18,350,431 ‐ ‐ ‐ 18,350,431
Net Tuition and Fees 9,102,253 ‐ ‐ ‐ 9,102,253
Grants and contracts ‐ noncapital:Federal 3,492,240 ‐ ‐ 898,303 4,390,543 State 25,022,780 ‐ ‐ 1,176,451 26,199,231 Local 1,684,574 ‐ ‐ ‐ 1,684,574
Auxiliary enterprise sales and charges 130,956 ‐ ‐ 20,060 151,016 Other operating revenues 434,963 3,352,815 ‐ 31,776 3,819,554
Total Operating Revenues 39,867,766 3,352,815 ‐ 2,126,590 45,347,171
Operating Expenditures/ExpensesSalaries 83,544,692 ‐ ‐ 1,801,839 85,346,531 Employee benefits 24,146,313 ‐ ‐ 729,672 24,875,985 Supplies, materials, and other operating expenditures 22,570,292 172,487 3,575 212,818 22,959,172 Capital outlay 2,173,278 ‐ ‐ ‐ 2,173,278 Utilities 2,746,666 ‐ ‐ 34,843 2,781,509 Depreciation 49,673 ‐ ‐ ‐ 49,673 Payments to students 479,653 ‐ ‐ ‐ 479,653
Total Operating Expenditures/Expenses 135,710,567 172,487 3,575 2,779,172 138,665,801
Operating Income (Loss) (95,842,801) 3,180,328 (3,575) (652,582) (93,318,630)
Nonoperating Revenues (Expenditures)State apportionments ‐ noncapital 42,433,053 ‐ ‐ ‐ 42,433,053 Education protection account revenues 18,127,790 ‐ ‐ ‐ 18,127,790 Local property taxes ‐ noncapital 55,216,302 8,281 ‐ ‐ 55,224,583 State taxes and other revenues ‐ noncapital 15,526,794 107,062 ‐ ‐ 15,633,856 Investment income ‐ noncapital 340,526 ‐ ‐ ‐ 340,526 Financial aid revenues ‐ federal ‐ ‐ ‐ ‐ ‐ Financial aid revenues ‐ state ‐ ‐ ‐ ‐ ‐ Financial aid disbursements ‐ ‐ ‐ ‐ ‐ Other nonoperating revenues/expenditures (1,526,293) ‐ (3,352,815) 95,069 (4,784,039)
Total Nonoperating Revenues (Expenditures) 130,118,172 115,343 (3,352,815) 95,069 126,975,769
Income (Loss) Before Other Revenues and Expenditures/Expenses 34,275,371 3,295,671 (3,356,390) (557,513) 33,657,139
Other Revenues and ExpendituresLocal property taxes and revenues ‐ capital ‐ 12,628,447 ‐ ‐ 12,628,447 Investment income ‐ capital ‐ 91,226 416,479 ‐ 507,705
Excess of Revenues Over (Under) Expenditures/Expenses 34,275,371 16,015,344 (2,939,911) (557,513) 46,793,291
Other Financing Sources (Uses)Bond proceeds ‐ 30,759,648 ‐ ‐ 30,759,648 Cost of bond issuance ‐ (417,444) ‐ ‐ (417,444) Operating transfers in 42,859 ‐ 623,705 576,035 1,242,599 Operating transfers out (12,104,864) ‐ ‐ ‐ (12,104,864) Debt service (5,926,322) (48,574,574) ‐ ‐ (54,500,896)
Total Other Financing Sources (Uses) (17,988,327) (18,232,370) 623,705 576,035 (35,020,957)
Excess of Revenues and Other Financing SourcesOver (Under) Expenditures/Expenses andOther Financing Uses 16,287,044 (2,217,026) (2,316,206) 18,522 11,772,334
Fund Equity ‐ Beginning of Year 50,150,051 18,557,840 19,925,838 37,476 88,671,205
Fund Equity ‐ End of Year 66,437,095$ 16,340,814$ 17,609,632$ 55,998$ 100,443,539$
See the accompanying notes to the supplementary information.
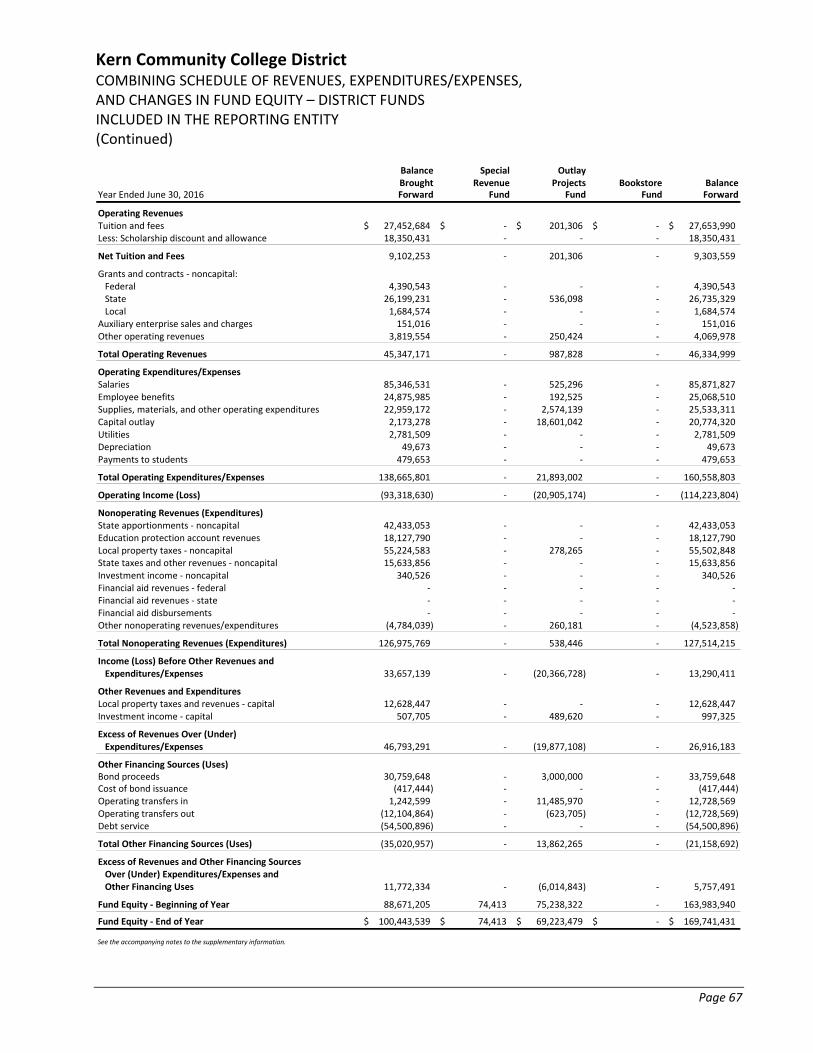
Kern Community College District COMBINING SCHEDULE OF REVENUES, EXPENDITURES/EXPENSES, AND CHANGES IN FUND EQUITY – DISTRICT FUNDS INCLUDED IN THE REPORTING ENTITY (Continued)
Page 67
Balance Special OutlayBrought Revenue Projects Bookstore Balance
Year Ended June 30, 2016 Forward Fund Fund Fund Forward
Operating RevenuesTuition and fees 27,452,684$ ‐$ 201,306$ ‐$ 27,653,990$ Less: Scholarship discount and allowance 18,350,431 ‐ ‐ ‐ 18,350,431
Net Tuition and Fees 9,102,253 ‐ 201,306 ‐ 9,303,559
Grants and contracts ‐ noncapital:Federal 4,390,543 ‐ ‐ ‐ 4,390,543 State 26,199,231 ‐ 536,098 ‐ 26,735,329 Local 1,684,574 ‐ ‐ ‐ 1,684,574
Auxiliary enterprise sales and charges 151,016 ‐ ‐ ‐ 151,016 Other operating revenues 3,819,554 ‐ 250,424 ‐ 4,069,978
Total Operating Revenues 45,347,171 ‐ 987,828 ‐ 46,334,999
Operating Expenditures/ExpensesSalaries 85,346,531 ‐ 525,296 ‐ 85,871,827 Employee benefits 24,875,985 ‐ 192,525 ‐ 25,068,510 Supplies, materials, and other operating expenditures 22,959,172 ‐ 2,574,139 ‐ 25,533,311 Capital outlay 2,173,278 ‐ 18,601,042 ‐ 20,774,320 Utilities 2,781,509 ‐ ‐ ‐ 2,781,509 Depreciation 49,673 ‐ ‐ ‐ 49,673 Payments to students 479,653 ‐ ‐ ‐ 479,653
Total Operating Expenditures/Expenses 138,665,801 ‐ 21,893,002 ‐ 160,558,803
Operating Income (Loss) (93,318,630) ‐ (20,905,174) ‐ (114,223,804)
Nonoperating Revenues (Expenditures)State apportionments ‐ noncapital 42,433,053 ‐ ‐ ‐ 42,433,053 Education protection account revenues 18,127,790 ‐ ‐ ‐ 18,127,790 Local property taxes ‐ noncapital 55,224,583 ‐ 278,265 ‐ 55,502,848 State taxes and other revenues ‐ noncapital 15,633,856 ‐ ‐ ‐ 15,633,856 Investment income ‐ noncapital 340,526 ‐ ‐ ‐ 340,526 Financial aid revenues ‐ federal ‐ ‐ ‐ ‐ ‐ Financial aid revenues ‐ state ‐ ‐ ‐ ‐ ‐ Financial aid disbursements ‐ ‐ ‐ ‐ ‐ Other nonoperating revenues/expenditures (4,784,039) ‐ 260,181 ‐ (4,523,858)
Total Nonoperating Revenues (Expenditures) 126,975,769 ‐ 538,446 ‐ 127,514,215
Income (Loss) Before Other Revenues and Expenditures/Expenses 33,657,139 ‐ (20,366,728) ‐ 13,290,411
Other Revenues and ExpendituresLocal property taxes and revenues ‐ capital 12,628,447 ‐ ‐ ‐ 12,628,447 Investment income ‐ capital 507,705 ‐ 489,620 ‐ 997,325
Excess of Revenues Over (Under) Expenditures/Expenses 46,793,291 ‐ (19,877,108) ‐ 26,916,183
Other Financing Sources (Uses)Bond proceeds 30,759,648 ‐ 3,000,000 ‐ 33,759,648 Cost of bond issuance (417,444) ‐ ‐ ‐ (417,444) Operating transfers in 1,242,599 ‐ 11,485,970 ‐ 12,728,569 Operating transfers out (12,104,864) ‐ (623,705) ‐ (12,728,569) Debt service (54,500,896) ‐ ‐ ‐ (54,500,896)
Total Other Financing Sources (Uses) (35,020,957) ‐ 13,862,265 ‐ (21,158,692)
Excess of Revenues and Other Financing SourcesOver (Under) Expenditures/Expenses andOther Financing Uses 11,772,334 ‐ (6,014,843) ‐ 5,757,491
Fund Equity ‐ Beginning of Year 88,671,205 74,413 75,238,322 ‐ 163,983,940
Fund Equity ‐ End of Year 100,443,539$ 74,413$ 69,223,479$ ‐$ 169,741,431$
See the accompanying notes to the supplementary information.
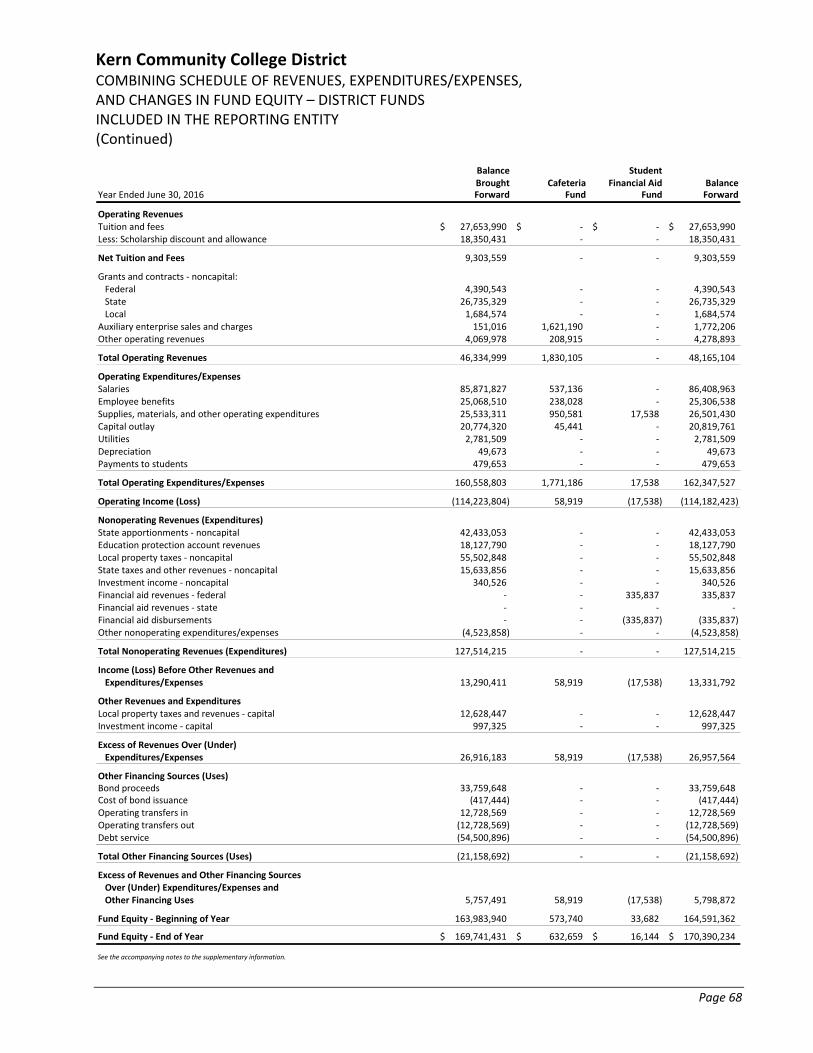
Kern Community College District COMBINING SCHEDULE OF REVENUES, EXPENDITURES/EXPENSES, AND CHANGES IN FUND EQUITY – DISTRICT FUNDS INCLUDED IN THE REPORTING ENTITY (Continued)
Page 68
Balance StudentBrought Cafeteria Financial Aid Balance
Year Ended June 30, 2016 Forward Fund Fund Forward
Operating RevenuesTuition and fees 27,653,990$ ‐$ ‐$ 27,653,990$ Less: Scholarship discount and allowance 18,350,431 ‐ ‐ 18,350,431
Net Tuition and Fees 9,303,559 ‐ ‐ 9,303,559
Grants and contracts ‐ noncapital:Federal 4,390,543 ‐ ‐ 4,390,543 State 26,735,329 ‐ ‐ 26,735,329 Local 1,684,574 ‐ ‐ 1,684,574
Auxiliary enterprise sales and charges 151,016 1,621,190 ‐ 1,772,206 Other operating revenues 4,069,978 208,915 ‐ 4,278,893
Total Operating Revenues 46,334,999 1,830,105 ‐ 48,165,104
Operating Expenditures/ExpensesSalaries 85,871,827 537,136 ‐ 86,408,963 Employee benefits 25,068,510 238,028 ‐ 25,306,538 Supplies, materials, and other operating expenditures 25,533,311 950,581 17,538 26,501,430 Capital outlay 20,774,320 45,441 ‐ 20,819,761 Utilities 2,781,509 ‐ ‐ 2,781,509 Depreciation 49,673 ‐ ‐ 49,673 Payments to students 479,653 ‐ ‐ 479,653
Total Operating Expenditures/Expenses 160,558,803 1,771,186 17,538 162,347,527
Operating Income (Loss) (114,223,804) 58,919 (17,538) (114,182,423)
Nonoperating Revenues (Expenditures)State apportionments ‐ noncapital 42,433,053 ‐ ‐ 42,433,053 Education protection account revenues 18,127,790 ‐ ‐ 18,127,790 Local property taxes ‐ noncapital 55,502,848 ‐ ‐ 55,502,848 State taxes and other revenues ‐ noncapital 15,633,856 ‐ ‐ 15,633,856 Investment income ‐ noncapital 340,526 ‐ ‐ 340,526 Financial aid revenues ‐ federal ‐ ‐ 335,837 335,837 Financial aid revenues ‐ state ‐ ‐ ‐ ‐ Financial aid disbursements ‐ ‐ (335,837) (335,837) Other nonoperating expenditures/expenses (4,523,858) ‐ ‐ (4,523,858)
Total Nonoperating Revenues (Expenditures) 127,514,215 ‐ ‐ 127,514,215
Income (Loss) Before Other Revenues and Expenditures/Expenses 13,290,411 58,919 (17,538) 13,331,792
Other Revenues and ExpendituresLocal property taxes and revenues ‐ capital 12,628,447 ‐ ‐ 12,628,447 Investment income ‐ capital 997,325 ‐ ‐ 997,325
Excess of Revenues Over (Under) Expenditures/Expenses 26,916,183 58,919 (17,538) 26,957,564
Other Financing Sources (Uses)Bond proceeds 33,759,648 ‐ ‐ 33,759,648 Cost of bond issuance (417,444) ‐ ‐ (417,444) Operating transfers in 12,728,569 ‐ ‐ 12,728,569 Operating transfers out (12,728,569) ‐ ‐ (12,728,569) Debt service (54,500,896) ‐ ‐ (54,500,896)
Total Other Financing Sources (Uses) (21,158,692) ‐ ‐ (21,158,692)
Excess of Revenues and Other Financing SourcesOver (Under) Expenditures/Expenses andOther Financing Uses 5,757,491 58,919 (17,538) 5,798,872
Fund Equity ‐ Beginning of Year 163,983,940 573,740 33,682 164,591,362
Fund Equity ‐ End of Year 169,741,431$ 632,659$ 16,144$ 170,390,234$
See the accompanying notes to the supplementary information.
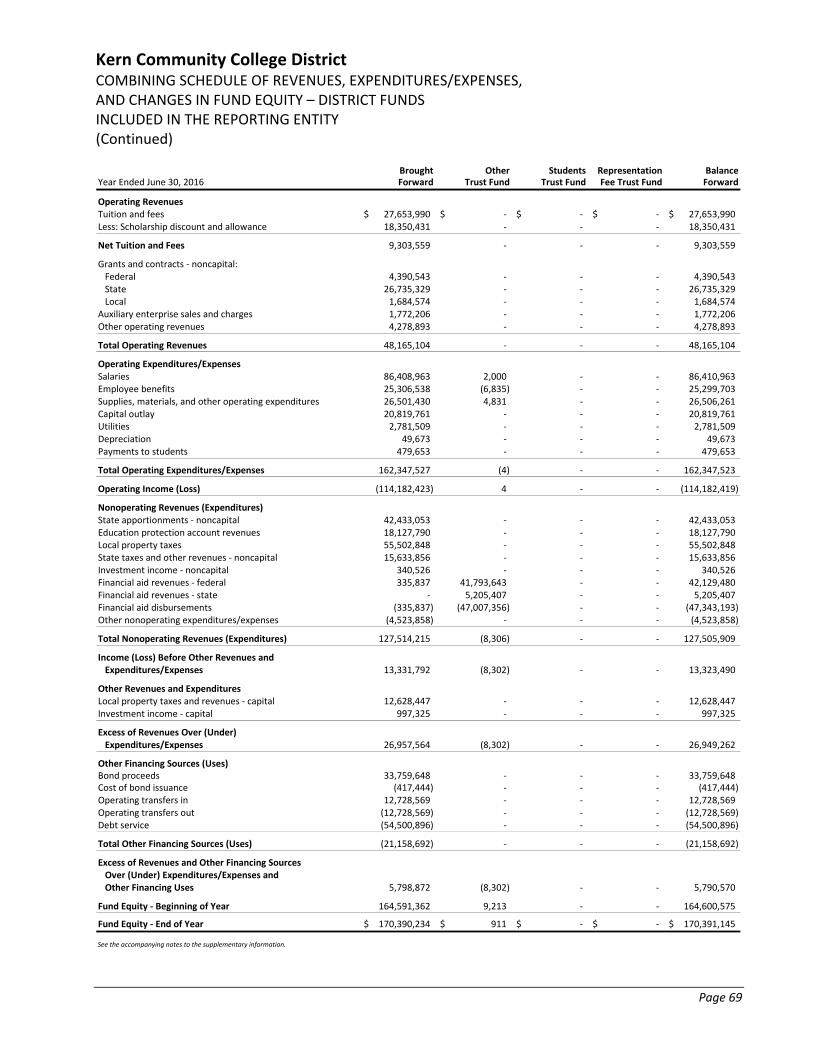
Kern Community College District COMBINING SCHEDULE OF REVENUES, EXPENDITURES/EXPENSES, AND CHANGES IN FUND EQUITY – DISTRICT FUNDS INCLUDED IN THE REPORTING ENTITY (Continued)
Page 69
Brought Other Students Representation BalanceYear Ended June 30, 2016 Forward Trust Fund Trust Fund Fee Trust Fund Forward
Operating RevenuesTuition and fees 27,653,990$ ‐$ ‐$ ‐$ 27,653,990$ Less: Scholarship discount and allowance 18,350,431 ‐ ‐ ‐ 18,350,431
Net Tuition and Fees 9,303,559 ‐ ‐ ‐ 9,303,559
Grants and contracts ‐ noncapital:Federal 4,390,543 ‐ ‐ ‐ 4,390,543 State 26,735,329 ‐ ‐ ‐ 26,735,329 Local 1,684,574 ‐ ‐ ‐ 1,684,574
Auxiliary enterprise sales and charges 1,772,206 ‐ ‐ ‐ 1,772,206 Other operating revenues 4,278,893 ‐ ‐ ‐ 4,278,893
Total Operating Revenues 48,165,104 ‐ ‐ ‐ 48,165,104
Operating Expenditures/ExpensesSalaries 86,408,963 2,000 ‐ ‐ 86,410,963 Employee benefits 25,306,538 (6,835) ‐ ‐ 25,299,703 Supplies, materials, and other operating expenditures 26,501,430 4,831 ‐ ‐ 26,506,261 Capital outlay 20,819,761 ‐ ‐ ‐ 20,819,761 Utilities 2,781,509 ‐ ‐ ‐ 2,781,509 Depreciation 49,673 ‐ ‐ ‐ 49,673 Payments to students 479,653 ‐ ‐ ‐ 479,653
Total Operating Expenditures/Expenses 162,347,527 (4) ‐ ‐ 162,347,523
Operating Income (Loss) (114,182,423) 4 ‐ ‐ (114,182,419)
Nonoperating Revenues (Expenditures)State apportionments ‐ noncapital 42,433,053 ‐ ‐ ‐ 42,433,053 Education protection account revenues 18,127,790 ‐ ‐ ‐ 18,127,790 Local property taxes 55,502,848 ‐ ‐ ‐ 55,502,848 State taxes and other revenues ‐ noncapital 15,633,856 ‐ ‐ ‐ 15,633,856 Investment income ‐ noncapital 340,526 ‐ ‐ ‐ 340,526 Financial aid revenues ‐ federal 335,837 41,793,643 ‐ ‐ 42,129,480 Financial aid revenues ‐ state ‐ 5,205,407 ‐ ‐ 5,205,407 Financial aid disbursements (335,837) (47,007,356) ‐ ‐ (47,343,193) Other nonoperating expenditures/expenses (4,523,858) ‐ ‐ ‐ (4,523,858)
Total Nonoperating Revenues (Expenditures) 127,514,215 (8,306) ‐ ‐ 127,505,909
Income (Loss) Before Other Revenues and Expenditures/Expenses 13,331,792 (8,302) ‐ ‐ 13,323,490
Other Revenues and ExpendituresLocal property taxes and revenues ‐ capital 12,628,447 ‐ ‐ ‐ 12,628,447 Investment income ‐ capital 997,325 ‐ ‐ ‐ 997,325
Excess of Revenues Over (Under) Expenditures/Expenses 26,957,564 (8,302) ‐ ‐ 26,949,262
Other Financing Sources (Uses)Bond proceeds 33,759,648 ‐ ‐ ‐ 33,759,648 Cost of bond issuance (417,444) ‐ ‐ ‐ (417,444) Operating transfers in 12,728,569 ‐ ‐ ‐ 12,728,569 Operating transfers out (12,728,569) ‐ ‐ ‐ (12,728,569) Debt service (54,500,896) ‐ ‐ ‐ (54,500,896)
Total Other Financing Sources (Uses) (21,158,692) ‐ ‐ ‐ (21,158,692)
Excess of Revenues and Other Financing SourcesOver (Under) Expenditures/Expenses andOther Financing Uses 5,798,872 (8,302) ‐ ‐ 5,790,570
Fund Equity ‐ Beginning of Year 164,591,362 9,213 ‐ ‐ 164,600,575
Fund Equity ‐ End of Year 170,390,234$ 911$ ‐$ ‐$ 170,391,145$
See the accompanying notes to the supplementary information.
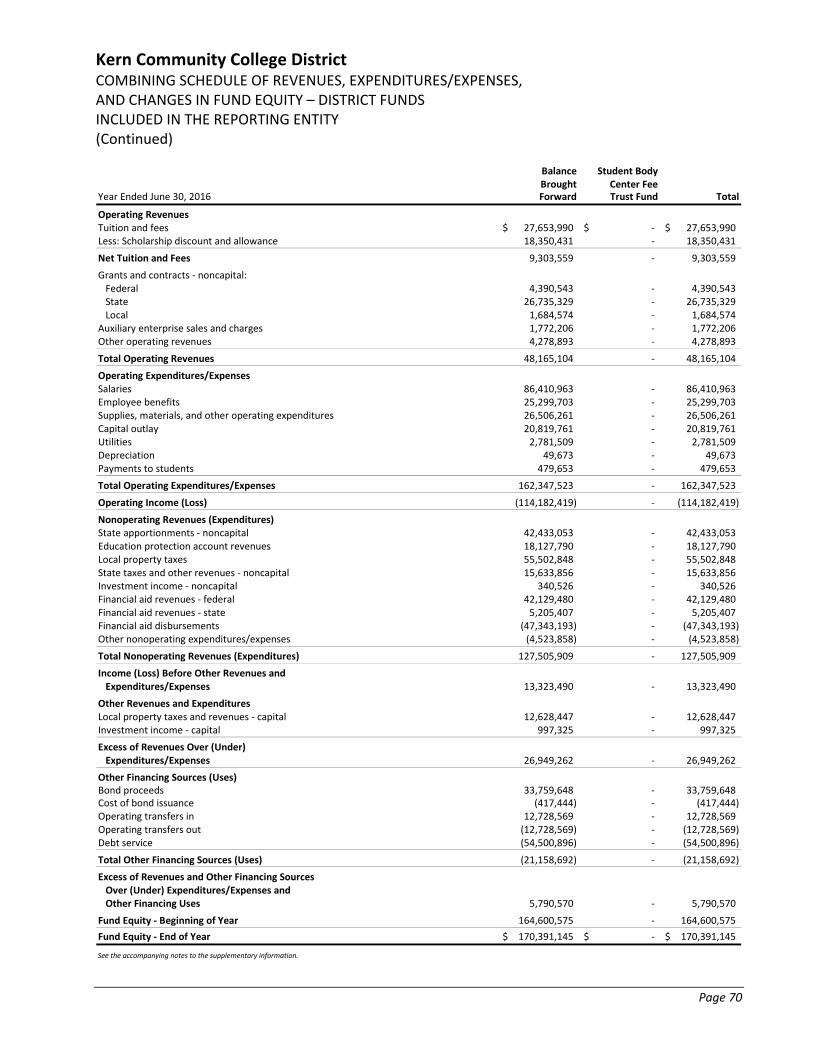
Kern Community College District COMBINING SCHEDULE OF REVENUES, EXPENDITURES/EXPENSES, AND CHANGES IN FUND EQUITY – DISTRICT FUNDS INCLUDED IN THE REPORTING ENTITY (Continued)
Page 70
Balance Student BodyBrought Center Fee
Year Ended June 30, 2016 Forward Trust Fund Total
Operating RevenuesTuition and fees 27,653,990$ ‐$ 27,653,990$ Less: Scholarship discount and allowance 18,350,431 ‐ 18,350,431
Net Tuition and Fees 9,303,559 ‐ 9,303,559
Grants and contracts ‐ noncapital:Federal 4,390,543 ‐ 4,390,543 State 26,735,329 ‐ 26,735,329 Local 1,684,574 ‐ 1,684,574
Auxiliary enterprise sales and charges 1,772,206 ‐ 1,772,206 Other operating revenues 4,278,893 ‐ 4,278,893
Total Operating Revenues 48,165,104 ‐ 48,165,104
Operating Expenditures/ExpensesSalaries 86,410,963 ‐ 86,410,963 Employee benefits 25,299,703 ‐ 25,299,703 Supplies, materials, and other operating expenditures 26,506,261 ‐ 26,506,261 Capital outlay 20,819,761 ‐ 20,819,761 Utilities 2,781,509 ‐ 2,781,509 Depreciation 49,673 ‐ 49,673 Payments to students 479,653 ‐ 479,653
Total Operating Expenditures/Expenses 162,347,523 ‐ 162,347,523
Operating Income (Loss) (114,182,419) ‐ (114,182,419)
Nonoperating Revenues (Expenditures)State apportionments ‐ noncapital 42,433,053 ‐ 42,433,053 Education protection account revenues 18,127,790 ‐ 18,127,790 Local property taxes 55,502,848 ‐ 55,502,848 State taxes and other revenues ‐ noncapital 15,633,856 ‐ 15,633,856 Investment income ‐ noncapital 340,526 ‐ 340,526 Financial aid revenues ‐ federal 42,129,480 ‐ 42,129,480 Financial aid revenues ‐ state 5,205,407 ‐ 5,205,407 Financial aid disbursements (47,343,193) ‐ (47,343,193) Other nonoperating expenditures/expenses (4,523,858) ‐ (4,523,858)
Total Nonoperating Revenues (Expenditures) 127,505,909 ‐ 127,505,909
Income (Loss) Before Other Revenues and Expenditures/Expenses 13,323,490 ‐ 13,323,490
Other Revenues and ExpendituresLocal property taxes and revenues ‐ capital 12,628,447 ‐ 12,628,447 Investment income ‐ capital 997,325 ‐ 997,325
Excess of Revenues Over (Under) Expenditures/Expenses 26,949,262 ‐ 26,949,262
Other Financing Sources (Uses)Bond proceeds 33,759,648 ‐ 33,759,648 Cost of bond issuance (417,444) ‐ (417,444) Operating transfers in 12,728,569 ‐ 12,728,569 Operating transfers out (12,728,569) ‐ (12,728,569) Debt service (54,500,896) ‐ (54,500,896)
Total Other Financing Sources (Uses) (21,158,692) ‐ (21,158,692)
Excess of Revenues and Other Financing SourcesOver (Under) Expenditures/Expenses andOther Financing Uses 5,790,570 ‐ 5,790,570
Fund Equity ‐ Beginning of Year 164,600,575 ‐ 164,600,575
Fund Equity ‐ End of Year 170,391,145$ ‐$ 170,391,145$
See the accompanying notes to the supplementary information.

Kern Community College District RECONCILIATION OF FUND EQUITY TO NET POSITION June 30, 2016
Page 71
Total Fund Equity ‐ District Funds Included in the Reporting Entity 170,391,145$
Assets recorded within the GASB 35 Statement of Net Position not included in the District fund financial statements:Depreciable capital assets 328,842,754$ Accumulated depreciation (112,909,439) 215,933,315
Nondepreciable capital assets 66,942,387 Other postemployment benefits asset 45,990,800
Deferred outlows related to pensions 10,167,169 Deferred loss on refunding 2,789,201
Liabilities recorded within the GASB 35 Statement of Net Position not recorded in the District fund financial statements:Accounts payable:Interest payable (2,342,827)Retentions payable (1,092,664)
Pension liabilities (81,140,433) Compensated absences (2,881,120) Other long‐term liabilities (307,372,713)
Deferred Inflows related to pensions (12,684,225)
Net Assets Reported Within the GASB 35 Statement of Net Position 104,700,035$
See the accompanying notes to the supplementary information.

Kern Community College District RECONCILIATION OF CHANGE IN FUND EQUITY TO CHANGE IN NET POSITION June 30, 2016
Page 72
Total Net Change in Fund Equity ‐ District Funds Included in the Reporting Entity 5,790,570$
Compensated absence expense reduction reported within the GASB 35 Statements (173,400) Change in pension expense related to GASB 68 (211,493) Depreciation expense reported within the GASB 35 Statements (9,212,049) Amortization of bond premium cost reported within the GASB 35 Statements 2,961,103 Amortization of deferred loss on refunding within the GASB 35 Statements (303,683) Capital outlay expense not reported within the GASB 35 Statements 22,371,178 Capitalized interest reported within the GASB 35 Statements 359,358 Decrease in interest expense for capital asset related debt reported within 385,302 the GASB 35 Statements
Principal payments on debt not reported within the GASB 35 Statements 37,282,992 Bond proceeds from debt not reported within the GASB 35 Statements (33,759,648) Prepaid expense of other postemployment benefits reported withinthe GASB 35 Statements (5,522,564)
Net Change in Net Position Reported Within the GASB 35 Statement of Revenues,Expenses, and Changes in Net Assets 19,967,666$
See the accompanying notes to the supplementary information.
Kern Community College District NOTES TO THE SUPPLEMENTARY INFORMATION
Page 73
1. PURPOSE OF SCHEDULES
Schedule of Workload Measures for State General Apportionment
The Schedule of Workload Measures for State General Apportionment Annualized Attendance as of June 30, 2016, represents the basis of apportionment of the District’s annual source of funding.
Schedule of Expenditures of Federal Awards and Schedule of Expenditures of State Awards
This schedule includes the federal award activity of the District under programs of the federal government for the year ended June 30, 2016. The information in this schedule is presented in accordance with the requirements of Title 2 U.S. Code of Federal Regulations Part 200, Uniform Administrative Requirements, Cost Principles, and Audit Requirements for Federal Awards (the Uniform Guidance).
Expenditures reported on this schedule are reported on the modified basis of accounting. Such expenditures are recognized following the cost principles contained in the Uniform Guidance, wherein certain types of expenditures are not allowable or are limited as to reimbursement.
The District has not elected to use the 10% de minimis indirect cost rate allowed under the Uniform Guidance.
Schedule of Expenditures of State Awards
This schedule includes the state activity of the District under categorical programs of the state of California for the year ended June 30, 2016. The information in this schedule is presented in accordance with the requirements of the California Community Colleges Contracted District Audit Manual 2015‐16.
Expenses reported on this schedule are reported on the accrual basis of accounting.
Reconciliation of Annual Financial and Budget Report (CCFS‐311) With District Audited Financial Statements
This schedule provides the information necessary to reconcile the fund balance of all funds reported on the Form CCFS‐311 to the District accounting records.
Reconciliation of 50% Law Calculation
This schedule provides the information necessary to reconcile the 50% law calculation as reported on the Form CCFS‐311 to the audited financial statements.
Reconciliation of Education Protection Account Expenditures
This schedule provides the information necessary to reconcile the Education Protection Account Expenditures reported on the Form CCFS‐311 to the audited financial statements.
Kern Community College District NOTES TO THE SUPPLEMENTARY INFORMATION (Continued)
Page 74
Reconciliation of Fund Equity to Net Position and Reconciliation of Change in Fund Equity to Change in Net Position
These schedules provide the information necessary to reconcile the supplemental combining financial schedules to the audited financial statements.
2. COMBINING FINANCIAL STATEMENTS SUMMARY OF SIGNIFICANT ACCOUNTING POLICIES
Basis of Accounting The accompanying Combining Balance Sheet – District Funds Included in the Reporting Entity, Combining Schedule of Revenues, Expenditures/Expenses, and Changes in Fund Equity – District Funds Included in the Reporting Entity are presented on the modified accrual basis of accounting with the exception of the Bookstore and Cafeteria Funds, which are presented on the accrual basis of accounting consistent with the presentation in the entity‐wide financial statements.
Under the modified accrual basis of accounting, revenues are recognized when susceptible to accrual (i.e., when they are measurable and available). Measurable means the amount of the transaction can be determined and available means collectible within the current period or soon enough thereafter to pay liabilities of the current period. The District considers property taxes available if they are collected within 60 days after year end. A one‐year availability period is used for revenue recognition for all other governmental fund revenues. Expenditures are recorded when the related fund liability is incurred. Principal and interest on general long‐term debt are recorded as fund liabilities when due or when amounts have been accumulated in the debt service fund for payments to be made early in the following year.
Property taxes, franchise taxes, licenses, interest revenue, and charges for services are susceptible to accrual. Other receipts become measurable and available when cash is received by the District and are recognized as revenue at that time.
The District reports advances from grantors and students on its combining balance sheet. Advances from grantors and students arise when potential revenue does not meet both the measurable and available criteria for recognition in the current period. Advances from grantors and students also arise when resources are received by the District before it has a legal claim to them, as when grant monies are received prior to the incurrence of qualifying expenditures. In subsequent periods, when both revenue recognition criteria are met, or when the District has legal claim to the resources, the liability for advances from grantors and students is removed and revenue is recognized.
3. LOAN PROGRAMS
The District is responsible only for the performance of certain administrative duties with respect to the Federal Direct Loan Program. Accordingly, the value of these outstanding loans is not reflected in the District’s financial statements. It is not practical to determine the balance of loans outstanding to students of the District under this program as of June 30, 2016.

OTHER REPORTS SECTION
Page 76
INDEPENDENT AUDITORS’ REPORT ON INTERNAL CONTROL OVER FINANCIAL REPORTING AND ON COMPLIANCE AND OTHER MATTERS BASED ON AN AUDIT OF FINANCIAL STATEMENTS PERFORMED IN ACCORDANCE WITH GOVERNMENT AUDITING STANDARDS
To the Board of Trustees Kern Community College District Bakersfield, California
We have audited, in accordance with auditing standards generally accepted in the United States of America and the standards applicable to financial audits contained in Government Auditing Standards issued by the Comptroller General of the United States, the financial statements of the business‐type activities of Kern Community College District (the District) as of and for the year ended June 30, 2016; and the related notes to the financial statements, which collectively comprise the District’s basic financial statements; and have issued our report thereon dated December 23, 2016.
Internal Control Over Financial Reporting
In planning and performing our audit of the financial statements, we considered the District’s internal control over financial reporting (internal control) to determine the audit procedures that are appropriate in the circumstances for the purpose of expressing our opinions on the financial statements, but not for the purpose of expressing an opinion on the effectiveness of the District’s internal control. Accordingly, we do not express an opinion on the effectiveness of the District’s internal control.
A deficiency in internal control exists when the design or operation of a control does not allow management or employees in the normal course of performing their assigned functions, to prevent, or detect and correct misstatements on a timely basis. A material weakness is a deficiency, or a combination of deficiencies, in internal control, such that there is a reasonable possibility that a material misstatement of the District’s financial statements will not be prevented, or detected and corrected on a timely basis. A significant deficiency is a deficiency, or a combination of deficiencies, in internal control that is less severe than a material weakness, yet important enough to merit attention by those charged with governance.
Our consideration of internal control was for the limited purpose described in the first paragraph of this section and was not designed to identify all deficiencies in internal control over financial reporting that might be material weaknesses or significant deficiencies. Given these limitations, during our audit we did not identify any deficiencies in internal control that we consider to be material weaknesses. However, material weaknesses may exist that have not been identified.
Page 77
INDEPENDENT AUDITORS’ REPORT ON INTERNAL CONTROL OVER FINANCIAL REPORTING AND ON COMPLIANCE AND OTHER MATTERS BASED ON AN AUDIT OF FINANCIAL STATEMENTS PERFORMED IN ACCORDANCE WITH GOVERNMENT AUDITING STANDARDS
(Continued)
Compliance and Other Matters
As part of obtaining reasonable assurance about whether the District’s financial statements are free of material misstatement, we performed tests of its compliance with certain provisions of laws, regulations, contracts, and grant agreements, noncompliance with which could have a direct and material effect on the determination of financial statement amounts. However, providing an opinion on compliance with those provisions was not an objective of our audit; and, accordingly, we do not express such an opinion. The results of our tests disclosed no instances of noncompliance or other matters that are required to be reported under Government Auditing Standards.
Purpose of This Report
The purpose of this report is solely to describe the scope of our testing of internal control and compliance and the results of that testing, and not to provide an opinion on the effectiveness of the District’s internal control or on compliance. This report is an integral part of an audit performed in accordance with Government Auditing Standards in considering the District’s internal control and compliance. Accordingly, this communication is not suitable for any other purpose. December 23, 2016 Redding, California
apotter
KCoe Isom
Page 78
INDEPENDENT AUDITORS’ REPORT ON COMPLIANCE FOR EACH MAJOR FEDERAL PROGRAM AND ON INTERNAL CONTROL OVER COMPLIANCE REQUIRED BY THE UNIFORM GUIDANCE
To the Board of Trustees Kern Community College District Bakersfield, California
Report on Compliance for Each Major Federal Program
We have audited Kern Community College District’s (the District) compliance with the types of compliance requirements described in the U.S. Office of Management and Budget (OMB) Compliance Supplement that could have a direct and material effect on each of the District’s major federal programs for the year ended June 30, 2016. The District’s major federal programs are identified in the summary of auditors’ results section of the accompanying schedule of findings and questioned costs.
Management’s Responsibility
Management is responsible for compliance with the requirements of federal statutes, regulations, and the terms and conditions of its federal awards applicable to its federal programs.
Auditors’ Responsibility
Our responsibility is to express an opinion on compliance for each of the District’s major federal programs based on our audit of the types of compliance requirements referred to above. We conducted our audit of compliance in accordance with auditing standards generally accepted in the United States of America; the standards applicable to financial audits contained in Government Auditing Standards, issued by the Comptroller General of the United States; and the audit requirements of Title 2 U.S. Code of Federal Regulations (CFR) Part 200, Uniform Administrative Requirements, Cost Principles, and Audit Requirements for Federal Awards (the Uniform Guidance). Those standards and the Uniform Guidance require that we plan and perform the audit to obtain reasonable assurance about whether noncompliance with the types of compliance requirements referred to above that could have a direct and material effect on a major federal program occurred. An audit includes examining, on a test basis, evidence about the District’s compliance with those requirements and performing such other procedures as we considered necessary in the circumstances.
We believe that our audit provides a reasonable basis for our opinion on compliance for each major federal program. However, our audit does not provide a legal determination of the District’s compliance.

Page 79
INDEPENDENT AUDITORS’ REPORT ON COMPLIANCE FOR EACH MAJOR FEDERAL PROGRAM AND ON INTERNAL CONTROL OVER COMPLIANCE REQUIRED BY THE UNIFORM GUIDANCE (Continued)
Opinion on Each Major Federal Program
In our opinion, the District complied, in all material respects, with the types of compliance requirements referred to above that could have a direct and material effect on each of its major federal programs for the year ended June 30, 2016.
Report on Internal Control Over Compliance
Management of the District is responsible for establishing and maintaining effective internal control over compliance with the types of compliance requirements referred to above. In planning and performing our audit of compliance, we considered the District’s internal control over compliance with the types of requirements that could have a direct and material effect on each major federal program as a basis for designing auditing procedures that are appropriate in the circumstances for the purpose of expressing an opinion on compliance for each major federal program, and to test and report on internal control over compliance in accordance with the Uniform Guidance, but not for the purpose of expressing an opinion on the effectiveness of internal control over compliance. Accordingly, we do not express an opinion on the effectiveness of the District’s internal control over compliance.
A deficiency in internal control over compliance exists when the design or operation of a control over compliance does not allow management or employees, in the normal course of performing their assigned functions to prevent, or detect, and correct noncompliance with a type of compliance requirement of a federal program on a timely basis. A material weakness in internal control over compliance is a deficiency, or combination of deficiencies in internal control over compliance, such that there is a reasonable possibility that material noncompliance with a type of compliance requirement of a federal program will not be prevented, or detected and corrected, on a timely basis. A significant deficiency in internal control over compliance is a deficiency, or a combination of deficiencies, in internal control over compliance with a type of compliance requirement of a federal program that is less severe than a material weakness in internal control over compliance, yet important enough to merit attention by those charged with governance.
Our consideration of internal control over compliance was for the limited purpose described in the first paragraph of this section and was not designed to identify all deficiencies in internal control over compliance that might be material weaknesses or significant deficiencies. We did not identify any deficiencies in internal control over compliance that we consider to be material weaknesses. However, material weaknesses may exist that have not been identified.
Page 80
INDEPENDENT AUDITORS’ REPORT ON COMPLIANCE FOR EACH MAJOR FEDERAL PROGRAM AND ON INTERNAL CONTROL OVER COMPLIANCE REQUIRED BY THE UNIFORM GUIDANCE (Continued)
Purpose of This Report
The purpose of this report on internal control over compliance is solely to describe the scope of our testing of internal control over compliance, and the results of that testing, based on the requirements of the Uniform Guidance. Accordingly, this report is not suitable for any other purpose. December 23, 2016 Redding, California
apotter
KCoe Isom
Page 81
INDEPENDENT AUDITORS’ REPORT ON STATE COMPLIANCE
To the Board of Trustees Kern Community College District Bakersfield, California
Compliance
We have audited the Kern Community College District’s (the District) compliance with the types of state compliance requirements described in the California Community Colleges Contracted District Audit Manual 2015‐16, published by the California Community Colleges Chancellor’s Office, for the year ended June 30, 2016. The applicable state compliance requirements are identified in the table below.
Management’s Responsibility
Compliance with the requirements referred to above is the responsibility of the District’s management.
Auditors’ Responsibility
Our responsibility is to express an opinion on the District’s compliance with the state laws and regulations based on our audit.
We conducted our audit of compliance in accordance with auditing standards generally accepted in the United States of America; the standards applicable to financial audits contained in Government Auditing Standards, issued by the Comptroller General of the United States; and the California Community Colleges Contracted District Audit Manual 2015‐16, published by the California Community Colleges Chancellor’s Office. Those standards and the California Community Colleges Contracted District Audit Manual 2015‐16 require that we plan and perform the audit to obtain reasonable assurance about whether noncompliance with the compliance requirements referred to above that could have a material effect on compliance with the state laws and regulations described in the schedule below occurred. An audit includes examining, on a test basis, evidence supporting the District’s compliance with those requirements and performing such other procedures as we considered necessary in the circumstances. We believe our audit provides a reasonable basis for our opinion. Our audit does not provide legal determination of the District’s compliance with those requirements.
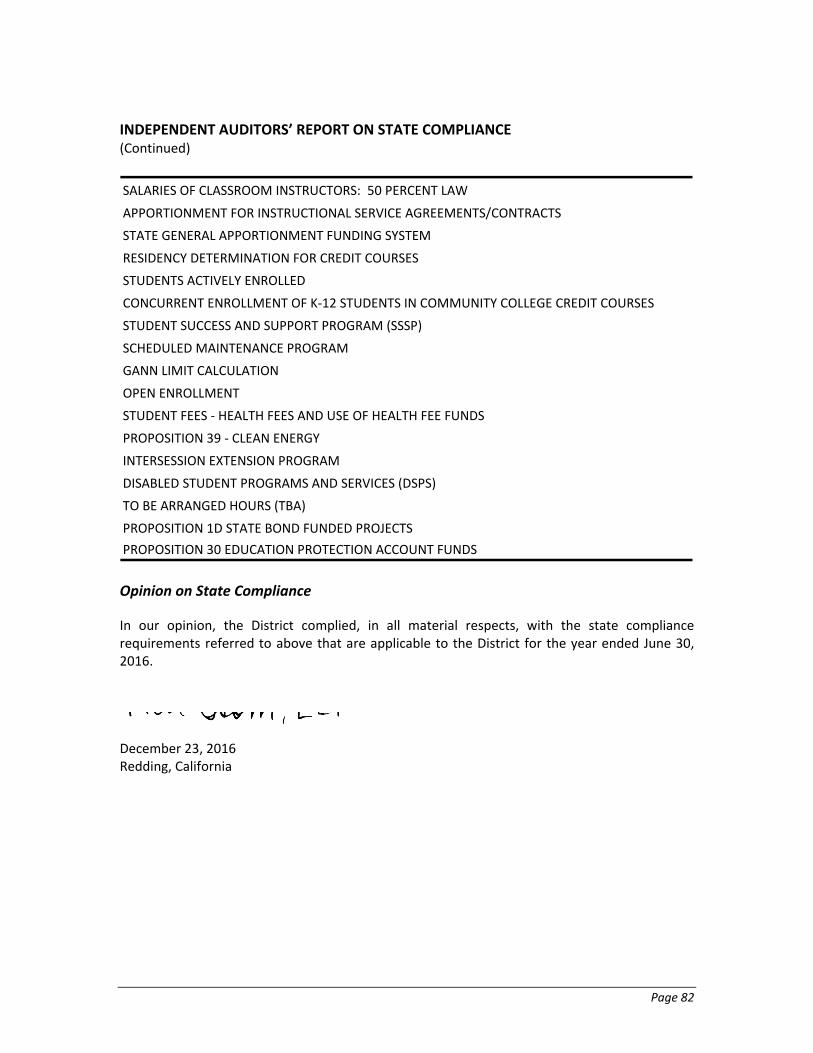
Page 82
INDEPENDENT AUDITORS’ REPORT ON STATE COMPLIANCE (Continued)
SALARIES OF CLASSROOM INSTRUCTORS: 50 PERCENT LAW
APPORTIONMENT FOR INSTRUCTIONAL SERVICE AGREEMENTS/CONTRACTS
STATE GENERAL APPORTIONMENT FUNDING SYSTEM
RESIDENCY DETERMINATION FOR CREDIT COURSES
STUDENTS ACTIVELY ENROLLED
CONCURRENT ENROLLMENT OF K‐12 STUDENTS IN COMMUNITY COLLEGE CREDIT COURSES
STUDENT SUCCESS AND SUPPORT PROGRAM (SSSP)
SCHEDULED MAINTENANCE PROGRAM
GANN LIMIT CALCULATION
OPEN ENROLLMENT
STUDENT FEES ‐ HEALTH FEES AND USE OF HEALTH FEE FUNDS
PROPOSITION 39 ‐ CLEAN ENERGY
INTERSESSION EXTENSION PROGRAM
DISABLED STUDENT PROGRAMS AND SERVICES (DSPS)
TO BE ARRANGED HOURS (TBA)
PROPOSITION 1D STATE BOND FUNDED PROJECTS
PROPOSITION 30 EDUCATION PROTECTION ACCOUNT FUNDS
Opinion on State Compliance
In our opinion, the District complied, in all material respects, with the state compliance requirements referred to above that are applicable to the District for the year ended June 30, 2016.
December 23, 2016 Redding, California
apotter
KCoe Isom
FINDINGS AND QUESTIONED COSTS SECTION
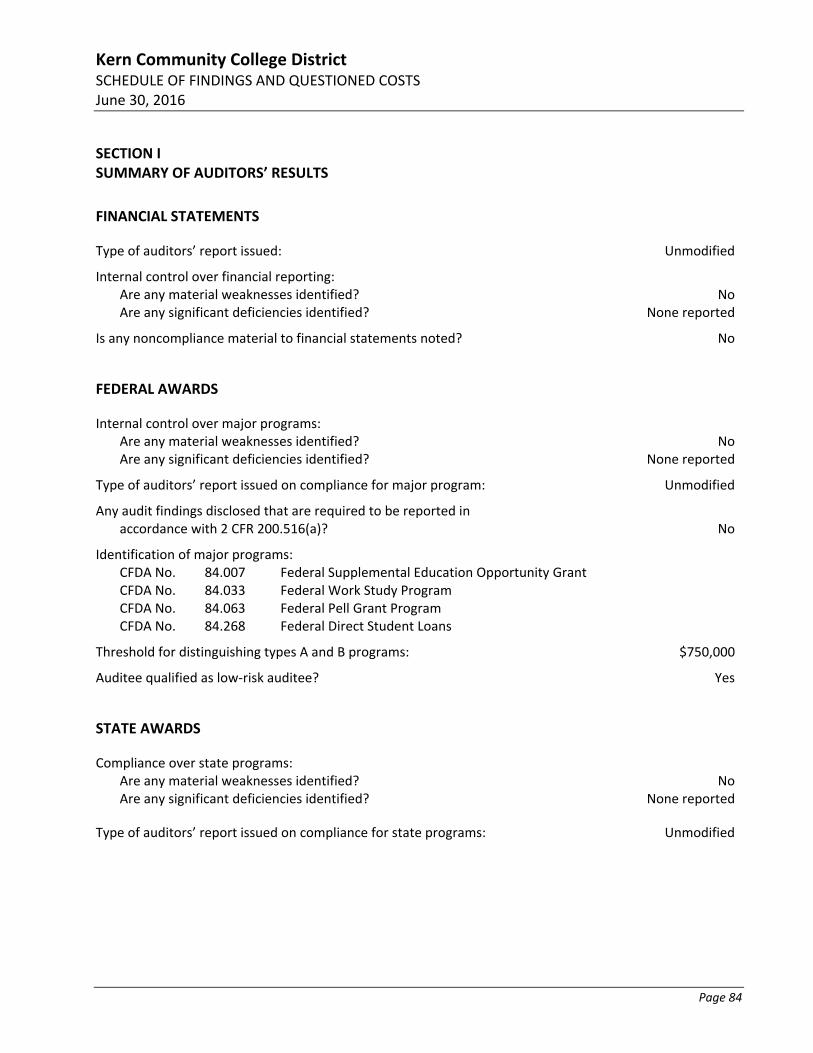
Kern Community College District SCHEDULE OF FINDINGS AND QUESTIONED COSTS June 30, 2016
Page 84
SECTION I SUMMARY OF AUDITORS’ RESULTS
FINANCIAL STATEMENTS
Type of auditors’ report issued: Unmodified
Internal control over financial reporting: Are any material weaknesses identified? NoAre any significant deficiencies identified? None reported
Is any noncompliance material to financial statements noted? No
FEDERAL AWARDS
Internal control over major programs: Are any material weaknesses identified? NoAre any significant deficiencies identified? None reported
Type of auditors’ report issued on compliance for major program: Unmodified
Any audit findings disclosed that are required to be reported in accordance with 2 CFR 200.516(a)? No
Identification of major programs: CFDA No. 84.007 Federal Supplemental Education Opportunity Grant CFDA No. 84.033 Federal Work Study Program CFDA No. 84.063 Federal Pell Grant Program CFDA No. 84.268 Federal Direct Student Loans
Threshold for distinguishing types A and B programs: $750,000
Auditee qualified as low‐risk auditee? Yes
STATE AWARDS
Compliance over state programs: Are any material weaknesses identified? NoAre any significant deficiencies identified? None reported
Type of auditors’ report issued on compliance for state programs: Unmodified
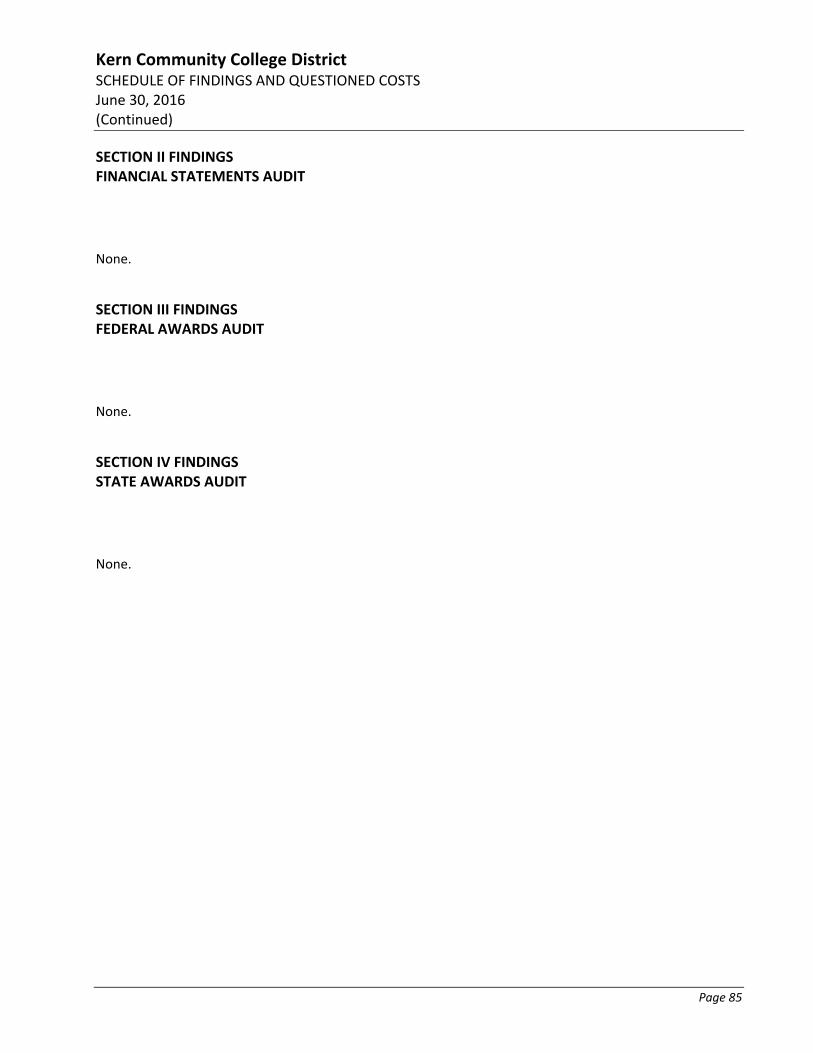
Kern Community College District SCHEDULE OF FINDINGS AND QUESTIONED COSTS June 30, 2016 (Continued)
Page 85
SECTION II FINDINGS FINANCIAL STATEMENTS AUDIT
None.
SECTION III FINDINGS FEDERAL AWARDS AUDIT
None.
SECTION IV FINDINGS STATE AWARDS AUDIT
None.
Kern Community College District CORRECTIVE ACTION PLAN June 30, 2016
Page 86
Not applicable: there are no current‐year findings related to federal awards.
Kern Community College District SUMMARY SCHEDULE OF PRIOR AUDIT FINDINGS June 30, 2016
Page 87
None.