Keppel REIT...Keppel REIT or any of their respective advisors, representatives or agents shall have...
23
Keppel REIT Second Quarter and First Half 2017 Financial Results 18 July 2017
Transcript of Keppel REIT...Keppel REIT or any of their respective advisors, representatives or agents shall have...
Keppel REIT
Second Quarter and First Half 2017
Financial Results
18 July 2017
Outline
Key Highlights for 1H 2017 3
Financial Performance & Capital Management 6
Portfolio Performance 10
Market Updates 14
2
IMPORTANT NOTICE: The past performance of Keppel REIT is not necessarily indicative of its future performance. Certain statements made in this presentation may not be based
on historical information or facts and may be “forward-looking” statements due to a number of risks, uncertainties and assumptions. Representative examples of these factors
include (without limitation) general industry and economic conditions, interest rate trends, cost of capital and capital availability, competition from similar developments or shifts in
expected levels of property rental income, changes in operating expenses, including employee wages, benefits and training, property expenses and governmental and public policy
changes, and the continued availability of financing in the amounts and terms necessary to support future business.
Prospective investors and unitholders of Keppel REIT (“Unitholders”) are cautioned not to place undue reliance on these forward-looking statements, which are based on the current
view of Keppel REIT Management Limited, as manager of Keppel REIT (the “Manager”) on future events. No representation or warranty, express or implied, is made as to, and no
reliance should be placed on, the fairness, accuracy, completeness or correctness of the information, or opinions contained in this presentation. None of the Manager, the trustee of
Keppel REIT or any of their respective advisors, representatives or agents shall have any responsibility or liability whatsoever (for negligence or otherwise) for any loss howsoever
arising from any use of this presentation or its contents or otherwise arising in connection with this presentation. The information set out herein may be subject to updating,
completion, revision, verification and amendment and such information may change materially. The value of units in Keppel REIT (“Units”) and the income derived from them may
fall as well as rise. Units are not obligations of, deposits in, or guaranteed by, the Manager or any of its affiliates. An investment in Units is subject to investment risks, including the
possible loss of the principal amount invested.
Investors have no right to request the Manager to redeem their Units while the Units are listed. It is intended that Unitholders may only deal in their Units through trading on
Singapore Exchange Securities Trading Limited (“SGX-ST”). Listing of the Units on SGX-ST does not guarantee a liquid market for the Units.

Key Highlights for 1H 2017
Distributable Income $95.5 mil
Distribution per Unit 2.87 cents
Aggregate Leverage 38.5%
All-in Interest 2.59%
Portfolio Occupancy 99.8%
Tenant Retention 85%
Strengthened Australian Footprint
with acquisition of 50% stake in
311 Spencer Street
Minimal Leasing Risks
Only 2% of NLA of leases due for the rest of 2017 3
$
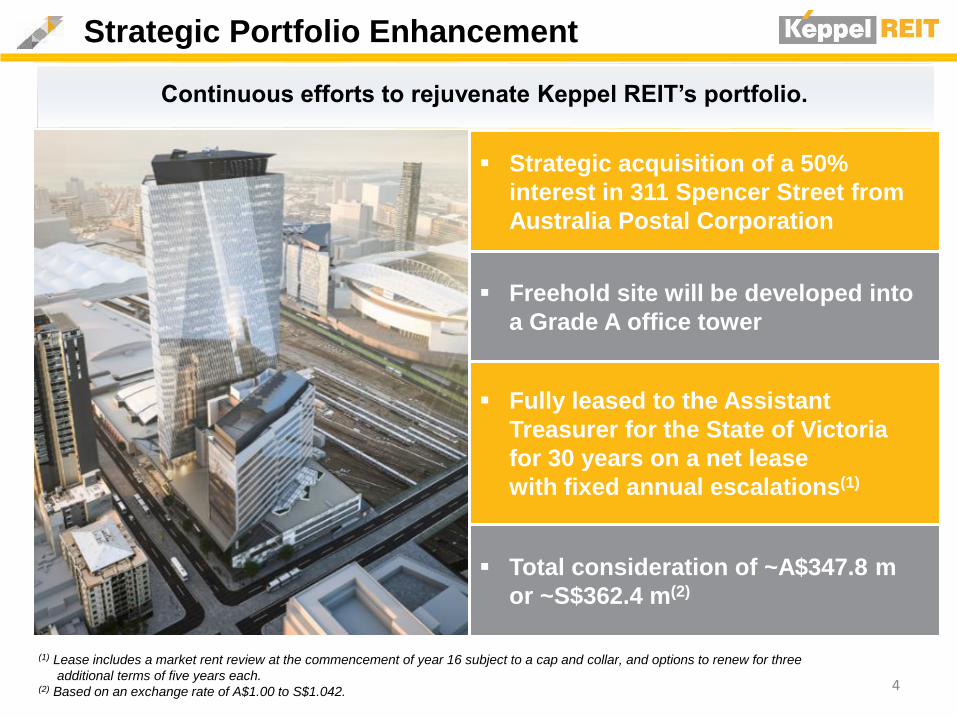
Strategic Portfolio Enhancement
4
(1) Lease includes a market rent review at the commencement of year 16 subject to a cap and collar, and options to renew for three
additional terms of five years each.(2) Based on an exchange rate of A$1.00 to S$1.042.
Strategic acquisition of a 50%
interest in 311 Spencer Street from
Australia Postal Corporation
Freehold site will be developed into
a Grade A office tower
Fully leased to the Assistant
Treasurer for the State of Victoria
for 30 years on a net lease
with fixed annual escalations(1)
Total consideration of ~A$347.8 m
or ~S$362.4 m(2)
Continuous efforts to rejuvenate Keppel REIT’s portfolio.
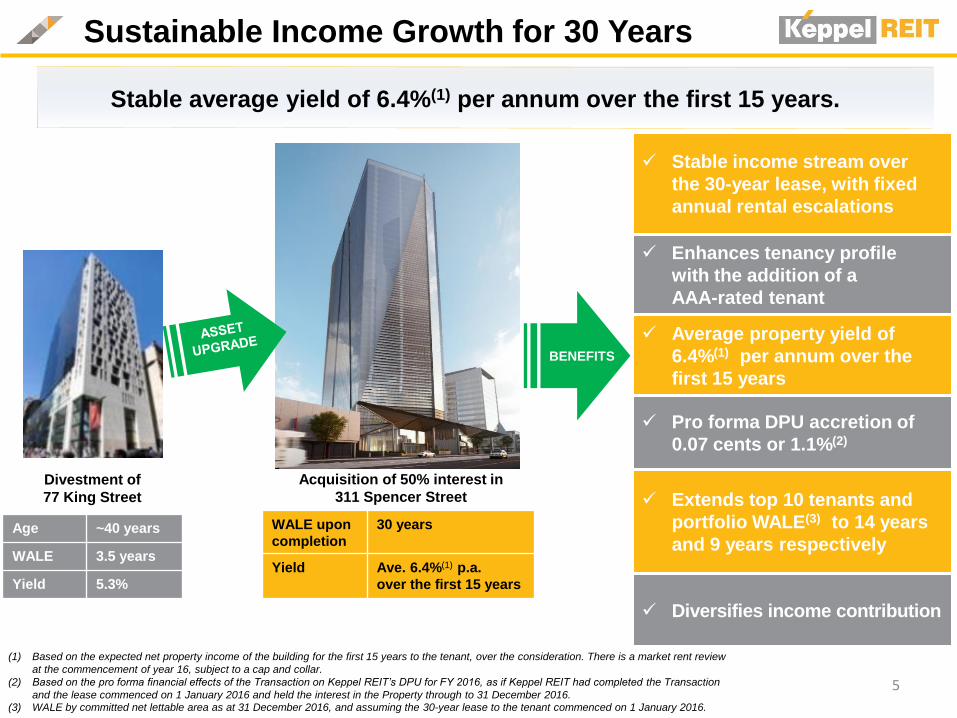
Sustainable Income Growth for 30 Years
5
Divestment of
77 King Street
Age ~40 years
WALE 3.5 years
Yield 5.3%
WALE upon
completion
30 years
Yield Ave. 6.4%(1) p.a.
over the first 15 years
(1) Based on the expected net property income of the building for the first 15 years to the tenant, over the consideration. There is a market rent review
at the commencement of year 16, subject to a cap and collar.
(2) Based on the pro forma financial effects of the Transaction on Keppel REIT’s DPU for FY 2016, as if Keppel REIT had completed the Transaction
and the lease commenced on 1 January 2016 and held the interest in the Property through to 31 December 2016.(3) WALE by committed net lettable area as at 31 December 2016, and assuming the 30-year lease to the tenant commenced on 1 January 2016.
Acquisition of 50% interest in
311 Spencer Street
Stable income stream over
the 30-year lease, with fixed
annual rental escalations
Enhances tenancy profile
with the addition of a
AAA-rated tenant
Average property yield of
6.4%(1) per annum over the
first 15 years
Pro forma DPU accretion of
0.07 cents or 1.1%(2)
Extends top 10 tenants and
portfolio WALE(3) to 14 years
and 9 years respectively
Diversifies income contribution
Stable average yield of 6.4%(1) per annum over the first 15 years.
BENEFITS
Financial Performance
& Capital Management
Marina Bay Financial Centre, Singapore
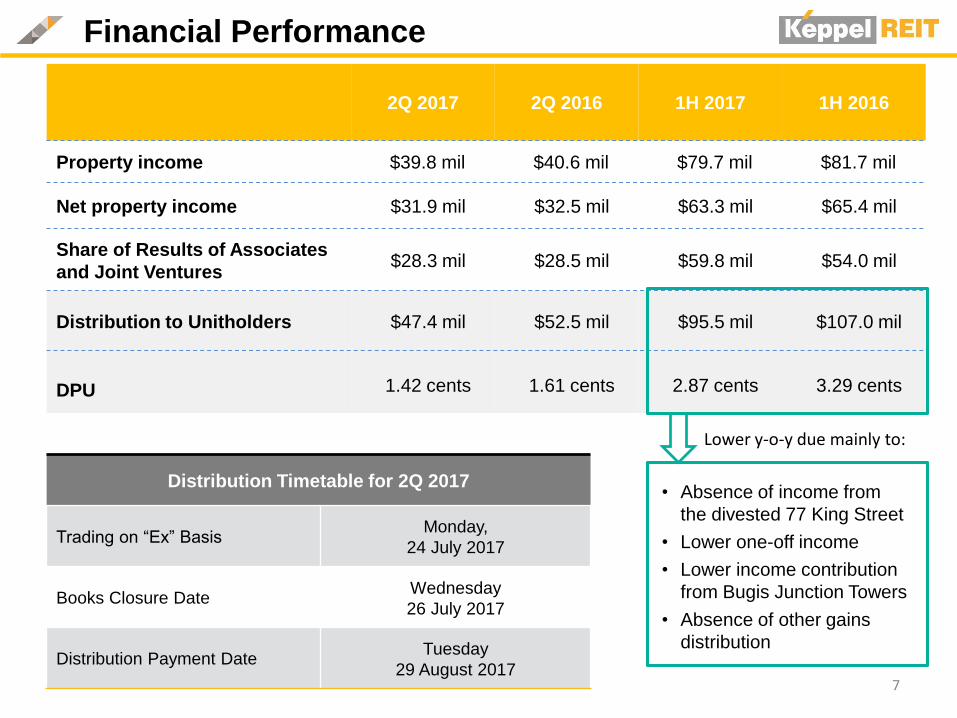
• Absence of income from
the divested 77 King Street
• Lower one-off income
• Lower income contribution
from Bugis Junction Towers
• Absence of other gains
distribution
Financial Performance
7
2Q 2017 2Q 2016 1H 2017 1H 2016
Property income $39.8 mil $40.6 mil $79.7 mil $81.7 mil
Net property income $31.9 mil $32.5 mil $63.3 mil $65.4 mil
Share of Results of Associates
and Joint Ventures$28.3 mil $28.5 mil $59.8 mil $54.0 mil
Distribution to Unitholders $47.4 mil $52.5 mil $95.5 mil $107.0 mil
DPU 1.42 cents 1.61 cents 2.87 cents 3.29 cents
Distribution Timetable for 2Q 2017
Trading on “Ex” BasisMonday,
24 July 2017
Books Closure DateWednesday
26 July 2017
Distribution Payment DateTuesday
29 August 2017
Lower y-o-y due mainly to:
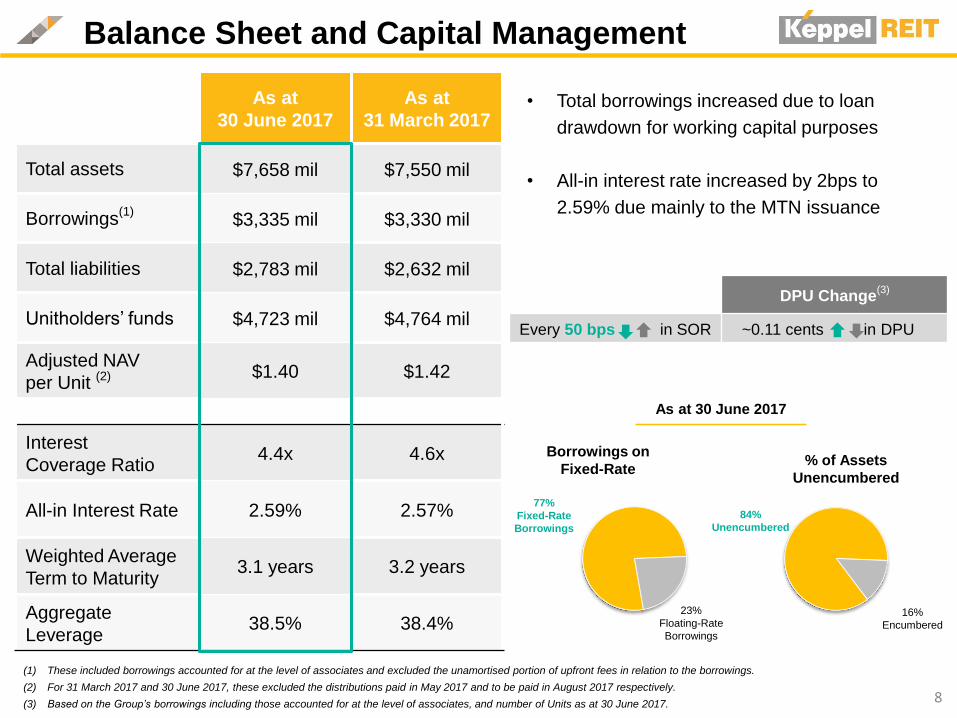
Balance Sheet and Capital Management
As at
30 June 2017
As at
31 March 2017
Total assets $7,658 mil $7,550 mil
Borrowings(1)
$3,335 mil $3,330 mil
Total liabilities $2,783 mil $2,632 mil
Unitholders’ funds $4,723 mil $4,764 mil
Adjusted NAV
per Unit (2) $1.40 $1.42
Interest
Coverage Ratio4.4x 4.6x
All-in Interest Rate 2.59% 2.57%
Weighted Average
Term to Maturity3.1 years 3.2 years
Aggregate
Leverage38.5% 38.4%
(1) These included borrowings accounted for at the level of associates and excluded the unamortised portion of upfront fees in relation to the borrowings.
(2) For 31 March 2017 and 30 June 2017, these excluded the distributions paid in May 2017 and to be paid in August 2017 respectively.
(3) Based on the Group’s borrowings including those accounted for at the level of associates, and number of Units as at 30 June 2017.8
• Total borrowings increased due to loan
drawdown for working capital purposes
• All-in interest rate increased by 2bps to
2.59% due mainly to the MTN issuance
16%
Encumbered
84%
Unencumbered
% of Assets
Unencumbered
23%
Floating-Rate
Borrowings
77%
Fixed-Rate
Borrowings
Borrowings on
Fixed-Rate
As at 30 June 2017
DPU Change(3)
Every 50 bps in SOR ~0.11 cents in DPU
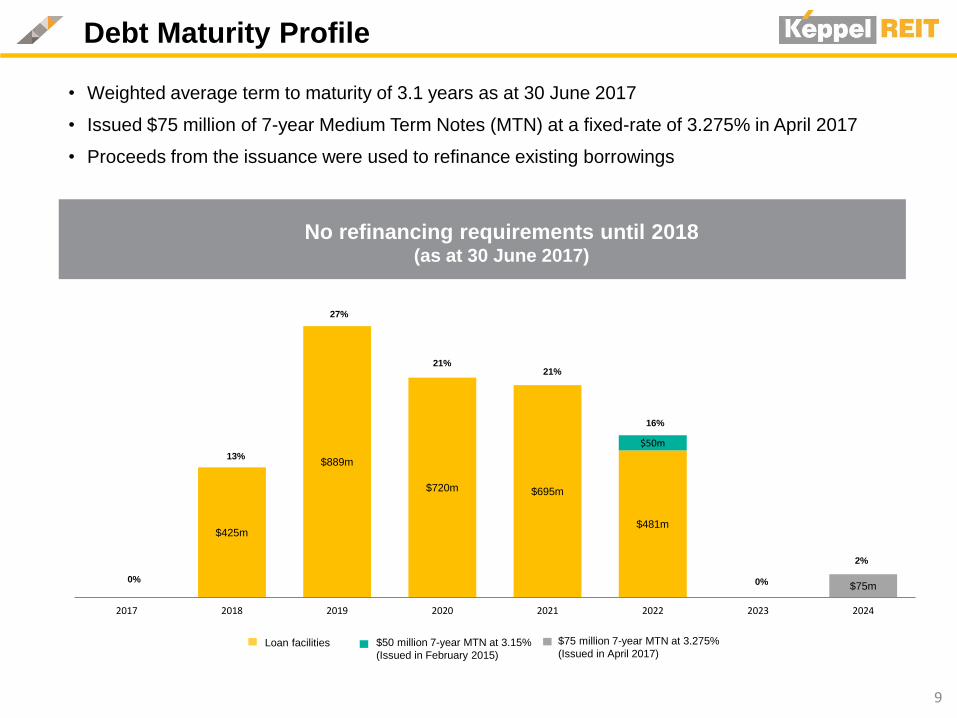
$425m
$889m
$720m $695m
$481m
$50m
$75m
2017 2018 2019 2020 2021 2022 2023 2024
0%
13%
27%
21%
16%
21%
0%
2%
Debt Maturity Profile
No refinancing requirements until 2018 (as at 30 June 2017)
9
Loan facilities $50 million 7-year MTN at 3.15%
(Issued in February 2015)
$75 million 7-year MTN at 3.275%
(Issued in April 2017)
• Weighted average term to maturity of 3.1 years as at 30 June 2017
• Issued $75 million of 7-year Medium Term Notes (MTN) at a fixed-rate of 3.275% in April 2017
• Proceeds from the issuance were used to refinance existing borrowings
Portfolio
Performance
Ocean Financial Centre, Singapore
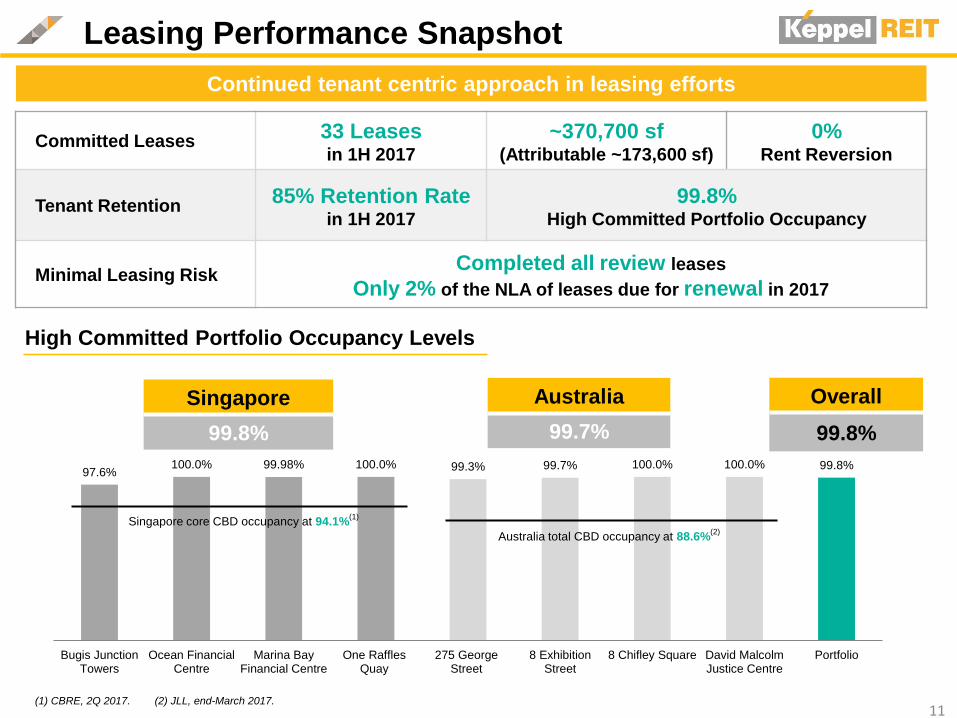
Leasing Performance Snapshot
Committed Leases33 Leases in 1H 2017
~370,700 sf(Attributable ~173,600 sf)
0% Rent Reversion
Tenant Retention85% Retention Rate
in 1H 2017
99.8%High Committed Portfolio Occupancy
Minimal Leasing RiskCompleted all review leases
Only 2% of the NLA of leases due for renewal in 2017
Continued tenant centric approach in leasing efforts
11
97.6%100.0% 99.98% 100.0% 99.3% 99.7% 100.0% 100.0% 99.8%
Bugis JunctionTowers
Ocean FinancialCentre
Marina BayFinancial Centre
One RafflesQuay
275 GeorgeStreet
8 ExhibitionStreet
8 Chifley Square David MalcolmJustice Centre
Portfolio
(1) CBRE, 2Q 2017. (2) JLL, end-March 2017.
Australia
99.7%
Singapore
99.8%
Overall
99.8%
High Committed Portfolio Occupancy Levels
Singapore core CBD occupancy at 94.1%(1)
Australia total CBD occupancy at 88.6%(2)

2.0%
6.6%
11.6%
7.2%
21.0%
51.4%
0.0%
14.6%
1.6%4.2%
6.1% 4.9%
2017 2018 2019 2020 2021 2022 and beyond
Lease expiry as % of total portfolio NLA Rent review as % of total portfolio NLA
Proactive Lease Management
12All data as at 30 June 2017.
* Remaining lease term to expiry based on portfolio committed NLA
• Completed all review leases, with only 2% of the NLA of leases expiring for the rest of 2017
Top Ten Tenants WALE
Portfolio WALE
Weighted Average Lease Expiry (WALE)
(1)
Top 10 Tenants
~9 Years Portfolio
~6 Years
Portfolio Lease Expiry Profile (by Attributable NLA)
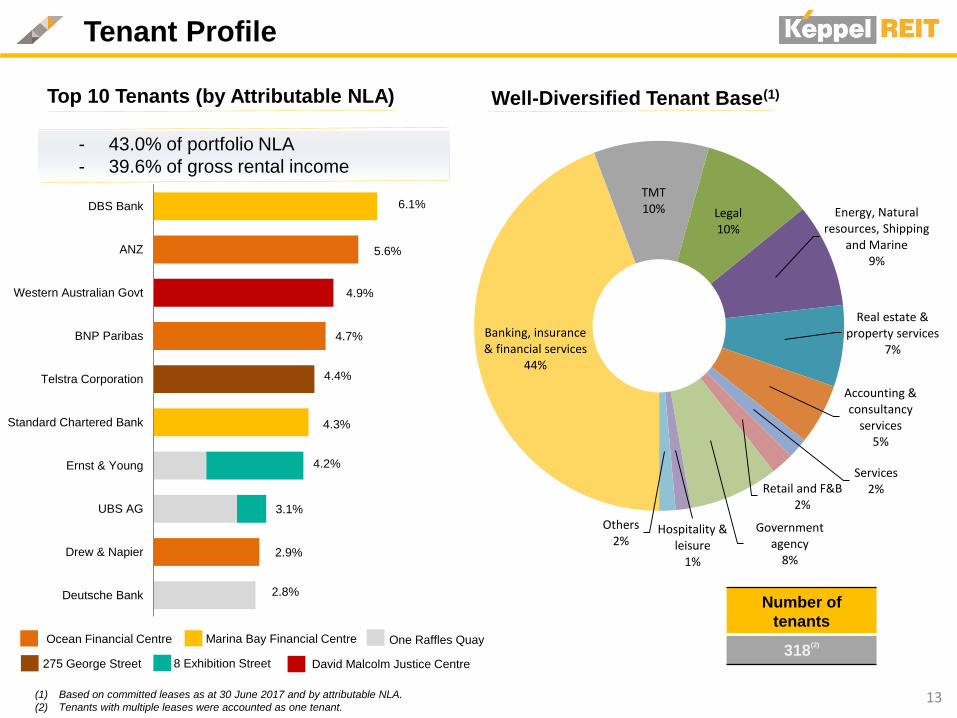
2.8%
2.9%
4.3%
4.4%
4.7%
4.9%
5.6%
6.1%
3.1%
4.2%
Deutsche Bank
Drew & Napier
UBS AG
Ernst & Young
Standard Chartered Bank
Telstra Corporation
BNP Paribas
Western Australian Govt
ANZ
DBS Bank
Banking, insurance & financial services
44%
TMT10% Legal
10%
Energy, Natural resources, Shipping
and Marine9%
Real estate & property services
7%
Accounting & consultancy
services5%
Services2%Retail and F&B
2%
Government agency
8%
Hospitality & leisure
1%
Others2%
Tenant Profile
Ocean Financial Centre Marina Bay Financial Centre One Raffles Quay
275 George Street 8 Exhibition Street David Malcolm Justice Centre
13
- 43.0% of portfolio NLA
- 39.6% of gross rental income
Number of
tenants
318(2)
Well-Diversified Tenant Base(1)Top 10 Tenants (by Attributable NLA)
(1) Based on committed leases as at 30 June 2017 and by attributable NLA.
(2) Tenants with multiple leases were accounted as one tenant.
Market Updates
David Malcolm Justice Centre, Perth
Singapore Office Market
Marina Bay Financial Centre Ocean Financial Centre One Raffles Quay
Bugis Junction TowersOcean Financial Centre
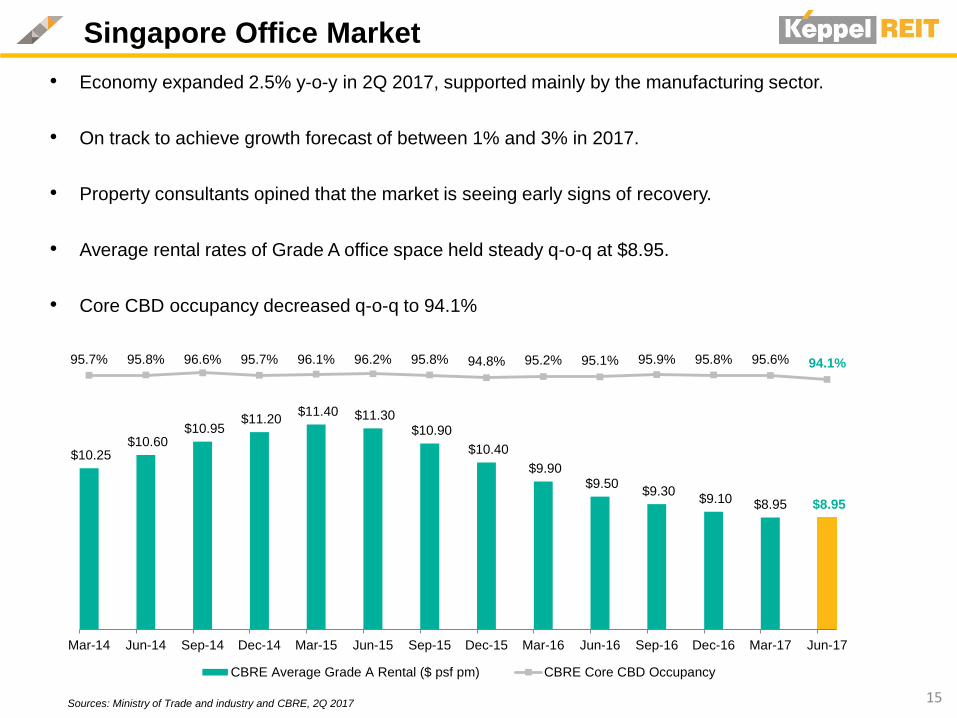
• Economy expanded 2.5% y-o-y in 2Q 2017, supported mainly by the manufacturing sector.
• On track to achieve growth forecast of between 1% and 3% in 2017.
• Property consultants opined that the market is seeing early signs of recovery.
• Average rental rates of Grade A office space held steady q-o-q at $8.95.
• Core CBD occupancy decreased q-o-q to 94.1%
15Sources: Ministry of Trade and industry and CBRE, 2Q 2017
$10.25 $10.60
$10.95 $11.20
$11.40 $11.30 $10.90
$10.40
$9.90 $9.50
$9.30 $9.10 $8.95 $8.95
95.7% 95.8% 96.6% 95.7% 96.1% 96.2% 95.8% 94.8% 95.2% 95.1% 95.9% 95.8% 95.6% 94.1%
0.0%
10.0%
20.0%
30.0%
40.0%
50.0%
60.0%
70.0%
80.0%
90.0%
100.0%
$6.00
$7.00
$8.00
$9.00
$10.00
$11.00
$12.00
$13.00
Mar-14 Jun-14 Sep-14 Dec-14 Mar-15 Jun-15 Sep-15 Dec-15 Mar-16 Jun-16 Sep-16 Dec-16 Mar-17 Jun-17
CBRE Average Grade A Rental ($ psf pm) CBRE Core CBD Occupancy
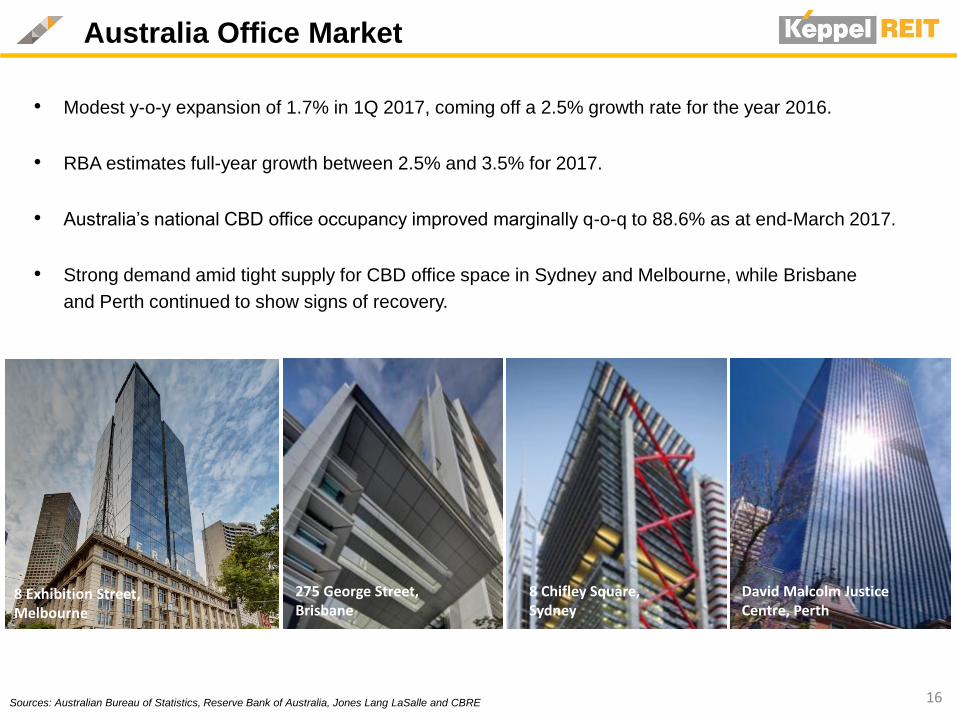
Australia Office Market
Sources: Australian Bureau of Statistics, Reserve Bank of Australia, Jones Lang LaSalle and CBRE
• Modest y-o-y expansion of 1.7% in 1Q 2017, coming off a 2.5% growth rate for the year 2016.
• RBA estimates full-year growth between 2.5% and 3.5% for 2017.
• Australia’s national CBD office occupancy improved marginally q-o-q to 88.6% as at end-March 2017.
• Strong demand amid tight supply for CBD office space in Sydney and Melbourne, while Brisbane
and Perth continued to show signs of recovery.
8 Chifley Square,Sydney
8 Exhibition Street, Melbourne
275 George Street, Brisbane
David Malcolm Justice Centre, Perth8 Chifley Square
16
8 Exhibition Street, Melbourne Ocean Financial Centre Bugis Junction Towers
275 George Street,Brisbane
8 Chifley Square, Sydney
David Malcolm Justice Centre, Perth
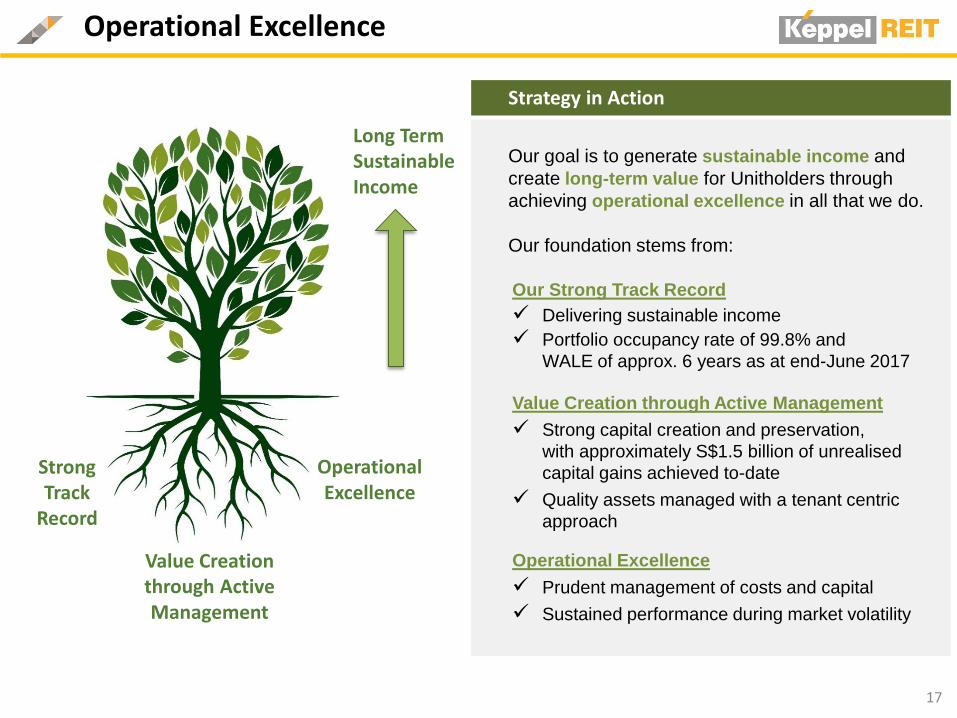
Strategy in Action
Our goal is to generate sustainable income and
create long-term value for Unitholders through
achieving operational excellence in all that we do.
Our foundation stems from:
Operational Excellence
17
Our Strong Track Record
Delivering sustainable income
Portfolio occupancy rate of 99.8% and
WALE of approx. 6 years as at end-June 2017
Value Creation through Active Management
Strong capital creation and preservation,
with approximately S$1.5 billion of unrealised
capital gains achieved to-date
Quality assets managed with a tenant centric
approach
Operational Excellence
Prudent management of costs and capital
Sustained performance during market volatility
Strong Track
Record
Operational Excellence
Value Creation through Active Management
Long Term Sustainable Income
Additional Information
One Raffles Quay, Singapore18
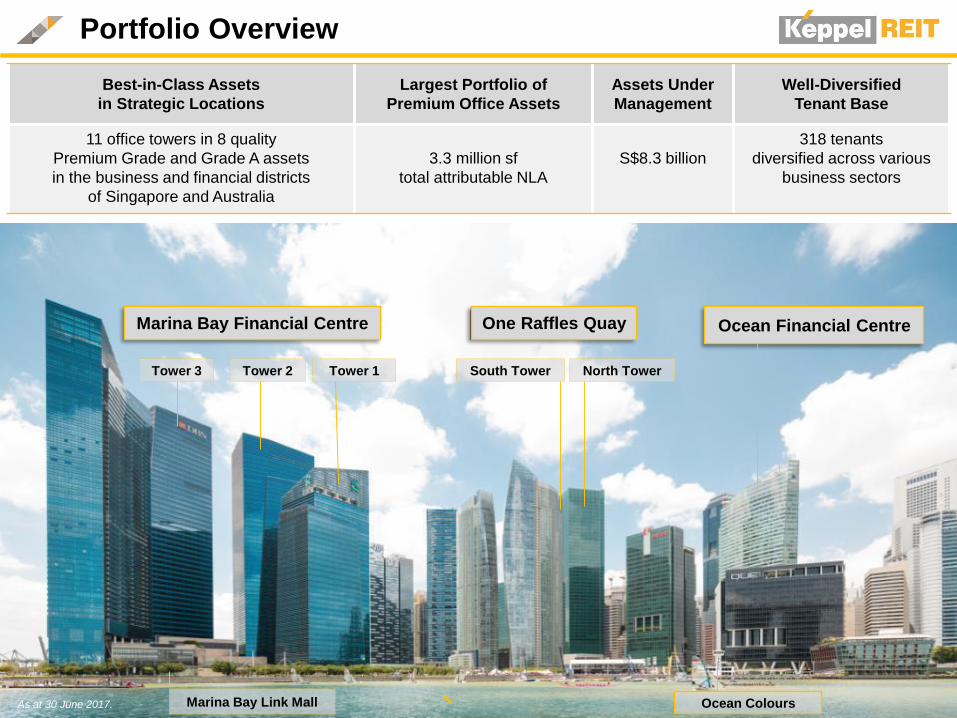
Portfolio Overview
Marina Bay Financial Centre One Raffles Quay Ocean Financial Centre
North TowerSouth TowerTower 3
Marina Bay Link Mall
Best-in-Class Assets
in Strategic Locations
Largest Portfolio of
Premium Office Assets
Assets Under
Management
Well-Diversified
Tenant Base
11 office towers in 8 quality
Premium Grade and Grade A assets
in the business and financial districts
of Singapore and Australia
3.3 million sf
total attributable NLA
S$8.3 billion
318 tenants
diversified across various
business sectors
Ocean Colours
Tower 1 Tower 2
As at 30 June 2017.
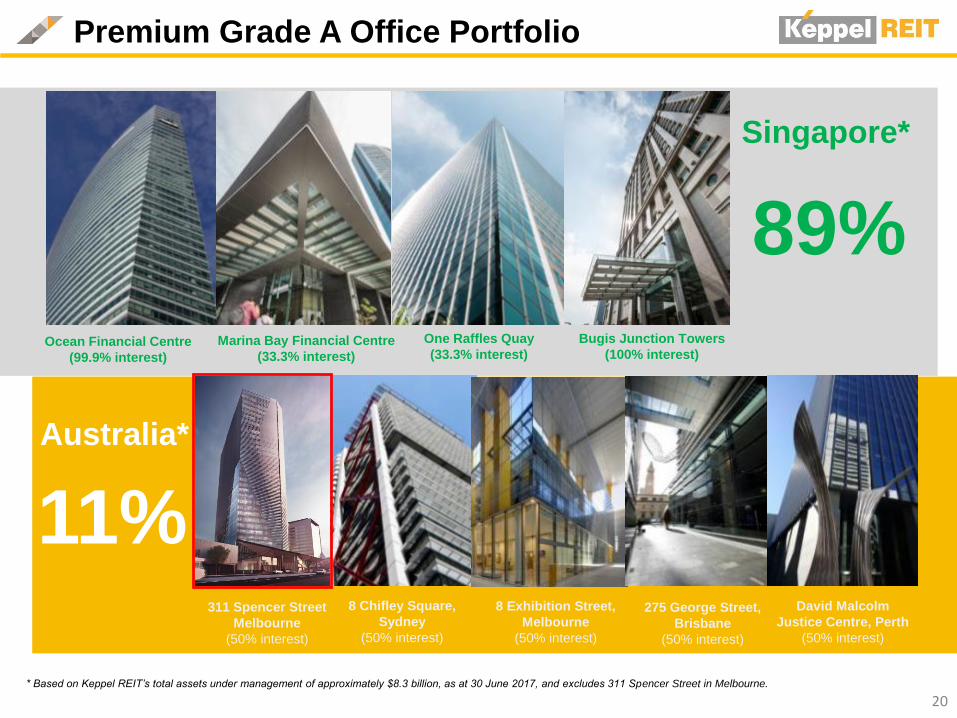
Australia*
Singapore*
Marina Bay Financial Centre
(33.3% interest)Ocean Financial Centre
(99.9% interest)
One Raffles Quay
(33.3% interest)
Bugis Junction Towers
(100% interest)
Premium Grade A Office Portfolio
8 Chifley Square,
Sydney
(50% interest)
8 Exhibition Street,
Melbourne
(50% interest)
275 George Street,
Brisbane
(50% interest)
David Malcolm
Justice Centre, Perth
(50% interest)
11%
89%
20
311 Spencer Street
Melbourne
(50% interest)
* Based on Keppel REIT’s total assets under management of approximately $8.3 billion, as at 30 June 2017, and excludes 311 Spencer Street in Melbourne.
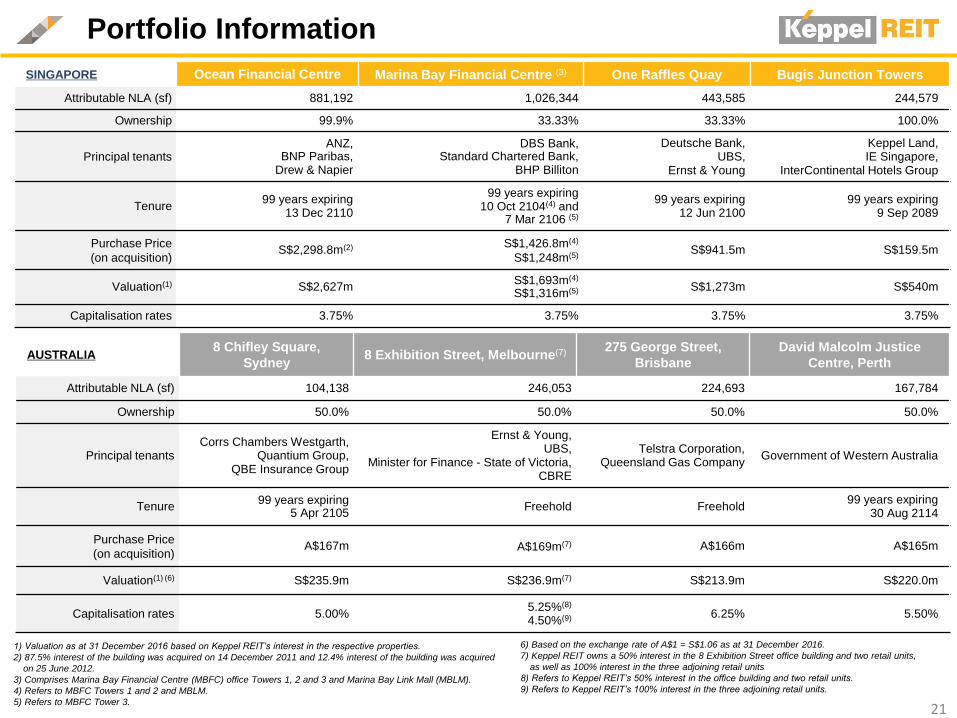
1) Valuation as at 31 December 2016 based on Keppel REIT’s interest in the respective properties.
2) 87.5% interest of the building was acquired on 14 December 2011 and 12.4% interest of the building was acquired
on 25 June 2012.
3) Comprises Marina Bay Financial Centre (MBFC) office Towers 1, 2 and 3 and Marina Bay Link Mall (MBLM).
4) Refers to MBFC Towers 1 and 2 and MBLM.
5) Refers to MBFC Tower 3.
Portfolio Information
21
SINGAPORE Ocean Financial Centre Marina Bay Financial Centre (3) One Raffles Quay Bugis Junction Towers
Attributable NLA (sf) 881,192 1,026,344 443,585 244,579
Ownership 99.9% 33.33% 33.33% 100.0%
Principal tenantsANZ,
BNP Paribas, Drew & Napier
DBS Bank, Standard Chartered Bank,
BHP Billiton
Deutsche Bank, UBS,
Ernst & Young
Keppel Land,IE Singapore,
InterContinental Hotels Group
Tenure99 years expiring
13 Dec 2110
99 years expiring 10 Oct 2104(4) and
7 Mar 2106 (5)
99 years expiring 12 Jun 2100
99 years expiring 9 Sep 2089
Purchase Price
(on acquisition)S$2,298.8m(2) S$1,426.8m(4)
S$1,248m(5)S$941.5m S$159.5m
Valuation(1) S$2,627mS$1,693m(4)
S$1,316m(5) S$1,273m S$540m
Capitalisation rates 3.75% 3.75% 3.75% 3.75%
AUSTRALIA8 Chifley Square,
Sydney8 Exhibition Street, Melbourne(7) 275 George Street,
Brisbane
David Malcolm Justice
Centre, Perth
Attributable NLA (sf) 104,138 246,053 224,693 167,784
Ownership 50.0% 50.0% 50.0% 50.0%
Principal tenantsCorrs Chambers Westgarth,
Quantium Group,QBE Insurance Group
Ernst & Young,UBS,
Minister for Finance - State of Victoria,CBRE
Telstra Corporation,Queensland Gas Company
Government of Western Australia
Tenure99 years expiring
5 Apr 2105Freehold Freehold
99 years expiring 30 Aug 2114
Purchase Price
(on acquisition)A$167m A$169m(7) A$166m A$165m
Valuation(1) (6) S$235.9m S$236.9m(7) S$213.9m S$220.0m
Capitalisation rates 5.00%5.25%(8)
4.50%(9) 6.25% 5.50%
6) Based on the exchange rate of A$1 = S$1.06 as at 31 December 2016.
7) Keppel REIT owns a 50% interest in the 8 Exhibition Street office building and two retail units,
as well as 100% interest in the three adjoining retail units
8) Refers to Keppel REIT’s 50% interest in the office building and two retail units.
9) Refers to Keppel REIT’s 100% interest in the three adjoining retail units.
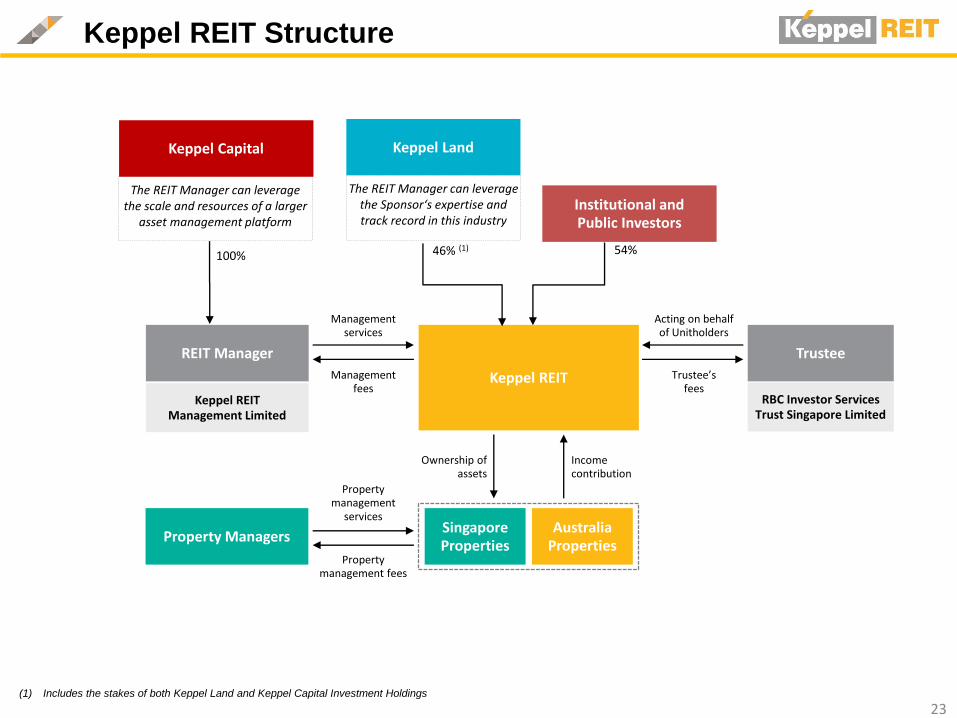
Keppel REIT Structure
The REIT Manager can leverage the scale and resources of a larger
asset management platform
Property Managers
Property management
services
Property management fees
Institutional and Public Investors
54%
REIT Manager Trustee
Keppel REIT Management Limited
RBC Investor Services Trust Singapore Limited
Australia Properties
Singapore Properties
Ownership of assets
Income contribution
Keppel REIT
Management services
Management fees
Acting on behalf of Unitholders
Trustee’sfees
Keppel Land
46% (1)100%
Keppel Capital
The REIT Manager can leverage the Sponsor‘s expertise and track record in this industry
23(1) Includes the stakes of both Keppel Land and Keppel Capital Investment Holdings

Thank You