Kenyon, A. D. and Catterson, V. M. and McArthur, S. D. J ...
6
Kenyon, A. D. and Catterson, V. M. and McArthur, S. D. J. (2010) Development of an intelligent system for detection of exhaust gas temperature anomalies in gas turbines. Insight: The Journal of the British Institute of Non-Destructive Testing, 52 (8). ISSN 1354-2575 http://strathprints.strath.ac.uk/26474/ This is an author produced version of a paper published in Insight: The Journal of the British Institute of Non-Destructive Testing, 52 (8). ISSN 1354-2575. This version has been peer-reviewed but does not include t corrections, published layout or pagination. Strathprints is designed to allow users to access the research output of the University of Strathclyde. Copyright © and Moral Rights for the papers on this site are retained by the individual authors and/or other copyright owners. You may not engage in further distribution of the material for any profitmaking activities or any commercial gain. You may freely distribute both the url (http://strathprints.strath.ac.uk ) and the content of this paper for research or study, educational, or not-for-profit purposes without prior permission or charge. You may freely distribute the url (http://strathprints.strath.ac.uk) of the Strathprints website. Any correspondence concerning this service should be sent to The Strathprints Administrator: [email protected]
Transcript of Kenyon, A. D. and Catterson, V. M. and McArthur, S. D. J ...

Kenyon, A. D. and Catterson, V. M. and McArthur, S. D. J. (2010) Development of an intelligent system for detection of exhaust gas temperature anomalies in gas turbines. Insight: The Journal of the British Institute of Non-Destructive Testing, 52 (8). ISSN 1354-2575
http://strathprints.strath.ac.uk/26474/
This is an author produced version of a paper published in Insight: The Journal of the British Institute of Non-Destructive Testing, 52 (8). ISSN 1354-2575. This version has been peer-reviewed but does not include the final publisher proof corrections, published layout or pagination.
Strathprints is designed to allow users to access the research output of the University of Strathclyde. Copyright © and Moral Rights for the papers on this site are retained by the individual authors and/or other copyright owners. You may not engage in further distribution of the material for any profitmaking activities or any commercial gain. You may freely distribute both the url (http://strathprints.strath.ac.uk) and the content of this paper for research or study, educational, or not-for-profit purposes without prior permission or charge. You may freely distribute the url (http://strathprints.strath.ac.uk) of the Strathprints website.
Any correspondence concerning this service should be sent to The Strathprints Administrator: [email protected]
Insight Vol 52 No 8 August 2010 1
NEURAL NETWORKS
An unplanned outage can be costly for a utility, and gas turbines are expensive pieces of equipment to repair or replace. It is therefore vital that anomalous behaviour is flagged before damage can occur that may cause a prolonged outage. An anomaly detection system is proposed for gas turbines to monitor the related parameters and raise alarms when anomalies are identified.The proposed system incorporates machine learning algorithms based on artificial neural networks (ANN). By using ANNs trained on normal plant behaviour, it is possible to identify anomalous behaviour by the high residuals between actual and predicted outputs. Within this paper, the data mining methodology is described and the process followed before arriving at the successful approach is documented. Results from testing the approach on an industrial case study are presented and, based on these results, areas for further development are identified. It is intended to deploy the system along with several other algorithms as part of a multi-agent system for plant-wide condition monitoring. This paper will focus on the design and testing of the developed anomaly detection system.
1. IntroductionMaintaining the condition of generation assets is a vital part of electricity generation. Any unscheduled loss of service is costly to the energy provider, both in direct financial terms and in damage to its reputation among existing and potential customers. Because of this, detailed, timely and accurate condition monitoring and diagnostic support for generation assets is important to safely operate a power plant. This paper will focus on anomaly detection algorithms for gas turbines, but the technique developed here will form part of a larger fleet-wide plant condition monitoring system based on multi-agent system (MAS) technology.
Gas turbines (GT) are used in several ways, such as for peaking power or for cold-starts in large units. However, when they are used in combined cycle gas turbine (CCGT) units they are required to run for long periods of time where they are used for base load. This limits the down-time for manual inspection and testing, while increasing the wear on the gas turbine. Therefore, an online system that can detect problems while the turbine is operating is a valuable commodity. This paper will detail the use of a data mining methodology and machine learning techniques to derive a novel condition monitoring algorithm for use with gas turbines.
The paper is organised as follows: Section 2 outlines the problems that the proposed condition monitoring system must overcome; Section 3 provides a brief review of work in the field of condition monitoring, with particular focus on CCGT and GTs;
Section 4 outlines the data mining methodology and its application using a case study; Section 5 documents the implementation and testing of the selected algorithm; and Section 6 is the conclusion.
2. Problem descriptionA major utility has experienced significant outages in a CCGT plant, related to failure of gas turbine components. The utility requires a data-based technique capable of detecting these faults, and an appropriate technique can be selected through the use of data mining. Finally, the system must be tested and shown to be successful in detecting the required faults.
The technique will ultimately form an intelligent agent within the larger condition monitoring system. Intelligent agents are constructs, in this case software, capable of both reactive and proactive behaviour, and incorporating social ability(1,2). Several intelligent agents deployed together are considered a multi-agent system. The algorithm described in this paper will be the core of an intelligent agent, which will form part of a fleet-wide monitoring system(3).
3. Related workThe following is a review of existing research in the field of condition monitoring. Particular attention is given to CCGT-specific applications, focused primarily on the gas turbine, before notable examples of more general condition monitoring techniques. This section describes the current state-of-the-art.
3.1 Approach to condition monitoringA great deal of research has been undertaken into CCGT condition monitoring(4). However, the wide assortment of techniques can generally be divided into two approaches:q Anomaly detection monitors parameters related to the subject,
and, if they differ sufficiently from a perceived notion of normality, the subject is considered to have entered an anomalous state and an alarm may be raised. In this type of condition monitoring there is no diagnosis of the nature of the fault, only that the monitored parameters have deviated from normal values.
q Fault diagnosis attempts to diagnose a problem by analysing data and determining the particular fault which has occurred. Fault diagnosis is often used to determine the most likely type or cause of a fault that is known to have occurred, and does not necessarily include a capability to distinguish normal from faulty behaviour. This is in contrast to anomaly detection, where the presence of a fault is identified, but not the type or source of the fault.
From the above description, it is clear that neither completely covers the requirements to detect and diagnose a fault in a monitored subject. For this reason, previous work has combined these approaches(5). In the cited case, an anomaly detection algorithm is used first to detect whether a fault has occurred and
Development of an intelligent system for detection of exhaust gas temperature anomalies in gas turbines
A D Kenyon, V M Catterson and S D J McArthur
Paper presented at CM 2010-MFPT 2010, the Seventh International Conference on Condition Monitoring and Machinery Failure Prevention Technologies, Stratford-upon-Avon, June 2010
Andrew D Kenyon, Victoria M Catterson and Stephen D J McArthur are with the Department of Electronic and Electrical Engineering, University of Strathclyde, Glasgow G1 1XQ, United Kingdom. Tel: +44 (0)141 548 4840; Email: [email protected]
if so, delegate the task of identifying the particular fault to a fault diagnosis algorithm. Such an approach allows a wider range of algorithms that may be particularly adept at anomaly detection or fault diagnosis, but not both. It combines the ability of anomaly detection to detect any deviation from normal behaviour, even if caused by a fault type not seen before, while allowing a dedicated fault diagnosis algorithm to classify the fault if it is of a known type.
3.2 CCGT monitoringAnomaly detection, or alternatively ‘novelty detection’ as it is sometimes referred to, is often the most suitable avenue for condition monitoring of high integrity systems(6). This is especially true of GTs, where faults are relatively rare and a multi-class fault classification approach is not possible due to the lack of data for even a sub-set of possible faults. It is therefore useful to instead model the normal behaviour of the GT, of which there is usually an abundance of data, and raise alarms when the behaviour deviates sufficiently from normal.
The variation in gas turbine monitoring depends greatly on the original equipment manufacturer (OEM) and the original application of the turbine(7). Once the type and application of the turbine is known, the techniques can be considered. One possible approach is to build a probabilistic model of possible faults. Poncet et al(8) take this approach, by focusing on models that predict the likelihood of particular faults in the compressor and turbine, based on available symptoms. This is, however, extremely complicated, and would require extensive knowledge of the turbine and the operation and degradation of both components during each fault. The same is true for any mathematically-derived model.
Ultimately, some kind of machine learning approach is more appropriate in a case where knowledge of the equipment is limited but data is abundant. The DADICC system(9), which utilises artificial neural networks (ANN) as models for components of a CCGT, shows the application of such a technique. While the effectiveness of this approach has been demonstrated through deployment on an Iberdrola CCGT plant, it is stated that the choice of variables is vital to the success of such models. This strongly suggests the need to use a structured data mining methodology (discussed further in section 4).
Another example, the ND Tool(10), is a fleet-wide application designed to learn the behaviour of a plant using entirely data-driven techniques. The example uses a form of K-means clustering and can be applied to any set of variables selected by the user. Using a training dataset based on normal operation, the clusters for normal behaviour are learned and stored. During testing, the Euclidean distance between the actual values and the cluster centres is calculated and used as a measure of normality.
3.3 Condition monitoring of other assetsConsidering other condition monitoring examples can be useful as many techniques are not domain specific and can be applied to the GT problem domain. An example of the successful application of several machine learning techniques is given by McArthur et al(11), where an ANN, K-means and a rule induction engine are utilised for the purpose of transformer partial discharge fault diagnosis. Of note is the use of MAS technology to allow several techniques to work together as one system. It is intended that the technique applied in this paper will function in a similar way as part of a fleet-wide condition monitoring MAS.
Parallels can also be drawn between locomotive condition monitoring and the gas turbine field. The use of ANNs for anomaly detection(12) is similar to previous examples. The appropriateness of a machine learning approach over a physical model, in situations where complexity of the model and frequency of sampling is an issue, is also addressed. The example takes a ‘divide and conquer’ approach in order to allow the fault to be attributed to specific sub-
components, rather than model an entire locomotive system. This is similar to the philosophy behind the intended MAS.
3.4 SummaryFrom a review of related work, it is clear that the application of the condition monitoring algorithm presented in this paper is unique. While an ANN was ultimately chosen to detect anomalies in the GT, similar to the DADICC system, the application of the ANN is unique for a number of reasons. Primarily, DADICC is a collection of models, designed to model an entire plant. Conversely, the approach taken to this problem required detection of particular types of faults. The choice of variables and technique, driven by a data mining methodology, and the successful implementation to allow detection of previously undetectable faults, is the contribution and the novelty of this paper.
4. Data miningData mining is considered as the non-trivial extraction of implicit, previously unknown and potentially useful information from data(13). A structure for data mining has been developed(14) and consists of a number of steps. The steps are outlined in section 4.1, and a case study demonstrating the application of this methodology to GT data is provided in section 4.2.
4.1 DescriptionThe five main steps are outlined below. They are normally performed in the order introduced here, but with iteration over the earliest steps until a satisfactory result is reached.
4.1.1 FamiliarisationThis stage encompasses the initial discussions with the data provider, including domain experts and those already familiar with similar data. This will also include reading any literature or event reports relevant to the data. The aim of this stage is to improve general understanding and knowledge of the data and how it applies to the problem domain.
4.1.2 VisualisationVisualisation includes analysis of the data at a relatively high level. This stage involves attempting to identify any visual inconsistency or pattern in the data made apparent through the use of different techniques. These techniques can include trending, clustering or transformations (for example Fast Fourier transform (FFT)) on the data.
Dimensionality reduction is often performed at this stage, allowing high dimensional data to be displayed in two- or three- dimensional diagrams to allow patterns to be more easily identified visually. This process is also often used as a data reduction technique and may be a pre-processing stage for some algorithms, such as Independent Component Analysis (ICA)(15).
4.1.3 Data reduction and cleaningAfter familiarisation with the data and identifying patterns through visualisation, it may then be possible to reduce the amount of data being considered. This may include removing redundant or irrelevant data, especially in multivariate data where some readings may be strongly correlated or where variables are not related to the relevant outcome being considered. The aim of this stage is to remove data unnecessary to identifying the state or condition of the monitored asset.
Some examples of techniques used at this stage include ICA, to identify the independent components that make up a multivariate signal, or clustering, to identify state transitions in potentially high-dimensional data. After performing this stage, the preceding steps are repeated. This process continues until it is possible to move on to the succeeding stage.
2 Insight Vol 52 No 8 August 2010

Insight Vol 52 No 8 August 2010 3
4.1.4 Technique selectionAfter performing the preceding steps a sufficient number of times to identify features within the data and reducing the dimensionality of the data as much as possible, the possible techniques for anomaly detection or fault diagnosis must be considered. The exact methods considered depend on the data (real or complex, linear or non-linear), the application (anomaly detection, fault diagnosis, or both) and the requirements (accuracy, particular requirements such as a low number of false positives, a single outcome or a vector of possibilities, etc). There may be a number of possibilities, but a single technique will be selected and the process will proceed to implementation and testing.
4.1.5 Implementation and testingThe selected technique must be implemented, which would include the training stage for machine learning algorithms. The technique must then be tested on blind data to ensure that it is applicable to data beyond the data presented to it during training. If the technique proves unsatisfactory the process will revert to technique selection and so on until a satisfactory technique has been identified and verified through testing.
4.2 ApplicationThe following is a case study of the application of the data mining methodology in an effort to find an acceptable anomaly detection algorithm for the GTs in a CCGT plant. A step-by-step account of the development of the technique is given and an analysis of its performance during testing is provided.
4.2.1 FamiliarisationFor this case study, 10 months of data from a CCGT station’s gas turbine units, sampled at 1 minute intervals, was available. This data included 187 variables, covering all sensors within the turbine, including pressure, vibration and temperature. An event file was also made available, containing all shutdowns and trips, stating causes and reasons, and differentiating scheduled shutdowns from unplanned outages. Two major failures in GT2 occurred during this time: a combustor failure in month 6 and a compressor blade failure during month 10.
4.2.2 Visualisation and data reductionBefore beginning any analysis it was first necessary to reduce the number of variables under consideration, from the 187 (per turbine) provided, to a more manageable subset. Two groups of variables with potential to show precursors related to compressor blade failure were identified: exhaust temperature and vibration. This was due to compressor failure often being caused by compressor surge, and both are known to show precursors. Exhaust temperature related variables were first identified and a set of eight were selected for further analysis.Table 1. Exhaust gas variable set
Gas Fuel Flow Kg/s
Compressor Pressure Ratio Ratio
Absolute compressor discharge pressure Bar
Combustion Reference Temperature °C
Combustion Monitor Actual Spread 1 °C
Combustion Monitor Actual Spread 2 °C
Combustion Monitor Actual Spread 3 °C
Ex Temp Median Corrected by Average °C
4.2.3 Technique selectionA number of techniques were initially tried before a successful approach prevailed. These included clustering (K-Means(16) and DBScan(17)), independent component analysis and self-organising
maps. Ultimately, none of these techniques provided a clear sign of an anomaly around the time of the compressor blade failure in month 10 and were discounted as viable approaches for this case study. After considering other approaches, and in light of previous successful use in the condition monitoring field(18), an artificial neural network was selected and successfully applied. The implementation of this technique is documented in the following sections.
5. Technique implementationWhile following the data mining methodology, an ANN was selected and implemented using GT data. The following section gives a description of the technology behind ANNs, before detailing the specific implementation and testing for the GT case study.
5.1 Artificialneuralnetworks(ANN)An artificial neural network(19) is a type of machine learning algorithm. ANNs are made up of several nodes that mimic the firing and interconnection of neurons in the brain. Each link between nodes has a weight applied to it and by adjusting this the output of the node will change. The interconnections between nodes and the subsequent manipulation of the weights of the nodes allow the network to ‘learn’. All ANNs have two modes: training, where the network learns the relationships between inputs and output; and testing, where the network estimates the output for a set of given inputs.
The type of ANN used in this paper is called a multi-layer perceptron(20). This is a feed-forward ANN consisting of multiple layers. The use of a feed-forward network simplifies the training process as it is known that data can only travel one way between nodes. Layers will typically consist of an input layer, one or more hidden layers and an output layer. The hidden layer is so called because the inputs and outputs of these nodes are hidden from the outside.
Testing, and how it is carried out, is an important part in using MLPs. It is desirable to divide data into training and testing sub-sets. This is to ensure that the network has not simply learned the specific cases presented in the training set, but rather has learned the underlying relationship. Where it has learned the relationship and tests well on the new data, it is said to have generalised well. When the network shows good results on the training data but not on new data outside this set, it is known as overfitting(20).
5.2 ImplementationIt was attempted to use a feed-forward ANN to learn the relationships between exhaust temperature variables under normal operating behaviour, with the aim that a breakdown of the relationship could be identified before a failure. The exhaust temperature median (corrected by average) was used as the classifier. The individual residual for each time step was directly output, rather than a correlation coefficient or other metric of similarity (mean square error etc). This was as a result of requests by the utility, which requested residuals so that results could be directly compared with other methods they have used.
Several training sets were tried, all of them using the exhaust gas variables in Table 1. Initially, only full load data was used but resulted in residual spikes whenever a turbine was shut down, even for scheduled shut downs. While this may still be useful, it would be desirable to limit alarms to only abnormal events during shutdown or start-up. To this end, normal start-up and shutdown data was added to the training set. This removed several of the residual spikes around scheduled shutdowns and successful start-ups.
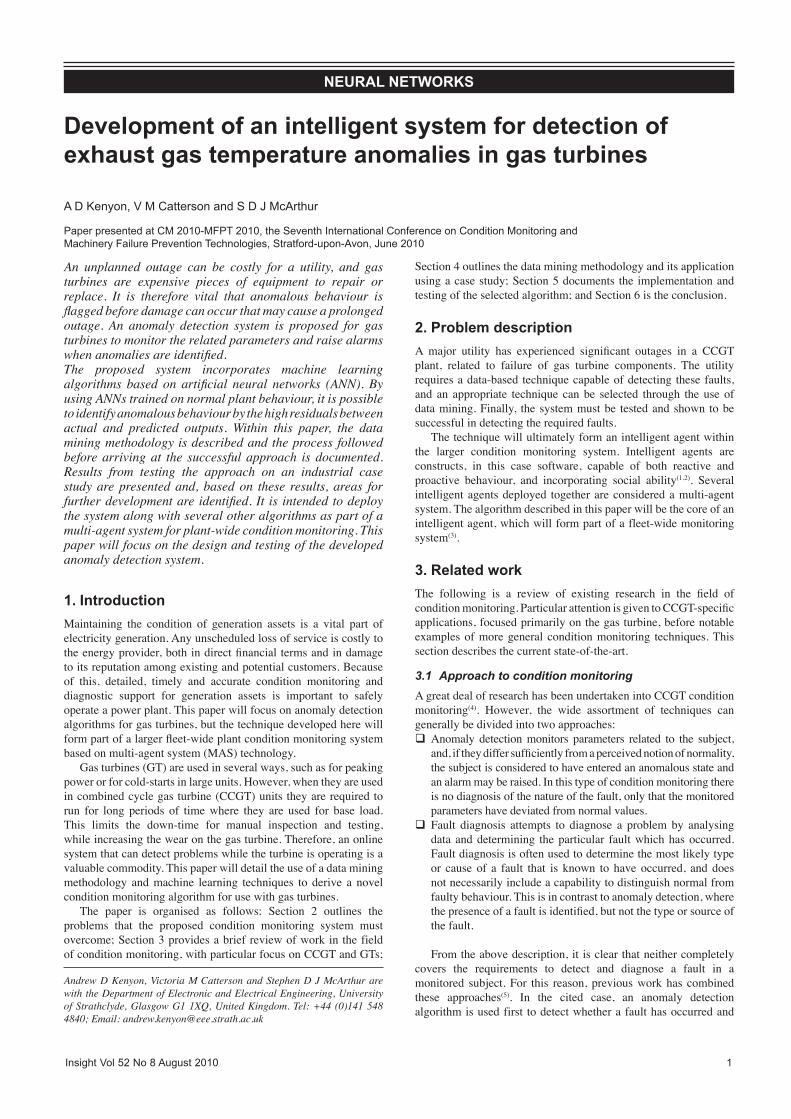
Further work was undertaken to improve the performance of the technique using addition values from previous time steps. Figure 1 shows a scheduled shutdown, to which residuals should be as low as possible. The load is overlaid in purple to better illustrate the
behaviour of the system output. The t-1 and t-2 residuals are lower, suggesting better accuracy. Greater delays were experimented with, but increased the training time while not improving accuracy proportionally. For this reason, a t-1 level delay was considered the best compromise and is implemented in subsequent test cases.
The technique could be used to raise alarms, based on the residual exceeding a certain threshold. Typical values of normal operation residuals are usually single figure or less, while the largest spikes can be in excess of 100. This represents a good dynamic range, which should make it easy to identify when to raise an alarm. Based on the results from testing carried out on the entire 10-month period for GT1, a threshold of 10 is suggested.
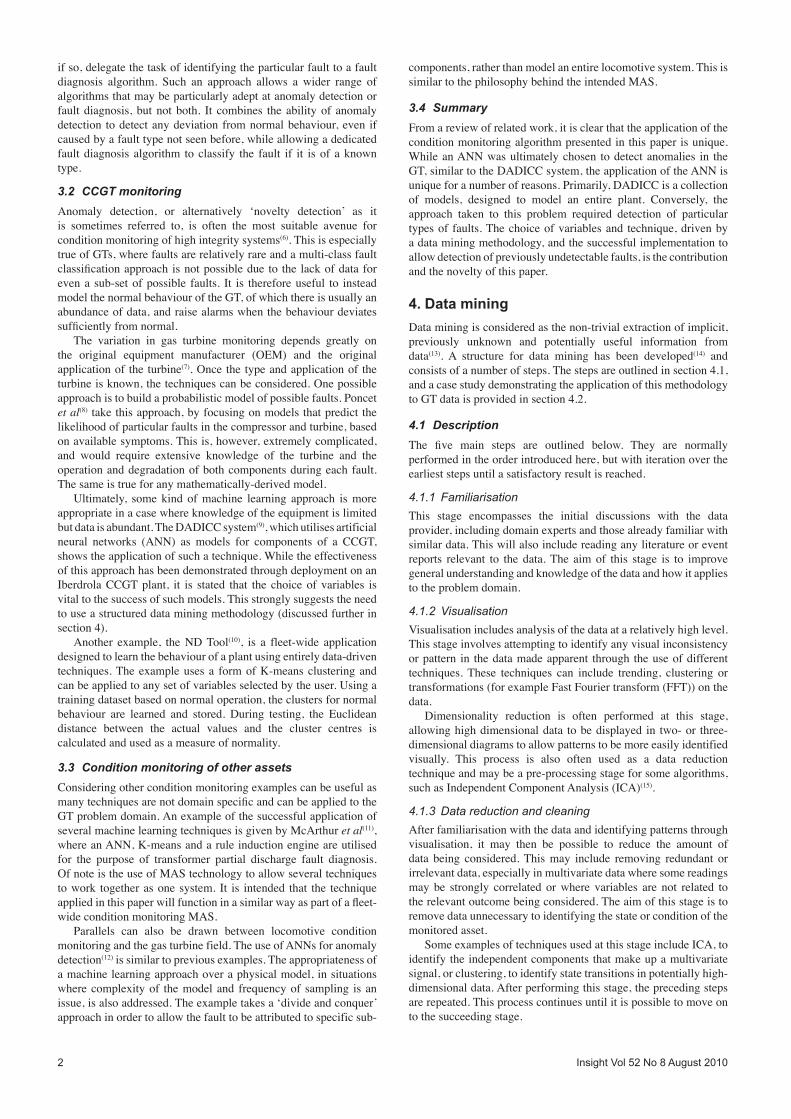
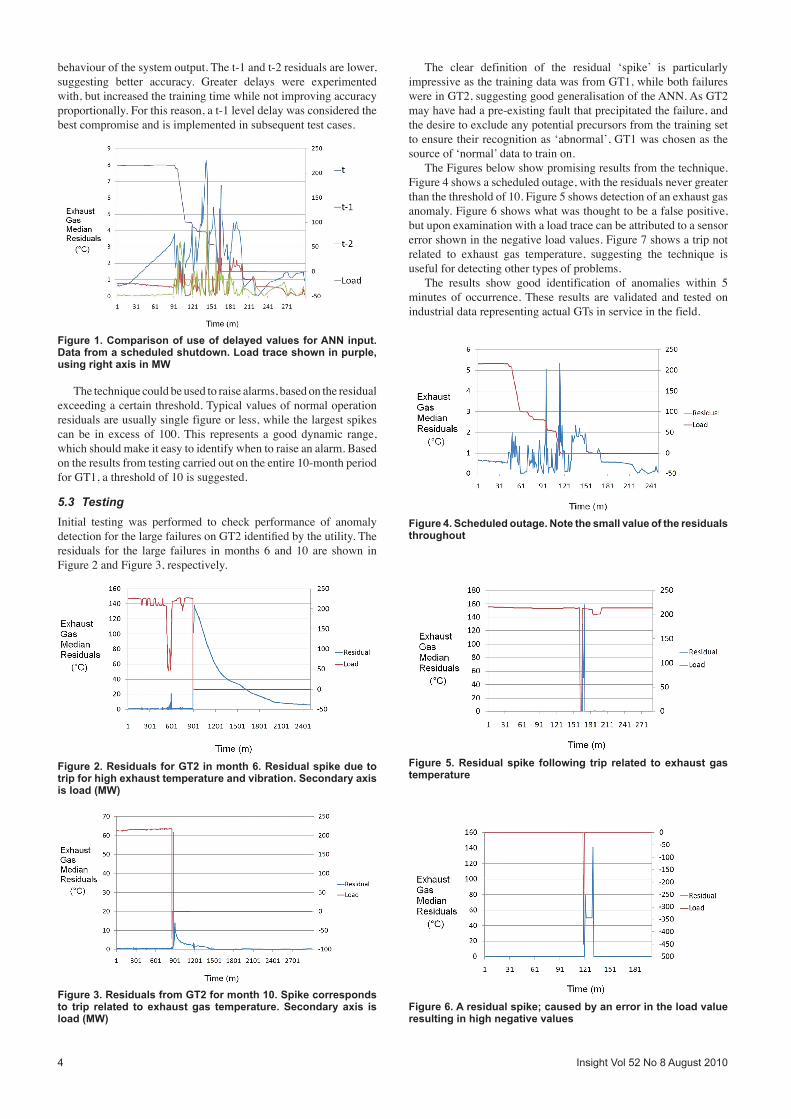
5.3 TestingInitial testing was performed to check performance of anomaly detection for the large failures on GT2 identified by the utility. The residuals for the large failures in months 6 and 10 are shown in Figure 2 and Figure 3, respectively.
The clear definition of the residual ‘spike’ is particularly impressive as the training data was from GT1, while both failures were in GT2, suggesting good generalisation of the ANN. As GT2 may have had a pre-existing fault that precipitated the failure, and the desire to exclude any potential precursors from the training set to ensure their recognition as ‘abnormal’, GT1 was chosen as the source of ‘normal’ data to train on.
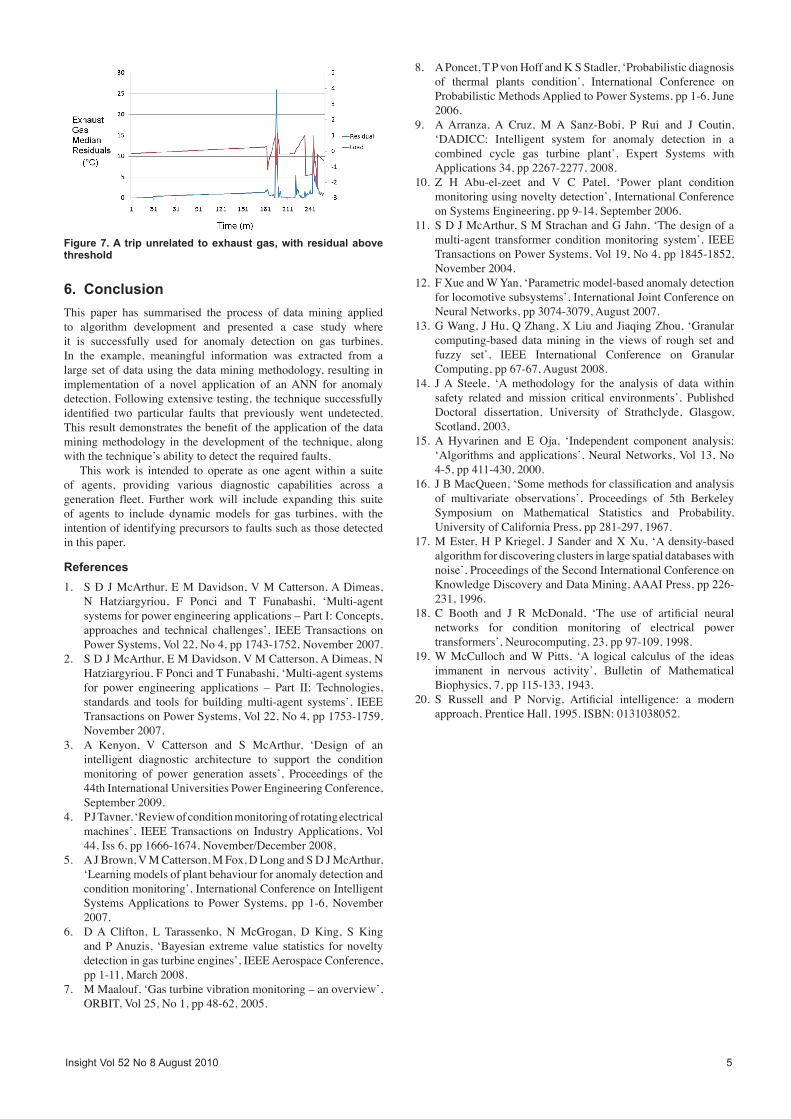
The Figures below show promising results from the technique. Figure 4 shows a scheduled outage, with the residuals never greater than the threshold of 10. Figure 5 shows detection of an exhaust gas anomaly. Figure 6 shows what was thought to be a false positive, but upon examination with a load trace can be attributed to a sensor error shown in the negative load values. Figure 7 shows a trip not related to exhaust gas temperature, suggesting the technique is useful for detecting other types of problems.
The results show good identification of anomalies within 5 minutes of occurrence. These results are validated and tested on industrial data representing actual GTs in service in the field.
Figure 1. Comparison of use of delayed values for ANN input. Data from a scheduled shutdown. Load trace shown in purple, using right axis in MW
Figure 2. Residuals for GT2 in month 6. Residual spike due to trip for high exhaust temperature and vibration. Secondary axis is load (MW)
Figure 3. Residuals from GT2 for month 10. Spike corresponds to trip related to exhaust gas temperature. Secondary axis is load (MW)
Figure 4. Scheduled outage. Note the small value of the residuals throughout
Figure 5. Residual spike following trip related to exhaust gas temperature
Figure 6. A residual spike; caused by an error in the load value resulting in high negative values
4 Insight Vol 52 No 8 August 2010
Insight Vol 52 No 8 August 2010 5
6. ConclusionThis paper has summarised the process of data mining applied to algorithm development and presented a case study where it is successfully used for anomaly detection on gas turbines. In the example, meaningful information was extracted from a large set of data using the data mining methodology, resulting in implementation of a novel application of an ANN for anomaly detection. Following extensive testing, the technique successfully identified two particular faults that previously went undetected. This result demonstrates the benefit of the application of the data mining methodology in the development of the technique, along with the technique’s ability to detect the required faults.
This work is intended to operate as one agent within a suite of agents, providing various diagnostic capabilities across a generation fleet. Further work will include expanding this suite of agents to include dynamic models for gas turbines, with the intention of identifying precursors to faults such as those detected in this paper.
References1. S D J McArthur, E M Davidson, V M Catterson, A Dimeas,
N Hatziargyriou, F Ponci and T Funabashi, ‘Multi-agent systems for power engineering applications – Part I: Concepts, approaches and technical challenges’, IEEE Transactions on Power Systems, Vol 22, No 4, pp 1743-1752, November 2007.
2. S D J McArthur, E M Davidson, V M Catterson, A Dimeas, N Hatziargyriou, F Ponci and T Funabashi, ‘Multi-agent systems for power engineering applications – Part II: Technologies, standards and tools for building multi-agent systems’, IEEE Transactions on Power Systems, Vol 22, No 4, pp 1753-1759, November 2007.
3. A Kenyon, V Catterson and S McArthur, ‘Design of an intelligent diagnostic architecture to support the condition monitoring of power generation assets’, Proceedings of the 44th International Universities Power Engineering Conference, September 2009.
4. P J Tavner, ‘Review of condition monitoring of rotating electrical machines’, IEEE Transactions on Industry Applications, Vol 44, Iss 6, pp 1666-1674, November/December 2008,
5. A J Brown, V M Catterson, M Fox, D Long and S D J McArthur, ‘Learning models of plant behaviour for anomaly detection and condition monitoring’, International Conference on Intelligent Systems Applications to Power Systems, pp 1-6, November 2007.
6. D A Clifton, L Tarassenko, N McGrogan, D King, S King and P Anuzis, ‘Bayesian extreme value statistics for novelty detection in gas turbine engines’, IEEE Aerospace Conference, pp 1-11, March 2008.
7. M Maalouf, ‘Gas turbine vibration monitoring – an overview’, ORBIT, Vol 25, No 1, pp 48-62, 2005.
8. A Poncet, T P von Hoff and K S Stadler, ‘Probabilistic diagnosis of thermal plants condition’, International Conference on Probabilistic Methods Applied to Power Systems, pp 1-6, June 2006.
9. A Arranza, A Cruz, M A Sanz-Bobi, P Rui and J Coutin, ‘DADICC: Intelligent system for anomaly detection in a combined cycle gas turbine plant’, Expert Systems with Applications 34, pp 2267-2277, 2008.
10. Z H Abu-el-zeet and V C Patel, ‘Power plant condition monitoring using novelty detection’, International Conference on Systems Engineering, pp 9-14, September 2006.
11. S D J McArthur, S M Strachan and G Jahn, ‘The design of a multi-agent transformer condition monitoring system’, IEEE Transactions on Power Systems, Vol 19, No 4, pp 1845-1852, November 2004.
12. F Xue and W Yan, ‘Parametric model-based anomaly detection for locomotive subsystems’, International Joint Conference on Neural Networks, pp 3074-3079, August 2007.
13. G Wang, J Hu, Q Zhang, X Liu and Jiaqing Zhou, ‘Granular computing-based data mining in the views of rough set and fuzzy set’, IEEE International Conference on Granular Computing, pp 67-67, August 2008.
14. J A Steele, ‘A methodology for the analysis of data within safety related and mission critical environments’, Published Doctoral dissertation, University of Strathclyde, Glasgow, Scotland, 2003.
15. A Hyvarinen and E Oja, ‘Independent component analysis: ‘Algorithms and applications’, Neural Networks, Vol 13, No 4-5, pp 411-430, 2000.
16. J B MacQueen, ‘Some methods for classification and analysis of multivariate observations’, Proceedings of 5th Berkeley Symposium on Mathematical Statistics and Probability, University of California Press, pp 281-297, 1967.
17. M Ester, H P Kriegel, J Sander and X Xu, ‘A density-based algorithm for discovering clusters in large spatial databases with noise’, Proceedings of the Second International Conference on Knowledge Discovery and Data Mining, AAAI Press, pp 226-231, 1996.
18. C Booth and J R McDonald, ‘The use of artificial neural networks for condition monitoring of electrical power transformers’, Neurocomputing, 23, pp 97-109, 1998.
19. W McCulloch and W Pitts, ‘A logical calculus of the ideas immanent in nervous activity’, Bulletin of Mathematical Biophysics, 7, pp 115-133, 1943.
20. S Russell and P Norvig, Artificial intelligence: a modern approach, Prentice Hall, 1995. ISBN: 0131038052.
Figure 7. A trip unrelated to exhaust gas, with residual above threshold