Kenya’s Financial Transformation in the 21st...
52
Kenya’s Financial Transformation in the 21st Century Edited by Amrik Heyer and Michael King
Transcript of Kenya’s Financial Transformation in the 21st...

Kenya’s Financial Transformation
in the 21st Century
Edited by Amrik Heyer and Michael King
Kenya’s Financial Transformation in the 21st C
entury

Kenya’s Financial Transformation in the
21st Century
EDITED BY AMRIK HEYER AND MICHAEL KING
FSD Kenya
5th floor, KMA CentreCorner Chyulu/Mara RoadUpper HillP.O. Box 11353-00100NairobiKenya
Tel: +254 20 292 3000Email: [email protected]: www.fsdkenya.org
ISBN: 978-9966-093-91-2
Cover photograph by Gitau Mburu.
© FSD Kenya, 2015
CHAPTER 1
Transformation of Kenya’s Banking Sector, 2000–2012
RADHA UPADHYAYA AND SUSAN JOHNSON

Transformation of Kenya’s Banking Sector, 2000–2012 17
1 Introduction and motivation
The finance for growth literature emphasises the long-run positive relationship between finance and economic growth (Levine, 1997; Demirgüç-Kunt and Levine, 2001). However there is now an acceptance that this relationship has important ‘non-linear effects’ (Beck, 2013) and that ‘we cannot carry on assuming that more finance is better’ (Griffith-Jones, 2013). Furthermore, it has now been recognised that it is not only foreign banks, but also local banks, that are important drivers of credit growth, access to finance for the poor and innovation (Lin, 2009). It is within the context of these debates that this chapter discusses the evolution of the banking sector in Kenya.
The changes in the Kenyan banking sector since colonial times largely mirror the country’s political and economic transformation from a colony into an independent nation. The pre-independence period was characterised by a small banking sector with foreign-owned banks that predominantly extracted profits out of the colony. The post-independence era from 1963 to 2000 had three phases that reflect the growing pains of a newly independent nation. The first phase (‘Harambee’), from 1963 to 1980, saw the creation of government-owned banks. The next phase (‘Nyayo’) was characterised by a large increase in banks and non-banking financial institutions (NBFIs) including the creation of local banks, several of which had strong political connections.1 The next phase (‘Liberalisation’), from 1990 to 1999, saw an explosion in the growth of banks but was also characterised by instability, with a large number of bank failures. Therefore, while liberalisation had some positive effects including an increase in the levels of deposits, the overall results of liberalisation were largely disappointing both in terms of the depth and the stability of the financial sector. Furthermore, financial access was not a major consideration for commercial banks or the Central Bank of Kenya.
The next phase (‘Transformation’), from 2000 to 2012, is the focus of this chapter. One of the impetuses for this phase was changes in the regulatory environment in 2000. Among these key changes were an increase in minimum capital requirements, the reinforcement of single borrower limits and restricted lending to insiders.
Authors’ note: The authors would like to thank Mr. Ochieng Oloo of Think Business Ltd and Mr. Ashif Kassam of RSM Ashvir Ltd for sharing their datasets on the financial statements of banks in Kenya. The authors would also like to thank participants at the Kenyan Financial Transformation (2006–2014) workshop at FSD Kenya, Nairobi on 13–14 June 2014, and an anonymous referee for useful comments. The views expressed here remain the authors’ own.
1 Harambee and Nyayo were the terms used by the first and second presidents of Kenya, President Jomo Kenyatta and President Daniel Arap Moi, to capture the philosophy of their leadership.
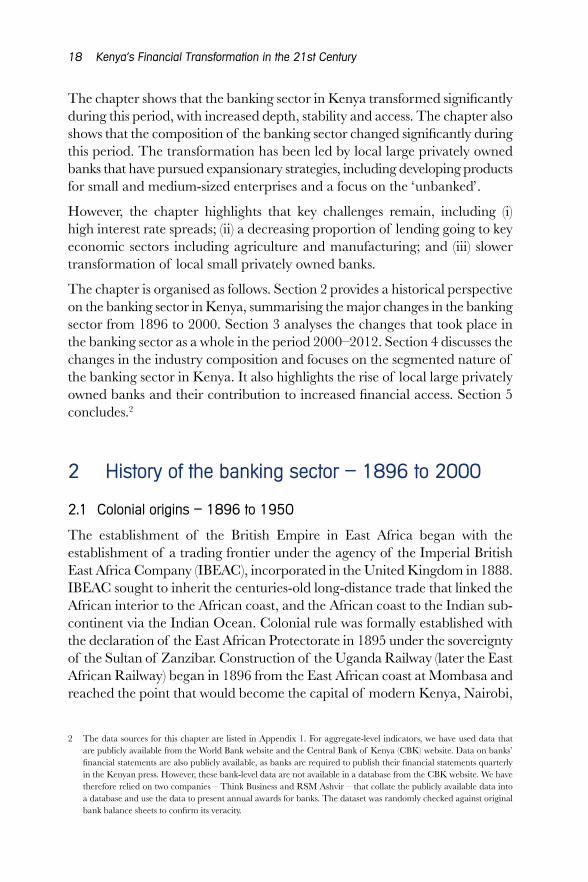
18 Kenya’s Financial Transformation in the 21st Century
The chapter shows that the banking sector in Kenya transformed significantly during this period, with increased depth, stability and access. The chapter also shows that the composition of the banking sector changed significantly during this period. The transformation has been led by local large privately owned banks that have pursued expansionary strategies, including developing products for small and medium-sized enterprises and a focus on the ‘unbanked’.
However, the chapter highlights that key challenges remain, including (i) high interest rate spreads; (ii) a decreasing proportion of lending going to key economic sectors including agriculture and manufacturing; and (iii) slower transformation of local small privately owned banks.
The chapter is organised as follows. Section 2 provides a historical perspective on the banking sector in Kenya, summarising the major changes in the banking sector from 1896 to 2000. Section 3 analyses the changes that took place in the banking sector as a whole in the period 2000–2012. Section 4 discusses the changes in the industry composition and focuses on the segmented nature of the banking sector in Kenya. It also highlights the rise of local large privately owned banks and their contribution to increased financial access. Section 5 concludes.2
2 History of the banking sector – 1896 to 2000
2.1 Colonial origins – 1896 to 1950
The establishment of the British Empire in East Africa began with the establishment of a trading frontier under the agency of the Imperial British East Africa Company (IBEAC), incorporated in the United Kingdom in 1888. IBEAC sought to inherit the centuries-old long-distance trade that linked the African interior to the African coast, and the African coast to the Indian sub-continent via the Indian Ocean. Colonial rule was formally established with the declaration of the East African Protectorate in 1895 under the sovereignty of the Sultan of Zanzibar. Construction of the Uganda Railway (later the East African Railway) began in 1896 from the East African coast at Mombasa and reached the point that would become the capital of modern Kenya, Nairobi,
2 The data sources for this chapter are listed in Appendix 1. For aggregate-level indicators, we have used data that are publicly available from the World Bank website and the Central Bank of Kenya (CBK) website. Data on banks’ financial statements are also publicly available, as banks are required to publish their financial statements quarterly in the Kenyan press. However, these bank-level data are not available in a database from the CBK website. We have therefore relied on two companies – Think Business and RSM Ashvir – that collate the publicly available data into a database and use the data to present annual awards for banks. The dataset was randomly checked against original bank balance sheets to confirm its veracity.
Transformation of Kenya’s Banking Sector, 2000–2012 19
in May 1898. In 1920, the nominal sovereignty of the Sultan of Zanzibar was confined to a ten-mile strip along the coast, which the British then rented from the Sultan. The country was renamed the Colony and Protectorate of Kenya (Hazlewood, 1979; Atieno-Odhiambo, 2000).
The origins of commercial banking in Kenya lie in these commercial connections between British East Africa and British India at the close of the 19th century. The first two British banks to be established were the National Bank of India in 1896 and the Standard Bank of South Africa in 1910. The former became National and Grindlays Bank and the latter became Standard Chartered Bank. The National Bank of South Africa was established in 1916 but was later merged with Colonial Bank and Anglo-Egyptian Bank to form Barclays Bank (Dominion, Colonial and Overseas) in 1926, which was also based in London.
The most important point to recognise is that while commercial banking became relatively well established in Kenya during the colonial period, the banks showed little interest in the indigenous African population. As branches of metropolitan banks, they were designed to settle accounts of the colonial economy and were therefore not interested in encouraging savings amongst Africans or financing African enterprise (Engberg, 1965; Mkandawire, 1999). It has been further argued that the banks did little to help even their main customer base – the white settler community that was dominated by farmers:
‘… these banks lent money to the farmers at [interest rates of] anything from 8 to 10 per cent. When crisis came [after the First World War] they operated their traditional policy and shut down on credit at the moment when it was most required. When European farmers were mortgaged to the hilt and the wages of Africans were at least halved, these banks remained woefully prosperous. Throughout the crisis the Standard Bank of South Africa did not declare a dividend of no less than 10 per cent… A good deal of property as well as money passed into their hands during these years. Organised to take money out of the colony, there is little evidence that the banks have proved adventurous in promoting industrial development in Kenya.’ Aaronovitch and Aaronovitch (1947, p. 177)3
Interestingly, the restriction of credit by the three banks led to pressure on the government to relieve the heavily indebted white farmers. The colonial government established the Land Bank in 1931 as a source of alternative credit. However, it has been observed that the private banks benefited more
3 Emphasis added.
20 Kenya’s Financial Transformation in the 21st Century
than farmers, as 39% of the funds of the Land Bank were used to discharge existing mortgages with private banks and therefore did not increase the total availability of credit (Aaronovitch and Aaronovitch, 1947).
2.2 Pre-independence growth – 1950 to 1963
It was not until the 1950s that other banks began to be established. These were mainly single branch banks, headquartered in Nairobi with a focus on trade finance (Engberg, 1965; Central Bank of Kenya, 1976).
There are other structural features that should be noted. First, there was no central bank fulfilling the function of lender of last resort. In its place was the East African Currency Board (EACB) with the limited function of maintaining a strict parity between the East African shilling and the British pound.4 Therefore, the supply of credit was fully determined by the commercial banks. Commercial bank advances consisted of their own resources and funds borrowed from parent banks. Funds moved freely from parent banks to their branches, as there were no capital account restrictions. Second, prudential regulation was very lenient with no statutory liquidity or cash requirement ratios (Central Bank of Kenya, 1976, 1986).5 Third, there was very little effort amongst the banks to compete for deposits. Interest rates on deposits and loans were determined by collective (cartel-type) bank arrangements decided by the three major banks and subscribed to by the other banks (Engberg, 1965).
Between 1950 and 1963, the levels of deposits, assets and loans held by commercial banks in East Africa (and therefore Kenya) grew substantially (see Table 1).
4 The establishment of the EACB in 1919 led to the introduction of the East African florin in 1920 and the East African shilling in 1922. Prior to that, the currency of use in East Africa was the Indian rupee, due to centuries-old trade connections between India and East Africa. However the fluctuations in the value of the rupee in relation to sterling during the First World War led to the establishment of the EACB (Central Bank of Kenya, 1976). The Board, operating through commercial banks, issued shillings at a fixed exchange rate of 20 East African shillings for every £1. The Board had all its assets in UK securities and all its currency issues had to be fully backed by foreign exchange (Hazlewood, 1979).
5 The first three banks to be established during the colonial period were regulated by the Banking Ordinance of 1910. This Act was repealed and replaced by the Banking Ordinance of 1956, which specified for the first time minimum capital requirements for banks and established a Registrar of Banks with power to license banks. The minimum capital was set at 2 million East African shillings (approximately US$0.28 million).

Transformation of Kenya’s Banking Sector, 2000–2012 21
Table 1: Monetisation, assets and deposits held by banks in East Africa, 1950–1963
YearTotal
deposits (£m)
Local earning assets (£m)
Local earning assets as % of total deposits
Loans and advances
(£m)
Loans and advances as % of
total deposits
1950 64 22 34% 17 27%
1960 87 78 90% 69 80%
1963 121 105 87% 93 77%
Note: It has not been possible to get a breakdown of these figures between the three East African countries (Kenya, Uganda and Tanzania).
Source: Engberg (1965).
It has been documented that the banks tended to be very conservative, applying credit standards set by their head offices that were not realistic in the extremely under-developed countries in which they were operating (Engberg, 1965). The unwillingness of banks to extend credit led to a situation in the 1950s where there was an export of capital from the under-developed periphery to the developed metropole (Maxon, 1992).
The second important point to note is that the safety of the deposits held by the branches of the main banks did not depend on the quality of assets of these banks in East Africa, but was linked to the capital and reserves of the parent banks overseas. Therefore, when large withdrawals of deposits took place in 1955, 1960 and 1963, the banks were able to use the inter-bank borrowing facilities of their London head office (Abdi, 1977). This point is crucial to keep in mind for our discussion below on segmentation – foreign banks had already established a reputation as ‘safe banks’ before independence.
On 30 June 1963, on the eve of independence, there were nine banks operating in Kenya.6 Table 2 lists these banks.
6 The financial sector also included three private NBFIs: Diamond Jubilee Investment Trust established in 1946; Credit Finance Corporation established in 1955; and National Industrial Credit established in 1959. In addition, there were two private housing finance companies: Savings and Loans established in 1949; and East African Building Society established in 1959 (Central Bank of Kenya, 1972, 1986). Though it has not been possible to find the exact figures for the asset bases of these financial companies at independence, it would be reasonable to assume that they were very small compared to the banks. These NBFIs were restricted from raising deposits and were also single branch institutions.
22 Kenya’s Financial Transformation in the 21st Century
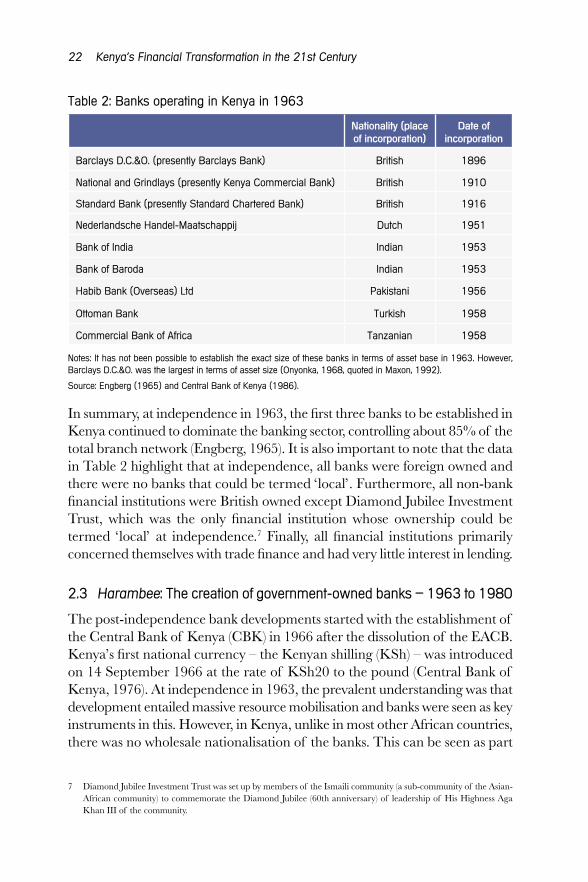
Table 2: Banks operating in Kenya in 1963
Nationality (place of incorporation)
Date of incorporation
Barclays D.C.&O. (presently Barclays Bank) British 1896
National and Grindlays (presently Kenya Commercial Bank) British 1910
Standard Bank (presently Standard Chartered Bank) British 1916
Nederlandsche Handel-Maatschappij Dutch 1951
Bank of India Indian 1953
Bank of Baroda Indian 1953
Habib Bank (Overseas) Ltd Pakistani 1956
Ottoman Bank Turkish 1958
Commercial Bank of Africa Tanzanian 1958
Notes: It has not been possible to establish the exact size of these banks in terms of asset base in 1963. However, Barclays D.C.&O. was the largest in terms of asset size (Onyonka, 1968, quoted in Maxon, 1992).
Source: Engberg (1965) and Central Bank of Kenya (1986).
In summary, at independence in 1963, the first three banks to be established in Kenya continued to dominate the banking sector, controlling about 85% of the total branch network (Engberg, 1965). It is also important to note that the data in Table 2 highlight that at independence, all banks were foreign owned and there were no banks that could be termed ‘local’. Furthermore, all non-bank financial institutions were British owned except Diamond Jubilee Investment Trust, which was the only financial institution whose ownership could be termed ‘local’ at independence.7 Finally, all financial institutions primarily concerned themselves with trade finance and had very little interest in lending.
2.3 Harambee: The creation of government-owned banks – 1963 to 1980
The post-independence bank developments started with the establishment of the Central Bank of Kenya (CBK) in 1966 after the dissolution of the EACB. Kenya’s first national currency – the Kenyan shilling (KSh) – was introduced on 14 September 1966 at the rate of KSh20 to the pound (Central Bank of Kenya, 1976). At independence in 1963, the prevalent understanding was that development entailed massive resource mobilisation and banks were seen as key instruments in this. However, in Kenya, unlike in most other African countries, there was no wholesale nationalisation of the banks. This can be seen as part
7 Diamond Jubilee Investment Trust was set up by members of the Ismaili community (a sub-community of the Asian-African community) to commemorate the Diamond Jubilee (60th anniversary) of leadership of His Highness Aga Khan III of the community.

Transformation of Kenya’s Banking Sector, 2000–2012 23
of the broader strategy by Kenyan leaders at independence to accommodate colonial interests and prevent a wholesale migration of foreign capital (Leys, 1975). At independence, the first president Jomo Kenyatta assured the white settler community:
‘The Government of independent Kenya will not be a gangster Government. Those who have been panicky…can now rest assured that the future African Government…will not deprive them of their property rights of ownership. We will encourage investors…to come to Kenya… to bring prosperity to this country.’ Quoted in Ndege (2000, p. 107) and Hazlewood (1979, p. 13).
Therefore international banks – now classified as foreign-owned banks – including Barclays D.C.&O. and Standard Bank continued to operate in Kenya.8 Only National and Grindlays Bank was bought out by the Government of Kenya (GoK) and became the Kenya Commercial Bank (KCB) (Central Bank of Kenya, 1986).9 In 1974, two US banks were established – the First National Bank of Chicago and the First National City Bank of New York (Nasibi, 1992).
In the 1960s, Kenya experienced impressive economic growth, mainly driven by the commercialisation of African smallholder agriculture. In the first decade of independence, GDP at constant prices grew at an annual rate of 7.1% (Hazlewood, 1979). The M2-to-GDP ratio increased from 19% in 1963 to 30% in 1970 (Central Bank of Kenya, 1986). However, the government was dissatisfied with the pace of adjustment, in particular with the very low loans-to-deposit ratio of 64.6% in 1969 (Republic of Kenya, 1968).10 It was argued that:
‘… the urgency of development is so great, that the need for specialized institutions for the collection of savings and investment cannot be left to the process of slow evolution.’ Republic of Kenya (1968, p. 558).
8 In the 1970s, Standard Bank became Standard Chartered Bank Ltd and Barclays Bank D.C.&O changed its name to Barclays Bank International Ltd, both becoming wholly owned subsidiaries of the parent banks in London (Central Bank of Kenya, 1976).
9 This was part of the resource mobilisation and ‘Africanisation’ strategy of the government discussed below. The purchase of National and Grindlays Bank was on a willing seller, willing buyer basis. In 1968, the Ottoman Bank was taken over by National and Grindlays Bank. Then in 1970, an agreement was reached between National and Grindlays Bank and the government. The bank was split into an international bank in which the government took a 40% share, and the local branch system of the bank, renamed Kenya Commercial Bank, in which the government took a 60% share. The remaining shares were quoted on the London and Nairobi stock exchanges, respectively (Hazlewood, 1979).
10 The loans-to-deposit ratio in 1969 was even lower than the 1963 figure of 77%.
24 Kenya’s Financial Transformation in the 21st Century
There was an understanding that economic development entailed massive resource mobilisation, and that these resources could be raised through banks. There was also the political reality that needed to be addressed – the need for visible ownership in the Kenyan economy by African Kenyans – and the government’s stated policy of ‘Africanisation’ was also pursued through the financial system. The government also established two new banks – Co-operative Bank of Kenya and National Bank of Kenya – in 1968. Specialised credit institutions, or development finance institutions (DFIs) – including the Industrial & Commercial Development Corporation (ICDC), the Industrial Development Bank (IBD), the Development Finance Corporation of Kenya (DFCK) and the Agricultural Finance Corporation (AFC) – were set up to give loans to Kenyans and also to purchase shares in public corporations (Grosh, 1991). 11
There was also growth of local financial institutions, termed ‘indigenous’ banks. Between 1971 and 1980, one local private bank and nine local NBFIs were established (Kariuki, 1993). These financial institutions were mainly owned by African (Kikuyu) businessmen who had built up capital during the coffee boom of 1976–1979 due to their close links to President Kenyatta, who was also from the Kikuyu ethnic group (Throup, 1987). The commercial banks and NBFIs were largely free from regulatory controls, except the stipulation of lending and deposit interest rates (Brownbridge, 1998). There was a condition that banks should extend credit to agriculture amounting to 17% of their deposits, but this requirement was rarely enforced (Kariuki, 1993).
The M2-to-GDP ratio throughout the 1970s and 1980s remained at approximately 30%. There was some financial deepening, however, as the loans-to-deposits ratio grew from 64.6% in 1969 to 80% by 1980. The ratio of financial institutions’ (banks and NBFIs) assets to GDP grew from 28% in 1971 to 40% in 1980 (Ngugi, 2000).12
2.4 Nyayo: The rise of indigenous and political banks – 1980 to 1990
When President Kenyatta died in 1978, he was succeeded by President Moi, who was from the Kalenjin community. The watchword chosen by Moi for his presidency was Nyayo (meaning ‘footsteps’), emphasising continuity with the
11 ICDC was originally incorporated in 1954 as Industrial Development Corporate (IDC) to assist and encourage medium- and large-scale investment in the industrial sector. In 1973, IDB was set up as a subsidiary of ICDC. However, ICDC, DFCK and IDB had overlapping and duplicating roles (Grosh, 1991).
12 It should be noted that this ratio is different from the private credit-to-GDP ratio, as it includes public as well as private lending and also includes liquid assets which are not lent out.
Transformation of Kenya’s Banking Sector, 2000–2012 25
economic policies of the Kenyatta era by remaining committed to a capitalist economy with a focus on attracting foreign investment and maintaining policies of Africanisation of the economy (Maxon and Ndege, 1995).
The 1980s witnessed a large growth in the number of NBFIs from 20 in 1980 to 53 in 1990 (a rise of 165%). The number of banks also grew from 17 to 24 (a rise of 17%).13 The majority of these new financial institutions were owned by local entrepreneurs (Kariuki, 1993). These local banks fulfilled a very useful function, as they catered for mainly small and medium-sized enterprises, often from their own communities, that the foreign-owned and government-owned banks did not serve (Nasibi, 1992).
However the proliferation of local banks and NBFIs was also facilitated by several political and regulatory factors. First, regulatory barriers – including the minimum capital requirements and reserve ratios – were very low compared to banks (Brownbridge, 1998). In particular, the minimum capital requirements for NBFIs were extremely low even though they were allowed to take deposits.14 There was a regulatory ‘arbitrage’ between banks and NBFIs, and most banks (including foreign-owned and government-owned banks) started an NBFI as a subsidiary to take advantage of this regulatory loophole.15 Second, political interference subverted prudential criteria in the awarding of licenses, as Section 53 of the Banking Act gave the minister of finance authority to grant exemptions to the Act (Brownbridge, 1998).16 Third, many banks had prominent politicians on their boards and were able to use these connections to obtain public sector deposits very cheaply (Ndii, 1994; Brownbridge, 1998). Fourth, the CBK had very little capacity to supervise the growth of non-bank financial institutions (World Bank, 1989). As will be seen below, these factors sowed the seeds of weakness in the banking system from the very establishment of these NBFIs.
Furthermore, during the first decade of the Moi era, due to external and internal economic factors, Kenya experienced a severe reduction in GDP growth and macroeconomic imbalances, including declining terms of trade
13 See Table 3. It should be noted that it has been difficult to get data on the exact number of banks that opened and closed each year. In particular, it has been difficult to establish the exact number of banks in 1983 prior to large number of bank failures in 1984. Therefore, these trend figures do not capture the full details of the movements in the number of banks.
14 From 1963 to 1980, the minimum share capital for banks remained KSh2 million and the minimum share capital of NBFIs was KSh500,000 (Brownbridge, 1998). See Table 4 for a list of capital requirements of the Central Bank of Kenya from 1956 onwards.
15 This policy was reversed in 1993, as will be discussed below. 16 The Banking Act is Chapter 488 of the Laws of Kenya; the Central Bank of Kenya Act is Chapter 491 of the Laws
of Kenya (see www.centralbank.go.ke).

26 Kenya’s Financial Transformation in the 21st Century
and budget deficits, and was forced into undertaking structural adjustment policies recommended by the IMF and the World Bank (Ngugi, 2000).17
The banking system was repressed according to the McKinnon-Shaw hypothesis, as interest rates up to the early 1980s were low and negative in real terms (Mwega et al., 1990). It was acknowledged that:
‘it had been official policy in Kenya since independence to follow a ‘low interest rate policy’ in order to encourage investment and to protect the small borrower.’ Central Bank of Kenya (1986, p. 54)
The main structural adjustment policy relating to the financial sector was a gradual increase in interest rates, and real lending rates of banks increased from -2.5% in 1980 to 9% in 1990 (Brownbridge, 1998).
The rapid rise of financial institutions, very poor regulation, shifting political economy trends and also declining economic growth resulted in the failure of 12 banks between 1984 and 1989 (see Table 3). In December 1989, nine of these banks were taken over by the government to form the Consolidated Bank (Ngugi, 2000).18 A more detailed discussion on the reasons for bank failures, in particular the political economy shifts, is presented below. In 1989, there was a major amendment to the Banking Act and Central Bank of Kenya Act establishing stricter guidelines for the licensing of institutions and establishing single borrower limits (Nasibi, 1992). 19 In 1989, the Deposit Protection Fund Board was also established to compensate small depositors in case of bank failures. This institution also assumed responsibility for liquidating failed banks (Nasibi, 1992).
This section has shown that the banking sector in Kenya immediately prior to full-scale liberalisation in the 1990s was fragile. Despite the increase in the number of financial institutions to 94 in 1990, the M2-to-GDP ratio and the loans-to-deposits ratio of banks remained constant throughout the 1980s at about 30% and 80% respectively. Furthermore, the ratio of total financial
17 The main external factor was the oil price shocks of 1973 and 1979 and the key internal factor was the drought of 1979 and 1984 (Ngugi and Kabubo, 1998). From an average rate of 7.1% (mentioned above), GDP growth fell to 3.9% in 1980 and then to a low of 0.8% in 1984, but grew again to 5% by 1989.
18 These are Union Bank, Jimba Credit Corporation, Estate Finance, Estate Building Society, Business Finance, Nationwide Finance, Kenya Savings and Mortgages, Home Savings and Mortgages, and Citizens Building Society (Nasibi, 1992; Brownbridge, 1998).
19 The Central Bank of Kenya Act was only tinkered with from 1969 to 1984. In 1985, it was overhauled. The key amendments were that first, applications for the license of banks had to go through the CBK and not directly to the Minister of Finance; second, minimum capital requirements were increased to KSh15 million; and third, single borrower limits were set at 100% of share capital (Central Bank of Kenya, 1986). See Table 4 for a list of changes to capital requirements through the years.
Transformation of Kenya’s Banking Sector, 2000–2012 27
institutions’ assets to GDP rose only marginally from 40% in 1980 to 41.6% in 1989 (Central Bank of Kenya, 1986; Ngugi, 2000).20
2.5 Liberalisation – 1990 to 1999
Following the structural adjustment programmes of the 1980s, which were focused on debt and budget reform and only contained minor financial sector reforms, Kenya embarked on full-scale financial liberalisation in the 1990s. Unlike other African countries, the official reports of the Kenyan government lauded the success of the structural adjustment programmes of the 1980s (Nasibi, 1992).21 Liberalisation of the financial sector was financed by the World Bank’s Financial Sector Adjustment Credit (FSAC), which was approved by the Board of the World Bank in June 1989. The theoretical basis of financial liberalisation was the McKinnon-Shaw hypothesis, in which government control of interest rates was seen as a key constraint to financial sector development.22
The key step of full-scale financial liberalisation was the complete deregulation of interest rates in 1991 (Brownbridge, 1998). In 1992, commercial banks were authorised to deal in foreign exchange, and in 1993 a market-determined flexible exchange rate system was adopted for the Kenyan shilling (Brownbridge, 1998). While liberalisation was taking place, big political changes were also taking place and in 1992, Kenya had its first multi-party elections. President Moi was returned to power due to an extremely fractured opposition. However, funding the elections left the public finances in disarray. In particular, government borrowing jumped and this is reflected in the Treasury bill rates. In March 1993, the 91-day Treasury bill rate was 25%. This jumped to 46% in April
20 Ngugi (2000) argues that this is because the M2/GDP figure does not take into account assets and liabilities of NBFIs. She shows that NBFI assets as a percentage of GDP grew from 12.1% in 1980 to 22% in 1984, but dropped again to 14.5% in 1989, while bank assets as a percentage of GDP were constant at around 28% throughout the decade. However, she does not give a figure of the loan-to-deposit ratio of NBFIs. It is estimated that the M3-to-GNP ratio increased from 38% in 1973 to 45% in 1985 (Mwega et al., 1990).
21 It should be noted that in Kenya, the clamour for liberalisation was not only external. Leaders of the private sector, including several chairmen of the Kenya Association of Manufacturers (the principal manufacturing and trade lobby group), were calling for a deregulation of interest rates and commodity prices (Nasibi, 1992). Though it should also be noted that there were differences in positions between export-oriented manufacturers, such as textile manufacturers, who opposed the liberalisation and import-oriented manufacturers who lobbied for the liberalisation.
22 The references to the McKinnon-Shaw hypothesis are explicit. The objectives of financial liberalisation were stated as:
‘to encourage mobilisation of savings and contribute to the maintenance of financial stability...and to ensure that funds flow into those areas which are most productive, and that the biases which have existed against lending to small business are eliminated.’ Central Bank of Kenya (1988, p. 18), quoted in Kariuki (1995, p. 6).

28 Kenya’s Financial Transformation in the 21st Century
1993, peaked at 85% in July 1993, and then dropped steadily but remained still very high at 44% in December 1993.23
This liberalisation of interest rates and exchange rates provided further avenues for local banks to compete with more established banks, and was an added stimulus for local bank entry (Brownbridge, 1998; Ndung’u and Ngugi, 1999). While the 1980s witnessed the rise of African (mainly Kikuyu) banks, the late 1980s and 1990s witnessed the rise of several African (Kalenjin) and Asian-African banks.24 By the mid-1990s, it is estimated that local banks controlled about a quarter of the market (Brownbridge, 1998).25 Table 3 shows the growth in the total number of financial institutions from 1990 to 1993. The total number of banks grew by 67% and the total number of NBFIs by 13%.
Table 3: Number of financial institutions in Kenya, 1963–2000
1963 1975 1980 1990 1993 1994 1997 1998 2000
Banks 9 14 17 24 40 37 53 53 49
NBFIs 3 8 20 53 60 44 19 15 5
Building Societies
2 2 2 17 11 6 6 4 4
Total 14 22 39 94 111 87 78 72 58
Source: Engberg (1965); Brownbridge (1998); Central Bank of Kenya (2000a, 2003, 2005).
However, as will be shown below, the experience with liberalisation in terms of financial deepening was very unsatisfactory.
After 1994, there was a decline in the total number of institutions. This was partly due to the failure of 15 financial institutions in 1993. Furthermore, in 1993 the Central Bank of Kenya adopted a universal banking policy and reduced the regulatory advantages that were available to NBFIs. This led to several NBFIs converting to banks or merging with their parent bank, and to a consolidation of the banking sector (Ngugi, 2000). However, towards the end of the 1990s, the banking sector still remained fairly fragile and six more banks were put under CBK statutory management towards the end of 1998.
23 Data for Kenyan GDP growth rates, inflation rates, exchanges rates and T-bill rates from 1990–2005 are displayed in Appendix 7.
24 The Asian-African community is a new label of identity used by people of Indian origin who settled in Kenya (Asian-African Heritage Trust, 2000). This community is often also referred to as Kenyan-Asians, East African-Asians or South Asian-Kenyans.
25 It has not been possible to get disaggregated data at the segment level on banks’ assets for the periods before 2000.
Transformation of Kenya’s Banking Sector, 2000–2012 29
3 Banking sector industry trends, 2000–2012
The banking sector as a whole changed significantly during this period, facilitated by regulatory changes, the rise of large locally owned private banks and increased competition.
3.1 Regulatory changes
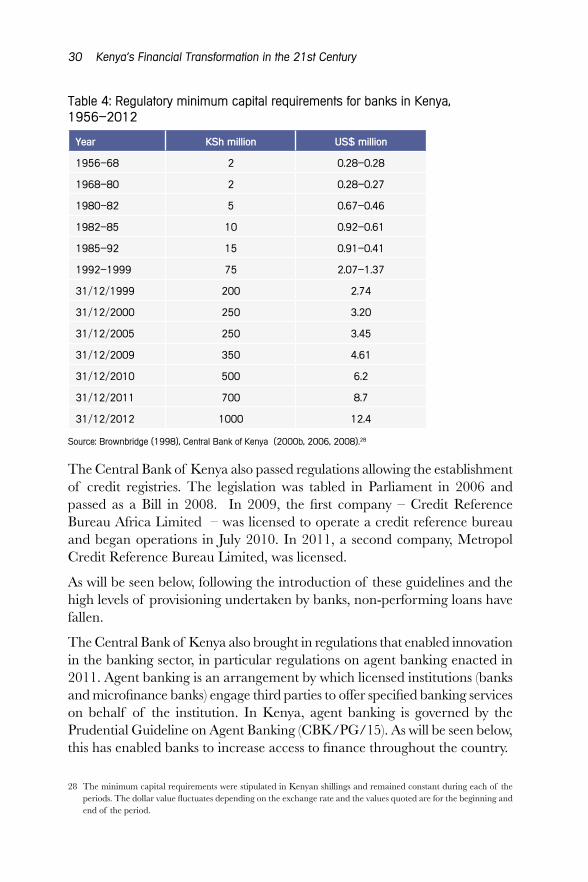
Throughout the late 1990s and up to 2000, the CBK Act and the Banking Act were amended to improve regulation and supervision of banks.26 In October 1995, key amendments included the harmonisation of banks’ accounting financial years, the approval of bank auditors by the CBK and the reduction of the single borrower limit to core capital ratio from 100% to 25% (Central Bank of Kenya, 1995, 1996).27 In 1997, the responsibilities for appointing the governor and the management of the CBK were transferred to a board of directors appointed by the president, rather than directly by the minister of finance, in order to reduce political interference in the Bank (Central Bank of Kenya, 1997). In response to another spate of bank failures in 1998, several changes were brought into force in 1999. Detailed guidelines on provisioning for non-performing loans were set out and a requirement was established for banks to publish their accounts, including details on their non-performing loans, in the national press (Central Bank of Kenya, 1999). Minimum capital was increased to KSh200 million by December 1999. In October 2000, minimum capital requirements were increased to Ksh250 million. Table 4 summarises the changes in the minimum capital requirements for banks in Kenya from 1956 onwards.
Also in October 2000, guidelines were issued requiring banks to conform to the Basel Capital Accord in terms of the composition of capital, and also new regulatory capital ratios were specified. The October 2000 guidelines also reinforced the single borrower limits to 25% of core capital, restricted lending to insiders to 20% of core capital, defined a large exposure as 10% of core capital, and further restricted lending to all large borrowers to five times the core capital (Central Bank of Kenya, 2000b).
26 President Moi did not contest the December 2002 elections and in 2003, President Mwai Kibai became the third president of Kenya as head of NARC (the National Rainbow Coalition), a coalition of parties of which the two largest were the NAK (National Alliance Party of Kenya) and LDP (Liberal Democratic Party of Kenya).
27 The single borrower limit is aimed at reducing exposure to one borrower. The previous limit of 100% meant that a single non-performing loan to one borrower could wipe out the entire capital of a bank.
30 Kenya’s Financial Transformation in the 21st Century
Table 4: Regulatory minimum capital requirements for banks in Kenya, 1956–2012
Year KSh million US$ million
1956–68 2 0.28–0.28
1968–80 2 0.28–0.27
1980–82 5 0.67–0.46
1982–85 10 0.92–0.61
1985–92 15 0.91–0.41
1992–1999 75 2.07–1.37
31/12/1999 200 2.74
31/12/2000 250 3.20
31/12/2005 250 3.45
31/12/2009 350 4.61
31/12/2010 500 6.2
31/12/2011 700 8.7
31/12/2012 1000 12.4
Source: Brownbridge (1998), Central Bank of Kenya (2000b, 2006, 2008).28
The Central Bank of Kenya also passed regulations allowing the establishment of credit registries. The legislation was tabled in Parliament in 2006 and passed as a Bill in 2008. In 2009, the first company – Credit Reference Bureau Africa Limited – was licensed to operate a credit reference bureau and began operations in July 2010. In 2011, a second company, Metropol Credit Reference Bureau Limited, was licensed.
As will be seen below, following the introduction of these guidelines and the high levels of provisioning undertaken by banks, non-performing loans have fallen.
The Central Bank of Kenya also brought in regulations that enabled innovation in the banking sector, in particular regulations on agent banking enacted in 2011. Agent banking is an arrangement by which licensed institutions (banks and microfinance banks) engage third parties to offer specified banking services on behalf of the institution. In Kenya, agent banking is governed by the Prudential Guideline on Agent Banking (CBK/PG/15). As will be seen below, this has enabled banks to increase access to finance throughout the country.
28 The minimum capital requirements were stipulated in Kenyan shillings and remained constant during each of the periods. The dollar value fluctuates depending on the exchange rate and the values quoted are for the beginning and end of the period.

Transformation of Kenya’s Banking Sector, 2000–2012 31
In the rest of this section, we discuss general trends in the financial sector in Kenya, focusing on depth, efficiency, stability and access.
3.2 Changes in financial sector depth
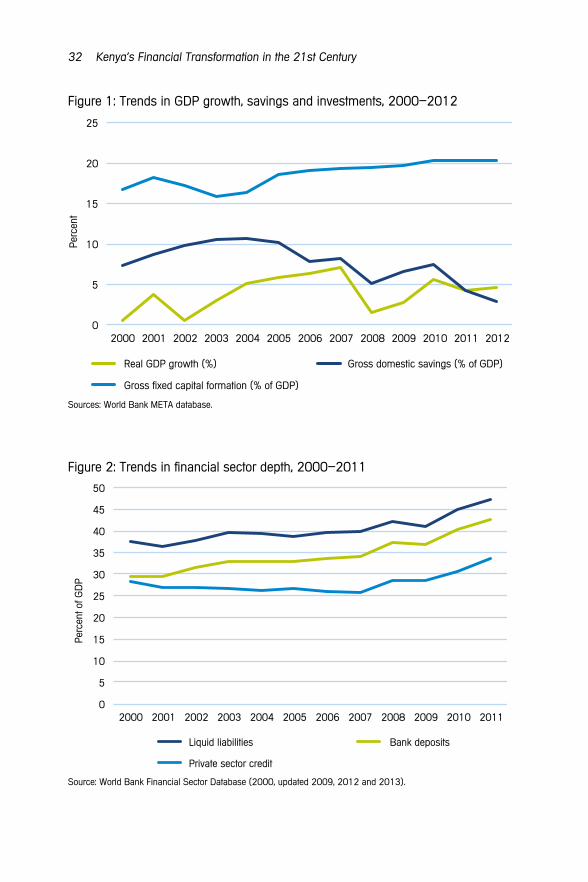
Kenya has experienced steady increases in GDP growth, with the exceptions of 2002 and 2008 when there was very low growth linked to election-related political instability (see Figure 1). Kenya has also experienced some increases in investment, with gross fixed capital formation as a percentage of GDP increasing from 16.71% in 2000 to 20.39% in 2012, with a dip between 2002 and 2004.
The key area for concern is the savings rate. The ratio of domestic savings to GDP increased from 7.28% in 2000 to 10.2% in 2005, but has fallen steadily since to 2.9% in 2012. As we will see below, the financial sector has steadily deepened since 2000, but this growth is not translating into an increase in gross savings. It should be noted that a key argument of the McKinnon-Shaw theories that formed the basis of financial liberalisation was that a freely determined market rate of interest would increase deposits and, in turn, savings (McKinnon, 1973; Shaw, 1973). However, the experience of most countries post liberalisation has been similar to that of Kenya – financial liberalisation and an increase in financial depth have not led to an increase in savings – and it has been recognised that the causal nexus between finance and savings still has to be clarified (Mavrotas, 2005).29 This raises a key concern, as Kenya’s Vision 2030 goals entail a significant increase in domestic savings to 30% by 2030 with an explicit view that this increase in savings will be propelled by the financial sector (Republic of Kenya, 2007).
Kenya has also experienced growth in all three main indicators of financial deepening (Figure 2). The liquid liabilities-to-GDP ratio steadily increased from 37.5% in 2000 to 47.4% in 2011. Similarly, the deposits-to-GDP ratio also increased from 29.5% in 2000 to 42.5% in 2011. The private credit-to-GDP ratio has not exhibited a similar increase. It hovered around 27% but experienced some growth from 2008, rising to 33.6% in 2011. Overall it can be argued that the country has made good strides in terms of increasing financial depth.
29 The causal nexus between savings and growth has also been questioned, with some economists suggesting that the causation may run in the opposite direction – from growth to savings; see Mavrotas (2005) for a summary of the debates.
32 Kenya’s Financial Transformation in the 21st Century
Figure 1: Trends in GDP growth, savings and investments, 2000–2012
0
5
10
15
20
25
2000 2001 2002 2003 2004 2005 2006 2007 2008 2009 2010 2011 2012
Real GDP growth (%) Gross domestic savings (% of GDP)
Gross fixed capital formation (% of GDP)
Perc
ent
Sources: World Bank META database.
Figure 2: Trends in financial sector depth, 2000–2011
0
5
10
15
20
25
30
35
40
45
50
2000 2001 2002 2003 2004 2005 2006 2007 2008 2009 2010 2011
Perc
ent o
f GD
P
Liquid liabilities Bank deposits
Private sector credit
Source: World Bank Financial Sector Database (2000, updated 2009, 2012 and 2013).

Transformation of Kenya’s Banking Sector, 2000–2012 33
3.3 Efficiency, profitability and concentration
A key measure of market structure and competition is the concentration of the banking sector. During the period 2000–2012, the share of the top three banks in Kenya in terms of total assets fell from 64.4% in 2000 to about 40% in 2012 (see Figure 3). Overall, this implies that competition has increased in the banking sector. The concentration ratios in Kenya are also low compared to global standards (see Table 5).
It should be noted that several authors have attributed the poor performance of the Kenyan banking system and African banking systems in general in the 1990s – in particular the high interest rate spreads – to their high concentration ratios and oligopolistic nature (Ncube and Senbet, 1997; Kamau et al., 2004). As the discussion below shows, despite the increase in competition, interest rate spreads in Kenya still remain high.
Figure 3: Banking concentration, 2000–2012
0
10
20
30
40
50
60
70
2000 2001 2002 2003 2004 2005 2006 2007 2008 2009 2010 2011 2012
Concentration ratios (assets of top three banks as % of total)
Perc
ent
Source: World Bank Financial Sector Database (2000, updated 2009, 2012 and 2013).
Table 5: Global data on mean bank concentration ratios
2000 2005 2010
SSA 84.0 77.2 72.8
Upper-middle 64.4 64.1 61.1
High income 64.9 64.0 63.6
Kenya 64.4 51.6 42.9
Source: Authors’ calculations from the World Bank Financial Sector Database (2000, updated 2009, 2012 and 2013).
34 Kenya’s Financial Transformation in the 21st Century
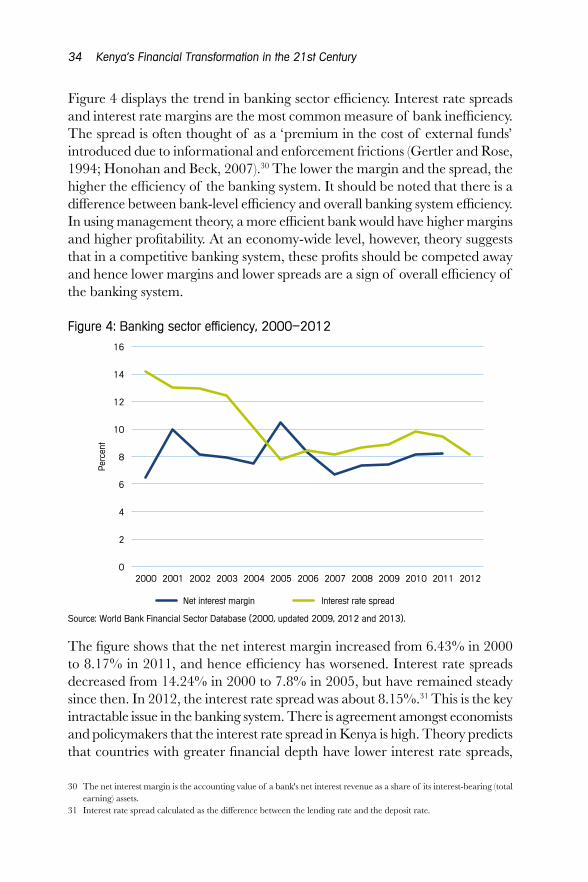
Figure 4 displays the trend in banking sector efficiency. Interest rate spreads and interest rate margins are the most common measure of bank inefficiency. The spread is often thought of as a ‘premium in the cost of external funds’ introduced due to informational and enforcement frictions (Gertler and Rose, 1994; Honohan and Beck, 2007).30 The lower the margin and the spread, the higher the efficiency of the banking system. It should be noted that there is a difference between bank-level efficiency and overall banking system efficiency. In using management theory, a more efficient bank would have higher margins and higher profitability. At an economy-wide level, however, theory suggests that in a competitive banking system, these profits should be competed away and hence lower margins and lower spreads are a sign of overall efficiency of the banking system.
Figure 4: Banking sector efficiency, 2000–2012
0
2
4
6
8
10
12
14
16
2000 2001 2002 2003 2004 2005 2006 2007 2008 2009 2010 2011 2012
Net interest margin Interest rate spread
Perc
ent
Source: World Bank Financial Sector Database (2000, updated 2009, 2012 and 2013).
The figure shows that the net interest margin increased from 6.43% in 2000 to 8.17% in 2011, and hence efficiency has worsened. Interest rate spreads decreased from 14.24% in 2000 to 7.8% in 2005, but have remained steady since then. In 2012, the interest rate spread was about 8.15%.31 This is the key intractable issue in the banking system. There is agreement amongst economists and policymakers that the interest rate spread in Kenya is high. Theory predicts that countries with greater financial depth have lower interest rate spreads,
30 The net interest margin is the accounting value of a bank's net interest revenue as a share of its interest-bearing (total earning) assets.
31 Interest rate spread calculated as the difference between the lending rate and the deposit rate.

Transformation of Kenya’s Banking Sector, 2000–2012 35
yet Kenya has achieved an increase in depth with a relatively minor decrease in spreads (World Bank, 2013). However, two recent papers have highlighted that the determinants of interest rate spreads in Kenya are still debated. While some authors argue that the unstable macro environment, including exchange rate volatility, contributes to the high spread (World Bank, 2013), others have argued that macroeconomic factors such as economic growth and inflation are not useful in explaining high spreads (Were and Wambua, 2013). Both studies emphasise the role of internal factors such as overhead costs and high profitability, and both indicate that the larger banks in Kenya enjoy a higher spread. We will discuss later in this chapter the segmented nature of the banking system in Kenya, as this partly explains why despite the increasing depth of the banking sector and reduced concentration, interest rate spreads still remain high.
The profitability of the banking sector (as measured by return on assets and return on equity) has been steadily increasing (except for dips in 2002 and 2008). Figure 5 shows that return on assets (ROA) increased from 0.8% in 2000 to 3.5% in 2011, and return on equity (ROE) increased from 14.2% in 2000 to 23.09% in 2011. Again, this shows that despite the reduction in concentration and the increase in competition, sustained interest rate margins and spreads have meant that banks are able to maintain high profit margins.
Figure 5: Banking sector profitability, 2000–2011
0
5
10
15
20
25
30
0.0
0.5
1.0
1.5
2.0
2.5
3.0
3.5
4.0
4.5
2000 2001 2002 2003 2004 2005 2006 2007 2008 2009 2010 2011
Return on equity (percent) Ret
urn
on a
sset
s (p
erce
nt)
Return on assets Return on equity
Source: World Bank Financial Sector Database (2000, updated 2009 and 2012 and 2013).
36 Kenya’s Financial Transformation in the 21st Century
3.4 Banking sector stability
Banking sector stability is measured by looking at three factors: capitalisation, liquidity and absence of non-performing loans.
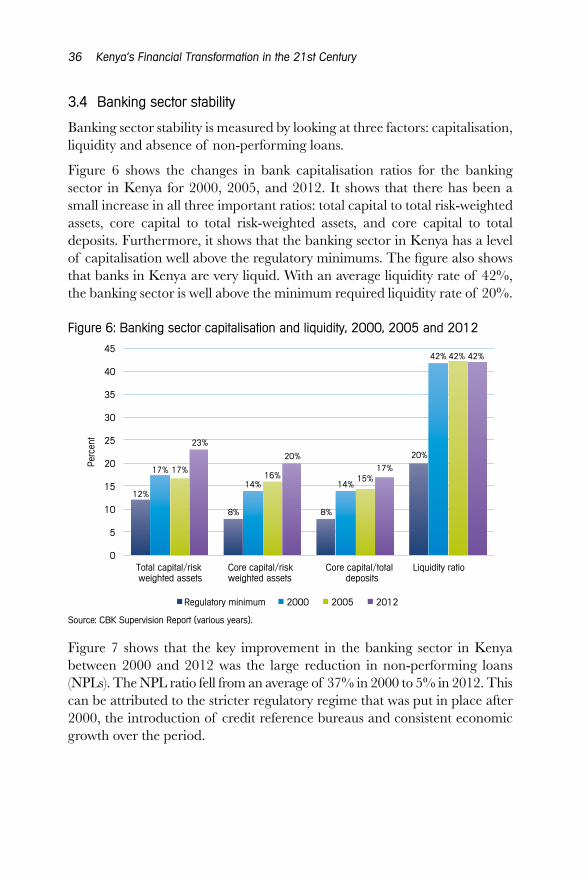
Figure 6 shows the changes in bank capitalisation ratios for the banking sector in Kenya for 2000, 2005, and 2012. It shows that there has been a small increase in all three important ratios: total capital to total risk-weighted assets, core capital to total risk-weighted assets, and core capital to total deposits. Furthermore, it shows that the banking sector in Kenya has a level of capitalisation well above the regulatory minimums. The figure also shows that banks in Kenya are very liquid. With an average liquidity rate of 42%, the banking sector is well above the minimum required liquidity rate of 20%.
Figure 6: Banking sector capitalisation and liquidity, 2000, 2005 and 2012
12%
8% 8%
20%
17%
14% 14%
42%
17% 16% 15%
42%
23%
20% 17%
42%
0
5
10
15
20
25
30
35
40
45
Total capital/risk weighted assets
Core capital/risk weighted assets
Core capital/total deposits
Liquidity ratio
Regulatory minimum 2000 2005 2012
Perc
ent
Source: CBK Supervision Report (various years).
Figure 7 shows that the key improvement in the banking sector in Kenya between 2000 and 2012 was the large reduction in non-performing loans (NPLs). The NPL ratio fell from an average of 37% in 2000 to 5% in 2012. This can be attributed to the stricter regulatory regime that was put in place after 2000, the introduction of credit reference bureaus and consistent economic growth over the period.

Transformation of Kenya’s Banking Sector, 2000–2012 37
Figure 7: Non-performing loans, 2000–2012
0
5
10
15
20
25
30
35
40
2000 2001 2002 2003 2004 2005 2006 2007 2008 2009 2010 2011 2012
Total non-performing loans/total loans
Perc
ent
Source: CBK Supervision Report (various years).
Another study, which carried out stress tests on the Kenyan banking sector using data from 2007 and 2008, suggests that the banking sector is resilient to shocks such as an increase in bad debt provisions by 50% and a reduction in performing loans by 50%. However, the extreme shock of an increase in provisions by 100% would lead to 17 banks failing to meet the minimum capital standards (Beck et al., 2010).32 Furthermore, as the global financial crisis of 2008 showed, high liquidity in a banking system can be an illusion that can quickly dry up if all banks become illiquid at the same time (Davidson, 2008; Nesvetailova, 2010). While this may not be a concern for the moment, it may become more important as the Kenyan banking system becomes more integrated with the regional and global banking systems.
3.5 Access to finance
The most significant impact of the transformation of the banking sector has been on outreach and access. While Kenya’s increase in financial inclusion is often told in terms of the mobile money revolution, the increase in commercial bank outreach has been just as important.
The latest FinAccess survey showed that the proportion of the adult population using different forms of formal financial services stood at 66.7% in 2013 compared to 41.3% in 2009 and 27.4% in 2006. Similarly, the proportion of
32 Data used to stress test the banking system are not in the public domain and therefore we cannot repeat these tests.

38 Kenya’s Financial Transformation in the 21st Century
the adult population totally excluded from financial services declined to 25.4% in 2013 from 31.4% in 2009 and 39.3% in 2006 (CBK and FSD Kenya, 2013). Table 6 shows that bank access increased by 64% between 2006 and 2013.
Table 6: Financial service use (percentage of adult population currently using)
Financial service
FinAccess 2006
(n=4,418)
FinAccess 2009
(n=6,343)
FinAccess 2013
(n=5,849)
Banks 17.8 21.5 29.2
SACCO 13.1 9.0 11.0
MFI 1.7 3.4 3.5
MMT registered -- 27.9 61.6
Government 1.1 0.3 1.0
ROSCA 29.3 31.7 21.4
ASCA 5.7 8.0 8.8
Local shop 22.8 24.3 5.6
Informal moneylender 0.7 0.4 0.4
Employer loan 0.9 0.5 0
Buyer loan 0.9 1.2 1.1
Family or friend (saving or loan) 17.5 17.5 11.0
Source: FinAccess Reports 2006, 2009 and 2013.
On the supply side, the increase in outreach can be assessed by looking at the availability of access points and the uptake of accounts. For access points, two common measures are bank branches and ATMs, while for accounts the key measure is the number of deposit accounts. In the period for which data are available (from 2004 to 2012), there was a marked increase in bank branches and ATMs both in terms of numbers and geographic coverage (see Figure 8 and Figure 9).
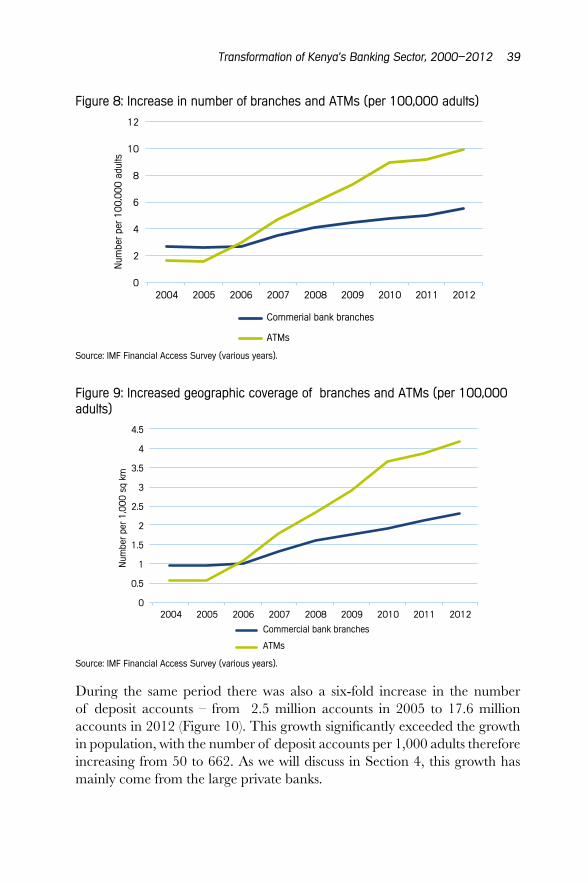
Transformation of Kenya’s Banking Sector, 2000–2012 39
Figure 8: Increase in number of branches and ATMs (per 100,000 adults)
0
2
4
6
8
10
12
2004 2005 2006 2007 2008 2009 2010 2011 2012
Num
ber
per
100,
000
adul
ts
Commerial bank branches
ATMs
Source: IMF Financial Access Survey (various years).
Figure 9: Increased geographic coverage of branches and ATMs (per 100,000 adults)
0
0.5
1
1.5
2
2.5
3
3.5
4
4.5
2004 2005 2006 2007 2008 2009 2010 2011 2012
Num
ber
per
1,00
0 sq
km
Commercial bank branches
ATMs
Source: IMF Financial Access Survey (various years).
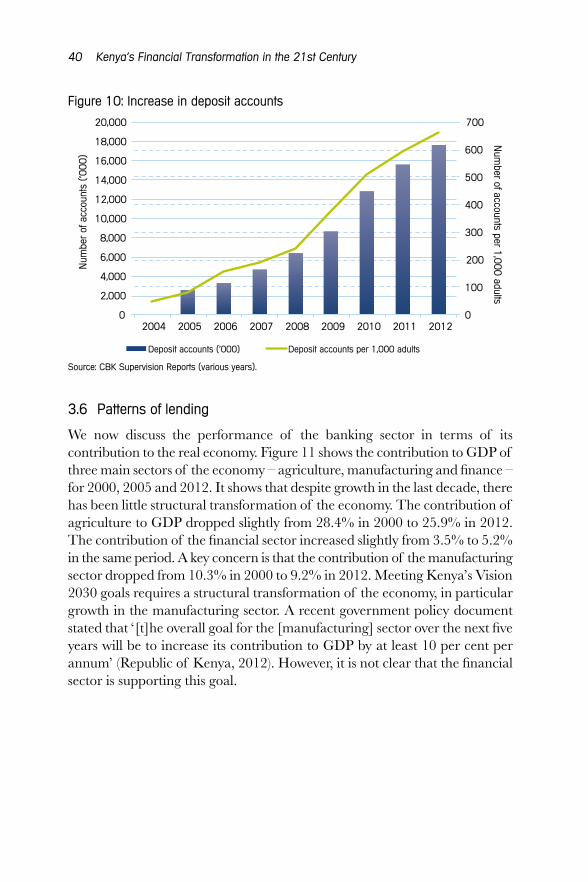
During the same period there was also a six-fold increase in the number of deposit accounts – from 2.5 million accounts in 2005 to 17.6 million accounts in 2012 (Figure 10). This growth significantly exceeded the growth in population, with the number of deposit accounts per 1,000 adults therefore increasing from 50 to 662. As we will discuss in Section 4, this growth has mainly come from the large private banks.
40 Kenya’s Financial Transformation in the 21st Century
Figure 10: Increase in deposit accounts
0
100
200
300
400
500
600
700
0
2,000
4,000
6,000
8,000
10,000
12,000
14,000
16,000
18,000
20,000
2004 2005 2006 2007 2008 2009 2010 2011 2012
Num
ber
of a
ccou
nts
(’000
)
Deposit accounts ('000) Deposit accounts per 1,000 adults
Num
ber of accounts per 1,000 adults
Source: CBK Supervision Reports (various years).
3.6 Patterns of lending
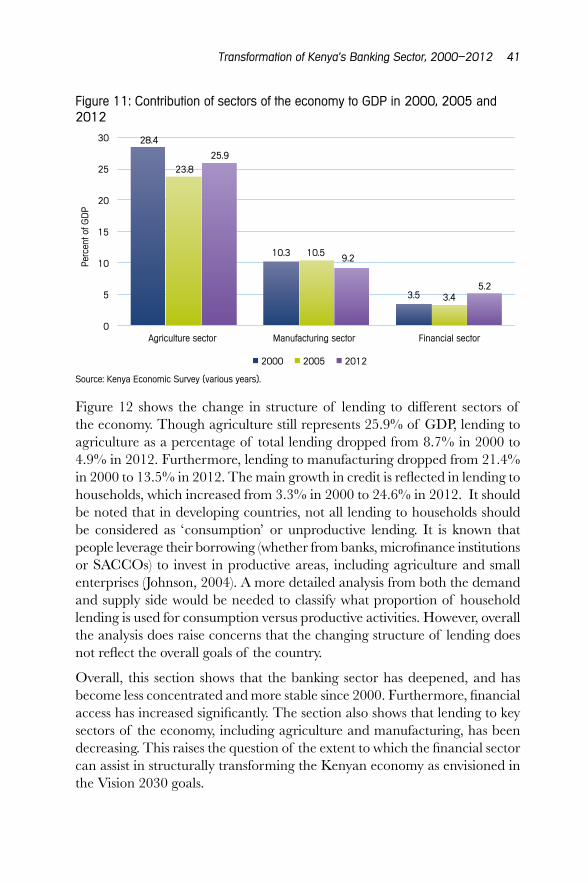
We now discuss the performance of the banking sector in terms of its contribution to the real economy. Figure 11 shows the contribution to GDP of three main sectors of the economy – agriculture, manufacturing and finance – for 2000, 2005 and 2012. It shows that despite growth in the last decade, there has been little structural transformation of the economy. The contribution of agriculture to GDP dropped slightly from 28.4% in 2000 to 25.9% in 2012. The contribution of the financial sector increased slightly from 3.5% to 5.2% in the same period. A key concern is that the contribution of the manufacturing sector dropped from 10.3% in 2000 to 9.2% in 2012. Meeting Kenya’s Vision 2030 goals requires a structural transformation of the economy, in particular growth in the manufacturing sector. A recent government policy document stated that ‘[t]he overall goal for the [manufacturing] sector over the next five years will be to increase its contribution to GDP by at least 10 per cent per annum’ (Republic of Kenya, 2012). However, it is not clear that the financial sector is supporting this goal.
Transformation of Kenya’s Banking Sector, 2000–2012 41
Figure 11: Contribution of sectors of the economy to GDP in 2000, 2005 and 2012
28.4
10.3
3.5
23.8
10.5
3.4
25.9
9.2
5.2
0
5
10
15
20
25
30
Agriculture sector Manufacturing sector Financial sector
2000 2005 2012
Perc
ent o
f GD
P
Source: Kenya Economic Survey (various years).
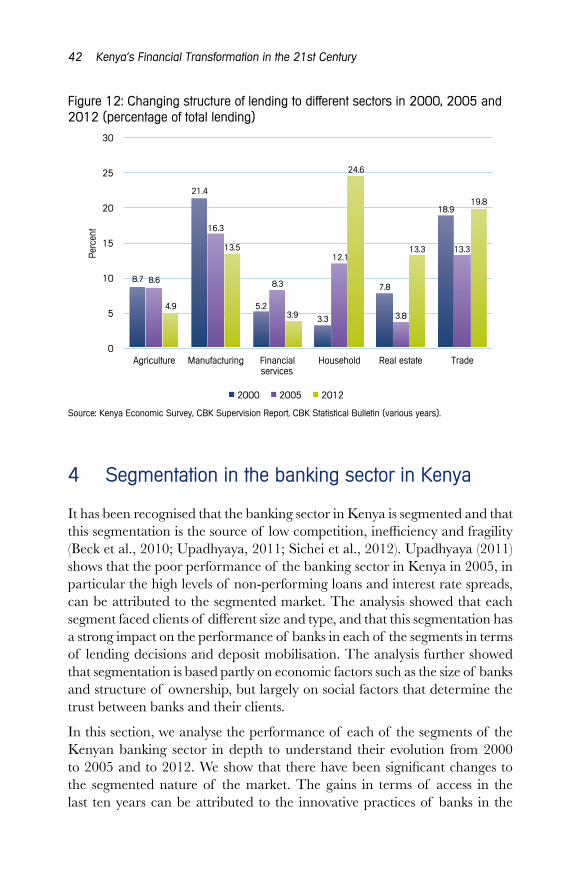
Figure 12 shows the change in structure of lending to different sectors of the economy. Though agriculture still represents 25.9% of GDP, lending to agriculture as a percentage of total lending dropped from 8.7% in 2000 to 4.9% in 2012. Furthermore, lending to manufacturing dropped from 21.4% in 2000 to 13.5% in 2012. The main growth in credit is reflected in lending to households, which increased from 3.3% in 2000 to 24.6% in 2012. It should be noted that in developing countries, not all lending to households should be considered as ‘consumption’ or unproductive lending. It is known that people leverage their borrowing (whether from banks, microfinance institutions or SACCOs) to invest in productive areas, including agriculture and small enterprises (Johnson, 2004). A more detailed analysis from both the demand and supply side would be needed to classify what proportion of household lending is used for consumption versus productive activities. However, overall the analysis does raise concerns that the changing structure of lending does not reflect the overall goals of the country.
Overall, this section shows that the banking sector has deepened, and has become less concentrated and more stable since 2000. Furthermore, financial access has increased significantly. The section also shows that lending to key sectors of the economy, including agriculture and manufacturing, has been decreasing. This raises the question of the extent to which the financial sector can assist in structurally transforming the Kenyan economy as envisioned in the Vision 2030 goals.
42 Kenya’s Financial Transformation in the 21st Century
Figure 12: Changing structure of lending to different sectors in 2000, 2005 and 2012 (percentage of total lending)
8.7
21.4
5.2
3.3
7.8
18.9
8.6
16.3
8.3
12.1
3.8
13.3
4.9
13.5
3.9
24.6
13.3
19.8
0
5
10
15
20
25
30
Agriculture Manufacturing Financial services
Household Real estate Trade
Perc
ent
2000 2005 2012
Source: Kenya Economic Survey, CBK Supervision Report, CBK Statistical Bulletin (various years).
4 Segmentation in the banking sector in Kenya
It has been recognised that the banking sector in Kenya is segmented and that this segmentation is the source of low competition, inefficiency and fragility (Beck et al., 2010; Upadhyaya, 2011; Sichei et al., 2012). Upadhyaya (2011) shows that the poor performance of the banking sector in Kenya in 2005, in particular the high levels of non-performing loans and interest rate spreads, can be attributed to the segmented market. The analysis showed that each segment faced clients of different size and type, and that this segmentation has a strong impact on the performance of banks in each of the segments in terms of lending decisions and deposit mobilisation. The analysis further showed that segmentation is based partly on economic factors such as the size of banks and structure of ownership, but largely on social factors that determine the trust between banks and their clients.
In this section, we analyse the performance of each of the segments of the Kenyan banking sector in depth to understand their evolution from 2000 to 2005 and to 2012. We show that there have been significant changes to the segmented nature of the market. The gains in terms of access in the last ten years can be attributed to the innovative practices of banks in the

Transformation of Kenya’s Banking Sector, 2000–2012 43
large privately owned banks segment. However, segmentation has not been completely eroded, and this partly explains structural features such as the persistent interest rate spread.
We use the same definition for segments used in Upadhyaya (2011) – foreign-owned banks (FOBs), government-owned banks (GOBs), large private locally owned banks (LPOBs), and small and medium private locally owned banks (SPOBs). 33 Foreign- and government-owned banks are classified as such if foreign or government shareholding is more than 50%.34 Privately owned banks are classified as LPOBs or SPOBs based on an economic measure – the asset size of the bank. Banks with total assets of KSh50 billion (approximately US$580 million) or more are classified as LPOBs.35 This definition is based on the convention used by bankers in Kenya. The definition recognises that banks are segmented along both ownership and size lines. Furthermore, both size and ownership affect the perceived reputation of banks in the market, which affects their ability to raise deposits.36 Key data points used are 2000, 2005 and 2012. The year 2000 is used as a starting point as data at the bank level are not available before then; 2012 is used as the end point as 2013 data were not available at the time the analysis of this chapter was initiated; and 2005 is a key middle point as significant transformation of the banking sector took place after this date, with Equity Bank converting from a building society in 2004.
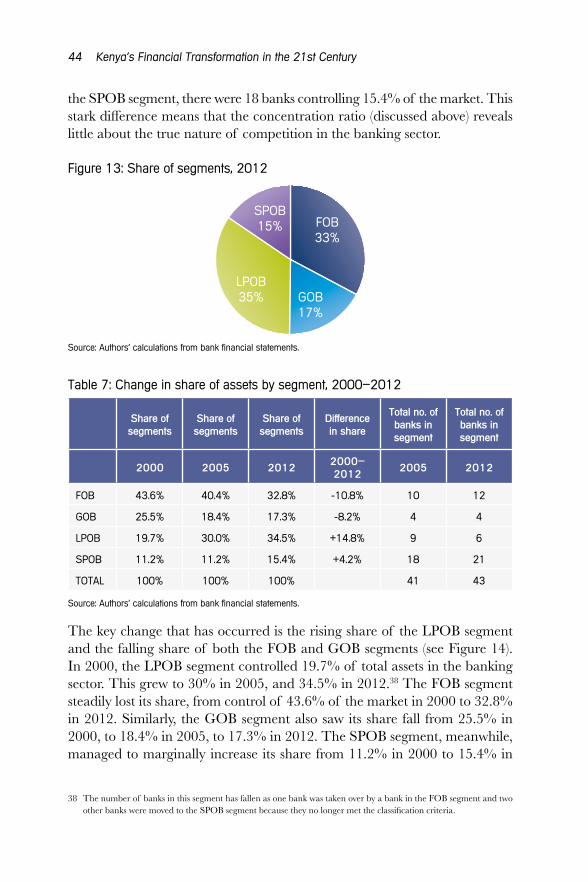
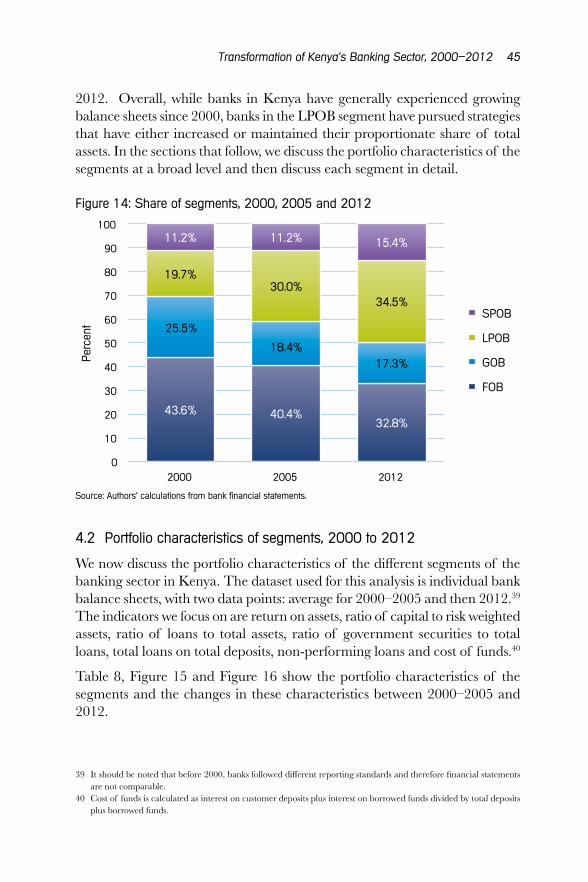
4.1 Share of segments, 2000 to 2012
Figure 13 and Table 7 show the shares of the segments in 2012 and the change in shares in terms of total assets between 2000 and 2012. The figures highlight the stark contrast in terms of market share and number of banks in the different segments. In 2012, there were 12 banks controlling 32.8% of FOB market share. Even within the FOB segment there are differences, with the four main banks – Barclays Bank, Standard Chartered Bank, Citibank and CFC Stanbic – controlling 25% of the total market.37 In the LPOB segment in 2012, there were six banks controlling 34.5% of the market and in the GOB segment, there were four banks controlling 17.3% of the market. However, in
33 A list of banks in each segment is given in Appendix 2. 34 In the case of Kenya Commercial Bank (KCB), government ownership is not more than 50% but the government
has a controlling interest through other shareholders, including the National Social Security Fund (NSSF). 35 This is based on the mean exchange rate as at 31 December 2013 of KSh86.03 to US$1. 36 The Central Bank of Kenya does not use ownership as a category but size. Large banks are those that control more
than 5% of total assets; medium banks are those that control between 1% and 5% of the market; and small banks are those that control less than 1% of the market. Beck et al. (2010) do carry out analysis by ownership, though defined slightly differently from this chapter. They use four categories: foreign, private domestic, government owned and government controlled.
37 The other FOBs are smaller banks serving niche clients.
44 Kenya’s Financial Transformation in the 21st Century
the SPOB segment, there were 18 banks controlling 15.4% of the market. This stark difference means that the concentration ratio (discussed above) reveals little about the true nature of competition in the banking sector.
Figure 13: Share of segments, 2012
FOB 33%
GOB 17%
LPOB 35%
SPOB 15%
Source: Authors’ calculations from bank financial statements.
Table 7: Change in share of assets by segment, 2000–2012
Share of segments
Share of segments
Share of segments
Difference in share
Total no. of banks in segment
Total no. of banks in segment
2000 2005 20122000–2012
2005 2012
FOB 43.6% 40.4% 32.8% -10.8% 10 12
GOB 25.5% 18.4% 17.3% -8.2% 4 4
LPOB 19.7% 30.0% 34.5% +14.8% 9 6
SPOB 11.2% 11.2% 15.4% +4.2% 18 21
TOTAL 100% 100% 100% 41 43
Source: Authors’ calculations from bank financial statements.
The key change that has occurred is the rising share of the LPOB segment and the falling share of both the FOB and GOB segments (see Figure 14). In 2000, the LPOB segment controlled 19.7% of total assets in the banking sector. This grew to 30% in 2005, and 34.5% in 2012.38 The FOB segment steadily lost its share, from control of 43.6% of the market in 2000 to 32.8% in 2012. Similarly, the GOB segment also saw its share fall from 25.5% in 2000, to 18.4% in 2005, to 17.3% in 2012. The SPOB segment, meanwhile, managed to marginally increase its share from 11.2% in 2000 to 15.4% in
38 The number of banks in this segment has fallen as one bank was taken over by a bank in the FOB segment and two other banks were moved to the SPOB segment because they no longer met the classification criteria.
Transformation of Kenya’s Banking Sector, 2000–2012 45
2012. Overall, while banks in Kenya have generally experienced growing balance sheets since 2000, banks in the LPOB segment have pursued strategies that have either increased or maintained their proportionate share of total assets. In the sections that follow, we discuss the portfolio characteristics of the segments at a broad level and then discuss each segment in detail.
Figure 14: Share of segments, 2000, 2005 and 2012
43.6% 40.4% 32.8%
25.5%
18.4% 17.3%
19.7% 30.0%
34.5%
11.2% 11.2% 15.4%
0
10
20
30
40
50
60
70
80
90
100
2000 2005 2012
Perc
ent
SPOB
LPOB
GOB
FOB
Source: Authors’ calculations from bank financial statements.
4.2 Portfolio characteristics of segments, 2000 to 2012
We now discuss the portfolio characteristics of the different segments of the banking sector in Kenya. The dataset used for this analysis is individual bank balance sheets, with two data points: average for 2000–2005 and then 2012.39 The indicators we focus on are return on assets, ratio of capital to risk weighted assets, ratio of loans to total assets, ratio of government securities to total loans, total loans on total deposits, non-performing loans and cost of funds.40
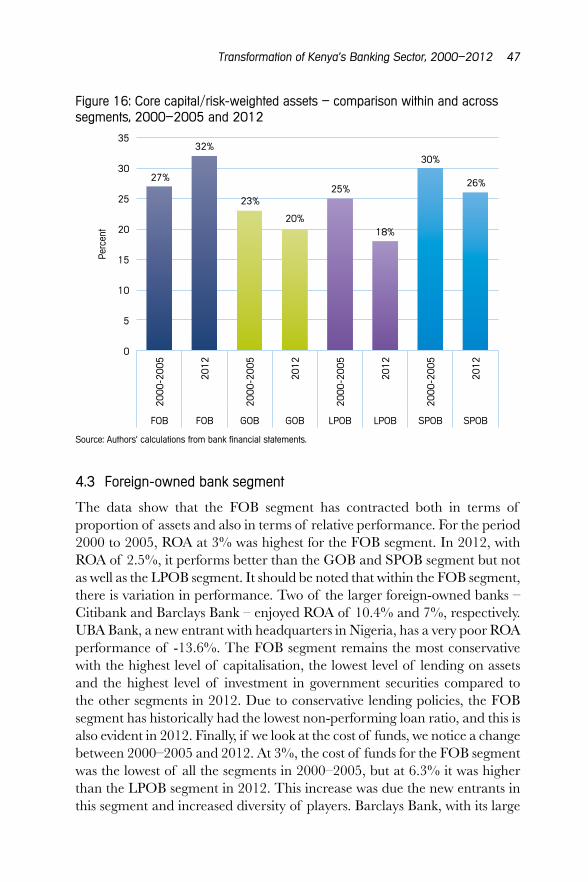
Table 8, Figure 15 and Figure 16 show the portfolio characteristics of the segments and the changes in these characteristics between 2000–2005 and 2012.
39 It should be noted that before 2000, banks followed different reporting standards and therefore financial statements are not comparable.
40 Cost of funds is calculated as interest on customer deposits plus interest on borrowed funds divided by total deposits plus borrowed funds.

46 Kenya’s Financial Transformation in the 21st Century
Table 8: Change in key indicators by segment, 2000–2005 and 2012
Segment FOB GOB LPOB SPOB
2000–2005
20122000–2005
20122000–2005
20122000–2005
2012
Return on assets 3% 2.5% 1% 2.2% 3% 4.9% 0% 1.9%
Core capital/total risk-weighted assets
27% 32% 23% 20% 25% 18% 30% 26%
Total loans/total assets
40% 48% 53% 56% 50% 59% 52% 58%
Government securities/total loans
117% 91% 26% 50% 38% 27% 31% 42%
Total loans/total deposits
58% 64% 153% 76% 82% 77% 158% 77%
Total NPLs/total loans
9% 4% 46% 8% 16% 6% 28% 8%
Cost of funds 3% 6.3% 4% 7.5% 5% 5.8% 6% 8.40%
Source: Authors’ calculations from bank financial statements.
Figure 15: Return on assets – comparison within and across segments, 2000–2005 and 2012
3%
2.5%
1%
2.2%
3%
4.9%
0%
1.9%
0
1
2
3
4
5
2000
-200
5
2012
2000
-200
5
2012
2000
-200
5
2012
2000
-200
5
2012
FOB FOB GOB GOB LPOB LPOB SPOB SPOB
Perc
ent
Source: Authors’ calculations from bank financial statements.
Transformation of Kenya’s Banking Sector, 2000–2012 47
Figure 16: Core capital/risk-weighted assets – comparison within and across segments, 2000–2005 and 2012
27%
32%
23%
20%
25%
18%
30%
26%
0
5
10
15
20
25
30
35
2000
-200
5
2012
2000
-200
5
2012
2000
-200
5
2012
2000
-200
5
2012
FOB FOB GOB GOB LPOB LPOB SPOB SPOB
Perc
ent
Source: Authors’ calculations from bank financial statements.
4.3 Foreign-owned bank segment
The data show that the FOB segment has contracted both in terms of proportion of assets and also in terms of relative performance. For the period 2000 to 2005, ROA at 3% was highest for the FOB segment. In 2012, with ROA of 2.5%, it performs better than the GOB and SPOB segment but not as well as the LPOB segment. It should be noted that within the FOB segment, there is variation in performance. Two of the larger foreign-owned banks – Citibank and Barclays Bank – enjoyed ROA of 10.4% and 7%, respectively. UBA Bank, a new entrant with headquarters in Nigeria, has a very poor ROA performance of -13.6%. The FOB segment remains the most conservative with the highest level of capitalisation, the lowest level of lending on assets and the highest level of investment in government securities compared to the other segments in 2012. Due to conservative lending policies, the FOB segment has historically had the lowest non-performing loan ratio, and this is also evident in 2012. Finally, if we look at the cost of funds, we notice a change between 2000–2005 and 2012. At 3%, the cost of funds for the FOB segment was the lowest of all the segments in 2000–2005, but at 6.3% it was higher than the LPOB segment in 2012. This increase was due the new entrants in this segment and increased diversity of players. Barclays Bank, with its large
48 Kenya’s Financial Transformation in the 21st Century
branch network and strong reputation, had a cost of funds of only 1.7% and Citibank had a cost of funds of 3.7%. UBA Bank and Bank of Africa, both new entrants to the markets and banks that are headquartered in West Africa, had very high costs of funds in 2012 of 9.72% and 9.48%, respectively. This may reflect their lack of reputation in the market.41
Overall, it can be said that the FOB segment maintains a significant if falling share of the market. The segment also changed between 2000 and 2005, as there is more diversity within this segment with some new entrants. The discussion shows that even within the FOB segment there is variation of performance based on size, length of presence in Kenya and location of the parent bank, all of which affect the reputation of the banks.
4.4 Government-owned bank segment
The data show that though the share of the GOB segment declined between 2000–2005 and 2012, the portfolio characteristics were much improved. In particular, the very high NPL ratio of 46% in 2000–2005 was reduced to 8% in 2012.42 This is still higher than the NPL ratio of the FOB and LPOB segments, but reflects the policy of the regulator to restructure the banks, in particular the Kenya Commercial Bank. The liquidity of the sector as measured by total loans/deposits also improved from 153% in 2000–2005 to 76% in 2012. The ROA for the sector, at 2.2% in 2012, also improved. The main change between 2000–2005 and 2012 was the increase in cost of funds. In 2000–2005, the cost of funds of GOBs, at 4%, was higher than that of FOBs but much lower those of LPOBs and SPOBs. At 7.5% in 2012, the GOB segment now has a cost of funds lower only than the SPOB segment. There is variation within the segment, with the Kenya Commercial Bank, the largest bank in 2012, having a cost of funds of only 4.6%. In contrast, Consolidated Bank had a very high cost of funds of 11% and National Bank of Kenya had a cost of funds of 6.6%. In 2005, these two banks had a cost of funds of 1.61% and 2.6%, respectively.
Overall it can be said that the GOB segment between 2000–2005 and 2012 improved in terms of several performance ratios. However, its overall share of the market was reduced and the segment also had reduced ability to raise funds very cheaply as it could in the past.43
41 It can be hypothesised that these smaller FOB banks are not viewed by the market as foreign-owned banks but small privately owned banks.
42 Refer to the historical section above for explanation of sources of high NPLs. 43 This was partly due to a change in government policy whereby it is no longer mandatory for government parastatals
to keep funds in government-owned banks.
Transformation of Kenya’s Banking Sector, 2000–2012 49
4.5 Large privately owned bank segment
This is the segment that experienced the most significant change between 2000–2005 and 2012. The segment’s share of total assets increased from 19.7% in 2000 to 34.5% in 2012. In 2012, this segment had the highest ROA (4.9%) of all segments and the lowest cost of funds, at 5.8%. This is the key change within the segments between 2005 and 2012. In 2005, FOBs and GOBs had the lowest overall cost of funds, followed by LPOBs and SPOBs. In 2012, however, LPOBs has the lowest cost of funds followed by FOBs, GOBs and SPOBs.44 The LPOB segment is also the least conservative with the highest total loans-to-total assets ratio of 59% and the lowest investment in government securities as a proportion of total loans (27%), but it still has a low NPL ratio of 6%. Most of the growth in this sector can be explained by the rise of Equity Bank. In 2005, Equity Bank was the 13th largest bank in Kenya with a market share of 1.8%. By 2012, it was the second largest bank in Kenya with 9.3% of the market.45 Equity Bank started as a microfinance bank and has received numerous accolades due to its focus on making financial services available to the poor and the ‘unbanked’ (Equity Bank Ltd, 2009). Studies have attributed its success to developing innovative products, including changing its fee structure from monthly ledger fees to a transaction fee-based model, ‘no-collateral’ loans, a customer focus, investment in human resources and investment in technology (Coates, 2007; Wright and Cracknell, 2008). Furthermore, Equity Bank used the agency banking model to increase access to finance. However each of the banks in the LPOB segment has made strides in either growing or maintaining its market share in a growing market (see Appendix 3). For example, Diamond Trust Bank grew its asset share from 2.72% in 2005 to 4.06% in 2012 by focusing on small and medium-sized enterprises. Overall, there is a need to study the competitive strategies of other banks in the LPOB segment to understand how they have been able to build their reputation and asset base so as to break the historical dominance of the FOBs and GOBs.
4.6 Small privately owned bank segment
We now turn to the SPOB segment. As mentioned earlier, this segment has over 18 small banks. These banks were able to increase their share of the market from 11.2% in 2005 to 15.4% in 2012. Furthermore, they remain well capitalised. At 26%, the average core capital-to-risk-weighted ratio is
44 Again there are differences within this segment. Equity Bank, with its large branch network, has a cost of funds of 2.9% and I&M Bank has a cost of funds of 7.9%.
45 Refer to Appendix 3 for the changing shares of specific banks in the LPOB segment.

50 Kenya’s Financial Transformation in the 21st Century
lower than for FOBs but higher than for GOBs and LPOBs. However, banks in this segment still experience difficulties. They are not conservative, with a total loan/total assets ratio and a total loans/total deposits ratio very similar to the LPOB segment. However, with a ROA of 1.9%, this segment has the lowest ROA and the highest cost of funds. Overall, this shows that the SPOB segment still faces significant barriers in terms of competing with banks in other segments. Their inability to exert competitive pressure on the other segments has implications for increasing access to financial services, and partly explains the persistence of high interest rate spreads in Kenya. While there have been changes in the nature of the segmentation of the banking sector in Kenya, it has not been completely eroded.
4.7 Financial access and segmentation
Table 9 shows the usage of different types of banks as reported in the FinAccess surveys of 2006, 2009 and 2013. It shows that the majority of respondents use banks in the LPOB segment, followed by the GOB segment. These data provide corroboration to the discussion above where we showed the increasing share of the LPOB segment and that this is primarily the result of Equity Bank pioneering access to a wider market.
Table 9: Financial service use by segment (percentage of adult population)
2006 2009 2013
FOB 2.7 3.5 3.3
GOB 6.2 5.2 4.8
LPOB
of which equity
6.8
3.6
14.3
--
19.9
16.1
SPOB 0.7 1.6 2.8
Note: This represents the proportion of the adult population reporting that they are currently using a bank in the segment, it does not take account of multiple account use in the same sector. Respondents may also have an account in a different sector.
Sources: Authors’ calculations from FinAccess surveys
Table 10 lists the top five banks and highlights changes in outreach between 2006 and 2013. It shows that while the largest increase in outreach can be attributed to Equity Bank, Co-operative also increasing its outreach. Postbank lost out to the competition (it do not offer loans) and KCB expanded its outreach marginally.

Transformation of Kenya’s Banking Sector, 2000–2012 51
Table 10: Proportion using specific banks46 (percentage of adult population)
2006 2013
Equity 3.6 16.1
Co-operative 3.0 4.7
Postbank 5.6 5.1
KCB 3.3 3.8
Barclays 1.6 1.4
Sources: Authors’ calculations from FinAccess surveys.
Supply-side data also reflect the fact that the increase in access, as discussed above, has been driven by the LPOBs, one GOB (KCB) and one SPOB (Family Bank) (see Figure 17). It should be noted that the agency banking model has been key to allowing banks to increase access to finance. As at December 2012, there were ten commercial banks that had contracted 16,333 active agents facilitating over 38 million transactions valued at Ksh195.8 billion (Central Bank of Kenya, 2012).47
Since these data were collected, the Commercial Bank of Africa (CBA) has grown considerably in outreach through its M-Shwari product embedded into M-PESA. Recent data indicate that CBA has some 5.6 million deposit accounts, compared to Equity Bank’s 7.4 million, with an average account balance of Ksh16,000 compared to Equity’s average balance of Ksh21,445. However, CBA’s number of loan accounts (879,000) now exceeds that of Equity Bank (840,000) (Ngigi, 2014b). Loan sizes are likely to be much lower, however, given M-Shwari’s loan limit of approximately Ksh8,000, and costs are high at 7.5% per month. This is revolutionary in the low-end market, although the actual profile of borrowers remains to be established. However, CBA’s enforcement mechanisms for these loans are currently weak and it reported in January 2014 that it had blacklisted 140,000 clients (16%) with credit bureaux (Ngigi, 2014a).
46 Data for individual banks in the 2009 dataset are not consistent with other years and we therefore do not present them here. Nevertheless, the data for the segments, which combine a number of banks, appear consistent and have therefore been presented.
47 The CBK does not provide a breakdown of the number of agents per bank. However, the three banks with the largest agent networks are Equity Bank and Co-operative Bank (in the LPOB segment) and Kenya Commercial Bank (in the GOB segment).

52 Kenya’s Financial Transformation in the 21st Century
Figure 17: Growth of deposit accounts by segment
0
2,000
4,000
6,000
8,000
10,000
12,000
14,000
16,000
18,000
2006 2008 2010 2012
Num
ber
of a
ccou
nts
(’000
)
SPOB
FOB
GOB
LPOB
Source: Central Bank of Kenya supervision reports (various years).
5 Conclusions
This chapter has traced the evolution of the banking sector in Kenya from 2000 to 2012. It shows that at the macro level, there has been significant progress in terms of increased financial depth, reduced concentration, increased stability and increased access. However we note three main areas of concern: the low savings rates, the lack of credit to key sectors of the economy including agriculture and manufacturing, and the high interest rate spread and margin.
At the micro level, we focus on the evolution of four different segments of the banking sector – FOBs, GOBs, LPOBs and SPOBs. It had been noted in 2005 that the first three banks to be established in Kenya (between 1896 and 1910) remained the three dominant banks (Upadhyaya, 2011). Of these three banks, two were in the FOB segment and one was in the GOB segment. The analysis shows that there was a significant change in the strength of the segments between 2005 and 2012. Banks in the LPOB segment gained ground and managed to overcome the reputation barriers they faced in 2005. This can be mainly attributed to the phenomenal rise of Equity Bank, but other banks in the LPOB segment also increased or maintained their share of the market. This reduction in the historical dominance of the FOBs and GOBs is the positive story of the banking system in Kenya.

Transformation of Kenya’s Banking Sector, 2000–2012 53
This change reflects the recognition, led by Equity, of under-banked markets and that banking these profitably requires new approaches to operating. Competition for the low-income unbanked is mainly between LPOBs (Equity, Co-operative), with the mobile-enabled technology of M-PESA now linked to banking with Commercial Bank of Africa (CBA) via M-Shwari offering initial signs of a significant shift in the landscape. This competition is likely to continue to drive growth in the LPOB segment, which should also drive improvements in efficiency and thus reduce costs to make mass banking outreach a reality. While disruptive innovation may arise from any quarter as mobile technology development continues apace, the current trend is producing a new segmentation between the LPOBs and the formerly dominant GOBs and FOBs, which appear unable to actively compete for this market, and raises the risk of the low-income market becoming an effective duopoly between Equity and CBA.
However, as reflected in the intractable interest rate spread, while segmentation of the sector has in many ways been eroded, it is still present and there is a need to increase the reputation of the banking sector as a whole, and in particular of banks in the SPOB segment, to encourage full competition.
References
Aaronovitch, S. and K. Aaronovitch (1947), Crisis in Kenya, London: Lawrence and Wishart.
Abdi, A. (1977), Commercial Banks and Economic Development : The Experience of Eastern Africa, New York: Praeger.
Asian-African Heritage Trust (2000), The Asian-African Heritage Exhibition: Identity and History, Nairobi: National Museums of Kenya and The Asian-African Heritage Trust.
Atieno-Odhiambo, E. (2000), “Mugo’s Prophesy”, in B. Ogot and W. Ochieng’ (eds), Kenya: The Making of a Nation 1895–1995, Maseno and Kisumu: Maseno University.
Beck, T. (2013), Finance for Development: A Context-Specific Policy Agenda, London: DFID-ESRC Growth Research Programme (DEGRP).
Beck, T., R. Cull, M. Fuchs, J. Getenga, P. Gatere, J. Randa and M. Trandafir (2010), “Banking Sector Stability, Efficiency, and Outreach in Kenya”, in C. Adam, P. Collier and N. Ndung’u (eds), Kenya: Policies for Prosperity, Oxford: Oxford University Press.
54 Kenya’s Financial Transformation in the 21st Century
Brownbridge, M. (1998), “Government Policies and the Development of Banking in Kenya”, in M. Brownbridge and C. Harvey (eds), Banking in Africa, Trenton, NJ: Africa World Press/James Curry, pp. 79–103.
Central Bank of Kenya (1972), Money and Banking in Kenya, Nairobi: Central Bank of Kenya, p. 34.
_____ (1976), The First Ten Years, Nairobi: Central Bank of Kenya.
_____ (1986), Central Bank of Kenya – It’s Evolution, Responsibilities and Organization, Nairobi: Central Bank of Kenya.
_____ (1995), Annual Report and Financial Statements July 1994 – June 1995, Nairobi: Central Bank of Kenya.
_____ (1996), Annual Report and Financial Statements July 1995 – June 1996, Nairobi: Central Bank of Kenya.
_____ (1997), Annual Report and Financial Statements July 1996 – June 1997, Nairobi: Central Bank of Kenya.
_____ (1999), Annual Report and Financial Statements July 1998 – June 1999, Nairobi: Central Bank of Kenya.
_____ (2000a), Bank Supervision Annual Report 2000, Nairobi: Central Bank of Kenya.
_____ (2000b), Prudential Guidelines 2000, Nairobi: Central Bank of Kenya.
_____ (2003), Bank Supervision Annual Report 2003, Nairobi: Central Bank of Kenya.
_____ (2005), Bank Supervision Annual Report 2005, Nairobi: Central Bank of Kenya.
_____ (2006), Prudential Guidelines 2006, Nairobi: Central Bank of Kenya.
_____ (2008), Bank Supervision Annual Report 2008, Nairobi: Central Bank of Kenya.
_____ (2012), Bank Supervision Annual Report 2012, Nairobi: Central Bank of Kenya.
Central Bank of Kenya (CBK) and FSD Kenya (2013), FinAcess National Survey 2013: Profiling Developments in Financial Access and Usage in Kenya, Nairobi.
Coates, B. (2007), “Equity Bank”, Stanford Graduate School of Business Case Study, E260.
Davidson, P. (2008), “Securitisation, Liquidity, and Market Failure”, Challenge 51(2).
Transformation of Kenya’s Banking Sector, 2000–2012 55
Demirgüç-Kunt, A. and R. Levine (2001), Financial Structure and Economic Growth: A Cross Country Comparison of Banks, Markets and Development, Cambridge MA: MIT Press.
Engberg, H. (1965), “Commercial Banking in East Africa, 1950–1963”, The Journal of Modern African Studies 3(2), pp. 175–200.
Equity Bank (2009), Annual Report and Accounts, Nairobi: Equity Bank Ltd.
Gertler, M. and A. Rose (1994), “Finance, Public Policy and Growth”, in G. Caprio, I. Atiyas and P. Honohan (eds), Financial Reform, Cambridge: Cambridge University Press.
Griffith-Jones, S. (2013), Policy-Relevant Research for the Finanical Sector in Low-Income Countries, London: DFID-ESRC Growth Research Programme (DEGRP).
Grosh, B. (1991), Public Enterprises in Kenya : What Works, What Doesn’t and Why, Boulder, CO and London: Lynne Rienner Publishers.
Hazlewood, A. (1979), The Economy of Kenya - The Kenyatta Era, Oxford: Oxford University Press.
Honohan, P. and T. Beck (2007), Making Finance Work for Africa, Washington, DC: The World Bank.
Johnson, S. (2004), “‘Milking The Elephant’ : Financial Markets as Real Markets in Kenya”, Development and Change 35(2), pp. 247–274.
Kamau, A., S. Karingi, N. Ndung’u and S. Mwaura (2004), “Capital Requirements and Bank Behaviour in Kenya: Empirical Evidence”, KIPPRA Discussion Paper No. 36, Nairobi.
Kariuki, P. (1993), The Impact of Interest Rate Liberalisation on Financial Savings: The Case of Kenya, Brighton: University of Sussex.
Kariuki, P. (1995), “The Impact of Interest Rate Liberalisation on Financial Savings: The Case of Kenya”, African Review of Money, Finance and Banking 95, pp. 5–20.
Levine, R. (1997), “Financial Development and Economic Growth: Views and Agenda”, Journal of Economic Literature 35 (June), pp. 688–726.
Leys, C. (1975), Underdevelopment in Kenya: The Political Economy of Neo-Colonialism, London: Heinemann, Educational Books.
Lin, J. (2009), “Walk, Don’t Run”, The Economist, 11 July.

56 Kenya’s Financial Transformation in the 21st Century
Mavrotas, G. (2005), “Savings and Financial Sector Development: Assessing the Evidence”, in C. Green, C. Kirkpatrick and V. Murinde (eds), Finance and Development: Surveys of Theory, Evidence and Policy, Cheltenham, UK: Edward Elgar.
Maxon, R. (1992), “The Colonial Financial System”, in W. Ochieng and R. Maxon (eds), An Economic History of Kenya, Nairobi: East African Educational Publishers.
Maxon, R. and P. Ndege (1995), “The Economics of Structural Adjustment”, in B. Ogot and W. Ochieng’ (eds), Decolonization and Independence in Kenya, 1940–93, Athens, OH: Ohio University Press.
McKinnon, R. (1973), Money and Capital in Economic Development, Washington, DC: Brookings Institute.
Mkandawire, T. (1999), “The Political Economy of Financial Reform in Africa”, Journal of International Development 11, pp. 321–342.
Mwega, F., S. Ngola and N. Mwangi (1990), “Real Interest Rates and the Mobilization of Private Savings in Africa”, AERC Research Paper No. 2.
Nasibi, R. (1992), “Financial Institutions and Monetary Policy in Post-Independence Kenya”, in W. Ochieng and R. Maxon (eds), An Economic History of Kenya, Nairobi: East African Educational Publishers.
Ncube, M. and L. Senbet (1997), “Perspectives on Financial Regulation and Liberalisation in Africa under Incentive Problems and Asymmetric Information”, Journal of African Economies 6(1).
Ndege, P. (2000), “Modernisation of the Economy 1964–1970”, in B. Ogot and W. Ochieng’ (eds), Kenya: The Making of a Nation 1895–1995, Maseno and Kisumu: Maseno University.
Ndii, D. (1994), “An Asymmetric Information Analysis of Financial Sector Policy in Kenya”, University of Oxford.
Ndung’u, N. and R. Ngugi (1999), “Adjustment and Liberalisation in Kenya: The Financial and Foreign Exchange Markets”, Journal of International Development 11, pp. 465–491.
Nesvetailova, A. (2010), Financial Alchemy in Crisis: The Great Liquidity Illusion, London: Pluto Press.
Ngigi, G. (2014a), “CBA Blacklists 140,000 Safaricom Loan Defaulters”, Business Daily, 26 January.

Transformation of Kenya’s Banking Sector, 2000–2012 57
_____ (2014b, 10th June 2014), “M-Shwari Helps CBA to Claim Top Personal Loans Position”, Business Daily, 10 June.
Ngugi, R. (2000), “Financial Sector Reform Process in Kenya: 1989–96”, African Development Review 12(1), 52–77.
Ngugi, R. and J. Kabubo (1998), “Financial Sector Reforms and Interest Rate Liberalisation: The Kenya Experience”, AERC Research Paper No. 72.
Onyonka, Z. (1968), Agricultural Development Banking: A Case Study of Kenya, New York: Syracuse University.
Republic of Kenya (1968), “Development Plan 1969–1974”, Nairobi: Government Printer.
_____ (2007), “Vision 2030 (The Popular Version)”, Nairobi: Government Printer.
_____ (2012), “Sessional Paper No. 10 of 2012 on Kenya Vision 2030”, Nairobi: Government Printer.
Shaw, E. (1973), Financial Deepening in Economic Development. New York: Oxford University Press.
Sichei, M., S. Tiriongo and C. Shimba (2012), “Segmentation and Efficiency of the Interbank Market in Kenya”, KBA Centre for Research on Financial Markets and Policy Working Paper No. WPS/01/12.
Throup, D. (1987), “The Construction and Destruction of the Kenyan State”, in M. Schatzberg (ed.), The Political Economy of Kenya, New York: Praeger.
Upadhyaya, R. (2011), “Analysing the Sources and Impact of Segmentation in the Banking Sector: A Case Study of Kenya”, School of Oriental and African Studies, University of London.
Were, M. and Wambua, J. (2013), “Assessing the Determinants of Interest Rate Spread of Commercial Banks in Kenya: An Empirical Investigation”, KBA Centre for Research on Financial Markets and Policy Working Paper WPS/01/13.
World Bank (1989), Kenya: Report and Recommendations of the President of the International Development Association to the Executive Directors on the Proposed Financial Sector Adjustment Credit, Washington, DC: World Bank.
_____ (2013), Kenya Economic Update: Reinvigorating Growth with a Dyanamic Banking Sector, Nairobi: World Bank.
Wright, G. and D. Cracknell (2008), “The Market Led Revolution of Equity Bank”, Microsave Credit Note No. 63.
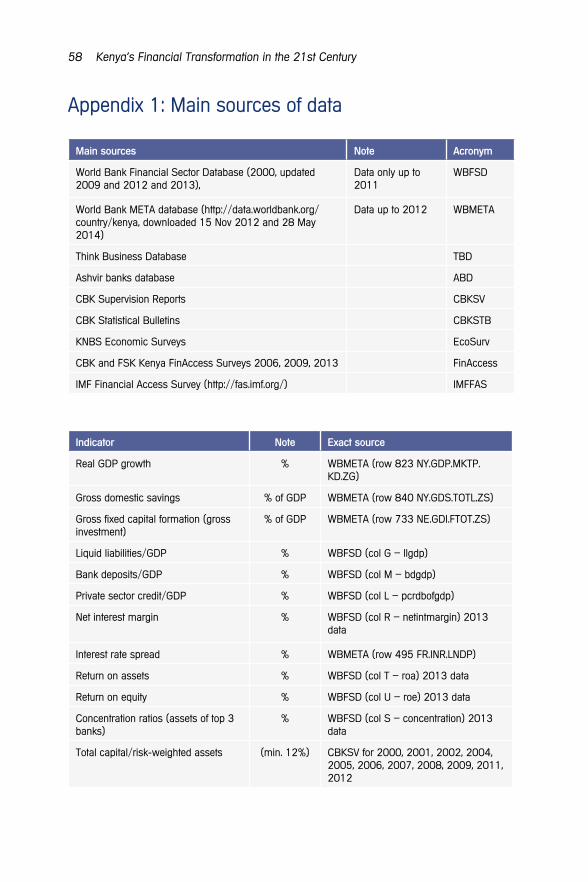
58 Kenya’s Financial Transformation in the 21st Century
Appendix 1: Main sources of data
Main sources Note Acronym
World Bank Financial Sector Database (2000, updated 2009 and 2012 and 2013),
Data only up to 2011
WBFSD
World Bank META database (http://data.worldbank.org/country/kenya, downloaded 15 Nov 2012 and 28 May 2014)
Data up to 2012 WBMETA
Think Business Database TBD
Ashvir banks database ABD
CBK Supervision Reports CBKSV
CBK Statistical Bulletins CBKSTB
KNBS Economic Surveys EcoSurv
CBK and FSK Kenya FinAccess Surveys 2006, 2009, 2013 FinAccess
IMF Financial Access Survey (http://fas.imf.org/) IMFFAS
Indicator Note Exact source
Real GDP growth % WBMETA (row 823 NY.GDP.MKTP.KD.ZG)
Gross domestic savings % of GDP WBMETA (row 840 NY.GDS.TOTL.ZS)
Gross fixed capital formation (gross investment)
% of GDP WBMETA (row 733 NE.GDI.FTOT.ZS)
Liquid liabilities/GDP % WBFSD (col G – llgdp)
Bank deposits/GDP % WBFSD (col M – bdgdp)
Private sector credit/GDP % WBFSD (col L – pcrdbofgdp)
Net interest margin % WBFSD (col R – netintmargin) 2013 data
Interest rate spread % WBMETA (row 495 FR.INR.LNDP)
Return on assets % WBFSD (col T – roa) 2013 data
Return on equity % WBFSD (col U – roe) 2013 data
Concentration ratios (assets of top 3 banks)
% WBFSD (col S – concentration) 2013 data
Total capital/risk-weighted assets (min. 12%) CBKSV for 2000, 2001, 2002, 2004, 2005, 2006, 2007, 2008, 2009, 2011, 2012

Transformation of Kenya’s Banking Sector, 2000–2012 59
Indicator Note Exact source
Core capital/risk-weighted assets (min. 8%) CBKSV for 2000, 2001, 2002, 2004, 2005, 2006, 2007, 2008, 2009, 2011, 2012
Core capital/total deposits (min. 8%) CBKSV for 2000, 2001, 2002, 2004, 2005, 2006, 2007, 2008, 2009, 2011, 2012
Liquid assets to deposit liabilities (liquidity ratio)
(min. 20%) CBKSV for 2000, 2001, 2002, 2004, 2005, 2006, 2007, 2008, 2009, 2011, 2012
NPLs/total loans CBKSV for 2000, 2001, 2002, 2004, 2005, 2006, 2007, 2008, CBSV(2010) for 2009, 2010; CBSV(2011) for 2011; CBSV (2012) for 2012
Agriculture sector % of GDP EcoSurv (2013) for 2012; EcoSurv (2008) for 2005; EcoSurv (2005) for 2000
Manufacturing sector size % of GDP EcoSurv (2013) for 2012; EcoSurv (2008) for 2005; EcoSurv (2005) for 2000
Financial sector size % of GDP EcoSurv (2013) for 2012; EcoSurv (2008) for 2005; EcoSurv (2005) for 2000
Lending to agriculture % (share of gross loans)
CBKSV (2012) for 2012; CBKSTB for 2005; EcoSurv (2005) for 2000
Lending to manufacturing % (share of gross loans)
CBKSV (2012) for 2012; CBKSTB for 2005; EcoSurv (2005) for 2000
Lending to household % (share of gross loans)
CBKSV (2012) for 2012; CBKSTB for 2005; EcoSurv (2005) for 2000
Lending to financial services % (share of gross loans)
CBKSV (2012) for 2012; CBKSTB for 2005; EcoSurv (2005) for 2000
Lending to real estate % (share of gross loans)
CBKSV (2012) for 2012; CBKSTB for 2005; EcoSurv (2005) for 2000
Lending to trade % (share of gross loans)
CBKSV (2012) for 2012; CBKSTB for 2005; EcoSurv (2005) for 2000
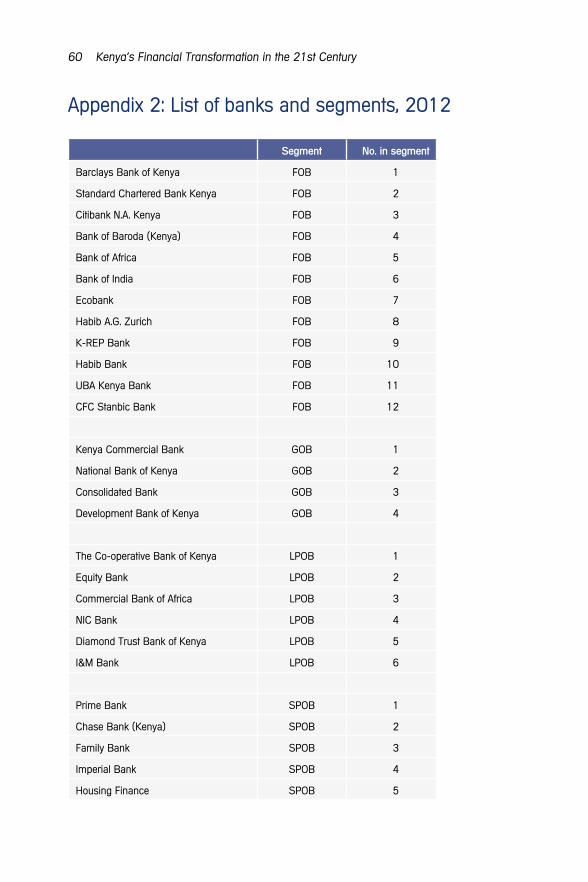
60 Kenya’s Financial Transformation in the 21st Century
Appendix 2: List of banks and segments, 2012
Segment No. in segment
Barclays Bank of Kenya FOB 1
Standard Chartered Bank Kenya FOB 2
Citibank N.A. Kenya FOB 3
Bank of Baroda (Kenya) FOB 4
Bank of Africa FOB 5
Bank of India FOB 6
Ecobank FOB 7
Habib A.G. Zurich FOB 8
K-REP Bank FOB 9
Habib Bank FOB 10
UBA Kenya Bank FOB 11
CFC Stanbic Bank FOB 12
Kenya Commercial Bank GOB 1
National Bank of Kenya GOB 2
Consolidated Bank GOB 3
Development Bank of Kenya GOB 4
The Co-operative Bank of Kenya LPOB 1
Equity Bank LPOB 2
Commercial Bank of Africa LPOB 3
NIC Bank LPOB 4
Diamond Trust Bank of Kenya LPOB 5
I&M Bank LPOB 6
Prime Bank SPOB 1
Chase Bank (Kenya) SPOB 2
Family Bank SPOB 3
Imperial Bank SPOB 4
Housing Finance SPOB 5

Transformation of Kenya’s Banking Sector, 2000–2012 61
Fina Bank SPOB 6
Gulf African Bank SPOB 7
African Banking Corporation SPOB 8
Giro Commercial Bank SPOB 9
Equatorial Commercial Bank SPOB 10
Fidelity Commercial Bank SPOB 11
First Community Bank SPOB 12
Guardian Bank SPOB 13
Victoria Commercial Bank SPOB 14
Trans National Bank SPOB 15
Credit Bank SPOB 16
Oriental Commercial Bank SPOB 17
Paramount Universal Bank SPOB 18
Middle East Bank SPOB 19
Dubai Bank SPOB 20
Jamii Bora Bank SPOB 21
TOTAL INDUSTRY 43
Appendix 3: Changing share of banks in LPOB segment
Market Share 2005 2012 Difference
Equity Bank 1.90% 9.26% 7.36%
Co-operative Bank of Kenya 8.59% 8.57% -0.02%
NIC Bank 3.43% 4.37% 0.94%
Commercial Bank of Africa 4.90% 4.31% -0.58%
Diamond Trust 2.72% 4.06% 1.34%
I&M Bank 2.99% 3.93% 0.94%


The transformation of financial services in Kenya since 2000 has been remarkable. Kenya outperforms both the global average and many middle-income countries such as Chile, Brazil, India, Mexico and Russia, with 75% of adults holding a formal account that allows them to save, send or receive money. This book explores the transformation with analysis of a range of new datasets by leading academic experts. The exceptional growth in mobile money, the emergence of bank agents, the expansion of bank branches and the growth of domestically owned banks are just some of the dimensions investigated in the book. While the Kenyan experience is unique, the story has great relevance for all emerging economies seeking to develop their financial systems.
9 789966 093912
ISBN 978-9966-093-91-2
FSD Kenya is an independent trust established to support the development of inclusive financial markets in Kenya
5th floor, KMA Centre • Junction of Chyulu Road and Mara Road, Upper Hill • PO Box 11353, 00100 Nairobi, Kenya
T +254 (20) 2923000 • C +254 (724) 319706, (735) 319706
[email protected] • www.fsdkenya.org
Kenya’s Financial Transformation in the 21st C
entury