KENEDIX MARKET REPORT2013/03/22 · banks has rebounded to show increases since Q3 2011, and...
13
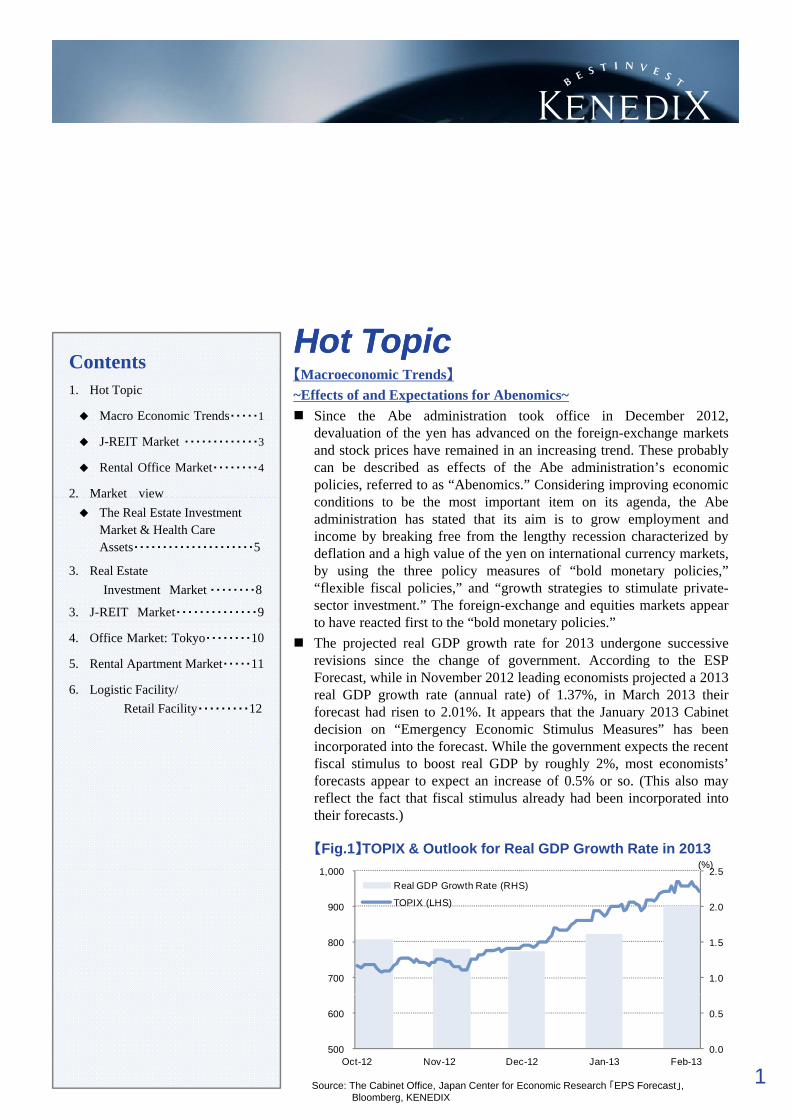
KENEDIX MARKET REPORT March 2013 【M i T d 】 Hot Topic Hot Topic Contents 【Macroeconomic Trends】 ~Effects of and Expectations for Abenomics~ Since the Abe administration took office in December 2012, devaluation of the yen has advanced on the foreign-exchange markets and stock prices have remained in an increasing trend. These probably can be described as effects of the Abe administration’s economic policies, referred to as “Abenomics.” Considering improving economic di i b h i i i d h Ab 1. Hot Topic Macro Economic Trends・・・・・1 J-REIT Market ・・・・・・・・・・・・・3 Rental Office Market・・・・・・・・4 2. Market view conditions to bethe most important item on its agenda, the Abe administration has stated that its aim is to grow employment and income by breaking free from the lengthy recession characterized by deflation and a high value of the yen on international currency markets, by using the three policy measures of “bold monetary policies,” “flexible fiscal policies,” and “growth strategies to stimulate private- sector investment.” The foreign-exchange and equities markets appear to have reacted first to the “bold monetary policies ” 2. Market view The Real Estate Investment Market & Health Care Assets・・・・・・・・・・・・・・・・・・・・・5 3. Real Estate Investment Market ・・・・・・・・8 3. J-REIT Market・・・・・・・・・・・・・・9 to have reacted first to the bold monetary policies. The projected real GDP growth rate for 2013 undergone successive revisions since the change of government. According to the ESP Forecast, while in November 2012 leading economists projected a 2013 real GDP growth rate (annual rate) of 1.37%, in March 2013 their forecast had risen to 2.01%. It appears that the January 2013 Cabinet decision on “Emergency Economic Stimulus Measures” has been incorporated into the forecast While the government expects the recent 4. Office Market: Tokyo・・・・・・・・10 5. Rental Apartment Market・・・・・11 6. Logistic Facility/ Retail Facility・・・・・・・・・12 incorporated into the forecast. While the government expects the recent fiscal stimulus to boost real GDP by roughly 2%, most economists’ forecasts appear to expect an increase of 0.5% or so. (This also may reflect the fact that fiscal stimulus already had been incorporated into their forecasts.) 【Fig.1】TOPIX & Outlook for Real GDP Growth Rate in 2013 25 1 000 (%) 1.0 1.5 2.0 2. 5 700 800 900 1, 000 Real GDP Growth Rate (RHS) TOPIX (LHS) 1 Source: The Cabinet Office, Japan Center for Economic Research 「EPS Forecast」, Bloomberg, KENEDIX 0.0 0.5 500 600 Oct-12 Nov-12 Dec-12 Jan-13 Feb-13
Transcript of KENEDIX MARKET REPORT2013/03/22 · banks has rebounded to show increases since Q3 2011, and...
KENEDIX MARKET REPORT March 2013
【M i T d 】
Hot TopicHot TopicContents
【Macroeconomic Trends】~Effects of and Expectations for Abenomics~
Since the Abe administration took office in December 2012,devaluation of the yen has advanced on the foreign-exchange marketsand stock prices have remained in an increasing trend. These probablycan be described as effects of the Abe administration’s economicpolicies, referred to as “Abenomics.” Considering improving economic
di i b h i i i d h Ab
1. Hot Topic
Macro Economic Trends・・・・・1
J-REIT Market ・・・・・・・・・・・・・3
Rental Office Market・・・・・・・・4
2. Market view conditions to be the most important item on its agenda, the Abeadministration has stated that its aim is to grow employment andincome by breaking free from the lengthy recession characterized bydeflation and a high value of the yen on international currency markets,by using the three policy measures of “bold monetary policies,”“flexible fiscal policies,” and “growth strategies to stimulate private-sector investment.” The foreign-exchange and equities markets appearto have reacted first to the “bold monetary policies ”
2. Market viewThe Real Estate InvestmentMarket & Health Care Assets・・・・・・・・・・・・・・・・・・・・・5
3. Real EstateInvestment Market ・・・・・・・・8
3. J-REIT Market・・・・・・・・・・・・・・9to have reacted first to the bold monetary policies.The projected real GDP growth rate for 2013 undergone successiverevisions since the change of government. According to the ESPForecast, while in November 2012 leading economists projected a 2013real GDP growth rate (annual rate) of 1.37%, in March 2013 theirforecast had risen to 2.01%. It appears that the January 2013 Cabinetdecision on “Emergency Economic Stimulus Measures” has beenincorporated into the forecast While the government expects the recent
4. Office Market: Tokyo・・・・・・・・10
5. Rental Apartment Market・・・・・11
6. Logistic Facility/ Retail Facility・・・・・・・・・12
incorporated into the forecast. While the government expects the recentfiscal stimulus to boost real GDP by roughly 2%, most economists’forecasts appear to expect an increase of 0.5% or so. (This also mayreflect the fact that fiscal stimulus already had been incorporated intotheir forecasts.)
【Fig.1】TOPIX & Outlook for Real GDP Growth Rate in 20132 51 000
(%)
1.0
1.5
2.0
2.5
700
800
900
1,000 ( )
Real GDP Growth Rate (RHS)
TOPIX (LHS)
1Source: The Cabinet Office, Japan Center for Economic Research 「EPS Forecast」,Bloomberg, KENEDIX
0.0
0.5
500
600
Oct-12 Nov-12 Dec-12 Jan-13 Feb-13
Hot Topic
Monetary Easing and the Real-Estate Investment MarketProclaiming a target of 2% inflation, in January 2013 the Abe administration issued a joint government-Bank ofJapan statement announcing a price stability target of 2% YoY growth in consumer prices. Also, it seems likelythat Haruhiko Kuroda, President of the Asian Development Bank and an advocate of proactive monetary easing,has been named the next Governor of the Bank of Japan. It appears that Kuroda will aim to achieve theinflation target of 2% through further monetary easing, as he has stated in a Diet policy hearing that “The
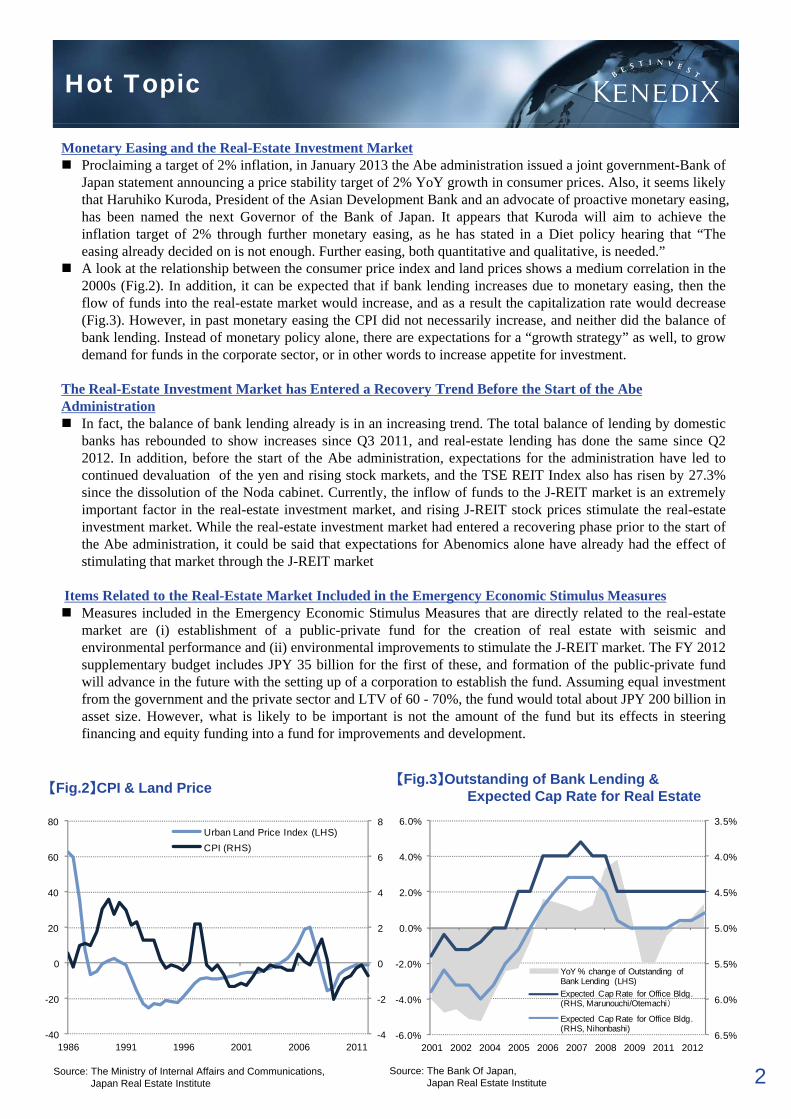
i l d d id d i t h F th i b th tit ti d lit ti i d d ”easing already decided on is not enough. Further easing, both quantitative and qualitative, is needed.”A look at the relationship between the consumer price index and land prices shows a medium correlation in the2000s (Fig.2). In addition, it can be expected that if bank lending increases due to monetary easing, then theflow of funds into the real-estate market would increase, and as a result the capitalization rate would decrease(Fig.3). However, in past monetary easing the CPI did not necessarily increase, and neither did the balance ofbank lending. Instead of monetary policy alone, there are expectations for a “growth strategy” as well, to growdemand for funds in the corporate sector, or in other words to increase appetite for investment.
The Real-Estate Investment Market has Entered a Recovery Trend Before the Start of the Abe Administration
In fact, the balance of bank lending already is in an increasing trend. The total balance of lending by domesticbanks has rebounded to show increases since Q3 2011, and real-estate lending has done the same since Q22012. In addition, before the start of the Abe administration, expectations for the administration have led tocontinued devaluation of the yen and rising stock markets, and the TSE REIT Index also has risen by 27.3%since the dissolution of the Noda cabinet. Currently, the inflow of funds to the J-REIT market is an extremelysince the dissolution of the Noda cabinet. Currently, the inflow of funds to the J REIT market is an extremelyimportant factor in the real-estate investment market, and rising J-REIT stock prices stimulate the real-estateinvestment market. While the real-estate investment market had entered a recovering phase prior to the start ofthe Abe administration, it could be said that expectations for Abenomics alone have already had the effect ofstimulating that market through the J-REIT market
Items Related to the Real-Estate Market Included in the Emergency Economic Stimulus MeasuresMeasures included in the Emergency Economic Stimulus Measures that are directly related to the real-estatemarket are (i) establishment of a public-private fund for the creation of real estate with seismic andenvironmental performance and (ii) environmental improvements to stimulate the J-REIT market. The FY 2012supplementary budget includes JPY 35 billion for the first of these, and formation of the public-private fundwill advance in the future with the setting up of a corporation to establish the fund. Assuming equal investmentfrom the government and the private sector and LTV of 60 - 70%, the fund would total about JPY 200 billion inasset size. However, what is likely to be important is not the amount of the fund but its effects in steeringfinancing and equity funding into a fund for improvements and development.
【Fig.3】Outstanding of Bank Lending & Expected Cap Rate for Real Estate【Fig.2】CPI & Land Price
6
8
60
80Urban Land Price Index (LHS)CPI (RHS)
3.5%
4.0%4.0%
6.0%
0
2
4
0
20
40 4.5%
5.0%
5.5%-2.0%
0.0%
2.0%
YoY % change of Outstanding of Bank Lending (LHS)Expected Cap Rate for Office Bldg
2Source: The Ministry of Internal Affairs and Communications, Japan Real Estate Institute
-4
-2
-40
-20
1986 1991 1996 2001 2006 2011
Source: The Bank Of Japan, Japan Real Estate Institute
6.0%
6.5%-6.0%
-4.0%
2001 2002 2004 2005 2006 2007 2008 2009 2011 2012
Expected Cap Rate for Office Bldg. (RHS, Marunouchi/Otemachi)
Expected Cap Rate for Office Bldg. (RHS, Nihonbashi)
Hot Topic
【J-REIT Market】An Inflow of Funds Into the Real-Estate Investment Market Continues
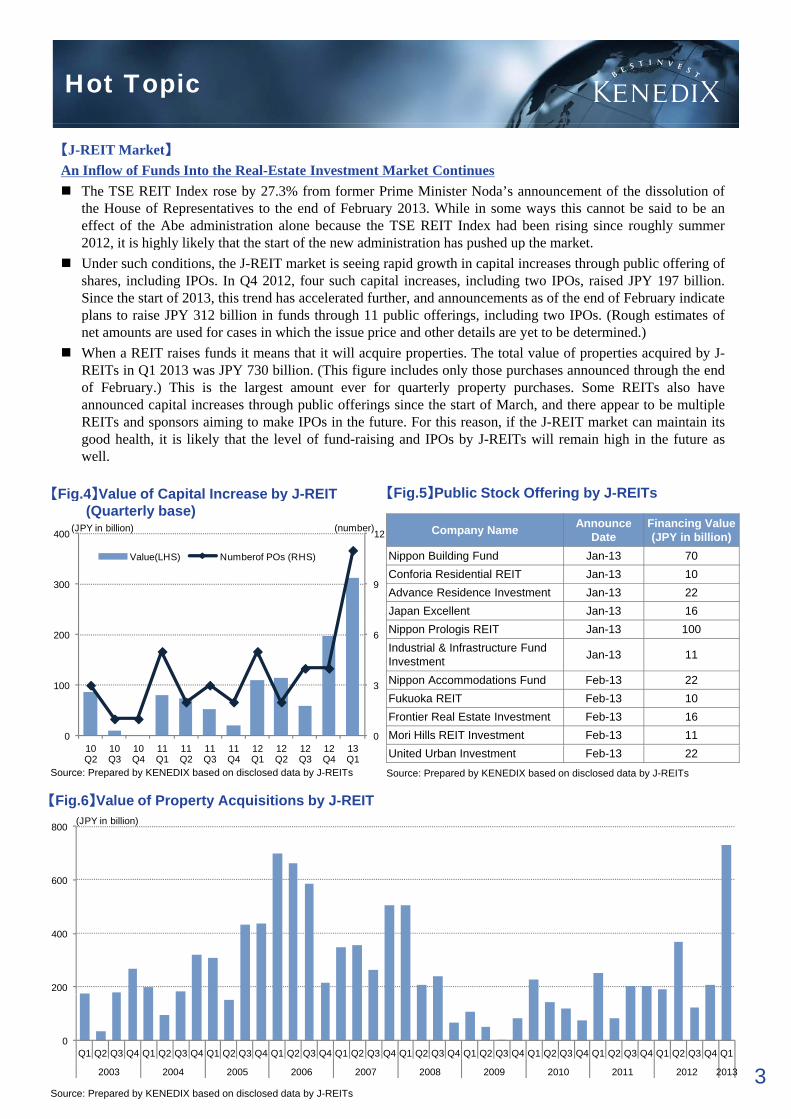
The TSE REIT Index rose by 27.3% from former Prime Minister Noda’s announcement of the dissolution ofthe House of Representatives to the end of February 2013. While in some ways this cannot be said to be aneffect of the Abe administration alone because the TSE REIT Index had been rising since roughly summer2012, it is highly likely that the start of the new administration has pushed up the market., g y y p pUnder such conditions, the J-REIT market is seeing rapid growth in capital increases through public offering ofshares, including IPOs. In Q4 2012, four such capital increases, including two IPOs, raised JPY 197 billion.Since the start of 2013, this trend has accelerated further, and announcements as of the end of February indicateplans to raise JPY 312 billion in funds through 11 public offerings, including two IPOs. (Rough estimates ofnet amounts are used for cases in which the issue price and other details are yet to be determined.)When a REIT raises funds it means that it will acquire properties. The total value of properties acquired by J-REITs in Q1 2013 was JPY 730 billion (This figure includes only those purchases announced through the endREITs in Q1 2013 was JPY 730 billion. (This figure includes only those purchases announced through the endof February.) This is the largest amount ever for quarterly property purchases. Some REITs also haveannounced capital increases through public offerings since the start of March, and there appear to be multipleREITs and sponsors aiming to make IPOs in the future. For this reason, if the J-REIT market can maintain itsgood health, it is likely that the level of fund-raising and IPOs by J-REITs will remain high in the future aswell.
【Fig.5】Public Stock Offering by J-REITs【Fig.4】Value of Capital Increase by J-REIT
9
12
300
400 (number)
Value(LHS) Numberof POs (RHS)
(JPY in billion)
【Fig.5】Public Stock Offering by J REITs【Fig.4】Value of Capital Increase by J REIT(Quarterly base)
Company Name Announce Date
Financing Value (JPY in billion)
Nippon Building Fund Jan-13 70Conforia Residential REIT Jan-13 10Advance Residence Investment Jan-13 22Japan Excellent Jan-13 16
0
3
6
0
100
200
10 10 10 11 11 11 11 12 12 12 12 13
Nippon Prologis REIT Jan-13 100Industrial & Infrastructure Fund Investment Jan-13 11
Nippon Accommodations Fund Feb-13 22Fukuoka REIT Feb-13 10Frontier Real Estate Investment Feb-13 16Mori Hills REIT Investment Feb-13 11
10 Q2
10 Q3
10 Q4
11 Q1
11 Q2
11 Q3
11 Q4
12 Q1
12 Q2
12 Q3
12 Q4
13 Q1
【Fig.6】Value of Property Acquisitions by J-REIT
Source: Prepared by KENEDIX based on disclosed data by J-REITs
800 (JPY in billion)
United Urban Investment Feb-13 22
Source: Prepared by KENEDIX based on disclosed data by J-REITs
200
400
600
3
0Q1 Q2 Q3 Q4 Q1 Q2 Q3 Q4 Q1 Q2 Q3 Q4 Q1 Q2 Q3 Q4 Q1 Q2 Q3 Q4 Q1 Q2 Q3 Q4 Q1 Q2 Q3 Q4 Q1 Q2 Q3 Q4 Q1 Q2 Q3 Q4 Q1 Q2 Q3 Q4 Q1
2003 2004 2005 2006 2007 2008 2009 2010 2011 2012 2013
Source: Prepared by KENEDIX based on disclosed data by J-REITs
Hot Topic
【Rental Office Market】A Rental Office Market Characterized by Increased Relocation Demand
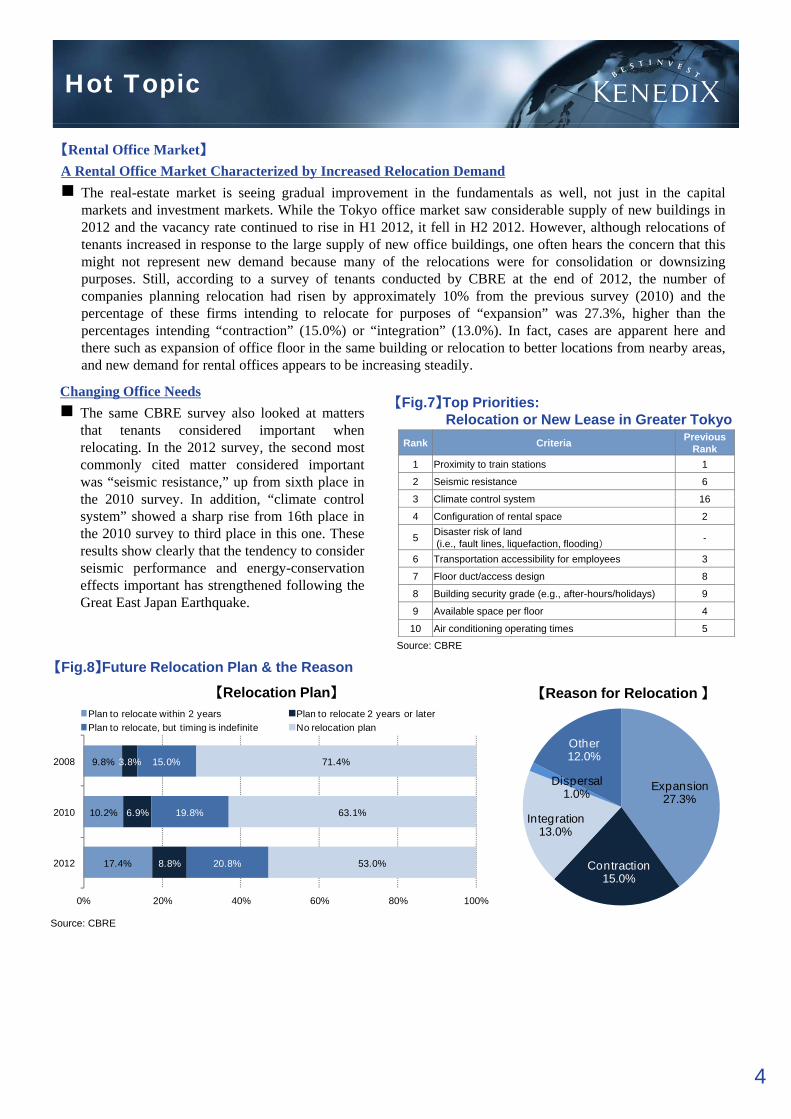
The real-estate market is seeing gradual improvement in the fundamentals as well, not just in the capitalmarkets and investment markets. While the Tokyo office market saw considerable supply of new buildings in2012 and the vacancy rate continued to rise in H1 2012, it fell in H2 2012. However, although relocations oftenants increased in response to the large supply of new office buildings, one often hears the concern that thistenants increased in response to the large supply of new office buildings, one often hears the concern that thismight not represent new demand because many of the relocations were for consolidation or downsizingpurposes. Still, according to a survey of tenants conducted by CBRE at the end of 2012, the number ofcompanies planning relocation had risen by approximately 10% from the previous survey (2010) and thepercentage of these firms intending to relocate for purposes of “expansion” was 27.3%, higher than thepercentages intending “contraction” (15.0%) or “integration” (13.0%). In fact, cases are apparent here andthere such as expansion of office floor in the same building or relocation to better locations from nearby areas,and new demand for rental offices appears to be increasing steadily.
Changing Office NeedsThe same CBRE survey also looked at mattersthat tenants considered important whenrelocating. In the 2012 survey, the second mostcommonly cited matter considered importantwas “seismic resistance,” up from sixth place inth 2010 I dditi “ li t t l
pp g y
Rank Criteria Previous Rank
1 Proximity to train stations 1
2 Seismic resistance 6
3 Cli t t l t 16
【Fig.7】Top Priorities:Relocation or New Lease in Greater Tokyo
the 2010 survey. In addition, “climate controlsystem” showed a sharp rise from 16th place inthe 2010 survey to third place in this one. Theseresults show clearly that the tendency to considerseismic performance and energy-conservationeffects important has strengthened following theGreat East Japan Earthquake.
3 Climate control system 16
4 Configuration of rental space 2
5 Disaster risk of land(i.e., fault lines, liquefaction, flooding) -
6 Transportation accessibility for employees 3
7 Floor duct/access design 8
8 Building security grade (e.g., after-hours/holidays) 9
9 Available space per floor 4
【Fig.8】Future Relocation Plan & the Reason
10 Air conditioning operating times 5
【Relocation Plan】 【Reason for Relocation 】
Source: CBRE
Other
Plan to relocate within 2 years Plan to relocate 2 years or laterPlan to relocate, but timing is indefinite No relocation plan
Expansion27.3%
Contraction
Integration13.0%
Dispersal1.0%
Other12.0%9.8%
10.2%
17.4%
3.8%
6.9%
8.8%
15.0%
19.8%
20.8%
71.4%
63.1%
53.0%
2008
2010
201215.0%
Source: CBRE
0% 20% 40% 60% 80% 100%
4
Market View
MarketMarket ViewViewThe Real Estate Investment Market and the Senior Residential Market
As ways of living for senior citizens are a subject of discussion amid a rapidly growing senior population, theMinistry of Land, Infrastructure, Transport and Tourism (MLIT) of Japan has established the Committee on theUtilization and Stability of Real Estate Securitization Scheme for the Promotion of Healthcare Facilities , and
di i h di i f i h bli h f h l h h b d dstudies on preparing the conditions for encouraging the establishment of healthcare REITs have been advanced.In the committee’s discussions, a variety of issues have arisen concerning treatment of healthcare facilities asinvestment assets of real-estate funds. While healthcare REITs account for approximately 12% of the entireREIT market (by market capitalization) in the U.S., in Japan only some REITs own a small number ofhealthcare facilities. This report shows summarized views on matters such as the current state of the seniorresidential market, which is likely to be a central element of healthcare facilities, and problems related to realestate funds involving healthcare facilities.
E t bli h t f H lth REIT W ld B 【Fig.9】Number of Certified Person for Long-term Care(Support) needs & Capacity of Private Nursing Home
Establishment of Healthcare REITs Would BeDesirable
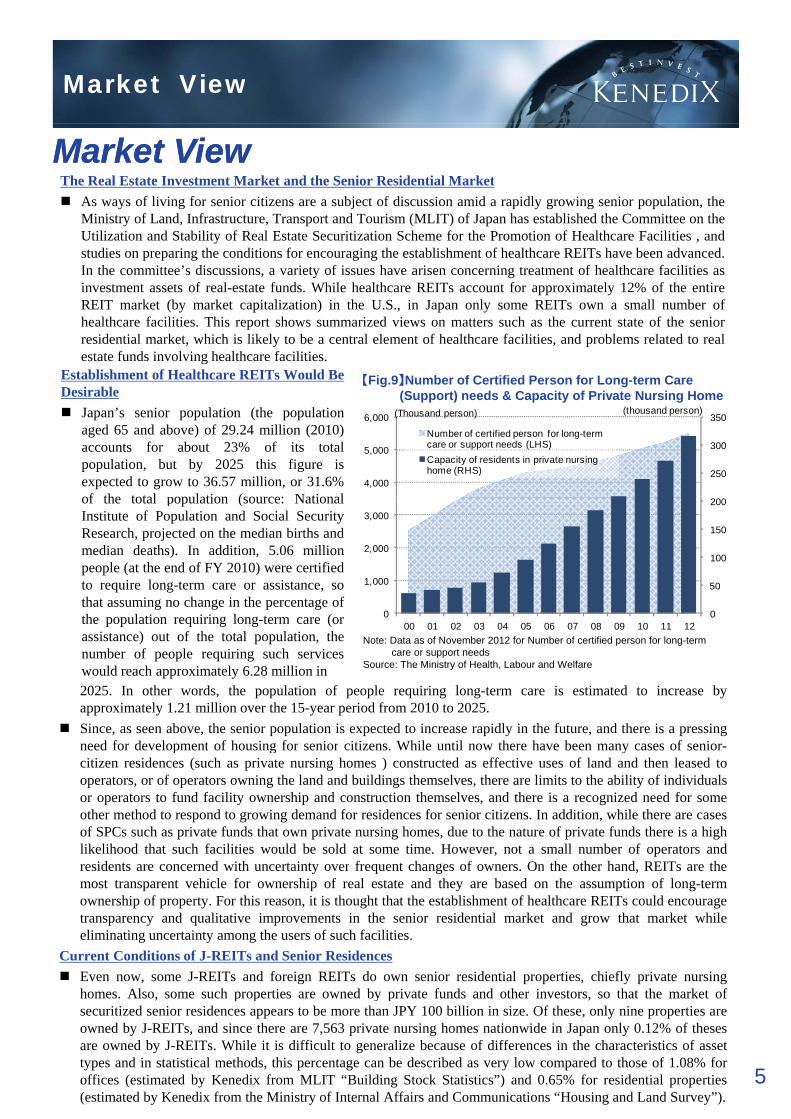
Japan’s senior population (the populationaged 65 and above) of 29.24 million (2010)accounts for about 23% of its totalpopulation, but by 2025 this figure isexpected to grow to 36.57 million, or 31.6%f th t t l l ti ( N ti l
250
300
350
4,000
5,000
6,000(thousand person)(Thousand person)
Number of certified person for long-term care or support needs (LHS)Capacity of residents in private nursing home (RHS)
of the total population (source: NationalInstitute of Population and Social SecurityResearch, projected on the median births andmedian deaths). In addition, 5.06 millionpeople (at the end of FY 2010) were certifiedto require long-term care or assistance, sothat assuming no change in the percentage ofthe population requiring long-term care (or 0
50
100
150
200
0
1,000
2,000
3,000
Note: Data as of November 2012 for Number of certified person for long-term care or support needs
Source: The Ministry of Health, Labour and Welfare
the population requiring long-term care (orassistance) out of the total population, thenumber of people requiring such serviceswould reach approximately 6.28 million in2025. In other words, the population of people requiring long-term care is estimated to increase byapproximately 1.21 million over the 15-year period from 2010 to 2025.Since, as seen above, the senior population is expected to increase rapidly in the future, and there is a pressingneed for development of housing for senior citizens While until now there have been many cases of senior
00 01 02 03 04 05 06 07 08 09 10 11 12
need for development of housing for senior citizens. While until now there have been many cases of senior-citizen residences (such as private nursing homes ) constructed as effective uses of land and then leased tooperators, or of operators owning the land and buildings themselves, there are limits to the ability of individualsor operators to fund facility ownership and construction themselves, and there is a recognized need for someother method to respond to growing demand for residences for senior citizens. In addition, while there are casesof SPCs such as private funds that own private nursing homes, due to the nature of private funds there is a highlikelihood that such facilities would be sold at some time. However, not a small number of operators andresidents are concerned with uncertainty over frequent changes of owners. On the other hand, REITs are theresidents are concerned with uncertainty over frequent changes of owners. On the other hand, REITs are themost transparent vehicle for ownership of real estate and they are based on the assumption of long-termownership of property. For this reason, it is thought that the establishment of healthcare REITs could encouragetransparency and qualitative improvements in the senior residential market and grow that market whileeliminating uncertainty among the users of such facilities.
Current Conditions of J-REITs and Senior ResidencesEven now, some J-REITs and foreign REITs do own senior residential properties, chiefly private nursinghomes Also some such properties are owned by private funds and other investors so that the market of
5
homes. Also, some such properties are owned by private funds and other investors, so that the market ofsecuritized senior residences appears to be more than JPY 100 billion in size. Of these, only nine properties areowned by J-REITs, and since there are 7,563 private nursing homes nationwide in Japan only 0.12% of thesesare owned by J-REITs. While it is difficult to generalize because of differences in the characteristics of assettypes and in statistical methods, this percentage can be described as very low compared to those of 1.08% foroffices (estimated by Kenedix from MLIT “Building Stock Statistics”) and 0.65% for residential properties(estimated by Kenedix from the Ministry of Internal Affairs and Communications “Housing and Land Survey”).
Market View
Company Name Properties Prefecture Completion Year
Acquisition value
Appraisal value (in the end of
Previous fiscal year)
NOI Yield (based on
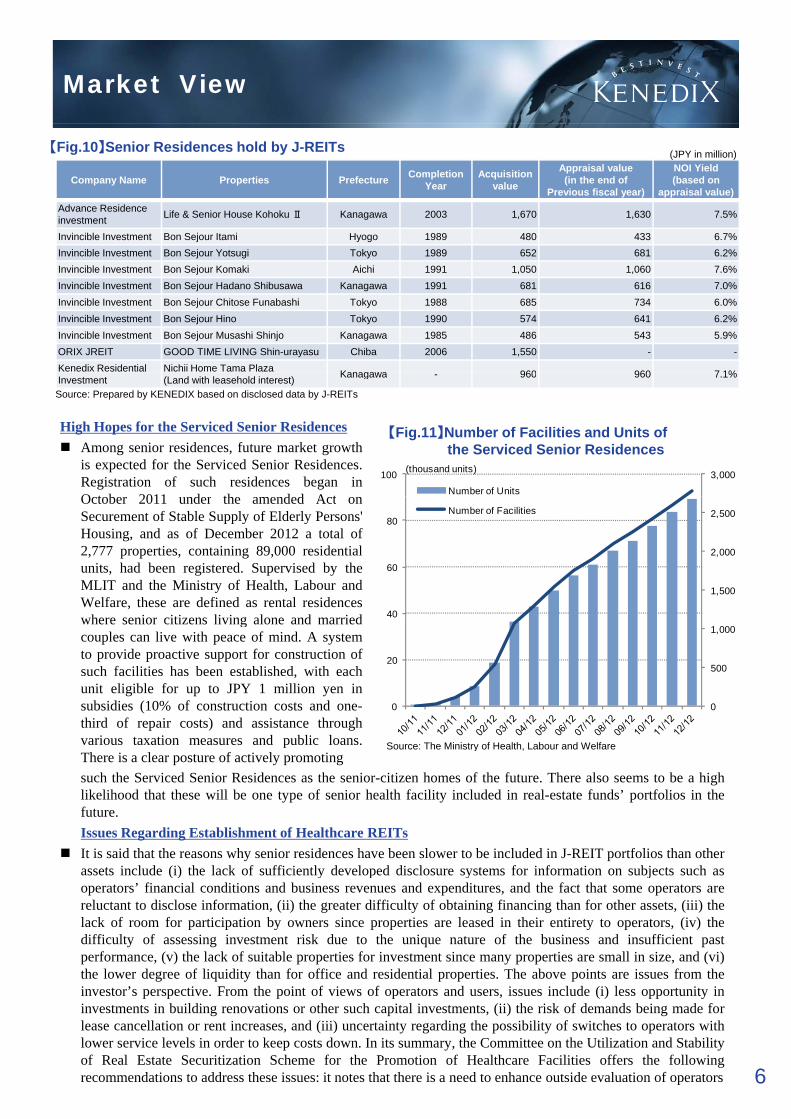
appraisal value)Advance Residence investment Life & Senior House Kohoku Ⅱ Kanagawa 2003 1,670 1,630 7.5%
Invincible Investment Bon Sejour Itami Hyogo 1989 480 433 6.7%
【Fig.10】Senior Residences hold by J-REITs (JPY in million)
Invincible Investment Bon Sejour Yotsugi Tokyo 1989 652 681 6.2%Invincible Investment Bon Sejour Komaki Aichi 1991 1,050 1,060 7.6%Invincible Investment Bon Sejour Hadano Shibusawa Kanagawa 1991 681 616 7.0%Invincible Investment Bon Sejour Chitose Funabashi Tokyo 1988 685 734 6.0%Invincible Investment Bon Sejour Hino Tokyo 1990 574 641 6.2%Invincible Investment Bon Sejour Musashi Shinjo Kanagawa 1985 486 543 5.9%ORIX JREIT GOOD TIME LIVING Shin-urayasu Chiba 2006 1,550 - -Kenedix Residential Nichii Home Tama Plaza Kanagawa 960 960 7 1%Investment (Land with leasehold interest) Kanagawa - 960 960 7.1%
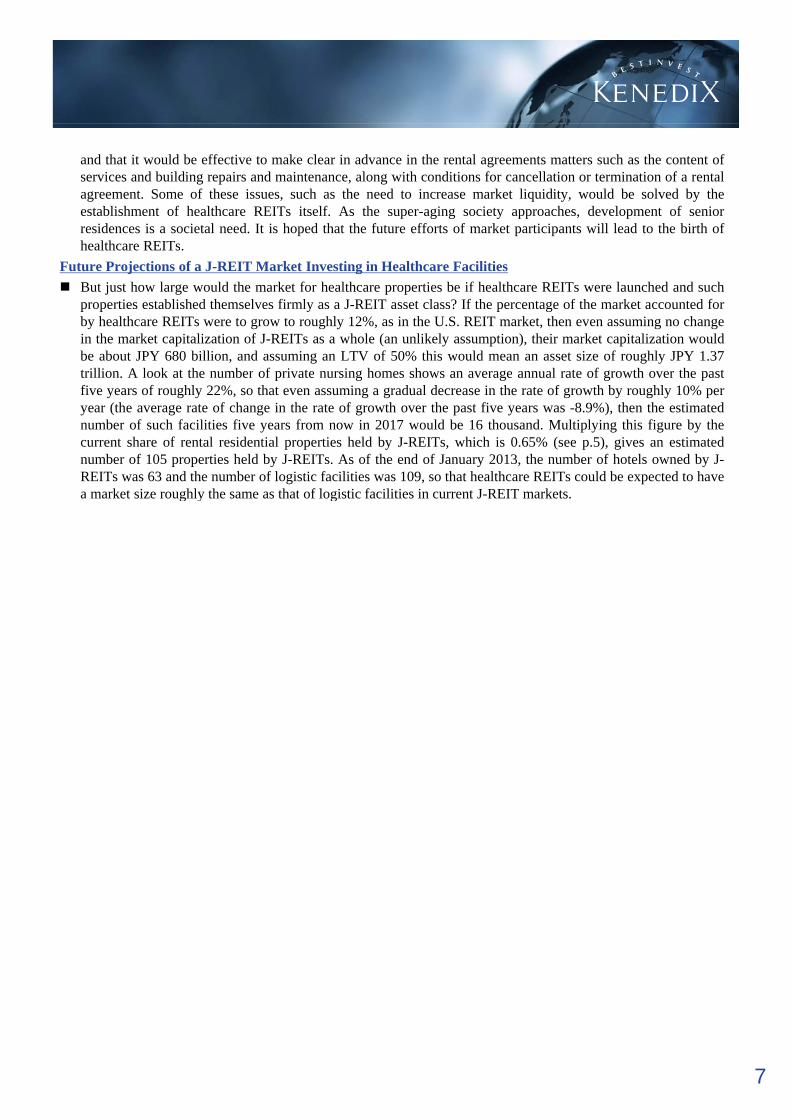
High Hopes for the Serviced Senior ResidencesAmong senior residences, future market growthis expected for the Serviced Senior Residences.Registration of such residences began inO t b 2011 d th d d A t
【Fig.11】Number of Facilities and Units ofthe Serviced Senior Residences
3,000100 (thousand units)
Number of Units
Source: Prepared by KENEDIX based on disclosed data by J-REITs
October 2011 under the amended Act onSecurement of Stable Supply of Elderly Persons'Housing, and as of December 2012 a total of2,777 properties, containing 89,000 residentialunits, had been registered. Supervised by theMLIT and the Ministry of Health, Labour andWelfare, these are defined as rental residenceswhere senior citizens living alone and married
1,500
2,000
2,500
40
60
80Number of Facilities
where senior citizens living alone and marriedcouples can live with peace of mind. A systemto provide proactive support for construction ofsuch facilities has been established, with eachunit eligible for up to JPY 1 million yen insubsidies (10% of construction costs and one-third of repair costs) and assistance throughvarious taxation measures and public loans. Source: The Ministry of Health Labour and Welfare
0
500
1,000
0
20
pThere is a clear posture of actively promotingsuch the Serviced Senior Residences as the senior-citizen homes of the future. There also seems to be a highlikelihood that these will be one type of senior health facility included in real-estate funds’ portfolios in thefuture.Issues Regarding Establishment of Healthcare REITsIt is said that the reasons why senior residences have been slower to be included in J-REIT portfolios than otherassets include (i) the lack of sufficiently developed disclosure systems for information on subjects such as
Source: The Ministry of Health, Labour and Welfare
assets include (i) the lack of sufficiently developed disclosure systems for information on subjects such asoperators’ financial conditions and business revenues and expenditures, and the fact that some operators arereluctant to disclose information, (ii) the greater difficulty of obtaining financing than for other assets, (iii) thelack of room for participation by owners since properties are leased in their entirety to operators, (iv) thedifficulty of assessing investment risk due to the unique nature of the business and insufficient pastperformance, (v) the lack of suitable properties for investment since many properties are small in size, and (vi)the lower degree of liquidity than for office and residential properties. The above points are issues from theinvestor’s perspective From the point of views of operators and users issues include (i) less opportunity in
6
investor s perspective. From the point of views of operators and users, issues include (i) less opportunity ininvestments in building renovations or other such capital investments, (ii) the risk of demands being made forlease cancellation or rent increases, and (iii) uncertainty regarding the possibility of switches to operators withlower service levels in order to keep costs down. In its summary, the Committee on the Utilization and Stabilityof Real Estate Securitization Scheme for the Promotion of Healthcare Facilities offers the followingrecommendations to address these issues: it notes that there is a need to enhance outside evaluation of operators
and that it would be effective to make clear in advance in the rental agreements matters such as the content ofservices and building repairs and maintenance, along with conditions for cancellation or termination of a rentalagreement. Some of these issues, such as the need to increase market liquidity, would be solved by theestablishment of healthcare REITs itself. As the super-aging society approaches, development of seniorresidences is a societal need. It is hoped that the future efforts of market participants will lead to the birth ofhealthcare REITshealthcare REITs.
Future Projections of a J-REIT Market Investing in Healthcare FacilitiesBut just how large would the market for healthcare properties be if healthcare REITs were launched and suchproperties established themselves firmly as a J-REIT asset class? If the percentage of the market accounted forby healthcare REITs were to grow to roughly 12%, as in the U.S. REIT market, then even assuming no changein the market capitalization of J-REITs as a whole (an unlikely assumption), their market capitalization wouldbe about JPY 680 billion, and assuming an LTV of 50% this would mean an asset size of roughly JPY 1.37trillion A look at the number of private nursing homes shows an average annual rate of growth over the pasttrillion. A look at the number of private nursing homes shows an average annual rate of growth over the pastfive years of roughly 22%, so that even assuming a gradual decrease in the rate of growth by roughly 10% peryear (the average rate of change in the rate of growth over the past five years was -8.9%), then the estimatednumber of such facilities five years from now in 2017 would be 16 thousand. Multiplying this figure by thecurrent share of rental residential properties held by J-REITs, which is 0.65% (see p.5), gives an estimatednumber of 105 properties held by J-REITs. As of the end of January 2013, the number of hotels owned by J-REITs was 63 and the number of logistic facilities was 109, so that healthcare REITs could be expected to havea market size roughly the same as that of logistic facilities in current J-REIT marketsa market size roughly the same as that of logistic facilities in current J REIT markets.
7
Real Estate Investment Market
Commercial Property Transaction
300%
400%
500%
800
1,000
1,200 (billion in yen)
Transaction volume (LHS) % change YoY (RHS)
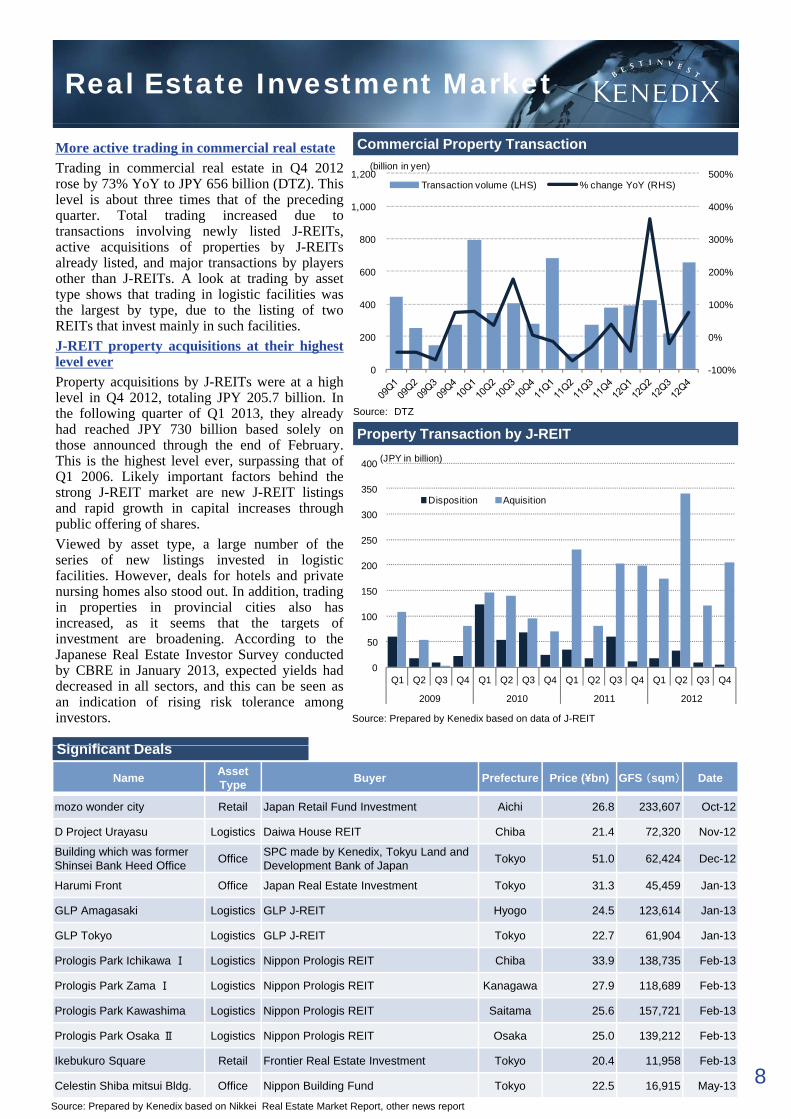
More active trading in commercial real estateTrading in commercial real estate in Q4 2012rose by 73% YoY to JPY 656 billion (DTZ). Thislevel is about three times that of the precedingquarter. Total trading increased due totransactions involving newly listed J-REITs,active acquisitions of properties by J-REITs
-100%
0%
100%
200%
0
200
400
600
active acquisitions of properties by J-REITsalready listed, and major transactions by playersother than J-REITs. A look at trading by assettype shows that trading in logistic facilities wasthe largest by type, due to the listing of twoREITs that invest mainly in such facilities.J-REIT property acquisitions at their highestlevel ever
Property Transaction by J-REITSource: DTZ
100%0
350
400 (JPY in billion)
Di iti A i iti
Property acquisitions by J-REITs were at a highlevel in Q4 2012, totaling JPY 205.7 billion. Inthe following quarter of Q1 2013, they alreadyhad reached JPY 730 billion based solely onthose announced through the end of February.This is the highest level ever, surpassing that ofQ1 2006. Likely important factors behind thestrong J-REIT market are new J-REIT listings
100
150
200
250
300Disposition Aquisition
strong J REIT market are new J REIT listingsand rapid growth in capital increases throughpublic offering of shares.Viewed by asset type, a large number of theseries of new listings invested in logisticfacilities. However, deals for hotels and privatenursing homes also stood out. In addition, tradingin properties in provincial cities also hasincreased as it seems that the targets of
Si ifi t D l
Source: Prepared by Kenedix based on data of J-REIT
0
50
Q1 Q2 Q3 Q4 Q1 Q2 Q3 Q4 Q1 Q2 Q3 Q4 Q1 Q2 Q3 Q4
2009 2010 2011 2012
increased, as it seems that the targets ofinvestment are broadening. According to theJapanese Real Estate Investor Survey conductedby CBRE in January 2013, expected yields haddecreased in all sectors, and this can be seen asan indication of rising risk tolerance amonginvestors.
Significant Deals
Name Asset Type Buyer Prefecture Price (¥bn) GFS (sqm) Date
mozo wonder city Retail Japan Retail Fund Investment Aichi 26.8 233,607 Oct-12
D Project Urayasu Logistics Daiwa House REIT Chiba 21.4 72,320 Nov-12
Building which was former Shinsei Bank Heed Office Office SPC made by Kenedix, Tokyu Land and
Development Bank of Japan Tokyo 51.0 62,424 Dec-12p p
Harumi Front Office Japan Real Estate Investment Tokyo 31.3 45,459 Jan-13
GLP Amagasaki Logistics GLP J-REIT Hyogo 24.5 123,614 Jan-13
GLP Tokyo Logistics GLP J-REIT Tokyo 22.7 61,904 Jan-13
Prologis Park Ichikawa Ⅰ Logistics Nippon Prologis REIT Chiba 33.9 138,735 Feb-13
Prologis Park Zama Ⅰ Logistics Nippon Prologis REIT Kanagawa 27.9 118,689 Feb-13
Source: Prepared by Kenedix based on Nikkei Real Estate Market Report, other news report
8
Prologis Park Kawashima Logistics Nippon Prologis REIT Saitama 25.6 157,721 Feb-13
Prologis Park Osaka Ⅱ Logistics Nippon Prologis REIT Osaka 25.0 139,212 Feb-13
Ikebukuro Square Retail Frontier Real Estate Investment Tokyo 20.4 11,958 Feb-13
Celestin Shiba mitsui Bldg. Office Nippon Building Fund Tokyo 22.5 16,915 May-13
J-REIT Market
140
160
180Topix TSE REIT Topix Real Estate
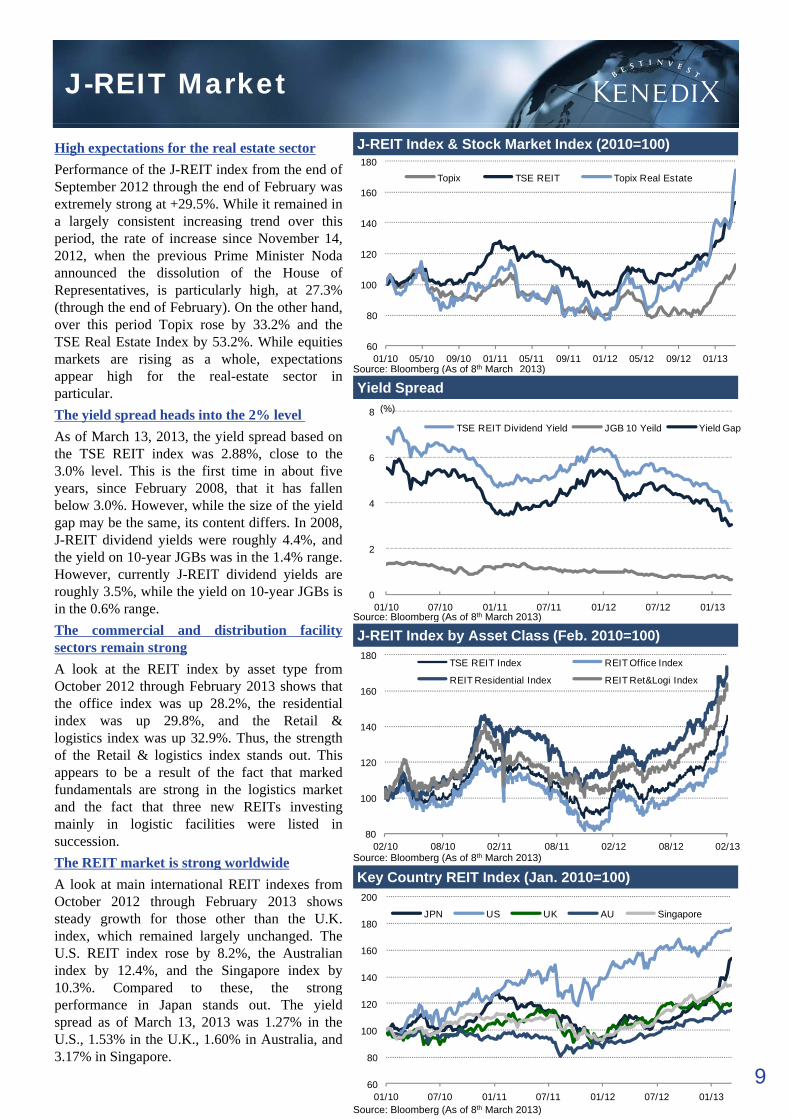
J-REIT Index & Stock Market Index (2010=100)High expectations for the real estate sectorPerformance of the J-REIT index from the end ofSeptember 2012 through the end of February wasextremely strong at +29.5%. While it remained ina largely consistent increasing trend over thisperiod, the rate of increase since November 14,
60
80
100
120
01/10 05/10 09/10 01/11 05/11 09/11 01/12 05/12 09/12 01/13Source: Bloomberg (As of 8th March 2013)
2012, when the previous Prime Minister Nodaannounced the dissolution of the House ofRepresentatives, is particularly high, at 27.3%(through the end of February). On the other hand,over this period Topix rose by 33.2% and theTSE Real Estate Index by 53.2%. While equitiesmarkets are rising as a whole, expectations
hi h f th l t t t i
6
8 (%)
TSE REIT Dividend Yield JGB 10 Yeild Yield Gap
Sou ce oo be g ( s o 8 a c 0 3)
Yield Spreadappear high for the real-estate sector inparticular.The yield spread heads into the 2% levelAs of March 13, 2013, the yield spread based onthe TSE REIT index was 2.88%, close to the3.0% level. This is the first time in about fiveyears, since February 2008, that it has fallen
0
2
4
01/10 07/10 01/11 07/11 01/12 07/12 01/13Source: Bloomberg (As of 8th March 2013)
below 3.0%. However, while the size of the yieldgap may be the same, its content differs. In 2008,J-REIT dividend yields were roughly 4.4%, andthe yield on 10-year JGBs was in the 1.4% range.However, currently J-REIT dividend yields areroughly 3.5%, while the yield on 10-year JGBs isin the 0.6% range.
140
160
180TSE REIT Index REIT Office Index
REIT Residential Index REIT Ret&Logi Index
J-REIT Index by Asset Class (Feb. 2010=100)g ( )
The commercial and distribution facilitysectors remain strongA look at the REIT index by asset type fromOctober 2012 through February 2013 shows thatthe office index was up 28.2%, the residentialindex was up 29.8%, and the Retail &logistics index was up 32.9%. Thus, the strength
80
100
120
02/10 08/10 02/11 08/11 02/12 08/12 02/13Source: Bloomberg (As of 8th March 2013)
of the Retail & logistics index stands out. Thisappears to be a result of the fact that markedfundamentals are strong in the logistics marketand the fact that three new REITs investingmainly in logistic facilities were listed insuccession.The REIT market is strong worldwide
140
160
180
200
JPN US UK AU Singapore
Key Country REIT Index (Jan. 2010=100)g
A look at main international REIT indexes fromOctober 2012 through February 2013 showssteady growth for those other than the U.K.index, which remained largely unchanged. TheU.S. REIT index rose by 8.2%, the Australianindex by 12.4%, and the Singapore index by10.3%. Compared to these, the strong
60
80
100
120
01/10 07/10 01/11 07/11 01/12 07/12 01/13
9Source: Bloomberg (As of 8th March 2013)
p , gperformance in Japan stands out. The yieldspread as of March 13, 2013 was 1.27% in theU.S., 1.53% in the U.K., 1.60% in Australia, and3.17% in Singapore.
Office market : Tokyo
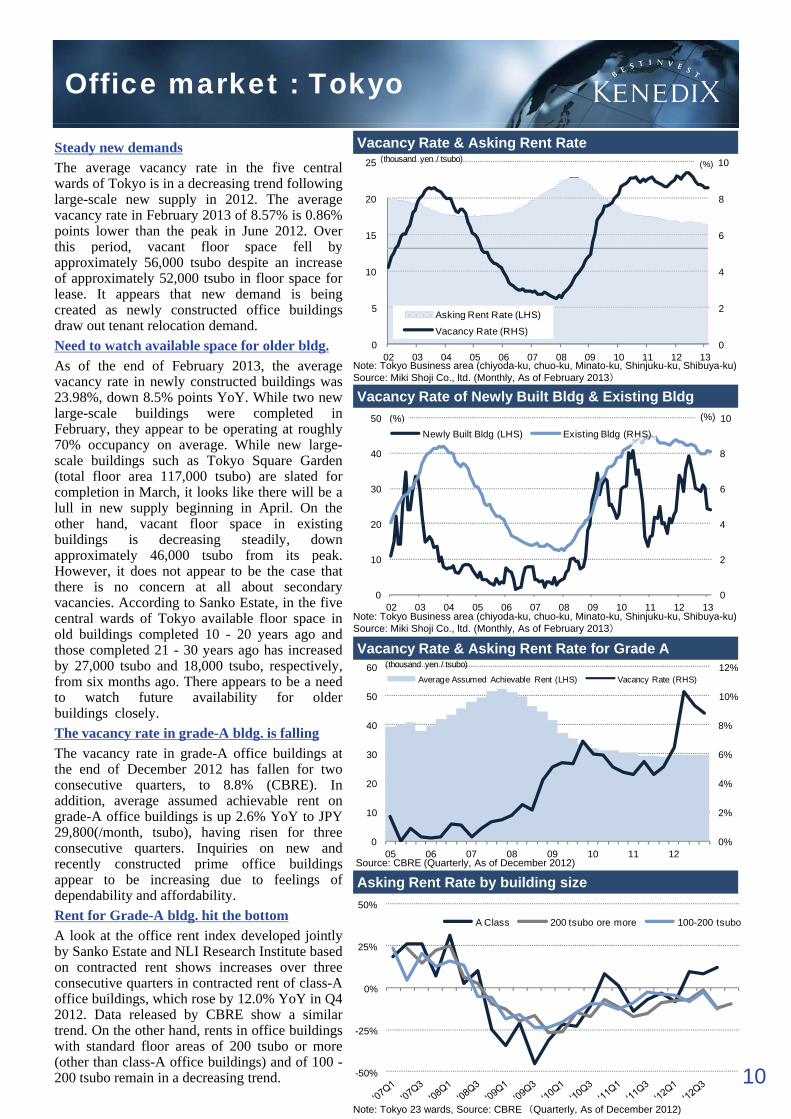
Vacancy Rate & Asking Rent RateSteady new demandsThe average vacancy rate in the five centralwards of Tokyo is in a decreasing trend followinglarge-scale new supply in 2012. The averagevacancy rate in February 2013 of 8.57% is 0.86%points lower than the peak in June 2012. Overthis period vacant floor space fell by
6
8
10
15
20
25 (%)(thousand yen / tsubo)
Note: Tokyo Business area (chiyoda-ku, chuo-ku, Minato-ku, Shinjuku-ku, Shibuya-ku)
this period, vacant floor space fell byapproximately 56,000 tsubo despite an increaseof approximately 52,000 tsubo in floor space forlease. It appears that new demand is beingcreated as newly constructed office buildingsdraw out tenant relocation demand.Need to watch available space for older bldg.As of the end of February 2013, the average
0
2
4
0
5
10
02 03 04 05 06 07 08 09 10 11 12 13
Asking Rent Rate (LHS)
Vacancy Rate (RHS)
Vacancy Rate of Newly Built Bldg & Existing BldgSource: Miki Shoji Co., ltd. (Monthly, As of February 2013)
y , gvacancy rate in newly constructed buildings was23.98%, down 8.5% points YoY. While two newlarge-scale buildings were completed inFebruary, they appear to be operating at roughly70% occupancy on average. While new large-scale buildings such as Tokyo Square Garden(total floor area 117,000 tsubo) are slated forcompletion in March, it looks like there will be a 6
8
10
30
40
50 (%)(%)Newly Built Bldg (LHS) Existing Bldg (RHS)
Note: Tokyo Business area (chiyoda-ku, chuo-ku, Minato-ku, Shinjuku-ku, Shibuya-ku)
co p e o c , oo s e e e w belull in new supply beginning in April. On theother hand, vacant floor space in existingbuildings is decreasing steadily, downapproximately 46,000 tsubo from its peak.However, it does not appear to be the case thatthere is no concern at all about secondaryvacancies. According to Sanko Estate, in the fivecentral wards of Tokyo available floor space in
0
2
4
0
10
20
02 03 04 05 06 07 08 09 10 11 12 13
8%
10%
12%
40
50
60 (thousand yen / tsubo)
Average Assumed Achievable Rent (LHS) Vacancy Rate (RHS)
Vacancy Rate & Asking Rent Rate for Grade A
y ( y j y )Source: Miki Shoji Co., ltd. (Monthly, As of February 2013)
central wards of Tokyo available floor space inold buildings completed 10 - 20 years ago andthose completed 21 - 30 years ago has increasedby 27,000 tsubo and 18,000 tsubo, respectively,from six months ago. There appears to be a needto watch future availability for olderbuildings closely.The vacancy rate in grade-A bldg. is falling
0%
2%
4%
6%
0
10
20
30
05 06 07 08 09 10 11 12Source: CBRE (Quarterly, As of December 2012)
The vacancy rate in grade-A office buildings atthe end of December 2012 has fallen for twoconsecutive quarters, to 8.8% (CBRE). Inaddition, average assumed achievable rent ongrade-A office buildings is up 2.6% YoY to JPY29,800(/month, tsubo), having risen for threeconsecutive quarters. Inquiries on new andrecently constructed prime office buildings
Asking Rent Rate by building sizey p g
appear to be increasing due to feelings ofdependability and affordability.Rent for Grade-A bldg. hit the bottomA look at the office rent index developed jointlyby Sanko Estate and NLI Research Institute basedon contracted rent shows increases over threeconsecutive quarters in contracted rent of class-A
ffi b ildi hi h b 12 0% Y Y i Q40%
25%
50%
A Class 200 tsubo ore more 100-200 tsubo
Note: Tokyo 23 wards, Source: CBRE (Quarterly, As of December 2012)
10
office buildings, which rose by 12.0% YoY in Q42012. Data released by CBRE show a similartrend. On the other hand, rents in office buildingswith standard floor areas of 200 tsubo or more(other than class-A office buildings) and of 100 -200 tsubo remain in a decreasing trend. -50%
-25%
Residential Market
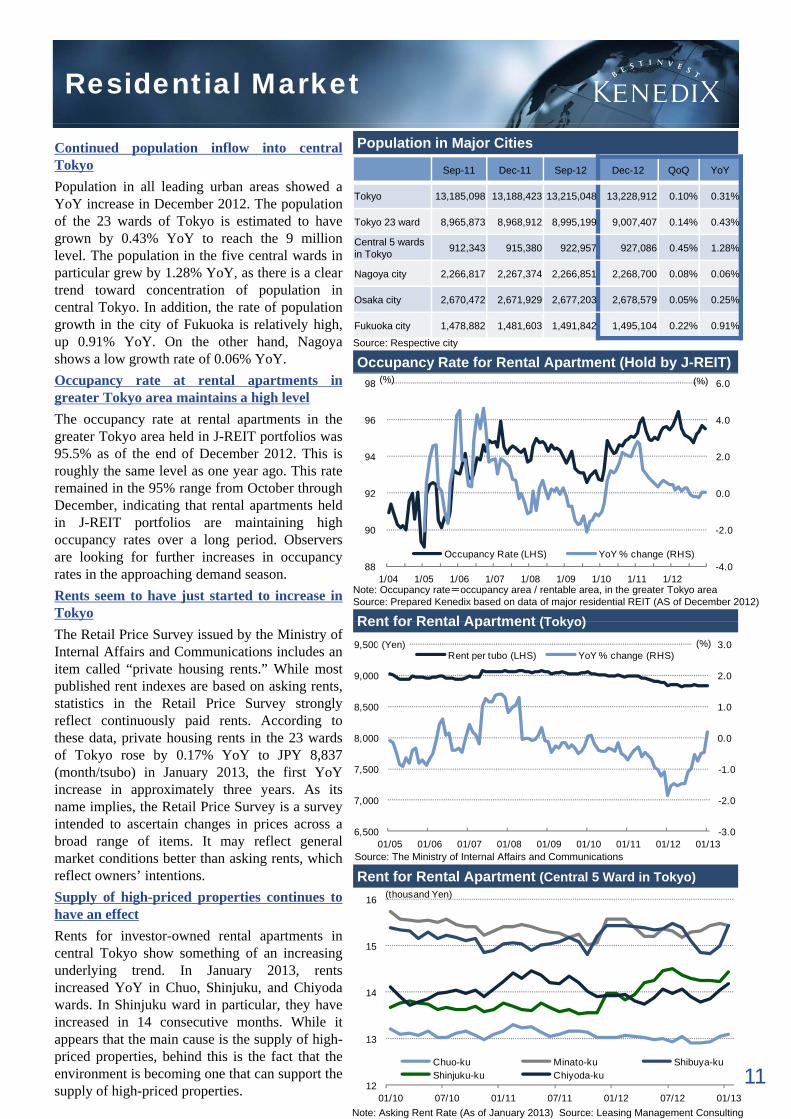
Population in Major Cities
Sep-11 Dec-11 Sep-12 Dec-12 QoQ YoY
Tokyo 13,185,098 13,188,423 13,215,048 13,228,912 0.10% 0.31%
Tokyo 23 ward 8,965,873 8,968,912 8,995,199 9,007,407 0.14% 0.43%
Central 5 wards 912 343 915 380 922 957 927 086 0 45% 1 28%
Continued population inflow into centralTokyoPopulation in all leading urban areas showed aYoY increase in December 2012. The populationof the 23 wards of Tokyo is estimated to havegrown by 0.43% YoY to reach the 9 million
Occupancy Rate for Rental Apartment (Hold by J-REIT)
in Tokyo 912,343 915,380 922,957 927,086 0.45% 1.28%
Nagoya city 2,266,817 2,267,374 2,266,851 2,268,700 0.08% 0.06%
Osaka city 2,670,472 2,671,929 2,677,203 2,678,579 0.05% 0.25%
Fukuoka city 1,478,882 1,481,603 1,491,842 1,495,104 0.22% 0.91%
Source: Respective city
level. The population in the five central wards inparticular grew by 1.28% YoY, as there is a cleartrend toward concentration of population incentral Tokyo. In addition, the rate of populationgrowth in the city of Fukuoka is relatively high,up 0.91% YoY. On the other hand, Nagoyashows a low growth rate of 0.06% YoY.Occupancy rate at rental apartments ingreater Tokyo area maintains a high levelThe occupancy rate at rental apartments in thegreater Tokyo area held in J-REIT portfolios was95.5% as of the end of December 2012. This isroughly the same level as one year ago. This rateremained in the 95% range from October through 0.0
2.0
4.0
6.0
92
94
96
98 (%)(%)
Note: Occupancy rate=occupancy area / rentable area, in the greater Tokyo areaSource: Prepared Kenedix based on data of major residential REIT (AS of December 2012)
Rent for Rental Apartment (Tokyo)
December, indicating that rental apartments heldin J-REIT portfolios are maintaining highoccupancy rates over a long period. Observersare looking for further increases in occupancyrates in the approaching demand season.Rents seem to have just started to increase inTokyo
-4.0
-2.0
0.0
88
90
92
1/04 1/05 1/06 1/07 1/08 1/09 1/10 1/11 1/12
Occupancy Rate (LHS) YoY % change (RHS)
Rent for Rental Apartment (Tokyo) The Retail Price Survey issued by the Ministry ofInternal Affairs and Communications includes anitem called “private housing rents.” While mostpublished rent indexes are based on asking rents,statistics in the Retail Price Survey stronglyreflect continuously paid rents. According tothese data, private housing rents in the 23 wards 0.0
1.0
2.0
3.0
8,000
8,500
9,000
9,500 (%)(Yen)Rent per tubo (LHS) YoY % change (RHS)
of Tokyo rose by 0.17% YoY to JPY 8,837(month/tsubo) in January 2013, the first YoYincrease in approximately three years. As itsname implies, the Retail Price Survey is a surveyintended to ascertain changes in prices across abroad range of items. It may reflect generalmarket conditions better than asking rents, which Source: The Ministry of Internal Affairs and Communications
-3.0
-2.0
-1.0
6,500
7,000
7,500
01/05 01/06 01/07 01/08 01/09 01/10 01/11 01/12 01/13
Rent for Rental Apartment (Central 5 Ward in Tokyo) reflect owners’ intentions.Supply of high-priced properties continues tohave an effectRents for investor-owned rental apartments incentral Tokyo show something of an increasingunderlying trend. In January 2013, rentsincreased YoY in Chuo, Shinjuku, and Chiyoda 14
15
16 (thousand Yen)
11Note: Asking Rent Rate (As of January 2013) Source: Leasing Management Consulting
, j , ywards. In Shinjuku ward in particular, they haveincreased in 14 consecutive months. While itappears that the main cause is the supply of high-priced properties, behind this is the fact that theenvironment is becoming one that can support thesupply of high-priced properties. 12
13
14
01/10 07/10 01/11 07/11 01/12 07/12 01/13
Chuo-ku Minato-ku Shibuya-kuShinjuku-ku Chiyoda-ku

Logistics / Retail
15%
20%
6.0
7.0 Asking Rent Rate (LHS)Vacancy Rate for Existing Facility (RHS)Average Vacancy Rate (RHS)
(thousand yen)Asking Rent & Vacancy Rate for LogisticsVacancy rates are at record lows
The vacancy rate in large-scale, multi-tenantlogistic facilities in the greater Tokyo area fell by0.9% points from the previous quarter to 3.7% inQ4 2012. This is the lowest level since the surveybegan (CBRE). In addition, asking rents onmedium large facilities in Tokyo increased for
0%
5%
10%
3.0
4.0
5.0
05 06 07 08 09 10 11 12Source: CBRE (Quarterly for Vacancy Rate Half yearly for Rent Rate)
medium-large facilities in Tokyo increased forthe second consecutive half period, to JPY 5,470(month/tsubo). The balance between supply anddemand appears to be getting even tighter asinquiries are strong from Internet retailers andother firms.localized excess supply requires cautionNew supply from November 2012 through Source: CBRE (Quarterly for Vacancy Rate, Half-yearly for Rent Rate)
Supply-Demand Balance in Tokyo Area for Logistics
pp y gJanuary 2013 was 43,000 square meters, whilenew demand was 70,000 square meters. Newlysupplied facilities appear to be operating at highoccupancy, and existing facilities appear to havefilled vacancies as well. New supply in 2013 isprojected to be approximately 280,000 tsubo,more than double the average over the past fiveyears of 136,000 tsubo (CBRE). For this reason, 200
300
400 (thousand sqm)
New Supply New Demand
S I hi R l E t t S i C Ltd
years of 136,000 tsubo (CBRE). For this reason,there probably is a possibility that the balancebetween supply and demand could worsen insome areas. In addition, a succession of newdevelopment projects have been announced,including Mitsui Fudosan’s plans to invest JPY200 billion in logistic facilities, so that the highlevel of supply is expected to continue in 2014 aswell
0
100
200
Asking Rent Rate for Retail Property (ground floor)Source: Ichigo Real Estate Service Co, Ltd.well.
Retail store’s vacancy are decreasingA survey by BAC Urban Projects of retail rentsshows that available properties in the maincommercial areas fell in Q3 2012 for the secondconsecutive quarter, an indication of animproving balance between supply and demand.Asking rents on first floor retail stores decreased
40
50
60(thousand yen)
Source: Nikkei Real Estate Market report (Quarterly, As of Q3 2012)
Asking rents on first-floor retail stores decreasedin the four areas other than Shinjuku. Achievedrents are strong in Ginza and Omotesando, andthis appears to be a result of progress in leasingstores along main streets. Asking rents have risenrapidly in the Shinjuku area, possibly due to thestart of leasing in high-priced areas.Positive signs in consumption trend
10
20
30
09Q4 10Q1 10Q2 10Q3 10Q4 11Q1 11Q2 11Q3 11Q4 12Q1 12Q2 12Q3
Ginza Omotesando ShinjukuShibuya Ikebukuro
Source: Nikkei Real Estate Market report (Quarterly, As of Q3 2012)
Retail Sales (YOY % change)Retail sales continue to experience ups anddowns, and they probably could be said to haveremained largely unchanged over the past fewmonths. However, a look at their details showsgrowing sales for apparel and similar items, asconsumers appear to have begun loosening theirpurse strings. In addition, the ConsumerConfidence Index announced by the Cabinet 0
5
10
15 (%)Existing Shopping Center Department Store
Overall Retail Sales
Source: Japan Council of Shopping Centers, Japan Department Stores Association,The Ministry of Economy, Trade and Industry (As of January 2013)
12
Confidence Index announced by the CabinetOffice has improved over two consecutivemonths in January and February 2013. Somecompanies have announced wage increases andsome have agreed to increases in summerbonuses, and these probably can be said to bepositive signs for consumption.
-15
-10
-5
1/08 7/08 1/09 7/09 1/10 7/10 1/11 7/11 1/12 7/12 1/13

Disclaimer
The contents of this document, including summary notes, quotes, data and other information, areprovided solely for informational purpose and not intended for the purpose of soliciting investment in,or as a recommendation to purchase or sell, any specific products.
Please be aware that matters described herein may change or cease to exist without prior notice ofPlease be aware that matters described herein may change or cease to exist without prior notice ofany kind. This document contains forward-looking statements, including anticipations of futureresults, based on current assumptions and beliefs in the light of currently available information andresources. Risks and uncertainties, both known and unknown, including those relating to interest ratefluctuations, competitive scenarios, and changing regulations or taxations, may cause Kenedix, Inc.actual results, performance, achievements and financial performance to be materially different fromthose as explicitly or implicitly expressed in this document.
With respect to any and all terms in this document, the information provided is intended to bethorough. However, no absolute assurance or warranties are given with respect to the accuracy orcompleteness thereof.
Kenedix, Inc. shall not be liable for any errors, inaccuracies, losses or damages, or for any actionstaken in reliance thereon, or undertake any obligation to publicly update the information containedin this document after the date of this document.
13