
KenAnGA SyArIAh GrOwth fund · Kenanga Syariah Growth Fund Interim Report 1 1. fund InfOrmAtIOn 1.1...
56
INTERIM REPORT For the Financial Period From 1 June 2018 to 30 November 2018 KENANGA SYARIAH GROWTH FUND
Transcript of KenAnGA SyArIAh GrOwth fund · Kenanga Syariah Growth Fund Interim Report 1 1. fund InfOrmAtIOn 1.1...

InterIm rePOrt
For the Financial Period From 1 June 2018 to 30 November 2018
KenAnGA SyArIAh GrOwth fund


KenAnGA SyArIAh GrOwth fund
Contents Page
Corporate directory ii - iiiDirectory of Manager’s Offices ivfund Information 1manager’s report 2 - 4fund Performance 5 - 7trustee’s report 8Shariah Adviser’s report 9Statement by the manager 10financial Statements 11 - 45

ii Kenanga Syariah Growth Fund Interim Report
COrPOrAte dIreCtOrymanager: Kenanga Investors Berhad (Company No. 353563-P)
Registered OfficeLevel 17, Kenanga Tower,237, Jalan Tun Razak,50400 Kuala Lumpur, Malaysia.Tel: 03-2172 2888Fax: 03-2172 2999
Business OfficeLevel 14, Kenanga Tower,237, Jalan Tun Razak,50400 Kuala Lumpur, Malaysia.Tel: 03-2172 3000Fax: 03-2172 3080E-mail:[email protected]: www.KenangaInvestors.com.my
Board of directorsDatuk Syed Ahmad Alwee Alsree (Chairman)Syed Zafilen Syed Alwee (Independent
director)Peter John Rayner (Independent director)Imran Devindran bin Abdullah (Independent
director)Ismitz Matthew De Alwis
Investment Committee Syed Zafilen Syed Alwee (Independent
member)Peter John Rayner (Independent member)Imran Devindran bin Abdullah (Independent
member)Ismitz Matthew De Alwis
Company Secretary: norliza Abd Samad (MAICSA 7011089)
Level 17, Kenanga Tower, 237, Jalan Tun Razak, 50400 Kuala Lumpur, Malaysia
external fund manager: Kenanga Islamic Investors Berhad (Company No. 451957-D)
Registered Office Level 17, Kenanga Tower,237, Jalan Tun Razak,50400 Kuala Lumpur, Malaysia.Tel: 03-2172 2888Fax: 03-2172 2999
Business Office Level 14, Kenanga Tower,237, Jalan Tun Razak,50400 Kuala Lumpur, Malaysia.Tel: 03-2172 3000Fax: 03-2172 3080
trustee: CImB Islamic trustee Berhad (Company No. 167913-M)
Registered Office Level 13, Menara CIMBJalan Stesen Sentral 2Kuala Lumpur Sentral50490 Kuala Lumpur.Tel: 03-2261 8888Fax: 03-2261 0099Website:www.cimb.com
Business Office Level 21, Menara CIMBJalan Stesen Sentral 2Kuala Lumpur Sentral50490 Kuala Lumpur.Tel: 03-2261 8888Fax: 03-2261 9889
Shariah Adviser: IBfIm (Company No. 763075-W)
Registered Office Suite 13.03, 13th FloorMenara Tan & Tan 207 Jalan Tun Razak 50400 Kuala Lumpur.
Business Office 3rd Floor, Menara Takaful MalaysiaJalan Sultan Sulaiman50000 Kuala Lumpur, Malaysia.Tel: 03-2031 1010Fax: 03-2078 5250
Kenanga Syariah Growth Fund Interim Report iii
Auditor: ernst & young (AF: 0039)
Level 23A, Menara Milenium, Jalan Damanlela, Pusat Bandar Damansara, 50490 Kuala Lumpur.Tel: 03-7495 8000 Fax: 03-2095 5332
tax Adviser: ernst & young tax Consultants Sdn Bhd (Company No. 179793-K)
Level 23A, Menara Milenium, Jalan Damanlela, Pusat Bandar Damansara, 50490 Kuala Lumpur.Tel: 03-7495 8000 Fax: 03-2095 5332
membership: federation of Investment managers malaysia (fImm)19-06-1, 6th Floor, Wisma Tune, 19, Lorong Dungun, Damansara Heights, 50490 Kuala Lumpur, Malaysia.Tel: 03-2093 2600 Fax: 03-2093 2700 Website: www.fimm.com.my

iv Kenanga Syariah Growth Fund Interim Report
dIreCtOry Of mAnAGer’S OffICeSRegional Branch Offices :
Kuala LumpurLevel 13, Kenanga Tower,237, Jalan Tun Razak,50400 Kuala Lumpur, Malaysia.Tel: 03-2172 3123 Fax: 03-2172 3133
Johor BahruLot 11.03, 11th Floor, Menara MSC CyberportNo. 5, Jalan Bukit Meldrum80300 Johor Bahru , JohorTel: 07-223 7505 / 4798 Fax: 07-223 4802
melakaNo. 25-1, Jalan Kota Laksamana 2/17Taman Kota Laksamana, Seksyen 275200 MelakaTel: 06-281 8913 / 06-282 0518Fax: 06-281 4286
Kuching1st Floor, No 71Lot 10900, Jalan Tun Jugah93350 Kuching, SarawakTel: 082-572 228 Fax: 082-572 229
KlangNo. 12, Jalan Batai Laut 3, Taman Intan41300 Klang, Selangor Darul EhsanTel: 03-3341 8818 / 03-3348 7889 Fax: 03-3341 8816
KuantanGround Floor ShopNo. B8, Jalan Tun Ismail 125000 Kuantan, Pahang.Tel : 09-514 3688Fax : 09-514 3838
Penang5.04, 5th Floor, Menara Boustead Penang No. 39, Jalan Sultan Ahmad Shah 10050 Penang. Tel : 04-210 6628Fax : 04-210 6644
IpohSuite 1, 2nd Floor,No. 63, Persiaran Greenhill,30450 Ipoh, Perak, MalaysiaTel: 05-254 7573 / 7570 / 7575Fax: 05-254 7606
miri 2nd Floor, Lot 1264, Centre Point Commercial Centre, Jalan Melayu, 98000 Miri, Sarawak Tel: 085-416 866 Fax: 085-322 340
Kota KinabaluLevel 8, Wisma Great EasternNo. 68, Jalan Gaya, 88000 Kota Kinabalu, SabahTel: 088-203 063 Fax: 088-203 062
Seremban 2nd Floor, No. 1D-2, Jalan Tuanku Munawir 70000 Seremban, Negeri Sembilan Tel: 06-761 5678 Fax: 06-761 2242
Petaling Jaya44B, Jalan SS21/35Damansara Utama47400 Petaling Jaya, SelangorTel: 03-7710 8828Fax: 03-7710 8830

Kenanga Syariah Growth Fund Interim Report 1
1. fund InfOrmAtIOn
1.1 fund name
Kenanga Syariah Growth fund (KSGf or the fund)
1.2 fund Category / type
Equity (Islamic) / Growth
1.3 Investment Objective
The Fund aims to provide unit holders with long-term capital growth by investing principally in equities that comply with Shariah requirements.
1.4 Investment Strategy
The Fund will invest principally in a diversified portfolio of Malaysian Shariah-compliant equity and Shariah-compliant equity related securities of companies with sustainable business model and trading at a discount to its intrinsic value.
1.5 duration
The Fund was launched on 29 January 2002 and shall exist as long as it appears to the Manager and the Trustee that it is in the interests of the unit holders for it to continue.
1.6 Performance Benchmark
FTSE-Bursa Malaysia Emas Shariah Index (FBMS).
1.7 distribution Policy
Income distribution is incidental, if any.
1.8 external fund manager
Kenanga Islamic Investors Berhad
1.9 Breakdown of unit holdings of KSGf as at 30 november 2018
Size of holdingsno. of
unit holdersno. of
units held5,000 and below 4,908 12,917,0675,001 - 10,000 3,611 26,874,54110,001 - 50,000 6,872 156,660,80250,001 - 500,000 1,873 199,303,830500,001 and above 35 70,275,403total 17,299 466,031,643

2 Kenanga Syariah Growth Fund Interim Report
2. mAnAGer’S rePOrt
2.1 explanation on whether the fund has achieved its investment objective
The Fund boasts a return of 329.56% since inception; hence it has achieved its investment objective of achieving consistent capital appreciation over the long term by primarily investing in Shariah-compliant securities with good growth prospects.
2.2 Comparison between the fund’s performance and performance of the benchmark
Performance Chart Since Launch (29/1/2002 - 30/11/2018)Kenanga Syariah Growth fund vs ftSe-Bursa malaysia emas Shariah Index
Source: Novagni Analytics & Advisory
2.3 Investment strategies and policies employed during the financial period under review
For the financial period under review, the Fund continued with its strategy of investing in Shariah compliant securities of companies with sustainable business models and competent management, whilst trading at a discount to their intrinsic / fair value. The Fund focused on companies whose top line / revenue should prove to be relatively more resilient to a global economic slowdown and have the ability to maintain their profit margins.
2.4 the fund’s asset allocation as at 30 november 2018 and comparison with the previous financial period
Asset 30 nov 2018 30 nov 2017Listed Shariah-compliant investment securities 83.0% 86.0%Listed Shariah non-compliant equity security (Note 14(a)) 0.2% -Unlisted Shariah-compliant investment securities - -Short term Islamic deposits and cash 16.8% 14.0%
reason for the differences in asset allocation
The fund invested level declined to 83.2% due to the fund manager taking a slightly more defensive stance.
Benchmark
Fund Category/Type
Equity (Islamic) / Growth
Launch Date
FUND OBJECTIVE
External Investment Manager / Designated Fund Manager
Syarifah Hidayatul Akmal
HISTORICAL FUND PRICE *
Annual Management Fee
1.50% p.a.
Annual Trustee Fee
0.05% p.a.
Redemption Charge
2.35
-4.17
13.29
Aims to provide unit holders with long-term capital growth by
investing principally in equities that comply with Shariah
requirements.
CUMULATIVE FUND PERFORMANCE (%) #
6 months
CALENDAR YEAR FUND PERFORMANCE (%) #
Period
1 month
Fund
-1.34 -1.18
Period
10.722017
Fund
12.96
Benchmark
1 year
3 years -6.98
-8.64
-9.68
-0.91
7.24
329.56
-4.46
-9.96
2016
2015
-2.29
9.49
NAV PER UNIT *
FUND PERFORMANCE (%)
Kenanga Syariah Growth FundDecember 2018
2018 The Edge | Thomson Reuters Lipper Fund Awards
Equity Malaysia - Malaysia Islamic, 10 years
124.54
2014
2013
Sales Charge
Max 5.50% -6.14
-1.20
20.51
FUND SIZE *
#Source : Lipper, 30 November 2018
5 years
Since Launch
-2.66
29 January 2002
Trustee
CIMB Islamic Trustee Berhad
Benchmark
FTSE Bursa Malaysia EMAS Shariah Index
Lipper Analytics15 Nov 2018
3-yearFund Volatility
Moderate
-50
0
50
100
150
200
250
300
350
400
450
Jan
02
Jun
02
De
c 0
2
Jun
03
De
c 0
3
Jun
04
De
c 0
4
Jun
05
De
c 0
5
Jun
06
De
c 0
6
Jun
07
De
c 0
7
Jun
08
De
c 0
8
Jun
09
De
c 0
9
Jun
10
De
c 1
0
Jun
11
De
c 1
1
Jun
12
De
c 1
2
Jun
13
De
c 1
3
Jun
14
De
c 1
4
Jun
15
De
c 1
5
Jun
16
De
c 1
6
Jun
17
De
c 1
7
Jun
18
No
v 1
8
% Cumulative Return, Launch to 30/11/2018
Kenanga Syariah Growth : 329.56 FTSE Bursa Malaysia Emas Shariah Index : 124.54
Source: Novagni Analytics and Advisory
1
2
3
4
5
TENAGA NASIONAL BHD
PETRONAS CHEMICALS GROUP BHD
AXIATA GROUP BHD
TOP GLOVE CORPORATION BHD
YINSON HOLDINGS BHD
8.02%
6.00%
5.36%
3.73%
3.58%
10.11 sen
10.50 sen
ASSET ALLOCATION (% NAV) *
DISTRIBUTION HISTORY *TOP EQUITY HOLDINGS (% NAV) *
-
-
8.65%
5.83%
Based on the fund’s portfolio returns as at 15 November 2018, the Volatility Factor (VF) for this fund is 7.59 and is classified as “Moderate”. (Source: Lipper). “Moderate”
includes funds with VF that are above 6.615 and less than or equal to 8.710 (source: Lipper). The VF means there is a possibility for the fund in generating an upside return or
downside return around this VF. The Volatility Class (VC) is assigned by Lipper based on quintile ranks of VF for qualified funds. VF is subject to monthly revision and VC will
be revised every six months. The fund’s portfolio may have changed since this date and there is no guarantee that the fund will continue to have the same VF or VC in the
future. Presently, only funds launched in the market for at least 36 months will display the VF and its VC. The Master Prospectus dated 30 June 2017 and the Supplemental
Prospectus (if any), its Product Highlights Sheets (“PHS”) or Supplemental Disclosure Document (“SDD”) (if any) have been registered with the Securities Commission
Malaysia, who takes no responsibility for its contents. A copy of the Master Prospectus, Supplemental Prospectus (if any), SDD (if any) and the PHS are obtainable at our
offices. Application for Units can only be made on receipt of application form referred to in and accompanying the Master Prospectus and/or Supplemental Prospectus (if any),
SDD (if any) and PHS. Investors are advised to read and understand the Master Prospectus, its PHS and any other relevant product disclosure documents involved before
investing. Investors are also advised to consider the fees and charges before investing. Unit prices and distributions may go down as well as up. Where a unit split/distribution
is declared, investors are advised that following the issue of additional units/distribution, the NAV per unit will be reduced from pre-unit split NAV/cum-distribution NAV to post-
unit split NAV/ex-distribution NAV. Where a unit split is declared, investors should note that the value of their investment in Malaysian Ringgit will remain unchanged after the
distribution of the additional units. A Fund’s track record does not guarantee its future performance. Investors are advised to read and understand the contents of the unit trust
loan financing risk disclosure statement before deciding to borrow to purchase units.“Cooling-Off Period” or “Cooling-Off Right” is not applicable to EPF Member Investment
26-Feb-15
28-May-14
RM Yield (%)
* Source: Kenanga Investors Berhad, 30 November 2018
-9.31%
Date
Gross Distribution
Unit Split
7.50 sen
16-May-16
SECTOR ALLOCATION (% NAV) *
HISTORICAL FUND PRICE *Redemption Charge
Nil RM 465.07 million
4-May-12
11-Mar-03
RM 3.0262
RM 0.8124
Highest
LowestAll fees and charges payable to the Manager and the Trustee are
subject to the goods and services tax /sales and services tax/other taxes
of similar nature as may be imposed by the government or other
authorities from time to time.
Since Inception Date
NAV PER UNIT *
RM 0.9979
FUND SIZE *
86.30%
84.30%
84.00%
13.70%
15.70%
16.00%
September
October
November
Liquidity Equity
29.5%
21.7%
16.0%
7.9%
6.4%
5.8%
5.5%
4.2%
1.0%
0.9%
1.1%
Trading and Services
Industrial Products
Short Term Islamic Deposits and Cash
Consumer Products
Technology
Properties
Construction
Finance
Infrastructure
Plantations
Others
loan financing risk disclosure statement before deciding to borrow to purchase units.“Cooling-Off Period” or “Cooling-Off Right” is not applicable to EPF Member Investment
Scheme (EPF MIS). Kenanga Investors Berhad is committed to preventing Conflict of Interest between its various businesses and activities and between its
clients/directors/shareholders and employees by having in place procedures and measures for identifying and properly managing any apparent, potential and perceived Conflict
of Interest by making disclosures to Clients, where appropriate. The Manager wishes to highlight the specific risks of the Fund are specific stock risk and reclassification of
Shariah status risk.

Kenanga Syariah Growth Fund Interim Report 3
2.5 fund performance analysis based on nAV per unit (adjusted for income distribution; if any) since last review period
Period under review
Kenanga Syariah Growth fund -2.66%ftSe-Bursa malaysia emas Shariah Index (fBmS) -4.46%
Source: Lipper
For the financial period under review, the Fund outperformed the FBMS benchmark by 1.8% mainly due to Shariah-compliant security selection.
2.6 review of the market
market review
The FBMS started the month positive during the first week of June. However, the positive momentum failed to sustain as foreigners continued to sell the market. The initial decline was dragged by finance related stocks which brought the index lower on 11 June; bucking regional trend which closed in the green on optimism that the U.S-North Korea summit in Singapore may lead to the denuclearization of the Korean peninsula. The downtrend for the index continued, in line with regional markets on trade-war fears after Donald Trump threatened to have additional tariffs on another USD200 billion of Chinese imports.
Despite concerns over elevated trade tensions, a strong round of US corporate earnings have helped pacify market jitters and lifted US stock indices in July before ending positively in August led by solid US corporate earnings and continued to hit a new high in September.
October was a brutal month for equity markets. Equities tumbled amidst escalated US-China trade tension, rising treasury yields, disappointment over apple suppliers’ profits and UK’s introduction of digital tax. The International Monetary Fund (IMF) cut 2018/19 global growth to 3.7% (previously 3.9%), the first downgrade since July 2016. IMF highlighted that risks to global outlook have risen due to the trade tensions and sharper interest rate hikes. November ended with mixed performances across the globe. While US equity markets recorded monthly gains with Dow Jones up by 1.7% month-on-month (MoM), European markets were generally negative. Investors were generally cautious over Brexit-led turmoil, falling oil prices and the uncertain outcome between Trump and Xi’s trade talk in G20 meeting.
market Outlook
Market could remain volatile in December with ongoing news-flow on US-China trade wars, and statements from the Federal Reserve. Beijing and China now has 90 days to negotiate, after which US could go ahead with 25% tariff increase if both sides failed to reach an agreement. Expectation for further hikes next year has receded following the Powell’s dovish statement. Federal Open Market Committee (FOMC) will meet on 18 & 19 December 2018 which may lead to last rate hike for the year.
Another key to watch is outlook of oil price. All eyes will be on Organisation of Petroleum Exporting Countries (OPEC) meeting which is scheduled on 6 December. Details have yet to be disclosed but market is expecting a production cut of 1 million-1.4 million bpd. Russia had earlier expressed its interest to join Saudi in curbing production output.
Strategy
We remain defensive overall, while focusing on Shariah-compliant security picking for outperformance. We continue to focus on Shariah-compliant securities with sustained earnings growth, strong balance sheet and consistent dividend payment. These include exporters like technolgy, EMS and rubber glove players (beneficiary of weak Ringgit), Shariah-compliant securities related to domestic consumption and selective value picks which are sold down excessively.

4 Kenanga Syariah Growth Fund Interim Report
2.7 distribution
For the financial period under review, the Fund did not declare any distribution.
2.8 details of any unit split exercise
The Fund did not carry out any unit split exercise during the financial period under review.
2.9 Significant changes in the state of affair of the Fund during the financial period
There were no significant changes in the state of affair of the Fund during the financial period and up until the date of the Manager’s report, not otherwise disclosed in the financial statements.
2.10 Circumstances that materially affect any interests of the members
During the financial period under review, there were no circumstances that materially affected any interests of the unit holders.
2.11 Cross trade
During the financial period under review, no cross-trade transaction was undertaken by investment manager for the Fund.
2.12 rebates & Soft commissions
It is the policy of the Manager to credit any rebates received into the account of the Fund. Any soft commissions received by investment manager on behalf of the Fund are in the form of research and advisory services that assist in the decision making process relating to the investment of the Fund which are of demonstrable benefit to unit holders of the Fund. For the financial period under review, the Manager has received soft commissions from the stockbrokers.

Kenanga Syariah Growth Fund Interim Report 5
3. fund PerfOrmAnCe
3.1 Details of portfolio composition of the Fund for the financial period as at 30 November 2018 against the last three financial years as at 31 May are as follows:
a. distribution among industry sectors and category of Shariah-compliant investments:
As at fy fy fy30.11.2018 2018 2017 2016
% % % %
Trading/Services 29.4 26.1 20.5 23.8 Industrial products 21.4 14.0 12.7 12.4 Consumer products 7.8 12.4 4.9 4.1 Technology 6.3 4.6 3.5 2.1 Properties 5.6 4.4 8.7 5.7 Constructions 5.4 8.9 13.7 8.0 Finance 4.2 4.2 4.1 4.1 Infrastructure 1.0 - 1.6 4.2 Plantations 0.8 2.3 2.6 5.3 Islamic Real Estate
Investment Trust 0.8 0.9 3.8 4.6 Shariah-compliant
warrants 0.3 0.3 - 0.1 Listed Shariah non-
compliant equity security (Note 14 (a)) 0.2 0.3 - -
Islamic deposits and cash 16.8 21.6 23.9 25.6
100.0 100.0 100.0 100.0
Note: The above mentioned percentages are based on total Shariah-compliant investment market value plus cash.
b. distribution among markets
The Fund invests in local Shariah-compliant investment securities and cash instruments only.

6 Kenanga Syariah Growth Fund Interim Report
3.2 Performance details of the Fund for the financial period ended 30 November 2018 against the last three financial years ended 31 May are as follows:
Period from 1.6.2018 to30.11.2018
fy 2018
fy 2017
fy2016
Net asset value (“NAV”) (RM Million) 465.07* 421.03 361.64 241.24
Units in circulation (Million) 466.03 410.67 340.58 243.01 NAV per unit (RM) 0.9979* 1.0252 1.0618 0.9927 Highest NAV per unit (RM) 1.0888 1.1678 1.0802 1.1285 Lowest NAV per unit (RM) 0.9905 1.0217 0.9868 0.9851 Total return (%) -2.66 -3.45 6.95 -0.47- Capital growth (%) -2.66 -3.45 6.95 -9.74- Income growth (%) - - - 9.27 Gross distribution per unit (sen) - - - 10.11 Net distribution per unit (sen) - - - 10.11 Management expense ratio
(“MER”) (%)1 1.57 1.70 1.69 1.70 Portfolio turnover ratio (“PTR”)
(times)2 0.37 1.05 0.48 0.39
Note: Total return is the actual return of the Fund for the respective financial period/years, computed based on NAV per unit and net of all fees.
MER is computed based on the total fees and expenses incurred by the Fund divided by the average fund size calculated on a daily basis. PTR is computed based on the average of the total acquisitions and total disposals of Shariah-compliant investment securities of the Fund divided by the average fund size calculated on a daily basis.
1. MER is lower against the previous financial year mainly due to lower recorved expenses incured during the financial period under review.
2. PTR for the financial period under review is lower due to shorter period under review.
* Based on bid price fair valuation method on all Shariah-compliant investments held by the Fund as at 30 November 2018, the NAV and NAV per unit would be RM463.31 million and RM0.9942 respectively. (As disclosed under Note 13 of the financial statements)”

Kenanga Syariah Growth Fund Interim Report 7
3.3 Average total return of the fund
1 year30 nov 17 - 30 nov 18
3 years30 nov 15 - 30 nov 18
5 years30 nov 13 - 30 nov 18
Kenanga Syariah Growth fund -9.68% -0.02% 1.75%ftSe-Bursa malaysia emas Shariah Index (fBmS) -9.96% -1.99% -1.37%
Source: Lipper
3.4 Annual total return of the fund
Period under review
31 may 18 - 30 nov
18
1 year31 may 17 - 31 may
18
1 year31 may 16 - 31 nov
17
1 year31 may 15 - 31 may
16
1 year31 may 14 - 31 may
15
Period from
31 dec 12 - 31 may
14Kenanga Syariah Growth fund -2.66% -3.45% 6.96% -0.47% -1.30% 28.72%ftSe-Bursa malaysia emas Shariah Index (fBmS) -4.46% -4.91% 7.39% -5.20% -4.26% 14.02%
Source: Lipper
Investors are reminded that past performance is not necessarily indicative of future performance. Unit prices and investment returns may fluctuate.

8 Kenanga Syariah Growth Fund Interim Report
4 truStee’S rePOrt tO the unIt hOLderS Of KenAnGA SyArIAh GrOwth fund
We, CIMB Islamic Trustee Berhad being the Trustee for Kenanga Syariah Growth Fund (“the Fund”), are of the opinion that Kenanga Investors Berhad (“the Manager”), acting in the capacity as Manager of the Fund, has fulfilled its duties in the following manner for the financial period form 1 June 2018 to 30 November 2018.
a) The Fund has been managed in accordance with the limitations imposed on the investment powers of the Manager under the Deed, the Securities Commission Malaysia’s Guidelines on Unit Trust Funds, the Capital Markets and Services Act 2007 (as amended from time to time) and other applicable laws;
b) Valuation and pricing of units of the Fund has been carried out in accordance with the Deed and relevant regulatory requirements; and
c) Creation and cancellation of units have been carried out in accordance with the Deed and relevant regulatory requirements.
For and on behalf of CIMB Islamic Trustee Berhad
Lee Kooi Yoke Chief Operating Officer Kuala Lumpur, Malaysia
15 January 2019

Kenanga Syariah Growth Fund Interim Report 9
5. ShArIAh AdVISer’S rePOrt tO the unIt hOLderS Of KenAnGA SyArIAh GrOwth fund
We have acted as the Shariah Adviser of Kenanga Syariah Growth Fund. Our responsibility is to ensure that the procedures and processes employed by Kenanga Investors Berhad are in accordance with Shariah principles.
In our opinion, Kenanga Investors Berhad has managed and administered Kenanga Syariah Growth Fund in accordance with Shariah principles and complied with applicable guidelines, rulings and decisions issued by the Securities Commission Malaysia pertaining to Shariah matters for the financial period ended 30 November 2018.
In addition, we also confirm that the investment portfolio of Kenanga Syariah Growth Fund comprises instruments which have been classified as Shariah-compliant by the Shariah Advisory Council of the Securities Commission Malaysia and the Shariah Advisory Council of Bank Negara Malaysia. As for the instruments which are not classified as Shariah-compliant by the Shariah Advisory Council of the Securities Commission Malaysia and the Shariah Advisory Council of Bank Negara Malaysia, we have reviewed the said instruments and opine that these instruments are designated as Shariah-compliant.
For and on behalf of the Shariah AdviserIBFIM
Nazmi Ashraf Bin Mohd NazimConsultant (Shariah)/Designated Person Responsible for Shariah Advisory
Kuala Lumpur, Malaysia
15 January 2019

10 Kenanga Syariah Growth Fund Interim Report
6. StAtement By the mAnAGer
I, Ismitz Matthew De Alwis, being a director of Kenanga Investors Berhad, do hereby state that, in the opinion of the Manager, the accompanying statement of financial position as at 30 November 2018 and the related statement of comprehensive income, statement of changes in net asset value and statement of cash flows for the financial period from 1 June 2018 to 30 November 2018 together with notes thereto, are drawn up in accordance with Malaysian Financial Reporting Standards and International Financial Reporting Standards so as to give a true and fair view of the financial position of Kenanga Syariah Growth Fund as at 30 November 2018 and of its financial performance and cash flows for the financial period from 1 June 2018 to 30 November 2018 and comply with the requirements of the Deed.
For and on behalf of the Manager KENANGA INVESTORS BERHAD
ISMITZ MATTHEW DE ALWIS Executive Director/Chief Executive Officer
Kuala Lumpur, Malaysia
15 January 2019
Kenanga Syariah Growth Fund Interim Report 11
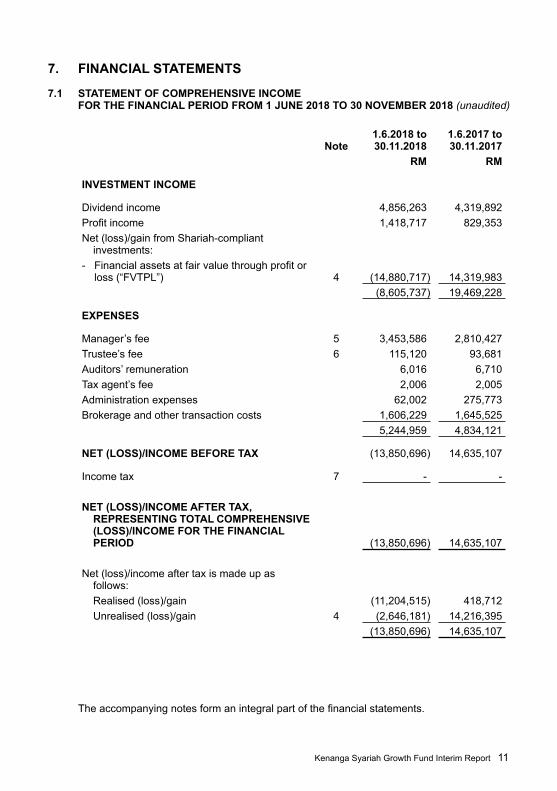
7. fInAnCIAL StAtementS
7.1 StAtement Of COmPrehenSIVe InCOme fOr the fInAnCIAL PerIOd frOm 1 June 2018 tO 30 nOVemBer 2018 (unaudited)
note1.6.2018 to 30.11.2018
1.6.2017 to 30.11.2017
rm rm
InVeStment InCOme
Dividend income 4,856,263 4,319,892 Profit income 1,418,717 829,353 Net (loss)/gain from Shariah-compliant
investments:- Financial assets at fair value through profit or
loss (“FVTPL”) 4 (14,880,717) 14,319,983 (8,605,737) 19,469,228
eXPenSeS
Manager’s fee 5 3,453,586 2,810,427 Trustee’s fee 6 115,120 93,681 Auditors’ remuneration 6,016 6,710 Tax agent’s fee 2,006 2,005 Administration expenses 62,002 275,773 Brokerage and other transaction costs 1,606,229 1,645,525
5,244,959 4,834,121
net (LOSS)/InCOme BefOre tAX (13,850,696) 14,635,107
Income tax 7 - -
net (LOSS)/InCOme After tAX, rePreSentInG tOtAL COmPrehenSIVe (LOSS)/InCOme fOr the fInAnCIAL PerIOd (13,850,696) 14,635,107
Net (loss)/income after tax is made up as follows:Realised (loss)/gain (11,204,515) 418,712 Unrealised (loss)/gain 4 (2,646,181) 14,216,395
(13,850,696) 14,635,107
The accompanying notes form an integral part of the financial statements.

12 Kenanga Syariah Growth Fund Interim Report
7.2 StAtement Of CASh fLOwS fOr the fInAnCIAL PerIOd frOm 1 June 2018 tO 30 nOVemBer 2018 (unaudited)
note 30.11.2018 30.11.2017rm rm
ASSetS
InVeStmentS
Financial assets at FVTPL 4 388,764,107 344,612,971 Islamic deposits 8 78,522,502 53,535,513
467,286,609 398,148,484
Other ASSetS
Amount due from Manager 470,654 -Amount due from licensed financial institutions 9 5,119,405 4,754,306 Other receivables 10 633,943 415,668 Tax recoverable 9,092 9,092 Cash at bank 22,766 2,551,786
6,255,860 7,730,852
tOtAL ASSetS 473,542,469 405,879,336
LIABILItIeS
Amount due to Manager - 258,734 Amount due to Trustee 19,153 16,284 Amount due to licensed financial institutions 10,166,700 7,846,083 Other payables 11 43,350 73,750 tOtAL LIABILItIeS 10,229,203 8,194,851
eQuIty
Unit holders’ contribution 474,945,348 364,464,024 (Accumulated loss)/Retained earning (11,632,082) 33,220,461 net ASSet VALue (“nAV”) AttrIButABLe
tO unIt hOLderS 12 463,313,266 397,684,485
tOtAL LIABILItIeS And eQuIty 473,542,469 405,879,336
numBer Of unItS In CIrCuLAtIOn 12(a) 466,031,643 361,911,626
net ASSet VALue Per unIt (rm) 13 0.9942 1.0988
The accompanying notes form an integral part of the financial statements.

Kenanga Syariah Growth Fund Interim Report 13
7.3 StAtement Of CASh fLOwS fOr the fInAnCIAL PerIOd frOm 1 June 2018 tO 30 nOVemBer 2018 (unaudited)
noteunit holders’ contribution
(Accumulatedloss)
/retained earning total nAV
rm rm rm
1.6.2018 to 30.11.2018At beginning of the financial
period 417,044,494 2,218,614 419,263,108 Total comprehensive loss - (13,850,696) (13,850,696)Creation of units 12(a) 68,451,203 - 68,451,203 Cancellation of units 12(a) (10,557,920) - (10,557,920)Distribution equalisation 12(a) 7,571 - 7,571 At end of the financial period 474,945,348 (11,632,082) 463,313,266
1.6.2017 to 30.11.2017At beginning of the financial
period 341,577,232 18,585,354 360,162,586 Total comprehensive income - 14,635,107 14,635,107 Creation of units 12(a) 47,181,797 - 47,181,797 Cancellation of units 12(a) (24,346,083) - (24,346,083)Distribution equalisation 12(a) 51,078 - 51,078 At end of the financial period 364,464,024 33,220,461 397,684,485
The accompanying notes form an integral part of the financial statements.

14 Kenanga Syariah Growth Fund Interim Report
7.4 StAtement Of CASh fLOwS fOr the fInAnCIAL PerIOd frOm 1 June 2018 tO 30 nOVemBer 2018 (unaudited)
note1.6.2018 to 30.11.2018
1.6.2017 to 30.11.2017
rm rm
CASh fLOwS frOm OPerAtInG And InVeStInG ACtIVItIeS
Proceeds from sale of financial assets at FVTPL 132,142,105 171,676,844 Dividends received 5,252,387 4,508,067 Profit received from Islamic deposits 1,369,412 869,999 Auditors’ remuneration paid (12,000) (12,000)Trustee’s fee paid (114,283) (92,249)Payments for other fees and expenses (106,161) (225,991)Manager’s fee paid (3,428,464) (2,767,458)Purchase of financial assets at FVTPL (202,587,463) (230,310,886)Net cash used in operating and investing
activities (82,460,467) (56,353,674)
CASh fLOwS frOm fInAnCInG ACtIVItIeS
Cash received from units created 67,793,641 47,689,261 Cash paid on units cancelled (11,113,818) (24,309,269)Net cash generated from financing activities 56,679,823 23,379,992
net deCreASe In CASh And CASh eQuIVALentS (25,780,644) (32,973,682)
CASh And CASh eQuIVALentS At BeGInnInG Of the fInAnCIAL PerIOd 89,349,912 89,060,981
CASh And CASh eQuIVALentS At end Of the fInAnCIAL PerIOd 63,569,268 56,087,299
Cash and cash equivalents comprise:Cash at bank 22,766 2,551,786 Short term Islamic deposits 8 63,546,502 53,535,513
63,569,268 56,087,299
The accompanying notes form an integral part of the financial statements.

Kenanga Syariah Growth Fund Interim Report 15
7.5 nOteS tO the fInAnCIAL StAtementS fOr the fInAnCIAL PerIOd frOm 1 June 2018 tO 30 nOVemBer 2018 (unaudited)
1. the fund, the mAnAGer And theIr PrInCIPAL ACtIVItIeS
Kenanga Syariah Growth Fund (“the Fund”) was constituted pursuant to the executed Master Deed dated 8 January 2002 (collectively, together with deeds supplemental thereto, referred to as “the Deed”) between the Manager, Kenanga Investors Berhad, and HSBC (Malaysia) Trustee Berhad (“the Trustee” prior to 3 December 2013). The Fund has changed its trustee to CIMB Islamic Trustee Berhad (“the Trustee” with effect from 3 December 2013). The aforesaid change was effected on 3 December 2013 via a Second Master Supplemental Deed dated 19 November 2013. The Fund commenced operations on 29 January 2002 and will continue to be in operation until terminated by the Trustee, as provided under Part 12 of the Deed.
Kenanga Investors Berhad is a wholly-owned subsidiary of Kenanga Investment Bank Berhad that is listed on the Main Market of Bursa Malaysia Securities Berhad. All of these companies are incorporated in Malaysia.
The principal place of business of the Manager is Level 14, Kenanga Tower, 237, Jalan Tun Razak, 50400 Kuala Lumpur.
The Fund seeks to provide unit holders with long term capital growth by investing principally in equities that comply with Shariah requirements.
2. fInAnCIAL rISK mAnAGement OBJeCtIVeS And POLICIeS
The Fund is exposed to a variety of risks including market risk (which includes interest rate risk and price risk), credit risk, liquidity risk and reclassification of Shariah status risk. Whilst these are the most important types of financial risks inherent in each type of financial instruments, the Manager and the Trustee would like to highlight that this list does not purport to constitute an exhaustive list of all the risks inherent in a Shariah-compliant investment in the Fund.
The Fund has an approved set of investment guidelines and policies as well as internal controls which sets out its overall business strategies to manage these risks to optimise returns and preserve capital for the unit holders, consistent with the long term objectives of the Fund.
a. market risk
Market risk is the risk that the fair value or future cash flows of a financial instrument will fluctuate because of changes in market prices. Market risk includes interest rate risk and price risk.

16 Kenanga Syariah Growth Fund Interim Report
2. fInAnCIAL rISK mAnAGement OBJeCtIVeS And POLICIeS (COntd.)
a. market risk (contd.)
Market risk arises when the value of the Shariah-compliant investments fluctuates in response to the activities of individual companies, general market or economic conditions. It stems from the fact that there are economy-wide perils, which threaten all businesses. Hence, investors are exposed to market uncertainties. Fluctuation in the Shariah-compliant investments’ prices caused by uncertainties in the economic, political and social environment will affect the NAV of the Fund.
The Manager manages the risk of unfavourable changes in prices by cautious review of the Shariah-compliant investments and continuous monitoring of their performance and risk profiles.
i. Interest rate risk
Interest rate risk refers to how the changes in the interest rate environment would affect the valuation of Shariah-compliant instruments. In the event of a rising interest rate environment, the performance of Shariah-compliant instruments may decrease, and vice versa. Interest rate, such as the Overnight Policy Rate set by Bank Negara Malaysia, will have an impact on the investment decisions of the Fund regardless of whether it is an Islamic fund or otherwise. It does not in any way suggest that the Fund will invest in conventional financial instruments.
The Fund is not exposed to significant interest rate risk as its Islamic deposits are short term in nature and have fixed profit rates.
Interest rate risk exposure
The following table analyses the Fund’s interest rate risk exposure. The Fund’s financial assets and financial liabilities are disclosed at fair value and categorised by the earlier of contractual re-pricing or maturity dates.
up to 1 year
non-exposure
to interest rate
movement total
weighted average effective
rate of return*
rm rm rm %
30.11.2018AssetsFinancial assets at
FVTPL - 388,764,107 388,764,107 Islamic deposits 78,522,502 - 78,522,502 3.5Other assets - 6,246,768 6,246,768
78,522,502 395,010,875 473,533,377
LiabilitiesOther liabilities - 10,185,853 10,185,853
total interest rate sensitivity gap 78,522,502 384,825,022 463,347,524

Kenanga Syariah Growth Fund Interim Report 17
2. fInAnCIAL rISK mAnAGement OBJeCtIVeS And POLICIeS (COntd.)
a. market risk (contd.)
i. Interest rate risk (contd.)
Interest rate risk exposure (contd.)
up to 1 year
non-exposure
to interest rate
movement total
weighted average effective
rate of return*
rm rm rm %
30.11.2017AssetsFinancial assets at
FVTPL -
344,612,971
344,612,971 Islamic deposits 53,535,513 - 53,535,513 3.1Other assets - 7,721,760 7,721,760
53,535,513 352,334,731 405,870,244
LiabilitiesOther liabilities - 8,121,101 8,121,101
total interest rate sensitivity gap 53,535,513
344,213,630
397,749,143
* Computed based on Shariah-compliant assets with exposure to interest rate movement only.
ii. Price risk
Price risk is the risk of unfavourable changes in the fair values of listed Shariah-compliant equity securities, listed Islamic collective investment scheme, listed Shariah-compliant warrants and listed Shariah non-compliant equity security. The Fund invests in listed Shariah-compliant equity securities, listed Islamic collective investment schemes, listed Shariah-compliant warrants and listed Shariah non-compliant equity security which are exposed to price fluctuations. This may then affect the NAV of the Fund.

18 Kenanga Syariah Growth Fund Interim Report
2. fInAnCIAL rISK mAnAGement OBJeCtIVeS And POLICIeS (COntd.)
a. market risk (contd.)
ii. Price risk (contd.)
Price risk sensitivity
The Manager’s best estimate of the effect on the profit for the financial period due to a reasonably possible change in investments in listed Shariah-compliant equity securities, listed Islamic collective investment scheme, listed Shariah-compliant warrants and listed Shariah non-compliant equity security with all other variables held constant is indicated in the table below:
Changes in price
Effects on profit for the financial
periodIncrease/
(decrease)Increase/
(decrease)Basis points rm
30.11.2018Financial assets at FVTPL 5/(5) 194,382/(194,382)
30.11.2017Financial assets at FVTPL 5/(5) 172,238/(172,238)
In practice, the actual trading results may differ from the sensitivity analysis above and the difference could be material.
Price risk concentration
The following table sets out the Fund’s exposure and concentration to price risk based on its portfolio of Shariah-compliant financial instruments as at the reporting date.
fair value Percentage of nAV30.11.2018 30.11.2017 30.11.2018 30.11.2017
rm rm % %
Financial assets at FVTPL 388,746,107 344,612,971 83.9 86.6

Kenanga Syariah Growth Fund Interim Report 19
2. fInAnCIAL rISK mAnAGement OBJeCtIVeS And POLICIeS (COntd.)
a. market risk (contd.)
ii. Price risk (contd.)
Price risk concentration (contd.)
The Fund’s concentration of Shariah-compliant investment security price risk from the Fund’s listed Shariah-compliant equity securities, listed Islamic collective investment scheme, listed Shariah-compliant warrants and unlisted Shariah non-compliant equity security analysed by sector is as follows:
fair value Percentage of nAV30.11.2018 30.11.2017 30.11.2018 30.11.2017
rm rm % %
Trading/Services 137,174,476 93,488,741 29.6 23.5 Industrial products 100,540,515 57,184,982 21.7 14.4 Consumer products 36,329,720 36,912,659 7.8 9.3 Technology 29,658,986 17,400,144 6.4 4.4 Properties 26,000,661 34,221,899 5.6 8.6 Constructions 25,106,880 57,424,540 5.4 14.4 Finance 19,452,517 17,623,484 4.2 4.4 Infrastructure 4,649,193 - 1.0 -Plantations 3,958,080 23,661,690 0.9 5.9 Islamic Real Estate
Investment Trust 3,723,342 6,156,465 0.8 1.6 Shariah-compliant
warrants 1,323,762 538,367 0.3 0.1 Listed Shariah non-
compliant equity security
(Note 14 (a)) 845,975 - 0.2 -388,764,107 344,612,971 83.9 86.6
b. Credit risk
Credit risk is the risk that the counterparty to a financial instrument will cause a financial loss to the Fund by failing to discharge an obligation. The Manager manages the credit risk by undertaking credit evaluation to minimise such risk.
i. Credit risk exposure
As at the reporting date, the Fund’s maximum exposure to credit risk is represented by the carrying amount of each class of financial asset recognised in the statement of financial position.
ii. financial assets that are either past due or impaired
As at the reporting date, there are no financial assets that are either past due or impaired.

20 Kenanga Syariah Growth Fund Interim Report
2. fInAnCIAL rISK mAnAGement OBJeCtIVeS And POLICIeS (COntd.)
b. Credit risk (contd.)
iii. Credit quality of financial assets
The Fund invests in Islamic deposits with financial institutions licensed under the Islamic Financial Services Act 2013. The following table analyses the licensed financial institutions by rating category:
Islamic deposits
Percentage of total Islamic deposits Percentage of nAV
30.11.2018 30.11.2017 30.11.2018 30.11.2017% % % %
ratingP1 39.2 - 6.6 - WR 60.8 100.0 10.3 13.5
100.0 100.0 16.9 13.5
c. Liquidity risk
Liquidity risk is defined as the risk that the Fund will encounter difficulty in meeting obligations associated with financial liabilities that are to be settled by delivering cash or another financial asset. Exposure to liquidity risk arises because of the possibility that the Fund could be required to pay its liabilities or cancel its units earlier than expected. The Fund is exposed to cancellation of its units on a regular basis. Units sold to unit holders by the Manager are cancellable at the unit holders’ option based on the Fund’s NAV per unit at the time of cancellation calculated in accordance with the Deed.
The Islamic liquid assets comprise cash, short term Islamic deposits with licensed financial institutions and other Shariah-compliant instruments, which are capable of being converted into cash within 7 days.

Kenanga Syariah Growth Fund Interim Report 21
2. fInAnCIAL rISK mAnAGement OBJeCtIVeS And POLICIeS (COntd.)
c. Liquidity risk (contd.)
The following table analyses the maturity profile of the Fund’s financial assets and financial liabilities in order to provide a complete view of the Fund’s contractual commitments and liquidity.
up to 1 yearnote 30.11.2018 30.11.2017
rm rm
AssetsFinancial assets at FVTPL 388,764,107 344,612,971 Islamic deposits 78,522,502 53,535,513 Other assets 6,246,768 7,721,760
i. 473,533,377 405,870,244
LiabilitiesOther liabilities ii. 10,185,853 8,121,101
Equity iii. 463,313,266 397,684,485
Liquidity gap 34,257 64,658
i. financial assets
Analysis of financial assets at FVTPL into maturity groupings is based on the expected date on which these assets will be realised. The Fund’s investments in listed Shariah-compliant equity securities, listed Islamic collective investment scheme, listed Shariah-compliant warrants and listed Shariah non-compliant equity security have been included in the “up to 1 year” category on the assumption that these are highly liquid Shariah-compliant investments which can be realised should all of the Fund’s unit holders’ equity be required to be redeemed. For other assets, the analysis into maturity groupings is based on the remaining period from the end of the reporting period to the contractual maturity date or if earlier, the expected date on which the assets will be realised.
ii. financial liabilities
The maturity grouping is based on the remaining period from the end of the reporting period to the contractual maturity date or if earlier, the date on which liabilities will be settled. When the counterparty has a choice of when the amount is paid, the liability is allocated to the earliest period in which the Fund can be required to pay.
iii. equity
As the unit holders can request for redemption of their units, they have been categorised as having a maturity of “up to 1 year”.

22 Kenanga Syariah Growth Fund Interim Report
2. fInAnCIAL rISK mAnAGement OBJeCtIVeS And POLICIeS (COntd.)
d. Reclassification of Shariah status risk
The risk that the currently held Shariah-compliant securities in the portfolio of Islamic funds may be reclassified to be Shariah non-compliant upon review of the securities by the Shariah Advisory Council of the Securities Commission Malaysia (“SACSC”) performed twice yearly. If this occurs, the Manager will take the necessary steps to dispose of such securities.
There may be opportunity loss to the Fund due to the Fund not being allowed to retain the excess capital gains derived from the disposal of the Shariah non-compliant equities. The value of the Fund may also be adversely affected in the event of a disposal of Shariah non-compliant equities at a price lower than the investment cost.
e. regulatory reportings
It is the Manager’s responsibility to ensure full compliance of all requirements under the Guidelines on Unit Trust Funds issued by Securities Commission Malaysia. Any breach of any such requirement has been reported in the mandatory reporting to Securities Commission Malaysia on a monthly basis.
3. SummAry Of SIGnIfICAnt ACCOuntInG POLICIeS
a. Basis of accounting
The financial statements of the Fund have been prepared in accordance with Malaysian Financial Reporting Standards (“MFRS”) as issued by the Malaysian Accounting Standards Board (“MASB”) and International Financial Reporting Standards (“IFRS”) as issued by the International Accounting Standards Board (“IASB”).
The accounting policies adopted are consistent with those of the previous financial period except for the adoption of the new and amended MFRS which became effective for the Fund on 1 June 2018. The adoption of the new and amended MFRS did not have any significant impact on the financial position or performance of the Fund.
The financial statements have been prepared on the historical cost basis except as disclosed in the accounting policies below.

Kenanga Syariah Growth Fund Interim Report 23
3. SummAry Of SIGnIfICAnt ACCOuntInG POLICIeS (COntd.)
b. Standards, amendments and interpretations issued but not yet effective
As at the reporting date, the following Standards, Amendments and Interpretation Committee’s (“IC”) Interpretations that have been issued by MASB will be effective for the Fund in future financial periods. The Fund intends to adopt the relevant standards when they become effective.
description
Effective for financial period beginning on
or after
Amendments to MFRS contained in the documents entitled “Annual improvements to MFRS Standards 2014 - 2016 Cycle” 1 January 2018
Amendments to MFRS 1: First-time Adoption of Malaysian Financial Reporting Standards contained in the documents entitled “Annual Improvements to MFRS Standards 2014 - 2016 Cycle” 1 January 2018
Amendments to MFRS 128: Investments in Associates and Joint Ventures contained in the documents entitled “Annual improvements to MFRS Standards 2014 - 2016 Cycle” 1 January 2018
MFRS 9: Financial Instruments 1 January 2018MFRS 15: Revenue from Contracts with Customers 1 January 2018Clarifications to MFRS 15: Revenue from Contracts with
Customers 1 January 2018Amendments to MFRS 2: Classification and Measurement
of Shared-Based Payment Transactions 1 January 2018
Amendments to MFRS 4: Applying MFRS 9 Financial Instruments with MFRS 4 Insurance Contracts
Temporary exemption from MFRS 9 subject
to certain criteria being met for annual periods
beginning on or after 1 January 2018
Amendments to MFRS 140: Transfers of Investment Property 1 January 2018
IC Interpretation 22: Foreign Currency Transactions and Advance Consideration 1 January 2018
Amendments to MFRS contained in the documents entitled “Annual improvements to MFRS Standards 2015 - 2017 Cycle” 1 January 2019
Amendments to MFRS 3 and MFRS 11: Previously Held Interest in a Joint Operation contained in the document entitled “Annual Improvements to MFRS Standards 2015 - 2017 Cycle” 1 January 2019
Amendments to MFRS 112: Income Tax Consequences of Payments on Financial Instruments Classified as Equity contained in the documents entitled “Annual improvements to MFRS Standards 2015 - 2017 Cycle” 1 January 2019

24 Kenanga Syariah Growth Fund Interim Report
3. SummAry Of SIGnIfICAnt ACCOuntInG POLICIeS (COntd.)
b. Standards, amendments and interpretations issued but not yet effective (contd.)
description
Effective for financial period beginning on
or after
Amendments to MFRS 123: Borrowing Costs Eligible for Capitalisation contained in the documents entitled “Annual improvements to MFRS Standards 2015 - 2017 Cycle” 1 January 2019
MFRS 16: Leases 1 January 2019Amendments to MFRS 9: Prepayment Features with
Negative Compensation 1 January 2019Amendments to MFRS 119: Plan Amendment, Curtailment
or Settlement 1 January 2019Amendments to MFRS 128: Long-term interests in
Associates and Joint Ventures 1 January 2019IC Interpretation 23: Uncertainty Over Income Tax
Treatments 1 January 2019Amendments to MFRS 2: Share-Based Payment 1 January 2020Amendments to MFRS 3: Business Combinations 1 January 2020Amendments to MFRS 6: Exploration for and Evaluation of
Mineral Resources 1 January 2020Amendments to MFRS 14: Regulatory Deferral Accounts 1 January 2020Amendments to MFRS 101: Presentation of Financial
Statements 1 January 2020Amendments to MFRS 108: Accounting Policies, Changes
in Accounting Estimates and Errors 1 January 2020Amendments to MFRS 134: Interim Financial Reporting 1 January 2020Amendment to MFRS 137: Provisions, Contingent
Liabilities and Contingent Assets 1 January 2020Amendment to MFRS 138: Intangible Assets 1 January 2020Amendments to IC Interpretation 12: Service Concession
Arrangements 1 January 2020Amendments to IC Interpretation 19: Extinguishing
Financial Liabilities with Equity Instruments 1 January 2020Amendments to IC Interpretation 22: Foreign Currency
Transactions and Advance Consideration 1 January 2020Amendments to IC Interpretation 132: Intangible Assets -
Web Site Costs 1 January 2020MFRS 17: Insurance Contracts 1 January 2021Amendments to MFRS 10 and MFRS 128: Sale or
Contribution of Assets between an Investor and its Associate or Joint Venture
To be announced by MASB

Kenanga Syariah Growth Fund Interim Report 25
3. SummAry Of SIGnIfICAnt ACCOuntInG POLICIeS (COntd.)
b. Standards, amendments and interpretations issued but not yet effective (contd.)
The Fund will adopt the above pronouncements when they become effective in the respective financial periods. These pronouncements are not expected to have any significant impact to the financial statements of the Fund upon their initial application, other than MFRS 9.
MFRS 9 replaces MFRS 139 on the following requirements: classification and measurement of financial assets and financial liabilities as defined in MFRS 139, impairment methodology and hedge accounting. The Fund does not expect any change in classification and any potential material financial impact arising from the adoption of this standard.
c. financial assets
Shariah-compliant Financial assets are recognised in the statement of financial position when, and only when, the Fund becomes a party to the contractual provisions of the financial instruments.
When financial assets are recognised initially, they are measured at fair value, plus, in the case of financial assets not at FVTPL, directly attributable transaction costs.
The Fund determines the classification of its financial assets at initial recognition.
i. financial assets at fVtPL
Shariah-compliant Financial assets are classified as financial assets at FVTPL if they are held for trading or are designated as such upon initial recognition.
Shariah-compliant Financial assets held for trading include listed Shariah-compliant equity securities, listed Islamic collective investment scheme, listed Shariah-compliant warrants and listed Shariah non-compliant equity security acquired principally for the purpose of selling in the near term.
Subsequent to initial recognition, financial assets at FVTPL are measured at fair value. Changes in the fair value of those Shariah-compliant financial instruments are recorded in profit or loss.
Profit earned and dividend revenue elements of such Shariah-compliant instruments are recorded separately in “profit income” and “dividend income”, respectively.
ii. receivables
Financial assets with fixed or determinable payments that are not quoted in an active market are classified as receivables.
Subsequent to initial recognition, receivables are measured at amortised cost using the effective yield method. Gain or loss is recognised in profit or loss when the receivable is derecognised or impaired, and through the amortisation process.
A financial asset is derecognised when the contractual right to receive cash flows from the asset has expired. On derecognition of a financial asset, the difference between the carrying amount and the sum of the consideration received is recognised in profit or loss.
26 Kenanga Syariah Growth Fund Interim Report
3. SummAry Of SIGnIfICAnt ACCOuntInG POLICIeS (COntd.)
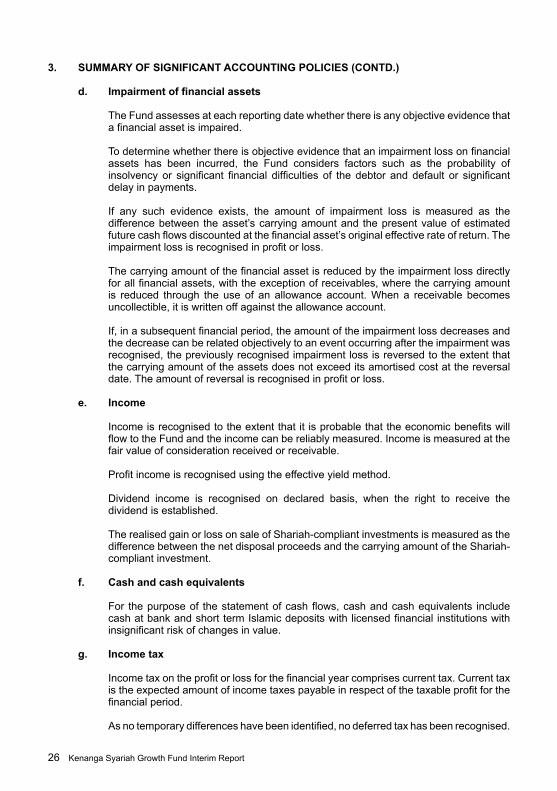
d. Impairment of financial assets
The Fund assesses at each reporting date whether there is any objective evidence that a financial asset is impaired.
To determine whether there is objective evidence that an impairment loss on financial assets has been incurred, the Fund considers factors such as the probability of insolvency or significant financial difficulties of the debtor and default or significant delay in payments.
If any such evidence exists, the amount of impairment loss is measured as the difference between the asset’s carrying amount and the present value of estimated future cash flows discounted at the financial asset’s original effective rate of return. The impairment loss is recognised in profit or loss.
The carrying amount of the financial asset is reduced by the impairment loss directly for all financial assets, with the exception of receivables, where the carrying amount is reduced through the use of an allowance account. When a receivable becomes uncollectible, it is written off against the allowance account.
If, in a subsequent financial period, the amount of the impairment loss decreases and the decrease can be related objectively to an event occurring after the impairment was recognised, the previously recognised impairment loss is reversed to the extent that the carrying amount of the assets does not exceed its amortised cost at the reversal date. The amount of reversal is recognised in profit or loss.
e. Income
Income is recognised to the extent that it is probable that the economic benefits will flow to the Fund and the income can be reliably measured. Income is measured at the fair value of consideration received or receivable.
Profit income is recognised using the effective yield method.
Dividend income is recognised on declared basis, when the right to receive the dividend is established.
The realised gain or loss on sale of Shariah-compliant investments is measured as the difference between the net disposal proceeds and the carrying amount of the Shariah-compliant investment.
f. Cash and cash equivalents
For the purpose of the statement of cash flows, cash and cash equivalents include cash at bank and short term Islamic deposits with licensed financial institutions with insignificant risk of changes in value.
g. Income tax
Income tax on the profit or loss for the financial year comprises current tax. Current tax is the expected amount of income taxes payable in respect of the taxable profit for the financial period.
As no temporary differences have been identified, no deferred tax has been recognised.

Kenanga Syariah Growth Fund Interim Report 27
3. SummAry Of SIGnIfICAnt ACCOuntInG POLICIeS (COntd.)
h. unrealised reserves
Unrealised reserves represent the net gain or loss arising from carrying Shariah-compliant investments at their fair values at reporting date. This reserve is not distributable.
i. financial liabilities
Financial liabilities are classified according to the substance of the contractual arrangements entered into and the definitions of a financial liability.
Financial liabilities are recognised in the statement of financial position when, and only when, the Fund becomes a party to the contractual provisions of the financial instrument. The Fund’s financial liabilities are classified as other financial liabilities. The Fund’s financial liabilities are recognised initially at fair value and subsequently measured at amortised cost using the effective yield method.
A financial liability is derecognised when the obligation under the liability is extinguished. Gains and losses are recognised in profit or loss when the liabilities are derecognised, and through the amortisation process.
j. unit holders’ contribution - nAV attributable to unit holders
The unit holders’ contribution to the Fund is classified as equity instruments.
Distribution equalisation represents the average amount of undistributed net income included in the creation or cancellation price of units. This amount is either refunded to unit holders by way of distribution and/or adjusted accordingly when units are released back to the Trustee.
k. functional and presentation currency
The financial statements of the Fund are measured using the currency of the primary economic environment in which the Fund operates (“the functional currency”). The financial statements are presented in Ringgit Malaysia (“RM”), which is also the Fund’s functional currency.
l. distributions
Distributions are at the discretion of the Manager. A distribution to the Fund’s unit holders is accounted for as a deduction from retained earnings.
m. Significant accounting judgments and estimates
The preparation of financial statements requires the use of certain accounting estimates and exercise of judgment. Estimates and judgments are continually evaluated and are based on past experience, reasonable expectations of future events and other factors.
i. Critical judgments made in applying accounting policies
There are no major judgments made by the Manager in applying the Fund’s accounting policies.

28 Kenanga Syariah Growth Fund Interim Report
3. SummAry Of SIGnIfICAnt ACCOuntInG POLICIeS (COntd.)
m. Significant accounting judgments and estimates (contd.)
ii. Key sources of estimation uncertainty
There are no key assumptions concerning the future and other key sources of estimation uncertainty at the reporting date, that have a significant risk of causing a material adjustment to the carrying amounts of assets and liabilities within the next financial period.
4. fInAnCIAL ASSetS At fVtPL
30.11.2018 30.11.2017 rm rm
Financial assets held for trading, at FVTPL:Listed Shariah-compliant equity securities 382,871,028 337,781,347 Listed Islamic collective investment scheme 3,723,342 6,156,465 Listed Shariah-compliant warrants 1,323,762 538,367 Listed Shariah non-compliant equity security
(Note 14 (a)) 845,975 -Unlisted Shariah-compliant investment securities - 136,792
388,764,107 344,612,971
1.6.2018 to 30.11.2018
1.6.2017 to 30.11.2017
rm rmNet (loss)/gain on financial assets at FVTPL comprised:
Realised (loss)/gain on disposals (12,234,536) 103,588 Unrealised changes in fair values (2,646,181) 14,216,395
(14,880,717) 14,319,983

Kenanga Syariah Growth Fund Interim Report 29
4. fInAnCIAL ASSetS At fVtPL (COntd.)
Details of financial assets at FVTPL as at 30 November 2018:
Quantity Aggregate
cost fair value Percentage
of nAVrm rm %
Listed Shariah-compliant equity securities
trading/ServicesAxiata Group Berhad 6,861,828 29,576,835 24,908,436 5.4 Bermaz Auto Berhad 5,508,200 11,619,819 11,567,220 2.5 Chin Hin Group Berhad 2,063,800 2,699,843 1,434,341 0.3 Dialog Group Berhad 5,205,876 10,867,376 16,450,568 3.5 IHH Healthcare Berhad 1,634,300 8,622,438 8,727,162 1.9 PESTECH International
Berhad 2,839,264 2,600,191 3,151,583 0.7 Serba Dinamik Holdings
Berhad 598,500 2,351,626 2,154,600 0.5 Sunway Berhad 4,900,092 7,563,374 7,056,132 1.5 Tenaga Nasional Berhad 2,619,100 38,690,022 37,295,984 8.0 TIME dotCom Berhad 968,400 7,931,575 7,795,620 1.7 Yinson Holdings Berhad 3,868,100 14,852,222 16,632,830 3.6
137,375,321 137,174,476 29.6
Industrial productsHartalega Holdings
Berhad 707,500 4,410,280 4,528,000 1.0 Hibiscus Petroleum
Berhad 7,196,800 6,437,330 7,196,800 1.6 Kossan Rubber Industries
Berhad 2,343,500 9,365,728 10,030,180 2.2 Pentamaster Corporation
Berhad 4,064,100 10,952,452 12,436,146 2.7 PETRONAS Chemicals
Group Berhad 3,034,800 25,890,573 27,889,812 6.0 Press Metal Aluminium
Holdings Berhad (formerly known as Press Metal Berhad) 966,400 4,674,749 4,600,064 1.0
Rohas Tecnic Berhad (formerly known as Tecnic Group Berhad) 1,146,700 1,370,443 957,495 0.2
SKP Resources Bhd 7,421,400 9,464,602 8,386,182 1.8 Top Glove Corporation
Berhad 2,908,400 15,255,367 17,334,064 3.7 V. S. Industry Berhad 4,603,700 7,390,059 7,181,772 1.5
95,211,583 100,540,515 21.7

30 Kenanga Syariah Growth Fund Interim Report
4. fInAnCIAL ASSetS At fVtPL (COntd.)
Details of financial assets at FVTPL as at 30 November 2018: (contd.)
Quantity Aggregate
cost fair value Percentage
of nAVrm rm %
Listed Shariah-compliant equity securities (contd.)
Consumer productsAjinomoto (Malaysia)
Berhad 189,300 4,034,776 3,634,560 0.8CCK Consolidated
Holdings Berhad 6,316,900 3,075,434 3,000,527 0.6CCM Duopharma Biotech
Berhad 3,597,636 4,912,508 3,705,565 0.8Nestlé (M) Berhad 89,100 6,297,172 13,293,720 2.9Power Root Berhad 4,035,100 6,193,761 5,528,087 1.2QL Resouces Berhad 1,019,525 3,058,030 7,167,261 1.5
27,571,681 36,329,720 7.8
technologyFrontken Corporation
Berhad 8,562,800 7,083,681 6,893,054 1.5 Globetronics Technology
Bhd. 4,058,966 9,834,648 8,361,470 1.8 Inari Amertron Berhad 5,113,000 8,755,483 8,436,450 1.8 N2N Connect Berhad 5,630,200 6,885,619 5,968,012 1.3
32,559,431 29,658,986 6.4
PropertiesS P Setia Berhad -
ordinary shares 2,990,900 9,246,525 6,430,435 1.4 S P Setia Berhad -
preference shares B 428,546 377,121 304,268 - LBS Bina Group Berhad -
ordinary shares 9,900,440 8,780,706 6,880,806 1.5 LBS Bina Group Berhad -
preference shares 817,580 899,338 833,932 0.2 Paramount Corporation
Berhad 3,573,900 6,977,654 7,326,495 1.6 Sime Darby Property Bhd 2,468,300 3,595,119 2,455,958 0.5 Tambun Indah Land
Berhad 2,297,100 3,928,084 1,768,767 0.4 33,804,547 26,000,661 5.6

Kenanga Syariah Growth Fund Interim Report 31
4. fInAnCIAL ASSetS At fVtPL (COntd.)
Details of financial assets at FVTPL as at 30 November 2018: (contd.)
Quantity Aggregate
cost fair value Percentage
of nAVrm rm %
Listed Shariah-compliant equity securities (contd.)
ConstructionsEconpile Holdings Berhad 3,243,600 3,112,986 1,410,966 0.3 Gabungan AQRS Berhad 5,469,800 9,163,650 4,430,538 1.0 Kerjaya Prospek Group
Berhad 6,532,440 8,301,793 7,838,928 1.7 Malaysian Resources
Corporation Berhad 10,061,600 7,605,776 6,690,964 1.4 MGB Berhad (formerly
known as ML Global Berhad) 6,230,900 7,404,185 4,735,484 1.0
35,588,390 25,106,880 5.4
financeBIMB Holdings Berhad 2,470,700 10,394,680 9,363,953 2.0 Syarikat Takaful Malaysia
Berhad 2,541,200 7,060,958 10,088,564 2.2 17,455,638 19,452,517 4.2
InfrastructureDigi.Com Berhad 1,099,100 4,855,519 4,649,193 1.0
PlantationsBatu Kawan Berhad 235,600 4,310,327 3,958,080 0.9
total listed Shariah-compliant equity securities 388,732,437 382,871,028 82.6
Listed Islamic collective investment scheme
Islamic real estate Investment trust
Axis Real Estate Investment Trust 2,433,557 3,828,759 3,723,342 0.8
total listed Islamic collective investment scheme 3,828,759 3,723,342 0.8

32 Kenanga Syariah Growth Fund Interim Report
4. fInAnCIAL ASSetS At fVtPL (COntd.)
Details of financial assets at FVTPL as at 30 November 2018: (contd.)
Quantity Aggregate
cost fair value Percentage
of nAVrm rm %
Listed Shariah-compliant warrants
CCK Consolidated Holdings Berhad-WA 2,871,400 - 287,140 0.1
Hibiscus Petroleum Berhad-WC 1,611,620 - 741,345 0.2
Kerjaya Prospek Group Berhad-WB 384,360 - 74,950 -
Malaysian Resources Corporation Berhad-WB 400,581 - 82,119 -
Sunway Berhad-WB 511,880 - 138,208 -total listed Shariah-
compliant warrants - 1,323,762 0.3
Listed Shariah non-compliant equity security
Sentoria Group Berhad (Note 14 (a)) 2,349,930 1,559,499 845,975 0.2
total listed Shariah non-compliant equity security 1,559,499 845,975 0.2
Total financial assets at fVtPL 394,120,695 388,764,107 83.9
unrealised loss on financial assets at fVtPL (5,356,588)

Kenanga Syariah Growth Fund Interim Report 33
5. mAnAGer’S fee
The Manager’s fee is calculated on a daily basis at a rate not exceeding 1.50% per annum of the NAV of the Fund as provided under Clause 13.1 of the Deed.
The Manager is currently charging Manager’s fee of 1.50% per annum of the NAV of the Fund (financial period from 1 June 2017 to 30 November 2017: 1.50% per annum).
6. truStee’S fee
Pursuant to the Third Master Supplemental Deed dated 25 July 2014, the Trustee’s fee is calculated at a rate not exceeding 0.05% per annum of the NAV of the Fund effective from 1 August 2014.
The Trustee’s fee is currently calculated at 0.05% per annum of the NAV of the Fund (financial period from 1 June 2017 to 30 November 2017: 0.05% per annum).
7. InCOme tAX
Income tax is calculated at the Malaysian statutory tax rate of 24% of the estimated assessable income for the current and previous financial periods.
Income tax is calculated on investment income less partial deduction for permitted expenses as provided for under Section 63B of the Income Tax Act, 1967.
A reconciliation of income tax expense applicable to net (loss)/income before tax at the statutory income tax rate to income tax expense at the effective income tax rate of the Fund is as follows:
1.6.2018 to 30.11.2018
1.6.2017 to 30.11.2017
rm rm
Net (loss)/income before tax (13,850,696) 14,635,107
Tax at Malaysian statutory tax rate of 24% (financial period from 1 June 2017 to 30 November 2017: 24%) (3,324,167) 3,512,426 Tax effect of:Income not subject to tax (1,505,995) (4,672,615)
Loss not deductible for tax purposes 3,571,372 - Expenses not deductible for tax purposes 415,490 473,728 Restriction on tax deductible expenses for unit trust fund 843,300 686,461
Income tax for the financial period - -

34 Kenanga Syariah Growth Fund Interim Report
8. ISLAmIC dePOSItS
Islamic deposits are held with licensed financial institutions in Malaysia at the prevailing profit rates.
30.11.2018 30.11.2017rm rm
Short term Islamic deposits (tenure: 3 months or less) 63,546,502 53,535,513 Islamic deposits (tenure: more than 3 months) 14,976,000 -
78,522,502 53,535,513
9. AmOunt due frOm/tO LICenSed fInAnCIAL InStItutIOnS
Amount due from/to licensed financial institutions relates to the amount to be received from or to licensed financial institutions arising from the sales and purchase of Shariah-compliant investments.
10. Other reCeIVABLeS
30.11.2018 30.11.2017rm rm
Dividends receivable 540,113 403,877Profit receivable from Islamic deposits 93,830 11,791
633,943 415,668
11. Other PAyABLeS
30.11.2018 30.11.2017rm rm
Accrual for auditors’ remuneration 6,016 4,710 Accrual for tax agent’s fees 6,006 6,005 Provision for printing and other expenses 31,328 63,035
43,350 73,750

Kenanga Syariah Growth Fund Interim Report 35
12. net ASSet VALue AttrIButABLe tO unIt hOLderS
NAV attributed to unit holders is represented by:
note 30.11.2018 30.11.2017rm rm
Unit holders’ contribution (a) 474,945,348 364,464,024
(Accumulated loss)/Retained earning:Realised reserve (6,275,494) 3,278,333 Unrealised reserve (5,356,588) 29,942,128
(11,632,082) 33,220,461
463,313,266 397,684,485
(a) unit holders’ contribution
1.6.2018 to 30.11.2018 1.6.2017 to 30.11.2017no. of units rm no. of units rm
At beginning of the financial period 410,674,447 417,044,494 340,583,836 341,577,232
Add: Creation of units 65,405,645 68,451,203 43,963,952 47,181,797
Less: Cancellation of units (10,048,449) (10,557,920) (22,636,162) (24,346,083)
Distribution equalisation - 7,571 - 51,078
At end of the financial period 466,031,643 474,945,348 361,911,626 364,464,024
The number of units legally or beneficially held by the Manager, Kenanga Investors Berhad, and parties related to the Manager as at 30 November 2018 were nil (30 November 2017: nil).

36 Kenanga Syariah Growth Fund Interim Report
13. net ASSet VALue Per unIt
In line with the adoption of MFRS 139, financial assets at FVTPL have been valued at the bid prices at the close of business. In accordance with the Deed, the calculation of NAV attributable to unit holders per unit for the creation and cancellation of units is computed based on financial assets at FVTPL valued at the last done market price.
A reconciliation of NAV attributable to unit holders for creation/cancellation of units and the NAV attributable to unit holders per the financial statements is as follows:
30.11.2018 30.11.2017rm rm/unit rm rm/unit
NAV attributable to unit holders for creation/cancellation of units 465,068,410 0.9979 399,882,813 1.1049
Effects of adopting bid prices as fair value (1,755,144) (0.0037) (2,198,328) (0.0061)
NAV attributable to unit holders per statement of financial position 463,313,266 0.9942 397,684,485 1.0988
14. ShArIAh InfOrmAtIOn Of the fund
The Shariah Adviser confirmed that the investment portfolio of the Fund is Shariah-compliant, which comprises the following:
a. Investment in equity securities listed on Bursa Malaysia Securities Berhad which have been classified as Shariah-compliant by the SACSC for the financial period under review except for Sentoria Group Berhad. The security has been reclassified as Shariah non-compliant by the SACSC on 25 May 2018. As per the SACSC’s advice, the security will be disposed of soonest practical, once the total amount of dividends received and the market value of the security held equals the original investment cost;
b. Investment in collective investment scheme listed on Bursa Malaysia Securities Berhad which was verified as Shariah-compliant by the Shariah Adviser; and
c. Liquid assets in the local market, that have been placed in the Shariah-compliant investments and/or instruments.
15. POrtfOLIO turnOVer rAtIO (“Ptr”)
PTR for the financial period from 4 June 2018 to 30 November 2018 is 0.37 times (financial period from 1 June 2017 to 30 November 2017: 0.52 times).
PTR is the ratio period from 1 June 2018 to 30 November 2018 of average sum of acquisitions and disposals of Shariah-compliant investments of the Fund for the financial period to the average NAV of the Fund, calculated on a daily basis.

Kenanga Syariah Growth Fund Interim Report 37
16. mAnAGement eXPenSe rAtIO (“mer”)
MER for the financial period from 1 June 2018 to 30 November 2018 is 1.57% per annum (financial period from 1 June 2017 to 30 November 2017: 1.63% per annum).
MER is the ratio of total fees and recovered expenses of the Fund expressed as a percentage of the Fund’s average NAV, calculated on a daily basis.
17. trAnSACtIOnS wIth LICenSed fInAnCIAL InStItutIOnS
transaction value
Percentage of total
Brokerage, stamp duty
and clearing fee
Percentage of total
rm % rm %
UOB Kay Hian Securities (M) Sdn Bhd 80,488,666 23.9 193,948 24.2
Kenanga Investment Bank Berhad* 61,582,288 18.3 140,863 17.6
RHB Investment Bank Berhad 39,615,448 11.8 95,549 11.9
Public Investment Bank Berhad 32,517,421 9.6 76,506 9.6
Credit Suisse Securities (Malaysia) Sdn Bhd 21,421,306 6.3 53,102 6.6
CIMB Investment Bank Berhad 19,456,571 5.8 46,258 5.8
Affin Hwang Investment Bank Berhad 19,445,289 5.8 44,935 5.6
Maybank Investment Bank Berhad 18,726,838 5.6 43,530 5.5
KAF-Seagroatt & Campbell Securities Sdn Bhd 12,804,028 3.8 30,648 3.8
Macquarie Capital Securities (Malaysia) Sdn Bhd 7,701,807 2.3 19,403 2.4
Others 22,976,548 6.8 56,174 7.0 336,736,210 100.0 800,916 100.0
* Kenanga Investment Bank Berhad is a related party of Kenanga Investors Berhad.
The above transaction values are in respect of of listed Shariah-compliant equity securities and listed Shariah-compliant warrants.
The directors of the Manager are of the opinion that the transactions with the related party have been entered into in the normal course of business and have been established on terms and conditions that are not materially different from that obtainable in transactions with unrelated parties. The Manager is of the opinion that the above dealings have been transacted on an arm’s length basis.

38
Ken
anga
Sya
riah
Gro
wth
Fun
d In
terim
Rep
ort
18.
SeG
men
tAL
reP
Or
tIn
G
a.
Bus
ines
s se
gmen
ts
In
acc
orda
nce
with
the
obje
ctiv
e of
the
Fund
, the
Fun
d ca
n in
vest
75%
to 9
5% in
list
ed S
haria
h-co
mpl
iant
inve
stm
ent s
ecur
ities
. Th
e fo
llow
ing
tabl
e pr
ovid
es a
n an
alys
is o
f the
Fun
d’s
reve
nue,
resu
lts, a
sset
s an
d lia
bilit
ies
by b
usin
ess
segm
ents
:
List
ed S
haria
h-co
mpl
iant
inve
stm
ent
secu
ritie
s
List
edSh
aria
h no
n-co
mpl
iant
equ
ity s
ecur
ity(n
ote
14 (a
))
unl
iste
d S
haria
h-co
mpl
iant
inve
stm
ent
secu
ritie
s
Oth
er S
haria
h-co
mpl
iant
inve
stm
ents
tota
lr
mr
mr
mr
mr
m
1.6.
2018
to 3
0.11
.201
8r
even
ueS
egm
ent (
loss
)/inc
ome
(9,3
10,9
30)
(713
,524
)-
1,41
8,71
7 S
egm
ent e
xpen
ses
(1,6
06,2
29)
--
-N
et s
egm
ent (
loss
)/inc
ome
repr
esen
ting
segm
ent r
esul
ts(1
0,91
7,15
9)(7
13,5
24)
-1,
418,
717
(10,
211,
966)
Una
lloca
ted
expe
nditu
re(3
,638
,730
)Lo
ss b
efor
e ta
x(1
3,85
0,69
6)In
com
e ta
x-
Net
loss
afte
r tax
(13,
850,
696)

K
enan
ga S
yaria
h G
row
th F
und
Inte
rim R
epor
t 3
9
18.
SeG
men
tAL
reP
Or
tIn
G (C
On
td.)
a.
Bus
ines
s se
gmen
ts (c
ontd
.)
List
ed S
haria
h-co
mpl
iant
inve
stm
ent
secu
ritie
s
List
edSh
aria
h no
n-co
mpl
iant
equ
ity s
ecur
ity(n
ote
14 (a
))
unl
iste
d S
haria
h-co
mpl
iant
in
vest
men
t se
curit
ies
Oth
er S
haria
h-co
mpl
iant
inve
stm
ents
tota
lr
mr
mr
mr
mr
m
30.1
1.20
18A
sset
sFi
nanc
ial a
sset
s at
FV
TPL
387,
918,
132
845,
975
--
Isla
mic
dep
osits
--
-78
,522
,502
O
ther
seg
men
t ass
ets
5,65
9,51
8 -
-93
,830
To
tal s
egm
ent a
sset
s39
3,57
7,65
0 84
5,97
5 -
78,6
16,3
32
473,
039,
957
Una
lloca
ted
asse
ts
502,
512
473,
542,
469
Liab
ilitie
sS
egm
ent l
iabi
litie
s10
,166
,700
--
-10
,166
,700
U
nallo
cate
d lia
bilit
ies
62,5
03
10,2
29,2
03

40
Ken
anga
Sya
riah
Gro
wth
Fun
d In
terim
Rep
ort
18.
SeG
men
tAL
reP
Or
tIn
G (C
On
td.)
a.
Bus
ines
s se
gmen
ts (c
ontd
.)
List
ed S
haria
h-co
mpl
iant
inve
stm
ent
secu
ritie
s
List
edSh
aria
h no
n-co
mpl
iant
equ
ity
secu
rity
(not
e 14
(a))
unl
iste
d S
haria
h-co
mpl
iant
inve
stm
ent
sec
uriti
es
Oth
er S
haria
h-co
mpl
iant
in
vest
men
tsto
tal
rm
rm
rm
rm
rm
1.6.
2017
to 3
0.11
.201
7r
even
ueS
egm
ent i
ncom
e 18
,639
,875
-
-82
9,35
3 S
egm
ent e
xpen
ses
(1,6
45,5
25)
--
-N
et s
egm
ent i
ncom
e re
pres
entin
g se
gmen
t re
sults
16,9
94,3
50
--
829,
353
17,8
23,7
03
Una
lloca
ted
expe
nditu
re(3
,188
,596
)In
com
e be
fore
tax
14,6
35,1
07
Inco
me
tax
-N
et in
com
e af
ter t
ax14
,635
,107

K
enan
ga S
yaria
h G
row
th F
und
Inte
rim R
epor
t 4
1
18.
SeG
men
tAL
reP
Or
tIn
G (C
On
td.)
a.
Bus
ines
s se
gmen
ts (c
ontd
.)
List
ed S
haria
h-co
mpl
iant
inve
stm
ent
secu
ritie
s
List
edSh
aria
h no
n-co
mpl
iant
equ
ity
secu
rity
(not
e 14
(a))
unl
iste
d S
haria
h-co
mpl
iant
inve
stm
ent
sec
uriti
es
Oth
er S
haria
h-co
mpl
iant
in
vest
men
tsto
tal
rm
rm
rm
rm
rm
30.1
1.20
17A
sset
sFi
nanc
ial a
sset
s at
FV
TPL
344,
476,
179
-13
6,79
2 -
Isla
mic
dep
osits
--
-53
,535
,513
O
ther
seg
men
t ass
ets
5,15
8,18
3 -
-11
,791
To
tal s
egm
ent a
sset
s34
9,63
4,36
2 -
136,
792
53,5
47,3
04
403,
318,
458
Una
lloca
ted
asse
ts
2,56
0,87
8 40
5,87
9,33
6
Liab
ilitie
sS
egm
ent l
iabi
litie
s7,
846,
083
--
-7,
846,
083
Una
lloca
ted
liabi
litie
s34
8,76
8 8,
194,
851
b.
Geo
grap
hica
l seg
men
ts
A
s al
l of t
he F
und’
s in
vest
men
ts a
re lo
cate
d in
Mal
aysi
a, d
iscl
osur
e by
geo
grap
hica
l seg
men
ts is
not
rele
vant
.

42 Kenanga Syariah Growth Fund Interim Report
19. fInAnCIAL InStrumentS
a. Classification of financial instruments
The Fund’s financial assets and financial liabilities are measured on an ongoing basis at either fair value or at amortised cost based on their respective classification. The significant accounting policies in Note 3 describe how the classes of financial instruments are measured, and how income and expenses, including fair value gains and losses, are recognised.
The following table analyses the financial assets and financial liabilities of the Fund in the statement of financial position by the class of financial instruments to which they are assigned and therefore by the measurement basis.
financial assets at
fVtPL receivablesfinancialliabilities total
rm rm rm rm
30.11.2018AssetsListed Shariah-
compliant equity securities 382,871,028 - - 382,871,028
Listed Islamic collective investment scheme 3,723,342 - - 3,723,342
Listed Shariah-compliant warrants 1,323,762 - - 1,323,762
Listed Shariah non-compliant equity security (Note 14(a)) 845,975 - - 845,975
Islamic deposits - 78,522,502 - 78,522,502 Amount due from
Manager - 470,654 - 470,654Amount due from
licensed financial institutions - 5,119,405 - 5,119,405
Other receivables - 633,943 - 633,943 Cash at bank - 22,766 - 22,766
388,764,107 84,769,270 - 473,533,377
LiabilitiesAmount due to
Trustee - - 19,153 19,153 Other payables - - 10,166,700 10,166,700
- - 10,185,853 10,185,853

Kenanga Syariah Growth Fund Interim Report 43
19. fInAnCIAL InStrumentS (COntd.)
a. Classification of financial instruments (contd.)
financial assets at
fVtPL receivablesfinancial liabilities total
rm rm rm rm
30.11.2017AssetsListed Shariah-
compliant equity securities 337,781,347 - - 337,781,347
Listed Islamic collective investment scheme 6,156,465 - - 6,156,465
Listed Shariah-compliant warrants 538,367 - - 538,367
Unlisted Shariah-compliant investment securities 136,792 - - 136,792
Islamic deposits - 53,535,513 - 53,535,513 Amount due from
licensed financial institutions - 4,754,306 - 4,754,306
Other receivables - 415,668 - 415,668 Cash at bank - 2,551,786 - 2,551,786
344,612,971 61,257,273 - 405,870,244
LiabilitiesAmount due to
Manager - - 258,734 258,734 Amount due to
Trustee - - 16,284 16,284 Amount due to
licensed financial institutions - - 7,846,083 7,846,083
- - 8,121,101 8,121,101
b. financial instruments that are carried at fair value
The Fund’s financial assets at FVTPL are carried at fair value. The fair values of these financial assets were determined using prices in active markets.
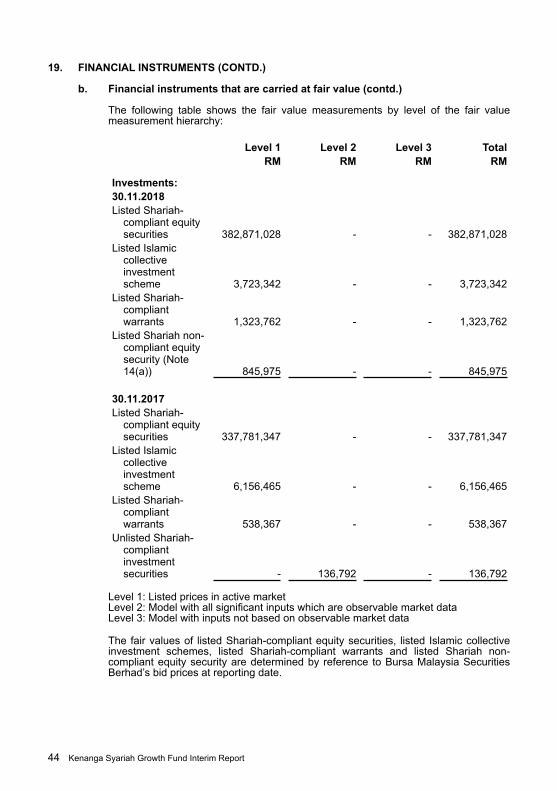
44 Kenanga Syariah Growth Fund Interim Report
19. fInAnCIAL InStrumentS (COntd.)
b. financial instruments that are carried at fair value (contd.)
The following table shows the fair value measurements by level of the fair value measurement hierarchy:
Level 1 Level 2 Level 3 totalrm rm rm rm
Investments:30.11.2018Listed Shariah-
compliant equity securities 382,871,028 - - 382,871,028
Listed Islamic collective investment scheme 3,723,342 - - 3,723,342
Listed Shariah-compliant warrants 1,323,762 - - 1,323,762
Listed Shariah non-compliant equity security (Note 14(a)) 845,975 - - 845,975
30.11.2017Listed Shariah-
compliant equity securities 337,781,347 - - 337,781,347
Listed Islamic collective investment scheme 6,156,465 - - 6,156,465
Listed Shariah-compliant warrants 538,367 - - 538,367
Unlisted Shariah-compliant investment securities - 136,792 - 136,792
Level 1: Listed prices in active marketLevel 2: Model with all significant inputs which are observable market dataLevel 3: Model with inputs not based on observable market data
The fair values of listed Shariah-compliant equity securities, listed Islamic collective investment schemes, listed Shariah-compliant warrants and listed Shariah non-compliant equity security are determined by reference to Bursa Malaysia Securities Berhad’s bid prices at reporting date.

Kenanga Syariah Growth Fund Interim Report 45
19. fInAnCIAL InStrumentS (COntd.)
c. financial instruments not carried at fair value and which their carrying amounts are reasonable approximations of fair value
The carrying amounts of the Fund’s other financial assets and financial liabilities are not carried at fair value but approximate fair values due to the relatively short term maturity of these financial instruments.
20. CAPItAL mAnAGement
The capital of the Fund can vary depending on the demand for creation and cancellation of units to the Fund.
The Fund’s objectives for managing capital are:
a. To invest in Shariah-compliant investments meeting the description, risk exposure and expected return indicated in its prospectus;
b. To maintain sufficient liquidity to meet the expenses of the Fund, and to meet cancellation requests as they arise; and
c. To maintain sufficient fund size to make the operations of the Fund cost-efficient.
No changes were made to the capital management objectives, policies or processes during the current and previous financial periods.

This page has been intentionally left blank

This page has been intentionally left blank

This page has been intentionally left blank


Investor Services CenterToll Free Line: 1 800 88 3737Fax: +603 2172 3133Email: [email protected]
Head Office, Kuala LumpurLevel 14, Kenanga Tower, 237 Jalan Tun Razak, 50400 Kuala Lumpur, Malaysia.Tel: 03-2172 3000 Fax: 03-2172 3080


