
KENANGA DIVERSIFIED FUND - …€¦Fax: 03-2161 4990 E-mail: [email protected]...
52
ANNUAL REPORT For the Financial Year Ended 30 November 2015 KENANGA DIVERSIFIED FUND Kenanga Investors Berhad (353563-P)
-
Upload
vuongthien -
Category
Documents
-
view
214 -
download
0
Transcript of KENANGA DIVERSIFIED FUND - …€¦Fax: 03-2161 4990 E-mail: [email protected]...

ANNUAL REPORT
For the Financial Year Ended 30 November 2015
KENANGA DIVERSIFIED FUND
Kenanga Investors Berhad (353563-P)


KENANGA DIVERSIFIED FUND
Contents Page
Corporate Directory ii
Directory of Manager’s Offi ces iii
Fund Information 1
Manager’s Report 2 - 7
Fund Performance 8 - 10
Trustee’s Report 11
Independent Auditor’s Report 12 - 13
Statement by the Manager 14
Financial Statement 15 - 45
ii Kenanga Diversifi ed Fund Annual Report
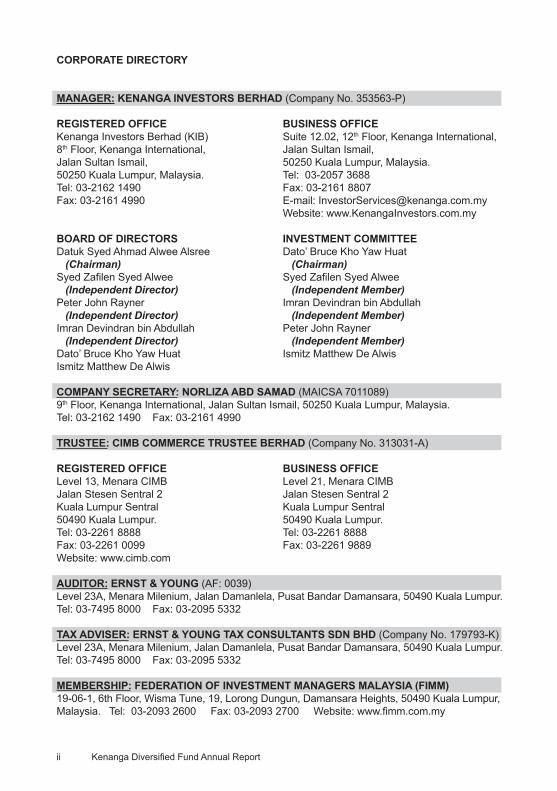
CORPORATE DIRECTORY
MANAGER: KENANGA INVESTORS BERHAD (Company No. 353563-P) REGISTERED OFFICE BUSINESS OFFICEKenanga Investors Berhad (KIB) Suite 12.02, 12th Floor, Kenanga International,8th Floor, Kenanga International, Jalan Sultan Ismail,Jalan Sultan Ismail, 50250 Kuala Lumpur, Malaysia.50250 Kuala Lumpur, Malaysia. Tel: 03-2057 3688Tel: 03-2162 1490 Fax: 03-2161 8807Fax: 03-2161 4990 E-mail: [email protected] Website: www.KenangaInvestors.com.my
BOARD OF DIRECTORS INVESTMENT COMMITTEEDatuk Syed Ahmad Alwee Alsree Dato’ Bruce Kho Yaw Huat (Chairman) (Chairman)Syed Zafi len Syed Alwee Syed Zafi len Syed Alwee (Independent Director) (Independent Member)Peter John Rayner Imran Devindran bin Abdullah (Independent Director) (Independent Member)Imran Devindran bin Abdullah Peter John Rayner (Independent Director) (Independent Member)Dato’ Bruce Kho Yaw Huat Ismitz Matthew De AlwisIsmitz Matthew De Alwis
COMPANY SECRETARY: NORLIZA ABD SAMAD (MAICSA 7011089)9th Floor, Kenanga International, Jalan Sultan Ismail, 50250 Kuala Lumpur, Malaysia.Tel: 03-2162 1490 Fax: 03-2161 4990 TRUSTEE: CIMB COMMERCE TRUSTEE BERHAD (Company No. 313031-A) REGISTERED OFFICE BUSINESS OFFICE Level 13, Menara CIMB Level 21, Menara CIMBJalan Stesen Sentral 2 Jalan Stesen Sentral 2Kuala Lumpur Sentral Kuala Lumpur Sentral50490 Kuala Lumpur. 50490 Kuala Lumpur.Tel: 03-2261 8888 Tel: 03-2261 8888Fax: 03-2261 0099 Fax: 03-2261 9889Website: www.cimb.com
AUDITOR: ERNST & YOUNG (AF: 0039)Level 23A, Menara Milenium, Jalan Damanlela, Pusat Bandar Damansara, 50490 Kuala Lumpur.Tel: 03-7495 8000 Fax: 03-2095 5332
TAX ADVISER: ERNST & YOUNG TAX CONSULTANTS SDN BHD (Company No. 179793-K)Level 23A, Menara Milenium, Jalan Damanlela, Pusat Bandar Damansara, 50490 Kuala Lumpur.Tel: 03-7495 8000 Fax: 03-2095 5332
MEMBERSHIP: FEDERATION OF INVESTMENT MANAGERS MALAYSIA (FIMM)19-06-1, 6th Floor, Wisma Tune, 19, Lorong Dungun, Damansara Heights, 50490 Kuala Lumpur, Malaysia. Tel: 03-2093 2600 Fax: 03-2093 2700 Website: www.fi mm.com.my

iiiKenanga Diversifi ed Fund Annual Report
DIRECTORY OF MANAGER’S OFFICES
REGIONAL BRANCH OFFICES:
Kuala LumpurSuite 12.02, 12th FloorKenanga InternationalJalan Sultan Ismail50250 Kuala Lumpur, MalaysiaTel : 03-2057 3688 Fax : 03-2161 8807
MelakaNo. 25-1, Jalan Kota Laksamana 2/17Taman Kota Laksamana, Seksyen 275200 MelakaTel : 06-281 8913 Fax : 06-281 4286
KlangNo. 12, Jalan Batai Laut 3, Taman Intan41300 Klang, Selangor Darul EhsanTel : 03-3341 8818 / 03-3348 7889 Fax : 03-3341 8816
Penang16th Floor, Menara Boustead Penang 39, Jalan Sultan Ahmad Shah 10050 Penang. Tel : 04-227 3788 / 04-210 6644Fax : 04-226 5120
Seremban 2nd Floor, No. 1D-2 Jalan Tuanku Munawir 70000 Seremban, Negeri SembilanTel : 06-761 5678 Fax : 06-761 2243
Johor BahruLot 11.03, 11th FloorMenara MSC Cyberport5 Jalan Bukit Meldrum80300 Johor Bahru, JohorTel : 07-223 7505 / 4798 Fax : 07-223 4802
Kuching1st Floor, No 71Lot 10900, Jalan Tun Jugah93350 Kuching, SarawakTel : 082-572 228 Fax : 082-572 229
Kota KinabaluA-03-11, 3rd FloorBlock A Warisan SquareJalan Tun Fuad Stephens88000 Kota Kinabalu, SabahTel : 088-447 089 / 088-448 106 Fax : 088-447 039
IpohSuite 1, 2nd Floor,63 Persiaran Greenhill,30450 Ipoh, Perak, MalaysiaTel : 05-254 7573 / 7570 Fax : 05-254 7606

1 Kenanga Diversifi ed Fund Annual Report
1. FUND INFORMATION
1.1 Fund Name
Kenanga Diversifi ed Fund (KDF or the Fund)
1.2 Fund Category / Type
Mixed Asset / Income & Growth
1.3 Investment Objective
The Fund aims to provide investors with capital appreciation with stability of income over a medium to long-term investment horizon from a diversifi ed investment portfolio.
1.4 Investment Strategy
The Fund’s asset allocation includes a mixture of equity securities, fi xed income securities and money market instruments. The maximum equity weighting is limited to 70% of the Fund’s NAV. In times of actual or anticipated adverse market conditions, the equity exposure may be reduced. The Fund engages active tactical asset allocation between the asset classes which is determined by analysing the economy, which infl uences the business cycle, and market factors.
1.5 Duration
The Fund was launched on 23 April 2004 and it shall exist as long as it appears to the Manager and the Trustee that it is in the interests of the unitholders for it to continue.
1.6 Performance Benchmark
A composite of the FTSE Bursa Malaysia Top 100 Index (FBM 100) (60%) and the All Malaysian Government Securities (MGS) Index (40%) obtainable from http://www.bursamalaysia.com and www.quantshop.com.
1.7 Distribution Policy
Income (if any) will be distributed annually on a best effort basis.
1.8 Breakdown of unit holdings of KDF as at 30 November 2015
Size of holdings No. of unitholders No. of units held 5,000 and below 2,669 2,537,182 5,001 - 10,000 86 588,746 10,001 - 50,000 44 696,770 50,001 - 500,000 5 411,992 500,001 and above 1 780,750 Total 2,805 5,015,440

2Kenanga Diversifi ed Fund Annual Report
2. MANAGER’S REPORT
2.1 Explanation on whether the Fund has achieved its investment objective
The Fund had fulfi lled its investment objective, by investing in a mixture of equity securities, fi xed income securities and money market instruments.
2.2 Comparison between the Fund’s performance during fi nancial year under review and performance of the benchmark
Performance Chart Since Launch (23/4/2004– 30/11/2015)Kenanga Diversifi ed Fund vs Benchmark *
* Benchmark: FTSE Bursa Malaysia Top 100 Index (FBM 100) (60%) and the All Malaysian Government Securities (MGS) Index (40%)
Source: Novagni Analytics and Advisory Sdn Bhd
2.3 Investment strategies and policies employed during the fi nancial year under review
For the fi nancial year under review, the Fund invested primarily in a mixture of equity securities, fi xed income securities and money market instruments in order to achieve diversifi cation in the portfolio. The strategy employed for equity was in line with that disclosed in the Master Prospectus.
For Fixed Income, the focus was on corporate bonds with target exposure at circa 30% – 40% over the fi nancial year under review.

3 Kenanga Diversifi ed Fund Annual Report
2.4 The Fund’s asset allocation as at 30 November 2015 and comparison with the previous fi nancial year
Asset 30 Nov 2015 30 Nov 2014 Quoted investment securities 53.1% 49.6% Unquoted corporate bonds 32.7% 30.2% Unquoted government guaranteed bonds 2.3% 2.0% Short term deposits and cash 11.9% 18.2%
Reason for the differences in asset allocation
The Fund’s equity exposure was increased to 53.1% as at 30 November 2015 from 49.6% in 30 November 2014 mainly because of cash deployment to buy stocks with favourable growth profi le.
2.5 Fund performance analysis based on NAV per unit (adjusted for income distribution; if any) since last review period
Period under review Kenanga Diversifi ed Fund 1.04% Benchmark * -3.16 * FTSE Bursa Malaysia Top 100 Index (FBM 100) (60%) and the All Malaysian Government Securities
(MGS) Index (40%) Source: Novagni Analytics and Advisory Sdn Bhd
The Fund outperformed the benchmark by 4.20% with a return of 1.04% for the fi nancial year under review. The outperformance was mainly due to stock selection.
2.6 Review of the market
Equity Market Review
The year began with a broad-based sell-off across markets. This was as a slew of macroeconomic concerns, such as: i) a deceleration in global economic growth, ii) defl ationary risks, iii) low commodity prices, and iv) concerns that the ECB may not meet the market’s expectations for a full-scale quantitative easing (QE), defl ated market sentiment. Subsequently, regional markets in countries that are net oil importers saw gains in their markets, as low crude oil prices provided central banks with more room for accommodative monetary measures.
The FBM KLCI rebounded in mid-January, tracking crude oil prices that saw an interim low that month. The revision of the 2015 Budget on 20 Jan, to factor in: i) a lower USD55 per barrel (bbl) crude oil price assumption, ii) savings from the removal of retail fuel subsidies, and iii) the maintenance of the dividend payout by Petronas in 2015, helped reassure markets about the country’s fi scal health. However, the gains were reversed and the bellwether index remained stuck in a range-bound pattern when the Fitch Rating Agency (Fitch) warned of a possible downgrade to Malaysia’s sovereign rating. On the

4Kenanga Diversifi ed Fund Annual Report
2.6 Review of the market (Contd.)
Equity Market Review (Contd.)
external front, the ECB’s announcement of a full-scale QE towards the end of January helped offset rising concerns of a Greek exit (Grexit) from the Eurozone after the anti-austerity Syriza party was elected to power in the EU member state.
At the end of June, Greece shut down its banking system for six days and exerted controls to prevent funds from fl owing out of the country. On 30 Jun, Fitch announced that it had affi rmed Malaysia’s long-term foreign currency sovereign credit rating at “A-”, with the outlook upgraded to “Stable” from “Negative”. However, the Fitch’s rating upgrade did little to excite the market, as the perceived threat of contagion from Greece continued to defl ate investor sentiment.
The FBM KLCI buckled under strong selling pressure when China announced a surprise devaluation of the CNY in mid-August, which sent markets reeling across the globe. The move sparked concerns over fl agging growth in the world’s second-largest economy, as well as the implications of a cheaper CNY on the demand for Malaysian exports and commodity prices.
On 14 Sep, the FBM KLCI traded higher as Prime Minister Dato’ Sri Najib Razak unveiled a slew of stimulus measures aimed at strengthening the economy, amongst which included the pumping of MYR20bn into ValueCap to invest in undervalued Malaysian stocks. During the September FOMC meeting, the US Federal Reserve (Fed) left US interest rates unchanged in view of the weak global economy, persistently low infl ation and unstable fi nancial markets.
On 5 Oct, the US and 11 other nations (including Malaysia) reached the landmark Trans-Pacifi c Partnership (TPP) deal, which would lower trade barriers to goods and services, and set commercial rules for two-fi fths of the global economy. A combination of the aforementioned factors lifted market sentiment and pushed the benchmark index above 1,700 pts for most of October. The 2016 Budget announced on 23 Oct had limited impact on the local benchmark and the MYR. However, the local benchmark retreated when Fitch raised doubts over Malaysia’s ability to achieve its fi scal defi cit target of 3.1% in 2016. The index further declined in the wake of the Fed’s October meeting, where the central bank stood pat on rates but explicitly signalled that a December rate hike could be fi rmly in play.
The FBM KLCI rebounded momentarily in early November as Brent crude breached the USD50 per bbl mark for the fi rst time since end-July. However, the market later reversed into a decline as optimistic US jobs data for October strengthened the case for a rate hike by the Fed in December. The local bourse breathed a sigh of relief and rallied on the proposed sale of Edra Global Energy – a unit of a government-linked company (GLC) that is wholly-owned by the MOF – to a China state-owned fi rm for MYR9.83bn (USD2.3bn) on 23 Nov. This has been seen as a key step for the state fund to pare down its debt and restore confi dence.

5 Kenanga Diversifi ed Fund Annual Report
2.6 Review of the market (Contd.)
Equity Market Outlook
Overall, we remain cautiously optimistic on equities in 2016 as uncertainty over the pace of interest rate normalisation in US and sluggish economic recovery globally will keep volatility high at least in 1H16. While US and Europe will recover modestly, weakness in China and its policy direction, alongside with reversal of capital fl ows globally on the back of higher funding cost in US post rate hike will exert pressure in emerging markets. However, Malaysia was one of the worst performing markets in USD term in 2015, and now with some external risks being partially priced in and currency weakness refl ected domestic headwinds, we believe valuations have emerged. Stock picking remains key for outperformance as not all sectors of the economy are expected to do well amid the sluggish domestic demand. We continue to favour certain sectors like exporters, construction, infrastructure and technology. Exporters are expected to benefi t from recovering external demand and favourable forex impact while government infra spending remains another bright spot with construction GDP growing at double the pace of headline GDP, as the government commits to mega transportation-related projects such as MRT and LRT.
Fixed Income Market Review
Markets were grappling with timing of fi rst Fed hiking cycle, slowing Chinese growth and renewed plunge in commodity prices. The spectre of Fed normalization loomed even as the markets were heavily discounting timing of hikes and this kept 10-year US Treasury (UST) yields fi rmly at the bottom half of its 2.0-2.5% trading range for most part of 2015.
Market has been forced to contend with a curveball from People’s Bank of China (PBoC) as well. Concerns on the Chinese economy were unavoidable with early sign of warning on the back of one-off Chinese Yuan’s (CNY devaluation that stoked fears of competitive devaluation.
In Asia, implied short-term rates were generally higher. The performance of Asian government bonds have been mixed given the nature of being commodity or trade dependent. Commodity producers such as Malaysia and Indonesia performed poorly while China, Korea and Taiwan government bonds performed well with disappointing macro sentiments.
Malaysian sovereign bonds recovered partial losses towards year-end demand with net-buying interest from offshore players and temporary spike in crude oil prices. Yield curve ended steeper as gains were skewed towards the front end of the curve.
At fi nancial year end, the 3-, 5-, 7- and 10-year benchmark MGS yields settled at a respective 3.42% (+33 bps), 3.70% (+9 bps), 4.08% (+4 bps) and 4.20% (+13 bps) y-o-y.

6Kenanga Diversifi ed Fund Annual Report
2.6 Review of the market (Contd.)
Fixed Income Market Outlook
2016 will be a year of relative value rather than an outright directional gain and learning to react as liquidity begins to tighten and credit spreads to widen further as defaults are likely to rise moderately. Rate adjustments will likely prove greater in the front end of the curve on a bear fl attening formation.
In the case of Malaysia, we continue to expect Bank Negara Malaysia (BNM) to keep policy rate steady at 3.25% this year but weak commodity prices, high loan-deposit ratio and decline in excess liquidity in the system will push 3-month KLIBOR and front-end RM swap rates higher in the process.
Sovereign rating is expected to remain stable due to fi scal sustainability, declining household debts, return of investment cycle and improving credit metrics as measured by 5-year credit default swap. Ringgit Malaysia’s risk premium is expected to recede, which will at least limit underperformance from here. Risk of twin defi cits is easing as the focus is shifting to import compression and exports are benefi tting from over-sold currency.

7 Kenanga Diversifi ed Fund Annual Report
2.7 Income Distribution
For the fi nancial year under review, the Fund did not declare any income distribution.
2.8 Details of any unit split exercise
The Fund did not carry out any unit split exercise during the fi nancial year under review.
2.9 Signifi cant changes in the state of affair of the Fund during the fi nancial year
There were no signifi cant changes in the state of affair of the Fund during the fi nancial year and up until the date of the manager’s report, not otherwise disclosed in the fi nancial statements.
2.10 Circumstances that materially affect any interests of the unitholders
During the fi nancial year under review, there are no circumstances that materially affect any interests of the unitholders.
2.11 Rebates & Soft commissions
Any rebates received are channeled back to the Fund. On the other hand, soft commissions received from the stockbrokers for goods and services such as technical analysis software, fundamental database, fi nancial wire services, stock quotation system and portfolio management software incidental to investment management of the Fund shall be retained by the Manager. For the fi nancial year under review, the Manager has received soft commissions from stockbrokers.

8Kenanga Diversifi ed Fund Annual Report
3. FUND PERFORMANCE
3.1 Details of portfolio composition of Kenanga Diversifi ed Fund (“the Fund”) for the last 3 fi nancial years as at 30 November are as follows:
a. Distribution among industry sectors and category of investments:
FY 2015 FY 2014 FY 2013 % % % Trading/Services 12.1 21.5 26.3 Technology 9.4 2.0 1.2 Industrial products 8.0 6.9 3.8 Finance 7.9 6.3 15.1 Consumer products 6.7 - 1.5 Construction 3.9 - - Properties 2.1 3.2 2.6 Infrastructure 1.3 4.0 4.1 Plantations - 1.4 1.5 REITs 1.7 2.5 2.2 Warrants - 1.8 2.1 Unquoted corporate bonds 32.7 30.2 28.1 Unquoted government guaranteed bonds 2.3 2.0 5.1 Short term deposits and cash 11.9 18.2 6.4 100.0 100.0 100.0
Note: The above mentioned percentages are based on total investment market value plus cash.
b. Distribution among markets
The Fund invests in local quoted investment securities, unquoted bonds and cash instruments only.

9 Kenanga Diversifi ed Fund Annual Report
3.2 Performance details of the Fund for the last 3 fi nancial years ended 30 November are as follows:
FY 2015 FY 2014 FY 2013 Net asset value (“NAV”) (RM Million) 4.33* 5.11 39.71 Units in circulation (Million) 5.02 5.98 46.80 NAV per unit (RM) 0.8634* 0.8545* 0.8485 Highest NAV per unit (RM) 0.8897 0.9141 0.8521 Lowest NAV per unit (RM) 0.7904 0.8425 0.7517 Total return (%) 1.04 0.71 12.73 - Capital growth (%) 1.04 0.71 12.73 - Income growth (%) - - - Gross distribution per unit (sen) - - - Net distribution per unit (sen) - - - Management expense ratio (“MER”) (%)1 2.76 1.91 1.68 Portfolio turnover ratio (“PTR”) (times)2 0.68 1.37 1.61
Note: Total return is the actual return of the Fund for the respective fi nancial years, computed based on NAV per unit and net of all fees.
MER is computed based on the total fees and expenses incurred by the Fund divided by the average fund size calculated on a daily basis. PTR is computed based on the average of the total acquisitions and total disposals of investment securities of the Fund divided by the average fund size calculated on a daily basis.
Above NAV and NAV per unit are not shown as ex-distribution as there were no distribution declared by the Fund in the current fi nancial year under review.
1 MER is higher against previous fi nancial year mainly due to decrease in average fund
size during the fi nancial year under review.
2 PTR is lower against the previous fi nancial year due to the adoption of new universe of stocks and investment policy while the Fund focused more on growth rather than trading stocks.
* Based on bid price fair valuation method on all investments held by the Fund as at 30 November 2015, the NAV and NAV per unit would be RM4.32 million and RM0.8610 respectively.
(As disclosed under Note 12 of the fi nancial statements)

10Kenanga Diversifi ed Fund Annual Report
3.3 Average total return of the Fund
1 Year 3 Years 5 Years 30 Nov 14 30 Nov 12 30 Nov 10 -30 Nov 15 -30 Nov 15 -30 Nov 15
Kenanga Diversifi ed Fund 1.04% 4.90% 9.35% Benchmark * -3.16% 2.22% 3.22%
* FTSE Bursa Malaysia Top 100 Index (FBM 100) (60%) and the All Malaysian Government Securities (MGS) Index (40%)
Source: Lipper & Novagni Analytics and Advisory Sdn Bhd
3.4 Annual total return of the Fund
Period under review 1 Year 1 Year 1 Year 1 Year
30 Nov 14 30 Nov 13 30 Nov 12 30 Nov 11 30 Nov 10 -30 Nov 15 -30 Nov 14 -30 Nov 13 -30 Nov 12 -30 Nov 11
Kenanga Diversifi ed Fund 1.04% 0.71% 12.73% 18.44% 8.02% Benchmark * -3.16% 1.46% 8.57% 7.59% 2.11%
* FTSE Bursa Malaysia Top 100 Index (FBM 100) (60%) and the All Malaysian Government Securities (MGS) Index (40%)
Source: Lipper & Novagni Analytics and Advisory Sdn Bhd
Investors are reminded that past performance is not necessarily indicative of future performance. Unit prices and investment returns may fl uctuate.

11 Kenanga Diversifi ed Fund Annual Report
4. TRUSTEE’S REPORT TO THE UNITHOLDERS OF KENANGA DIVERSIFIED FUND
We, CIMB COMMERCE TRUSTEE BERHAD (“the Trustee”), being the Trustee of KENANGA DIVERSIFIED FUND (“the Fund”) are of the opinion that KENANGA INVESTORS BERHAD (“the Manager”), acting in the capacity of Manager of the Fund, has fulfi lled their duties in the following manner for the fi nancial year ended 30 November 2015.
a) The Fund has been managed in accordance with the limitations imposed on the
investment powers of the Manager and the Trustee under the Deed, the Securities Commission Malaysia’s Guidelines on Unit Trust Funds, the Capital Markets and Services Act 2007 (as amended from time to time) and other applicable laws;
b) Valuation/pricing of units of the Fund has been carried out in accordance with the
Deed and relevant regulatory requirements; and c) Creation and cancellation of units have been carried out in accordance with the Deed
and relevant regulatory requirements.
For and on behalf of CIMB COMMERCE TRUSTEE BERHAD
LEE KOOI YOKE Chief Operating Offi cer
Kuala Lumpur, Malaysia 26 January 2016

12Kenanga Diversifi ed Fund Annual Report
5. INDEPENDENT AUDITORS’ REPORT TO THE UNIT HOLDERS OF KENANGA DIVERSIFIED FUND
Report on the fi nancial statements
We have audited the fi nancial statements of Kenanga Diversifi ed Fund (“the Fund”), which comprise the statement of fi nancial position as at 30 November 2015 and the statement of comprehensive income, statement of changes in net asset value and statement of cash fl ows for the fi nancial year then ended, and a summary of signifi cant accounting policies and other explanatory information, as set out on pages 15 to 45.
Manager’s and Trustee’s responsibility for the fi nancial statements and fair presentation
The Manager of the Fund is responsible for the preparation of fi nancial statements so as to give a true and fair view in accordance with Malaysian Financial Reporting Standards and International Financial Reporting Standards. The Manager is also responsible for such internal control as the Manager determines is necessary to enable the preparation of fi nancial statements that are free from material misstatement, whether due to fraud or error. The Trustee is responsible for ensuring that the Manager maintains proper accounting and other records as are necessary to enable true and fair presentation of these fi nancial statements.
Auditors’ responsibility
Our responsibility is to express an opinion on these fi nancial statements based on our audit. We conducted our audit in accordance with approved standards on auditing in Malaysia. Those standards require that we comply with ethical requirements and plan and perform the audit to obtain reasonable assurance about whether the fi nancial statements are free from material misstatement.
An audit involves performing procedures to obtain audit evidence about the amounts and disclosures in the fi nancial statements. The procedures selected depend on our judgment, including the assessment of risks of material misstatement of the fi nancial statements, whether due to fraud or error. In making those risk assessments, we consider internal control relevant to the Fund’s preparation of fi nancial statements that give a true and fair view in order to design audit procedures that are appropriate in the circumstances, but not for the purpose of expressing an opinion on the effectiveness of the Fund’s internal control. An audit also includes evaluating the appropriateness of the accounting policies used and the reasonableness of accounting estimates made by the Manager, as well as evaluating the overall presentation of the fi nancial statements.
We believe that the audit evidence we have obtained is suffi cient and appropriate to provide a basis for our audit opinion.

13 Kenanga Diversifi ed Fund Annual Report
5. INDEPENDENT AUDITORS’ REPORT TO THE UNIT HOLDERS OF KENANGA DIVERSIFIED FUND (CONTD.)
Opinion
In our opinion, the fi nancial statements give a true and fair view of the fi nancial position of the Fund as at 30 November 2015 and of its fi nancial performance, changes in net asset value and cash fl ows for the fi nancial year then ended in accordance with Malaysian Financial Reporting Standards and International Financial Reporting Standards.
Other matters
This report is made solely to the unitholders of the Fund, as a body, and for no other purpose. We do not assume responsibility to any other person for the content of this report.
Ernst & Young Chan Hooi Lam AF: 0039 No. 2844/02/18(J) Chartered Accountants Chartered Accountant
Kuala Lumpur, Malaysia
26 January 2016
14Kenanga Diversifi ed Fund Annual Report
6. STATEMENT BY THE MANAGER
I, Ismitz Matthew De Alwis, being a director of Kenanga Investors Berhad, do hereby state that, in the opinion of the Manager, the accompanying statement of fi nancial position as at 30 November 2015 and the related statement of comprehensive income, statement of changes in net asset value and statement of cash fl ows for the fi nancial year ended 30 November 2015 together with notes thereto, are drawn up in accordance with Malaysian Financial Reporting Standards and International Financial Reporting Standards so as to give a true and fair view of the fi nancial position of Kenanga Diversifi ed Fund as at 30 November 2015 and of its fi nancial performance and cash fl ows for the fi nancial year then ended and comply with the requirements of the Deed.
For and on behalf of the Manager Kenanga Investors Berhad
Ismitz Matthew De Alwis
Kuala Lumpur, Malaysia
26 January 2016

The accompanying notes form an integral part of the fi nancial statements.
Kenanga Diversifi ed Fund Annual Report15
7. FINANCIAL STATEMENT
7.1 STATEMENT OF COMPREHENSIVE INCOME FOR THE FINANCIAL YEAR ENDED 30 NOVEMBER 2015
Note 2015 2014 RM RM INVESTMENT INCOMEDividend income 103,102 229,203Interest income 94,654 286,274Net (loss)/gain from investments: Financial assets at fair value through profi t or loss (“FVTPL”) 4 (17,098) 1,214,766 180,658 1,730,243
EXPENSESManager’s fee 5 74,018 238,005Trustee’s fee 6 9,050 16,290Auditors’ remuneration 6,000 6,000Tax agent’s fee 4,400 6,586Administration expenses 37,825 27,606 131,293 294,487
NET INCOME BEFORE TAX 49,365 1,435,756
Income tax 7 52 7,006
NET INCOME AFTER TAX, REPRESENTING TOTAL COMPREHENSIVE INCOME FOR THE YEAR 49,417 1,442,762
Net income after tax is made up as follows: Realised (loss)/gain (55,840) 3,594,542 Unrealised gain/(loss) 4 105,257 (2,151,780) 49,417 1,442,762

The accompanying notes form an integral part of the fi nancial statements.
Kenanga Diversifi ed Fund Annual Report 16
7.2 STATEMENT OF FINANCIAL POSITION AS AT 30 NOVEMBER 2015
Note 2015 2014 RM RM
INVESTMENTS
Financial assets at FVTPL 4 3,766,184 4,189,660 Short term deposits 8 497,064 916,275 4,263,248 5,105,935 OTHER ASSETS Other receivables 9 104,035 12,438 Tax recoverable 14,737 14,685 Cash at bank 10,353 14,770 129,125 41,893 TOTAL ASSETS 4,392,373 5,147,828 LIABILITIES Amount due to Manager 15,421 6,625 Amount due to Trustee 740 690 Other payables 10 57,742 42,900 TOTAL LIABILITIES 73,903 50,215 EQUITY Unitholders’ contribution 2,480,487 802,361 Retained earnings 1,837,983 4,295,252 NET ASSET VALUE (“NAV”) ATTRIBUTABLE TO UNITHOLDERS 11 4,318,470 5,097,613 TOTAL EQUITY AND LIABILITIES 4,392,373 5,147,828 NUMBER OF UNITS IN CIRCULATION 11(a) 5,015,440 5,976,709 NET ASSET VALUE PER UNIT (RM) 12 0.8610 0.8529

The accompanying notes form an integral part of the fi nancial statements.
Kenanga Diversifi ed Fund Annual Report17
7.3 STATEMENT OF CHANGES IN NET ASSET VALUE FOR THE FINANCIAL YEAR ENDED 30 NOVEMBER 2015
Unitholders’ Retained Total Note contribution earnings NAV
RM RM RM
2015At beginning of the year 802,361 4,295,252 5,097,613 Total comprehensive income - 49,417 49,417 Creation of units 11(a) 508,110 - 508,110 Cancellation of units 11(a) (1,309,437) - (1,309,437)Distribution equalisation 11(a) (27,233) - (27,233)Reclassifi cation of retained earnings 11(a) 2,506,686 (2,506,686) -At end of the year 2,480,487 1,837,983 4,318,470
2014At beginning of the year 32,293,197 7,351,492 39,644,689Total comprehensive income - 1,442,762 1,442,762Creation of units 11(a) 712,879 - 712,879Cancellation of units 11(a) (34,516,724) - (34,516,724)Distribution equalisation 11(a) (2,185,993) - (2,185,993)Reclassifi cation of retained earnings 11(a) 4,499,002 (4,499,002) -At end of the year 802,361 4,295,252 5,097,613

The accompanying notes form an integral part of the fi nancial statements.
Kenanga Diversifi ed Fund Annual Report 18
7.4 STATEMENT OF CASH FLOWS FOR THE FINANCIAL YEAR ENDED 30 NOVEMBER 2015
2015 2014 RM RM
CASH FLOWS FROM OPERATING AND INVESTING ACTIVITIES
Proceeds from sale of fi nancial assets at FVTPL 3,347,019 38,169,835Purchase of fi nancial assets at FVTPL (3,027,345) (4,089,713)Dividends received 104,054 265,614Interest received 89,831 422,550Manager’s fee paid (74,626) (288,670)Trustee’s fee paid (9,000) (18,165)Auditors’ remuneration paid (6,000) (4,000)Tax agent’s fee paid (3,400) (9,086)Payment for other fees and expenses (25,005) (26,916)Cash generated from operating and investing activities 395,528 34,421,449Income tax refund - 6,859Net cash generated from operating and investing activities 395,528 34,428,308
CASH FLOWS FROM FINANCING ACTIVITIES
Cash received from units created 507,728 797,957Cash paid on units cancelled (1,326,884) (36,826,658)Net cash used in fi nancing activities (819,156) (36,028,701)
NET DECREASE IN CASH AND CASH EQUIVALENTS (423,628) (1,600,393)CASH AND CASH EQUIVALENTS AT BEGINNING OF THE YEAR 931,045 2,531,438CASH AND CASH EQUIVALENTS AT END OF THE YEAR 507,417 931,045
Cash and cash equivalents comprise: Cash at bank 10,353 14,770 Short term deposits 497,064 916,275 507,417 931,045

19 Kenanga Diversifi ed Fund Annual Report
7.5 NOTES TO THE FINANCIAL STATEMENTS FOR THE FINANCIAL YEAR ENDED 30 NOVEMBER 2015
1. THE FUND, THE MANAGER AND THEIR PRINCIPAL ACTIVITIES
Kenanga Diversifi ed Fund (the “Fund”) was constituted pursuant to the executed Deed dated 16 April 2004 (collectively, together with deeds supplemental thereto, referred to as “the Deed”) between the Manager, Kenanga Funds Berhad, and CIMB Commerce Trustee Berhad (“the Trustee”). The Fund commenced operations on 23 April 2004 and will continue to be in operation until terminated by the Trustee as provided under Clause 38 of the Deed.
Pursuant to the executed Seventh Supplemental Deed dated 15 May 2013 between Kenanga Investors Berhad and CIMB Commerce Trustee Berhad, Kenanga Investors Berhad was appointed as the Manager of the Fund with effect from 8 June 2013.
Kenanga Investors Berhad is a wholly-owned subsidiary of Kenanga Investment Bank Berhad, which in turn is a wholly-owned subsidiary of K & N Kenanga Holdings Berhad that is listed on the Main Board of Bursa Malaysia Securities Berhad. All of these companies are incorporated in Malaysia.
The principal place of business of the Manager is Suite 12.02, 12th Floor, Kenanga International, Jalan Sultan Ismail, 50250 Kuala Lumpur.
The Fund seeks to provide investors capital appreciation with stability of income over a medium to long term investment horizon from a diversifi ed investment portfolio. The investments include a mixture of equity securities, fi xed income securities and money market instruments.
The fi nancial statements were authorised for issue by the Chief Executive Offi cer of the Manager on 26 January 2016.
2. FINANCIAL RISK MANAGEMENT OBJECTIVES AND POLICIES
The Fund is exposed to a variety of risks including market risk (which includes interest rate risk and price risk), credit risk and liquidity risk. Whilst these are the most important types of fi nancial risks inherent in each type of fi nancial instruments, the Manager and the Trustee would like to highlight that this list does not purport to constitute an exhaustive list of all the risks inherent in an investment in the Fund.
The Fund has an approved set of investment guidelines and policies as well as internal controls which sets out its overall business strategies to manage these risks to optimise returns and preserve capital for the unitholders, consistent with the long term objectives of the Fund.

20Kenanga Diversifi ed Fund Annual Report
2. FINANCIAL RISK MANAGEMENT OBJECTIVES AND POLICIES (CONTD.) a. Market Risk Market risk is the risk that the fair value or future cash fl ows of a fi nancial instrument
will fl uctuate because of changes in market prices. Market risk includes interest rate risk and price risk.
Market risk arises when the value of the investments fl uctuates in response to the activities of individual companies, general market or economic conditions. It stems from the fact that there are economy-wide perils, which threaten all businesses. Hence, investors are exposed to market uncertainties. Fluctuation in the investments’ prices caused by uncertainties in the economic, political and social environment will affect the NAV of the Fund.
The Manager manages the risk of unfavourable changes in prices by cautious review of the investments and continuous monitoring of their performance and risk profi les.
i. Interest rate risk
The risk refers to how the changes in the interest rate environment would affect the valuation of Fund’s investments. Rate offered by the fi nancial institutions will fl uctuate according to the Overnight Policy Rate determined by Bank Negara Malaysia and this has direct correlation with the Fund’s investments in unquoted corporate bonds, unquoted government guaranteed bonds and deposits.
The Fund’s exposure to the interest rate risk is mainly confi ned to unquoted corporate bonds and unquoted government guaranteed bonds.
Interest rate risk sensitivity
The following table demonstrates the sensitivity of the Fund’s profi t for the fi nancial year to a reasonably possible change in rate of return, with all other variables held constant.
Effect on profi t Changes in rate for the year Increase/(decrease) Increase/(decrease) Basis points RM 2015 Financial assets at FVTPL 5/(5) 741/(741) 2014 Financial assets at FVTPL 5/(5) 820/(820)
In practice, the actual trading results may differ from the sensitivity analysis above and the difference could be material.

21 Kenanga Diversifi ed Fund Annual Report
2. FINANCIAL RISK MANAGEMENT OBJECTIVES AND POLICIES (CONTD.) a. Market Risk (Contd.)
i. Interest rate risk (Contd.)
Interest rate risk exposure
The following table analyses the Fund’s interest rate risk exposure. The Fund’s assets and liabilities are disclosed at fair value and categorised by the earlier of contractual re-pricing or maturity dates.
Weighted Non- average Above Above exposure to effective Up to 1 year 5 years interest rate interest 1 year -5 years -15 years movement Total rate* RM RM RM RM RM % 2015 Assets Financial assets at FVTPL - 917,127 565,313 2,283,744 3,766,184 4.93 Short term deposits 497,064 - - - 497,064 3.20 Other assets - - - 114,388 114,388 497,064 917,127 565,313 2,398,132 4,377,636 Liabilities Other liabilities - - - 73,903 73,903 Total interest rate sensitivity gap 497,064 917,127 565,313 2,324,229 4,303,733
2014 Assets Financial assets at FVTPL 501,101 926,233 212,105 2,550,221 4,189,660 4.75 Short term deposits 916,275 - - - 916,275 3.20 Other assets - - - 27,208 27,208 1,417,376 926,233 212,105 2,577,429 5,133,143 Liabilities Other liabilities - - - 50,215 50,215 Total interest rate sensitivity gap 1,417,376 926,233 212,105 2,527,214 5,082,928
* Computed based on interest-bearing assets only.

22Kenanga Diversifi ed Fund Annual Report
2. FINANCIAL RISK MANAGEMENT OBJECTIVES AND POLICIES (CONTD.) a. Market Risk (Contd.)
ii. Price risk
Price risk is the risk of unfavorable changes in the fair values of quoted equity securities, quoted collective investment schemes and quoted warrants. The Fund invests in quoted equity securities, quoted collective investment schemes and quoted warrants which are exposed to price fl uctuations. This may then affect the NAV per unit of the Fund.
Price risk sensitivity
The Manager’s best estimate of the effect on the profi t for the fi nancial year due to a reasonably possible change in investments in quoted equity securities, quoted collective investment schemes and quoted warrants with all other variables held constant is indicated in the table below:
Effect on profi t Changes in price for the year Increase/(decrease) Increase/(decrease) Basis points RM 2015 Financial assets at FVTPL 5/(5) 1,134/(1,134) 2014 Financial assets at FVTPL 5/(5) 1,270/(1,270)
In practice, the actual trading results may differ from the sensitivity analysis above and the difference could be material.
Price risk concentration
The following table sets out the Fund’s exposure and concentration to price risk based on its portfolio of fi nancial instruments as at the reporting date.
Fair value Percentage of NAV 2015 2014 2015 2014 RM RM % % Financial assets at FVTPL 2,268,866 2,540,202 52.5 49.8

23 Kenanga Diversifi ed Fund Annual Report
2. FINANCIAL RISK MANAGEMENT OBJECTIVES AND POLICIES (CONTD.) a. Market Risk (Contd.)
ii. Price risk (Contd.)
Price risk concentration (Contd.)
The Fund’s concentration of price risk from the Fund’s quoted equity securities, quoted collective investment schemes and quoted warrants analysed by sector is as follows:
Fair value Percentage of NAV 2015 2014 2015 2014
RM RM % % Trading/Services 516,460 1,103,463 11.9 21.6 Technology 401,944 101,430 9.3 2.0 Industrial products 342,195 353,133 7.9 6.9 Finance 336,016 324,416 7.8 6.4 Consumer products 285,764 - 6.6 - Construction 166,682 - 3.9 - Properties 89,744 165,684 2.1 3.2 Infrastructure 55,853 202,852 1.3 4.0 Plantations - 69,564 - 1.4 REITs 74,208 126,988 1.7 2.5 Warrants - 92,672 - 1.8 2,268,866 2,540,202 52.5 49.8
b. Credit Risk
Credit risk is the risk that the counterparty to a fi nancial instrument will cause a fi nancial loss to the Fund by failing to discharge an obligation. The Manager manages the credit risk by undertaking credit evaluation to minimise such risk.
i. Credit risk exposure
As at the reporting date, the Fund’s maximum exposure to credit risk is represented by the carrying amount of each class of fi nancial asset recognised in the statement of fi nancial position.
ii. Financial assets that are either past due or impaired
As at the reporting date, there are no fi nancial assets that are either past due or impaired.

24Kenanga Diversifi ed Fund Annual Report
2. FINANCIAL RISK MANAGEMENT OBJECTIVES AND POLICIES (CONTD.) b. Credit Risk (Contd.)
iii. Credit quality of fi nancial assets
The Fund invests only in unquoted corporate bonds and unquoted government guaranteed bonds with at least investment grade credit rating by a credit rating agency. The following table analyses the Fund’s portfolio of unquoted corporate bonds and unquoted government guaranteed bonds by rating category:
Financial assets at FVTPL
Percentage of total unquoted bonds Percentage of NAV 2015 2014 2015 2014
% % % %
Rating AAA 49.0 23.0 17.0 7.4 AA- 19.7 18.1 6.8 5.9 AA3 17.7 6.9 6.2 2.2 AA2 6.8 15.3 2.4 5.0 AA1 - 30.5 - 9.9 Not rated 6.8 6.2 2.3 2.0 100.0 100.0 34.7 32.4
The Fund invests in deposits with licensed fi nancial institutions under the Financial Services Act 2013 and Islamic Financial Services Act 2013. The following table analyses the licensed fi nancial institutions by rating category:
Short term deposits
Percentage of total short term deposits Percentage of NAV 2015 2014 2015 2014
% % % %
Rating P1 100.0 100.0 11.5 18.0

25 Kenanga Diversifi ed Fund Annual Report
2. FINANCIAL RISK MANAGEMENT OBJECTIVES AND POLICIES (CONTD.) b. Credit Risk (Contd.)
iv. Credit risk concentration
Concentration risk is monitored and managed based on sectoral distribution. The table below analyses the Fund’s portfolio of unquoted corporate bonds and government guaranteed bonds by sectoral distribution:
Percentage of total unquoted bonds Percentage of NAV 2015 2014 2015 2014
% % % %
Finance 49.0 53.5 17.0 17.3 Industrial products 29.8 27.3 10.3 8.9 Utilities 7.7 6.9 2.7 2.2 Plantations 6.8 6.2 2.4 2.0 Transportation 6.7 6.1 2.3 2.0 100.0 100.0 34.7 32.4
c. Liquidity Risk
Liquidity risk is defi ned as the risk that the Fund will encounter diffi culty in meeting obligations associated with fi nancial liabilities that are to be settled by delivering cash or another fi nancial asset. Exposure to liquidity risk arises because of the possibility that the Fund could be required to pay its liabilities or cancel its units earlier than expected. The Fund is exposed to cancellation of its units on a regular basis. Units sold to unitholders by the Manager are cancellable at the unitholder’s option based on the Fund’s NAV per unit at the time of cancellation calculated in accordance with the Deed.
The liquid assets comprise cash, deposits with licensed fi nancial institutions and other instruments, which are capable of being converted into cash within 7 days.

26Kenanga Diversifi ed Fund Annual Report
2. FINANCIAL RISK MANAGEMENT OBJECTIVES AND POLICIES (CONTD.) c. Liquidity Risk (Contd.)
The following table analyses the maturity profi le of the Fund’s fi nancial assets and fi nancial liabilities in order to provide a complete view of the Fund’s contractual commitments and liquidity.
Above Above Up to 1 year 5 years Note 1 year -5 years -15 years Total RM RM RM RM
2015 Assets Financial assets at FVTPL 2,283,744 917,127 565,313 3,766,184 Short term deposits 497,064 - - 497,064 Other assets 114,388 - - 114,388 (i) 2,895,196 917,127 565,313 4,377,636 Liabilities Other liabilities (ii) 73,903 - - 73,903 Equity (iii) 4,318,470 - - 4,318,470 Liquidity gap (1,497,177) 917,127 565,313 (14,737)
2014 Assets Financial assets at FVTPL 3,051,322 926,233 212,105 4,189,660 Short term deposits 916,275 - - 916,275 Other assets 27,208 - - 27,208 (i) 3,994,805 926,233 212,105 5,133,143 Liabilities Other liabilities (ii) 50,215 - - 50,215 Equity (iii) 5,097,613 - - 5,097,613 Liquidity gap (1,153,023) 926,233 212,105 (14,685)

27 Kenanga Diversifi ed Fund Annual Report
2. FINANCIAL RISK MANAGEMENT OBJECTIVES AND POLICIES (CONTD.) c. Liquidity Risk (Contd.)
i) Financial assets
Analysis of fi nancial assets at FVTPL into maturity groupings is based on the expected date on which these assets will be realised. The Fund’s investments in quoted equity securities, quoted collective investment schemes and quoted warrants have been included in the “up to 1 year” category on the assumption that these are highly liquid investments which can be realised should all of the Fund’s unitholders’ equity be required to be redeemed. For other assets, the analysis into maturity groupings is based on the remaining period from the end of the reporting period to the contractual maturity date or if earlier, the expected date on which the assets will be realised.
ii) Financial liabilities
The maturity grouping is based on the remaining period from the end of the reporting period to the contractual maturity date or if earlier, the date on which liabilities will be settled. When the counterparty has a choice of when the amount is paid, the liability is allocated to the earliest period in which the Fund can be required to pay.
iii) Equity
As the unitholders can request for redemption of their units, they have been categorised as having a maturity of “up to 1 year”. As a result, it appears that the Fund has a liquidity gap within “up to 1 year”. However, the Fund believes that it would be able to liquidate its investments should the need arises to satisfy all the redemption requirements.
3. SUMMARY OF SIGNIFICANT ACCOUNTING POLICIES
a. Basis of Accounting The fi nancial statements of the Fund have been prepared in accordance with Malaysian
Financial Reporting Standards (“MFRS”) as issued by the Malaysian Accounting Standards Board (“MASB”) and International Financial Reporting Standards (“IFRS”) issued by the International Accounting Standards Board (“IASB”).
The accounting policies adopted are consistent with those of the previous fi nancial year except for the adoption of the new and amended MFRS and Interpretation Committee (“IC”) Interpretations which became effective for the Fund on 1 December 2014. The adoption of the new and amended MFRS and IC Interpretations did not have any signifi cant impact on the fi nancial position or performance of the Fund.
The fi nancial statements have been prepared on the historical cost basis except as disclosed in the accounting policies below.

28Kenanga Diversifi ed Fund Annual Report
3. SUMMARY OF SIGNIFICANT ACCOUNTING POLICIES (CONTD.)
b. Standards, Amendments and Interpretations Issued But Not Yet Effective
As at the date of authorisation of these fi nancial statements, the following Standards, Amendments and Interpretations that have been issued by MASB will be effective for the Fund in future periods. The Fund intends to adopt the relevant standards when they become effective.
Effective for fi nancial period beginning on Description or after Amendments to MFRS contained in the documents entitled “Annual Improvements to MFRS 2012 - 2014 cycle” 1 January 2016 MFRS 14: Regulatory Deferral Accounts 1 January 2016 Amendments to MFRS 10, MFRS 12 and MFRS 128: Investment Entities: Applying the Consolidation Exception 1 January 2016 Amendments to MFRS 10 and MFRS 128: Sale or Contribution of Assets between an Investor and its Associate or Joint Venture 1 January 2016 Amendments to MFRS 11: Accounting for Acquisitions of Interests in Joint Operations 1 January 2016 Amendments to MFRS 101: Disclosure Initiative 1 January 2016 Amendments to MFRS 116 and MFRS 138: Clarifi cation of Acceptable Methods of Depreciation and Amortisation 1 January 2016 Amendments to MFRS 116 and MFRS 141: Agriculture: Bearer Plants 1 January 2016 Amendments to MFRS 127: Equity Method in Separate Financial Statements 1 January 2016 MFRS 15: Revenue from Contracts with Customers 1 January 2018 MFRS 9: Financial Instruments (IFRS 9: Financial Instruments as issued by IASB in July 2014) 1 January 2018
The Fund will adopt the above pronouncements when they become effective in the respective fi nancial periods. These pronouncements are not expected to have any signifi cant impact to the fi nancial statements of the Fund upon their initial application, other than MFRS 9.
MFRS 9 replaces MFRS 139 on the following requirements: classifi cation and measurement of fi nancial assets and fi nancial liabilities as defi ned in MFRS 139, impairment methodology and hedge accounting. The Fund is in the process of making an assessment of the impact of this Standard.

29 Kenanga Diversifi ed Fund Annual Report
3. SUMMARY OF SIGNIFICANT ACCOUNTING POLICIES (CONTD.)
c. Financial Assets
Financial assets are recognised in the statement of fi nancial position when, and only when, the Fund becomes a party to the contractual provisions of the fi nancial instruments.
When fi nancial assets are recognised initially, they are measured at fair value, plus, in the case of fi nancial assets not at FVTPL, directly attributable transaction costs.
The Fund determines the classifi cation of its fi nancial assets at initial recognition.
i. Financial assets at FVTPL
Financial assets are classifi ed as fi nancial assets at FVTPL if they are held for trading or are designated as such upon initial recognition.
Financial assets held for trading include quoted equity securities, quoted collective investment schemes, quoted warrants, unquoted corporate bonds and unquoted government guaranteed bonds acquired principally for the purpose of selling in the near term.
Subsequent to initial recognition, fi nancial assets at FVTPL are measured at fair value. Changes in the fair value of those fi nancial instruments are recorded in profi t or loss.
Interest earned and dividend revenue elements of such instruments are recorded separately in “interest income” and “dividend income”, respectively.
ii. Receivables
Financial assets with fi xed or determinable payments that are not quoted in an active market are classifi ed as receivables.
Subsequent to initial recognition, receivables are measured at amortised cost using the effective interest method. Gain or loss is recognised in profi t or loss when the receivable is derecognised or impaired, and through the amortisation process.
A fi nancial asset is derecognised when the contractual right to receive cash fl ows from the asset has expired. On derecognition of a fi nancial asset, the difference between the carrying amount and the sum of the consideration received is recognised in profi t or loss.

30Kenanga Diversifi ed Fund Annual Report
3. SUMMARY OF SIGNIFICANT ACCOUNTING POLICIES (CONTD.)
d. Impairment of Financial Assets
The Fund assesses at each reporting date whether there is any objective evidence that a fi nancial asset is impaired.
To determine whether there is objective evidence that an impairment loss on fi nancial assets has been incurred, the Fund considers factors such as the probability of insolvency or signifi cant fi nancial diffi culties of the debtor and default or signifi cant delay in payments.
If any such evidence exists, the amount of impairment loss is measured as the difference between the asset’s carrying amount and the present value of estimated future cash fl ows discounted at the fi nancial asset’s original effective interest rate. The impairment loss is recognised in profi t or loss.
The carrying amount of the fi nancial asset is reduced by the impairment loss directly for all fi nancial assets, with the exception of receivables, where the carrying amount is reduced through the use of an allowance account. When a receivable becomes uncollectible, it is written off against the allowance account.
If in a subsequent year, the amount of the impairment loss decreases and the decrease can be related objectively to an event occurring after the impairment was recognised, the previously recognised impairment loss is reversed to the extent that the carrying amount of the assets does not exceed its amortised cost at the reversal date. The amount of reversal is recognised in profi t or loss.
e. Income
Income is recognised to the extent that it is probable that the economic benefi ts will fl ow to the Fund and the income can be reliably measured. Income is measured at the fair value of consideration received or receivable.
Interest income which includes the accretion of discount and amortisation of premium on fi xed income securities is recognised using the effective interest method.
Dividend income is recognised on declared basis, when the right to receive the dividend is established.
The realised gain or loss on sale of investments is measured as the difference between the net disposal proceeds and the carrying amount of the investment.
f. Cash and Cash Equivalents
For the purposes of the statement of cash fl ows, cash and cash equivalents include cash at bank and short term deposits with licensed fi nancial institutions.

31 Kenanga Diversifi ed Fund Annual Report
3. SUMMARY OF SIGNIFICANT ACCOUNTING POLICIES (CONTD.)
g. Income Tax
Income tax on the profi t or loss for the fi nancial year comprises current tax. Current tax is the expected amount of income taxes payable in respect of the taxable profi t for the fi nancial year.
As no temporary differences have been identifi ed, no deferred tax has been recognised.
h. Unrealised Reserves
Unrealised reserves represent the net gain or loss arising from carrying investments at their fair values at reporting date. This reserve is not distributable.
i. Financial Liabilities
Financial liabilities are classifi ed according to the substance of the contractual arrangements entered into and the defi nitions of a fi nancial liability.
Financial liabilities are recognised in the statement of fi nancial position when, and only when, the Fund becomes a party to the contractual provisions of the fi nancial instrument. The Fund’s fi nancial liabilities are classifi ed as other fi nancial liabilities. The Fund’s fi nancial liabilities are recognised initially at fair value and subsequently measured at amortised cost using the effective interest method.
A fi nancial liability is derecognised when the obligation under the liability is extinguished. Gains and losses are recognised in profi t or loss when the liabilities are derecognised, and through the amortisation process.
j. Unitholders’ Contribution – NAV Attributable to Unitholders
The unitholders’ contribution to the Fund is classifi ed as equity instruments.
Distribution equalisation represents the average amount of undistributed net income included in the creation or cancellation price of units. This amount is either refunded to unitholders by way of distribution and/or adjusted accordingly when units are released back to the Trustee.
k. Functional and Presentation Currency
The fi nancial statements of the Fund are measured using the currency of the primary economic environment in which the Fund operates (“the functional currency”). The fi nancial statements are presented in Ringgit Malaysia (“RM”), which is also the Fund’s functional currency.
l. Distribution
Distributions are at the discretion of the Manager. A distribution to the Fund’s unitholders is accounted for as a deduction from retained earnings.
32Kenanga Diversifi ed Fund Annual Report
3. SUMMARY OF SIGNIFICANT ACCOUNTING POLICIES (CONTD.)
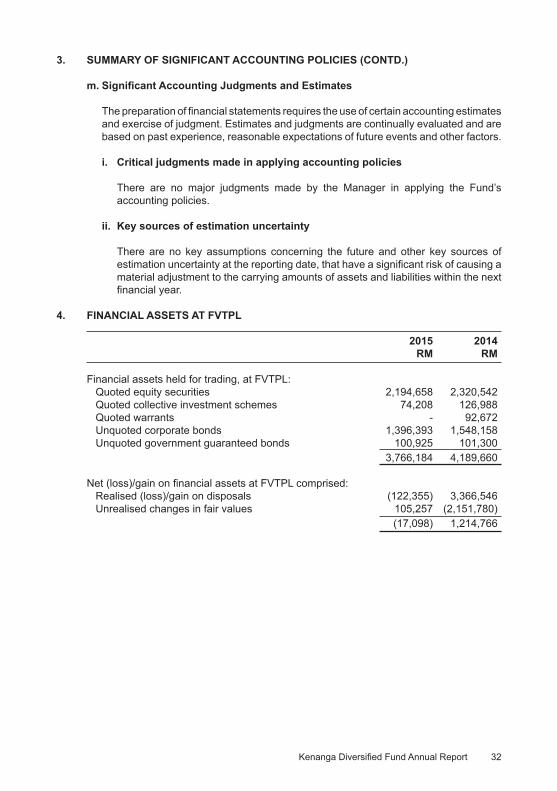
m. Signifi cant Accounting Judgments and Estimates
The preparation of fi nancial statements requires the use of certain accounting estimates and exercise of judgment. Estimates and judgments are continually evaluated and are based on past experience, reasonable expectations of future events and other factors.
i. Critical judgments made in applying accounting policies
There are no major judgments made by the Manager in applying the Fund’s accounting policies.
ii. Key sources of estimation uncertainty
There are no key assumptions concerning the future and other key sources of estimation uncertainty at the reporting date, that have a signifi cant risk of causing a material adjustment to the carrying amounts of assets and liabilities within the next fi nancial year.
4. FINANCIAL ASSETS AT FVTPL
2015 2014 RM RM Financial assets held for trading, at FVTPL: Quoted equity securities 2,194,658 2,320,542 Quoted collective investment schemes 74,208 126,988 Quoted warrants - 92,672 Unquoted corporate bonds 1,396,393 1,548,158 Unquoted government guaranteed bonds 100,925 101,300 3,766,184 4,189,660
Net (loss)/gain on fi nancial assets at FVTPL comprised: Realised (loss)/gain on disposals (122,355) 3,366,546 Unrealised changes in fair values 105,257 (2,151,780) (17,098) 1,214,766

33 Kenanga Diversifi ed Fund Annual Report
4. FINANCIAL ASSETS AT FVTPL (CONTD.)
Details of fi nancial assets at FVTPL as at 30 November 2015 (Contd.):
Aggregate/ Amortised Fair Percentage Quantity cost value of NAV RM RM %
Quoted equity securities
Trading/Services Axiata Group Berhad 11,852 78,734 72,534 1.7 Berjaya Auto Berhad 35,000 94,305 74,900 1.7 Deleum Berhad 33,332 51,712 37,999 0.9 Maxis Berhad 13,000 90,511 85,280 2.0 MISC Berhad 9,600 84,467 88,608 2.0 Tenaga Nasional Berhad 8,450 82,778 112,723 2.6 TIME dotcom Berhad 6,400 26,657 44,416 1.0 117,634 509,164 516,460 11.9
Technology Elsoft Research Berhad 23,500 40,082 45,590 1.0 Globetronics Technology Bhd. 17,100 65,370 108,414 2.5 Inari Amertron Berhad 36,000 109,292 150,120 3.5 ViTrox Corporation Berhad 29,200 72,694 97,820 2.3 105,800 287,438 401,944 9.3
Industrial products EG Industries Berhad 82,700 66,186 67,401 1.6 Evergreen Fibreboard Berhad 28,900 59,837 60,690 1.4 SCGM Berhad 14,800 41,763 41,144 0.9 SKP Resources Bhd 64,500 87,954 85,140 2.0 Success Transformer Corporation Berhad 28,300 56,011 53,770 1.2 United U-LI Corporation Berhad 7,500 26,250 34,050 0.8 226,700 338,001 342,195 7.9
Finance Alliance Financial Group Berhad 12,300 43,255 43,911 1.0 BIMB Holdings Berhad 10,620 40,390 41,418 1.0 CIMB Group Holdings Berhad 9,100 42,841 40,859 0.9 Malayan Banking Berhad 10,876 100,513 90,488 2.1 Public Bank Berhad 6,500 115,169 119,340 2.8 49,396 342,168 336,016 7.8
34Kenanga Diversifi ed Fund Annual Report
4. FINANCIAL ASSETS AT FVTPL (CONTD.)
Details of fi nancial assets at FVTPL as at 30 November 2015 (Contd.):
Aggregate/ Amortised Fair Percentage Quantity cost value of NAV RM RM %
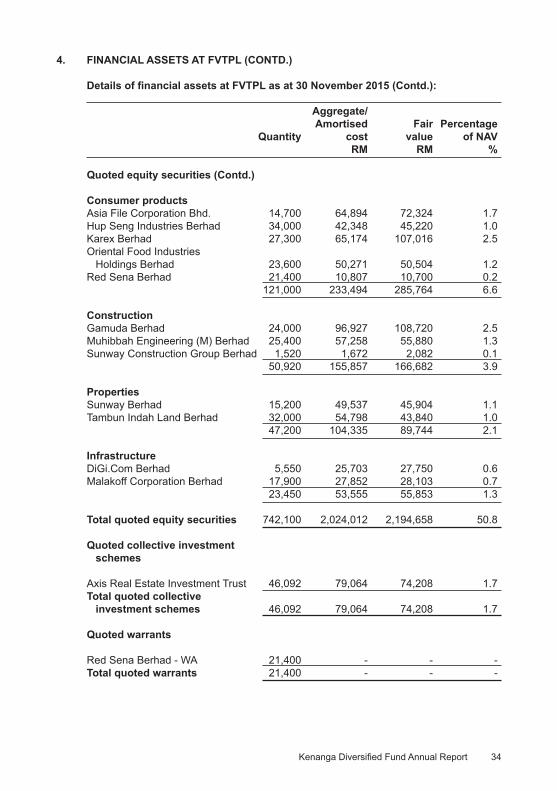
Quoted equity securities (Contd.)
Consumer products Asia File Corporation Bhd. 14,700 64,894 72,324 1.7 Hup Seng Industries Berhad 34,000 42,348 45,220 1.0 Karex Berhad 27,300 65,174 107,016 2.5 Oriental Food Industries Holdings Berhad 23,600 50,271 50,504 1.2 Red Sena Berhad 21,400 10,807 10,700 0.2 121,000 233,494 285,764 6.6
Construction Gamuda Berhad 24,000 96,927 108,720 2.5 Muhibbah Engineering (M) Berhad 25,400 57,258 55,880 1.3 Sunway Construction Group Berhad 1,520 1,672 2,082 0.1 50,920 155,857 166,682 3.9
Properties Sunway Berhad 15,200 49,537 45,904 1.1 Tambun Indah Land Berhad 32,000 54,798 43,840 1.0 47,200 104,335 89,744 2.1
Infrastructure DiGi.Com Berhad 5,550 25,703 27,750 0.6 Malakoff Corporation Berhad 17,900 27,852 28,103 0.7 23,450 53,555 55,853 1.3
Total quoted equity securities 742,100 2,024,012 2,194,658 50.8
Quoted collective investment schemes
Axis Real Estate Investment Trust 46,092 79,064 74,208 1.7 Total quoted collective investment schemes 46,092 79,064 74,208 1.7
Quoted warrants
Red Sena Berhad - WA 21,400 - - - Total quoted warrants 21,400 - - -

35 Kenanga Diversifi ed Fund Annual Report
4. FINANCIAL ASSETS AT FVTPL (CONTD.)
Details of fi nancial assets at FVTPL as at 30 November 2015 (Contd.):
Aggregate/ Amortised Fair Percentage Quantity cost value of NAV RM RM %
Unquoted corporate bonds
Aquasar Capital Sdn Bhd maturing on 16/07/2021 350,000 361,192 359,303 8.3 Bahrain Mumtalakat Holding Company B.S.C maturing on 30/4/2018 150,000 150,680 150,717 3.5 Cagamas Berhad maturing on 29/03/2019 360,000 379,881 374,726 8.7 DRB-Hicom Berhad maturing on 30/11/2018 300,000 298,944 295,215 6.8 First Resources Limited maturing on 31/07/2017 100,000 101,500 101,935 2.4 Jati Cakerawala Sdn Bhd maturing on 31/07/2023 115,000 113,743 114,497 2.6 Total unquoted corporate bonds 1,375,000 1,405,940 1,396,393 32.3
Unquoted government guaranteed bonds
Prasarana Malaysia Berhad [formerly known as Syarikat Prasarana Negara Berhad] maturing on 04/08/2021 100,000 103,328 100,925 2.4 Total unquoted government guaranteed bonds 100,000 103,328 100,925 2.4 Total fi nancial assets at FVTPL 3,612,344 3,766,184 87.2
Unrealised gain on fi nancial assets at FVTPL 153,840

36Kenanga Diversifi ed Fund Annual Report
5. MANAGER’S FEE
The Manager’s fee is computed on a daily basis at a rate not less than 1.2% per annum and not exceeding 3.0% per annum of the NAV of the Fund as provided under Clause 13(2) of the Deed.
The Manager is currently charging Manager’s fee of 1.55% per annum of the NAV of the Fund (2014: 1.55% per annum).
6. TRUSTEE’S FEE
Pursuant to the Eighth Supplemental Deed dated 25 July 2014, the Trustee’s fee is computed on a daily basis at a rate not exceeding 0.07% per annum of the NAV of the Fund and subject to a minimum fee of RM9,000 effective from 1 August 2014. Prior to 1 August 2014, the Trustee’s fee was computed at a rate not exceeding 0.20% per annum and subject to a minimum fee of RM18,000.
Accordingly, the Trustee’s fee is computed based on the minimum fee of RM9,000 per annum effective from 1 August 2014. Prior to 1 August 2014, the Trustee’s fee was computed based on the minimum fee of RM18,000 per annum.
7. INCOME TAX
Income tax is calculated at the Malaysian statutory tax rate of 25% of the estimated assessable income for the fi nancial year. The statutory tax rate will be reduced to 24% effective year of assessment 2016.
Income tax is calculated on investment income less partial deduction for permitted expenses as provided for under Section 63B of the Income Tax Act, 1967.
A reconciliation of income tax expense applicable to net income before tax at the statutory income tax rate to income tax expense at the effective income tax rate of the Fund is as follows:
2015 2014 RM RM Net income before tax 49,365 1,435,756 Tax at Malaysian statutory tax rate of 25% (2014: 25%) 12,341 358,939 Tax effect of: Income not subject to tax (75,753) (970,506) Loss not deductible for tax purposes 30,589 537,945 Expenses not deductible for tax purposes 4,916 6,739 Restriction on tax deductible expenses for unit trust fund 27,907 66,883 Overprovision in prior year (52) (7,006) Income tax for the year (52) (7,006)
8. SHORT TERM DEPOSITS
Short term deposits are held with licensed fi nancial institutions in Malaysia, on a daily renewal basis at the prevailing interest rate.

37 Kenanga Diversifi ed Fund Annual Report
9. OTHER RECEIVABLES
2015 2014 RM RM
Amount due from stockbrokers 99,270 6,685 Dividend receivable 4,721 5,673 Interest receivable from short term deposits 44 80 104,035 12,438
10. OTHER PAYABLES
2015 2014 RM RM Amount due to stockbrokers 32,927 31,410 Accrual for auditors’ remuneration 6,000 6,000 Accrual for tax agent’s fees 4,000 3,000 Provision for printing and other expenses 14,815 2,490 57,742 42,900
11. NET ASSET VALUE ATTRIBUTABLE TO UNITHOLDERS
NAV attributed to unitholders is represented by:
Note 2015 2014 RM RM Unitholders’ contribution (a) 2,480,487 802,361 Retained earnings: Realised reserves 1,684,143 4,246,669 Unrealised reserves 153,840 48,583 1,837,983 4,295,252 4,318,470 5,097,613
(a) Unitholders’ contribution
2015 2014 No. of units RM No. of units RM
At beginning of the year 5,976,709 802,361 46,802,087 32,293,197 Add: Creation of units 600,607 508,110 917,966 712,879 Less: Cancellation of units (1,561,876) (1,309,437) (41,743,344) (34,516,724) Distribution equalisation - (27,233) - (2,185,993) Reclassifi cation of retained earnings - 2,506,686 - 4,499,002 At end of the year 5,015,440 2,480,487 5,976,709 802,361
The number of units legally or benefi cially held by the Manager, Kenanga Investors Berhad, and parties related to the Manager as at 30 November 2015 were nil (2014: nil).

38Kenanga Diversifi ed Fund Annual Report
12. NET ASSET VALUE PER UNIT
In line with the adoption of MFRS 139, fi nancial assets at FVTPL have been valued at the bid prices at the close of business. In accordance with the Deed, the calculation of NAV attributable to unitholders per unit for the creation and cancellation of units is computed based on fi nancial assets at FVTPL valued at the last done market price.
A reconciliation of NAV attributable to unitholders for creation/cancellation of units and the NAV attributable to unitholders per the fi nancial statements is as follows:
2015 2014 RM RM/Unit RM RM/Unit
NAV attributable to unitholders for creation/cancellation of units 4,330,581 0.8634 5,107,346 0.8545 Effects of adopting bid prices as fair value (12,111) (0.0024) (9,733) (0.0016) NAV attributable to unitholders per statement of fi nancial position 4,318,470 0.8610 5,097,613 0.8529
13. PORTFOLIO TURNOVER RATIO
PTR for the fi nancial year is 0.68 times (2014: 1.37 times).
PTR is the ratio of average sum of acquisitions and disposals of investments of the Fund for the fi nancial year to the average NAV of the Fund, calculated on a daily basis.
14. MANAGEMENT EXPENSE RATIO (“MER”)
MER for the fi nancial year is 2.76% (2014: 1.91%).
MER is the ratio of total fees and recovered expenses of the Fund expressed as a percentage of the Fund’s average NAV, calculated on a daily basis.

39 Kenanga Diversifi ed Fund Annual Report
15. TRANSACTIONS WITH LICENSED FINANCIAL INSTITUTIONS
Brokerage, stamp duty Transaction Percentage and clearing Percentage Value of total fee of total RM % RM %
Alliance Bank Malaysia Berhad 2,578,000 26.7 - - Kenanga Investment Bank Berhad* 1,585,517 16.4 5,544 28.5 RHB Investment Bank Berhad 1,209,732 12.5 1,393 7.2 Maybank Investment Bank Berhad 1,023,896 10.6 3,881 19.9 CIMB Investment Bank Berhad 827,586 8.6 3,271 16.8 CIMB Bank Berhad 796,000 8.3 - - Hong Leong Investment Bank Berhad 381,321 4.0 1,152 5.9 TA Securities Holdings Berhad 270,095 2.8 905 4.7 Affi n Hwang Investment Bank Berhad 268,549 2.8 922 4.7 Alliance Investment Bank Berhad 208,149 2.2 706 3.6 Others 496,668 5.1 1,703 8.7 9,645,513 100.0 19,477 100.0
* Kenanga Investment Bank Berhad is a related party of Kenanga Investors Berhad.
The above transactions values are in respect of quoted equity securities, quoted collective investment schemes, quoted warrant, unquoted corporate bonds, unquoted government guaranteed bonds and short term deposits. Transactions in unquoted corporate bonds, unquoted government guaranteed bonds and short term deposits do not involve any commission or brokerage fees.
The directors of the Manager are of the opinion that the transactions with the related party have been entered into in the normal course of business and have been established on terms and conditions that are not materially different from that obtainable in transactions with unrelated parties. The Manager is of the opinion that the above dealings have been transacted on an arm’s length basis.

40Kenanga Diversifi ed Fund Annual Report
16. SEGMENTAL REPORTING
a. Business Segment
In accordance with the objective of the Fund, the Fund can invest around 20% to 70% in quoted investment securities and 30% to 80% in fi xed income securities and others. The following table provides an analysis of the Fund’s revenue, results, assets and liabilities by business segments:
Quoted investment Unquoted Other securities bonds investments Total RM RM RM RM
2015 Revenue Segment income 99,197 61,159 20,302 180,658 Unallocated expenditure (131,293) Income before tax 49,365 Income tax 52 Net income after tax 49,417 Assets Financial assets at FVTPL 2,268,866 1,497,318 - Short term deposits - - 497,064 Other segment assets 103,991 - 44 Total segment assets 2,372,857 1,497,318 497,108 4,367,283 Unallocated assets 25,090 4,392,373 Liabilities Other segment liabilities representing total segment liabilities 32,927 - - 32,927 Unallocated liabilities 40,976 73,903

41 Kenanga Diversifi ed Fund Annual Report
16. SEGMENTAL REPORTING (CONTD.)
a. Business Segment (Contd.) Quoted investment Unquoted Other securities bonds investments Total RM RM RM RM
2014 Revenue Segment income 1,495,336 204,654 30,253 1,730,243 Unallocated expenditure (294,487) Income before tax 1,435,756 Income tax 7,006 Net income after tax 1,442,762 Assets Financial assets at FVTPL 2,540,202 1,649,458 - Short term deposits - - 916,275 Other segment assets 12,358 - 80 Total segment assets 2,552,560 1,649,458 916,355 5,118,373 Unallocated assets 29,455 5,147,828
Liabilities Other segment liabilities representing total segment liabilities 31,410 - - 31,410 Unallocated liabilities 18,805 50,215
b. Geographical Segments
As all of the Fund’s investments are located in Malaysia, disclosure by geographical segments is not relevant.

42Kenanga Diversifi ed Fund Annual Report
17. FINANCIAL INSTRUMENTS
a. Classifi cation of fi nancial instruments
The Fund’s fi nancial assets and fi nancial liabilities are measured on an ongoing basis at either fair value or at amortised cost based on their respective classifi cation. The signifi cant accounting policies in Note 3 describe how the classes of fi nancial instruments are measured, and how income and expenses, including fair value gains and losses, are recognised.
The following table analyses the fi nancial assets and liabilities of the Fund in the statement of fi nancial position by the class of fi nancial instrument to which they are assigned and therefore by the measurement basis:
Financial assets at Financial FVTPL Receivables liabilities Total RM RM RM RM
2015 Assets Quoted equity securities 2,194,658 - - 2,194,658 Quoted collective investment schemes 74,208 - - 74,208 Unquoted corporate bonds 1,396,393 - - 1,396,393 Unquoted government guaranteed bonds 100,925 - - 100,925 Short term deposits - 497,064 - 497,064 Other receivables - 104,035 - 104,035 Cash at bank - 10,353 - 10,353 3,766,184 611,452 - 4,377,636 Liabilities Amount due to Manager - - 15,421 15,421 Amount due to Trustee - - 740 740 Other payables - - 57,742 57,742 - - 73,903 73,903

43 Kenanga Diversifi ed Fund Annual Report
17. FINANCIAL INSTRUMENTS (CONTD.)
a. Classifi cation of fi nancial instruments (Contd.) Financial assets at Financial FVTPL Receivables liabilities Total RM RM RM RM
2014 Assets Quoted equity securities 2,320,542 - - 2,320,542 Quoted collective investment schemes 126,988 - - 126,988 Quoted warrants 92,672 - - 92,672 Unquoted corporate bonds 1,548,158 - - 1,548,158 Unquoted government guaranteed bonds 101,300 - - 101,300 Short term deposits - 916,275 - 916,275 Other receivables - 12,438 - 12,438 Cash at bank - 14,770 - 14,770 4,189,660 943,483 - 5,133,143 Liabilities Amount due to Manager - - 6,625 6,625 Amount due to Trustee - - 690 690 Other payables - - 42,900 42,900 - - 50,215 50,215
b. Financial instruments that are carried at fair value
The Fund’s fi nancial assets at FVTPL are carried at fair value. The fair values of these fi nancial assets were determined using prices in active markets.
The following table shows the fair value measurements by level of the fair value measurement hierarchy:
Level 1 Level 2 Level 3 Total RM RM RM RM
Investments: 2015 - Quoted equity securities 2,194,658 - - 2,194,658 - Quoted collective investment schemes 74,208 - - 74,208 - Unquoted corporate bonds - 1,396,393 - 1,396,393 - Unquoted government guaranteed bonds - 100,925 - 100,925
44Kenanga Diversifi ed Fund Annual Report
17. FINANCIAL INSTRUMENTS (CONTD.)
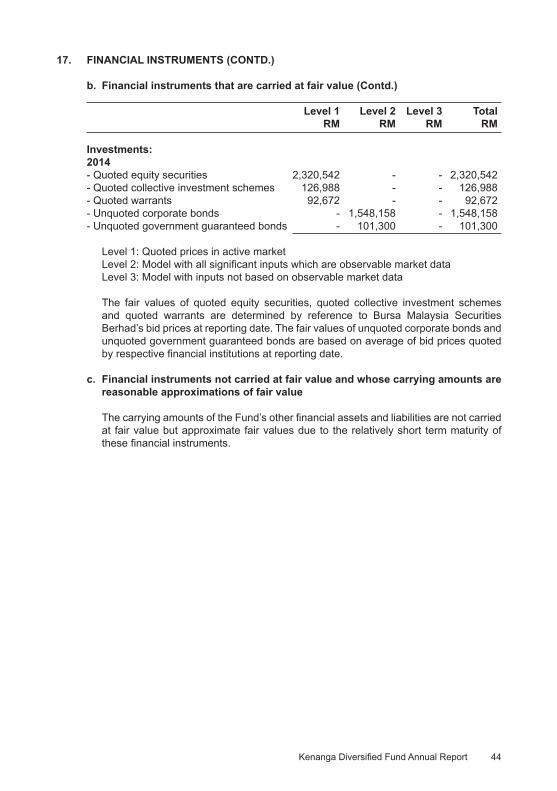
b. Financial instruments that are carried at fair value (Contd.) Level 1 Level 2 Level 3 Total RM RM RM RM
Investments: 2014 - Quoted equity securities 2,320,542 - - 2,320,542 - Quoted collective investment schemes 126,988 - - 126,988 - Quoted warrants 92,672 - - 92,672 - Unquoted corporate bonds - 1,548,158 - 1,548,158 - Unquoted government guaranteed bonds - 101,300 - 101,300
Level 1: Quoted prices in active market Level 2: Model with all signifi cant inputs which are observable market data Level 3: Model with inputs not based on observable market data
The fair values of quoted equity securities, quoted collective investment schemes and quoted warrants are determined by reference to Bursa Malaysia Securities Berhad’s bid prices at reporting date. The fair values of unquoted corporate bonds and unquoted government guaranteed bonds are based on average of bid prices quoted by respective fi nancial institutions at reporting date.
c. Financial instruments not carried at fair value and whose carrying amounts are reasonable approximations of fair value
The carrying amounts of the Fund’s other fi nancial assets and liabilities are not carried at fair value but approximate fair values due to the relatively short term maturity of these fi nancial instruments.

45 Kenanga Diversifi ed Fund Annual Report
18. CAPITAL MANAGEMENT
The capital of the Fund can vary depending on the demand for creation and cancellation of units to the Fund.
The Fund’s objectives for managing capital are:
a. To invest in investments meeting the description, risk exposure and expected return indicated in its prospectus;
b. To maintain suffi cient liquidity to meet the expenses of the Fund, and to meet cancellation requests as they arise; and
c. To maintain suffi cient fund size to make the operations of the Fund cost-effi cient.
No changes were made to the capital management objectives, policies or processes during the current and previous fi nancial years.

46Kenanga Diversifi ed Fund Annual Report

Investor Services Center Head Offi ce, Kuala LumpurToll Free Line: 1 800 88 3737 Suite 12.02, 12th Floor, Kenanga International,Fax: +603 2057 3722 Jalan Sultan Ismail, 50250 Kuala Lumpur, Malaysia.Email: [email protected] Tel: 03-2057 3688 Fax: 03-2161 8807


