Kelvin Probe Electrode for Contactless Potential ...sagues/Documents/KP Accepted MS with CS...
48
1 Kelvin Probe Electrode for Contactless Potential Measurement on Concrete – Properties and Corrosion Profiling Application Alberto A. Sagüés a,b and Michael T. Walsh a a Department of Civil and Environmental Engineering University of South Florida Tampa, FL 33620, USA b Corresponding Author; [email protected] ; Phone (813) 974 5819; Fax (813) 974-2957; Postal Address: Department of Civil and Environmental Engineering, ENB118, University of South Florida, 4202 E. Fowler Ave., Tampa, FL 33620, USA Abstract The practical feasibility of Kelvin Probe measurement of potential of the concrete surface was demonstrated. The measurements require no contact between the reference element and the concrete. Potential readings when placing the probe on dry concrete were nearly instantaneous and highly stable, in contrast with considerable potential drift with a conventional wet-tip electrode. The probe output was only modestly sensitive to the reference element working distance. The shape and range of potential profiles measured with the probe on Accepted 11/22/11 for Publication in Corrosion Science Final Published Citation: A. Sagüés and M. Walsh, “Kelvin Probe electrode for contactless potential measurement on concrete – Properties and corrosion profiling application”, Corrosion Science, Vol 56, pp 26-35 (2012). http://www.sciencedirect.com/science/article/pii/S0010938X11006111
Transcript of Kelvin Probe Electrode for Contactless Potential ...sagues/Documents/KP Accepted MS with CS...

1
Kelvin Probe Electrode for Contactless Potential Measurement on Concrete – Properties and
Corrosion Profiling Application
Alberto A. Sagüés a,b and Michael T. Walsh a a Department of Civil and Environmental Engineering
University of South Florida
Tampa, FL 33620, USA
b Corresponding Author; [email protected] ; Phone (813) 974 5819; Fax (813) 974-2957; Postal
Address: Department of Civil and Environmental Engineering, ENB118, University of South
Florida, 4202 E. Fowler Ave., Tampa, FL 33620, USA
Abstract
The practical feasibility of Kelvin Probe measurement of potential of the
concrete surface was demonstrated. The measurements require no contact
between the reference element and the concrete. Potential readings when
placing the probe on dry concrete were nearly instantaneous and highly stable, in
contrast with considerable potential drift with a conventional wet-tip electrode.
The probe output was only modestly sensitive to the reference element working
distance. The shape and range of potential profiles measured with the probe on
Accepted 11/22/11 for Publication in Corrosion Science
Final Published Citation: A. Sagüés and M. Walsh, “Kelvin Probe electrode for contactless potential measurement on concrete – Properties and corrosion profiling application”, Corrosion Science, Vol 56, pp 26-35 (2012). http://www.sciencedirect.com/science/article/pii/S0010938X11006111

2
concrete with locally corroding reinforcement were consistent with those using a
conventional wet-tip reference electrode, both identifying the anode location.
Keywords: A. steel reinforced concrete; B. polarization; C. potential parameters.
1 Introduction
The electric potential distribution on the external surface of concrete can
be indicative of various ongoing processes of interest. For example, surface
potential mapping is often conducted to identify the location of corroding
reinforcing steel. For that application potential measurements are normally
conducted by connecting the positive terminal of a high impedance dc voltmeter
to the reinforcing steel assembly, and the other terminal to the metallic terminal
of a reference electrode, usually a copper-copper sulfate electrode (CSE). The
electrolyte end of the reference electrode is then placed in successive contact
with an array of points on the external concrete surface, and the potential for
each point is recorded. The resulting potential map provides a diagnostic of the
presence and position of regions of the reinforcement assembly with high
likelihood of ongoing active corrosion. The method [1-3] relies on the sizable
potential transition (e.g. from ~-150 mV to ~-400 mV CSE) that formerly passive
steel often experiences upon the onset of active corrosion [4,5]. Thus, regions

3
displaying negative potentials in the order of several hundred mV vs. CSE may
be considered suspect of ongoing active corrosion. If active corrosion affects only
a portion of the steel, the potential is not uniformly highly negative on the
concrete surface because of the finite resistivity of concrete that joins the active
and the passive portions of the assembly. The steel in the latter is only partially
polarized and potential measurements against nearby concrete remain only
mildly negative, so the external potential map can reveal the location of the
corroding zones as well. Because of measurement artifacts described later, the
measured potentials may be more or less globally offset from those in an ideal
case. Thus, identification of corroding regions often relies more on consideration
of potential gradients rather than of the absolute potential values.
Concrete surface potential measurements are also routinely conducted to
monitor cathodic protection systems, assess the effectiveness of corrosion repair
patches, and as part of electrochemical corrosion rate measurements. The latter
are estimated by polarization measurements, where the amount of impressed
current needed to achieve a small potential change is determined. The current is
impressed by means of an additional external electrode attached to the concrete
surface [4] or by means of rebar not in metallic contact with that being tested [6].
Within certain limitations [4,7,8], the ratio of potential change to impressed
current density yields the polarization resistance Rp which is related to the
corrosion current density icorr through the Stearn-Geary parameter B by the

4
equation icorr = B/Rp. The resulting value of icorr can then be related to the
corrosion rate of the steel by the usual Faradaic conversion [9].
Surface potential measurements are sensitive to the condition of both the
bulk of the concrete and its surface. For example, the presence of a carbonated
concrete skin, even if it is very thin, can result in an appreciable potential
difference (e.g. as much as 200 mV) between the outer surface and the bulk of
the concrete [10,13]. That difference reflects the widely different pH of pore
water in the outer and inner regions. A diffusion potential (a general term that
includes junction and membrane potentials as well as those resulting from other
electrokinetic effects [13]) develops to preserve charge neutrality upon coupled
diffusion, across the region joining both zones, of anions (OH-) and cations (K+,
Na+) that have significantly different diffusivities. Weathering, sulfate attack and
other environmental interactions may cause similar electrochemical potential
gradients that may affect the surface potential pattern. A very dry concrete
surface may prevent accurate potential determination as the effective contact
resistance begins to approach the value of the voltmeter input resistance. The
sensitivity of the potential measurements to these phenomena creates both an
opportunity for their characterization and a concern as a source of artifacts in
corrosion condition determination.
The extent to which potential measurement artifacts are present is
obscured by the disruptive nature of the electrochemical reference electrode,

5
which requires a shared electrolyte link between the metallic terminal and the
concrete pore water. When the electrolyte tip of the reference electrode touches
the concrete surface, a liquid transport process starts that transfers some of the
electrode solution into the concrete pores and vice versa. The process may
range from mostly interdiffusion if the concrete pores are nearly saturated, to
strong convective capillary action if the pores are nearly dry. The latter case may
result in appreciable drift in the voltmeter reading as the system slowly
approaches a steady state condition, likely involving the evolution of a diffusion
potential pattern that includes both junction and membrane potential components
[10,13]. Such drift can introduce added uncertainty on the result of the potential
measurement, and significant artifacts in electrochemical corrosion rate
measurements. Sometimes to partially alleviate those effects a pre-wetting
procedure is used for the concrete surface before placing the reference electrode
[1], but comparable uncertainty exists as to the potential variation (and its time
variation) created by the intrusion of the wetting fluid to the formerly dry concrete.
Use of a Kelvin Probe (KP) electrode offers an alternative to avoid some
of the artifacts noted above, by means of a contactless procedure that does not
depend on a shared electrolyte, and that is inherently non-disruptive of the region
sampled by the probe. To the knowledge of the authors, application of the KP to
this end does not seem to have been previously conducted. In this work,
macroscopic measurement of concrete surface potentials with a KP is explored.

6
The probe operation, performance, and application to potential mapping is
demonstrated.
2 Principle of the KP operation and application to concrete
The KP determines the potential difference E between two surfaces
designated as working and reference respectively. The principle of operation has
been described extensively in the literature [14-17] so only a brief review is
presented here before addressing the issues specific to measurements on a
concrete surface.
In the present case the working surface is a small part of the outer
concrete surface, and the reference surface is the surface on one side of a
macroscopically small (e.g., ~1 cm diameter) disk of a suitable metallic material,
for example gold or stainless steel with a stable passive film. The disk and the
concrete surfaces are a small distance h apart so as to approximate a parallel-
plate capacitor configuration. The disk is connected through electronic
conductors to the steel bar assembly embedded in the concrete. The steel bar
surface is connected to the external surface of the concrete by an electrolytic
path provided mainly by the water in the concrete pore network. Consequently
the concrete and the reference surfaces are joined through an electronic and
electrolytic conductive path with associated interfaces that determine the value of
7
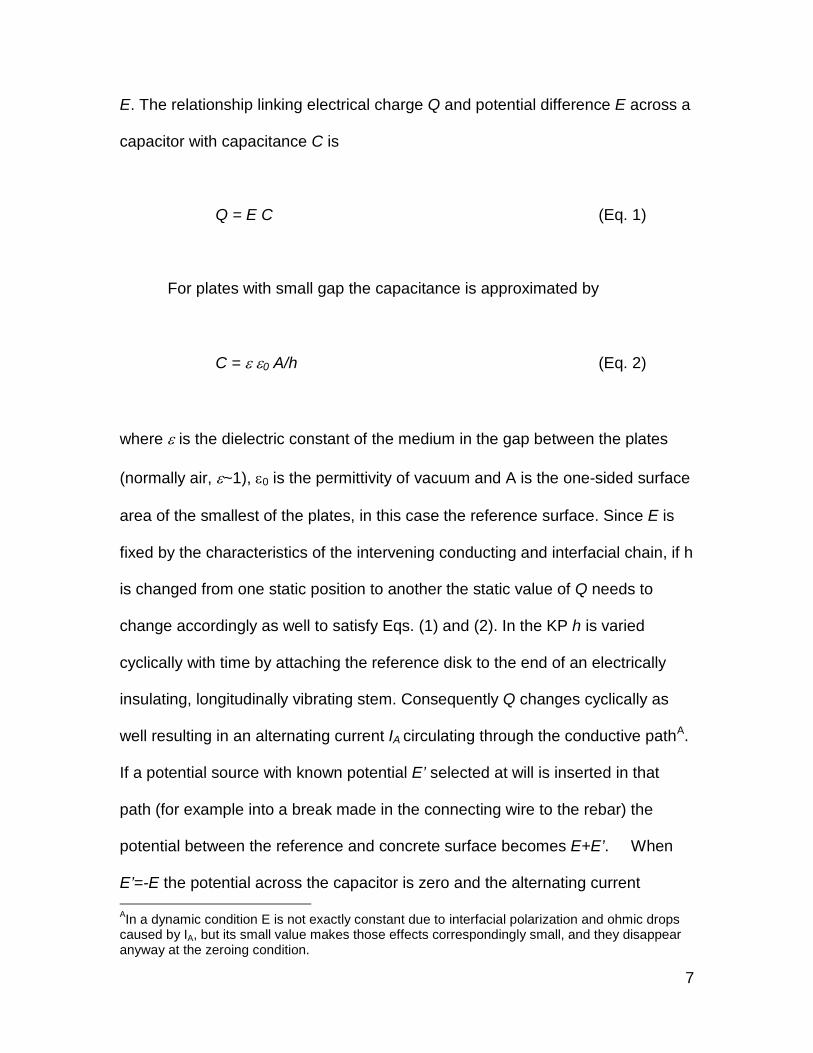
E. The relationship linking electrical charge Q and potential difference E across a
capacitor with capacitance C is
Q = E C (Eq. 1)
For plates with small gap the capacitance is approximated by
C = ε ε0 A/h (Eq. 2)
where ε is the dielectric constant of the medium in the gap between the plates
(normally air, ε~1), ε0 is the permittivity of vacuum and A is the one-sided surface
area of the smallest of the plates, in this case the reference surface. Since E is
fixed by the characteristics of the intervening conducting and interfacial chain, if h
is changed from one static position to another the static value of Q needs to
change accordingly as well to satisfy Eqs. (1) and (2). In the KP h is varied
cyclically with time by attaching the reference disk to the end of an electrically
insulating, longitudinally vibrating stem. Consequently Q changes cyclically as
well resulting in an alternating current IA circulating through the conductive pathA.
If a potential source with known potential E’ selected at will is inserted in that
path (for example into a break made in the connecting wire to the rebar) the
potential between the reference and concrete surface becomes E+E’. When
E’=-E the potential across the capacitor is zero and the alternating current AIn a dynamic condition E is not exactly constant due to interfacial polarization and ohmic drops caused by IA, but its small value makes those effects correspondingly small, and they disappear anyway at the zeroing condition.
8
vanishes. This permits then determining the value of E by varying E’ until IA=0, a
condition that can be reached with great sensitivity by adequate electronic
amplification. The zeroing process can be made manually or performed
automatically and promptly with ordinary control circuitry, yielding an immediate
record of the value of E.
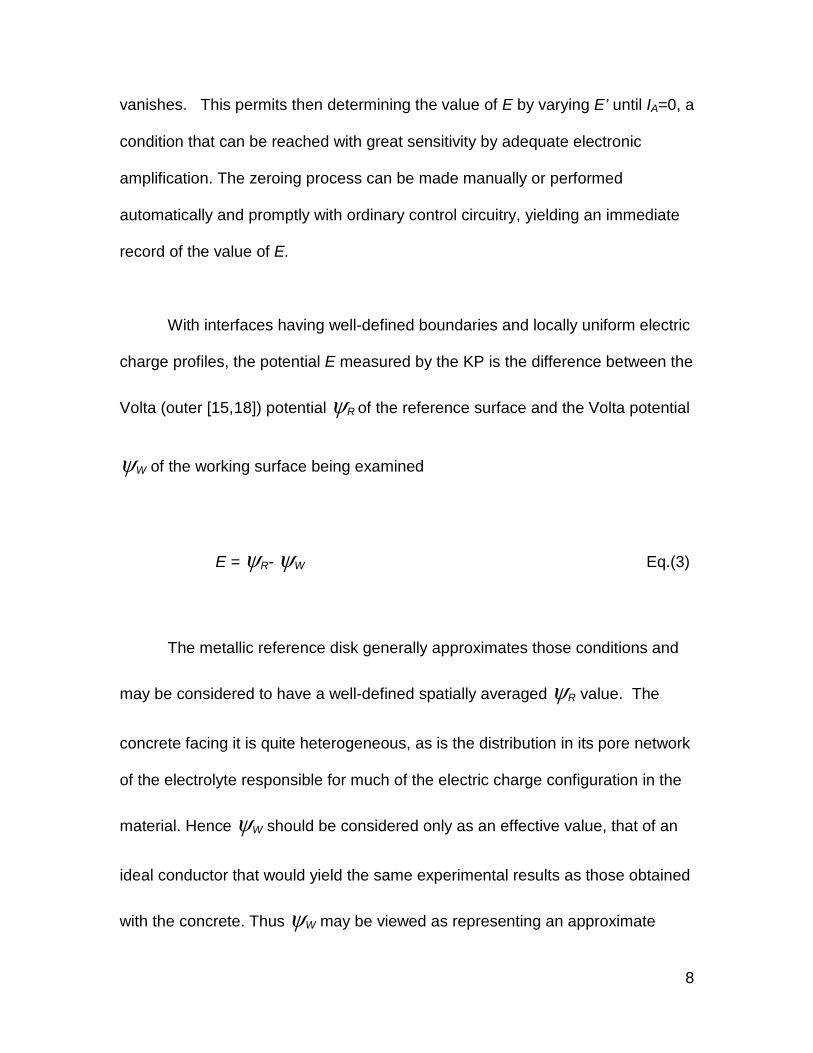
With interfaces having well-defined boundaries and locally uniform electric
charge profiles, the potential E measured by the KP is the difference between the
Volta (outer [15,18]) potential ψR of the reference surface and the Volta potential
ψW of the working surface being examined
E = ψR- ψW Eq.(3)
The metallic reference disk generally approximates those conditions and
may be considered to have a well-defined spatially averaged ψR value. The
concrete facing it is quite heterogeneous, as is the distribution in its pore network
of the electrolyte responsible for much of the electric charge configuration in the
material. Hence ψW should be considered only as an effective value, that of an
ideal conductor that would yield the same experimental results as those obtained
with the concrete. Thus ψW may be viewed as representing an approximate

9
average of the potential of the surface of the concrete beneath the footprint of the
of the reference surface disk. Lateral heterogeneity up to the mm scale (pore
space-paste-fine aggregate domain) is expected to be reasonably averaged
beneath the disk, but some sensitivity to the distribution of the coarse-aggregate,
which is typically >1cm in size, can be anticipated.
The value of E measured by the KP is determined by the present system
as schematically described in Figure 1. The reader is referred to the treatment by
Leng [17] for a thorough discussion on accounting for potentials at multiple
interfaces in a KP measurement. For simplicity, only two different metals are
assumed to be involved, one for the reference surface (R) and one for the steel
bar (S). The respective inner (Galvani [18]) potentials are designated ΦR and ΦS
with a corresponding interfacial potential difference XSR= ΦR - ΦS. The arrows in
the figure indicate that the stated difference of potential is added to the potential
at the tail to obtain that at the head. Designations for the medium-air interfacial
potential differences are respectively XAR =ΦR -ψR and XAW = ΦW -ψW, and for
the metal-electrolyte interfacial potential X’WS = ΦS - Φ'W. Both ΦW and Φ'W are
effective magnitudes representing a similar idealization as that noted above for
ψW. The values of ΦW and Φ'W are in general not the same because of the
ohmic potential drop created by the corrosion macrocell currents in the concrete,
and of electrolyte composition gradients within the concrete that cause
macroscopic junction potentials and electrokinetic effects [12,13]. These factors

10
will be further considered later on. The resulting difference is designated as
∆ΦW= Φ'W - ΦW . Ohmic drops and similar effects within the metals themselves
are treated as negligible in the present analysis. Applying the above definitions to
Eq. (3) yields
E = X’WS + XSR - XAR + XAW + ∆ΦW Eq (4)
A similar representation and nomenclature is presented in Figure 2 for a
conventional measurement of steel potential vs. a regular reference electrode
using a high impedance voltmeter [18]. For simplicity, it is assumed that a Cu-
CuSO4 electrode (CSE) is being used and that all the connections involve Cu
wiring, including the terminations of the voltmeter. In such case the Galvani and
Volta potential differences between the voltmeter leads are the same, and the
measured potential ECSE is given by
ECSE =ΦCu1-ΦCu2= X’WS + XSCu - XBCu + XBW + ∆Φ∗W Eq (5)
The salt bridge in Figure 2 is assumed to include a porous plug, as well as
a wet sponge or similar accessory, between the bulk of the CuSO4 solution in the
electrode and the surface of the concrete. The potential difference XBW
incorporates any diffusion potentials or related phenomena associated with ionic
concentration gradients across the plug and sponge. It is noted that the polarity
chosen to designate XBCu, a metal-to-electrolyte interfacial potential difference,

11
was chosen for uniformity to match that used for X’WS so both variables adhere to
the usual electrochemical convention.
Given its contactless character, placement of the KP on the system should
create no significant change of X’WS and ∆ΦW from their native values. Placement
of the CSE and sponge should likewise be expected to have little effect on the
value of XWS’, at least when the concrete cover is not very thin and only moderate
surface wetting is involved so the macrocell pattern is not substantially affected.
However, the CSE placement is more disruptive of conditions near the external
concrete surface. The concrete pore network in the contact region and to some
distance beneath it is expected to be affected by intrusion of water and ions
coming from the reference electrode and accessories, and from any pre-wetting
applied to the surface of the concrete. As indicated earlier the potential
distribution in that region is altered to some extent relative to the initially dry
condition, so Φ∗W and ∆Φ∗
W are used instead of the values without asterisk in
the undisturbed case in Figure 1.
The relationship between E and ECSE is discussed next. From Eqs. (4) and
(5) and treating X’WS as being invariant as indicated earlier, the potential
measured by the KP can be related to that measured in the usual manner with a
CSE reference electrode by
E = ECSE + [(XSR - XSCu) + (XAW – XAR) + XBCu +∆ΦW ] +[-XBW - ∆Φ∗W ] Eq.(6)

12
The terms grouped within the first set of square brackets are functions of
the properties of metal-metal, metal-air and metal-solution interfaces, and of the
condition of the concrete in the undisturbed condition. Those quantities may then
be considered on first approximation as being constants of the system and
together contribute as a simple constant addition term to the conversion between
E and ECSE, at least for the particular place on the concrete surface being
examined. In contrast, the terms within the second set of square brackets
depend on the time evolution of the system as moisture and ionic species
penetrate in the region contacted by the wet-tip electrode and sponge, and
affected by pre-wetting. Thus those terms are time-dependent and their effect on
the total amount is to preclude relating E and ECSE through a simple time-
invariant addition term. The variation should become very slow after a steady
state moisture and ionic species distribution is reached, but those processes may
take a long time [10]. In practical terms, for comparing KP and conventional wet-
tip electrode measurements it is best to examine the system after a prearranged
time after surface wetting started, when the time dependent terms have evolved
to a roughly reproducible extent. That approach was adopted in the experiments
presented here.
The above analysis can be extended to compare the case of KP
measurements on a pre-wetted concrete surface with those performed
conventionally on an equally pre-wetted surface. In that case both XAW and ∆ΦW

13
become time-dependent as well, although ∆ΦW may be closer to ∆Φ∗W so the
contribution of that pair could cancel to some extent. On the other hand pre-
wetting can also affect XAR due to adsorption of water on the reference disk due
to evaporation from the freshly wet concrete surfaceB. Thus, timing of the KP
measurement with respect to the moment of pre-wetting needs to be noted as
well for comparison between KP and conventional measurements when both
involve a pre-wetted surface.
These considerations can be readily extended to any other reference
electrode besides the CSE, with appropriate substitution for XSCu and XBCu and
for introduction of any pertinent additional metal-metal contact. The other terms
and their significance remain the same as before.
Experiments were conducted here to determine the feasibility, sensitivity
to system variables and stability of KP measurements on concrete surfaces, and
the extent to which the results could be correlated to conventional measurements
in the context of the above discussion.
B In lieu of a more sophisticated treatment that would need to address the creation of other interfaces due to the formation of a film or deposit, the combined effects are bundled for simplicity as an equivalent change in the effective value of XAR. The same approach applies here to any electrode that has a passive film or any other compositional differences near the surface.

14
3 Methodology
A KP was constructed with a 13 mm diameter austenitic stainless steel
(Type AISI 302) reference disk vibrating at 147 Hz with an approximately
sinusoidal, waveform of amplitude hA=0.5 ± ~0.1 mm (i.e., 1±~0.2 mm peak-to-
peak), implemented using a voice coil electromagnetic driver. At rest the
reference to working surface distance was h=1 mm, so the closest nominal
reference-to-working surface distance was hC = h-hA =~0.5 mm. The disk surface
was ground to an 800-grit finish and periodically cleaned by gently brushing with
a cotton-tipped applicator wetted with ethyl alcohol. The disk was placed at the
end of a short stem made of wood, to better dissipate static charging. As shown
in the sketch and photograph in Figure 3, a perforated metal casing placed
around the vibrating assembly and preamplifier provided shielding, leaving a 4
mm gap between the casing skirt and the concrete surface. Three insulated stop
screws around the skirt perimeter forming a triangle with the disk inside ensured
stable positioning against flat surfaces, and permitted fine h adjustment when
needed. The adjustment was to ±0.1 mm of the desired value, by gaging against
a flat machined surface. The experiments were only performed against
nominally flat and smooth concrete surfaces which typically introduced <0.1 mm
additional uncertainty in the value of h. However, probe design could easily be
optimized for more compact size and automatic working distance adjustment
using well established technology. The sensing circuit detected the off-zero
current with a circuit that approached a zero-resistance-ammeter configuration

15
[14]. Zeroing was made automatically with a feedback circuit, and the value of E
was acquired digitally. The probe output was electronically filtered with a low
pass filter with time constant τ ~ 1 s.
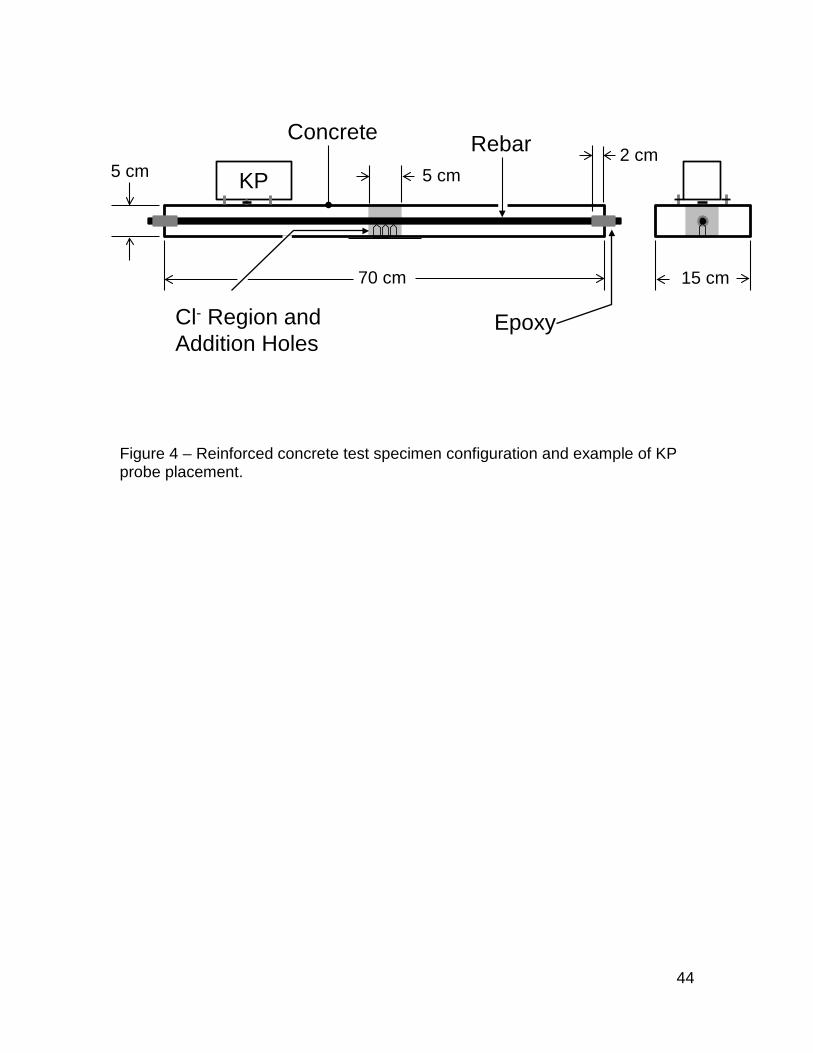
Concrete prisms 5 cm thick, 15 cm wide and 70 cm long were made in
duplicate using the mixture proportions listed in Table 1.
Table 1 – Mixture Proportions
Constituent Description Amount
Cement Type I/II 339 kg/m3
Coarse Aggregate Limestone ~ 2 cm max. 1,017 kg/m3
Fine Aggregate ASTM C778 Graded Sand 678 kg/m3
Water (W/C=0.5) Tap Water 169 kg/m3
The central 50 mm of the prism contained 8.4 kg/m3 Cl- ion (2.5 wt% of the
cement content, exceeding typical corrosion initiation threshold levels [19])
admixed by adding the corresponding proportion of NaCl (13.9 kg/m3).
Removable dams separated the Cl- - admixed region from the rest while casting
the concrete; the dams were removed just before final consolidation resulting in a
continuous joint. Wooden molds with a thin mold release cover were used. The

16
slabs were cast so that five surfaces were form-cast and the remaining one (a
broad face) was free and hand finished.
Each specimen had a longitudinally centered #4 (13 mm diameter) plain
steel ASTM A-615 reinforcing steel bar with dark mill scale, with the last 13 mm
inside concrete on each end as well as any emerging steel covered with epoxy
to avoid exit line corrosion. Steel placement is shown in Figure 4.
All KP and conventional wet-tip electrode tests were performed on the
broadest form-cast surface of the specimens. The form-cast surfaces were
macroscopically flat, but finely rough as is typical of a wood form finish.
The specimens were covered to prevent evaporation and demolded ~ 4
days after casting. Curing inside plastic bags with excess water continued until 4
weeks after casting, after which the specimens were left exposed to laboratory
air, ~60% relative humidity (RH) and ~ 24C. Initial conventional surface potential
surveys confirmed the presence of an actively corroding central region on the
rebar, coinciding with the chloride contaminated concrete. However, potential
differentiation between the central anodic region and the rest of the surface was
only modest (e.g < 150 mV) and tended to lessen with increasing drying of the
specimens. To increase differentiation, after ~12 weeks of exposure to laboratory
air the specimens were re-moisturized in closed wet bags for ~2 weeks. The
specimens were then modified on the hand-finished surface (on the opposite side
where the potential measurements were made) by drilling in the chloride-
contaminated zone with a masonry drill three equispaced 1-cm diameter holes,
17
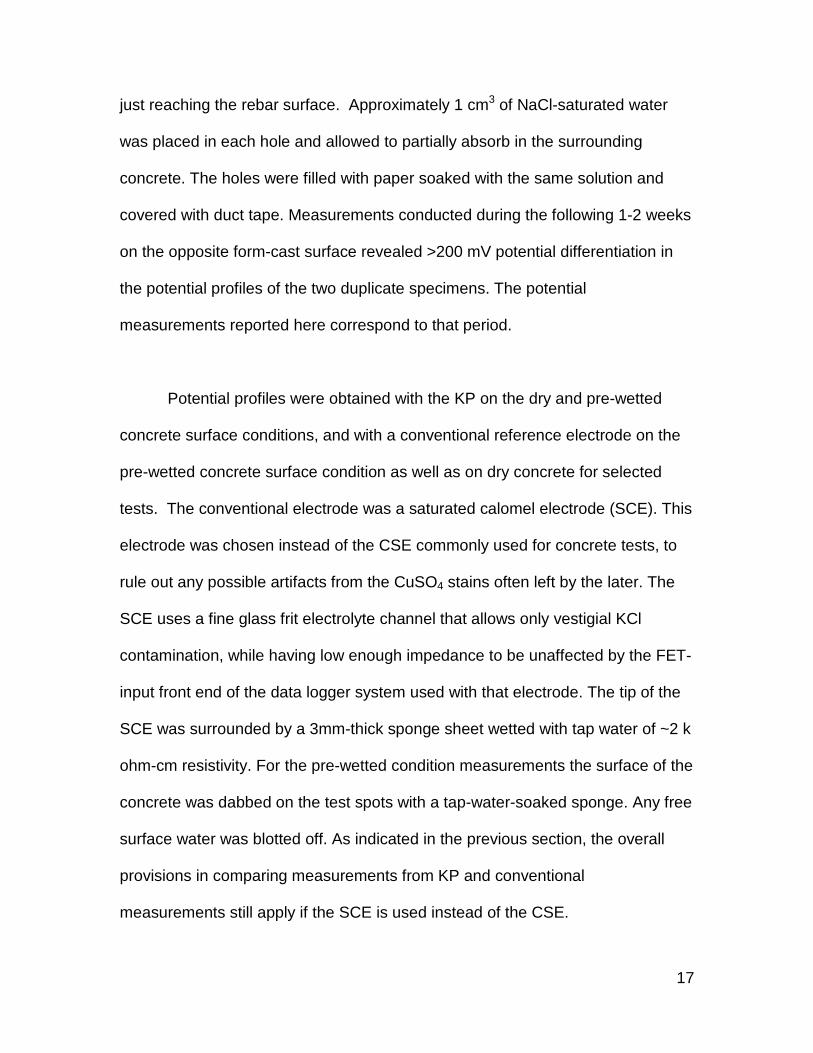
just reaching the rebar surface. Approximately 1 cm3 of NaCl-saturated water
was placed in each hole and allowed to partially absorb in the surrounding
concrete. The holes were filled with paper soaked with the same solution and
covered with duct tape. Measurements conducted during the following 1-2 weeks
on the opposite form-cast surface revealed >200 mV potential differentiation in
the potential profiles of the two duplicate specimens. The potential
measurements reported here correspond to that period.
Potential profiles were obtained with the KP on the dry and pre-wetted
concrete surface conditions, and with a conventional reference electrode on the
pre-wetted concrete surface condition as well as on dry concrete for selected
tests. The conventional electrode was a saturated calomel electrode (SCE). This
electrode was chosen instead of the CSE commonly used for concrete tests, to
rule out any possible artifacts from the CuSO4 stains often left by the later. The
SCE uses a fine glass frit electrolyte channel that allows only vestigial KCl
contamination, while having low enough impedance to be unaffected by the FET-
input front end of the data logger system used with that electrode. The tip of the
SCE was surrounded by a 3mm-thick sponge sheet wetted with tap water of ~2 k
ohm-cm resistivity. For the pre-wetted condition measurements the surface of the
concrete was dabbed on the test spots with a tap-water-soaked sponge. Any free
surface water was blotted off. As indicated in the previous section, the overall
provisions in comparing measurements from KP and conventional
measurements still apply if the SCE is used instead of the CSE.

18
Potential profile measurements were performed on the broad form-cast
surface, on top of the rebar, at the center of the face and at 2.5 cm intervals on
either side for the SCE and 1.25 cm intervals for the KP. The probe or electrode
output was recorded with a data logger ~5 seconds after placement in the test
spot.
For profile measurements on the dry surface condition the specimen had
been allowed to dry in lab air overnight from any previous test involving wetting.
For pre-wetted condition profile measurements the SCE or KP was placed and
the potential read on each spot typically within ~20 s after the spot was
prewetted. Repeat potential profiles were conducted ~10 minutes after the first.
4 Results and Discussion
4.1 Stability of Potential Readings
When placed on an undisturbed concrete surface in steady atmospheric
contact, the KP provided nearly instantaneous and far more stable readings than
those possible with a conventional wet-tip reference electrode. Figure 5 shows
typical time records of the output of the KP following placement on the surface of
a reinforced concrete specimen that had been left in laboratory air for several

19
days/weeks after curing. The tests were conducted at least one day after any
previous temporary wetting of the surface for SCE measurements. The records
correspond to transfer of the probe onto the concrete surface from rest on
another point on the concrete surface that had a different potential. Primary
stabilization to the new potential took ~1 second, reflecting the time constant of
the electronic filtering circuit. The charts show the potential drift as change of
output relative to the value obtained at a moment 1 second after probe
placement in the new position. That moment was designated as time=0. The
output for time>0 remained constant typically within ± 1mV for an evaluation
period of 3 minutes as long as the probe sensing disk assembly and underlying
concrete surface remained undisturbed. Warm or moist air briefly blown on the
sensing area caused potential excursions of up to several mV that vanished a
few seconds after the disturbance ended.
Figure 5 also shows for comparison the potential evolution observed when
placing afterwards on the same point the SCE with its wet sponge tip, but without
prewetting the surface. As it is commonly observed in such cases [1,10], there
was considerable drift of the output, reflecting electrolytic rearrangement in the
pore network of the concrete near the surface as it is invaded by the water from
the sponge, with consequent slow establishment of a new diffusion potential
regime. In the context of Eq. (5), those changes reflect variations in ∆Φ∗W and
XBW . The causes and direction of those changes are addressed in the discussion
on potential profiles later on. The extent of drift (e.g., up to >40 mV in 3 minutes)

20
greatly exceeded that encountered with the KP and in most instances the output
had not visually stabilized during the recording interval. Further considerations
on output stability are given in subsequent sections.
4.2 Effective Working Surface Position
For media with sufficient presence of mobile charge carriers the position of
the working surface from the standpoint of the operation of a macroscopic KP is
effectively the same as the geometric outer surface of the material [16]. For a
porous material like concrete, electric charge transport is dominated by the pore
solution which normally is highly conductive and partially fills the pore network.
The solid aggregate – cement paste matrix has properties that approach those of
a porous dielectric with vestigial conductance. For moist concrete, appreciable
amounts of pore water are expected to exist right up to the concrete outer
surface so it is clearly the working surface. For concrete long exposed to air of
moderate relative humidity the electrolyte presence in the pore network may be
very small due to evaporation, and the conductivity of the remaining electrolyte
may be also much diminished due to reaction with atmospheric CO2. Depending
on the concrete age and external humidity those effects reach depths ranging
from only a few µm to as much as many cm [4]. It was desired to determine to
which extent the KP working surface coincided with the geometric outer surface
for concrete in various conditions.

21
To examine that issue, measurements were conducted with the KP
zeroing circuit intentionally deviated, by 1 V, out of the balance condition. In that
condition the alternating current generated by the probe has its main spectral
component with frequency equal to the vibrating frequency, and amplitude
approximately inversely proportional to hC [20]. The KP circuit reports that current
after amplification as an a.c. potential, of which the r.m.s value, VOB, was
measured and recorded. When the effective working surface coincides with the
outer material surface, a plot of VOB-1 as function of h should yield a curve that on
extrapolation intersects the h axis at h = hA since at that condition the reference
surface would virtually contact the working surface with ideally unlimited output
amplitude. If the effective working surface were deeper than the external
surface, the extrapolated intersection of the curve for VOB-1(h) with the horizontal
axis would be at a value lower than hA, with a consequent expected shift of the
curve to the left compared with the previous case.
As a baseline, the value of VOB was measured when the KP reference was
placed on a flat-machined smooth steel surface at the normal h = 1mm working
distance, and also after increasing h to 1.25, 1.5, 1.75 and 2mm. The same
procedure was conducted at various points on the surface of the concrete prisms
when they had had been left in laboratory air for several days/weeks after curing.
Similar tests were conducted with three other available reinforced concrete
specimens that had been allowed to dry in laboratory air for over a decade after a

22
previous investigation. The composition of the concrete in those specimens
corresponds to mixes A, E and F as detailed elsewhere [21].
Figure 6 shows the resulting VOB-1(h) graphs. The results for steel could be
closely fit to a second-degree polynomial relationship with modest quadratic
component. The h-axis intercept of the fit function (average of two tests) was
~0.56 mm, approaching the value of hA=0.5 mm expected for a metallic surface
closely, considering the 0.1 mm uncertainty affecting both h and hA. The curves
for concrete, regardless of composition or age, all deviated very little from the
shape and position of the curve obtained for steel. Because of the close
superposition, only variation bands are shown, indicating the range of VOB-1
values obtained for the concrete specimens. The greatest corresponding
leftward horizontal deviation from the steel curve was only ~0.1 mm, which is well
within the overall variability in h especially since in concrete specimens some
surface deviation from a fully flat surface is common. The h-axis intercept of the
fit for the concrete specimens was virtually the same as that for the steel surface.
It was thus concluded that the concrete geometric outer surface coincided with
the KP working surface, at least within the operating positioning precision. That
result applied even for concrete that had aged extensively under the type of
moderately dry atmospheric conditions that lead to high surface resistivity values
(e.g. > 1 MΩ-cm).

23
4.3 Sensitivity to Working Distance
Spurious surface and spatial electric charges exist in the supporting
structure and other conductors near the vibrating disk inside the shielding
enclosure. Those charges modify the electric field created by the working
surface, so that the nulling potential differs from that which would have been
obtained in the absence of the spurious sources. The effect is relatively stronger
the further away the disc is from the working surface, so the result of the KP
measurement becomes sensitive to the average probe-to-working surface
distance [20]. The extent to which this artifact existed in the present system was
determined by varying the distance between the probe supports and the concrete
surface by means of spacers and measuring the resulting change in output.
The effect was found to be small, in the form of a shift in measured
potential in the positive direction typically ranging from nil to <40 mV when
increasing h from 1 mm to 2 mm, a change much larger than the usual variability
of h. Within that 1mm range the precise magnitude of the shift varied depending
on recent history of maintenance of the disk supporting assembly and cleaning of
the internal surface of the shielding enclosure. For any given such condition the
shift was approximately linearly dependent on the increase in working distance,
and of the same order when measuring either a flat-machined smooth steel
surface or concrete. Refinement in future probe design is expected to readily
minimize residual sensitivity to working distance.

24
4.4 Potential Profile Measurements
This section addresses potential measurements conducted at various
points of the concrete surface over a single piece of reinforcement with various
polarization conditions along its length. Before addressing those results it is
noted that other tests were conducted with the KP placed at a fixed position on
the dry surface of the specimens that had multiple, non-interconnected metallic
electrodes (the same specimens from a previous investigation noted earlier). In
those tests the KP yielded, as expected, potential values for the various
electrodes that differed from each other by the same amount as that determined
by direct measurement with a high impedance voltmeter. The agreement was
within the ± 1mV resolution and overall percent accuracy of the digital displays of
the voltmeter and the KP , as long as the switching of the KP connection from
one electrode to the other was performed promptly so minor drift effects such as
those shown in Figure 5 did not introduce additional error.
Figure 7 shows potential profiles obtained with the KP and with the SCE
for each of the duplicate longitudinal rebar specimens. The results correspond to
the condition described earlier, shortly after modification on the backside of the
specimens to obtain a strongly evidenced central corroding region. In each
specimen the first set of measurements was taken in the dry surface conditions
with the KP, proceeding from one end of the slab to the other and then repeated
immediately. The surface of the slab was then topically moistened at the

25
intended test spots and a second set of duplicate measurements was taken
using the SCE with the wet sponge tip. Afterwards the surface topical moistening
was refreshed and a final set of duplicate measurements was taken on the moist
spots with the KP. The duplicate results for the three sets of measurements are
labeled KP-Dry, SCE Wet and KP-Wet respectively.
The results from both slabs were comparable within the variability levels
commonly encountered with assessing corrosion phenomena in concrete. The
following addresses the short term repeatability in immediately consecutive
profile measurements within a given slab, and the overall features of the potential
profiles.
Regarding short term repeatability, the KP-Dry data showed closely
overlapping consecutive profiles along the entire length of the specimen,
consistent with the nearly constant output noted in Figure 5 for the KP placed on
a stabilized dry concrete surface. The SCE Wet data showed greater variability
in consecutive results than those for KP-Dry data, reflecting spot-to-spot
variations in time-dependent water absorption and evaporation following the pre-
wetting. The changes, which can be interpreted as noted earlier in the context of
Eq. (5), were in the same order as those shown in the time charts in Figure 5 for
the SCE data after the first minute or so of placing the wet sponge on a
previously dry concrete surface. When the KP was placed on the pre-wetted
locations the consecutive measurements on the same spot showed variability

26
greater than that for the KP in the dry condition, and comparable to that in the
SCE Wet data. As in the SCE measurements, that variability is interpreted as
being associated with moisture evolution with time at the pre-wetted spots on the
concrete surface, affecting XAW and ∆ΦW. Also as noted earlier, minute changes
in the amount of water adsorbed on the reference disk surface, given its
proximity to the freshly evaporating concrete surface, may have contributed to
the variability as well through changes in XAR.
Regarding overall features, the SCE profiles showed the distinct negative
dip pattern, in the present case ~200 mV deep, expected from a concrete slab
with a centrally corroding segment on a longitudinal reinforcing bar [22,23].
Figure 7 shows that the KP profile shape and range, for both the dry and wet
conditions, generally reproduced the SCE pattern. That is manifested in the
graphs in Figure 8 that show linear correspondence with slopes ranging from
0.87 to 1.12 and correlation coefficients ranging from 0.87 to 0.96. The
corresponding offsets from an ideal 1:1 coincidence with the CSE readings were
about +100 to +200 mV for the KP-Dry condition, and about half as much for the
KP-Wet condition. Comparison of the profiles is conceptually more
straightforward for the Wet cases, where both probes interacted with a concrete
surface in the same nominal condition and measurement timing was similar.
Assuming on first approximation a correlation slope of unity, the potential offset
for the wet cases may be viewed as a temporary calibration of the KP readings
with respect to potential measurements in the SCE scale, corresponding ideally

27
to the addition of the terms in square brackets in the equivalent of Eq.(6) for an
SCE.
The calibration should be viewed as temporary because even if the timing of the
measurements with respect to the moment of wetting were strictly controlled, day
to day variations in environmental variables as well as long term evolution of the
concrete surface are expected to appreciable affect the key parameters in Eq.(6).
In particular, the value of XAR (as treated in the simplified treatment used here) is
highly sensitive to the makeup of a region only a few atomic distances thick on
the disk surface. Even if the disk had been recently cleaned, monolayer-levels of
moisture or organic vapor precipitation on the surface can readily build up with
time of exposure to normal environmental conditions, leading to potential
changes that can be large (e.g.> 100 mV [14]). Variations of that order were
noted during testing conducted at different times, especially if servicing of the
probe disk was involved. Consequently, if absolute as well as relative potential
profile information were sought with the KP, a fresh calibration step should be
conducted concurrent with the measurements. It is also reminded that the
potential offset depends on the nature of the disk alloy used, so the relative
position of the data graphs in Figure 8 would have been different if, for example,
a gold-plated would have been used instead of the stainless steel disk.
The KP-Dry surface profiles were, as exemplified in Figures 7 and 8,
usually positively offset with respect to those obtained in the Wet condition. This
shift is in the same direction as that documented for the SCE in Figure 5 by

28
comparing the potential obtained at very short times, when the concrete surface
was only beginning to depart from its initial dry condition, to the more negative
values prevalent after substantial water absorption from the sponge took place.
Such change may be interpreted as due to the slow dissipation of a diffusion
potential (manifested in the combined values of XAW and ∆ΦW or XBW and ∆Φ∗W
in Eqs. (4) or (5) respectively) due in part to a gradient in OH- concentration in
the water partially filling the pores [10,13]. The OH- concentration of the pore
water has high values inside the concrete, due to high alkaline content [24], and
smaller values near the surface because of carbonation by interaction with
atmospheric CO2. In this interpretation, the higher diffusivity of the OH- ions
compared with that of the balancing cations [13] promotes a diffusion potential
difference where the outer surface is more negative than the inside; because of
the polarity of the KP and SCE measurements the result is a more positive steel
potential reading than if the diffusion potential were not present. Other
electrolytes, such as those associated with chloride salts, would have additional
individual effects. As water refills the partially empty pore network near the
surface, the resulting enhanced transport between outer and inner regions
lessens solute concentration gradients hence reducing the magnitude of the
junction potential difference and resulting in a shift in the negative direction of the
measured potential.
The KP-Dry surface profiles showed also more spatial variability than
those for the Wet condition. Because of the high reproducibility noted above, the

29
spatial variability represented in general true local potential differences on dry
regions 1.25 cm apart. The source of the short distance variability is yet to be
identified in follow up work. In that context, it is noted that the KP-Wet profiles
tended to show less short-distance spatial variability than for the dry condition. It
may then be proposed that the local variations in the dry case are associated
with variations in diffusion potential from local changes in the degree of
carbonation, or differences in the evaporative concentration at the extreme outer
surface of other species with similar outcome. Some of the differences may be
associated with how close to the surface the coarse aggregate may be locally.
Those effects would diminish upon pre-wetting as discussed earlier, resulting in a
smoother potential profile than that in the dry condition.
The above discussion generally assumed that the moisture condition of
the steel-concrete interface was the same while switching between the dry and
wet conditions of the outer concrete surface over short periods of time. The
changes were considered to be negligible because the concrete slabs were
relatively young and had also experienced periodic moisture conditioning. In
those conditions and for the 0.5 w/c concrete used, convective transport is
expected to be limited to a depth from the surface appreciably less than the
concrete cover thickness over the rebar [25]. Transport by diffusion through the
pore network of the concrete is very slow and it would not be expected either to
lead to any noticeable effects on the time scale considered [4]. Hence the results
from both the dry and wet surface experiments were interpreted to differ primarily

30
because of changes in the zones closer to the outer concrete surface. The
moisture content at the rebar surface could however change substantially on
external moisture cycling if cover were shallower or the cycles longer. In such
cases the potential difference between the two conditions observed with the KP
could include also a component due to variations in the potential across the
metal-pore water interface, not unlike those encountered between immersed and
emersed conditions in passive metals [26].
The profile measurements presented here were exploratory in nature, and
addressed for simplicity cases with strongly defined corrosion macrocell patterns
that dominated the potential distribution on the concrete. The partial contribution
resulting from the chloride content gradient, which can also indirectly affect the
local rate of carbonation, is being investigated in follow up work. Further work
should also aim toward development of a rational calibration procedure to relate
the potential determined by the KP to that of the metal-concrete interface,
perhaps by adequate choice of an external concrete surface condition and a
methodology comparable to that of Leng [17].
4.5 Prospective applications and open issues.
This work demonstrated the practical feasibility of KP measurement of
potential on the concrete surface, with very low drift on dry concrete surfaces,
and sufficient sensitivity for detailed potential mapping. An especially attractive

31
feature of the KP is its ability to perform essentially instantaneous and non-
intrusive measurements, requiring neither direct contact with the surface nor prior
surface preparation in the form of wetting plus stabilization. The output sensitivity
to disk-to-surface distance is modest, which is desirable for practical use on
regularly finished concrete surfaces. Some prospective applications for
continuing investigation are noted next.
The KP merits consideration as an alternative to wet-tip contacting
reference electrodes for conducting potential survey of bridge decks or similar
structures without need for laborious maintenance of wet contacts [1, 2]. Given
its speed, stability and absence of contact with the concrete surface the KP or an
array thereof may be particularly suitable to adapt for automatic operation trailed
from a slow moving vehicle for minimum traffic disruption. Future work to assess
the feasibility of this application should determine how tolerable is the
measurement scatter introduced by the probe sensitivity to the surface condition
of itself and of the concrete, especially in the presence of contaminant spills or
other commonly occurring alterations of the structural surface. Some of that
scatter, as well as the sensitivity to surface roughness, may be reduced by using
a larger reference disk and a higher disk-to-surface distance. Those
modifications provide for spatial averaging of the output with consequent filtering
of short-distance variations, and can be implemented by hardware scaling with
readily available technology. In addition, control of the condition of the disk

32
surface will need attention, including possible use of solid alloys or surface
plating less prone to contamination.
The KP probe also holds promise as a highly stable reference electrode
for measurements of polarization resistance or of low frequency electrochemical
impedance of reinforcement, especially when the concrete surface is dry and it is
desired not to disturb it. In those cases wet-tip electrode potential drift, as well as
the effect of any moisture applied to the concrete near the reinforcement for
surface preparation, could lead to appreciable measurement artifacts. The use of
the KP together with a non-wetting counter electrode (such as a conductive
elastomer [27]) would obviate those concerns. Polarization tests of this type
involve measuring only relative potential changes at a single point on the surface,
so sensitivity to spatial variations in concrete surface condition is not an issue
such as it was for potential mapping. Application of the KP to this type of
measurement has been demonstrated for other systems [28]. Experiments to
demonstrate feasibility for the present case are in progress.
In its present form the probe would require, for either of the above
applications, a ground contact to one point in the normally electrically continuous
reinforcing steel assembly of the structure to be assessed. For traveling probes
that connection should be implemented beforehand, so the entire structure could
be sampled using a temporary flexible extension cable. In potential mapping the
identification of corroding spots may be sufficiently established, if the surface

33
potential gradients are large enough, solely by means of differential potential
measurements which ideally do not need a ground contact. That approach can
be implemented with wet-tip reference electrodes if they and the underlying
concrete have sufficiently low impedance to keep electrical noise at acceptable
levels. The feasibility of a similar approach using a differential KP configuration
needs yet to be established by conceptual development and demonstration.
For clarity, it is noted that the use of the KP as introduced here focuses on
avoiding the need for contact with the concrete surface at the potential test point.
Technology has been introduced recently for corrosion assessment by
polarization measurements with current injection and extraction points with
contacts on the concrete surface, but none to the rebar assembly [29]. That
technology addresses a different issue not to be confused with that of the present
paper, although it may be possible in the future to favorably combine aspects of
each.
While a source of scatter in the case of potential mapping applications, the
high sensitivity of the KP to the condition of the concrete surface offers a
powerful alternative to investigate phenomena for which a wet-tip electrode
would be too disruptive. Among other applications, the KP with appropriate
customization may be able for example to (i) measure the evolution of the early
stages of concrete carbonation in real time by monitoring the associated diffusion
potential development, a sensitivity that applies also to the following; (ii) detect

34
moisture content gradients that would have been otherwise overwhelmed by
contact with a wet electrode tip; (iii) detect diffusional penetration and partition of
moisture and chemical species such as chloride ions between aggregate and
hydrated cement paste in concrete cross sections; (iv) assess the transport and
distribution of migrating corrosion inhibitors in concrete; (v) characterize the
penetration and aging of concrete surface treatments such as silane/siloxane
compounds; (vi) characterize the extent of evaporative concentration of species
such as chloride ions on the external concrete surface; (vii) assessment of
sulfate attack; (viii) assessment of concrete surface contamination and the
effectiveness of cleaning and remediation methods.
6 Conclusions
The practical operation of a macroscopic Kelvin Probe (KP) for contactless
measurement of concrete surface potentials was demonstrated.
Potential readings when placing the KP on dry concrete surfaces were
nearly instantaneous and highly stable, in contrast with the considerable potential
drift that took place when first placing a wet-tip electrode on the same surfaces.
The potential sampled was found to be that of a plane closely approaching
the outer concrete surface even for concrete specimens that had been exposed

35
to dry and naturally carbonating lab air for many years, for which high surface
resistivity is expected.
The KP output was only modestly sensitive to changes in the reference
disk to concrete surface working distance.
The shape and range of potential profiles measured with the KP were consistent
with the location of the local anode in a reinforced concrete beam with a well-
differentiated centrally corroding rebar segment. The KP profiles were offset
from, but comparable in shape and range, to those obtained independently with a
conventional wet-tip reference electrode. The offset depended on the condition of
both the KP disk and the concrete surface, so appropriate calibration is needed if
absolute potential determination with the KP is desired.
Comparable KP profile features were obtained when sampling the
concrete in either the dry or a pre-wetted surface condition, but with greater
point-to-point variability in the former. The variability reflects the sensitivity of the
KP output to the local condition of the concrete surface. That sensitivity may be
caused by the development of ionic concentration gradients with depth from the
concrete surface, with associated diffusion potential differences.
The results encourage exploration of the use of the KP for fast automated
field corrosion potential surveys, precise polarization and electrochemical

36
impedance determination when the concrete surface is dry, and physicochemical
determinations in concrete for conditions where the use of a conventional wet-tip
reference electrode would be disruptive.
7 Acknowledgment
This work was performed with the support and facilities of the University of
South Florida. The assistance of Kingsley Lau with trial tests is greatly
appreciated.
8 References
[1] ASTM C876 - 09, Standard Test Method for Half-Cell Potentials of Uncoated Reinforcing Steel in Concrete, 2009. [2] B. Elsener, C. Andrade, J. Gulikers, R. Polder, and M. Raupach, Half-Cell Potential Measurements – Potential Mapping on Reinforced Concrete Structures, Materials and Structures 36 (2003) 461-471. [3] Y. Schiegg, M. Buchler and M. Brem, Potential mapping technique for the detection of corrosion in reinforced concrete structures: Investigation of parameters influencing the measurement and determination of the reliability of the method, Materials and Corrosion 60 (2009) 79-86. [4] L. Bertolini, B. Elsener, P. Pedeferri, and R. Polder, Corrosion of Steel in Concrete, Wiley, Weinheim, 2004. [5] U.M. Angst, B. Elsener, C.K. Larsen, O. Vennesland, Chloride induced reinforcement corrosion: Electrochemical monitoring of initiation stage and chloride threshold value, Corrosion Science 53 (2011) 1451–1464.

37
[6] A.A. Sagüés, S.C. Kranc, and E. Moreno, Time Domain Response of a Corroding System with Constant Phase Angle Interfacial Component: Application to Steel in Concrete, Corrosion Science 37 (1995) 1097-1113. [7] C. Andrade and J. Gonzalez, Quantitative Measurements of Corrosion Rate of Reinforcing Steels Embedded in Concrete Using Polarization Resistance Measurements, Werkstoffe und Korrosion 29 (1978) 515-519. [8] A.A. Sagüés, M..A. Pech-Canul, and Shahid Al-Mansur, Corrosion Macrocell Behavior of Reinforcing Steel in Partially Submerged Concrete Columns, Corrosion Science 45 (2003) 7-32. [9] D.A. Jones, Principles and Prevention of Corrosion, 2nd ed., Prentice Hall, Upper Saddle River, 1995. [10] R. Myrdal, Phenomena that Disturb the Measurement of Potentials in Concrete, Corrosion/96, paper no. 339, NACE International, Houston, 1996. [11] R. Myrdal, Potential Gradients in Concrete Caused by Charge Separations in a Complex Electrolyte, Corrosion/97, paper no. 278, NACE International, Houston, 1997. [12] U. Angst, O. Vennesland, and R. Myrdal, Diffusion Potentials as Source of Error in Electrochemical Measurements in Concrete, Materials and Structures 42 (2009) 365-375. [13] U. Angst, B. Elsener, R. Myrdal, and O. Vennesland, Diffusion Potentials in Porous Mortar in a Moisture State below Saturation, Electrochimica Acta 55 (2010) 8545-8555. [14] U. Klein, W. Vollmann, and P.J. Abatti, Contact Potential Differences Measurement: Short History and Experimental Setup for Classroom Demonstration, IEEE Transactions on Education 46 (2003) 338-344. [15] M. Stratmann and H. Strechel, On the Atmospheric Corrosion of Metals which are Covered with Thin Electrolyte Layers – I. Verification of the Experimental Technique, Corrosion Science 30 (1990) 681-696. [16] L. Kronik and Y. Shapira, Surface photovoltage phenomena: theory, experiment, and applications, Surface Science Reports 37 (1999) 1-206. [17] A. Leng, H. Streckel, and M. Stratmann, The Delamination of Polymeric Coatings from Steel – Part 1: Calibration of the Kelvinprobe and Basic Delamination Mechanisim, Corrosion Science 41 (1999) 547-578.

38
[18] J. Bockris, A. Reddy, and M. Gamboa-Alcedo, Modern Electrochemistry, Vol. 2A, 2nd Ed., Kluwer Academic, New York, 2000. [19] Ann, K. Y., and Song, H. W., "Chloride Threshold Level for Corrosion of Steel in Concrete," Corrosion Science 49 (2007) 4113 -4133. [20] B. Ritty, F. Wachtel, R. Manquenouille, F. Ott, and J. Donnet, Conditions necessary to get meaningful measurements from the Kelvin method, J.Phys. E: Sci. Instrum. 15 (1982) 310-317. [21] E.I. Moreno, A. Sagüés, and R.G. Powers, Performance of Plain and Galvanized Reinforcing Steel During the Initiation Stage of Corrosion in Concrete with Pozzolanic Additions, Corrosion/96, paper no. 326, NACE International, Houston, 1996. [22] J. Ozbolt, G. Balabanic and M. Kuster, 3D Numerical modeling of steel corrosion in concrete structures, Corrosion Science 53 (2011) 4166-4177. [23]S.C. Kranc, A.A. Sagüés, Detailed modeling of corrosion macrocells on steel reinforcing in concrete, Corrosion Science 43 (2001) 1355–1372. [24] L. Cáseres, A.A. Sagüés, S.C. Kranc and R.E. Weyers, In-Situ Leaching Method for Determination of Chloride in Concrete Pore Water, Cement and Concrete Research 36 (2006) 492-503. [25] P. Schiessl and S. Lay, Influence of concrete composition, Corrosion in reinforced concrete structures, H. Boehni, Ed., CRC Press, Woodhead Publishing Ltd., Cambridge, 2005 pp. 91-134 [26] R. Hausbrand, M. Stratmann, and R. Rohwerder, The Physical Meaning of Electrode Potentials at Metal Surfaces and Polymer/Metal Interfaces: Consequences for Delamination, Journal of The Electrochemical Society 155 (2008) C369-C379 [27] M.A. Pech-Canul, A. A. Sagüés, and P.Castro, Influence of Counter Electrode Positioning on Solution Resistance in Impedance Measurements of Reinforced Concrete, Corrosion 54 (1998) 663-667. [28] G.S. Frankel , M. Stratmann, M. Rohwerder, A. Michalik, B. Maier, J. Dora and M. Wicinski, Potential control under thin aqueous layers using a Kelvin Probe, Corrosion Science 49 (2007) 2021–2036. [29] C. Andrade, I. Martínez and M. Castellote, Feasibility of determining corrosion rated by means of stray current-induced polarization, Journal of Applied Electrochemistry 38 (2008) 1467-1476.

39
Figure Captions
Figure 1 – Schematic representation of potentials and interfacial potential
differences in a KP arrangement for steel in concrete.
Figure 2 – Schematic representation of potentials and interfacial potential
differences in a conventional reference electrode arrangement for steel in
concrete, illustrated for the CSE.
Figure 3 – Schematic and photograph of Kelvin Probe (KP) implementation.
Figure 4 – Reinforced concrete test specimen configuration and example of KP
probe placement.
Figure 5 – Stability of Measured Potential for KP and SCE, shown as drift from
value measured 1 second after probe placement on dry concrete. Results shown
as stacked graphs for four positions indicated by distance from center of Slab A..
Figure 6 – Determination of effective working surface position. Circles: Flat-
machined steel surface. Range bands: Two positions at Slab A (center and 15
cm away), and three specimens aged in lab air [21]. Solid/ Dashed lines: 2nd
order polynomial trend fits for Steel / Concrete average. Triangle: h-axis
intercepts; Steel: 0.56 mm; Concrete: 0.57 mm.

40
Figure 7 – Potential profiles obtained in reinforced concrete slabs illustrating
overall trends and variation between replicate slabs A and B.
Figure 8 – Correlation between potentials measured with the SCE (always on a
pre-wetted concrete surface) and the KP on the concrete surface in the dry and
wet conditions, illustrating overall trends and variation between replicate slabs A
and B.

41
φW
φ’W
φS
ψR ψW
φR XAR
XAW
X’WS
XSR
∆φW
R (disk)
S (steel)
W(concrete)
, Figure 1 – Schematic representation of potentials and interfacial potential differences in a KP arrangement for steel in concrete.

42
φ’W
φS
φCu2
φB
XBW
X’WS
XBCu
∆φ*
Cu
S (steel)
W(concrete)
XSCu
φCu1
Cu
CuSO4Salt Bridge
ECSE
+
- Cu
Cu
Wφ*W
Figure 2 – Schematic representation of potentials and interfacial potential differences in a conventional reference electrode arrangement for steel in concrete, illustrated for the CSE.

43
Concrete
Voice CoilInner Shield
Casing
PreamplifierStem
Disk
Side View End View
Stop Screw
Steel
Data Logger
Control and Display Unit
E
Figure 3 – Schematic and photograph of Kelvin Probe (KP) implementation.
44
70 cm 15 cm
5 cm 5 cm
Rebar
Cl- Region and Addition Holes
KP2 cm
Concrete
Epoxy
Figure 4 – Reinforced concrete test specimen configuration and example of KP probe placement.

45
0 50 100 150 200
Pote
ntia
l Drif
t -10
mV
/ Di
visi
on
Time/s
SCEx = -15 cm
x = -5 cm
KP
x = 0 cm
x = 10 cm
KP
KP
KP
SCE
SCE
SCE
Pote
ntia
l Drif
t /
mV
0
-40
0
-40
0
-40
0
-40
Figure 5 – Stability of Measured Potential for KP and SCE, shown as drift from value measured 1 second after probe placement on dry concrete. Results shown as stacked graphs for four positions indicated by distance from center of Slab A.

46
0.000
0.010
0.020
0.030
0.040
0.050
0 0.5 1 1.5 2
V OB
-1/ m
V -1
h / mm
Figure 6 – Determination of effective working surface position. Circles: Flat-machined steel surface. Range bands: Two positions at Slab A (center and 15 cm away), and three specimens aged in lab air [21]. Solid/ Dashed lines: 2nd order polynomial trend fits for Steel / Concrete average. Triangle: h-axis intercepts; Steel: 0.56 mm; Concrete: 0.57 mm.

47
-500
-400
-300
-200
-100
0
-30 -20 -10 0 10 20 30
Pote
ntia
l/m
V
Distance from Slab Center/cm
KP Dry 1KP Dry 2KP Pre-Wet 1KP Pre-Wet 2SCE Pre-Wet 1SCE Pre-Wet 2
KP-Dry
KP-Wet
SCE-Wet
-500
-400
-300
-200
-100
0
-30 -20 -10 0 10 20 30
Pote
ntia
l/m
V
Distance from Slab Center/cm
KP w/LabPro, #1KP w/LabPro, #2KP, pre-wet, #1KP, pre-wet, #2SCE w/LabPro,#1SCE w/LabPro
KP Pre-Wet
SCE Pre-Wet
KP-Dry
KP-Wet
SCE-Wet
A
B
Figure 7 – Potential profiles obtained in reinforced concrete slabs illustrating overall trends and variation between replicate slabs A and B.

48
-500 -400 -300 -200 -100 0
ESCE / mV
KP-Dry
KP-Wet-500
-400
-300
-200
-100
0
-500 -400 -300 -200 -100 0
E KP
/ mV
ESCE / mV
KP-Dry
KP-Wet
A B
Figure 8 – Correlation between potentials measured with the SCE (always on a pre-wetted concrete surface) and the KP on the concrete surface in the dry and wet conditions, illustrating overall trends and variation between replicate slabs A and B.