kefr16-2-내지-53p수정 - KIF · 2017. 1. 31. · Title: kefr16-2-내지-53p수정 Created Date:...
65
Korean Economic Financial Review & Vol.16 | No.2 | April 2011
Transcript of kefr16-2-내지-53p수정 - KIF · 2017. 1. 31. · Title: kefr16-2-내지-53p수정 Created Date:...
KoreanEconomic
FinancialReview
&
Vol.16 | No.2 | April 2011

President and Publisher
Tae-Joon Kim [email protected]
Contributors (in alphabetical order)
Junghan Koo
Jae-Youn Lee
Kyoobok Lee
Myungwhal Lee
Soonho Lee
Sukho Lee
Yoonsok Lee (Editor)
Hyungjoon (Ray) Lim
Hyoung-Seok Lim
Hyoungsik Noh
Sungwook Park
Jeong Ho Suh
Christopher Byungho Suh
Thomas Steinberger (English Editor)
The Korean Economic and Financial Review, April 2011, Vol.16, No.2. The
KEFR is published four times a year (January, April, July, October) by the
Korea Institute of Finance. Permission to reproduce any portion of this work for
non-commercial purposes or classroom use should be obtained from the Korea
Institute of Finance, (822) 3705-6108, KFB Building, 4-1 Myung-Dong 1-Ga,
Chung-Ku, Seoul, Korea 100-021
Copyright 2011 by the Korea Institute of FinanceSeoul, Korea. All Rights Reserved
Printed by KM
Printed on April 30, 2011
Registration No. Ma-02619
Registration on December 17, 1996

Contents
Overview (Yoonsok Lee)
ⅠⅠ. Macroeconomic DevelopmentsA. Demand and Supply 9
1. Aggregate Demand (Hyoung-Seok Lim, Sungwook Park) 9
2. Aggregate Supply (Hyoung-Seok Lim) 16
B. Inflation (Kyoobok Lee) 19
1. Oil and Import Prices 19
2. Domestic Inflation 21
C. Macroeconomic Outlook for 2011 23
1. Global Economy and Balance of Payments (Sungwook Park) 23
2. Economic Growth (Myungwhal Lee) 25
3. Inflation (Kyoobok Lee) 28
ⅡⅡ. Financial Markets and IndustryA. Asset Prices(Kyoobok Lee, Sungwook Park, Hyungjoon (Ray) Lim) 29
1. Recent Trends 29
2. Outlook for 2011 32
B. Money and Credit (Kyoobok Lee) 34
C. Financial Industries 37
1. Banking Industry (Hyoungsik Noh) 37
2. Non-Banking Financial Institutions (Soonho Lee) 40
3. Securities Industry (Junghan Koo) 45
4. Insurance Industry (Sukho Lee) 47
ⅢⅢ. Current IssuesA. Korea's Credit Card System & Potential Measures
(Jae-Youn Lee) 52
B. The Role of Private Finance in Helping Korean Firms Win
Overseas Projects (Jeong Ho Suh) 56
C. Policy Agenda for Domestic Banks' Foreign Expansion
(Christopher Byungho Suh) 60

Macroeconomic Developments
The domestic economy has maintained its underlying
upward trend on the strength of high growth shown by
exports, even though consumption and facilities invest-
ment have faltered. The Korean exports are likely to
remain strong, and the improvement in domestic
demand, such as facilities investment, will be further
enhanced. These economic forecasts, however, still
remain uncertain due to the risk factors in domestic and
overseas economies.
Outlook for 2011
The Korean economy in 2011 is anticipated to continue
remaining on a robust recovery path. We forecast a
GDP growth of 4.4% for 2011 resulting from an expan-
sion in both domestic demand and exports growth.
Growth is forecast to be 4.0% and 4.7% y.o.y. in the
first and second half, respectively. By the component of
expenditures, exports and private consumption are
expected to increase by 12.2% and 3.3% y.o.y. respec-
tively. We expect also facilities investment and con-
struction investment to be 6.9% and △0.4% y.o.y.
respectively in 2011.
The Korean economy continued to show strong growth in the first quarter of 2011 amid strongexports although consumption and facilities faltered. Despite worries of rapid increase in globalcommodity prices and possible negative effects of the Japan earthquake, we maintain our growthforecast of 4.4% in 2011. We lowered our expected current account surplus to 12.0 billion USD in2011 due to higher import expectations and also revised our won forecast to 1,075. While Koreanbanks deleveraged in the fourth quarter of 2010 we expect growth opportunities to rebound in thefirst half of 2011. During the fourth quarter of 2010, assets of credit card companies increased 7.1%to 54.5 trillion won partly due to recent rapid increase in credit card loans. Meanwhile profitability ofsecurities companies is expected to rise as brokerage commissions is expected to increase due tothe rising transaction volumes.
Overview
Korean Economic and Financial Review [April 2011]4

Export and imports are expected to increase 15.6% and
21.4%, respectively, in 2011. Therefore, the balance of
payments is expected to register a current account sur-
plus of 12.0 billion USD in 2011, smaller than the 28.2
billion USD figure from the previous year. The reduc-
tion should occur mainly from a faster recovery of
imports than exports and rising raw materials prices.
Financial Markets
In the first quarter of 2011, money market rates mostly
increased following a change in the monetary policy by
the Bank of Korea. Meanwhile, long-term market inter-
est rates decreased slightly as investors’ risk aversion
increased due to the Japanese earthquake and nuclear
accident and the unrest in North Africa and the Middle
East and so on. As the base rate of the Bank of Korea is
expected to increase additionally in the rest of 2011
with high inflationary pressure, Treasury bond (3yr)
yields in 2011 are expected to be 4.0%, or 0.3%p higher
than 2010.
In 2011, the won/dollar exchange rate is expected to
average 1,075, down from the 1,156 figure of 2010.
The rate is to be affected by the continuous current
account surplus in Korea, foreign portfolio investment
inflows and the extended easing policy by the Fed. The
downward trend in the won/dollar exchange rate will,
however, be slowed by high raw materials prices and
remaining uncertainties in the international financial
markets.
The Korea Composite Index (KOSPI) ended the first
quarter of 2011 at 2,107 points, up 37 points from the
beginning of the year. The index has been negatively
affected by the Middle Eastern liberalization and the
Japanese earthquake, but managed to recover owing to
the robust buying of institutional investors. In the sec-
ond quarter, Korea’s equity market is expected to have
balanced upside and downside risks.
Overview 5

Money and Credit
In January and February of 2011, the money supply
continued to increase, but at a slower pace. M2 and Lf
growth fell to 5.7% and 5.9% in those period versus
7.4% and 8.3% in the fourth quarter of 2010.
During the first quarter of 2011, total depository banks’
corporate and household lending increased 12.6 trillion
won and 3.0 trillion won each. In 2011, corporate and
individual bank lending is expected to continue to rise
as the solid growth of real economy and high loan
demand from high inflation. However, its growth will
be limited by a rise in the base rate.
Financial Industries
In the fourth quarter of 2010, Korean banks’ assets sig-
nificantly decreased with a meager increase in loans.
Net income decreased over the previous quarter thanks
to a decrease in non-interest income while interest
income increased with the help of an increase in net
interest margins. Both loan loss provisions and bad debt
expenses decreased. The asset soundness substantially
improved whereas the BIS capital adequacy ratio
slightly went down. Growth opportunities for Korean
banks are expected to rebound in the first half of 2011.
Net income is expected to continue to improve. The
asset soundness and the capital adequacy ratio are
expected to ameliorate slightly.
In the fourth quarter of 2010, most non-banking finan-
cial institutions experienced asset growth. The net
income of non-banking financial institutions was posi-
tive except for Mutual Savings Banks and Agricultural
Cooperatives. Excluding installment financing compa-
nies and MSBs, the loan soundness of non-banking
financial institutions improved. Except for Mutual
Credits, capital adequacy also improved. Since the
competition between credit card companies and credit
finance companies become increasingly heated, operat-
ing expenses are expected to increase. Owing to poten-
tial insolvent loans, MSBs and MCs will be required to
adequately manage credit risks.
Korean Economic and Financial Review [April 2011]6

The assets of securities companies increased 21.9% to
199.8 trillion won during the fourth quarter of 2010, up
from 164 trillion won in the same quarter last year. This
was attributable to the increase in marketable securi-
ties, especially in bond holdings, which were up 20.7
trillion won. Securities companies’ profits increased
188.9% over the same period last year to 780 billion
won driven by increased brokerage commissions and
fees from asset management service. Capital adequacy
fell 37%p compared with the same quarter last year.
Despite higher net operating capital, total value at risk
rose due to the higher exposure to interest rate risk.
At the end of the third quarter of FY2010, premium
income of life insurers recorded 23.3 trillion won, up
4.3% y.o.y. Direct premiums written for non-life insur-
ers during the same period were up 28.6% y.o.y. to 12.8
trillion won. Total assets and premium income of the
life insurance industry during the first quarter of
FY2011 are expected to grow due to an upturn in the
sales of variable life insurance and continued inflow in
premium income from savings type insurance. Non-life
insurers are expected to maintain the growing trend,
driven by, in particular, long-term non-life insurance.
Current Issues
We have three papers that deals with current issues at
hand. The first paper covers the problems of the current
credit card system and potential measures to resolve
dissatisfaction among merchant members. Rapid
growth and competition in Korea’s credit card market
led to an expansion in benefits for card user members.
The costs of these benefits have been passed on not to
large merchant members but smaller ones because card
companies held the power to determine the merchant
fees of the latter exclusively in the 3-party scheme.
Mandating a merchant member pool system may allow
us to enjoy the benefits of the 4-party scheme while
maintaining the current 3-party scheme because it can
help improve bargaining power over large merchants
for the card companies. The second paper touches on
the role of private finance on supporting overseas pro-
jects of Korean firms. With the flurry of infrastructure
Overview 7

investment by resource-rich countries amid recent high
oil prices, competition has been heating up to win
orders for large-scale plants. In order to support mid-
/long-term demand for FX financing effectively, the
functions of Korea’s export credit agencies (ECAs)
should be strengthened first and foremost. However. as
there are limits to ECAs’ funding capacity, Korea also
need to enhance the competitiveness of private finan-
cial companies in the longer-term. ECAs, financial
companies, and supervisory authorities must design a
shared road-map for strengthening the private financial
sector, and push ahead with the globalization of
Korea’s financial industry. The last paper deals with the
policy agenda of domestic banks’ foreign business
expansion. It is imperative for the Korean government
to encourage domestic banks’ globalization through
foreign expansion. However, the institutional environ-
ment for domestic banks’ foreign expansion is not
friendly yet: Korean banks are required to keep their
loan exposure to each foreign country below 10%; it is
impossible for Korean banks to change the purchase
condition upon tender offer abroad; foreign sub-
sidiaries of domestic banks need to provide collateral
when they borrow money form their parent company;
and each foreign branch is subject to evaluation as an
independent entity. The government should abolish
rules that restrict domestic banks’ foreign expansion
and promote challenging so that domestic banks can
leap forward.
Korean Economic and Financial Review [April 2011]8

A. Demand and Supply
1. Aggregate Demand
Hyoung-Seok Lim ([email protected])
The domestic economy has maintained its underlying
upward trend on the strength of high growth shown by
exports, even though consumption and facilities invest-
ment have faltered. The domestic economy will keep
up its underlying trend, even in the presence of external
risks.
Real GDP (chained volume measure) increased 4.2% in
the first quarter of 2011. That primarily reflected posi-
tive contributions from expanded exports of goods &
services. On the production side, manufacturing
increased by 9.9% and services 2.8%. On the expendi-
ture side, facilities investment and exports went up by
12.0% and 16.8%, respectively, in the first quarter of
2011.
Domestic shipments and export shipments increased by
11.5% and 18.2%, y.o.y. in the last year and 6.3% and
15.7% y.o.y, respectively, in February 2011 (Figure
Ⅰ.1).
Macroeconomic Developments 9
The Korean economy continued to show signs of strong growth in the first quarter of 2011 althoughgrowth in consumption and facilities investment have been sluggish to that of last year. World tradevolumes climbed by 12.4% y.o.y. in 2010, following the uptrend in the global economy. It will contin-ue to have a positive effect on exports and improve domestic demand, such as that for facilitiesinvestment. However, there are also risk factors both at the domestic and international level.Domestically, the household debt, which has reached its historical levels, will be one of the seriousrisk. Internationally, sovereign debt problems in the Eurozone and inflationary pressure due to sharprise of oil and raw materials continue to be a challenge for the Korean economy.
Ⅰ.Macroeconomic Developments 1
FigureⅠⅠ.1 Monthly Shipments Indices
Source: National Statistical Office (NSO).
FigureⅠⅠ.2 Industrial Production Index
Source: NSO.

Industrial production and service industry production
have maintained their upward trend. Industrial produc-
tion index, following a 11.7% upswing in the fourth
quarter of 2010, increased by 13.4% and 9.1% y.o.y. in
January and February, respectively (Figure Ⅰ.2). Ser-
vice industry activity index registered 3.2% and 0.2%
increase y.o.y. in the fourth quarter of 2010 and Febru-
ary respectively in 2011 (Figure Ⅰ.2).
Economic Growth
The underlying upward trend of the Korean economy
continues to expand, even in the presence of external
risk. In particular, exports have continuously gone up.
Consumption and facilities investment slightly con-
tracted temporarily in the first quarter of 2011.
The economic growth rate, following a 4.7% y.o.y. in
the fourth quarter of 2010, increased by 4.2% y.o.y. in
the first quarter of 2011. Facilities investment
increased 12.0% y.o.y. in the first quarter of 2011,
including machinery and transport equipment invest-
ments. However, construction investment declined by
11.9%.
Exports in the national accounts grew 16.8% y.o.y. in
the first quarter of 2011, with an upswing in exports of
such items as semi-conductors, automobiles and
machinery. Imports also expanded 10.8% y.o.y. in the
same period.
In March, the trade surplus totaled $3.1 billion, up from
$2.46 billion in February. Exports rose 30.3% y.o.y.,
reaching an all-time high of $48.6 billion. Exports for
the first quarter of 2011 also set a new record with
$131.8 billion. Meanwhile, imports gained 27.9% to
record $45.5 billion. Higher energy prices drove up
inbound shipments of raw materials, which posted a
31.7% increase.
Korean Economic and Financial Review [April 2011]10
TableⅠⅠ.1 Economic Growth Trends
(Unit: %, y.o.y.)
Source: BOK.
2010 2011
1Q 2Q 3Q 4Q Year 1Q
G D P 8.5 7.5 4.4 4.76.2
4.2(q.o.q) (2.1) (1.4) (0.6) (0.5) (1.4)
Consumption 5.9 3.4 3.4 3.0 3.9 2.7
Private 6.6 3.5 3.6 2.9 4.1 3.0
Government 3.4 2.9 2.5 3.2 3.0 1.6
Investment 12.5 6.8 6.8 3.4 7.0 △2.2
Construction 4.3 △2.3 △3.1 △2.9 △1.4 △11.9
Facilities 29.1 30.5 26.6 15.9 25.0 12.0
Exports 16.7 14.5 11.6 15.7 14.5 16.8
Imports 21.5 18.0 14.7 14.2 16.9 10.8
GNI 9.6 5.6 4.5 3.0 5.5 -
FigureⅠⅠ.3 Service Industry Activity Index
Source: NSO.
FigureⅠⅠ.4 Export (f.o.b.) Growth
Source: Bank of Korea (BOK).

1.1 Domestic Demand
Aggregate consumption growth increased to 2.7%
y.o.y in the first quarter of 2011 from 3.0% y.o.y. in the
previous quarter. Private consumption showed sus-
tained growth, rising 3.0% y.o.y., while government
consumption modestly increased, growing to 1.6%,
after rising 3.2% in the previous quarter. The contribu-
tion of aggregate consumption to economic growth
reached 1.9%p, down slightly from 2.0%p in the previ-
ous quarter (Table Ⅰ.2).
Fixed investment declined 2.2% y.o.y. in the first quar-
ter of 2011. Facilities investment has kept on a marked
increase, rising 12.0% from the same period of the pre-
vious year, even though construction investment has
continued to be subdued. Fixed investment’s contribu-
tion to the real GDP growth was △0.5%p in the first
quarter of 2011 (Table Ⅰ.2).
Private Consumption
Private consumption in the national accounts rose 3.0%
y.o.y. in the first quarter, as expenditures on durables
exhibited high upward trends, and those on non-
durables and semi-durables also shifted to an increase.
This reflected increasing household buying power and
positive consumer confidence (Table Ⅰ.1). The con-
sumption-related economic indicators, however,
slightly contracted due to temporary factors such as
Lunar New Year holidays.
The consumer goods sales index declined 0.8% y.o.y.,
from 10.6% in January, due to temporary factors such
as the holiday season in February. By sector, the con-
sumption of durable and quasi-durable goods showed
an increase of 9.0% and 2.3%, respectively, compared
to 14.0% and 11.1% in January, while that of non-
durable goods declined 6.9%, compared to 9.3% of the
previous month. (Figure Ⅰ.6).
The service sector also has managed positive growth.
The service industry activity index increased 4.6% and
Macroeconomic Developments 11
TableⅠⅠ.2 Contributions to Real GDP Growth
(Unit: %p)
Source: BOK.
2010 2011
1Q 2Q 3Q 4Q Year 1Q
G D P 8.5 7.5 4.4 4.76.2
4.2(q.o.q) (2.1) (1.4) (0.6) (0.5) (1.4)
Consumption 4.3 2.4 2.3 2.0 2.7 1.9
Private 3.8 1.9 1.9 1.5 2.2 1.6
Government 0.6 0.5 0.4 0.5 0.5 0.3
Investment 3.2 2.1 2.0 1.1 2.0 △0.5
Construction 0.7 △0.5 △0.6 △0.6 △0.3 △1.8
Facilities 2.4 2.7 2.5 1.6 2.3 1.2
Inventories 2.7 4.0 1.2 0.3 2.0 △0.2
Net Exports △1.8 △1.0 △1.0 1.3 △0.6 3.1
FigureⅠⅠ.5 Contributions to Real GDP Growth
Source: BOK.
FigureⅠⅠ.6 Monthly Index of ConsumerGoods Sales
Source: NSO.

0.2% y.o.y. in January and February 2011, respectively
(Table Ⅰ.3).
At the sector level, finance & insurance, transportation,
business activities, and health & social work sectors
contributed in particular to output growth, while the
real estate & leasing was sluggish, recording △20.2%
y.o.y. in February, due to the real estate downturn
(Table Ⅰ.3).
The Consumer Expectations Index, a measure of
prospects for six months ahead in comparison with the
current situation, fell by 19.0 points to record 75 from
March’s 94, dropping below the benchmark of 100.
The Consumer Evaluation Index, a measure of current
situation in comparison with six months earlier,
recorded 64 in March, down 18.0 points from Febru-
ary’s 82 (Figure Ⅰ.7).
Real gross national income (GNI) increased 5.5% over
the previous year but this growth was smaller than that
of the real gross domestic product due to the deteriora-
tion of the terms of trade. (Figure Ⅰ.8). Per capita GNI
grew by US$ 3,566 to US$ 20,759 from US$ 17,193 in
2009.
Fixed Investment
Fixed investment growth in the national accounts
decreased 2.2% y.o.y. in the first quarter of 2011
reflecting construction investment which declined
11.9% y.o.y., owing to to an increase in civil engineer-
ing which offset the shrinkage of investment for build-
ing construction (Table Ⅰ.1), after diminishing △2.9%
in the fourth quarter of 2010. Facilities investment
including machinery and transport equipment invest-
ments, however, increased 12.0%.
Estimated equipment investment growth (current
value) was 26.6% and 0.7% in January and February,
respectively, buoyed by the decrease in machinery
investment (26.6% and 0.7% y.o.y., respectively).
Korean Economic and Financial Review [April 2011]12
FigureⅠⅠ.7 Consumer Sentiment Indices
Source: NSO.
FigureⅠⅠ.8 GDP, GDI, and Private Consumption
Source: BOK.
TableⅠⅠ.3 Service Industry Activity Indexby Type
(Unit: %, y.o.y.)
Source: NSO.
2010 2011
Year 4Q Sep. Jan. Feb.
Service Industry Activity 3.9 3.2 2.5 4.6 0.2
Wholesale & Retail 5.7 4.7 4.2 8.2 △1.0
Hotels & Restaurants 1.2 1.7 0.0 △0.4 △0.3
Transportation 12.0 10.0 12.0 8.4 4.4
Telecommunications 1.9 3.6 5.3 8.1 1.5
Finance & Insurance 4.6 8.2 7.9 8.0 7.2
Real Estate & Leasing △8.6△24.28△25.3△19.2△20.2
Business Activities 7.5 0.6 8.9 8.7 4.3
Education 2.0 3.1 4.4 4.3 -1.8
Health & Social Work 8.8 4.6 2.5 6.3 3.6
Culture & Sporting △0.4 2.7 △4.4 1.7 0.0
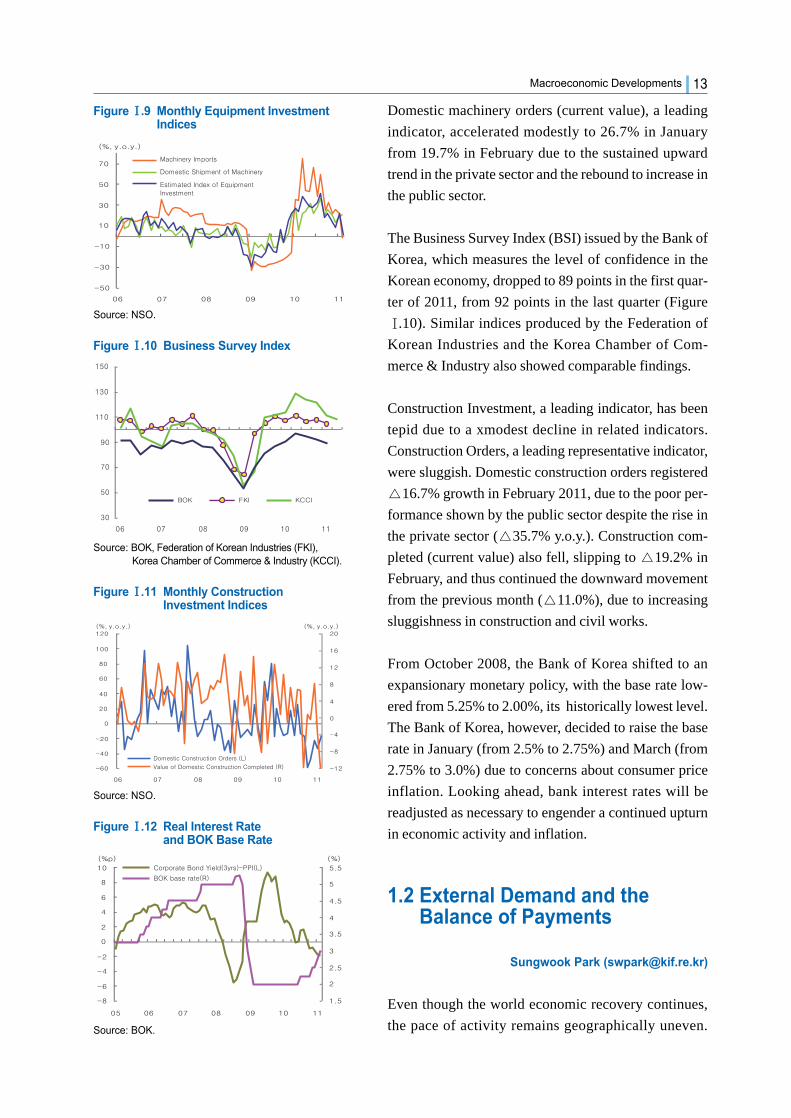
Domestic machinery orders (current value), a leading
indicator, accelerated modestly to 26.7% in January
from 19.7% in February due to the sustained upward
trend in the private sector and the rebound to increase in
the public sector.
The Business Survey Index (BSI) issued by the Bank of
Korea, which measures the level of confidence in the
Korean economy, dropped to 89 points in the first quar-
ter of 2011, from 92 points in the last quarter (Figure
Ⅰ.10). Similar indices produced by the Federation of
Korean Industries and the Korea Chamber of Com-
merce & Industry also showed comparable findings.
Construction Investment, a leading indicator, has been
tepid due to a xmodest decline in related indicators.
Construction Orders, a leading representative indicator,
were sluggish. Domestic construction orders registered
△16.7% growth in February 2011, due to the poor per-
formance shown by the public sector despite the rise in
the private sector (△35.7% y.o.y.). Construction com-
pleted (current value) also fell, slipping to △19.2% in
February, and thus continued the downward movement
from the previous month (△11.0%), due to increasing
sluggishness in construction and civil works.
From October 2008, the Bank of Korea shifted to an
expansionary monetary policy, with the base rate low-
ered from 5.25% to 2.00%, its historically lowest level.
The Bank of Korea, however, decided to raise the base
rate in January (from 2.5% to 2.75%) and March (from
2.75% to 3.0%) due to concerns about consumer price
inflation. Looking ahead, bank interest rates will be
readjusted as necessary to engender a continued upturn
in economic activity and inflation.
1.2 External Demand and theBalance of Payments
Sungwook Park ([email protected])
Even though the world economic recovery continues,
the pace of activity remains geographically uneven.
Macroeconomic Developments 13
FigureⅠⅠ.9 Monthly Equipment InvestmentIndices
Source: NSO.
FigureⅠⅠ.10 Business Survey Index
Source: BOK, Federation of Korean Industries (FKI),Korea Chamber of Commerce & Industry (KCCI).
FigureⅠⅠ.11 Monthly ConstructionInvestment Indices
Source: NSO.
FigureⅠⅠ.12 Real Interest Rateand BOK Base Rate
Source: BOK.

The US economy increased at an annual rate of 3.1%
q.o.q. in the fourth quarter of 2010, an increase from the
2.6% in the third quarter. Personal consumption expen-
ditures increased 4.0% q.o.q. in the fourth quarter of
2010, following an increase of 2.4% in the previous
quarter.
In contrast to private consumption, private fixed invest-
ment grew 6.8% q.o.q. in the fourth quarter, following
an increase of 1.5% q.o.q. in the previous quarter.
Exports of goods & services grew 8.6% q.o.q. from an
increase of 6.8% q.o.q. in the previous quarter. Imports
of goods & services decreased △12.6% q.o.q.. Mean-
while, the US unemployment rate recorded 8.8% in the
first quarter of 2011.
The Eurozone economy grew in the fourth quarter by
2.0% y.o.y. from 2.0% y.o.y. in the previous quarter,
boosted by strong performance in Germany and Swe-
den, which grew 4.0% and 7.2% y.o.y., respectively.
The main drag on the Eurozone was Greece, whose
GDP continued to contract by △6.6% y.o.y in the
fourth quarter of 2010. Eurozone private consumption
increased 1.1% y.o.y, and government spending rose by
0.6% y.o.y.. Exports and imports rose 11.6% y.o.y. and
10.7% y.o.y., respectively, in the fourth quarter. Mean-
while, eurozone unemployment has remained 10.0% in
the first quarter of 2011, slightly below the historical
high of 10.7% in January of 1997.
Japan’s GDP decreased at an annual pace of △1.3%
q.o.q., in the fourth quarter of 2010, driven by a
decrease in private consumption and exports. Private
consumption decreased △0.8% q.o.q. in the fourth
quarter from 0.9% q.o.q. in the third quarter. Private
residential investment rose 2.9% q.o.q., compared with
an increase of 1.8% q.o.q. in the previous quarter. Pub-
lic demand recorded △0.6% q.o.q. in fourth quarter
compared with △0.2% in the previous quarter. Exports
of goods & services decreased △0.8% q.o.q. in the
fourth quarter, down from the 1.5% in the previous
quarter. Meanwhile, Japan’s employment situation still
remains severe, although movements of an incipient
recovery could be seen shortly. The unemployment rate
Korean Economic and Financial Review [April 2011]14
TableⅠⅠ.4 Major Countries’ Economic Growth(Unit: %, q.o.q.)
Note: Annual rates from previous period.1) Bloomberg, y.o.y.2) ECB, Data refer to the Euro 17, y.o.y.
Source: Bureau of Economic Analysis, EurostatCabinet Office, Government of Japan
2009 20102010
1/4 2/4 3/4 4/4
US △2.6 2.8 3.7 1.7 2.6 3.1
Japan △6.3 3.9 6.1 2.1 3.3 △1.3
China1) 9.2 10.3 11.9 10.3 9.6 9.8
EU2) △4.1 1.8 0.8 2.0 2.0 2.0
Germany △4.9 3.6 2.1 3.9 3.9 4.0
France △2.5 1.6 1.2 1.6 1.7 1.5
Sweden △5.3 5.5 2.6 4.4 6.8 7.2
Greece △2.3 4.5 △0.7 △5.0 △5.1 △6.6
TableⅠⅠ.5 Major Countries’ UnemploymentRates (Unit: %)
Source: Bloomberg.
20092010 2011
1/4 2/4 3/4 4/4 1/4
US 9.3 9.7 9.6 9.6 9.6 1.4
Japan 5.1 4.9 5.2 5.1 5.0 4.8
Eurozone1) 9.5 10.0 10.0 10.0 10.0 10.0
TableⅠⅠ.6 Balance of Payments(Unit: 100 mil. USD)
Source: BOK.
2009 20102010 2011
2/4 3/4 4/4 1/4
Current Account 327.9 282.1 88.58 99.31 91.61 27.2
Goods 378.7 419.0 122.4 125.4 123.4 59.5Exports(f.o.b.) 3,581.9 4,642.9 1,175.9 1,182.6 1,270.9 1,277.0
Imports(f.o.b.) 3,203.2 4,223.8 1,053.5 1,057.2 1,147.5 1,217.5
Services △66.4 △112.3 △18.7 △29.6 △22.0 △25.4
Training 52.4 92.5 20.5 24.6 31.9 25.1
Travel △52.2 △79.0 △13.6 △27.0 △18.5 △22.4
Income 22.8 7.7 △10.1 13.0 △0.7 3.9
Current Transfers △7.1 △32.3 △5.0 △9.5 △9.1 △10.8
Exports (f.o.b.) 3,653.3 4,663.8 1,202.4 1,163.2 1,287.5 1,313.0
(%, y.o.y.) (△13.9) (28.3) (33.1) (22.7) (23.8) (29.9)
Imports (c.i.f.) 3,230.8 4,252.1 1,056.3 1,057.0 1,157.3 1,232.9
(%, y.o.y.) (△25.8) (△31.6) (42.8) (24.6) (24.6) (25.6)
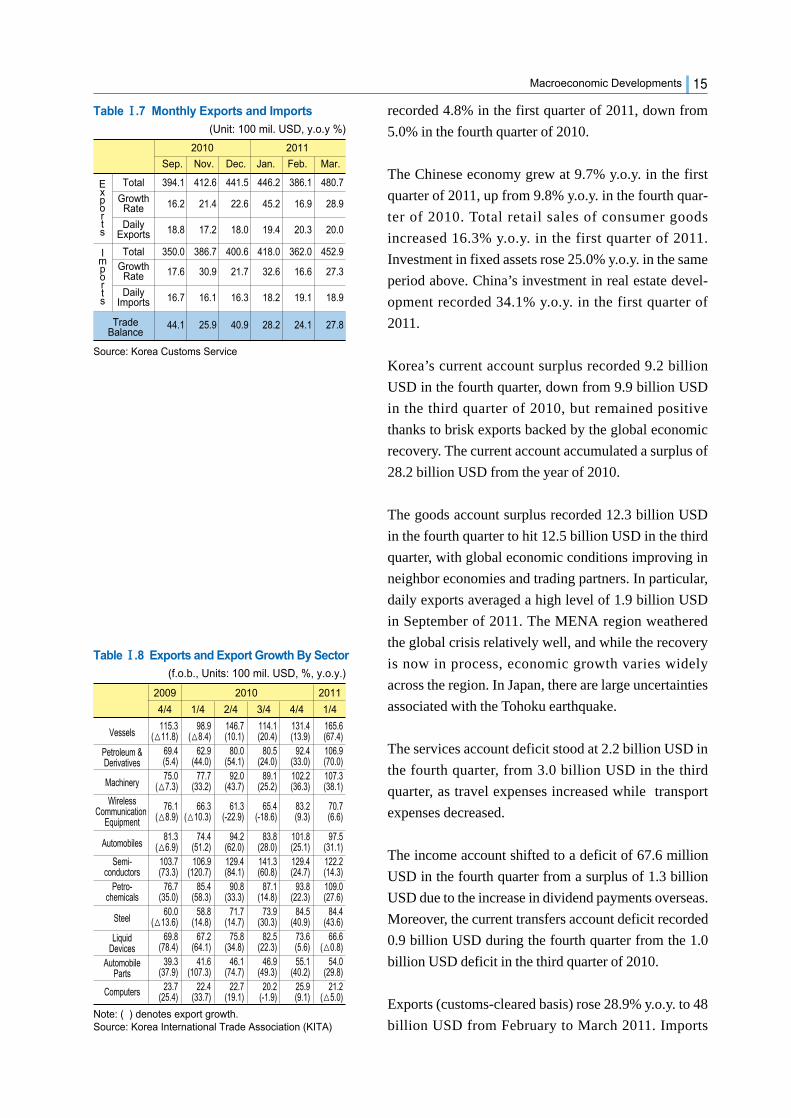
recorded 4.8% in the first quarter of 2011, down from
5.0% in the fourth quarter of 2010.
The Chinese economy grew at 9.7% y.o.y. in the first
quarter of 2011, up from 9.8% y.o.y. in the fourth quar-
ter of 2010. Total retail sales of consumer goods
increased 16.3% y.o.y. in the first quarter of 2011.
Investment in fixed assets rose 25.0% y.o.y. in the same
period above. China’s investment in real estate devel-
opment recorded 34.1% y.o.y. in the first quarter of
2011.
Korea’s current account surplus recorded 9.2 billion
USD in the fourth quarter, down from 9.9 billion USD
in the third quarter of 2010, but remained positive
thanks to brisk exports backed by the global economic
recovery. The current account accumulated a surplus of
28.2 billion USD from the year of 2010.
The goods account surplus recorded 12.3 billion USD
in the fourth quarter to hit 12.5 billion USD in the third
quarter, with global economic conditions improving in
neighbor economies and trading partners. In particular,
daily exports averaged a high level of 1.9 billion USD
in September of 2011. The MENA region weathered
the global crisis relatively well, and while the recovery
is now in process, economic growth varies widely
across the region. In Japan, there are large uncertainties
associated with the Tohoku earthquake.
The services account deficit stood at 2.2 billion USD in
the fourth quarter, from 3.0 billion USD in the third
quarter, as travel expenses increased while transport
expenses decreased.
The income account shifted to a deficit of 67.6 million
USD in the fourth quarter from a surplus of 1.3 billion
USD due to the increase in dividend payments overseas.
Moreover, the current transfers account deficit recorded
0.9 billion USD during the fourth quarter from the 1.0
billion USD deficit in the third quarter of 2010.
Exports (customs-cleared basis) rose 28.9% y.o.y. to 48
billion USD from February to March 2011. Imports
Macroeconomic Developments 15
TableⅠⅠ.8 Exports and Export Growth By Sector(f.o.b., Units: 100 mil. USD, %, y.o.y.)
Note: ( ) denotes export growth.Source: Korea International Trade Association (KITA)
2009 2010 2011
4/4 1/4 2/4 3/4 4/4 1/4
Vessels115.3 98.9 146.7 114.1 131.4 165.6
(△11.8) (△8.4) (10.1) (20.4) (13.9) (67.4)
Petroleum & 69.4 62.9 80.0 80.5 92.4 106.9Derivatives (5.4) (44.0) (54.1) (24.0) (33.0) (70.0)
Machinery75.0 77.7 92.0 89.1 102.2 107.3
(△7.3) (33.2) (43.7) (25.2) (36.3) (38.1)Wireless 76.1 66.3 61.3 65.4 83.2 70.7Communication (△8.9) (△10.3) (-22.9) (-18.6) (9.3) (6.6)Equipment
Automobiles81.3 74.4 94.2 83.8 101.8 97.5
(△6.9) (51.2) (62.0) (28.0) (25.1) (31.1)Semi- 103.7 106.9 129.4 141.3 129.4 122.2
conductors (73.3) (120.7) (84.1) (60.8) (24.7) (14.3)Petro- 76.7 85.4 90.8 87.1 93.8 109.0
chemicals (35.0) (58.3) (33.3) (14.8) (22.3) (27.6)
Steel60.0 58.8 71.7 73.9 84.5 84.4
(△13.6) (14.8) (14.7) (30.3) (40.9) (43.6)
Liquid 69.8 67.2 75.8 82.5 73.6 66.6Devices (78.4) (64.1) (34.8) (22.3) (5.6) (△0.8)
Automobile 39.3 41.6 46.1 46.9 55.1 54.0Parts (37.9) (107.3) (74.7) (49.3) (40.2) (29.8)
Computers 23.7 22.4 22.7 20.2 25.9 21.2(25.4) (33.7) (19.1) (-1.9) (9.1) (△5.0)
TableⅠⅠ.7 Monthly Exports and Imports(Unit: 100 mil. USD, y.o.y %)
Source: Korea Customs Service
2010 2011
Sep. Nov. Dec. Jan. Feb. Mar.
Total 394.1 412.6 441.5 446.2 386.1 480.7
Growth 16.2 21.4 22.6 45.2 16.9 28.9Rate
Daily 18.8 17.2 18.0 19.4 20.3 20.0Exports
Total 350.0 386.7 400.6 418.0 362.0 452.9Growth 17.6 30.9 21.7 32.6 16.6 27.3Rate
Daily 16.7 16.1 16.3 18.2 19.1 18.9Imports
Trade 44.1 25.9 40.9 28.2 24.1 27.8Balance
Exports
Imports
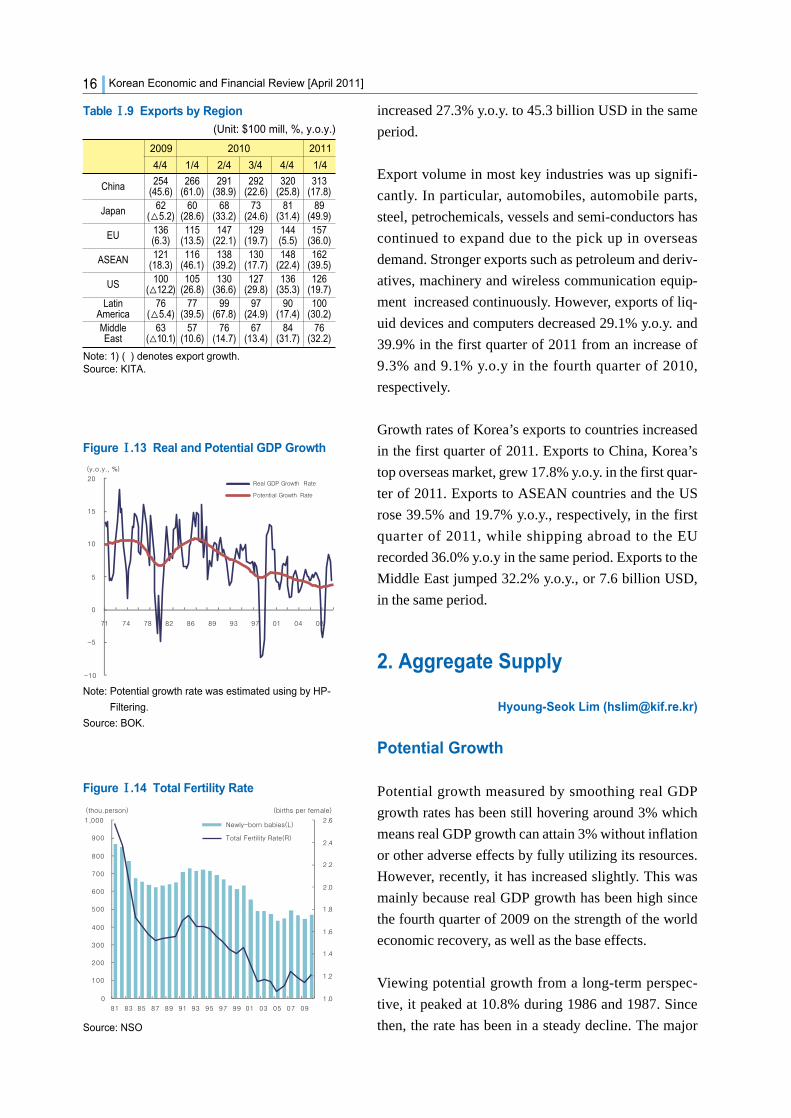
increased 27.3% y.o.y. to 45.3 billion USD in the same
period.
Export volume in most key industries was up signifi-
cantly. In particular, automobiles, automobile parts,
steel, petrochemicals, vessels and semi-conductors has
continued to expand due to the pick up in overseas
demand. Stronger exports such as petroleum and deriv-
atives, machinery and wireless communication equip-
ment increased continuously. However, exports of liq-
uid devices and computers decreased 29.1% y.o.y. and
39.9% in the first quarter of 2011 from an increase of
9.3% and 9.1% y.o.y in the fourth quarter of 2010,
respectively.
Growth rates of Korea’s exports to countries increased
in the first quarter of 2011. Exports to China, Korea’s
top overseas market, grew 17.8% y.o.y. in the first quar-
ter of 2011. Exports to ASEAN countries and the US
rose 39.5% and 19.7% y.o.y., respectively, in the first
quarter of 2011, while shipping abroad to the EU
recorded 36.0% y.o.y in the same period. Exports to the
Middle East jumped 32.2% y.o.y., or 7.6 billion USD,
in the same period.
2. Aggregate Supply
Hyoung-Seok Lim ([email protected])
Potential Growth
Potential growth measured by smoothing real GDP
growth rates has been still hovering around 3% which
means real GDP growth can attain 3% without inflation
or other adverse effects by fully utilizing its resources.
However, recently, it has increased slightly. This was
mainly because real GDP growth has been high since
the fourth quarter of 2009 on the strength of the world
economic recovery, as well as the base effects.
Viewing potential growth from a long-term perspec-
tive, it peaked at 10.8% during 1986 and 1987. Since
then, the rate has been in a steady decline. The major
Korean Economic and Financial Review [April 2011]16
FigureⅠⅠ.13 Real and Potential GDP Growth
Note: Potential growth rate was estimated using by HP-
Filtering.
Source: BOK.
TableⅠⅠ.9 Exports by Region(Unit: $100 mill, %, y.o.y.)
Note: 1) ( ) denotes export growth.Source: KITA.
2009 2010 2011
4/4 1/4 2/4 3/4 4/4 1/4
China 254 266 291 292 320 313(45.6) (61.0) (38.9) (22.6) (25.8) (17.8)
Japan 62 60 68 73 81 89(△5.2) (28.6) (33.2) (24.6) (31.4) (49.9)
EU 136 115 147 129 144 157(6.3) (13.5) (22.1) (19.7) (5.5) (36.0)
ASEAN 121 116 138 130 148 162(18.3) (46.1) (39.2) (17.7) (22.4) (39.5)
US 100 105 130 127 136 126(△12.2) (26.8) (36.6) (29.8) (35.3) (19.7)
Latin 76 77 99 97 90 100America (△5.4) (39.5) (67.8) (24.9) (17.4) (30.2)Middle 63 57 76 67 84 76East (△10.1) (10.6) (14.7) (13.4) (31.7) (32.2)
FigureⅠⅠ.14 Total Fertility Rate
Source: NSO

factor behind the downward trend is population
changes like the low birthrate and rapid aging. Births
per female in 2000 and 2010 was 1.21 on average, com-
pared to 1.62 in 1987 and 1996. Meanwhile, the birth
rate increased in recent years after falling to 1.076 in
2005, but the number of newly-born babies remained
unchanged. These factors might lead to a long-run
slowdown in input growth. Further, the global financial
crisis also harmed potential growth.
Total Factor Productivity
Growth accounting analysis using the Cobb-Douglas
production function with human capital shows that
Total
Factor Productivity (TFP) has made up 1.01%p of the
4.58% real GDP growth for the period from 2000 to
2010. It accounts for effects in total output not
explained by the amount of inputs used in production.
During the period from 2000 to 2010, TFP’s portion of
real GDP growth was 22.2% (TFP/GDP growth), lower
than the 23.2% for the 10 years from 1987 to 1996
(Table Ⅰ.10).
Meanwhile, in 2010, TFP’s contribution turned to posi-
tive after two consecutive years of negative figures, as
real GDP increased 6.2% in 2010. During 2008 and
2009, the contribution of TFP growth was negative.
Especially, in 2009, it was △1.0%p of the 0.2% real
GDP growth (based on 2005 prices) after comprising
△0.3%p of the 2.3% real GDP growth in 2008. It was
because employment in 2009 decreased 0.3% and gross
capital formation decreased 15.0%, due to the global
financial crisis (Figure Ⅰ.15). Decreasing TFP during
the global financial crisis indicates that the economy
has been less efficient.
R&D intensity (R&D expenditures as a percentage of
GDP) which is considered to be one of the most impor-
tant determinants of TFP growth has been increasing
steadily (Figure Ⅰ.16). This shows that TFP growth
will remain robust as long as R&D is conducted effi-
Macroeconomic Developments 17
TableⅠⅠ.10 Contributions of TFP and FactorInputs to Average GDP Growth
(Unit: %, %p)
GDP Physical HumanGrowth TFP Capital Capital Labor
’87~’96 8.67 2.01 3.62 0.94 2.11(A)
’00~’10 4.58 1.01 1.98 0.55 1.04(B)
(B)-(A) △4.09 △1.00 △1.64 △0.39 △1.07
FigureⅠⅠ.16 R&D as of GDP
FigureⅠⅠ.15 Recent Trends in TFP and FactorInputs to Average GDP Growth
Source: National Science & Technology Commission
(NTIS)
Source: BOK, NSO, KIF.
Source: BOK, NSO, KIF.

ciently and effectively.
Labor Input and Human Capital
From 2000 to 2010, the annual contribution of labor to
economic growth averaged 1.04%p, down from
2.11%p between 1987 and 1996 (Table Ⅰ.10). This
slowdown can largely be attributed to the slower
growth of the labor force, or economically active popu-
lation, over the past decade (Figure Ⅰ.17). During this
period, the average population growth of those aged
15-64 dipped to 0.58% from 1.67% between 1987 and
1996 (Figure Ⅰ.17). Also, labor’s portion of real GDP
growth (labor/GDP growth) over the past decade fell to
22.6% from 24.3% for the prior 10 year period.
This indicates that the Korean economy has become
less labor-intensive. As the population growth rates
decreases, the slowdown in labor is expected to con-
tinue for many years to come (Figure Ⅰ.17).
The annual contribution of human capital or quality of
labor to economic growth averaged 0.55%p from 2000
to 2010, lower than 0.39%p for the 10 years from 1987
to 1996 (Table Ⅰ.10). However, the quality of labor,
measured in terms of average years of schooling, has
improved over time, albeit at a diminishing rate (Figure
Ⅰ.18).
The recent economic slowdown, which was brought on
by the global financial crisis, led to not only an increase
in the average years of schooling to 11.5 years from 9.7
years from 1987 to 1996 (Figure Ⅰ.18) but also a
decrease in youth employment (ages 15-29).
Youth employment growth continued to decrease,
while employment of those aged 30~59 has been on the
rise and employment of those aged 60 and over has
continued to increase.
These structural unemployment issues therefore remain
a lurking threat to the Korean economy’s potential
growth (Figure Ⅰ.19).
Korean Economic and Financial Review [April 2011]18
FigureⅠⅠ.19 Employment Changes by Age
Source: NSO.
FigureⅠⅠ.18 Labor Force Growth andAverage Years of Schooling
Source: NSO, KIF
FigureⅠⅠ.17 Population Growth Rates(Projections)
Source: NSO.

Physical Capital
Slow physical capital growth is the primary factor
behind the long-run slowdown in potential economic
growth. In recent years, its slowdown has been much
more pronounced than that of either labor inputs or
human capital (Figure Ⅰ.15).
The average annual contribution of physical capital to
economic growth from 2000 to 2010 was 1.98%p,
1.64%p off the 3.62%p attained in the 1987 to 1996
period (Table Ⅰ.10). Meanwhile, in 2010, equipment
investment growth was 25.0%, which may increase
future capital accumulation, with the economic recov-
ery and the base effects of 2009.
In fact, from a long-run perspective, a slowdown in the
rate of capital accumulation usually occurs in a devel-
oping country that is coming off several decades of
rapid growth. In Korea’s case, the capital-output ratio
has been rising steadily, implying that many previous
investment opportunities have been drying up (Figure
Ⅰ.20).
B. Inflation
Kyoobok Lee ([email protected])
1. Oil and Import Prices
Crude oil Prices
Crude oil prices (including WTI, Brent and Dubai)
increased steeply during the first quarter of 2011, as the
geopolitical problems in the Middle East and North
Africa, including the continued insurgency in Libya
triggered from Tunisia and Egypt, continued. Egypt
plays an important role in international energy markets
through the operation of the Suez Canal and the
SUMED pipeline which is a global thoroughfare for oil
traffic, linking Europe to the Middle East and Asia.
Macroeconomic Developments 19
FigureⅠⅠ.20 Capital-Output Ratio
Source: BOK.
FigureⅠⅠ.21 Oil Prices
Source: Bloomberg.
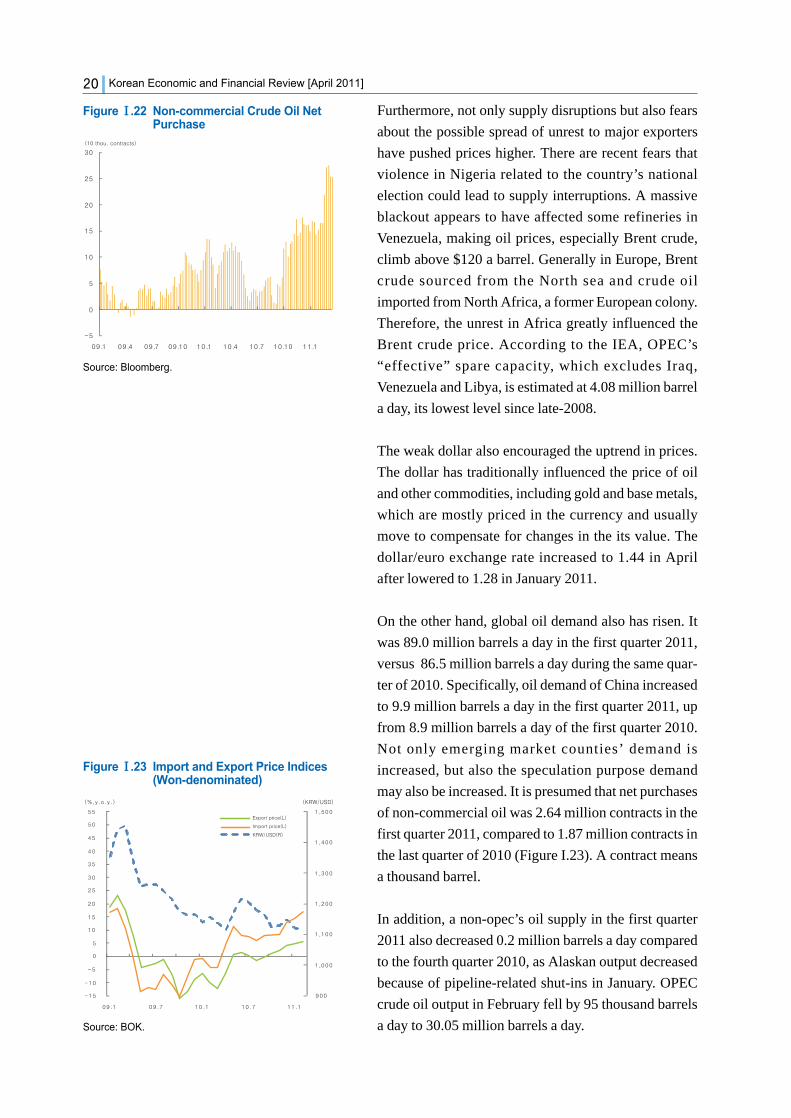
Furthermore, not only supply disruptions but also fears
about the possible spread of unrest to major exporters
have pushed prices higher. There are recent fears that
violence in Nigeria related to the country’s national
election could lead to supply interruptions. A massive
blackout appears to have affected some refineries in
Venezuela, making oil prices, especially Brent crude,
climb above $120 a barrel. Generally in Europe, Brent
crude sourced from the North sea and crude oil
imported from North Africa, a former European colony.
Therefore, the unrest in Africa greatly influenced the
Brent crude price. According to the IEA, OPEC’s
“effective” spare capacity, which excludes Iraq,
Venezuela and Libya, is estimated at 4.08 million barrel
a day, its lowest level since late-2008.
The weak dollar also encouraged the uptrend in prices.
The dollar has traditionally influenced the price of oil
and other commodities, including gold and base metals,
which are mostly priced in the currency and usually
move to compensate for changes in the its value. The
dollar/euro exchange rate increased to 1.44 in April
after lowered to 1.28 in January 2011.
On the other hand, global oil demand also has risen. It
was 89.0 million barrels a day in the first quarter 2011,
versus 86.5 million barrels a day during the same quar-
ter of 2010. Specifically, oil demand of China increased
to 9.9 million barrels a day in the first quarter 2011, up
from 8.9 million barrels a day of the first quarter 2010.
Not only emerging market counties’ demand is
increased, but also the speculation purpose demand
may also be increased. It is presumed that net purchases
of non-commercial oil was 2.64 million contracts in the
first quarter 2011, compared to 1.87 million contracts in
the last quarter of 2010 (Figure I.23). A contract means
a thousand barrel.
In addition, a non-opec’s oil supply in the first quarter
2011 also decreased 0.2 million barrels a day compared
to the fourth quarter 2010, as Alaskan output decreased
because of pipeline-related shut-ins in January. OPEC
crude oil output in February fell by 95 thousand barrels
a day to 30.05 million barrels a day.
Korean Economic and Financial Review [April 2011]20
FigureⅠⅠ.23 Import and Export Price Indices(Won-denominated)
Source: BOK.
FigureⅠⅠ.22 Non-commercial Crude Oil NetPurchase
Source: Bloomberg.

As a result, oil prices increased above $100 in the first
quarter 2011 from $80 of the fourth quarter 2010. And
recently it moved between $105 and $115 a barrel.
Import Prices
Won-denominated import prices increased 15.5% y.o.y.
in January and February of 2011, higher than the 9.7%
y.o.y. in the fourth quarter 2010. The prices in raw
materials, including crude oil, rose 28.4% y.o.y., lead
the import price growth. Also agricultural products’
prices increased 37.0% y.o.y., forest products’ prices
increased 44.4% y.o.y. and mineral fuels’ prices
increased 23.3% y.o.y.. However, capital goods prices
which has decreased since October 2009 decreased
0.7% during the first tow months in 2011.
Meanwhile, dollar-denominated import prices rose
18.5% y.o.y. in January and February of 2011, lower
than the figure of won-denominated import prices. Raw
materials and intermediate materials denominated in
dollar rose 31.7%, 13.9% y.o.y. respectively. Also those
of capital and consumer goods increased 1.9% and
5.0% y.o.y., respectively, during the same period.
These gaps between won-denominated import prices
and dollar-denominated import prices were attributable
to the fact that the y.o.y. change in the won/dollar
exchange rate decreased 2.5%, or averaged 1,119 in the
first two months of 2011, compared to 1,148 over the
same period in 2010.
Similarly, while export prices denominated in dollars
rose 8.0% in the fourth quarter, those denominated in
won increased 5.3% y.o.y.
2. Domestic Inflation
In the first quarter 2011, consumer and producer price
growth continued to increase, mainly led by farm prod-
ucts and industrial products. The PPI increased more
sharply than the CPI. Therefore, it is expected that the
CPI will rise more steeply because producer prices typ-
ically have a lagged effect on consumer prices.
Macroeconomic Developments 21
FigureⅠⅠ.25 CPI, PPI, and Core Inflation
Source: NSO.
FigureⅠⅠ.24 Won-denominated ImportedPrices
Source: BOK.

Producer Prices
In the first quarter 2011, producer prices climbed 6.7%
y.o.y., 1.7%p higher than the last quarter 2010. The
prices growth of agricultural, forest & marine products
fell to 21.0% y.o.y. in the first quarter from 23.7% of the
previous quarter, but still high. Also, the prices of indus-
trial products rose by 7.9% y.o.y. in the first quarter
2011, compared to 5.3% in the fourth quarter of 2010.
Service prices rose just 1.9% y.o.y.. Even though the
prices in professional, scientific & technical services
(which include architectural design, engineering, and
fees for CPAs and tax accountants) increased 3.6% and
the ones in financial services, including brokerage fees
and premiums, rose 5.3%, telecommunication service
prices decreased for five consecutive quarters and the
price of leasing & renting and advertising decreased
0.1%, 0.6% y.o.y., respectively, in the first quarter 2011.
Especially, in March, PPI growth was up 7.3%, which
is the fastest pace since November 2008.
This is because the costs for fresh vegetables and indus-
trial goods jumped. Prices for agricultural, forest and
marine products jumped 16.2% y.o.y. in March, with
live stock prices up 19.9% y.o.y. in the month. How-
ever, the price growth of vegetable was lowered to
5.3% in March as the cold weather has eased. Industrial
products’ prices, including products ranging from tex-
tiles to oil, plastics and computers, climbed 9.1% y.o.y.,
the highest since November 2008.
Consumer Prices
The Consumer Price Index (CPI) rose 4.5% y.o.y. in the
first quarter 2011, which exceed the BOK’s target range
(between 2.0% and 4.0%). The CPI for living necessi-
ties increased 4.9% in the first quarter, reflecting higher
prices for groceries.
Specifically, in the first quarter, consumer prices in the
agriculture, forestry and fishing sector increased 16.6%
and those in industrial products increased 5.0% higher
Korean Economic and Financial Review [April 2011]22
FigureⅠⅠ.26 Contributions to Consumer PriceInflation
Source: NSO, KIF
TableⅠⅠ.11 CPI and PPI
(Unit: %, y.o.y.)
Source: BOK.
2010 2011
3Q 4Q 1Q Jan. Feb. Mar.
CPI 2.9 3.6 4.5 4.1 4.5 4.7
Agriculture and 12.5 19.2 16.6 17.5 17.7 14.9Fishing
Industrial 2.5 2.8 5.0 4.3 5.0 5.9
Service 2.6 3.8 2.4 2.2 2.5 2.5
PPI 3.6 5.0 6.7 6.2 6.6 7.3
Agriculture, Forestry, 11.7 23.7 21.0 26.6 20.8 16.2and Fishing
Industrial 3.9 5.3 7.9 6.8 7.8 9.1
Services 1.3 1.8 1.9 1.8 1.9 2.1
than 2.8% of the fourth quarter 2010.
Especially, in March, consumer prices rose 4.7% the
highest level since October 2008. Notably, while con-
sumer prices growth in the agriculture, forestry and
fishing sector has decreased, industrial products prices
has increased since December 2010, mainly due to the
increase in oil prices.
Core CPI growth, which excludes oil and food costs,
also rose to 2.9% in the first quarter 2011, 1.0%p higher
than the previous quarter’s.
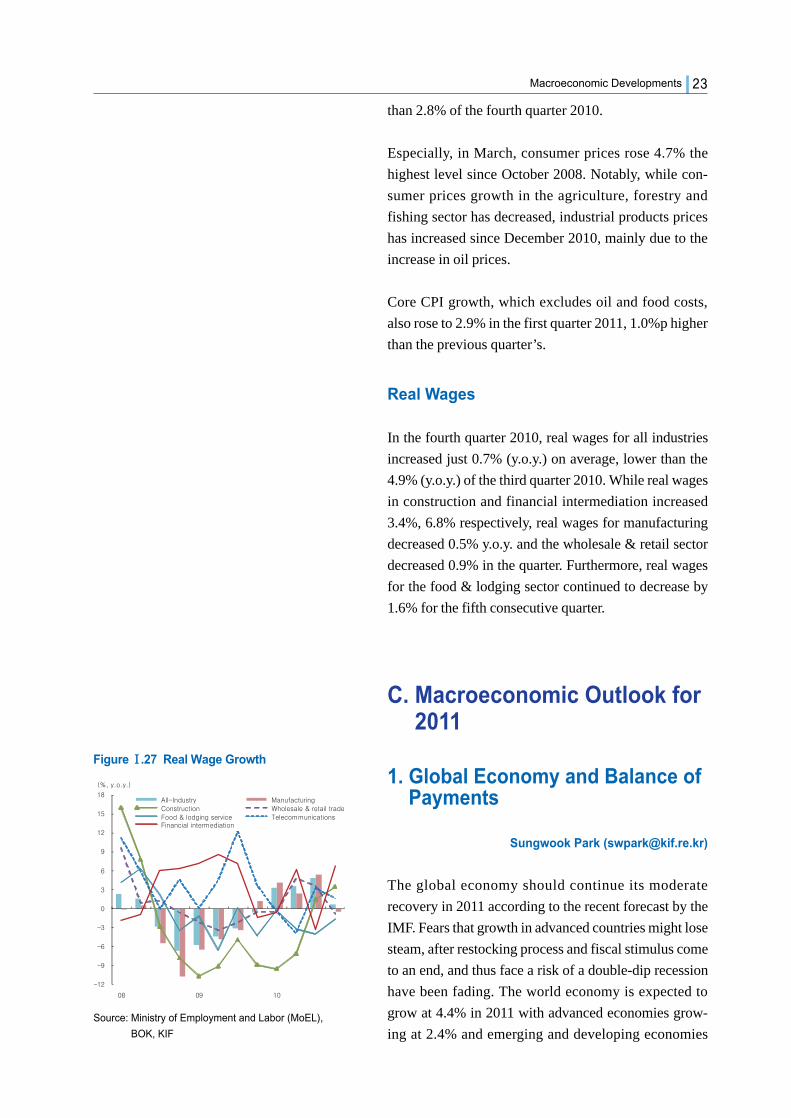
Real Wages
In the fourth quarter 2010, real wages for all industries
increased just 0.7% (y.o.y.) on average, lower than the
4.9% (y.o.y.) of the third quarter 2010. While real wages
in construction and financial intermediation increased
3.4%, 6.8% respectively, real wages for manufacturing
decreased 0.5% y.o.y. and the wholesale & retail sector
decreased 0.9% in the quarter. Furthermore, real wages
for the food & lodging sector continued to decrease by
1.6% for the fifth consecutive quarter.
C. Macroeconomic Outlook for2011
1. Global Economy and Balance ofPayments
Sungwook Park ([email protected])
The global economy should continue its moderate
recovery in 2011 according to the recent forecast by the
IMF. Fears that growth in advanced countries might lose
steam, after restocking process and fiscal stimulus come
to an end, and thus face a risk of a double-dip recession
have been fading. The world economy is expected to
grow at 4.4% in 2011 with advanced economies grow-
ing at 2.4% and emerging and developing economies
Macroeconomic Developments 23
FigureⅠⅠ.27 Real Wage Growth
Source: Ministry of Employment and Labor (MoEL),
BOK, KIF

growing at 6.5%, which implies that the recovery
remains uneven throughout the world. In the mean time,
prices for crude oil has been rising sharply mainly due to
the political unrest in the Middle East and North Africa
and high demand boosted by economic recovery. Soar-
ing oil prices and inflation in emerging economies pose
new risks to a stable recovery of the world economy.
The US economy is expected to recover at the growth
rate of 2.8% in 2011 with easing financial conditions
supporting private demand and external demand. The
US government helped boost the economic growth
with the Federal Reserves’s second round of quantita-
tive easing (QE2) and fiscal package approved in
December 2010. Healthy corporate balance sheet and
pent-up demand for durables may surprise on the
upside in the future. On the other hand, while labor
market seems to improve, unemployment rate of 8.8%
in March is still too high and the decline in the housing
market does not seem likely to stop soon.
The IMF forecasts 9.6% growth for the Chinese econ-
omy in 2011, following the 10.3% growth in the previ-
ous year. The drivers of growth seem to shift increas-
ingly from public to private demand. Inflation has
become one of the major policy concerns as CPI infla-
tion is about to move up above 5% y.o.y even after a
series of increases in the required reserve ratios and
hikes in the interest rates. Nevertheless, fears of a sharp
decline in the growth of the Chinese economy due to
overdone tightening seem to have subduing.
The Japanese economic growth is expected to slow to
1.4% in 2011 from 3.9% in 2010. As for the future fore-
cast, there are many uncertainties associated with the
recent Japanese earthquake which occurred in March. In
addition to the direct damage of capital stock after the
earthquake, possible power shortages and ongoing risks
associated with the crises at the nuclear power plant
pose further downside risks to the economic growth.
The Eurozone economy is forecast to grow modestly
and unevenly at a pace of 1.6% in 2011. The core
economies such as Germany, France and Italy should
Korean Economic and Financial Review [April 2011]24
TableⅠⅠ.13 Economic Outlook for EmergingCountries
Source: IMF WEO (April 2011).
(Unit: %)
Countries 2010Projections
2011 2012
Emerging and7.3 6.5 6.5Developing Economies
Commonwealth ofIndependent States 4.6 5.0 4.7
Developing Asia 9.5 8.4 8.4
Latin America and the 6.1 4.7 4.2Caribbean
Middle East and North Africa
3.8 4.1 4.2
Sub-Saharan Africa 5.0 5.5 5.9
Central and 4.2 3.7 4.0Eastern Europe
TableⅠⅠ.12 Economic Outlook for MajorTrade Partners
Source: International Monetary Fund World EconomicOutlook (IMF WEO) (April 2011).
(Unit: annualized GDP q.o.q.%)
2010Projections
2011 2012
World 5.0 4.4 4.5
Advanced 3.0 2.4 2.6countries
US 2.8 2.8 2.9
China 10.3 9.6 9.5
Japan 3.9 1.4 2.1
Euro Area 1.7 1.6 1.8

grow only gradually at the rate of 2.5%, 1.6%, and
1.1% respectively in 2011 due mainly to the fiscal con-
solidation and the slowdown in external demand
growth. The growth in the periphery of the euro area is
projected to be much lower because of a sharp contrac-
tion in public and private balance sheets and severe
structural unemployment problems.
In emerging markets, economic growth is expected to
remain high in 2011, boosted by accommodative
macroeconomic policies, rising global demand for
commodity prices and strong domestic demand. In the
meanwhile, inflation pressure should broaden. In par-
ticular, developing Asian economies are expected to
continue to expand rapidly and post 8.4% growth, fol-
lowed by economies in the Sub-Saharan Africa and the
Latin America which should grow 5.5% and 4.7%,
respectively, in 2011.
In Korea, the balance of payments is expected to regis-
ter a current account surplus of 12.0 billion USD in
2011, smaller than the 28.2 billion USD figure from the
previous year. The anticipated reduction stems from
expectations of a faster recovery of imports and travel
abroad than that of exports in 2011. Export and import
growth are expected to increase 15.6% and 21.4%,
respectively, for the year.
2. Economic Growth
Myong-Hwal Lee ([email protected])
The Korean economy has maintained its upward trend.
On the production side, manufacturing and services
increased by 9.9% and 2.8% y.o.y. respectively in the
first quarter of 2011. On the expenditure side, facilities
investment and exports have grown consistently, while
construction investment has decreased since the second
half of last year. The employment conditions continued
to improve, as the number of employed persons went
up by 442 thousand persons y.o.y. and the unemploy-
ment rate marked 4.2% in the first quarter of 2011.
Macroeconomic Developments 25
TableⅠⅠ.14 Balance of Payments Forecast
Notes: 1) Figures in parentheses represent percent changes from the previous year.
2) Period average.Source: BOK and KIF.
(Unit: 100 mil. USD)
20102011
1st half 2nd half Year
Current Account 282 49 71 120
Goods 419 144 139 285
Service·Income·△137 △97 △68 △165
Current Transfers
Exports (f.o.b.) 4,664 2,646 2,746 5,392(Growth, %)1) (28.3) (19.6) (12.0) (15.6)
Imports (c.i.f.) 4,252 2,527 2,636 5,163(Growth, %)1) (31.6) (24.0) (19.1) (21.4)
Won/Dollar 1,156 1,100 1,050 1,075Exchange Rate2)

The Cyclical Indicator of Coincident Composite Index
(CCI), a barometer of current economic conditions,
registered at 100.6 in February 2011. The 12-month
Smoothed Change in Composite Leading Index, which
predicts the turning points in business cycles, fell by
0.6%p from the previous month, registering 2.4% in
February(Figure Ⅰ.23). These imply concerns over the
uncertainties in domestic and overseas economic con-
ditions.
The global economy has improved faster than expected
from the global financial turmoil. The major advanced
economies have kept up their paces of recovery and the
emerging market economies have also continued to
show strong performances. World trade volumes
climbed by 12.4% y.o.y. in 2010, following the uptrend
in the global economy. It will continue to have a posi-
tive effect on exports and improve domestic demand,
such as that for facilities investment.
However, there are also risk factors in domestic and
overseas economies. The Eurozone’s sovereign debt
problems, such as those of Portugal and Spain, may act
as a downside risk factor for the global economy. In
addition, international oil prices, which have skyrock-
eted due to the political uncertainty in the Middle East
and North Africa, will stay on a high level. Emerging
countries as well as some advanced economies are also
increasingly concerned about inflationary pressure as
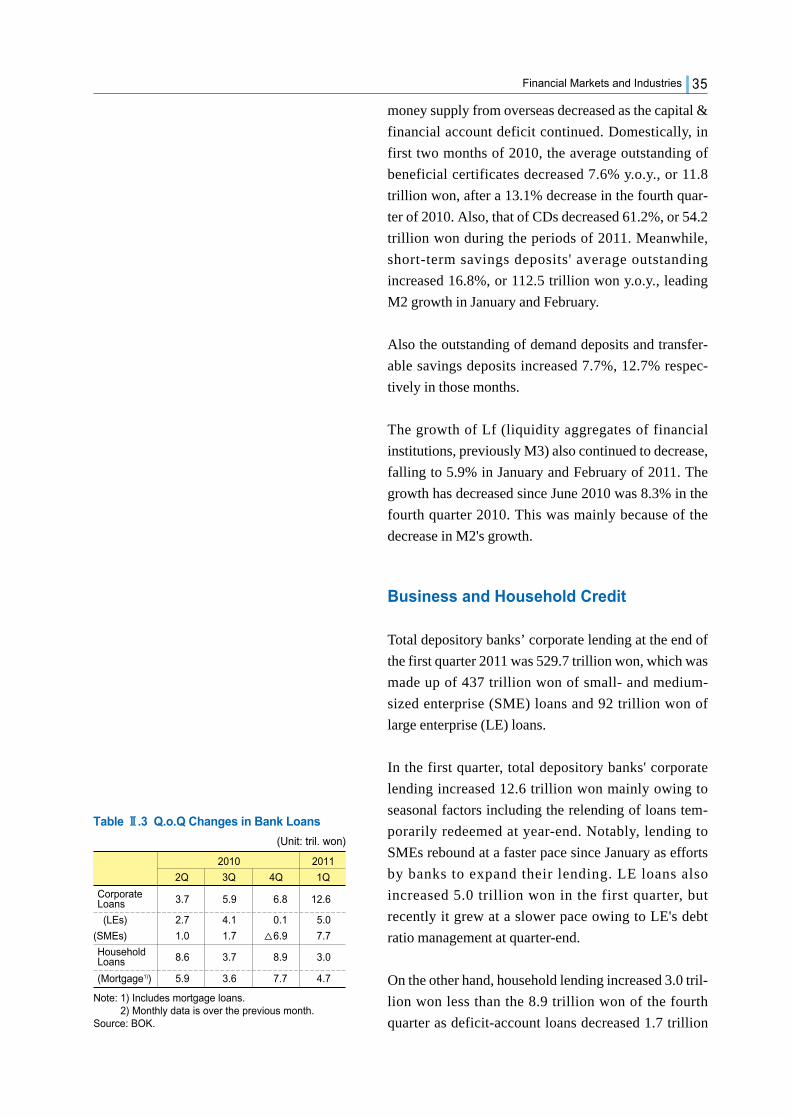
the prices of oil and raw materials increase sharply.
Finally, the aftermath of the Great East Japan Earth-
quake is expected to have some negative impacts on
some manufacturing companies in the short run.
Medium- and long-term impacts will, however, be
moderate.
Meanwhile, there are also several domestic risk factors.
The household debt, which has reached its historical
levels, will be one of the serious risk factors. It
approached approximately 800 trillion won at the end
of 2010. In addition, the sluggish real estate market and
the increase in leasehold deposits are about to spread
negatively to the real economy. The upward trend in
inflation is another concerns in Korea. There is a grow-
Korean Economic and Financial Review [April 2011]26
FigureⅠⅠ.29 Contributions to HouseholdConsumption Expenditures
Source: BOK.
FigureⅠⅠ.30 Rate of Change in Inventories
Source: NSO.
FigureⅠⅠ.28 CCI and CLI
Source: NSO.
ing possibility that the high inflation rate will persist in
the coming months. The Bank of Korea’s monetary
policy is expected to be further tightened in order to
curb inflation.
Gross Domestic Product
The Korean economy in 2011 is anticipated to continue
remaining on a robust recovery path. We forecast a
GDP growth of 4.4% for 2011 resulting from an expan-
sion in both domestic demand and exports growth.
Growth is forecast to be 4.0% and 4.7% y.o.y. in the
first and second half, respectively (Table Ⅰ.15).
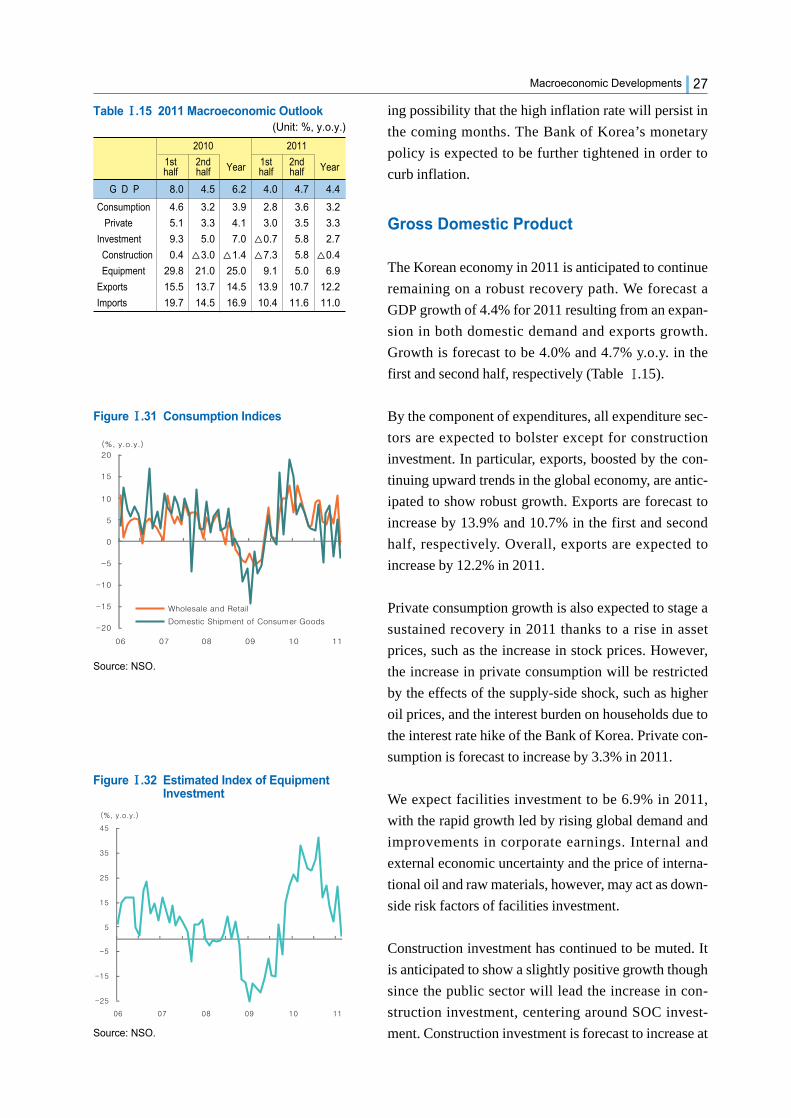
By the component of expenditures, all expenditure sec-
tors are expected to bolster except for construction
investment. In particular, exports, boosted by the con-
tinuing upward trends in the global economy, are antic-
ipated to show robust growth. Exports are forecast to
increase by 13.9% and 10.7% in the first and second
half, respectively. Overall, exports are expected to
increase by 12.2% in 2011.
Private consumption growth is also expected to stage a
sustained recovery in 2011 thanks to a rise in asset
prices, such as the increase in stock prices. However,
the increase in private consumption will be restricted
by the effects of the supply-side shock, such as higher
oil prices, and the interest burden on households due to
the interest rate hike of the Bank of Korea. Private con-
sumption is forecast to increase by 3.3% in 2011.
We expect facilities investment to be 6.9% in 2011,
with the rapid growth led by rising global demand and
improvements in corporate earnings. Internal and
external economic uncertainty and the price of interna-
tional oil and raw materials, however, may act as down-
side risk factors of facilities investment.
Construction investment has continued to be muted. It
is anticipated to show a slightly positive growth though
since the public sector will lead the increase in con-
struction investment, centering around SOC invest-
ment. Construction investment is forecast to increase at
Macroeconomic Developments 27
FigureⅠⅠ.32 Estimated Index of EquipmentInvestment
Source: NSO.
FigureⅠⅠ.31 Consumption Indices
Source: NSO.
TableⅠⅠ.15 2011 Macroeconomic Outlook(Unit: %, y.o.y.)
2010 2011
1st 2nd Year 1st 2nd Yearhalf half half half
G D P 8.0 4.5 6.2 4.0 4.7 4.4
Consumption 4.6 3.2 3.9 2.8 3.6 3.2
Private 5.1 3.3 4.1 3.0 3.5 3.3
Investment 9.3 5.0 7.0 △0.7 5.8 2.7
Construction 0.4 △3.0 △1.4 △7.3 5.8 △0.4
Equipment 29.8 21.0 25.0 9.1 5.0 6.9
Exports 15.5 13.7 14.5 13.9 10.7 12.2
Imports 19.7 14.5 16.9 10.4 11.6 11.0
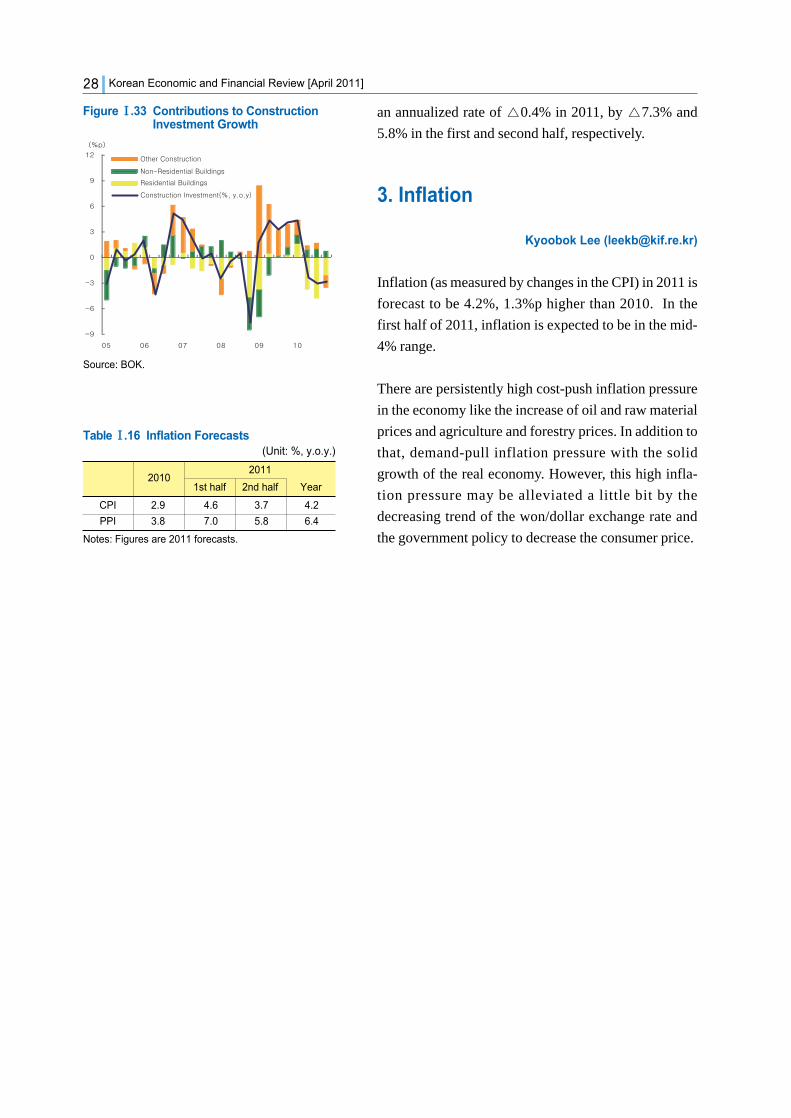
an annualized rate of △0.4% in 2011, by △7.3% and
5.8% in the first and second half, respectively.
3. Inflation
Kyoobok Lee ([email protected])
Inflation (as measured by changes in the CPI) in 2011 is
forecast to be 4.2%, 1.3%p higher than 2010. In the
first half of 2011, inflation is expected to be in the mid-
4% range.
There are persistently high cost-push inflation pressure
in the economy like the increase of oil and raw material
prices and agriculture and forestry prices. In addition to
that, demand-pull inflation pressure with the solid
growth of the real economy. However, this high infla-
tion pressure may be alleviated a little bit by the
decreasing trend of the won/dollar exchange rate and
the government policy to decrease the consumer price.
Korean Economic and Financial Review [April 2011]28
TableⅠⅠ.16 Inflation Forecasts(Unit: %, y.o.y.)
20102011
1st half 2nd half Year
CPI 2.9 4.6 3.7 4.2
PPI 3.8 7.0 5.8 6.4
Notes: Figures are 2011 forecasts.
FigureⅠⅠ.33 Contributions to ConstructionInvestment Growth
Source: BOK.

29
A. Asset Prices
1. Recent Trends
Kyoobok Lee ([email protected])
Interest Rates
In the first quarter of 2011, money market rates mostly
increased following a change in the monetary policy by
the Bank of Korea. Meanwhile, long-term market inter-
est rates decreased slightly as investors’ risk aversion
increased due to the Japanese earthquake and nuclear
accident and the unrest in North Africa and the Middle
East.
The Monetary Policy Committee (MPC) of the Bank of
Korea decided to raise the base rate four times since
November 16, 2010, mainly due to the continued
upward inflationary pressure associated with the con-
tinued upswing in activity and the run-up in interna-
tional raw material prices.
Since the increase in the base rate, CD rates (91 days)
have gone up to 3.40% from 2.66%. CP rates (91 days)
also increased to 3.61% from 2.79%.
Meanwhile, treasury bond yields (3-yr) decreased as
global financial market’s uncertainty increased due to
We expect the Bank of Korea to tighten its monetary policy as the economy continues to strengthenand inflationary pressure still linger. We revised our Treasury bond (3yr) yields slightly higher to4.0%, 0.3%p higher than 2010. Continuous current account surplus, foreign portfolio investmentinflows and the ongoing monetary easing policy by the Fed will strengthen the won and we expectan average of 1,075, down from the 1,156 figure of 2010. Both upside and downside risks seem toco-exist in the equity market. Growth opportunities for Korean banks are expected to rebound in thefirst half of 2011. Assets of credit card companies increased 7.1% to 54.5 trillion won and profitabili-ty of securities companies is expected to improve due to expected increase in trading volumes.Premium income of the life insurance industry in FY2011 are forecasted to increase as sales in vari-able life insurance and savings type insurance show strong growth prospects.
Ⅱ. Financial Markets and Industries 2
Figure ⅡⅡ.1 Major Short-Term Interest Rates
Source: BOK.
Figure ⅡⅡ.2 Major Long-Term Interest Rates
Source: BOK.

the massive earthquake and the nuclear accident in
Japan and the geopolitical unrest in the Middle East and
North Africa region, including Libya and Egypt. Also,
in the bond market, foreign investors’ domestic bond
investment shifted to a slight net buying position since
January 2011. Foreigners’ net purchases was 3.0 tril-
lion won in March, 2.5 trillion won in February and 1.0
trillion won in January. As a result, while treasury bond
yields (3-yr) were above 3.9% before the Japanese
earthquake, it recently hovered the level of 3.7%.
This trend matched major countries' treasury bond
rates. While the bond yields of major countries includ-
ing the US, Germany, the UK and Japan decreased as
global financial uncertainty increased through Febru-
ary to mid-March, they have turned upward and been
steadily rising since late March.
This is because the expectations of economic recovery
increased and the uncertainty about Japan eased after
the G7 decided to intervene to control the yen rise on
March 18.
On the other hand, corporate bond yields moved in sync
with treasury bond yields. After corporate bond yields
(AA-, 3yr) increased to 4.51% in February, they
decreased to 3.89% on March 15, 2011. Recently, how-
ever, it rose to 4.56% in April. Consequently, the credit
spreads on corporate bonds sustained the level of 75bps
~ 80bps.
Exchange Rates
Sungwook Park ([email protected])
During the first quarter of 2011, the won appreciated
3.5% against the U.S. dollar. While the won/dollar had
fluctuated within a narrow band from January till the
middle of March, it fell down below 1,100 relatively
fast in the late March. The fall in the won/dollar rate
reflected not only Korea's strong fundamentals but also
the recent rise in inflation in Korea. It was widely
accepted in the market that the Korean government
Korean Economic and Financial Review [April 2011]30
Figure ⅡⅡ.3 Major Countries’ Treasury BondRates (5yr)
Source: Bloomberg.
Figure ⅡⅡ.4 Won/Dollar Exchange Rate andWon/Yen Exchange Rate
Source: BOK.
would have less incentive to intervene in the foreign
exchange market since the appreciation of the won
would help slow down inflation. Consequently, the
won/dollar rate stood at 1096.7 by the end of March.
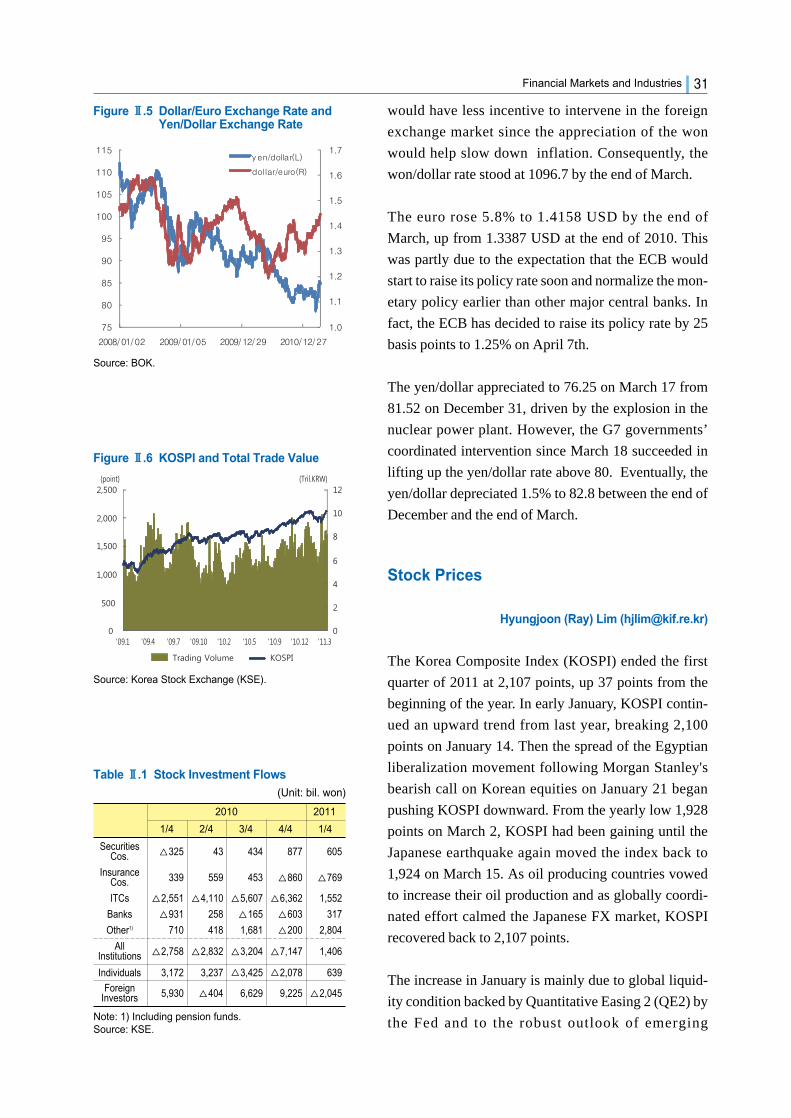
The euro rose 5.8% to 1.4158 USD by the end of
March, up from 1.3387 USD at the end of 2010. This
was partly due to the expectation that the ECB would
start to raise its policy rate soon and normalize the mon-
etary policy earlier than other major central banks. In
fact, the ECB has decided to raise its policy rate by 25
basis points to 1.25% on April 7th.
The yen/dollar appreciated to 76.25 on March 17 from
81.52 on December 31, driven by the explosion in the
nuclear power plant. However, the G7 governments’
coordinated intervention since March 18 succeeded in
lifting up the yen/dollar rate above 80. Eventually, the
yen/dollar depreciated 1.5% to 82.8 between the end of
December and the end of March.
Stock Prices
Hyungjoon (Ray) Lim ([email protected])
The Korea Composite Index (KOSPI) ended the first
quarter of 2011 at 2,107 points, up 37 points from the
beginning of the year. In early January, KOSPI contin-
ued an upward trend from last year, breaking 2,100
points on January 14. Then the spread of the Egyptian
liberalization movement following Morgan Stanley's
bearish call on Korean equities on January 21 began
pushing KOSPI downward. From the yearly low 1,928
points on March 2, KOSPI had been gaining until the
Japanese earthquake again moved the index back to
1,924 on March 15. As oil producing countries vowed
to increase their oil production and as globally coordi-
nated effort calmed the Japanese FX market, KOSPI
recovered back to 2,107 points.
The increase in January is mainly due to global liquid-
ity condition backed by Quantitative Easing 2 (QE2) by
the Fed and to the robust outlook of emerging
Financial Markets and Industries 31
Figure ⅡⅡ.6 KOSPI and Total Trade Value
Source: Korea Stock Exchange (KSE).
Table ⅡⅡ.1 Stock Investment Flows(Unit: bil. won)
Note: 1) Including pension funds.Source: KSE.
2010 2011
1/4 2/4 3/4 4/4 1/4
Securities △325 43 434 877 605Cos.
Insurance 339 559 453 △860 △769Cos.
ITCs △2,551 △4,110 △5,607 △6,362 1,552
Banks △931 258 △165 △603 317
Other1) 710 418 1,681 △200 2,804
All △2,758 △2,832 △3,204 △7,147 1,406Institutions
Individuals 3,172 3,237 △3,425 △2,078 639
Foreign 5,930 △404 6,629 9,225 △2,045Investors
Figure ⅡⅡ.5 Dollar/Euro Exchange Rate andYen/Dollar Exchange Rate
Source: BOK.

economies. Risk appetite of foreign investors
decreased in late January, however, as evidenced by
their net selling of Korean equities, reversing the trend.
In this environment, the Japanese earthquake and the
nuclear crisis along with it appeared to further move the
index downward. But KOSPI proved more resilient
than that, though we still have to watch out for nuclear
breakout or abrupt rise in US yields after QE2.
Foreign investors purchased a net 9,225 billion won in
equities in the fourth quarter of 2010, continuing the
6,629 billion won in net buying in the previous quarter.
Foreign investors net purchased 10,579, 14,321, 5,531,
5,930, and -404 billion won in equities in the five preced-
ing quarters. On the other hand, as retail investors kept
redeeming their investments in mutual funds, ITCs trend
of net buying of 6,629 and 9,225 billion won in the two
preceding quarters. Their investment appetite shrank due
to the war in the Middle East and issue of high oil prices
in February. On the other hand, all institutions purchased
a net 1,406 billion won, as ITCs reduced their trend of
net selling of equities and other institutions net pur-
chased on a large scale. In four quarters of 2010, they net
sold 2,758, 2,382, 3,204, and 7,147 billion won. Retail
investors also net purchased equities amounting to 639
billion won in the first quarter of 2011.
KOSPI and KOSDAQ stock issuance in the first two
months of the first quarter amounted to 1,292 billion
won (monthly average), up 18% from the previous
quarter (Table II.2). Corporate financing also increased
in the quarter to 12,442 billion won, due to the increase
in both corporate securities offerings and corporate
bonds issuing.
2. Outlook for 2011
Interest Rates
Kyoobok Lee ([email protected])
Since inflationary pressures are expected to persist as
favorable economic conditions continued and interna-
Korean Economic and Financial Review [April 2011]32
Table ⅡⅡ.2 Corporate Financing(Unit: bil. won)
Note: 1) Total volume of direct financing(bonds and stocks).
2) Offerings on Korea Exchange (KRX) and KOSDAQ.
Source: Financial Supervisory Service (FSS).
2010 2011
1/4 2/4 3/4 4/4
Corporate 9,145 11,552 10,320 10,070 12,442Financing (A)1)
CorporateSecurities 922 725 708 1,092 1,292Offerings (B)2)
•Initial Public 687 213 317 218 314Offerings•Rights 235 512 391 874 978
Offerings
B/A 10.1 6.3 6.9 10.8 10.4
1/4(Jan.~Feb.)
tional commodity prices including crude oil rise, the
base rate of the Bank of Korea is expected to increase
additionally in the rest of 2011.
Therefore, market rates are expected to trend higher
during 2011. However, the increase in market rates
should be limited, since such rates factor in corporate
expectations of the BOK’s future strict monetary policy
and from high demand from financial institutions and
foreign investors.
Therefore, Treasury bond (3yr) yields and corporate bond
(AA- and 3yr) yields in 2011 are expected to be 4.0% and
4.8%. In the first half, they will be 3.8% and 4.6% and, in
the second half, they will be 4.1% and 4.9%.
Exchange Rate
Sungwook Park ([email protected])
In 2011, the won/dollar exchange rate is expected to
average 1,075, down from the 1,156 figure of 2010, dri-
ven by a sustained current account surplus in Korea,
foreign portfolio investment inflows and the ongoing
monetary easing policies of the Fed. However, this
downward trend of won/dollar exchange rate will be
gradual since the US dollar may strengthen after the ter-
mination of QE2 and a high oil price may reduce
Korea’s current account surplus and put a break on the
fast appreciation of won.
Stock Prices
Hyungjoon (Ray) Lim ([email protected]))
In the second quarter of 2011, Korea's equity market is
expected to have balanced upside and downside risks.
The upside risks mainly hinge on two things. First,
emerging economies would win the battle on inflation,
relieving the pressure of central banks to hike the rates
much further. Second, the commodity prices are
Financial Markets and Industries 33

expected to finally decrease, also downsizing the infla-
tion risks.
Downside risks also lurk, however. Should the loss in
project financing loan spread or should the household
debt crisis emerge, the KOSPI could face considerable
downward adjustments. Plus, the pullback of foreign
investors after the QE2 cannot be ruled out, albeit
unlikely.
B. Money and Credit
Kyoobok Lee ([email protected])
In January and February, the money supply continued
to increase, but at a slower pace than the fourth quarter
2010. The average growth rate of M2, which is called
broad money, fell from 7.4% to 5.0% y.o.y. in February,
extending a downtrend begun since July 2010.
Monetary Aggregates
Between January and February, the reserve base (aver-
age) increased 13.2% y.o.y., higher than 12.5% of the
fourth quarter. This was mainly because bank notes &
coins issued increased 18.4% and foreign exchange
reserves continued to increase. In February, the y.o.y.
change in the amount of foreign exchange reserves was
$27.0 billion.
On the other hand, the outstanding of MSBs (monetary
stabilization bonds), which is used as a measure for the
BOK to control market liquidity, has decreased
slightly. It totaled 162.3 trillion won at the end of Feb-
ruary 2011, 1.2 trillion won less than the end of 2010.
Meanwhile, a monthly average issuance in MSBs
increased to 12.1 trillion won comparing the figure 10.9
trillion won of the fourth quarter 2010.
M2 growth in January and February was 5.7% (y.o.y.),
lower than the 7.4% of the fourth quarter 2010, as the
Korean Economic and Financial Review [April 2011]34
Figure ⅡⅡ.8 Monetary Stabilization BondsOutstanding
Note: 1) End of period.
Source: BOK.
Figure ⅡⅡ.7 Money Supply (average)Growth Rates
Note: Based on average money supply outstanding.
Source: BOK.
money supply from overseas decreased as the capital &
financial account deficit continued. Domestically, in
first two months of 2010, the average outstanding of
beneficial certificates decreased 7.6% y.o.y., or 11.8
trillion won, after a 13.1% decrease in the fourth quar-
ter of 2010. Also, that of CDs decreased 61.2%, or 54.2
trillion won during the periods of 2011. Meanwhile,
short-term savings deposits' average outstanding
increased 16.8%, or 112.5 trillion won y.o.y., leading
M2 growth in January and February.
Also the outstanding of demand deposits and transfer-
able savings deposits increased 7.7%, 12.7% respec-
tively in those months.
The growth of Lf (liquidity aggregates of financial
institutions, previously M3) also continued to decrease,
falling to 5.9% in January and February of 2011. The
growth has decreased since June 2010 was 8.3% in the
fourth quarter 2010. This was mainly because of the
decrease in M2's growth.
Business and Household Credit
Total depository banks’ corporate lending at the end of
the first quarter 2011 was 529.7 trillion won, which was
made up of 437 trillion won of small- and medium-
sized enterprise (SME) loans and 92 trillion won of
large enterprise (LE) loans.
In the first quarter, total depository banks' corporate
lending increased 12.6 trillion won mainly owing to
seasonal factors including the relending of loans tem-
porarily redeemed at year-end. Notably, lending to
SMEs rebound at a faster pace since January as efforts
by banks to expand their lending. LE loans also
increased 5.0 trillion won in the first quarter, but
recently it grew at a slower pace owing to LE's debt
ratio management at quarter-end.
On the other hand, household lending increased 3.0 tril-
lion won less than the 8.9 trillion won of the fourth
quarter as deficit-account loans decreased 1.7 trillion
Financial Markets and Industries 35
Table ⅡⅡ.3 Q.o.Q Changes in Bank Loans
(Unit: tril. won)
Note: 1) Includes mortgage loans. 2) Monthly data is over the previous month.
Source: BOK.
2010 2011
2Q 3Q 4Q 1Q
Corporate 3.7 5.9 6.8 12.6Loans
(LEs) 2.7 4.1 0.1 5.0
(SMEs) 1.0 1.7 △6.9 7.7
Household 8.6 3.7 8.9 3.0Loans
(Mortgage1)) 5.9 3.6 7.7 4.7

won, even though mortgage loans increased 4.7 trillion
won. Despite a decline in the number of apartments to
move in to, growth in mortgage lending accelerated
slightly, mainly due to the start of the spring moving
season and to banks’ strengthened efforts to expand
loans.
Corporate direct financing increased 12.1 trillion won
in the fourth quarter of 2011, more than the 7.1 trillion
won of the fourth quarter. Specifically, corporate bond
issuance (public offering) increased 4.1 trillion won in
the quarter, driven by issuance demand in line with the
sustained upward trend of the economy and the low
cost of raising funds.
CP also showed a large net redemption. Financing
through the stock market continued to increase, particu-
larly through a paid-in capital increase and initial offer-
ings, thanks to the bullish stock market.
Beneficiary certificates at investment trust manage-
ment companies (ITMCs) declined sharply except for
stock- type and new-type deposits. Deposits in equity-
type investment funds increased 0.3 trillion won in the
first quarter. Also new-type deposits increased 1.8 tril-
lion won in the quarter. Meanwhile, bond-type and
bond-equity type deposit decreased 7.1 trillion won, 1.7
trillion won during the first quarter as the bond yields
declined.
Outlook for 2011
In 2011, the corporate and household bank lending is
expected to continue to rise with the solid growth of
real economy sector. However, its growth will be lim-
ited by a rise in the base rate.
Meanwhile, since the lending demand of households
would continue to be high with high inflation, chunsei
price (chunsei: a deposit made to the owner of the
dwelling, the leasor, as a kind of security) and so on, the
household lending is expected to show a solid growth
through 2011.
Korean Economic and Financial Review [April 2011]36
Figure ⅡⅡ.9 Beneficiary Certificates at ITMCs
Source: BOK.
Table ⅡⅡ.4 Corporate Direct Financing1)
(Unit: tril. won)
Note: 1) Excludes financial institutions.2) KOSPI and KOSDAQ.3) Based on securities companies and
merchant banking accounts at banks. 4) as of March 20.
Source: BOK.
2010 2011
2Q 3Q 4Q 1Q
Stock2.5 1.4 3.7 3.3
issuance2)
Net issuance△0.2 1.4 △4.2 4.7
of CP3)
Net issuance of3.1 △0.7 5.5 4.1
corporate bonds
Total 5.4 2.1 5.0 12.1
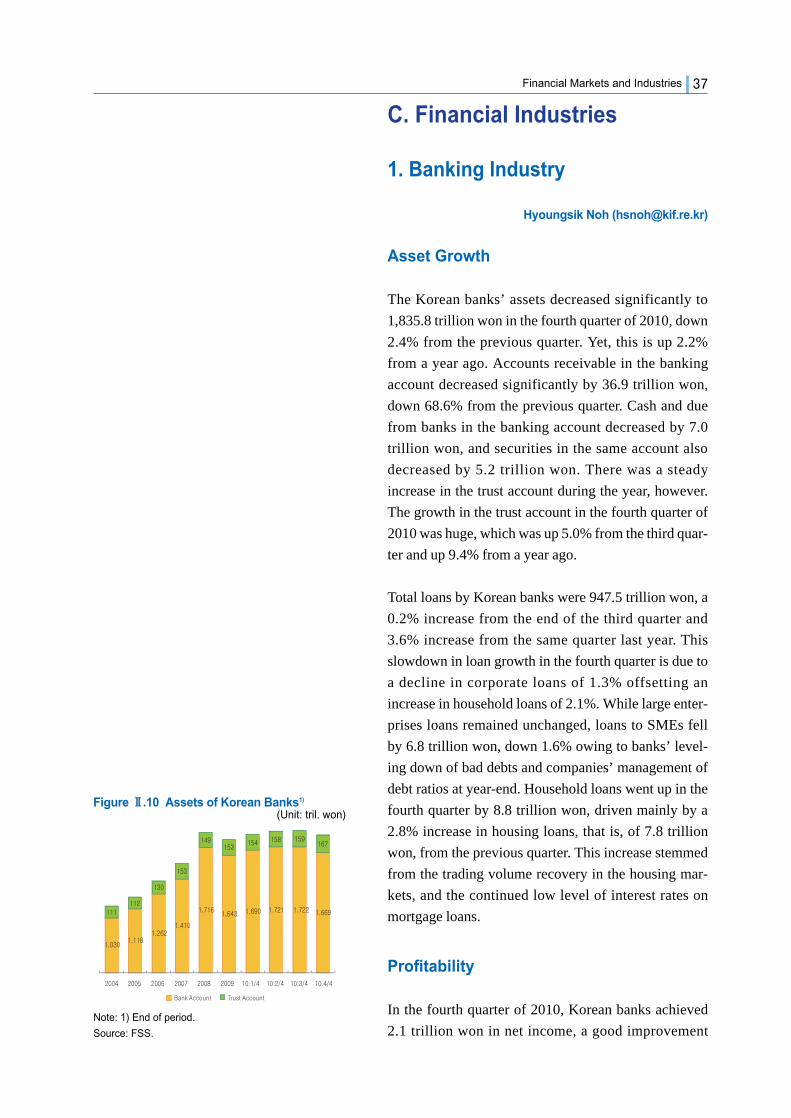
C. Financial Industries
1. Banking Industry
Hyoungsik Noh ([email protected])
Asset Growth
The Korean banks’ assets decreased significantly to
1,835.8 trillion won in the fourth quarter of 2010, down
2.4% from the previous quarter. Yet, this is up 2.2%
from a year ago. Accounts receivable in the banking
account decreased significantly by 36.9 trillion won,
down 68.6% from the previous quarter. Cash and due
from banks in the banking account decreased by 7.0
trillion won, and securities in the same account also
decreased by 5.2 trillion won. There was a steady
increase in the trust account during the year, however.
The growth in the trust account in the fourth quarter of
2010 was huge, which was up 5.0% from the third quar-
ter and up 9.4% from a year ago.
Total loans by Korean banks were 947.5 trillion won, a
0.2% increase from the end of the third quarter and
3.6% increase from the same quarter last year. This
slowdown in loan growth in the fourth quarter is due to
a decline in corporate loans of 1.3% offsetting an
increase in household loans of 2.1%. While large enter-
prises loans remained unchanged, loans to SMEs fell
by 6.8 trillion won, down 1.6% owing to banks’ level-
ing down of bad debts and companies’ management of
debt ratios at year-end. Household loans went up in the
fourth quarter by 8.8 trillion won, driven mainly by a
2.8% increase in housing loans, that is, of 7.8 trillion
won, from the previous quarter. This increase stemmed
from the trading volume recovery in the housing mar-
kets, and the continued low level of interest rates on
mortgage loans.
Profitability
In the fourth quarter of 2010, Korean banks achieved
2.1 trillion won in net income, a good improvement
Financial Markets and Industries 37
Figure ⅡⅡ.10 Assets of Korean Banks1)
Note: 1) End of period.
Source: FSS.
(Unit: tril. won)

from last year’s figure of 1.5 trillion won. However, it
was down 0.6 trillion won over the previous quarter.
The weakening of net profits has been driven by a drop
in non-interest income and continued high level of bad
debt expenses, despite improving net interest margins
and higher net interest income.
Net interest income increased considerably to 9.7 tril-
lion won, up 6.6% from the previous quarter, thanks to
a recovery in the net interest margin.
Net interest margins rose 0.2%p over the previous quar-
ter to 2.32%, back from the drops in the two previous
quarters, but remained below the 2.40% figure from the
first quarter of 2010.
Non-interest income decreased 0.8 trillion won to 1.4
trillion won. However, non-interest income during
2010 increased 47.7% over the previous year to 7.8 tril-
lion won, reflecting a huge increase in securities-
related income growth of 72.0% amid the strong securi-
ties market.
Loan loss provisions decreased 0.9 trillion won over
the previous quarter to 2.5 trillion won. However, loan
loss provisions throughout the year increased to 14.1
trillion won from 12.1 trillion won in the previous year.
Bad debt expenses in the fourth quarter decreased to 3.2
trillion won, down 0.2 trillion won from the previous
quarter. Bad debt expenses of 14.8 trillion won in 2010
were up 13.0% from the previous year's figure of 13.1
trillion won.
Soundness and Capital Adequacy
The asset soundness of Korean banks substantially
improved as the NPL ratio eased to 1.88% after peaking
in the third quarter. This has primarily been the result of
an aggressive clean-up of bad assets by Korean banks
through the sale or write-down of bad loans. Nonethe-
less, the NPL ratio is still high compared to the one a
year ago, 1.24%. Meanwhile, the ability of domestic
banks to absorb loan losses also improved as the cover-
age ratio recovered considerably in the fourth quarter.
Korean Economic and Financial Review [April 2011]38
Table ⅡⅡ.6 Composition of Banks’ Net Income(Unit: tril. won)
Note: Net income is cumulative.Source: FSS.
10.1/4 10.2/4 10.3/4 10.4/4
Net Interest Income 9.4 9.3 9.1 9.7
Net Non-Interest Income 2.0 2.2 2.1 1.4
Table ⅡⅡ.5 Composition of Bank Loans(Unit: tril. won)
Note: Includes Korea Development Bank.Source: BOK.
09.4/4 10.1/4 10.2/4 10.3/4 10.4/4
LE 75.5 80.3 83.1 87.3 87.3
SME 430.7 434.0 434.9 436.6 429.7
Housing 265.1 267.2 273.2 276.8 284.6
Others 142.3 141.0 143.7 143.8 144.9
Figure ⅡⅡ.11 Net Interest Margin
Source: FSS.
(Unit: %)
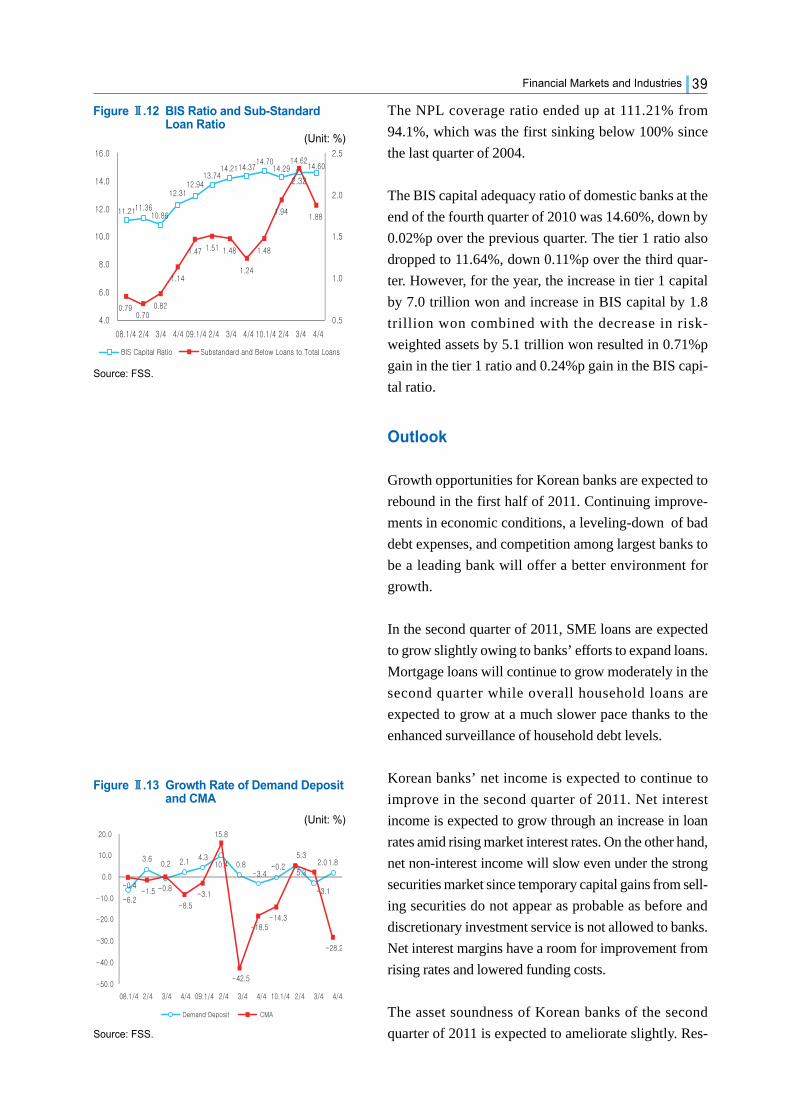
The NPL coverage ratio ended up at 111.21% from
94.1%, which was the first sinking below 100% since
the last quarter of 2004.
The BIS capital adequacy ratio of domestic banks at the
end of the fourth quarter of 2010 was 14.60%, down by
0.02%p over the previous quarter. The tier 1 ratio also
dropped to 11.64%, down 0.11%p over the third quar-
ter. However, for the year, the increase in tier 1 capital
by 7.0 trillion won and increase in BIS capital by 1.8
trillion won combined with the decrease in risk-
weighted assets by 5.1 trillion won resulted in 0.71%p
gain in the tier 1 ratio and 0.24%p gain in the BIS capi-
tal ratio.
Outlook
Growth opportunities for Korean banks are expected to
rebound in the first half of 2011. Continuing improve-
ments in economic conditions, a leveling-down of bad
debt expenses, and competition among largest banks to
be a leading bank will offer a better environment for
growth.
In the second quarter of 2011, SME loans are expected
to grow slightly owing to banks’ efforts to expand loans.
Mortgage loans will continue to grow moderately in the
second quarter while overall household loans are
expected to grow at a much slower pace thanks to the
enhanced surveillance of household debt levels.
Korean banks’ net income is expected to continue to
improve in the second quarter of 2011. Net interest
income is expected to grow through an increase in loan
rates amid rising market interest rates. On the other hand,
net non-interest income will slow even under the strong
securities market since temporary capital gains from sell-
ing securities do not appear as probable as before and
discretionary investment service is not allowed to banks.
Net interest margins have a room for improvement from
rising rates and lowered funding costs.
The asset soundness of Korean banks of the second
quarter of 2011 is expected to ameliorate slightly. Res-
Financial Markets and Industries 39
Figure ⅡⅡ.13 Growth Rate of Demand Depositand CMA
Source: FSS.
Figure ⅡⅡ.12 BIS Ratio and Sub-StandardLoan Ratio
Source: FSS.
(Unit: %)
(Unit: %)

olution of troubled real estate PF loans which is under
way will improve indicators of asset soundness. How-
ever, the default rates of loans for domestic banks are
likely to rise due to a rise in interest rates on loan. More
or less Korean banks should be able to keep asset
soundness under control as long SME loans and house-
hold loans are properly watched over.
It is expected that Korean banks will maintain good
capital adequacy level in the second quarter of 2011
through the reduction of the bad debts and the profit
improvements. However, it is necessary for Korean
banks to be alert for possible deterioration in asset
soundness and reduction in capital in turn. In case bad
debt expenses are poorly managed, net income will be
negatively affected, which will deteriorate quantity and
quality of capital. Korean banks should make efforts to
be in good shape in terms of capital adequacy and com-
position of capital.
2. Non-Banking FinancialInstitutions
Soonho Lee ([email protected])
Credit Card Companies
During the fourth quarter of 2010, the total assets of
credit card companies increased 7.1% to 54.5 trillion
won, up from 50.9 trillion won in the previous quarter
(Figure Ⅱ.14). Card assets, which comprise the largest
portion of total assets, increased by 9.3% to 35.3 trillion
won q.o.q. due to the increased credit card loans and
receivables on credit card installment sales. The out-
standing balance of loan & factoring increased from 1.0
trillion won to 1.2 trillion won. Meanwhile, lease &
installment assets stayed flat at 2.8 trillion won. A
decrease in cash and cash equivalents led to a fall in
current & fixed assets of 2.9% to 6.6 trillion won from
6.8 trillion won.
Total net income in the last quarter of 2010 soared
152.3% to 1,333.9 billion won from 528.7 billion won
Korean Economic and Financial Review [April 2011]40
Figure ⅡⅡ.14 Total Assets & Card Assets atCredit Card Companies
Source: FSS.
Figure ⅡⅡ.15 Net Income & Amortization ofCredit Losses at Credit CardCompanies
Note: Calculated quarterly.
Source: FSS.
Table ⅡⅡ.7 Financial Indicators ofCredit Card Companies
(Unit: %)
Source: FSS.
2009 2010
4Q 1Q 2Q 3Q 4Q
Adjusted29.1 28.1 30.2 30.0 28.5capital ratio
Delinquency2.2 2.0 1.8 1.8 1.7ratio
Substandard &below loans 2.0 1.7 1.5 1.4 1.3
ratio
ROA 4.3 4.5 3.8 3.8 5.5
ROE 15.8 15.3 13.4 13.4 19.8
(Unit: bil. won)
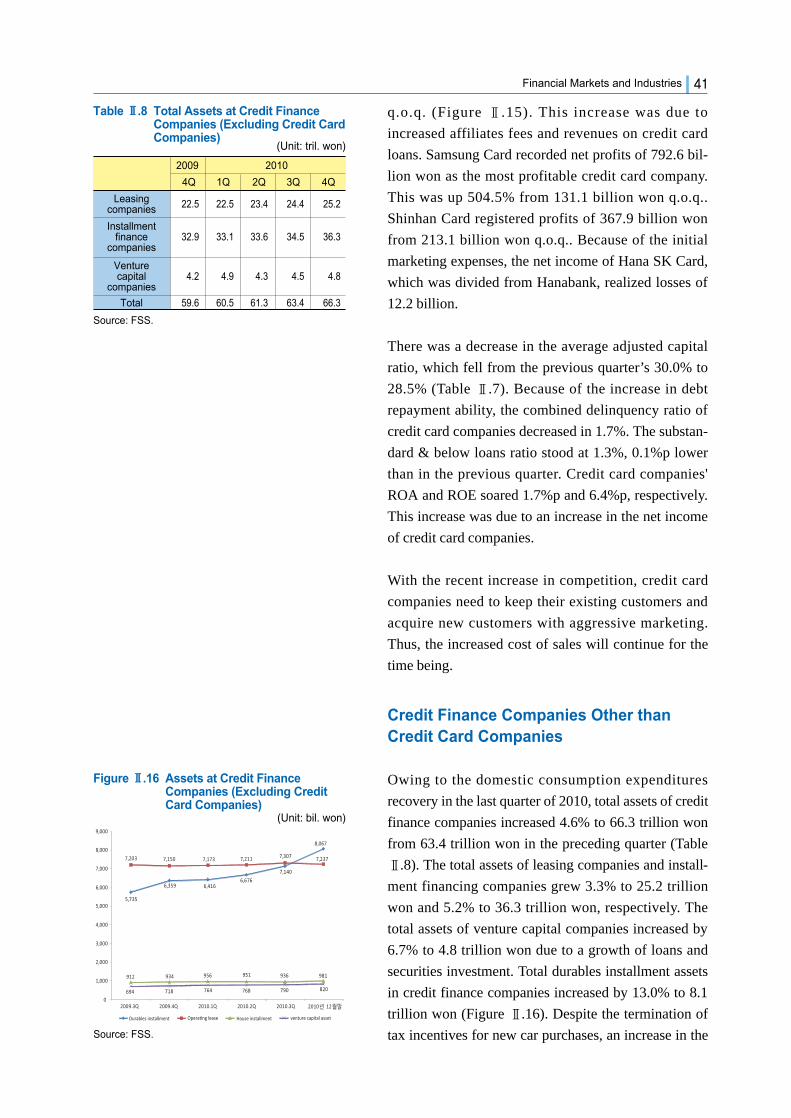
q.o.q. (Figure Ⅱ.15). This increase was due to
increased affiliates fees and revenues on credit card
loans. Samsung Card recorded net profits of 792.6 bil-
lion won as the most profitable credit card company.
This was up 504.5% from 131.1 billion won q.o.q..
Shinhan Card registered profits of 367.9 billion won
from 213.1 billion won q.o.q.. Because of the initial
marketing expenses, the net income of Hana SK Card,
which was divided from Hanabank, realized losses of
12.2 billion.
There was a decrease in the average adjusted capital
ratio, which fell from the previous quarter’s 30.0% to
28.5% (Table Ⅱ.7). Because of the increase in debt
repayment ability, the combined delinquency ratio of
credit card companies decreased in 1.7%. The substan-
dard & below loans ratio stood at 1.3%, 0.1%p lower
than in the previous quarter. Credit card companies'
ROA and ROE soared 1.7%p and 6.4%p, respectively.
This increase was due to an increase in the net income
of credit card companies.
With the recent increase in competition, credit card
companies need to keep their existing customers and
acquire new customers with aggressive marketing.
Thus, the increased cost of sales will continue for the
time being.
Credit Finance Companies Other thanCredit Card Companies
Owing to the domestic consumption expenditures
recovery in the last quarter of 2010, total assets of credit
finance companies increased 4.6% to 66.3 trillion won
from 63.4 trillion won in the preceding quarter (Table
Ⅱ.8). The total assets of leasing companies and install-
ment financing companies grew 3.3% to 25.2 trillion
won and 5.2% to 36.3 trillion won, respectively. The
total assets of venture capital companies increased by
6.7% to 4.8 trillion won due to a growth of loans and
securities investment. Total durables installment assets
in credit finance companies increased by 13.0% to 8.1
trillion won (Figure Ⅱ.16). Despite the termination of
tax incentives for new car purchases, an increase in the
Financial Markets and Industries 41
Figure ⅡⅡ.16 Assets at Credit FinanceCompanies (Excluding CreditCard Companies)
Source: FSS.
Table ⅡⅡ.8 Total Assets at Credit FinanceCompanies (Excluding Credit CardCompanies)
(Unit: tril. won)
Source: FSS.
2009 2010
4Q 1Q 2Q 3Q 4Q
Leasing 22.5 22.5 23.4 24.4 25.2companies
Installmentfinance 32.9 33.1 33.6 34.5 36.3
companies
Venturecapital 4.2 4.9 4.3 4.5 4.8
companies
Total 59.6 60.5 61.3 63.4 66.3
(Unit: bil. won)
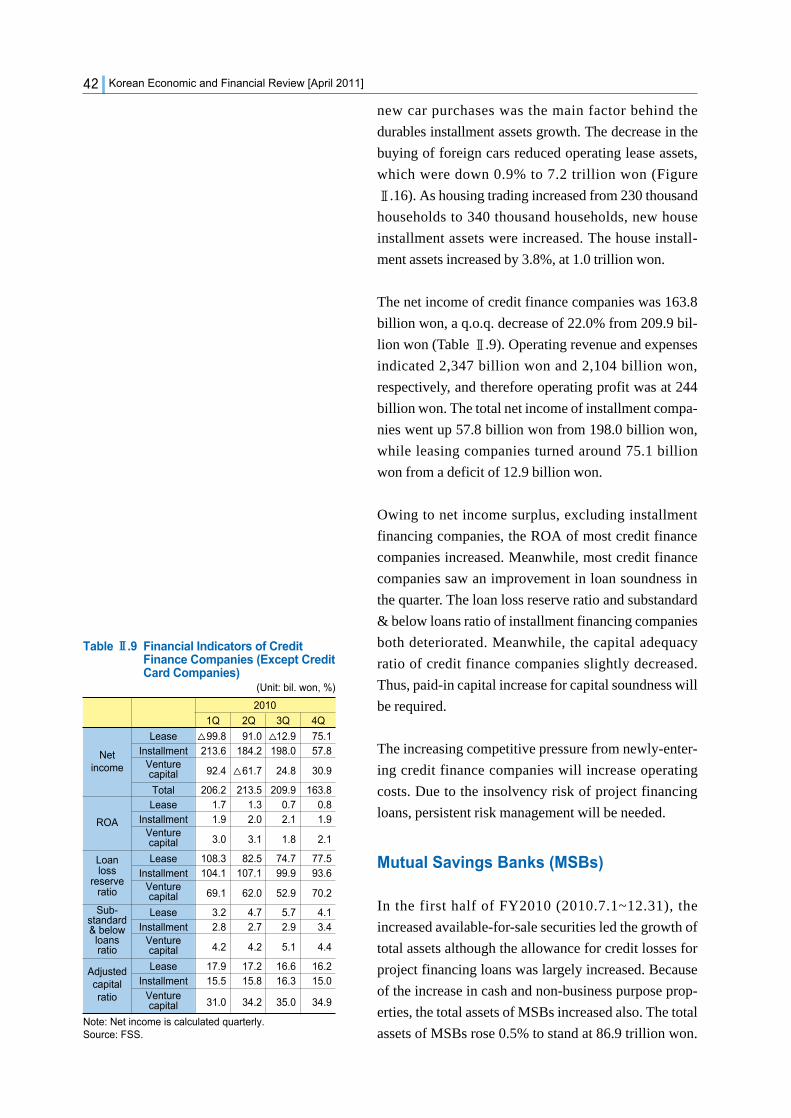
new car purchases was the main factor behind the
durables installment assets growth. The decrease in the
buying of foreign cars reduced operating lease assets,
which were down 0.9% to 7.2 trillion won (Figure
Ⅱ.16). As housing trading increased from 230 thousand
households to 340 thousand households, new house
installment assets were increased. The house install-
ment assets increased by 3.8%, at 1.0 trillion won.
The net income of credit finance companies was 163.8
billion won, a q.o.q. decrease of 22.0% from 209.9 bil-
lion won (Table Ⅱ.9). Operating revenue and expenses
indicated 2,347 billion won and 2,104 billion won,
respectively, and therefore operating profit was at 244
billion won. The total net income of installment compa-
nies went up 57.8 billion won from 198.0 billion won,
while leasing companies turned around 75.1 billion
won from a deficit of 12.9 billion won.
Owing to net income surplus, excluding installment
financing companies, the ROA of most credit finance
companies increased. Meanwhile, most credit finance
companies saw an improvement in loan soundness in
the quarter. The loan loss reserve ratio and substandard
& below loans ratio of installment financing companies
both deteriorated. Meanwhile, the capital adequacy
ratio of credit finance companies slightly decreased.
Thus, paid-in capital increase for capital soundness will
be required.
The increasing competitive pressure from newly-enter-
ing credit finance companies will increase operating
costs. Due to the insolvency risk of project financing
loans, persistent risk management will be needed.
Mutual Savings Banks (MSBs)
In the first half of FY2010 (2010.7.1~12.31), the
increased available-for-sale securities led the growth of
total assets although the allowance for credit losses for
project financing loans was largely increased. Because
of the increase in cash and non-business purpose prop-
erties, the total assets of MSBs increased also. The total
assets of MSBs rose 0.5% to stand at 86.9 trillion won.
Korean Economic and Financial Review [April 2011]42
Table ⅡⅡ.9 Financial Indicators of CreditFinance Companies (Except CreditCard Companies)
(Unit: bil. won, %)
Note: Net income is calculated quarterly. Source: FSS.
2010
1Q 2Q 3Q 4Q
Lease △99.8 91.0 △12.9 75.1Installment 213.6 184.2 198.0 57.8
Venture92.4 △61.7 24.8 30.9capital
Total 206.2 213.5 209.9 163.8Lease 1.7 1.3 0.7 0.8
Installment 1.9 2.0 2.1 1.9Venture
3.0 3.1 1.8 2.1capital
Lease 108.3 82.5 74.7 77.5Installment 104.1 107.1 99.9 93.6
Venture69.1 62.0 52.9 70.2capital
Lease 3.2 4.7 5.7 4.1Installment 2.8 2.7 2.9 3.4
Venture4.2 4.2 5.1 4.4capital
Lease 17.9 17.2 16.6 16.2Installment 15.5 15.8 16.3 15.0
Venture31.0 34.2 35.0 34.9capital
Loanloss
reserveratio
Sub-standard& below
loansratio
Adjustedcapitalratio
Netincome
ROA

The deposits of MSBs expanded by 0.5% to register
76.8 trillion won, while and loans increased 3.5%,
recording 64.6 trillion won for this period (Figure
Ⅱ.16). The proportion of loans has steadily increased.
As the burden of allowance for credit losses for project
financing loans will be increased, the ratio of total
assets growth is expected to shrink.
During the first half of 2010, the net income of MSBs
recorded to a deficit of 556.2 billion won, which was
brought on by the accumulated commission fees and
other operating expenses. In particular, four of the top
10 MSBs based on assets recorded a deficit. As the net
income of MSBs indicated a deficit, the ROA, an index
of profitability, recorded -0.6%. In addition, the ratio of
substandard & below loans, which shows assets sound-
ness of MSBs, worsened slightly from 10.3% to 10.6%
over the first half of FY2010. This deterioration was
due to project financing loan losses. Meanwhile,
despite an increase in risk-weighted assets, BIS capital
adequacy ratio of MSBs kept the same level at to 9.1 as
MSBs increased their capital by issuing stocks.
In the second half of FY2010, due to strengthened reg-
ulatory standards by the Financial Supervisory Service
(FSS) on PF loans and additional reserve of loan loss
provision, MSBs will be expected to increase the pro-
portion of retail banking including personal credit loans
rather than real estate-related loans. MSBs will need to
enhance their asset risk management to strengthen
assets soundness. Owing to the increased substandard
& below loans ratio, measures such as a selling of insol-
vent loans will be needed. In addition, because of the
declining trend in BIS capital ratio, MSBs will have to
extend their capital through a paid-in capital increase
and a dividend decrease. Deposit of MSBs will con-
tinue to increase because of the high interest rate.
Mutual Credits (MCs)
This category includes agricultural cooperatives (ACs),
fisheries cooperatives (FICs), forestry cooperatives
(FOCs) and credit unions (CUs). During the forth quar-
ter of 2010, the total assets of mutual credit institutions
Financial Markets and Industries 43
Table ⅡⅡ.10 Financial Indicators of MSBs (Unit: bil. won, %)
Note: Net income is calculated biannually. Source: FSS.
2008.12 2009.6 2009.12 2010.6 2010.12
Net Income 98.4 △105.1 134.3 △951.9 △566.2
ROA 0.2 0.1 0.2 △0.9 △0.6
BIS Capital Ratio
9.3 9.6 9.3 9.1 9.1
Substandard& Below 9.1 9.7 9.3 10.3 10.6
Loans Ratio
Figure ⅡⅡ.17 Total Assets, Deposits & Loansat MSBs
Source: FSS.

(MCs) increased slightly by 3.5% q.o.q. to stand at
310.5 trillion won (Table Ⅱ.11). Total deposits rose by
3.1% to 254.3 trillion won from 246.6 trillion won.
Because of the increased tax-free savings limits and
high deposit rates, the upward trend in deposits contin-
ued over time. Total credits rose about 2.0% from 181.3
trillion won to 184.9 trillion won. Since deposits
increase more rapidly than loans, the ratio of credits to
deposits declined over the fourth quarter of 2010.
Despite the increased operating revenues from loans
for the ordinary people, the mutual credit institutions
registered negative net income (Table Ⅱ.12). Also, the
high financing costs from the high deposit interest rate
raised operating expenses. The total combined net
income of MCs was a deficit of 151.6 billion won in the
last quarter of 2010. CUs, FICs and FOCs registered a
net income of 37.7 billion won, 39.6 billion won, and
12.4 billion won, respectively, while ACs recorded a
deficit of 241.3 billion won.
The ROAs of CUs and ACs declined slightly to 0.1%p
and 0.4%p, respectively. The ROA of FICs increased to
0.7% from 0.6%, while that of FOCs stood at the same
level of 1.1%. MCs faced developed loan soundness,
compared with the previous quarter. The delinquency
ratio of CUs, ACs, FICs and FOCs went down 0.8%p to
6.5%, 0.7%p to 3.1%, 1.1%p to 5.6%, and 1.4%p to
6.3%, respectively. This betterment was due to the
enhanced household income of the ordinary people
who that are the main customers of the MCs. Due to the
writing-off of year-end bad debts, most MCs’s substan-
dard & below loans ratios decreased considerably,
while that of FICs maintained the same level. In all
areas, MCs’s loan loss reserve ratio increased. Because
of the capital raising, the net capital ratio of ACs and
FICs improved slightly.
Due to seasonal effects like farming season, the demands
for of new policy lending and small loans will increase
consistently. So MCs’ asset growth and profitability will
improve. However, due to the rising interest rate on
home loans, there is a potential insolvency risk, meaning
they should strengthen their risk management.
Korean Economic and Financial Review [April 2011]44
Table ⅡⅡ.11 Total Assets & Ratio of Credits toDeposits at Mutual Credits
(Unit: tril. won, %)
Source: FSS.
2009 2010
4Q 1Q 2Q 3Q 4Q
Total Assets 281.2 285.7 294.5 300.1 310.5
Credits 173.8 174.7 178.0 181.3 184.9
Deposits 227.8 234.2 242.2 246.6 254.3Ratio of Credits
76.3 74.6 73.5 73.5 72.7to Deposits
Table ⅡⅡ.12 Financial Indicators of MutualCredits
(Unit: bil. won, %)
Notes: 1) Loan-loss reserve ratio is the ratio of reserved allowances for the credit losses of mutual credits relative to the minimum required allowances for the credit losses.
2) Net income is calculated quarterly.Source: FSS.
2010
1Q 2Q 3Q 4Q
Credit Unions 90.2 97.2 112.3 37.7
Agricultural 742.9 557.1 437.4△241.3
Fisheries 10.7 41.7 15.8 39.6
Forestry △9.5 34.0 9.3 12.4
Total 834.3 730.0 574.8 △151.6
Credit Unions 0.9 0.9 0.9 0.8
Agricultural 1.3 1.2 1.0 0.6
Fisheries 0.3 0.7 0.6 0.7
Forestry △1.0 1.2 1.1 1.1
Credit Unions 8.1 7.5 7.3 6.5
Agricultural 3.8 3.7 3.8 3.1
Fisheries 6.7 6.6 6.7 5.6
Forestry 7.9 7.4 7.7 6.3
Credit Unions 4.0 4.0 4.5 3.8
Agricultural 1.9 1.9 4.0 3.7
Fisheries 3.5 3.5 2.0 2.0
Forestry 3.2 3.2 3.7 3.3
Credit Unions 104.5 104.0 103.8 106.2
Agricultural 163.4 165.6 163.0 180.9
Fisheries 129.5 127.2 122.1 129.6
Forestry 106.4 114.6 110.8 112.7
Credit Unions 3.1 3.2 3.5 3.4
Agricultural 7.6 7.8 7.9 8.0
Fisheries 1.7 2.0 2.2 2.4
Forestry 10.8 10.9 11.3 11.3
Delinquencyratio
Standard& below
loansratio
Loan-lossreserve
ratio
Net capitalratio
Netincome
ROA

3. Securities Industry
Junghan Koo ([email protected])
Assets
The assets of securities companies increased 21.9% to
199.8 trillion won during the fourth quarter of 2010, up
from 164 trillion won in the same quarter last year (Fig-
ure Ⅱ.18). This was attributable to the increase in mar-
ketable securities, especially in bond holdings, which
were up 20.7 trillion won. There was also an increase in
broker’s loans of 5.1 trillion won as well as in cash and
deposits of 6.8 trillion won. Total stockholder’s equity
increased 8.1% to 37.2 trillion won from 34.4 trillion
won over the same period. This is mainly due to the
increase of retained earnings by 1.8 trillion won.
The ratio of securities companies’ asset size to com-
mercial banks’ asset size increased 2.9%p, up from
14.6% in the same quarter of last year. The asset size of
securities companies increased more significantly than
that of commercial banks. However, the HHI index
(market concentration index) of securities companies
was only 312, indicating that big securities companies
did not comprise a large market share.
Profitability
During the fourth quarter, securities companies’ profits
increased 188.9% over the same period last year to 780
billion won (Figure Ⅱ.19), driven by increased broker-
age commissions and fees from asset management ser-
vice. Brokerage commissions went up due to the
increased transaction volumes over the same period. In
addition, some securities companies got unexpected
earnings. However, profits from bond holdings
decreased by 764 billion won compared to the third
quarter of 2010 as interest rates went up from Novem-
ber 2010.
Financial Markets and Industries 45
Figure ⅡⅡ.19 Profits of Securities Companies
Source: FSS.
Figure ⅡⅡ.18 Total Assets of SecuritiesCompanies
Source: FSS.
(Unit: tril. won)
(Unit: bil. won)

Capital Adequacy
The net capital ratio (net capital over total risk, and
indicator of the capital adequacy of securities compa-
nies) fell 37%p from 576% to 539% at the end of the
fourth quarter of 2010 (Figure Ⅱ.20). Despite higher
net operating capital, total risk rose due to the higher
exposure to interest rate risk. The expansion of bond
holdings raised interest rate risk of securities compa-
nies. Although net operating capital went up 11.6%
from 26.4 trillion won as of December 2009 to 29.4 tril-
lion won as of December 2010, total risk amount also
rose 19.2% from 4.6 trillion won to 5.5 trillion won
over the same period.
Outlook
In the second quarter of 2011, the assets of securities
companies are projected to increase. The stock market
is expected to rise because there are not many invest-
ment targets due to sluggish real estate market. Espe-
cially, current inflation rate will make secure assets
such as deposits less attractive to investors. Hence,
money inflow toward risky assets such as stocks and
bonds is expected. The current expansion of asset man-
agement market and retirement pension market will
expand the asset size of securities companies.
Profitability is expected to rise as brokerage commis-
sions will rise due to the rising transaction volumes. In
addition, many investors are hard to find appropriate
investment vehicle. Hence, profits from asset manage-
ment-related service, such as selling wrap accounts and
funds, are expected to rise.
Capital adequacy is likely to remain on the same level.
The increase of profits will push net operating capital
up, but total risk is likely to rise at the same rate. Since
the net capital ratio is well above the FSC’s recom-
mended level of 150%, the capital adequacy of securi-
ties companies will not be an issue in the future.
Korean Economic and Financial Review [April 2011]46
Table ⅡⅡ.13 Total Value of Stock Trading &Commission Income
(Unit: tril. won)
Source: FSS, KRX.
09.4Q(10~12) 10.4Q(10~12)
Total Value of Trading 302 415
Commission Income 1.72 2.22
Figure ⅡⅡ.20 Net Capital Ratio of SecuritiesCompanies
Source: FSS.
(Unit: %)
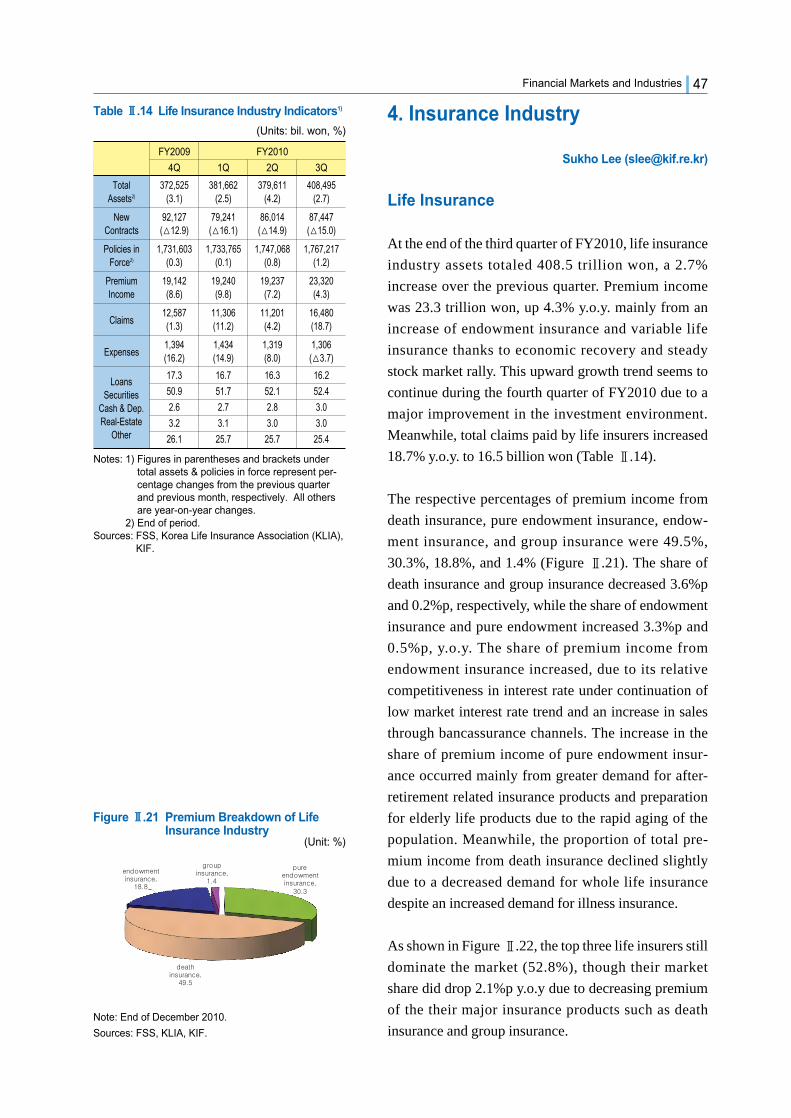
4. Insurance Industry
Sukho Lee ([email protected])
Life Insurance
At the end of the third quarter of FY2010, life insurance
industry assets totaled 408.5 trillion won, a 2.7%
increase over the previous quarter. Premium income
was 23.3 trillion won, up 4.3% y.o.y. mainly from an
increase of endowment insurance and variable life
insurance thanks to economic recovery and steady
stock market rally. This upward growth trend seems to
continue during the fourth quarter of FY2010 due to a
major improvement in the investment environment.
Meanwhile, total claims paid by life insurers increased
18.7% y.o.y. to 16.5 billion won (Table Ⅱ.14).
The respective percentages of premium income from
death insurance, pure endowment insurance, endow-
ment insurance, and group insurance were 49.5%,
30.3%, 18.8%, and 1.4% (Figure Ⅱ.21). The share of
death insurance and group insurance decreased 3.6%p
and 0.2%p, respectively, while the share of endowment
insurance and pure endowment increased 3.3%p and
0.5%p, y.o.y. The share of premium income from
endowment insurance increased, due to its relative
competitiveness in interest rate under continuation of
low market interest rate trend and an increase in sales
through bancassurance channels. The increase in the
share of premium income of pure endowment insur-
ance occurred mainly from greater demand for after-
retirement related insurance products and preparation
for elderly life products due to the rapid aging of the
population. Meanwhile, the proportion of total pre-
mium income from death insurance declined slightly
due to a decreased demand for whole life insurance
despite an increased demand for illness insurance.
As shown in Figure Ⅱ.22, the top three life insurers still
dominate the market (52.8%), though their market
share did drop 2.1%p y.o.y due to decreasing premium
of the their major insurance products such as death
insurance and group insurance.
Financial Markets and Industries 47
Figure ⅡⅡ.21 Premium Breakdown of LifeInsurance Industry
Note: End of December 2010.
Sources: FSS, KLIA, KIF.
TableⅡⅡ.14 Life Insurance Industry Indicators1)
(Units: bil. won, %)
FY2009 FY2010
4Q 1Q 2Q 3Q
Total 372,525 381,662 379,611 408,495Assets2) (3.1) (2.5) (4.2) (2.7)
New 92,127 79,241 86,014 87,447Contracts (△12.9) (△16.1) (△14.9) (△15.0)
Policies in 1,731,603 1,733,765 1,747,068 1,767,217Force2) (0.3) (0.1) (0.8) (1.2)
Premium 19,142 19,240 19,237 23,320Income (8.6) (9.8) (7.2) (4.3)
Claims12,587 11,306 11,201 16,480(1.3) (11.2) (4.2) (18.7)
Expenses1,394 1,434 1,319 1,306(16.2) (14.9) (8.0) (△3.7)
17.3 16.7 16.3 16.2
50.9 51.7 52.1 52.4
2.6 2.7 2.8 3.0
3.2 3.1 3.0 3.0
26.1 25.7 25.7 25.4
Notes: 1) Figures in parentheses and brackets undertotal assets & policies in force represent per-centage changes from the previous quarterand previous month, respectively. All othersare year-on-year changes.
2) End of period.Sources: FSS, Korea Life Insurance Association (KLIA),
KIF.
LoansSecurities
Cash & Dep.Real-Estate
Other
(Unit: %)

The market share of small & medium-sized life insurers
increased by 2.5%p thanks to an increase in sales of
savings type products mainly through new sales chan-
nels such as bancassurance, homeshopping, online
channel, etc. Meanwhile, the market share of foreign
life insurers was down 0.5%p. It is demanded that for-
eign life insurers should diversify their sales channels
more rather than depending too much on bancassurance
channel.
As of the end of December 2010 life insurance industry
operating profits totaled 21.4 trillion won, up 32.9%
over the same period last year. Underwriting profits
increased 65.5% y.o.y. to 9.4 trillion won, while invest-
ment profits saw a 15.2% y.o.y. rise to 12.0 trillion won.
The growth in underwriting profits occurred mainly
due to an increase of 5.5% in operating revenue and a
fall of 4.0% in operating cost y.o.y. On the investment
side, an increase in profits resulted mainly from both
improvement in the investment environment and life
insurers' efficient investment operations. The growth in
investment profit occurred thanks to a sharp fall
(39.1%) in investment cost. Net profits of life insurers
at the end of December of 2010 were 3.1 trillion won, a
42.9% increase y.o.y..
Non-Life Insurance
As of the end of December 2010, non-life insurance
industry assets totaled 99.0 trillion won, a 4.8%
increase over the end of the previous quarter. This was
attributable to growth in investment income from an
upturn in the overall investment environment and con-
tinued growth in long-term non-life insurance. Direct
premiums written in third quarter of FY2010 were up
28.6% y.o.y. to 12.8 trillion won following continued
growth of long-term non-life insurance sales by virtue
of steadily increasing demand for retirement-related
insurance products, and recovery of sales of automobile
insurance (Table Ⅱ.15). Total claims paid by non-life
insurers increased 27.3% y.o.y. to 5,870 billion won.
Meanwhile, total management expenses increased
24.1% y.o.y. to 2,640 billion won.
Korean Economic and Financial Review [April 2011]48
Figure ⅡⅡ.22 Market Share of Life InsuranceIndustry
Note: End of December, 2010.Sources: FSS, KLIA, KIF.
Figure ⅡⅡ.23 Business Performance of LifeInsurance Industry
Note: End of December, 2010.
Sources: FSS, KLIA, KIF.
(Unit: Billion KRW)
(Unit: %)
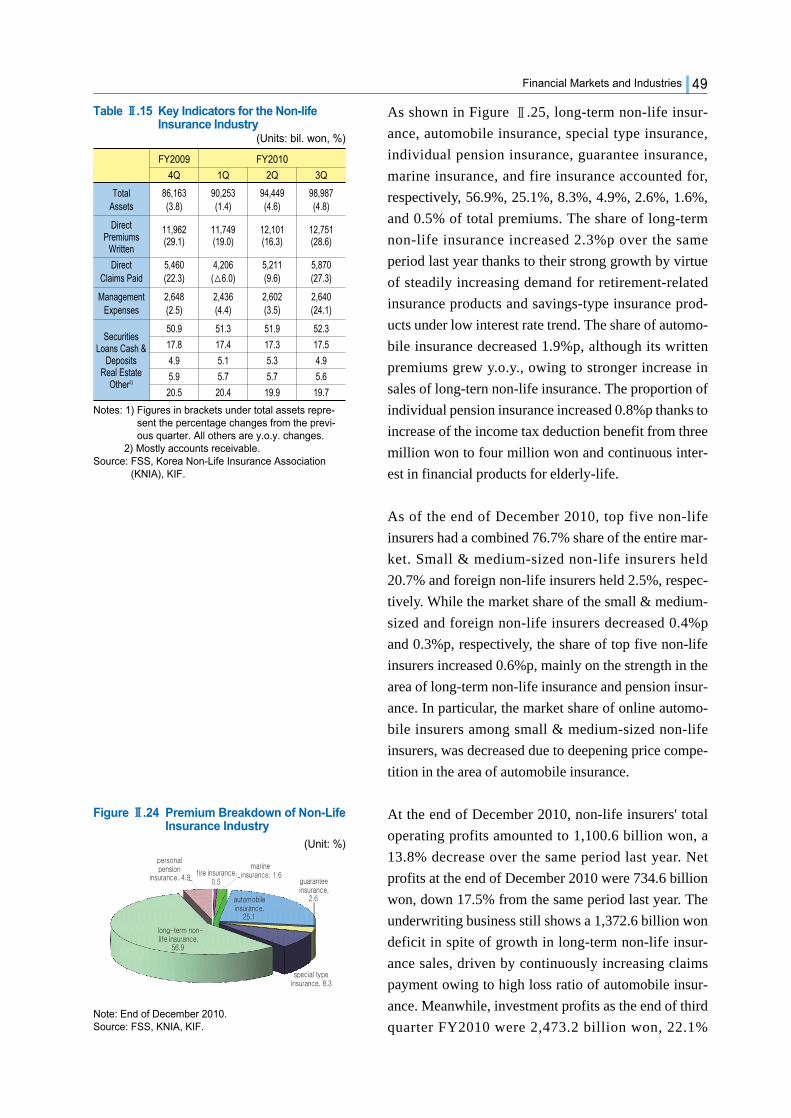
As shown in Figure Ⅱ.25, long-term non-life insur-
ance, automobile insurance, special type insurance,
individual pension insurance, guarantee insurance,
marine insurance, and fire insurance accounted for,
respectively, 56.9%, 25.1%, 8.3%, 4.9%, 2.6%, 1.6%,
and 0.5% of total premiums. The share of long-term
non-life insurance increased 2.3%p over the same
period last year thanks to their strong growth by virtue
of steadily increasing demand for retirement-related
insurance products and savings-type insurance prod-
ucts under low interest rate trend. The share of automo-
bile insurance decreased 1.9%p, although its written
premiums grew y.o.y., owing to stronger increase in
sales of long-tern non-life insurance. The proportion of
individual pension insurance increased 0.8%p thanks to
increase of the income tax deduction benefit from three
million won to four million won and continuous inter-
est in financial products for elderly-life.
As of the end of December 2010, top five non-life
insurers had a combined 76.7% share of the entire mar-
ket. Small & medium-sized non-life insurers held
20.7% and foreign non-life insurers held 2.5%, respec-
tively. While the market share of the small & medium-
sized and foreign non-life insurers decreased 0.4%p
and 0.3%p, respectively, the share of top five non-life
insurers increased 0.6%p, mainly on the strength in the
area of long-term non-life insurance and pension insur-
ance. In particular, the market share of online automo-
bile insurers among small & medium-sized non-life
insurers, was decreased due to deepening price compe-
tition in the area of automobile insurance.
At the end of December 2010, non-life insurers' total
operating profits amounted to 1,100.6 billion won, a
13.8% decrease over the same period last year. Net
profits at the end of December 2010 were 734.6 billion
won, down 17.5% from the same period last year. The
underwriting business still shows a 1,372.6 billion won
deficit in spite of growth in long-term non-life insur-
ance sales, driven by continuously increasing claims
payment owing to high loss ratio of automobile insur-
ance. Meanwhile, investment profits as the end of third
quarter FY2010 were 2,473.2 billion won, 22.1%
Financial Markets and Industries 49
Figure ⅡⅡ.24 Premium Breakdown of Non-LifeInsurance Industry
Note: End of December 2010.Source: FSS, KNIA, KIF.
(Unit: %)
TableⅡⅡ.15 Key Indicators for the Non-lifeInsurance Industry
(Units: bil. won, %)
FY2009 FY2010
4Q 1Q 2Q 3Q
Total 86,163 90,253 94,449 98,987Assets (3.8) (1.4) (4.6) (4.8)
Direct Premiums
11,962 11,749 12,101 12,751
Written (29.1) (19.0) (16.3) (28.6)
Direct 5,460 4,206 5,211 5,870Claims Paid (22.3) (△6.0) (9.6) (27.3)
Management 2,648 2,436 2,602 2,640Expenses (2.5) (4.4) (3.5) (24.1)
50.9 51.3 51.9 52.3
17.8 17.4 17.3 17.5
4.9 5.1 5.3 4.9
5.9 5.7 5.7 5.6
20.5 20.4 19.9 19.7
Notes: 1) Figures in brackets under total assets repre-sent the percentage changes from the previ-ous quarter. All others are y.o.y. changes.
2) Mostly accounts receivable.Source: FSS, Korea Non-Life Insurance Association
(KNIA), KIF.
Securities Loans Cash &
DepositsReal Estate
Other2)

increase over the same period last year due to an
increase in operating assets and improvement in finan-
cial market environments.
Outlook
Total assets and premium income of the life insurance
industry in the first quarter of FY2011 are expected to
grow due to an upturn in sales of variable life insurance
and continued inflow in premium income from savings
type insurance. Meanwhile, for variable life insurance,
the life insurers need to consider a possibility of
increasing volatility of stock prices, which is critical
aspect in sales of variable life insurance. The growth of
pension insurance should be continued thanks to on-
going or expected deregulation related to pension
insurance products. In addition, endowment insurance
is expected to maintain the growth trend as well. While
competition in the area of retirement pension is
expected to become fiercer than ever before, life insur-
ers should not rush into reckless external expansion
competition.
The surrender & lapse rate of life insurance contract
seems to be gradually stable, and the contract retention
rate is also expected to improve alongside the economic
recovery. The performance of investment business is
expected to improve more as the financial market envi-
ronment continues to stabilize. In addition, interest
gains on interest-related assets of life insurers are
expected to increase as market interest rate is forecast
to rise. However, life insurers should be alert to the pos-
sibility of an appraisal loss in stocks & bonds and a rise
in loan delinquency as interest rate goes up.
During the first quarter of FY2011, non-life insurance
companies are expected to continue the growing trend.
In particular, long-term non-life insurance sales should
continue to grow thanks to steadily increasing demand
for retirement-related insurance products. However,
non-life insurers should alert and control loss ratio of
long-term non-life insurance, which has been showing
somewhat increasing trend since the second half of the
year 2009. For automobile insurance, while improve-
Korean Economic and Financial Review [April 2011]50
Figure ⅡⅡ.25 Market Share of Non-LifeInsurance Industry
Note: End of December 2010.Source: FSS, KNIA, KIF.
(Unit: %)
Figure ⅡⅡ.26 Business Performance of Non-Life Insurance Industry
Note: End of December 2010.Source: FSS, KNIA, KIF.
(Unit: Billion KRW)
ment in sales performance during the first quarter of
2011 is expected, there exist some negative factors such
as difficulty in additional rise of premium rate, increas-
ing uncertainty in domestic & global economic envi-
ronments, and a growing price competition. The loss
ratio of automobile insurance is expected to decrease
thanks to a rise in premium rate and a decrease in oper-
ation of an automobile due to rising oil prices. On the
investment business side, non-life insurers are expected
to see more improved returns from the better invest-
ment environment and stable asset management. In
addition, non-life insurers, like life insurers, are
expected to benefit from rising market interest rate.
Meanwhile, it is expected that the recent huge earth-
quake in Japan will have only minimal impact in
Korean insurance industry. However, an increase in
reinsurance premium rate for the time being in future
should be unavoidable the entire reinisurance market
globally.
Financial Markets and Industries 51

Korean Economic and Financial Review [April 2011]52
A. Korea's Credit Card System& Potential Measures
Jae-Youn Lee ([email protected])
1. Introduction
Korea’s credit card market (including debit cards) took
off following the 1998 currency crisis, buoyed by gov-
ernment policies designed to spur consumption and
make taxable income more transparent. The govern-
ment introduced income deductions to individuals for
credit card use, and required merchants to become
credit card merchant members and accept card pay-
ments.
Korea’s payment card settlements as a share of private
consumption (goods and services purchases) was just
23.6% in 2000, but with the implementation of these
policies designed to stimulate credit card use, this fig-
ure rose sharply, reaching and 65.4% by the end of
2010. Korea’s credit card usage as a share of GDP was
36.2% as of the end of 2009, sharply higher than that of
other countries such as the US (13.7%) and Canada
(18.9%), but the same figure for direct payment and
check card usage was just 3.4%, below that of the US
(10.3%) and Canada (11.2%).
However, while growth and competition in the credit
card market led to an expansion in benefits for card user
members, the costs of these benefits have been exces-
sively passed on to merchant members, sparking com-
plaints especially from small merchants.
This paper shall examine the issues facing the Korean
credit card market by comparing two different types of
credit card systems to explore measures for resolving
the persistent dissatisfaction among merchant mem-
bers, despite merchant fees being lowered multiple
times since 2007.
Ⅲ. Current Issues 3
Table ⅢⅢ.1 Credit & Debit Card Use/PrivateConsumption
(Unit: 100 billion won, %)
Note: 1) Excludes cash service and corporate purchas-ing cards.
Source: Credit Finance Association (CFA), BOK.
2000 2001 2003 2005 2007 2008 2009 2010
CreditCards 778.7 1,342.3 1,705.3 1,904.7 2,410.8 2,793.1 3,039.4 3,506.9(A)1)
DebitCards 1.1 1.0 0.6 79.5 189.1 268.6 365.1 518.2
(B)
Private Consu 3,303.8 3,642.5 4,200.9 4,654.3 5,302.6 5,616.2 5,759.7 6,154.0mption
(C)
(A+B)/C 23.6 36.9 40.6 42.6 49.0 54.5 59.1 65.4
Table ⅢⅢ.2 Credit & Debit Card Use/GDP in2009
(Unit: %)
Note: 1) 2008 dataSource: The Bank for International Settlements (BIS),
BOK.
Korea US UK CanadaGerm Switzer
Japanany land
Credit Cards
36.2 13.7 7.7 18.9 0.5 4.9 8.41)
DebitCards
3.4 10.3 19.8 11.2 4.8 10.3 0.2

2. Problems with the transactionScheme in Korean Credit Cards
1) Problems with the Credit Card Market
In Korea, a highly competitive market structure has
formed to attract credit card user members. As of the
end of March 2011, there are 9 credit card networks and
21 issuers, and the number of credit cards held is at 4.5
cards per member of the economically active popula-
tion. This means that the credit card market is saturated.
As a result, credit card companies including banks offer
customers points, mileage, discount services, no-inter-
est installment services and annual fee exemptions in
order to entice them to use their cards.
Nevertheless, In under the market structure thus far
formed, there is almost no need to compete for mer-
chant members. Since the government policy makes it
effectively mandatory for merchants to be card mem-
bers and accept card payments, credit card companies
have a little need to compete for merchant members.
With such a market structure in place, smaller merchant
members have complained that credit card companies
pass on most of the expenses for syste ms maintenance
and marketing to the card user offering added members
on to them by maintaining high merchant fees.
Credit card companies hold greater bargaining power
over prices with most smaller merchants, but low
power with larger ones. Thus, large marts' merchant
fees are from 0.5%~1.5%, much lower than the average
fees (2.33% in 2006) because of the competition among
card companies. This lowers the card companies'
capacity to bring down smaller merchants fees.
2) Pros and Cons of Korea’s 3-Party Scheme
Under the 3-party scheme, individual credit card com-
panies recruit members and issue cards, but having to
separately recruit merchants entails high expenses on
merchant recruiting and management.
53Current Issues
Table ⅢⅢ.3 Credit Card Companies in Korea
Number Company Name
Bank BC, Shinhan, KDB subsidiary 4 Capital, Hana SK, KB,
Non-bank 3 Samsung, Hyundai, Lottesubsidiary
KEB Card 1 KEB
NACCP 1 NACCP
Shinhan Card and 4 Shinhan, Cheju, Suhyup,
alliance Chonbuk, Kwangju
IBK, KB, NACCP, Cheil, BC Card 11 Hana, Woori, Daegu, Members Busan, Kyongnam,
Citi Korea, Shinhan
Credit CardCompany
Card IssuingBank

Korean Economic and Financial Review [April 2011]54
As of the end of 2010, each of 9 credit card networks
had agreed on merchant contracts with around 2.9 mil-
lion merchants, and while 500,000 of these merchants
close their doors annually, 500,000 new contracts are
also agreed to.
Conversely, under the 4-party scheme, credit card com-
panies handle issuance and acquisition separately, so
issuers can issue joint brand credit cards, and acquirers
can jointly use the recruited merchant members. Hence,
while it is very hard for new credit card companies to
enter under the 3-party scheme, it is easier under the 4-
party scheme.
Under the 3-party scheme, since merchants are only
able to ask for acquisition of transactions to the relevant
credit card company, they have low bargaining power
in the determining of the merchant fees, that is, the cost
of processing credit card transactions. It is in reality
obligatory for merchants to join and accept credit card
payment, and since the relevant card companies can
pay for the goods in place of the customer, these com-
panies hold the power to determine the merchant fees.
Conversely, under the 4-party scheme, merchants can
choose the acquiring bank that acquires transactions, so
they can choose one that offers them better terms.
Under the 3-party scheme, since card companies can
impose most of the transaction costs on merchants, they
compete by trying to entice customers to use their cards
through offering services such as points, mileage, dis-
counts, and no-interest installment plans based on
usage amount.
But under the 4-party scheme, network companies like
Visa and MasterCard set the interchange fees that deter-
mine merchant fees, so they can control to some extent
the marketing expense of card issuers on behalf of cus-
tomers.
Figure ⅢⅢ.2 Settlement Flow Chart in a 4-Party Scheme
Figure ⅢⅢ.1 Settlement Flow Chart in a 3-Party Scheme

3. Mandating a Merchant MemberPool System
Introducing a 4-party scheme by consolidating the nine
card networks into one or two networks and switching
existing card companies to issuers would help ease prob-
lems for merchant members. Merchant members would
be able to seek out and transact with acquirers that offer
them more favorable terms and lower merchant fees.
However, each card company possesses around 2 mil-
lion merchant members, so it will not be easy to have
them give up their merchant members and switch to
being issuers.
Thus for the card companies, mandating a merchant
member pool system can help improve bargaining
power over large merchants. Since large merchants
would have to accept all credit cards regardless of
whether they are their merchant member or not and an
industry-specific interchange fee would be applied, card
companies would be able to decline requests by large
merchants for an excessive lowering of merchant fees.
However, currently, virtually all merchant members fear
being put at a disadvantage and hence sign individual
contracts with credit card companies, so there is almost
no use of a compulsive merchant member pool system.
Under the current merchant member pool system,
acquiring transactions from affiliated merchant members
are handled electronically, with payment taking 1-3 days,
but acquiring transactions from non-affiliated merchant
members are handled manually and this has the disad-
vantage of taking 6 days or more to settle the payment.
Therefore, it is necessary to stimulate the use of the
merchant member pool system by removing such
inconveniences such as time lags when disbursing pay-
ment for non-contracted credit card receipts.
The merchant member pool system may allow us to
enjoy the benefits of the 4-party scheme while main-
taining the current 3-party scheme.
55Current Issues
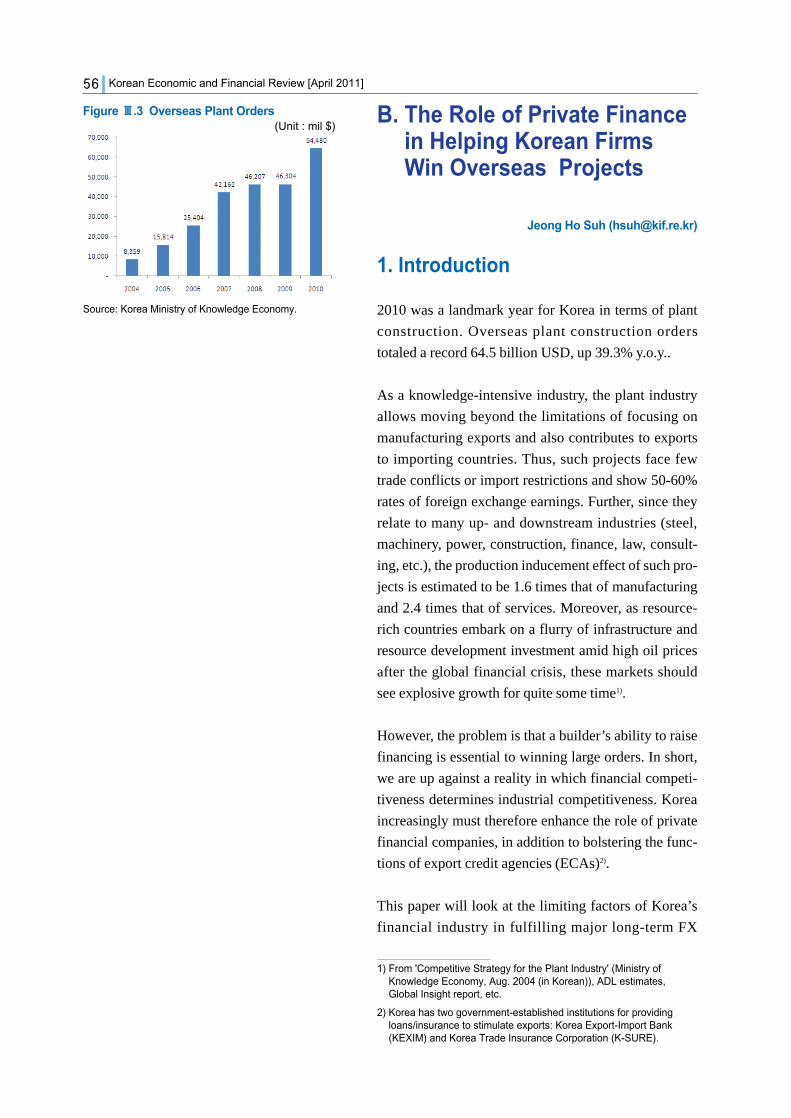
Korean Economic and Financial Review [April 2011]56
B. The Role of Private Financein Helping Korean FirmsWin Overseas Projects
Jeong Ho Suh ([email protected])
1. Introduction
2010 was a landmark year for Korea in terms of plant
construction. Overseas plant construction orders
totaled a record 64.5 billion USD, up 39.3% y.o.y..
As a knowledge-intensive industry, the plant industry
allows moving beyond the limitations of focusing on
manufacturing exports and also contributes to exports
to importing countries. Thus, such projects face few
trade conflicts or import restrictions and show 50-60%
rates of foreign exchange earnings. Further, since they
relate to many up- and downstream industries (steel,
machinery, power, construction, finance, law, consult-
ing, etc.), the production inducement effect of such pro-
jects is estimated to be 1.6 times that of manufacturing
and 2.4 times that of services. Moreover, as resource-
rich countries embark on a flurry of infrastructure and
resource development investment amid high oil prices
after the global financial crisis, these markets should
see explosive growth for quite some time1).
However, the problem is that a builder’s ability to raise
financing is essential to winning large orders. In short,
we are up against a reality in which financial competi-
tiveness determines industrial competitiveness. Korea
increasingly must therefore enhance the role of private
financial companies, in addition to bolstering the func-
tions of export credit agencies (ECAs)2).
This paper will look at the limiting factors of Korea’s
financial industry in fulfilling major long-term FX
Figure ⅢⅢ.3 Overseas Plant Orders
Source: Korea Ministry of Knowledge Economy.
(Unit : mil $)
1) From 'Competitive Strategy for the Plant Industry' (Ministry ofKnowledge Economy, Aug. 2004 (in Korean)), ADL estimates,Global Insight report, etc.
2) Korea has two government-established institutions for providingloans/insurance to stimulate exports: Korea Export-Import Bank(KEXIM) and Korea Trade Insurance Corporation (K-SURE).

funding demand to support plant exports, and discuss
ways of enhancing the role of private finance.
2. The Role of ECAs
Although government subsidies for export firms are
strictly limited under the WTO, public credit provided
by ECAs is usually exempted from regulation. As a
result, ECAs provide both capital for special purpose
vehicles (SPVs), as well as direct loans and external
debt guarantees (insurance) for participating firms, as
well as loans for suppliers.
For this reason, it is quite natural for another country’s
ECA to take the lead role for large-scale offshore rig
projects, while competition among countries to expand
financing for their local companies’ overseas invest-
ment and resource development is fierce. Recently,
Japan dramatically raised the amount of overseas
investment limit approved for the Japan Bank for
International Cooperation (JBIC) in order to secure sta-
ble energy and mineral resources. Further, in December
2010, it was reported that the ruling Democratic Party
of Japan considered separating the JBIC from its affili-
ated Japan Finance Corporation (JFC) and carrying out
measures to extend JBIC’s funding from mainly devel-
oping country projects to advanced nation projects as
well. That is, given that countries’ ECAs are involved
in everything from the structuring of and supply of
funding for major projects to building broad coopera-
tive ties with governments and helping win orders,
strengthening the functions of Korea’s ECAs is thought
of as an urgent task. At the same time, the role of pri-
vate financial companies is becoming more important
in regards to project financing.
3. Incubating Private Finance:Necessity & Limitations
The reason that private financial companies’ role is
becoming more critical is firstly that ECAs are not able
to provide unlimited financial support to exporters or
57Current Issues
Figure ⅢⅢ.4 A Typical Structure of ProjectFinancing for Overseas PlantExports
Source: Japan Bank for International Cooperation (JBIC).

other financial companies. With government funding
support limited, this necessarily constrains how much
FX funding can be borrowed. As a result, the need to
foster the private financial sector, such as commercial
banks and pension funds, has naturally been emerging.
Secondly, private financial companies serve as stronger
drivers than ECAs in terms of the efficient allocation
and administering of capital. With an active profit
motive, they are likely to outperform ECAs in terms of
structuring projects, follow-up, and risk assessment.
For these reasons, ECAs in advanced economies are
strictly limited to a complementary function for market
failures that avoids competition with the private finan-
cial sector.
2009 project financing figures reveal that French and
Japanese commercial banks held the top positions,
while Korean banks’ performance was relatively poor.
Why have Korean financial companies been unable to
show competitiveness in mid-/long-term export finance
such as plant export financing?
Firstly, private financial companies’ participation may
not be all that profitable. Many project contractees had
higher credit ratings than Korean financial companies,
making for low expected returns versus financing costs.
Further, for private sector participation, average total
project financing costs were higher, which increased
the chances that it would separate it from the bidding
competition.
Secondly, Korean financial companies are not adept at
long-term financing. Normally, large-scale plant con-
struction projects take over 10 years, while financing
FX funds for durations of over 10 years at competitive
interest rates is quite difficult for Korean financial com-
panies. This will also create a duration mismatch
between financing and fund usage. In addition, since
funds are raised through floating rates and invested at
fixed rates, this will also let financial companies
exposed to interest rate risk.
Korean Economic and Financial Review [April 2011]58
Table ⅢⅢ.4 2009 Project Financing LeagueTable
Note: 1) Global initial mandated lead managerSource: PFI magazine.
Mandated Arrangers1) US$(m)No ofdeals
1 State Bank of India 19,944.9 37
2 Calyon 7,359.6 80
3 BNP Paribas SA 5,836.1 63
4 Societe Generale 4,283.7 51
5 Sumitomo Mitsui Finl Grp Inc 4,025.1 40
6 IDBI Bank Ltd 3,989.2 11
7 Mitsubishi UFJ Financial Group 3,875.6 52
8 BBVA 3,641.3 54
9 Santander 3,344.4 55
10 Mizuho Financial Group 2,819.4 26
11 Standard Chartered PLC 2,805.9 21
12 Natixis 2,755.9 33
44 Korea Development Bank 637.2 8
83 KB Financial Group Inc 253.1 3
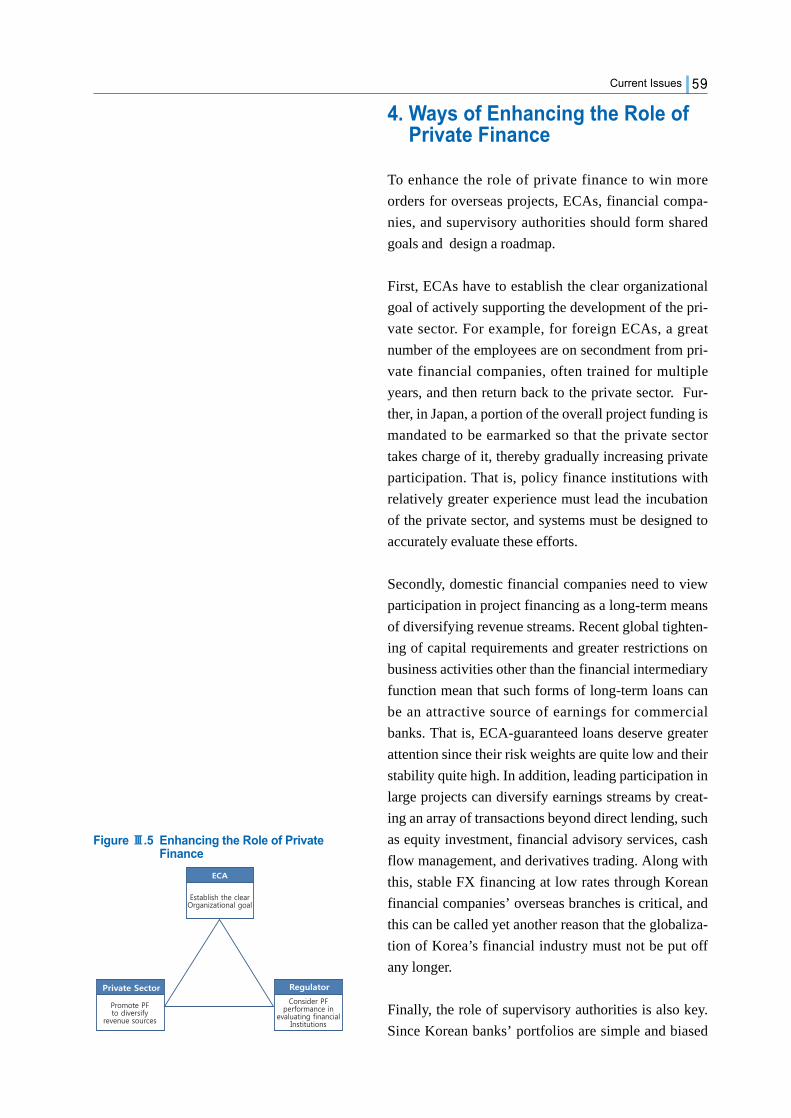
4. Ways of Enhancing the Role ofPrivate Finance
To enhance the role of private finance to win more
orders for overseas projects, ECAs, financial compa-
nies, and supervisory authorities should form shared
goals and design a roadmap.
First, ECAs have to establish the clear organizational
goal of actively supporting the development of the pri-
vate sector. For example, for foreign ECAs, a great
number of the employees are on secondment from pri-
vate financial companies, often trained for multiple
years, and then return back to the private sector. Fur-
ther, in Japan, a portion of the overall project funding is
mandated to be earmarked so that the private sector
takes charge of it, thereby gradually increasing private
participation. That is, policy finance institutions with
relatively greater experience must lead the incubation
of the private sector, and systems must be designed to
accurately evaluate these efforts.
Secondly, domestic financial companies need to view
participation in project financing as a long-term means
of diversifying revenue streams. Recent global tighten-
ing of capital requirements and greater restrictions on
business activities other than the financial intermediary
function mean that such forms of long-term loans can
be an attractive source of earnings for commercial
banks. That is, ECA-guaranteed loans deserve greater
attention since their risk weights are quite low and their
stability quite high. In addition, leading participation in
large projects can diversify earnings streams by creat-
ing an array of transactions beyond direct lending, such
as equity investment, financial advisory services, cash
flow management, and derivatives trading. Along with
this, stable FX financing at low rates through Korean
financial companies’ overseas branches is critical, and
this can be called yet another reason that the globaliza-
tion of Korea’s financial industry must not be put off
any longer.
Finally, the role of supervisory authorities is also key.
Since Korean banks’ portfolios are simple and biased
59Current Issues
Figure ⅢⅢ.5 Enhancing the Role of PrivateFinance

towards household lending and short-term corporate
lending, diversifying earnings streams and encouraging
overseas business for future growth is highly meaning-
ful. Supervisory authorities should provide incentives
when evaluating performance of financial companies
with strong records in overseas project finance, and
help financial companies strengthen their risk manage-
ment capabilities.
C. Policy Agenda for DomesticBanks' Foreign Expansion
Christopher Byungho Suh ([email protected])
1. Background
The demand for international banking, for examples,
financing, FX hedging and cash management service is
very large in Korea as its economy depends highly
upon international trade. However, domestic banks are
not globalized enough to meet those demands. More-
over, And the economy itself is vulnerable to foreign
exchange liquidity because of the fact that domestic
banks have no stable funding source aboard.
Therefore, it is imperative for the Korean government
to encourage domestic banks’ globalization through
foreign expansion. And it would be necessary for
domestic banks to expand abroad for sustainable
growth considering the fact that domestic market is
highly saturated.
2. Institutional Environment forDomestic Banks' ForeignExpansion
The institutional environment for domestic banks’ for-
eign expansion has recently improved as the govern-
ment exempted qualified domestic banks from the
screening process of opening up a new branch or sub-
Korean Economic and Financial Review [April 2011]60

sidiary abroad. The Korean Banking Law has been
revised last year such that only an ex-post notification
to the Financial Supervisory Committee (FSC) is
required for the installation of a foreign branch or sub-
sidiary if and only if all of the following conditions are
me the BIS capital adequacy ratio exceeds 10% the
overall rating from the Financial Supervisory Service
(FSS) is level 2 or higher, the installation does not
involve acquiring an institution with a credit rating of
B+ or lower, the installation does not involve opening
up a business line that is not allowed for Korean banks
or has not been conducted before the installation does
not involve entering into a country with a the credit rat-
ing of or B+ or lower and the installation does not
involve entering into a country that has not established
diplomatic relations with Korea.
However, there is more room to improve regarding the
institutional environment for domestic banks’ global-
ization. When a domestic bank attempts to acquire for-
eign banks using a tender offer, it needs to disclose its
intention, stock type and number, purchase terms, fund-
ing method and the purchasing agreement. Further-
more, it is impossible for a domestic bank to change the
purchase condition by lowering the acquisition price or
by extending the bargaining period because of article
136 and 145 of the Financial Investment Services and
Capital Markets Act (FSCMA). On the other hand,
domestic banks headquartered in the USA or the EU
need only to follow local regulations regarding tender
offer acquisition abroad because their governments
have exempted them from the domestic regulation in
case of cross-border acquisitions. This difference may
cause problems for domestic banks because they have a
comparative disadvantage in tender offer. And foreign
banks without such obligation will avoid co-investment
with domestic banks in tender offer investment because
the domestic regulation may jeopardize the whole
investment project.
Moreover, foreign subsidiaries of domestic banks need
to provide collateral when they borrow money from
their parent company according to article 22 and 48 of
the Financial Holding Company Law, whereas such
61Current Issues

obligation does not apply when the parent company
holds more than 80% of the total stake. The problem is
that most foreign investment involves investment con-
sortium, which ends up with stock ownership less than
80%. This may be problematic for the foreign operation
of domestic banks especially because they need funds
from their parent company as a small scale startup oper-
ation. And it also weakens domestic banks’ competitive
power abroad because US or EU banks do not follow
such obligation.
In addition, each foreign branch or subsidiary of
domestic bank is subject to evaluation from the FSS as
an independent entity. And the evaluation standard is
the same for each operation. This may cause trouble
because each operation is different in its local license,
history, size and business model. For example, it does
not make sense to evaluate a foreign branch with no
license to collect deposit based on its loan to deposit
ratio or newly opened branch based on profitability.
The US or EU governments do not evaluate different
foreign operations against the same standard.
It would be more reasonable to let domestic banks to
evaluate their own foreign operations, and the govern-
ment to evaluate the evaluation system of each bank.
Inspection of specific operations may be needed only
when there is an issue there.
Most of all, Korean banks are required to keep their
loan exposure to each foreign country below 10%
according to the FSS guideline. Therefore, a large scale
acquisition of foreign bank is practically impossible.
3. Evaluation of Domestic Banks'Foreign Expansion
The globalization measure for domestic banks is miser-
able. The representative measure of globalization
would be the Transnationality Index (TNI), which is
calculated as the average of foreign asset to total asset
ratio, foreign revenue to total revenue ratio and number
of foreign workers to total workers ratio. As of 2010,
the TNI of domestic banks is 2.9%, whereas it is 76.5%
Korean Economic and Financial Review [April 2011]62
Table ⅢⅢ.5 Performance of Domestic Banks'Foreign Operations
(Unit: billion USD, %)
Source: FSS, BOK.
2005 2006 2007 2008 2009
Total Assets 34.4 46.7 50.7 53.8 56.5
ROA 1.27 1.08 0.62 0.56 0.61
Substandardand Below 0.50 0.47 0.60 1.60 1.60Loans to
Total Loans

for UBS, 75.2% for Deutsche Bank, 64.7% for HSBC
and 43.7% for Citigroup. Even regional banks such as
Credit Agricole (37.4%) and Mitsubishi UFJ (28.9%)
have a wide difference with the domestic banks.
Domestic banks have started to increase their foreign
exposure, but the performance of domestic banks’ for-
eign operations is worsening. Domestic banks’ foreign
assets have increased from 34.4 billion dollars in 2006
to 56.5 billion dollars in 2010. However, the average
return on asset (ROA) has decreased from 1.27% in
2006 to 0.61% in 2010 mostly because of bad loans.
The sub-standard and below loans to total loans ratio
has increased from 0.50% in 2006 to 1.60% in 2010.
The recent slump in of foreign operations may stem
from the worsened local economy in the aftermath of
the global financial crisis. Since a large part of their
revenues came from loans to domestic companies’ for-
eign operations, their performance has also been
affected by the recent project financing crisis in Korea.
Moreover, foreign operations in China have suffered an
increase in costs as they were turned into subsidiaries
instead of branches.
Domestic banks have increased foreign subsidiaries for
localization, but most localization measures have wors-
ened. The ratio of the number of foreign subsidiaries to
the number of total foreign operation has increased
from 25.8% in 2008 to 31.5% in 2010, but the transna-
tionality index has decreased from 5.2% in 2007 to
3.6% in 2010. The local customers to total customers
ratio has decreased from 63.5% in 2008 to 63.2% in
2010, and the local funding to total funding ratio
35.1% in 2008 to 34.6% in 2010. This is because
domestic banks increased the number of local sub-
sidiaries by turning existing branches into subsidiaries
without acquiring local banks. And existing foreign
operations focused on stabilizing the business as the
asset quality worsened after the global financial crisis.
63Current Issues
Table ⅢⅢ.6 Localization Measure of DomesticBanks' Foreign Operations
(Unit: %)
Note: 1) (number of local subsidiaries/ number of over-seas branches) * 100
2) [(overseas branch assets / bank assets) +(overseas branches profit / Bank total profit) +(number of overseas branches / total number ofbanks)] * 100 / 3
Source: FSS.
Local Local Local Subsidiary Customers Funding TNI2)
Ratio1) Ratio Ratio
2007 N/A N/A N/A 5.2
2008 25.8 63.5 35.1 3.0
2009 30.2 64.3 34.3 2.7
2010 31.3 63.2 34.6 3.6

4. Policy Agenda for DomesticBanks' Foreign Expansion
Korean government has to improve the institutional
framework for domestic banks to expand abroad.
Firstly, it should abolish the 10% country limit for loan
portfolios so that domestic banks may acquire local
banks. Secondly, the domestic tender offer regulation
should not apply to cross-border acquisitions because it
limits domestic banks’ acquisition strategy choice.
Thirdly, the 80% rule for collateral requirement
between a subsidiary and its parent company should be
relaxed so that consortium investments are not penal-
ized. Fourth, the supervision of foreign operation
should focus on each bank’s management system of
foreign operation considering the limitation of the
inspection personnel.
Lastly, the Korean government should keep in mind
that global banks have grown through a series of cross-
border acquisitions and that successful investments
were the result of trial and error. It should promote chal-
lenging so that domestic banks can leap forward. Even
if some investments turn out to be unsuccessful, the
next investments will be more likely to be successful
because of the lessons learned from the past failures.
Korean Economic and Financial Review [April 2011]64
4-1 Myung-Dong 1-Ga, Seoul, 100-021, KoreaTEL : +82-2-3705-6108 FAX : +82-2-3705-6285