KEEPING PACE WITH THE SUPER CONSUMER - … pace with the super consumer the foresee e-retail...
29
© 2012 ForeSee KEEPING PACE WITH THE SUPER CONSUMER THE FORESEE E-RETAIL SATISFACTION INDEX (SPRING TOP 100 EDITION) May 9, 2012 Commentary and Analysis By: Larry Freed, President and CEO of ForeSee Research By: Rhonda Berg, Research Manager, ForeSee
-
Upload
truongliem -
Category
Documents
-
view
225 -
download
2
Transcript of KEEPING PACE WITH THE SUPER CONSUMER - … pace with the super consumer the foresee e-retail...
© 2012 ForeSee
KEEPING PACE WITH THE SUPER CONSUMER
THE FORESEE E-RETAIL SATISFACTION INDEX (SPRING TOP 100 EDITION)
May 9, 2012
Commentary and Analysis By:Larry Freed, President and CEO of ForeSee
Research By: Rhonda Berg, Research Manager, ForeSee
FORESEE E-RETAIL SATISFACTION INDEX (SPRING TOP 100 EDITION 2012)
Satis
fact
ion
Scor
e (1
00-p
oint
sca
le)
80
79
78
77
76
75
74
73
72
71
70
2007 2008 2009 2010 2011 2012
787878
73
75
74
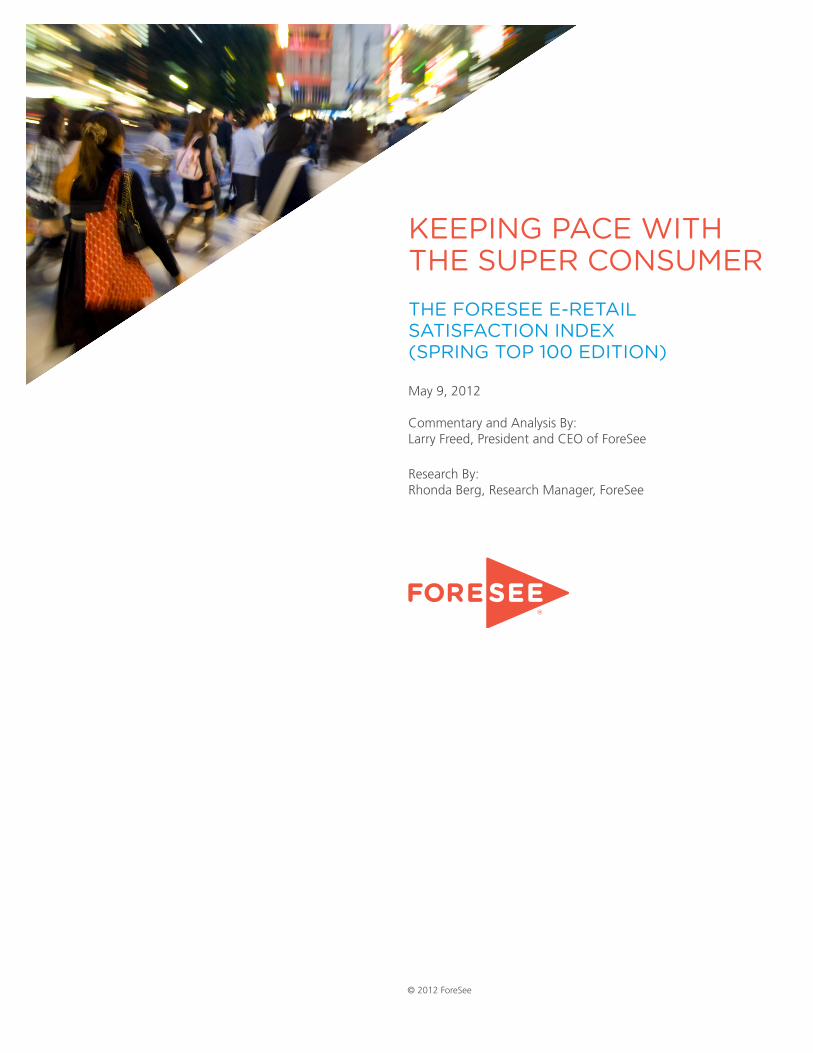
SATISFACTION STAGNATES
SATISFACTION MATTERS!
Companies with high customer satisfaction scores have blown the S&P 500 out of the water . . .— Havard Business Review
A highly satisfied visitor to an e-retail site is
72% more likely to purchase online
56% more likely to purchase offline
69% more likely to recommend the retailer1
THE WINNERS
HIGHEST-SCORING RETAILERS
BY CATEGORY
Apparel & Accessories
83L.L. Bean
Books, Music & Video
82 Barnes & Noble
82 Scholastic
Computers & Electronics
85 Apple
Food & Drug
84 Keurig
Hardware/Home Improvement
80 Northern Tool
Mass Merchants
89Amazon
Other
80 Edible Arrangements
Specialty
82Oriental Trading
1) These percentages are based on comparisons of likelihood scores for highly-satisfied site visitors (scoring satisfaction 80 or higher) compared to dissatisfied site visitors (scoring 69 or lower).
All data from the ForeSee E-Retail Satisfaction Index (Spring 2012 Edition).
FORESEE RATES TOP 100 E-RETAILERS
FORESEE E-RETAIL SATISFACTION INDEX (SPRING TOP 100 EDITION 2012) 3
EXECUTIVE SUMMARY For the eighth year, ForeSee has conducted the Spring Top100 edition of the ForeSee E-Retail Satisfaction
Index, an analysis of customer satisfaction with the top 100 online retailers in the United States. The list
of the top 100 e-retailers is determined by the 2012 Internet Retailer Top 500 Guide. This revealing report,
the result of almost 21,000 responses from visitors to the top 100 retail sites, allows for year-over-year
comparisons of both industry average satisfaction and satisfaction with individual retailers.
Key findings of this year’s research are further explored in the following report and include:
> Satisfaction plateaus: Overall satisfaction scores with the top e-retailers is stable. In 2010, there was
an increase in customer satisfaction from 2009 when the average score jumped from 73 (its lowest
point) to a record high of 78 as e-retailers rebounded from the sluggish economy. They haven’t
budged since, and overall satisfaction remains at 78.
> Amazon sets the standard: Amazon continues to set the standard for e-retailers. After grabbing the
top spot from Netflix last year, Amazon (89) remains the leader of the pack, improving three points
from 2011’s score of 86. Amazon’s score sets a record as the highest score ever attained by a retailer
measured in this Index.
> Netflix rebounds (a little): After slipping to an all-time low (79) during the holiday season, Netflix
regained some footing to score an 81. It still has a lot of work to do in order to return to its former
glory and list-leading score of 87 from two years ago.
> Satisfaction winners: This year’s top-performing e-retailers on this Index include Amazon, Apple,
QVC, L.L. Bean, Avon, and Keurig.
> Customer satisfaction matters: Compared to dissatisfied site visitors, satisfied visitors say they
are 72% more likely to purchase online, 56% more likely to purchase offline, 67% more likely to
purchase from that retailer next time they’re in the market for a similar product (a good proxy for
loyalty), and 69% more likely to recommend the retailer to someone else.
FORESEE E-RETAIL SATISFACTION INDEX (SPRING TOP 100 EDITION 2012) 4
INTRODUCTION
There’s no denying the significant impact the web has had in the retail industry and on how customers
shop today. Although retailers have come a long way in understanding consumer behavior, the truth is that
many are still trying to figuring out how to deal with the 21st century shopper. Gone are the days when a
customer drove to a store location during business hours, viewed the merchandise in person and, on a good
day, asked a sales representative a few questions about the different products sitting on the shelf before
making an educated purchase.
Today, consumers wield unprecedented power in the marketplace. They can shop anywhere at any time
and they have a multitude of resources literally at their fingertips – web, mobile, email, social media. They
have the ability to clone themselves by shopping in five stores at once through the use of a multi-tabbed
web browser. With the use of a smart phone, they can walk down an aisle of one store and teleport a sales
representative from a competing store or several representatives from several stores to assist them in finding
the best products at the best prices.
Consumers nowadays also speak with incredibly loud voices, posting their shopping experiences – good
or bad – to Facebook and Twitter. Their hearing is acute and refined; they listen to the millions of voices
expressing opinions and recommendations about products and companies through social media. Their
knowledge is practically limitless. Thanks to the available custom-generated product reviews and detail
specifications, many shoppers know as much or even more than store employees by the time they are ready
to make a purchase. More impressively, these super consumers can perform all these feats at one time.
Technology continues to move at lightning speed, and that means shoppers are only going to get smarter,
faster, and more powerful. That’s why it’s imperative for retailers to understand today’s super consumer, how
they shop and – maybe most importantly – what makes them happy. Technology will continue to change as
will the way consumers use it to research, shop and purchase.
FORESEE E-RETAIL SATISFACTION INDEX (SPRING TOP 100 EDITION 2012) 5
However, the one constant that will always remain relevant in the retail world is customer satisfaction.
Research shows again and again that satisfied customers are more likely to make future purchases and to
make recommendations, urging friends, family and anyone connected to the web to shop where they had
the best experiences. These key success indicators give company executives and managers excellent metrics
for their websites that go beyond just sales. These measures quantify how a website is influencing future
business across all channels.
Another problem that retailers face in this new era of shopping is to figure out which metrics will give them the
most actionable insights. Companies have long used behavioral metrics to determine their success or failure.
This isn’t wrong – it’s good information to have, but looking at only behavioral data is like constantly looking
in the rearview mirror. If a company really wants a sense of where they are going, they need to continuously
monitor and improve the customer experience before super consumers go up, up, and away from their
websites (and possibly other available channels).
BY THE NUMBERS: TOP 100 SATISFACTION SCORES
ForeSee’s technology is founded on a scientific methodology created at the University of Michigan that has
proven the strong relationship between customer satisfaction and a company’s financial future. In essence,
high customer satisfaction, when measured scientifically, predicts success.
Satisfaction is the most important customer metric organizations can track and is the driver of all behaviors that
retailers care most about: purchases, recommendations, loyalty, and more.
This year we compared less satisfied website visitors (with satisfaction scores 69 or less) to highly satisfied website
visitors (with satisfaction scores of 80 or higher). Based on likelihood scores, compared to dissatisfied site visitors,
satisfied visitors say they are 72% more likely to purchase online, 56% more likely to purchase offline, 67% more
likely to purchase from that retailer next time they’re in the market for a similar product, and 69% more likely to
recommend the retailer to someone else.
FORESEE E-RETAIL SATISFACTION INDEX (SPRING TOP 100 EDITION 2012) 6
Overall, satisfaction scores have plateaued over the last three years and remain at 78 again this year. In 2010,
we saw an increase in consumer satisfaction from 2009 when scores jumped from 73 – its lowest point – to a
record high of 78 as e-retailers rebounded from the sluggish economy.
What does this satisfaction plateau mean for retailers?
While satisfaction appears stagnant, the good news is that we haven’t seen it drop to 2009 levels again. We
do have to keep in mind that this is a measure of the Top 100 retailers – they are financially successful because
they already provide a satisfying experience for their customers and continue to innovate and improve upon it.
For example, everyone has heard of Amazon. It’s no surprise that Amazon leads the Top 100 and managed to
significantly improve upon last year’s already high score (89, compared to 86 last year). Amazon led the pack
by one point last year, and that gap has widened to four points. Statistically speaking, they are now in their
own tier above all of the other players.
The truth is that every consumer who has visited Amazon knowingly or unknowingly benchmarks all other
experiences against it , and why wouldn’t they? They were probably most satisfied there. This year, a number
of high scorers like Amazon, Apple, and L.L. Bean experienced increases over last year, while – for the first
time in two years – we saw a few companies fall below a score of 70.
It’s good that leading Top 100 companies are moving forward. However, the bad news is that some
of the smaller companies are lagging further behind and need to start playing catch up in the race
for customer satisfaction.
FORESEE E-RETAIL SATISFACTION INDEX (SPRING TOP 100 EDITION 2012) 7
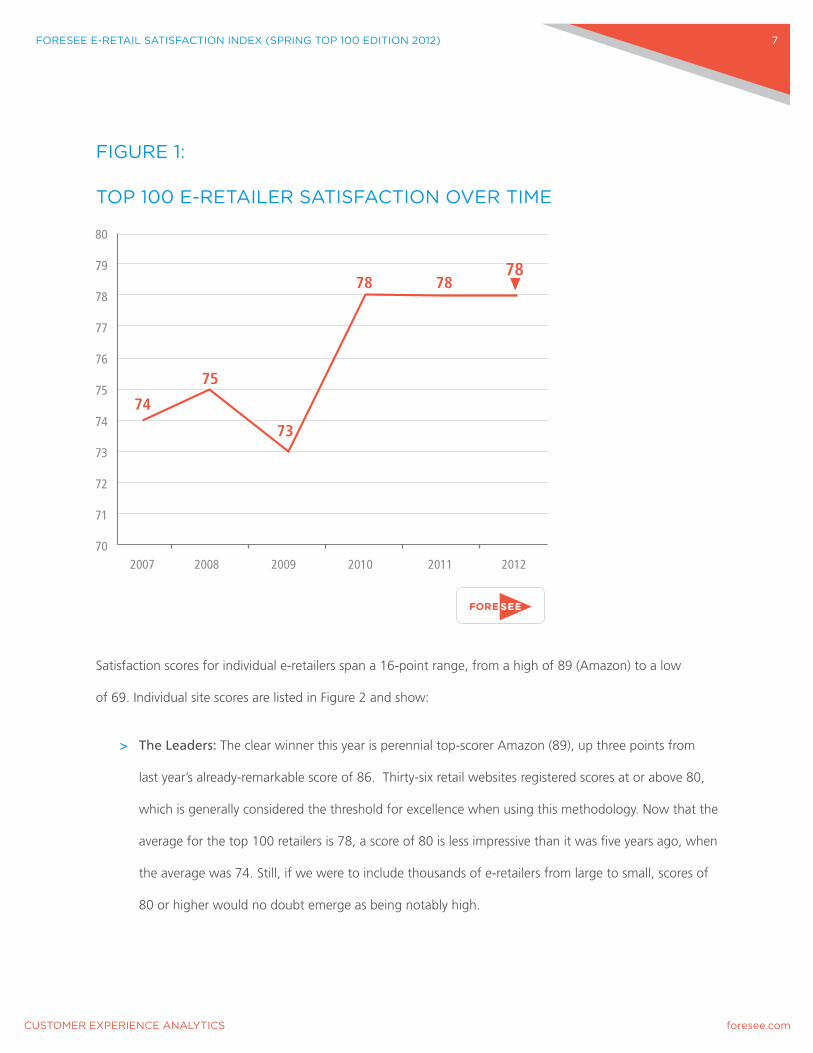
FIGURE 1:
TOP 100 E-RETAILER SATISFACTION OVER TIME
Satisfaction scores for individual e-retailers span a 16-point range, from a high of 89 (Amazon) to a low
of 69. Individual site scores are listed in Figure 2 and show:
> The Leaders: The clear winner this year is perennial top-scorer Amazon (89), up three points from
last year’s already-remarkable score of 86. Thirty-six retail websites registered scores at or above 80,
which is generally considered the threshold for excellence when using this methodology. Now that the
average for the top 100 retailers is 78, a score of 80 is less impressive than it was five years ago, when
the average was 74. Still, if we were to include thousands of e-retailers from large to small, scores of
80 or higher would no doubt emerge as being notably high.
80
79
78
77
76
75
74
73
72
71
70
78
74
75
73
78 78
2007 2008 2009 2010 2011 2012
FORESEE E-RETAIL SATISFACTION INDEX (SPRING TOP 100 EDITION 2012) 8
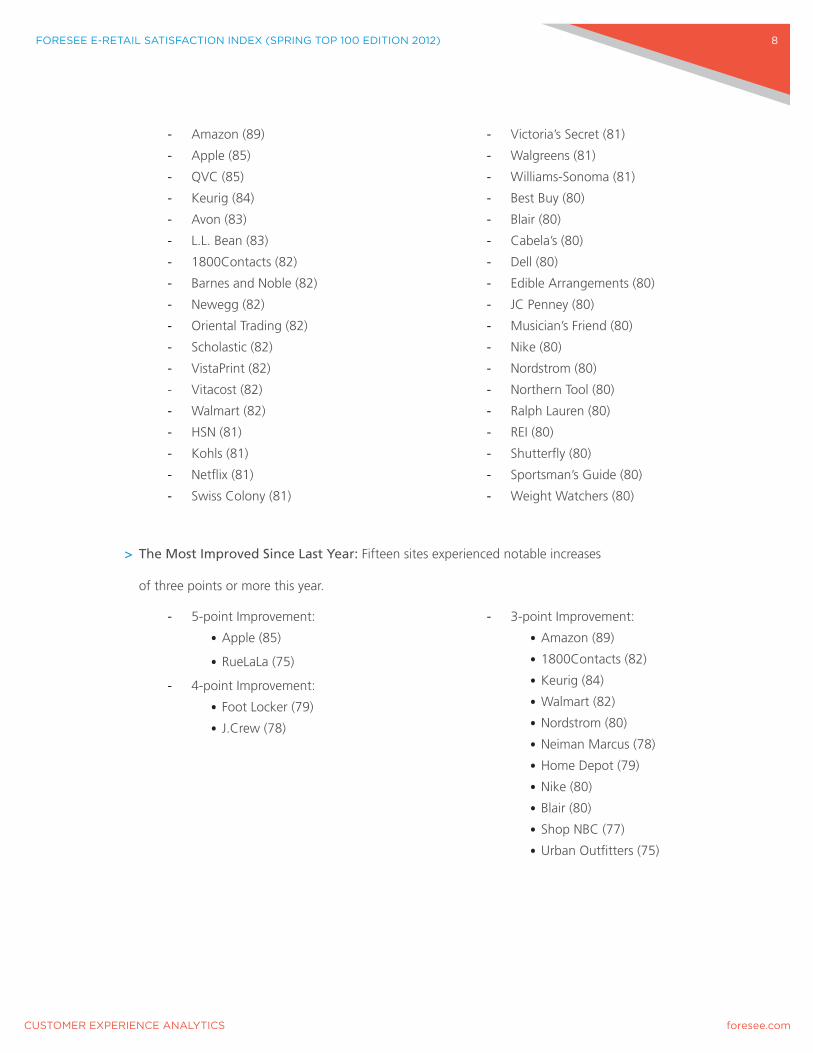
> The Most Improved Since Last Year: Fifteen sites experienced notable increases
of three points or more this year.
- Amazon (89)
- Apple (85)
- QVC (85)
- Keurig (84)
- Avon (83)
- L.L. Bean (83)
- 1800Contacts (82)
- Barnes and Noble (82)
- Newegg (82)
- Oriental Trading (82)
- Scholastic (82)
- VistaPrint (82)
- Vitacost (82)
- Walmart (82)
- HSN (81)
- Kohls (81)
- Netflix (81)
- Swiss Colony (81)
- Victoria’s Secret (81)
- Walgreens (81)
- Williams-Sonoma (81)
- Best Buy (80)
- Blair (80)
- Cabela’s (80)
- Dell (80)
- Edible Arrangements (80)
- JC Penney (80)
- Musician’s Friend (80)
- Nike (80)
- Nordstrom (80)
- Northern Tool (80)
- Ralph Lauren (80)
- REI (80)
- Shutterfly (80)
- Sportsman’s Guide (80)
- Weight Watchers (80)
- 5-point Improvement:
• Apple (85)
• RueLaLa (75)
- 4-point Improvement:
• Foot Locker (79)
• J.Crew (78)
- 3-point Improvement:
• Amazon (89)
• 1800Contacts (82)
• Keurig (84)
• Walmart (82)
• Nordstrom (80)
• Neiman Marcus (78)
• Home Depot (79)
• Nike (80)
• Blair (80)
• Shop NBC (77)
• Urban Outfitters (75)
FORESEE E-RETAIL SATISFACTION INDEX (SPRING TOP 100 EDITION 2012) 9
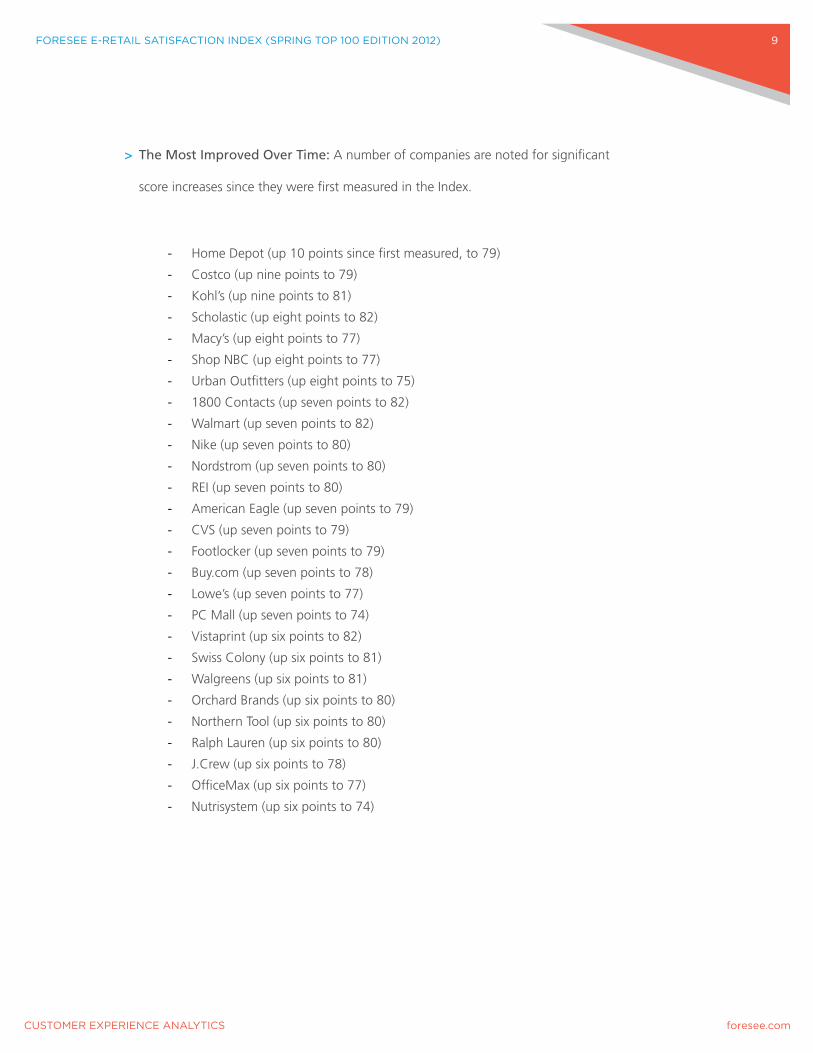
> The Most Improved Over Time: A number of companies are noted for significant
score increases since they were first measured in the Index.
- Home Depot (up 10 points since first measured, to 79)
- Costco (up nine points to 79)
- Kohl’s (up nine points to 81)
- Scholastic (up eight points to 82)
- Macy’s (up eight points to 77)
- Shop NBC (up eight points to 77)
- Urban Outfitters (up eight points to 75)
- 1800 Contacts (up seven points to 82)
- Walmart (up seven points to 82)
- Nike (up seven points to 80)
- Nordstrom (up seven points to 80)
- REI (up seven points to 80)
- American Eagle (up seven points to 79)
- CVS (up seven points to 79)
- Footlocker (up seven points to 79)
- Buy.com (up seven points to 78)
- Lowe’s (up seven points to 77)
- PC Mall (up seven points to 74)
- Vistaprint (up six points to 82)
- Swiss Colony (up six points to 81)
- Walgreens (up six points to 81)
- Orchard Brands (up six points to 80)
- Northern Tool (up six points to 80)
- Ralph Lauren (up six points to 80)
- J.Crew (up six points to 78)
- OfficeMax (up six points to 77)
- Nutrisystem (up six points to 74)
FORESEE E-RETAIL SATISFACTION INDEX (SPRING TOP 100 EDITION 2012) 10
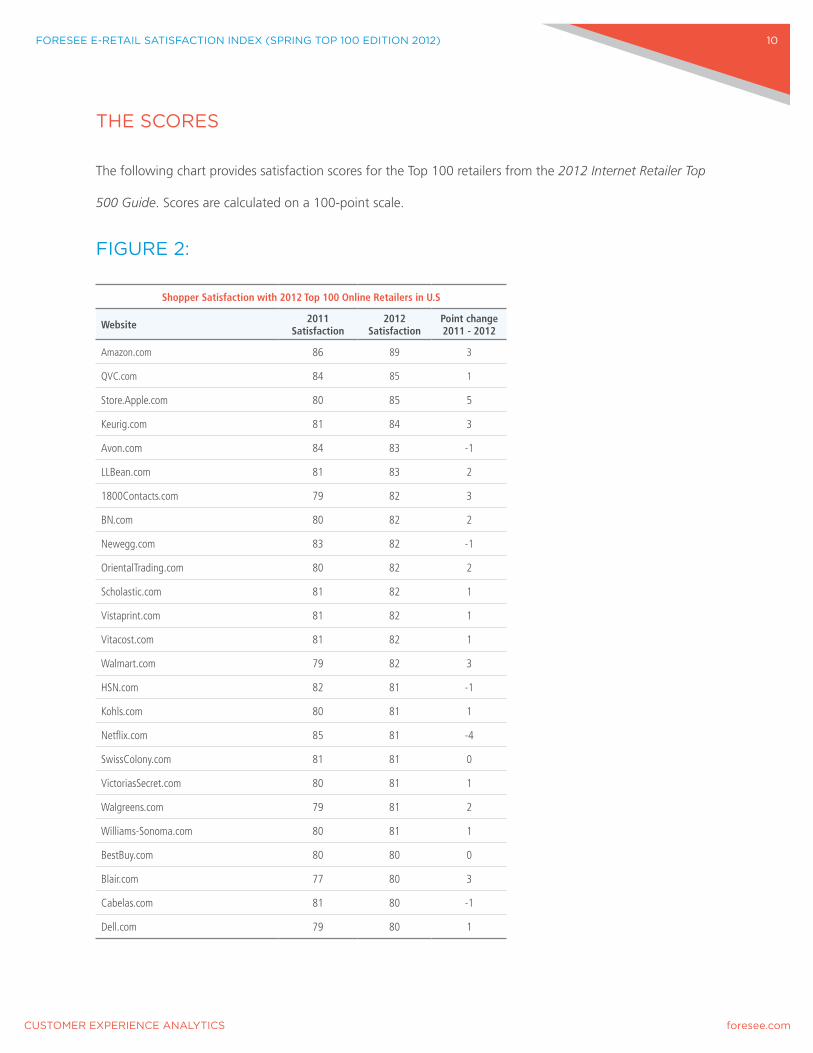
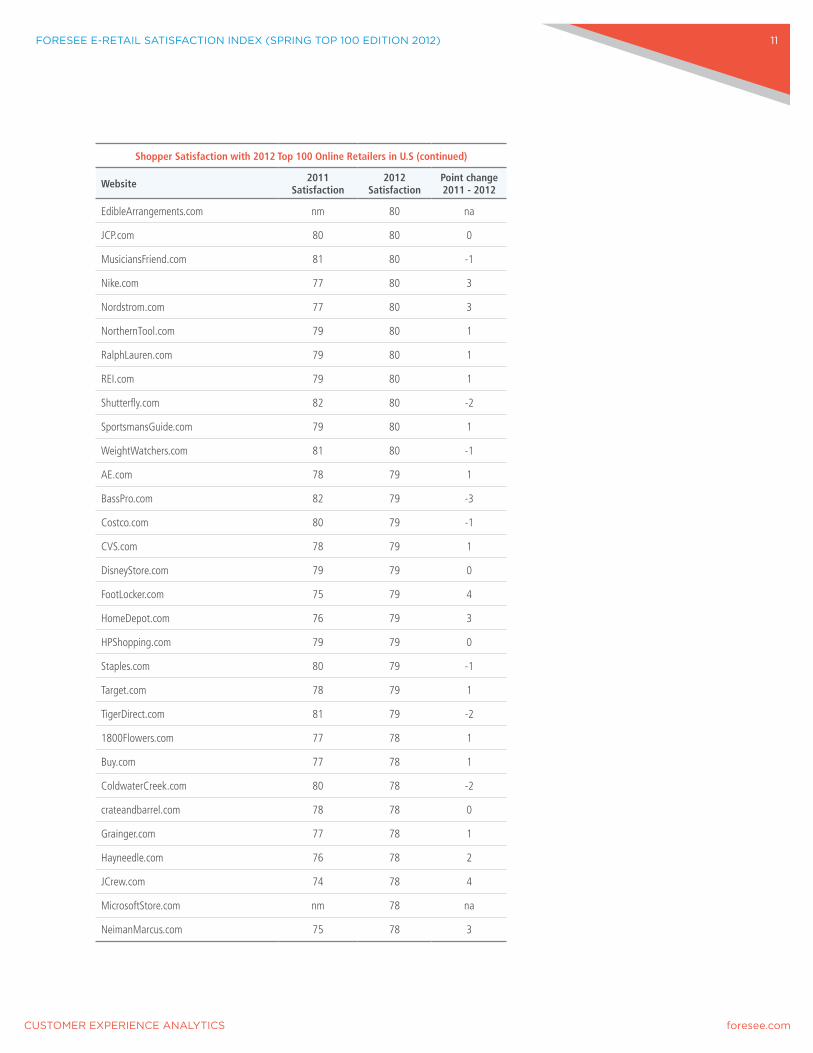
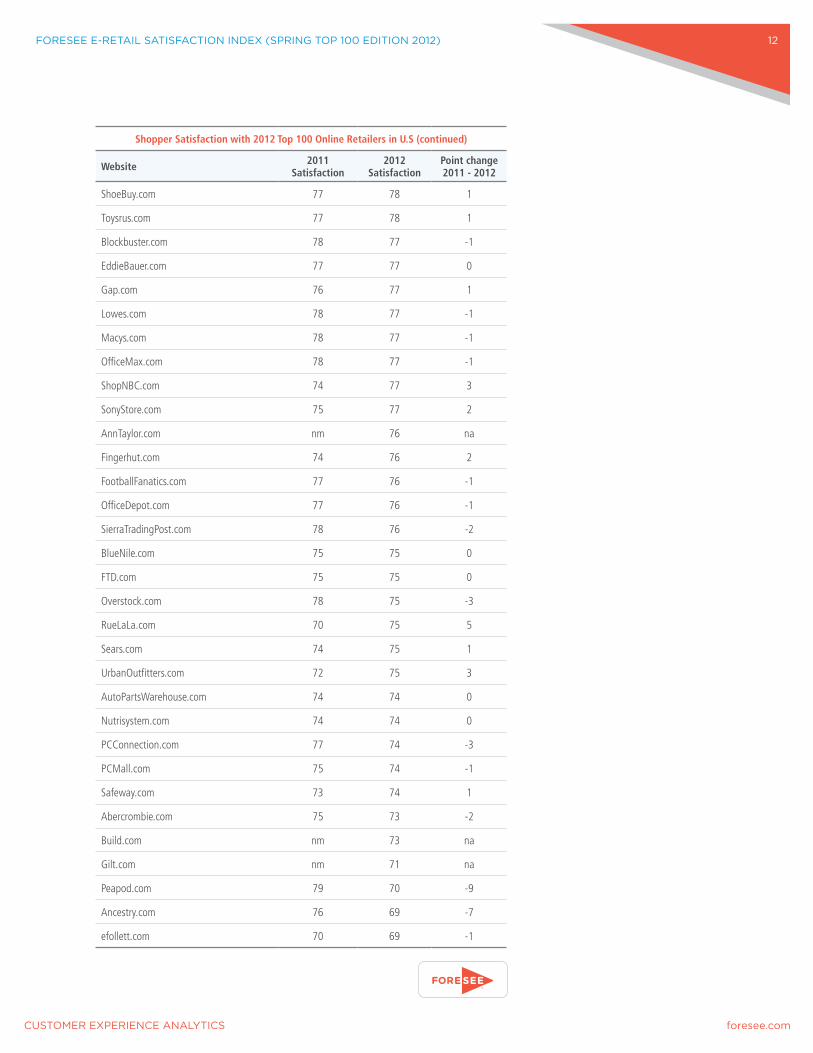
THE SCORES
The following chart provides satisfaction scores for the Top 100 retailers from the 2012 Internet Retailer Top
500 Guide. Scores are calculated on a 100-point scale.
FIGURE 2:
Shopper Satisfaction with 2012 Top 100 Online Retailers in U.S
Website 2011 Satisfaction
2012 Satisfaction
Point change 2011 - 2012
Amazon.com 86 89 3
QVC.com 84 85 1
Store.Apple.com 80 85 5
Keurig.com 81 84 3
Avon.com 84 83 -1
LLBean.com 81 83 2
1800Contacts.com 79 82 3
BN.com 80 82 2
Newegg.com 83 82 -1
OrientalTrading.com 80 82 2
Scholastic.com 81 82 1
Vistaprint.com 81 82 1
Vitacost.com 81 82 1
Walmart.com 79 82 3
HSN.com 82 81 -1
Kohls.com 80 81 1
Netflix.com 85 81 -4
SwissColony.com 81 81 0
VictoriasSecret.com 80 81 1
Walgreens.com 79 81 2
Williams-Sonoma.com 80 81 1
BestBuy.com 80 80 0
Blair.com 77 80 3
Cabelas.com 81 80 -1
Dell.com 79 80 1
FORESEE E-RETAIL SATISFACTION INDEX (SPRING TOP 100 EDITION 2012) 11
Shopper Satisfaction with 2012 Top 100 Online Retailers in U.S (continued)
Website 2011 Satisfaction
2012 Satisfaction
Point change 2011 - 2012
EdibleArrangements.com nm 80 na
JCP.com 80 80 0
MusiciansFriend.com 81 80 -1
Nike.com 77 80 3
Nordstrom.com 77 80 3
NorthernTool.com 79 80 1
RalphLauren.com 79 80 1
REI.com 79 80 1
Shutterfly.com 82 80 -2
SportsmansGuide.com 79 80 1
WeightWatchers.com 81 80 -1
AE.com 78 79 1
BassPro.com 82 79 -3
Costco.com 80 79 -1
CVS.com 78 79 1
DisneyStore.com 79 79 0
FootLocker.com 75 79 4
HomeDepot.com 76 79 3
HPShopping.com 79 79 0
Staples.com 80 79 -1
Target.com 78 79 1
TigerDirect.com 81 79 -2
1800Flowers.com 77 78 1
Buy.com 77 78 1
ColdwaterCreek.com 80 78 -2
crateandbarrel.com 78 78 0
Grainger.com 77 78 1
Hayneedle.com 76 78 2
JCrew.com 74 78 4
MicrosoftStore.com nm 78 na
NeimanMarcus.com 75 78 3
FORESEE E-RETAIL SATISFACTION INDEX (SPRING TOP 100 EDITION 2012) 12
Shopper Satisfaction with 2012 Top 100 Online Retailers in U.S (continued)
Website 2011 Satisfaction
2012 Satisfaction
Point change 2011 - 2012
ShoeBuy.com 77 78 1
Toysrus.com 77 78 1
Blockbuster.com 78 77 -1
EddieBauer.com 77 77 0
Gap.com 76 77 1
Lowes.com 78 77 -1
Macys.com 78 77 -1
OfficeMax.com 78 77 -1
ShopNBC.com 74 77 3
SonyStore.com 75 77 2
AnnTaylor.com nm 76 na
Fingerhut.com 74 76 2
FootballFanatics.com 77 76 -1
OfficeDepot.com 77 76 -1
SierraTradingPost.com 78 76 -2
BlueNile.com 75 75 0
FTD.com 75 75 0
Overstock.com 78 75 -3
RueLaLa.com 70 75 5
Sears.com 74 75 1
UrbanOutfitters.com 72 75 3
AutoPartsWarehouse.com 74 74 0
Nutrisystem.com 74 74 0
PCConnection.com 77 74 -3
PCMall.com 75 74 -1
Safeway.com 73 74 1
Abercrombie.com 75 73 -2
Build.com nm 73 na
Gilt.com nm 71 na
Peapod.com 79 70 -9
Ancestry.com 76 69 -7
efollett.com 70 69 -1
FORESEE E-RETAIL SATISFACTION INDEX (SPRING TOP 100 EDITION 2012) 13
SATISFACTION WINNERS
While a satisfaction score of 80 on the ACSI Index has long been the Holy Grail for companies across
industries, in recent years, more and more retailers have been reaching and surpassing that benchmark of
excellence. When we first started measuring the top e-retailers in 2005, only four websites scored 80 or
higher. In 2010 and 2011, almost one-third of all measured sites in the Top 100 reached or broke the 80
barrier. This year, 37 companies had satisfaction scores that ranged from 80-89.
After grabbing the top spot from Netflix last year, Amazon (89) remains the leader of the pack, improving
three points from 2011’s score of 86. Apple was another big mover, increasing to 85 with a five-point
improvement. RueLaLa’s satisfaction also increased by five points, to 75. Foot Locker (79) and J.Crew (78)
both saw an increase of four points, and 10 retailers besides Amazon also improved by three points.
We would be remiss not to mention Netflix (81), down four points from last spring (85) and the recipient
of much publicity about its missteps and resulting plummet in customer satisfaction. It’s worth noting that
Netflix’s satisfaction score is actually up two points from when we measured it over the holiday season (79).
Despite the increase, Netflix is still obviously paying the price of its PR fiasco last year and it is nowhere near
its all-time high score of 87 two years ago. Once the darling of the e-commerce world in terms of customer
satisfaction, Netflix clearly has a lot more ground to make up. What remains to be seen is whether this small
increase of two points is the result of successful efforts to satisfy customers, or whether so many customers
have jumped ship that only the most satisfied remain. Only time will tell.
Other findings by category include (full category charts can be found in Appendix A):
> Apparel and Accessories: With 22 websites, this is the largest category. The aggregate
satisfaction score for the apparel and accessories sites was 78, up two points from last year
(76). Scores for individual retailers within the category ranged from 71 to 83. L.L. Bean (83)
saw a two-point increase and now leads the group. Victoria’s Secret scored an 81, while five
others scored 80. Last year, just two retailers in this category scored 80 or above.
FORESEE E-RETAIL SATISFACTION INDEX (SPRING TOP 100 EDITION 2012) 14
> Books/Music/Video: The five e-retailers in the books/music/video category had an aggregate
category score of 78 (down slightly from 79), with individual scores ranging from 69 to 82.
Scholastic and Barnes and Noble each scored an 82.
> Computers and Electronics: The 10 computers and electronics retailers had an average score of 79
(up from 78), with individual companies ranging from 74 to 85. Four companies in this category had
satisfaction scores of 80 or higher: Apple (85), Newegg (82), Dell (80), and Best Buy (80).
> Food and Drug: Eight food and drug e-retailers averaged a score of 78, unchanged from 2011.
Keurig (84), Swiss Colony (81), Walgreens (81), and Weight Watchers (80) lead the group.
> Hardware/Home Improvement: The five e-retailers classified in this category averaged a score
of 77 – the lowest category score. Individual sites’ scores ranged from 73-80, with Northern
Tool receiving the only 80.
> Mass Merchants: Another large and well-performing category – 15 sites with an average
satisfaction score of 79 (same as 2011). Six e-retailers that are classified as mass merchants
scored over 80: Amazon (89), QVC (85), Walmart (82), HSN (81), Kohls (81), and JC Penney (80).
None of the Top 100 mass merchants scored lower than 75.
> Specialty/Non-Apparel: The five sites in this category overall score dropped to 78. Three of the
five sites scored in the 80s: Oriental Trading (82), Shutterfly (80), and Musician’s Friend (80).
There are several different ways for an e-retailer to put its score in context by using the benchmarking
capabilities provided by the ForeSee technology. E-retailers can compare their own score in the following
ways in order to determine whether they are leading the pack or falling short:
1. Comparison to the average Index score for U.S. e-retailers (78). Any retailer falling significantly
below 78 is risking loyalty, recommendations, sales, and market share to competitors who score
higher. By this measure, 30 e-retailers may be underperforming compared to their peers. However,
FORESEE E-RETAIL SATISFACTION INDEX (SPRING TOP 100 EDITION 2012) 15
that is not taking into account the 11 retailers that have average scores (78). While falling below
average is definitely dangerous, it is hard to imagine that a consistently average performance is safe
either, especially in a hyper-competitive economy. This data points out an interesting trend among
the top retailers: 80 is generally considered the threshold for excellence for companies across
industries using ForeSee’s methodology to evaluate their success. The top 100 e-retailers have
improved their performance so much over time that a score of 80 equates to being just above
average. Five years ago, the average score for the top 100 e-retailers was 74; now it is 78. The
performance of the largest online retailers raises the bar for other retailers.
2. Comparison to frontrunners. Most anyone who shops online will probably visit Amazon at some
point, and their expectations are being set accordingly. With Amazon setting a new record high for
the company and the Index, it’s apparent that other retail websites have work to do. The problem is
that Amazon doesn’t appear to be slowing down any time soon to let competitors catch up.
3. Comparison to direct competitors. All retailers in the Index are classified according to
product category, which allows individual companies to check their own performance against sites
selling similar products or services. For categories with more than five companies, we provide an
average category score. Companies in categories with less representation in the top 100 can still
make direct score comparisons to close or distant competitors. Please see Appendix A for a
breakdown of sites by product category.
4. Comparison to channel competitors. E-retailers in the Index are also organized by channel
category. In general, websites for multichannel retailers underperform web-only retailers, although
the gap is narrowing.
WHY MEASURE CUSTOMER SATISFACTION?
For years now, online retailers have tracked shoppers’ basic behavior patterns, such as which pages they
clicked on, where they came from, how much money they spent, and what they abandoned in their cart.
FORESEE E-RETAIL SATISFACTION INDEX (SPRING TOP 100 EDITION 2012) 16
While these are important metrics to have, they shouldn’t be considered the end result.
With the rise of the super consumer the retail landscape has changed and retailers need a tool just as potent
as the ones consumers wield (powerful voice, super hearing, unlimited knowledge, and cloning abilities)
to level the playing field. They need a precise and reliable technology that not only measures the customer
experience but predicts what impact their satisfaction, or lack thereof, will have on the future success of a
company. Companies also need to be aware that consumers are fully immersed in multichannel -- using web,
mobile, store locations, contact centers, email and social media at will – and the experience a customer has in
one channel can greatly affect the overall experience with the company as a whole.
ForeSee’s methodology used to conduct this study has proven there is a strong relationship between customer
satisfaction and a company’s financial future. The higher the customer satisfaction – when measured
scientifically – the higher the likelihood of future success.
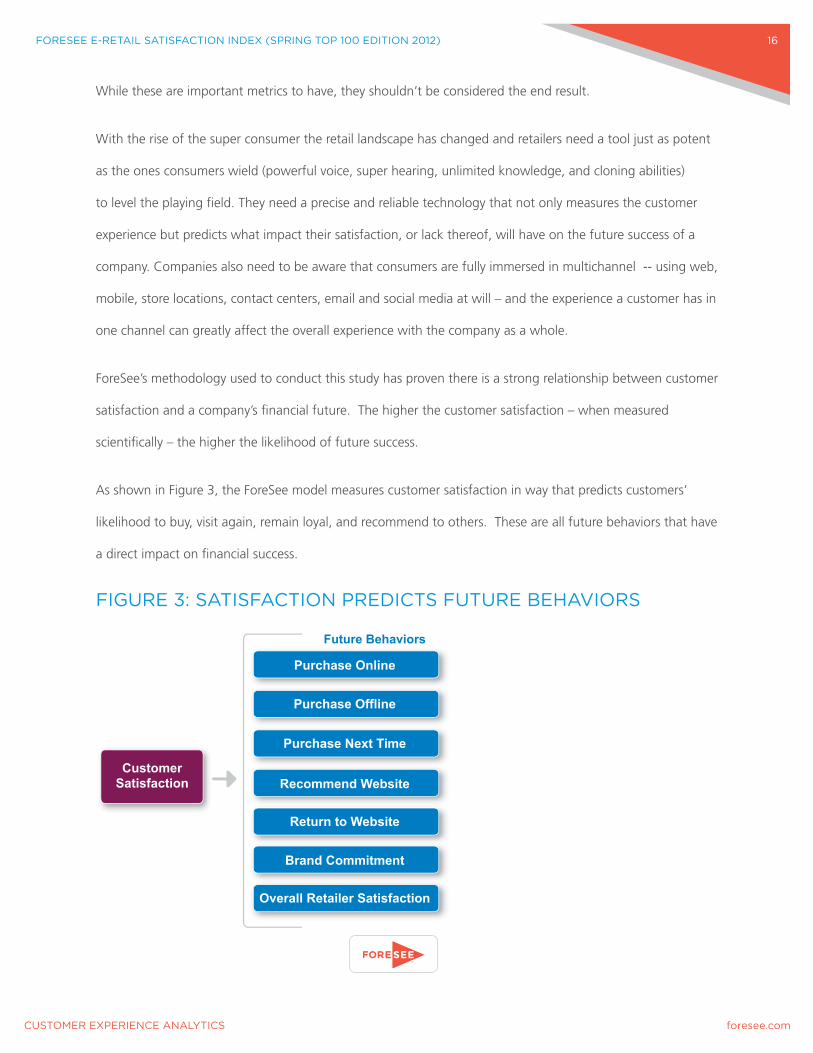
As shown in Figure 3, the ForeSee model measures customer satisfaction in way that predicts customers’
likelihood to buy, visit again, remain loyal, and recommend to others. These are all future behaviors that have
a direct impact on financial success.
FIGURE 3: SATISFACTION PREDICTS FUTURE BEHAVIORS
Purchase Online
Purchase Offline
CustomerSatisfaction
Future Behaviors
Purchase Next Time
Recommend Website
Return to Website
Brand Commitment
Overall Retailer Satisfaction
FORESEE E-RETAIL SATISFACTION INDEX (SPRING TOP 100 EDITION 2012) 17
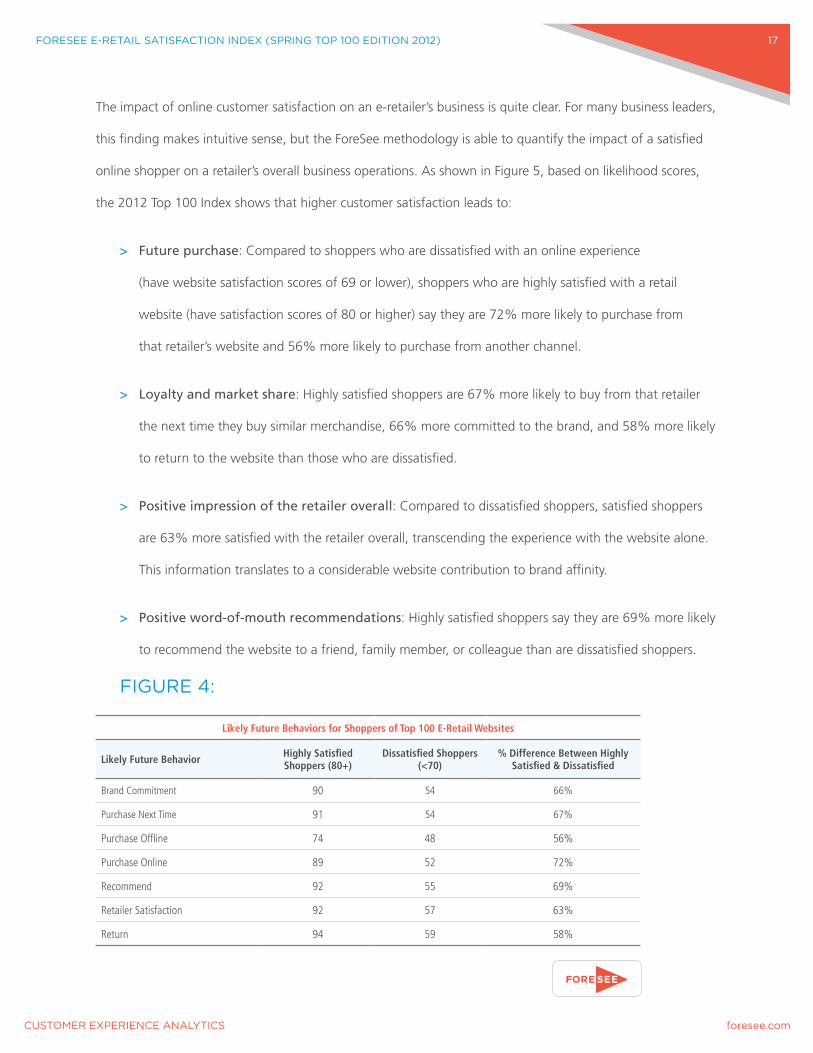
The impact of online customer satisfaction on an e-retailer’s business is quite clear. For many business leaders,
this finding makes intuitive sense, but the ForeSee methodology is able to quantify the impact of a satisfied
online shopper on a retailer’s overall business operations. As shown in Figure 5, based on likelihood scores,
the 2012 Top 100 Index shows that higher customer satisfaction leads to:
> Future purchase: Compared to shoppers who are dissatisfied with an online experience
(have website satisfaction scores of 69 or lower), shoppers who are highly satisfied with a retail
website (have satisfaction scores of 80 or higher) say they are 72% more likely to purchase from
that retailer’s website and 56% more likely to purchase from another channel.
> Loyalty and market share: Highly satisfied shoppers are 67% more likely to buy from that retailer
the next time they buy similar merchandise, 66% more committed to the brand, and 58% more likely
to return to the website than those who are dissatisfied.
> Positive impression of the retailer overall: Compared to dissatisfied shoppers, satisfied shoppers
are 63% more satisfied with the retailer overall, transcending the experience with the website alone.
This information translates to a considerable website contribution to brand affinity.
> Positive word-of-mouth recommendations: Highly satisfied shoppers say they are 69% more likely
to recommend the website to a friend, family member, or colleague than are dissatisfied shoppers.
FIGURE 4:
Likely Future Behaviors for Shoppers of Top 100 E-Retail Websites
Likely Future Behavior Highly Satisfied Shoppers (80+)
Dissatisfied Shoppers (<70)
% Difference Between Highly Satisfied & Dissatisfied
Brand Commitment 90 54 66%
Purchase Next Time 91 54 67%
Purchase Offline 74 48 56%
Purchase Online 89 52 72%
Recommend 92 55 69%
Retailer Satisfaction 92 57 63%
Return 94 59 58%
FORESEE E-RETAIL SATISFACTION INDEX (SPRING TOP 100 EDITION 2012) 18
FACTORS AFFECTING ONLINE CUSTOMER SATISFACTION
How can retailers increase satisfaction so shoppers are even more likely to buy, recommend, and
return to their sites?
The ForeSee methodology scientifically measures several key drivers, or elements, of online satisfaction
and the results tell us how shoppers feel about these performance areas and also how much influence
each element has on shoppers’ overall satisfaction. Improving the elements in the eyes of site visitors leads
to quantifiable increases in satisfaction. The elements that will have the most impact on overall satisfaction
(and therefore on future behaviors, both online and offline) differ for specific e-retailers.
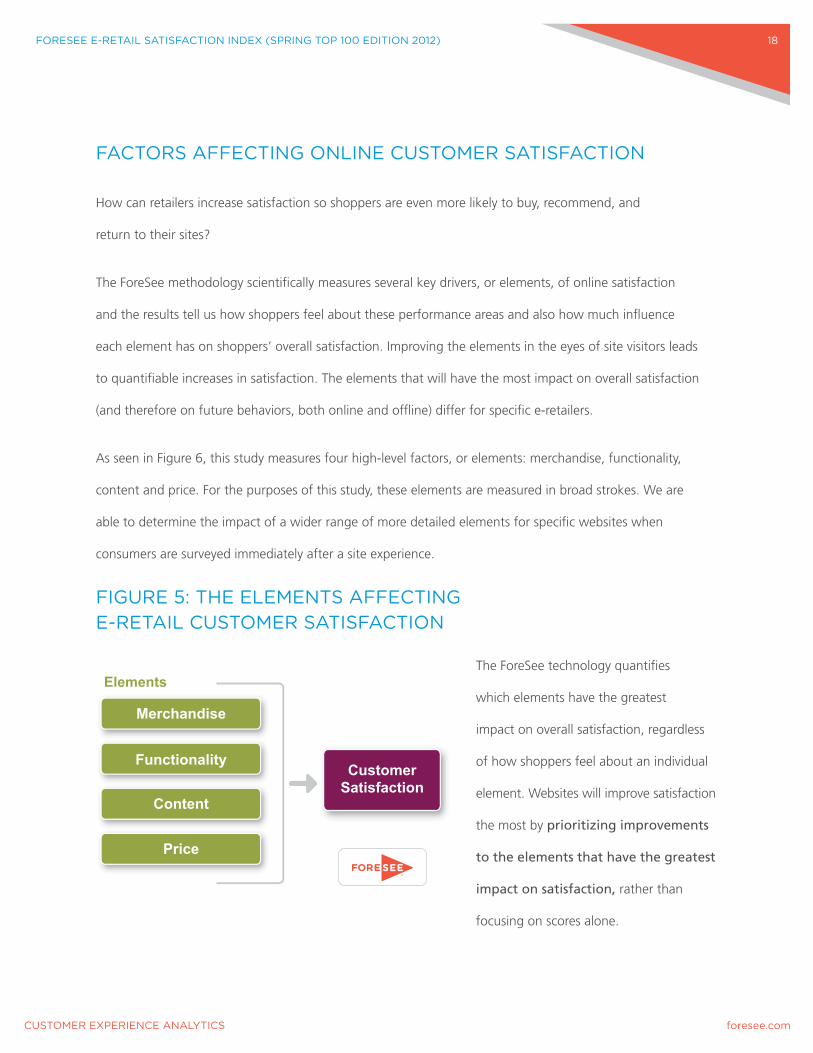
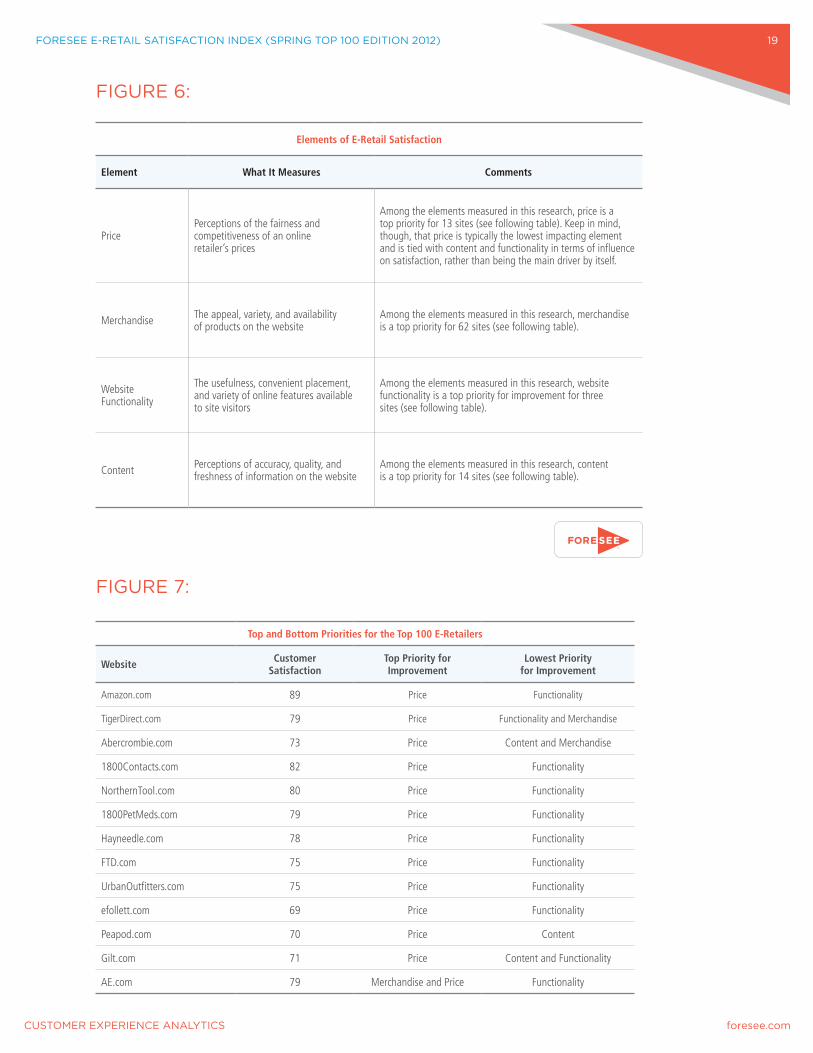
As seen in Figure 6, this study measures four high-level factors, or elements: merchandise, functionality,
content and price. For the purposes of this study, these elements are measured in broad strokes. We are
able to determine the impact of a wider range of more detailed elements for specific websites when
consumers are surveyed immediately after a site experience.
FIGURE 5: THE ELEMENTS AFFECTING E-RETAIL CUSTOMER SATISFACTION
The ForeSee technology quantifies
which elements have the greatest
impact on overall satisfaction, regardless
of how shoppers feel about an individual
element. Websites will improve satisfaction
the most by prioritizing improvements
to the elements that have the greatest
impact on satisfaction, rather than
focusing on scores alone.
CustomerSatisfaction
Merchandise
Functionality
Elements
Content
Price
FORESEE E-RETAIL SATISFACTION INDEX (SPRING TOP 100 EDITION 2012) 19
FIGURE 6:
Elements of E-Retail Satisfaction
Element What It Measures Comments
PricePerceptions of the fairness and competitiveness of an online retailer’s prices
Among the elements measured in this research, price is a top priority for 13 sites (see following table). Keep in mind, though, that price is typically the lowest impacting element and is tied with content and functionality in terms of influence on satisfaction, rather than being the main driver by itself.
Merchandise The appeal, variety, and availability of products on the website
Among the elements measured in this research, merchandise is a top priority for 62 sites (see following table).
Website Functionality
The usefulness, convenient placement, and variety of online features available to site visitors
Among the elements measured in this research, website functionality is a top priority for improvement for three sites (see following table).
Content Perceptions of accuracy, quality, and freshness of information on the website
Among the elements measured in this research, content is a top priority for 14 sites (see following table).
FIGURE 7:
Top and Bottom Priorities for the Top 100 E-Retailers
Website Customer Satisfaction
Top Priority for Improvement
Lowest Priority for Improvement
Amazon.com 89 Price Functionality
TigerDirect.com 79 Price Functionality and Merchandise
Abercrombie.com 73 Price Content and Merchandise
1800Contacts.com 82 Price Functionality
NorthernTool.com 80 Price Functionality
1800PetMeds.com 79 Price Functionality
Hayneedle.com 78 Price Functionality
FTD.com 75 Price Functionality
UrbanOutfitters.com 75 Price Functionality
efollett.com 69 Price Functionality
Peapod.com 70 Price Content
Gilt.com 71 Price Content and Functionality
AE.com 79 Merchandise and Price Functionality
FORESEE E-RETAIL SATISFACTION INDEX (SPRING TOP 100 EDITION 2012) 20
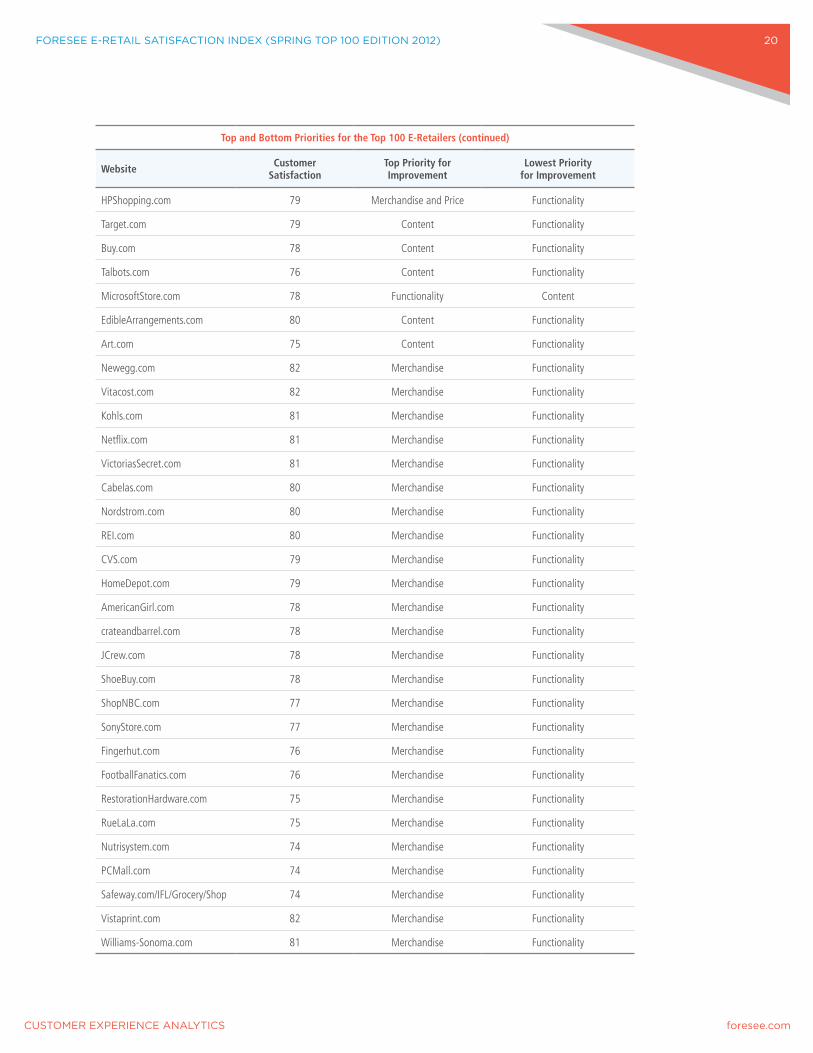
Top and Bottom Priorities for the Top 100 E-Retailers (continued)
Website Customer Satisfaction
Top Priority for Improvement
Lowest Priority for Improvement
HPShopping.com 79 Merchandise and Price Functionality
Target.com 79 Content Functionality
Buy.com 78 Content Functionality
Talbots.com 76 Content Functionality
MicrosoftStore.com 78 Functionality Content
EdibleArrangements.com 80 Content Functionality
Art.com 75 Content Functionality
Newegg.com 82 Merchandise Functionality
Vitacost.com 82 Merchandise Functionality
Kohls.com 81 Merchandise Functionality
Netflix.com 81 Merchandise Functionality
VictoriasSecret.com 81 Merchandise Functionality
Cabelas.com 80 Merchandise Functionality
Nordstrom.com 80 Merchandise Functionality
REI.com 80 Merchandise Functionality
CVS.com 79 Merchandise Functionality
HomeDepot.com 79 Merchandise Functionality
AmericanGirl.com 78 Merchandise Functionality
crateandbarrel.com 78 Merchandise Functionality
JCrew.com 78 Merchandise Functionality
ShoeBuy.com 78 Merchandise Functionality
ShopNBC.com 77 Merchandise Functionality
SonyStore.com 77 Merchandise Functionality
Fingerhut.com 76 Merchandise Functionality
FootballFanatics.com 76 Merchandise Functionality
RestorationHardware.com 75 Merchandise Functionality
RueLaLa.com 75 Merchandise Functionality
Nutrisystem.com 74 Merchandise Functionality
PCMall.com 74 Merchandise Functionality
Safeway.com/IFL/Grocery/Shop 74 Merchandise Functionality
Vistaprint.com 82 Merchandise Functionality
Williams-Sonoma.com 81 Merchandise Functionality
FORESEE E-RETAIL SATISFACTION INDEX (SPRING TOP 100 EDITION 2012) 21
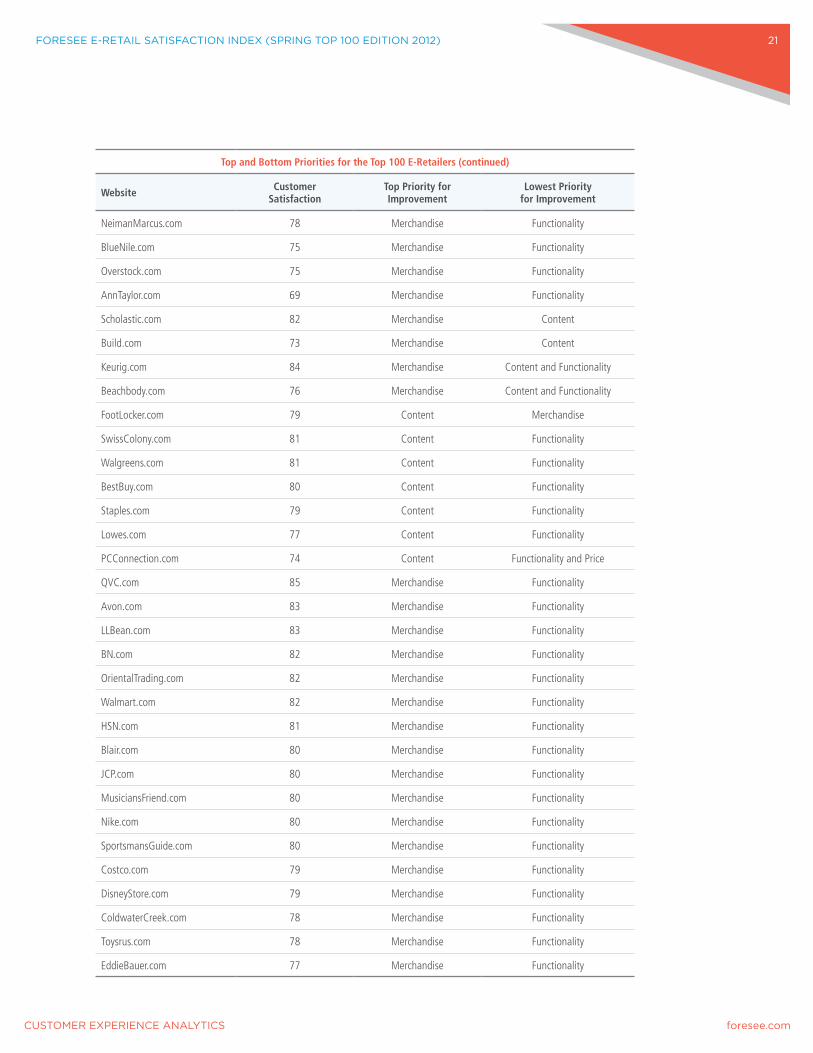
Top and Bottom Priorities for the Top 100 E-Retailers (continued)
Website Customer Satisfaction
Top Priority for Improvement
Lowest Priority for Improvement
NeimanMarcus.com 78 Merchandise Functionality
BlueNile.com 75 Merchandise Functionality
Overstock.com 75 Merchandise Functionality
AnnTaylor.com 69 Merchandise Functionality
Scholastic.com 82 Merchandise Content
Build.com 73 Merchandise Content
Keurig.com 84 Merchandise Content and Functionality
Beachbody.com 76 Merchandise Content and Functionality
FootLocker.com 79 Content Merchandise
SwissColony.com 81 Content Functionality
Walgreens.com 81 Content Functionality
BestBuy.com 80 Content Functionality
Staples.com 79 Content Functionality
Lowes.com 77 Content Functionality
PCConnection.com 74 Content Functionality and Price
QVC.com 85 Merchandise Functionality
Avon.com 83 Merchandise Functionality
LLBean.com 83 Merchandise Functionality
BN.com 82 Merchandise Functionality
OrientalTrading.com 82 Merchandise Functionality
Walmart.com 82 Merchandise Functionality
HSN.com 81 Merchandise Functionality
Blair.com 80 Merchandise Functionality
JCP.com 80 Merchandise Functionality
MusiciansFriend.com 80 Merchandise Functionality
Nike.com 80 Merchandise Functionality
SportsmansGuide.com 80 Merchandise Functionality
Costco.com 79 Merchandise Functionality
DisneyStore.com 79 Merchandise Functionality
ColdwaterCreek.com 78 Merchandise Functionality
Toysrus.com 78 Merchandise Functionality
EddieBauer.com 77 Merchandise Functionality
FORESEE E-RETAIL SATISFACTION INDEX (SPRING TOP 100 EDITION 2012) 22
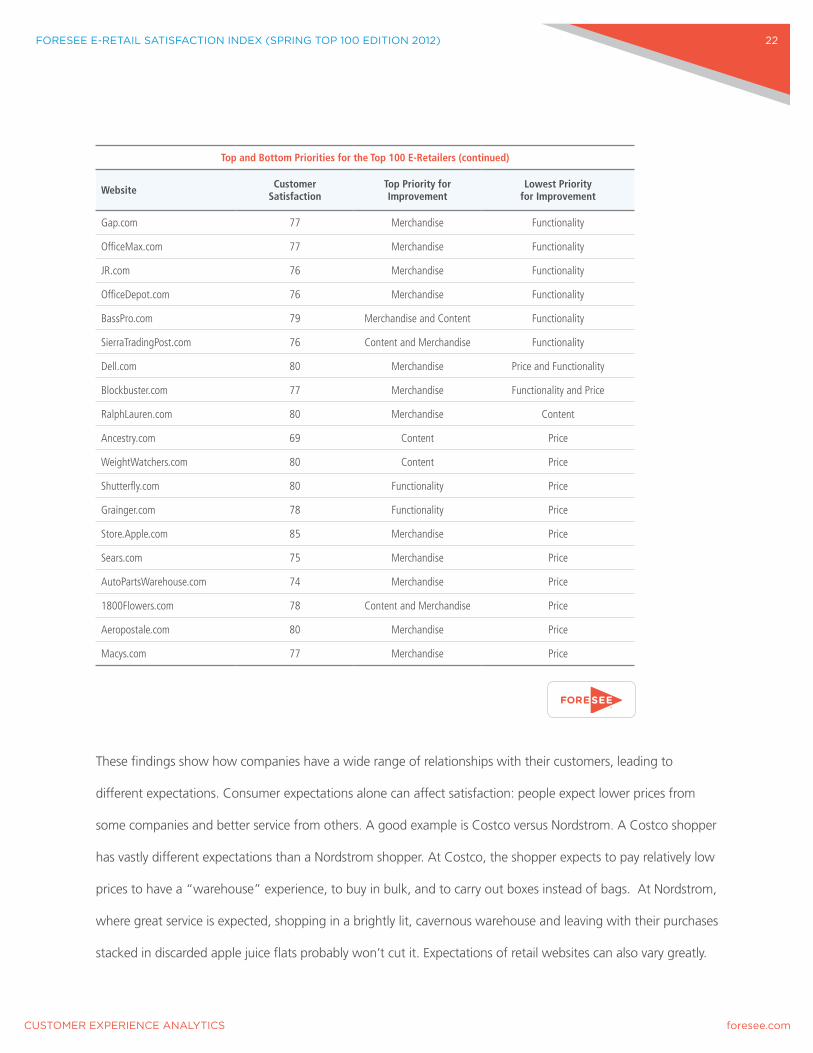
Top and Bottom Priorities for the Top 100 E-Retailers (continued)
Website Customer Satisfaction
Top Priority for Improvement
Lowest Priority for Improvement
Gap.com 77 Merchandise Functionality
OfficeMax.com 77 Merchandise Functionality
JR.com 76 Merchandise Functionality
OfficeDepot.com 76 Merchandise Functionality
BassPro.com 79 Merchandise and Content Functionality
SierraTradingPost.com 76 Content and Merchandise Functionality
Dell.com 80 Merchandise Price and Functionality
Blockbuster.com 77 Merchandise Functionality and Price
RalphLauren.com 80 Merchandise Content
Ancestry.com 69 Content Price
WeightWatchers.com 80 Content Price
Shutterfly.com 80 Functionality Price
Grainger.com 78 Functionality Price
Store.Apple.com 85 Merchandise Price
Sears.com 75 Merchandise Price
AutoPartsWarehouse.com 74 Merchandise Price
1800Flowers.com 78 Content and Merchandise Price
Aeropostale.com 80 Merchandise Price
Macys.com 77 Merchandise Price
These findings show how companies have a wide range of relationships with their customers, leading to
different expectations. Consumer expectations alone can affect satisfaction: people expect lower prices from
some companies and better service from others. A good example is Costco versus Nordstrom. A Costco shopper
has vastly different expectations than a Nordstrom shopper. At Costco, the shopper expects to pay relatively low
prices to have a “warehouse” experience, to buy in bulk, and to carry out boxes instead of bags. At Nordstrom,
where great service is expected, shopping in a brightly lit, cavernous warehouse and leaving with their purchases
stacked in discarded apple juice flats probably won’t cut it. Expectations of retail websites can also vary greatly.
FORESEE E-RETAIL SATISFACTION INDEX (SPRING TOP 100 EDITION 2012) 23
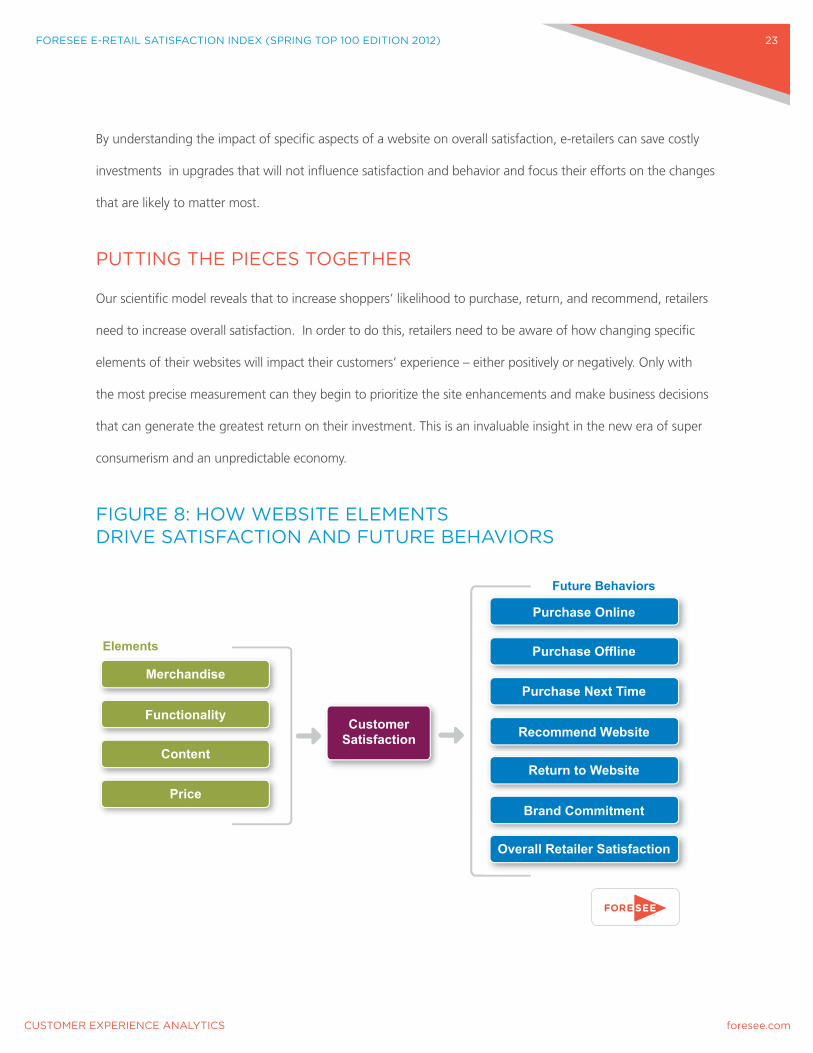
By understanding the impact of specific aspects of a website on overall satisfaction, e-retailers can save costly
investments in upgrades that will not influence satisfaction and behavior and focus their efforts on the changes
that are likely to matter most.
PUTTING THE PIECES TOGETHER
Our scientific model reveals that to increase shoppers’ likelihood to purchase, return, and recommend, retailers
need to increase overall satisfaction. In order to do this, retailers need to be aware of how changing specific
elements of their websites will impact their customers’ experience – either positively or negatively. Only with
the most precise measurement can they begin to prioritize the site enhancements and make business decisions
that can generate the greatest return on their investment. This is an invaluable insight in the new era of super
consumerism and an unpredictable economy.
FIGURE 8: HOW WEBSITE ELEMENTS DRIVE SATISFACTION AND FUTURE BEHAVIORS
Purchase Online
Purchase Offline
CustomerSatisfaction
Future Behaviors
Purchase Next Time
Recommend Website
Return to Website
Brand Commitment
Overall Retailer Satisfaction
Merchandise
Functionality
Elements
Content
Price
FORESEE E-RETAIL SATISFACTION INDEX (SPRING TOP 100 EDITION 2012) 24
The super consumer holds a tremendous amount of influence in the retail world with a powerful voice,
super hearing, unlimited knowledge, and cloning abilities in this new dawn of shopping. Retailers don’t have
to – in fact, they shouldn’t – look at the consumer as a villain that needs to be bested. Actually, consumers
are the misinterpreted superhero just looking to be understood. Retailers will never be able to surpass the
consumer’s ever-changing expectations. But if retailers monitor customer satisfaction and create increasingly
positive consumer experiences, they should at least be able to keep pace with the super consumer in this vast
technological world we now live in. And that’s a pretty good start.
HOW THE SURVEY WAS CONDUCTED
The Top 100 E-Retail Satisfaction Index measures browser satisfaction with the top 100 online retailers by
2011 sales volume as reported in the 2012 Internet Retailer Top 500 Guide. Satisfaction data were collected
through FGI Research’s SmartPanel – a nationwide group of 1.6 million consumer households that have
agreed to participate in opt-in surveys – and analyzed using ForeSee’s methodology, which is based on the
American Customer Satisfaction Index (ACSI), developed at the University of Michigan. During February 2012,
ForeSee collected data from almost 21,000 responses visitors of the top 100 online retail sites within the
previous two weeks, whether or not they made a purchase.
ABOUT THE AUTHOR
As President and CEO of ForeSee, Larry Freed is an expert on customer satisfaction and authors dozens
of research papers and reports on the subject every year as well as the 2011 book, Managing Forward.
Larry speaks extensively on the topic at private- and public-sector industry events and has been quoted in
numerous publications and media, including CNN, the Wall Street Journal, the Washington Post, the New
York Times, Investor’s Business Daily, Internet Retailer, Internet Retailing, Multichannel Merchant, DM News,
Computerworld, Federal Computer Week and Government Executive, among many others.
FORESEE E-RETAIL SATISFACTION INDEX (SPRING TOP 100 EDITION 2012) 25
ABOUT THE RESEARCH TEAM
Rhonda Berg, Research Manager at ForeSee, led the research team that worked on the 2012 ForeSee E-Retail
Satisfaction Index (Spring Top 100 Edition). Rhonda manages many research initiatives, such as the annual Top
100 and Top 40 Retail Satisfaction Indices (both U.S. and UK) and the quarterly E-Government Satisfaction
and Transparency Indices. She also serves as an internal consultant regarding statistics, methodology, and
survey design. Rhonda has been a research professional for 20 years in a number of industries and holds
advanced degrees in business and sociology.
ABOUT FORESEE
As a pioneer in customer experience analytics, ForeSee continuously measures satisfaction and delivers
powerful insights on where to prioritize improvements for maximum impact. ForeSee applies its trusted
technology across channels and customer touch points, including websites, call centers, brick-and-mortar
locations, mobile experiences, and social media interactions. Because ForeSee’s proven methodology
measures satisfaction in a manner that is predictive of customer loyalty, purchase behavior, future financial
success, and even stock prices, executives and managers are able to drive future success by confidently
prioritizing the efforts that they know will achieve business goals.
Working across the public and private sectors, with deep expertise in a range of business and consumer
industries, ForeSee combines the best in customer satisfaction measurement, proven predictive analytics,
actionable usability analysis, and rich observational data to work with large and small organizations around
the world. The result of measuring success through the customers’ eyes is better outcomes for businesses and
a better experience for consumers.
ForeSee is a privately held company headquartered in Ann Arbor, Michigan. Visit us at www.foresee.com for
customer experience solutions and original research.
FORESEE E-RETAIL SATISFACTION INDEX (SPRING TOP 100 EDITION 2012) 26
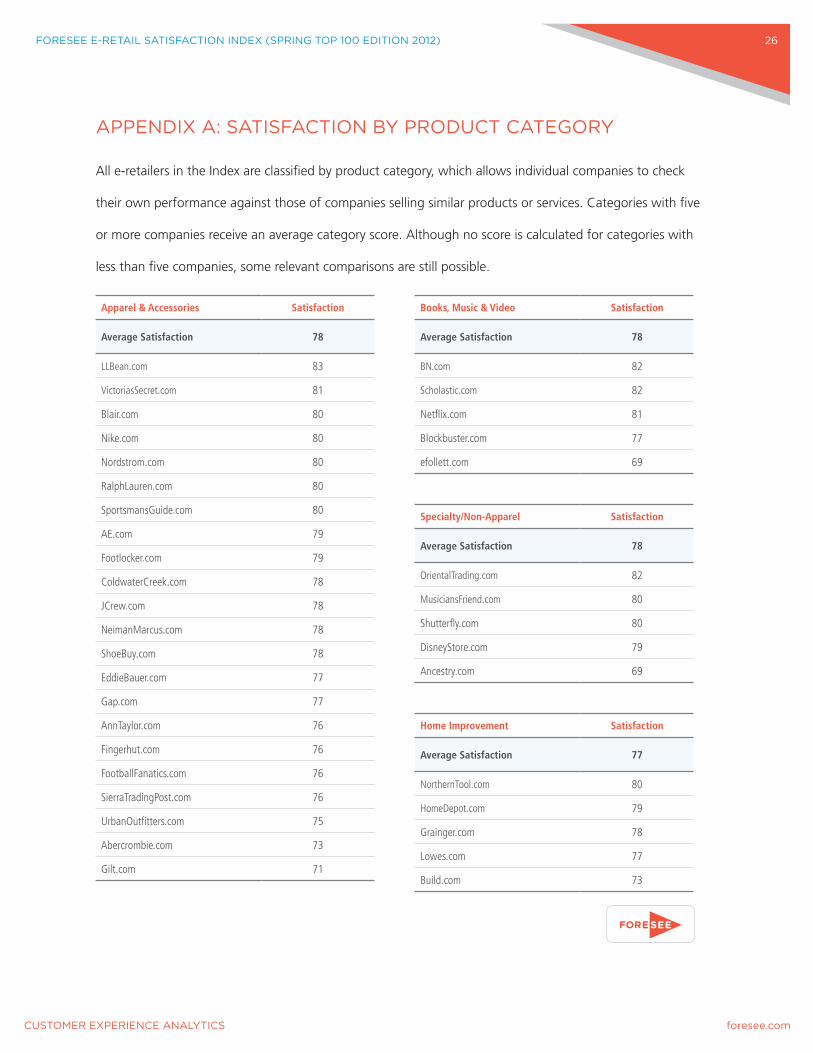
APPENDIX A: SATISFACTION BY PRODUCT CATEGORY
All e-retailers in the Index are classified by product category, which allows individual companies to check
their own performance against those of companies selling similar products or services. Categories with five
or more companies receive an average category score. Although no score is calculated for categories with
less than five companies, some relevant comparisons are still possible.
Apparel & Accessories Satisfaction
Average Satisfaction 78
LLBean.com 83
VictoriasSecret.com 81
Blair.com 80
Nike.com 80
Nordstrom.com 80
RalphLauren.com 80
SportsmansGuide.com 80
AE.com 79
Footlocker.com 79
ColdwaterCreek.com 78
JCrew.com 78
NeimanMarcus.com 78
ShoeBuy.com 78
EddieBauer.com 77
Gap.com 77
AnnTaylor.com 76
Fingerhut.com 76
FootballFanatics.com 76
SierraTradingPost.com 76
UrbanOutfitters.com 75
Abercrombie.com 73
Gilt.com 71
Books, Music & Video Satisfaction
Average Satisfaction 78
BN.com 82
Scholastic.com 82
Netflix.com 81
Blockbuster.com 77
efollett.com 69
Specialty/Non-Apparel Satisfaction
Average Satisfaction 78
OrientalTrading.com 82
MusiciansFriend.com 80
Shutterfly.com 80
DisneyStore.com 79
Ancestry.com 69
Home Improvement Satisfaction
Average Satisfaction 77
NorthernTool.com 80
HomeDepot.com 79
Grainger.com 78
Lowes.com 77
Build.com 73
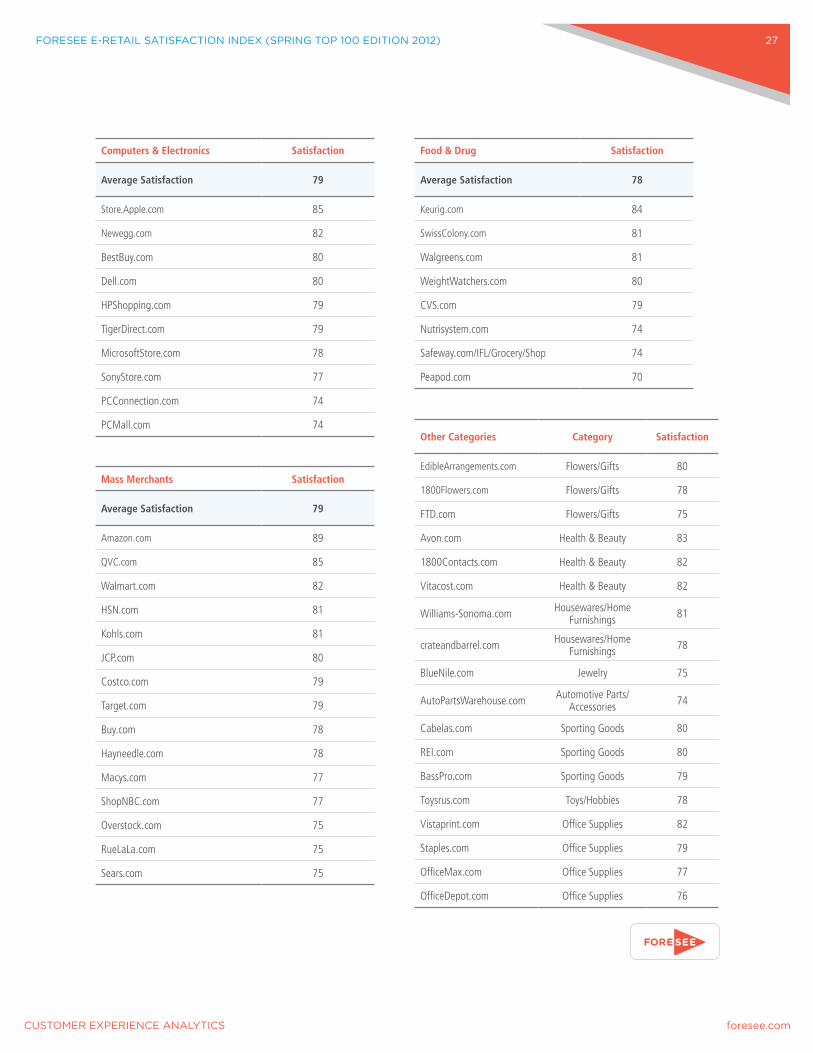
FORESEE E-RETAIL SATISFACTION INDEX (SPRING TOP 100 EDITION 2012) 27
Computers & Electronics Satisfaction
Average Satisfaction 79
Store.Apple.com 85
Newegg.com 82
BestBuy.com 80
Dell.com 80
HPShopping.com 79
TigerDirect.com 79
MicrosoftStore.com 78
SonyStore.com 77
PCConnection.com 74
PCMall.com 74
Mass Merchants Satisfaction
Average Satisfaction 79
Amazon.com 89
QVC.com 85
Walmart.com 82
HSN.com 81
Kohls.com 81
JCP.com 80
Costco.com 79
Target.com 79
Buy.com 78
Hayneedle.com 78
Macys.com 77
ShopNBC.com 77
Overstock.com 75
RueLaLa.com 75
Sears.com 75
Food & Drug Satisfaction
Average Satisfaction 78
Keurig.com 84
SwissColony.com 81
Walgreens.com 81
WeightWatchers.com 80
CVS.com 79
Nutrisystem.com 74
Safeway.com/IFL/Grocery/Shop 74
Peapod.com 70
Other Categories Category Satisfaction
EdibleArrangements.com Flowers/Gifts 80
1800Flowers.com Flowers/Gifts 78
FTD.com Flowers/Gifts 75
Avon.com Health & Beauty 83
1800Contacts.com Health & Beauty 82
Vitacost.com Health & Beauty 82
Williams-Sonoma.com Housewares/Home Furnishings 81
crateandbarrel.com Housewares/Home Furnishings 78
BlueNile.com Jewelry 75
AutoPartsWarehouse.com Automotive Parts/Accessories 74
Cabelas.com Sporting Goods 80
REI.com Sporting Goods 80
BassPro.com Sporting Goods 79
Toysrus.com Toys/Hobbies 78
Vistaprint.com Office Supplies 82
Staples.com Office Supplies 79
OfficeMax.com Office Supplies 77
OfficeDepot.com Office Supplies 76
FORESEE E-RETAIL SATISFACTION INDEX (SPRING TOP 100 EDITION 2012) 28
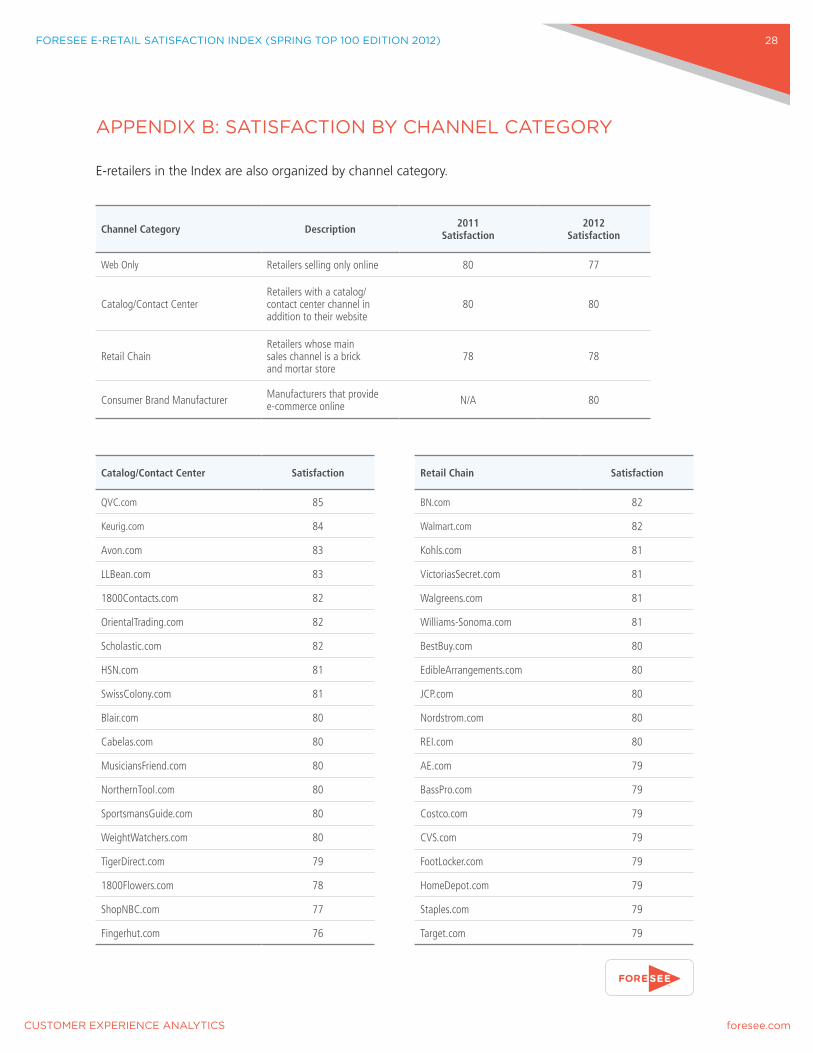
APPENDIX B: SATISFACTION BY CHANNEL CATEGORY
E-retailers in the Index are also organized by channel category.
Channel Category Description 2011 Satisfaction
2012 Satisfaction
Web Only Retailers selling only online 80 77
Catalog/Contact CenterRetailers with a catalog/contact center channel in addition to their website
80 80
Retail ChainRetailers whose main sales channel is a brick and mortar store
78 78
Consumer Brand Manufacturer Manufacturers that provide e-commerce online N/A 80
Catalog/Contact Center Satisfaction
QVC.com 85
Keurig.com 84
Avon.com 83
LLBean.com 83
1800Contacts.com 82
OrientalTrading.com 82
Scholastic.com 82
HSN.com 81
SwissColony.com 81
Blair.com 80
Cabelas.com 80
MusiciansFriend.com 80
NorthernTool.com 80
SportsmansGuide.com 80
WeightWatchers.com 80
TigerDirect.com 79
1800Flowers.com 78
ShopNBC.com 77
Fingerhut.com 76
Retail Chain Satisfaction
BN.com 82
Walmart.com 82
Kohls.com 81
VictoriasSecret.com 81
Walgreens.com 81
Williams-Sonoma.com 81
BestBuy.com 80
EdibleArrangements.com 80
JCP.com 80
Nordstrom.com 80
REI.com 80
AE.com 79
BassPro.com 79
Costco.com 79
CVS.com 79
FootLocker.com 79
HomeDepot.com 79
Staples.com 79
Target.com 79
FORESEE E-RETAIL SATISFACTION INDEX (SPRING TOP 100 EDITION 2012) 29
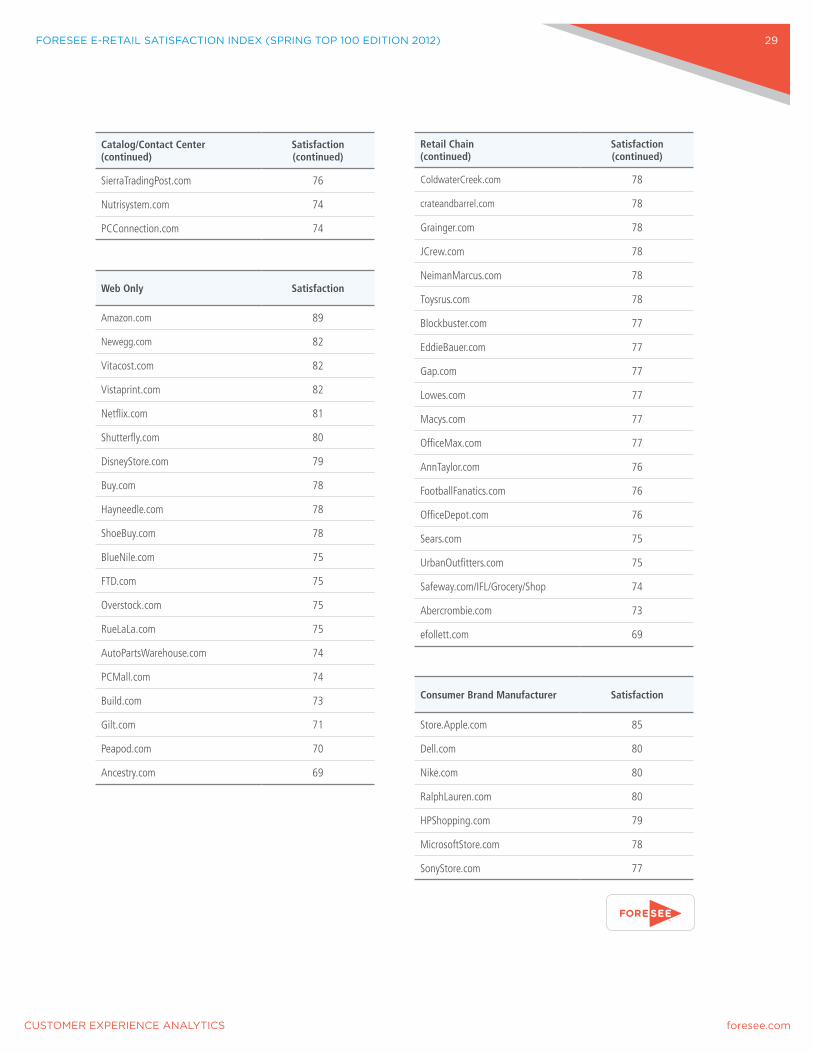
Catalog/Contact Center(continued)
Satisfaction(continued)
SierraTradingPost.com 76
Nutrisystem.com 74
PCConnection.com 74
Web Only Satisfaction
Amazon.com 89
Newegg.com 82
Vitacost.com 82
Vistaprint.com 82
Netflix.com 81
Shutterfly.com 80
DisneyStore.com 79
Buy.com 78
Hayneedle.com 78
ShoeBuy.com 78
BlueNile.com 75
FTD.com 75
Overstock.com 75
RueLaLa.com 75
AutoPartsWarehouse.com 74
PCMall.com 74
Build.com 73
Gilt.com 71
Peapod.com 70
Ancestry.com 69
Retail Chain(continued)
Satisfaction (continued)
ColdwaterCreek.com 78
crateandbarrel.com 78
Grainger.com 78
JCrew.com 78
NeimanMarcus.com 78
Toysrus.com 78
Blockbuster.com 77
EddieBauer.com 77
Gap.com 77
Lowes.com 77
Macys.com 77
OfficeMax.com 77
AnnTaylor.com 76
FootballFanatics.com 76
OfficeDepot.com 76
Sears.com 75
UrbanOutfitters.com 75
Safeway.com/IFL/Grocery/Shop 74
Abercrombie.com 73
efollett.com 69
Consumer Brand Manufacturer Satisfaction
Store.Apple.com 85
Dell.com 80
Nike.com 80
RalphLauren.com 80
HPShopping.com 79
MicrosoftStore.com 78
SonyStore.com 77