Keep Britain Tidy Report - The Royal Parks
39
Littering and recycling in St James’s and Green Parks A study to identify new ways to encourage responsible waste disposal in parks July 2015
Transcript of Keep Britain Tidy Report - The Royal Parks

Littering and recycling in
St James’s and Green Parks
A study to identify new ways to encourage
responsible waste disposal in parks
July 2015

1
CONTENTS
1. Executive Summary ....................................................................................... 2
1.1. Background ............................................................................................. 2
1.2. Aim and objectives ................................................................................. 2
1.3. Evaluation methodology ........................................................................ 2
1.4. Results and findings ................................................................................ 3
1.5. Recommendations .................................................................................. 5
2. Introduction .................................................................................................. 8
2.1. Background ............................................................................................. 8
2.2. Aim and objectives ................................................................................. 8
2.3. Methodology .......................................................................................... 8
3. Research findings ........................................................................................ 11
3.1. An overview of visitors and uses of the sites ....................................... 11
3.2. Littering behaviours .............................................................................. 12
3.3. Recycling behaviours ............................................................................ 22
4. Recommendations ...................................................................................... 29
5. Conclusions ................................................................................................. 33
Appendix A - Documentation of litter in Site C bench area ................................
2
1. Executive Summary
1.1. Background
The Royal Parks asked Keep Britain Tidy to identify new approaches to reduce littering and improve
recycling that could be implemented in Green Park and St James’s Park. It was agreed that Keep
Britain Tidy would conduct research into park users’ waste disposal behaviours and the behavioural
context of these in order to identify potential solutions that would address the drivers of incorrect
waste disposal more effectively.
1.2. Aim and objectives
The overall aim of this project was to gain insight into the behavioural drivers of incorrect waste
disposal in parks to inform future initiatives to reduce littering and improve recycling rates at St
James’s and Green Park. The research objectives were to:
1. identify recycling, littering and waste disposal behaviours at the parks
2. understand the (social, environmental and personal) contexts and drivers of these behaviours
3. identify potential interventions to address the behavioural drivers of incorrect waste disposal.
1.3. Evaluation methodology
The research was conducted at three littering hotspots identified by the Royal Parks – one located in
Green Park and two in St James’s Park. The research involved:
• behavioural observations, conducted in eight two-hour sessions per site (48 hours of
observations in total), recording a total of 426 people depositing waste items across the three
sites (either in a bin or on the ground as litter); and
• intercept interviews with 87 location users, conducted at each of the three sites alongside the
behavioural observations. The interviews were designed to encourage people to open up
about their waste disposal behaviours.
The behavioural observations and intercept interviews were conducted on different days of the week
and at varying times of day to capture a range of visitors to the parks (e.g. peak commute, lunch and
the Changing of the Guard times). Further details regarding the research methodology are provided
in the main body of the report at Section 2.3.

3
1.4. Results and findings
1.4.1. Littering behaviours
Extent of littering
Across all sites, the overwhelming majority of people put their rubbish in a bin. Despite this, rates of
littering were high; 20.1% (or 67 people) of all people observed depositing waste items during the
research littered their waste1.
What is littered?
The majority of items littered were food and drinks related (representing 63% of 76 items), though
paper items were the single biggest contributor by number (paper items includes tissues, leaflets,
receipts, transport tickets, paper bags and serviettes).
Who is littering?
When analysing littering by age and gender, more under-16s littered than any other age group (38%
of under 16s littered), and more females littered than males (24% of females compared to 17% of
males). This is the case across all age groups except for the U16s, in which males were more likely to
litter.
When are people littering?
The research identified two broad types of park users at the sites who handled waste items: leisure
visitors and commuters, with leisure visitors representing the majority of park users and being
significantly more likely to litter than commuters (24% compared to 5%).
We found a clear trend that people are more likely to litter when they are accompanied by at least
one other person, and this likelihood increases again when people are in groups of four or more. This
suggests that people feel more confident about littering when accompanied by others, and perhaps
less vulnerable to being told off for littering by strangers.
People who were sitting (either on a bench or on the ground) were significantly more likely to litter
than those who were standing or walking through the site (45% of people sitting littered compared to
15% standing and 8% walking).
1 If cigarette butts are included, this figure increases to 29.3% (125 people) observed littering. However, our
previous research has found that people treat cigarette butts differently to other types of waste, and many
people who would not normally litter other items, litter cigarettes. Therefore in this report cigarette butt
disposal is addressed separately (see boxed text on the following page and at Section 3.2.7 in the main report),
and excluded from all other results presented in this report.

4
Classification of littering behaviours
Our research found that most littering in the parks is discrete, rather than flagrant, and most people
we observed littering appeared to so habitually or subconsciously. Correct waste disposal seemed to
be low priority for them when visiting the park.
A person’s age group or who they are with does not appear to be a determining factor in the type of
littering behaviour they displayed (i.e. no one group consistently littered in a particular way), though
a larger sample size is needed to make any firm conclusions around this.
Cigarette litter analysis
Cigarette litter was found to be a major issue at the sites, representing 44% of all items littered during
the observations. More smokers (63%) littered their cigarette butts than not. The issue was most
prevalent at Site A, where 73% of items littered were cigarette butts. The underground station
entrance is heavily used by smokers before or after their journeys or while waiting to meet someone.
There is just one ashtray/cigarette bin present at the site (and across all three sites we monitored),
however this bin is not ideally situated making access by smokers difficult, and the bin currently
displays a ‘No smoking’ sign which may send confusing messages to smokers.
Appropriateness of litter bins provision in St James’s and Green Park
Overall, our observations found that the number of litter bins provided at the three sites is
appropriate. However, the design of the bins could be improved. The bins used are made from a
mesh wire, which means that there are large gaps in the walls of the bins. This allows the contents of
the bins to be easily seen for security purposes and keeps the bins light enough for emptying.
However, when a bin bag had been used to line a bin, we repeatedly saw the wind blow the bag
outside of the bin, and often rubbish with it. Park users then placed their rubbish on top of the bin
bag without rearranging it inside the bin, causing it to disperse around the bin instead of inside it.
Sometimes the bins wouldn’t be lined with a bin bag at all. This meant that when there was strong
wind, smaller items of rubbish that had been placed inside the bins flew out and littered the area.
1.1.1. Recycling behaviours
Extent of recycling at the sites
At the time of research, there were four recycling bins across the three monitoring sites – two
paper/newspaper and two mixed recycling bins. Of all waste items we observed being deposited at
the sites (in litter bins, recycling bins and on the ground as litter), 41% (or 157 items) were recyclable
in common on-the-go recycling schemes in the UK2. Unfortunately, however, just 7% of all waste
items were recycled. If The Royal Parks introduced more infrastructure and all of these items were
recycled, The Royal Parks could be on track towards achieving its target of 40% of all waste recycled
by 2016. It is our understanding that this is currently being explored by management.
2 Recyclable items include plastic drinks and food containers, coffee cups, glass bottles and jars, metal tins and
cans, paper (including magazines and newspaper) and cardboard.

5
What is being recycled?
Newspaper and paper had the highest rate of recycling at the sites (36% of these items were
recycled), while glass drinks containers had the lowest rate (none of these items were recycled). The
types of waste most commonly deposited in general waste bins that had the potential to be recycled
were coffee cups, newspaper/paper items and plastic drinks containers. Interventions that
successfully capture these waste types for recycling are therefore likely to have the biggest impact on
overall recycling rates.
Who is recycling?
16 to 24 year olds were the biggest recyclers amongst the age groups, followed by 35 to 54 year olds.
Under 16s, which was the age group that littered the most, also recycled the least. However these
results should be treated with caution due the small sample size of each age group observed.
Females were significantly more likely to deposit their recyclable waste in a recycling bin than males
(30% of females compared to 17% of males).
Drivers and barriers to recycling
The main barrier to recycling at the parks is clearly the low provision of recycling bins across the sites.
There are very few opportunities for people to recycle onsite and only the most committed are likely
to carry their recyclables with them until they find an appropriate recycling bin (either in the parks or
at other locations).
This is evidenced by our intercept interviews, in which 59% of park users we spoke to admitted they
don’t recycle at the parks. Furthermore, our interviews found that park users’ personal obligation to
recycle decreases when no facilities are provided. Park users felt that easy to find and use recycling
bins would encourage them to recycle.
The mixed recycling bin outside the toilets near Malborough Gate (Site B) was tucked away without
any signs indicating its location and could be moved to a more appropriate and prominent location.
The nearby newspapers/magazines recycling bin located by the ice cream kiosk should be changed to
or accompanied by a mixed recycling bin, as most waste generated at this site is food and drinks
related.
Finally, previous research by Keep Britain Tidy has found that one of the key barriers to using any bin
is whether it looks clean and whether users need to touch the bin in order to dispose of their item.
Therefore it is important to ensure recycling bins are kept clean and that the new bin design is easy to
use and accessible.
1.5. Recommendations
Our research found that much of the littering that occurs in St James’s and Green parks appears to be
thoughtless or subconscious, and comes from tourists and leisure visitors, rather than regular park
users. In terms of recycling, the main barrier appears to be a lack of suitable recycling bins.
Additionally, recycling was found to be a low priority for park users, with visitors being unlikely to

6
carry their recyclables with them until they find an appropriate bin (e.g. at the main gates or outside
the park). Our recommendations are therefore based around practical measures to improve the
provision of bins across the parks and make correct waste disposal easy and attractive for park
visitors.
Unfortunately due to security and conservation concerns, The Royal Parks is limited in what it can do
in terms of bin design and provision. For recycling bins, this includes only placing bins in locations
that do not obstruct main pathways through the parks and where they can be accessed by vehicle so
that they can be quickly removed if necessary. With this in mind, some of our recommendations are
intended to provide inspiration rather than be implemented immediately. However, without
improving infrastructure it is unlikely that the Royal Parks will meet its recycling rate target of 40%.
Ideally, more recycling bins than general waste bins should be provided in order to communicate to
park users the importance of and expectations around them recycling their waste.
Based on the findings of the research, we have nine recommendations for preventing littering and
increasing recycling at St James’s and Green parks, as summarised below.
1. Make doing the right thing with rubbish and recyclables easy through better bin provision and
design:
• Provide more recycling bins in easy-to-find and predictable locations (e.g. at pathway
intersections or near food and beverage kiosks).
• Provide bins for all waste streams collected in the parks at each bin location.
• Make recycling easy to understand quickly, e.g. by providing illustrations or examples of
the recyclable materials collected on the bins.
• Ensure that all bin apertures are free of items, easily accessible and facing the best
direction for easy disposal.
2. Attract attention to the bins and make doing the right thing attractive:
• Increase the salience of bins through signage, colourful or interesting bin wraps (e.g. with
pictures of landmarks, maps of the area, facts about the parks) and/or the use of
footprints to nudge people towards bins.
• Consider installing ‘fun’ interactive bins at the Marlborough Gate (Site B) and Inn The Park
(Site C) litter hotspots to draw people towards the bins, e.g. by installing the ‘world’s
deepest bin’ or voting bins (where users can indicate their preference between a number
of choices by depositing waste in the appropriate bin.
• Consider implementing a ‘Bin it for good’ campaign, whereby through correct litter
disposal or recycling, park users contribute to a local charity or cause.
• Ensure that bins are cleaned regularly (e.g. a quick wipe around the aperture with each
collection).

7
3. Show that doing the right thing with waste when at the parks is the social norm, i.e. what
most people do and/or what most people think should be done:
• Use positive reinforcement/social norming messages on signage at the parks as well as in
external communications and the Park’s website along the lines of ‘you have told us
recycling in St James’s/Green Park is important for you and we have listened, please use
the new recycling bins we have provided for you’.
• Use the rolling out of the new bins as an opportunity to reframe The Royal Parks as
‘recycling zones’ making recycling the clear norm and expected behaviour.
4. Ensure interventions are timely by reminding or prompting people to use bins correctly at the
points where they are more likely to need a litter or recycling bin:
• Place recycling reminders at litter hotspots (benches and picnic areas) and in places
where people are currently disposing of their items incorrectly.
• Place signs on general rubbish bins asking users ‘could this be recycled? Help us achieve
our 40% recycling rate’ (a recycling bin should be placed nearby if using this approach).
• Consider using messaging on cleansing staff uniforms such as ‘wildlife conservation
manager’ to prompt park users who see staff litter picking to make links between litter
and the welfare of park wildlife, and to highlight that even if they are litter picking, it is
not their job to clean up after people, but to look after the environment.
5. Consider replacing the mesh wire litter bins throughout the park.
6. Ensure that all bin lining is securely fixed to the litter bins.
7. Introduce sugar dispensers instead of sugar packets at kiosks.
8. Work with ‘Inn the Park’ to improve cleansing in the bench area around the restaurant.
9. Improve the provision of cigarette bins throughout the park, move the cigarette bin currently
provided at Site A to a more appropriate position and remove the ‘No smoking’ sign from this
bin.

8
2. Introduction
2.1. Background
The Royal Parks asked Keep Britain Tidy to identify new approaches that could be implemented at
two of its parks – Green Park and St James’s Park – to reduce littering and improve recycling. It was
agreed that Keep Britain Tidy would conduct research into park users’ waste disposal behaviours and
the behavioural context of these in order to identify potential solutions that would address the
drivers of incorrect waste disposal more effectively. The research was conducted at three littering
hotspots identified by the Royal Parks – one located in Green Park and two in St James’s Park.
2.2. Aim and objectives
The overall aim of this project was to gain insights into park users’ disposal behaviours in order to
identify potential interventions that could reduce littering and improve recycling rates at St James’s
and Green Park. The research objectives were to:
4. identify recycling, littering and waste disposal behaviours at the parks
5. understand the (social, environmental and personal) contexts and drivers of these behaviours
6. identify potential interventions to address the behavioural drivers of incorrect waste disposal.
2.3. Methodology
As detailed in the table below, we conducted behavioural observations and intercept interviews at
each of the three sites on eight different days, with each session lasting two hours. The sessions were
conducted at varying times of day to capture a range of visitors to the sites (e.g. peak commute, lunch
and the Changing of the Guard times).
Table 2: Evaluation methodology
Data collection
method Methodology
Behavioural
observations
Aim
• To gain insight into the user types, demographics, disposal behaviours and behavioural
contexts.
Data collection
• Structured naturalistic (unobtrusive) observations at the target sites using pre-coded
recording forms to identify instances of different disposal behaviours.
• Conducted by Keep Britain Tidy on varying days of the week to capture a range of park users.
• Conducted in eight two-hour sessions per site (48 hours across the three sites in total)
Analysis
Quantitative data analysis using Microsoft Excel.
Intercept
interviews
Aims
• To identify park users self-reported behaviours and perceptions on littering and recycling.

9
Data collection
method Methodology
• To gain insights into what would improve the likelihood of visitors recycling
Data collection
• Intercept interviews with site visitors across the three sites
• The interviews were conducted on varying days of the week to capture a range of site users
• The interviews were designed specifically to encourage respondents to feel comfortable
about opening up about their waste disposal behaviours.
Analysis
Qualitative and quantitative data analysed using Microsoft Excel.
2.3.1. Research sites
Site A - Green Park Station (Green Park)
Site A is located immediately outside of the new Green Park station exit. The site features a fountain
and a café kiosk and is an ideal meeting point for visitors of the park. There are four exits/entrances
to the site, and at the start of the monitoring period, there were six general bins, one
newspaper/magazines recycling bin and one cigarette bin, as shown below.
Figure 1. Site A – Green Park station
Site B - Marlborough Gate entrance (St James’s Park)
Site B is located immediately after the Marlborough gate entrance. The site features a public toilet, a
café kiosk, a seating area and an ice cream kiosk. At the start of the monitoring period, there were
five general bins, one mixed recycling bin (outside toilets) and one newspaper/magazines recycling
bin (next to ice cream kiosk), as shown in the site plan below.
Figure 2. Site B – Marlborough Gate

10
Site C - ‘Inn The Park’ (St Jame’s Park)
Site C encompasses the space around the ‘Inn the Park’ restaurant. The site features the restaurant, a
long, built-in bench for sitting around the restaurant and additional benches in front of the
lake/wildlife area. At the start of the monitoring period there were five general bins and one mixed
recycling bin, please refer to the site plan below for details.
Figure 3. Site C – Inn the Park

11
3. Research findings
3.1. An overview of visitors and uses of the sites
Site A: Green Park Station
Observations suggest the site is used mainly as a meeting point for both commuters and leisure
visitors (including independent small tour groups like the ‘Walking Tour’ and school trips). There are a
great number of commuters and leisure visitors using the site mainly for transit purposes (entry or
exit) to or from Green Park underground station. Traffic is usually high on weekdays between 8.30am
– 9.30am with commuters going to work; the traffic of leisure visitors starts to pick up from 9.30am
onwards. On weekends users of the site seem to mainly be leisure visitors arriving from 9.30am
onwards.
Due to the purpose for which park users seemed to be visiting the site (transit/meeting point), the
main waste type that could be observed was cigarette butts, followed by food packaging and general
litter which consisted mainly of used tissues.
Site B: Marlborough gate entrance area
Observations suggest that the site’s peak times are between 12.00pm – 4.30pm, with an increase in
the number of users on ‘Changing of the Guards’ days and weekends. Site users are generally leisure
visitors both local and foreign, and small independent groups (e.g. school trips) and large organised
tours.
It has been observed that the area around the toilet, especially the path, seems to be problematic;
people in transit – rather than actual park users – tend to litter while waiting for family, friends or
tour groups using the toilet facilities. The area opposite and around the café has also been found to
be highly littered during peak times, mainly with food packaging from the café despite two general
bins being located in this area.
SITE C: St James’s Park – ‘Inn The Park’ restaurant area
Observations suggest that the site’s peak times are between 12.00pm – 4.30pm, with an increase in
the number of visitors on days when there is ‘Changing of the Guards’ and on weekends. Site users
seem to generally be leisure visitors (90% of people observed), both local and foreign, and small
independent groups (e.g. school trips). The most problematic area in this site seems to be the built-in
benches outside ‘Inn The Park’ restaurant. These benches are highly used by leisure visitors,
especially families and small independent groups like school trips, as a lunch spot. Due to this use
type, noticeable amounts of litter have been recorded under and on top of the benches almost at all
sessions conducted at peak periods. Noticeable levels of litter were also found under the benches
facing the lake on weekends, also when visitors are at peak.

12
3.2. Littering behaviours
3.2.1. Extent of littering at the sites
Across all sites, we found that the overwhelming majority of people put their rubbish in a bin3. Figure
1 below shows the proportion of people who littered compared to the proportion who binned or
recycled their rubbish. Two versions of the results are presented – with cigarette butts included in the
analysis and without cigarette butts included.
Figure 4. Overall waste disposal behaviour at sites with and without cigarette disposal included in the data
Base: Incl. cig butts = 427, excl. cig butts = 334.
The rationale for excluding cigarette butts from general litter analysis is that our previous research
has found that people treat cigarette butts differently to other types of waste, and many people who
would not normally litter other items, litter cigarettes. We know that people feel that cigarette butts
are dirty and because they are on fire (and could potentially make other items catch fire if disposed of
in general litter bins) people are more likely to dispose litter them. Therefore, all analysis and results
presented in this report exclude cigarettes, except for Section 3.2.7 where the issue is addressed
separately.
Of the three sites, people were significantly less likely to litter at Site A (see Figure 2). One factor that
could help explain the difference in littering behaviours between sites is the provision of bins, with
Site A having the highest provision of bins in relation to its size4. Additionally, the research found that
people are less likely to litter when they are either standing (as opposed to sitting) or on-the-move
(see Section 3.2.4). This may contribute to the lower rates of littering seen at Site A as park users at
this site were often in transit or standing while waiting to meet people, whereas park users at sites B
and C were often using the site in a more leisurely manner, e.g. sitting and eating in groups.
3 This figure includes people who incorrectly disposed of recyclable materials in general waste bins. Recycling
behaviours are discussed further at Section 3.3. 4 However it should be noted that overall, 60% of all 67 littering incidents occurred less than five metres from a
litter bin, therefore more bins does not necessarily mean less litter.
29.3% 20.1%
70.7% 79.9%
0%
20%
40%
60%
80%
100%
Incl. cig butts Excl. cig butts
Overall waste disposal
behaviours
Binned/recycled
Littered

13
Figure 5. Waste disposal behaviour by site
Bases: Site A = 135, Site B = 100, Site C = 99.
3.2.2. What is being littered?
As shown below, the majority of items littered are food and drinks related (representing 63% of 76
items altogether), though paper items are the single biggest contributor (this includes tissues, leaflets,
receipts, transport tickets, paper bags and serviettes).
Figure 6. Item types littered
Base = 76 items littered
The five most littered item types at each site are shown in Table 3. Plastic bags appear to be more of
an issue at Site A, possibly due to its proximity to shops along Piccadilly.
9.6%26.0% 28.3%
90.4%74.0% 71.7%
0%
10%
20%
30%
40%
50%
60%
70%
80%
90%
100%
Site A Site B Site C
Disposal behaviours by site
Binned/ recycled
Littered
29%
25%14%
8%
7%
5%
5%
3% 3%
1% Item types littered
Paper
Food packaging
Food
Coffee cup
Plastic bags
Plastic drinks
Utensils
Canned drinks
Glass drink

14
Table 3: The five most littered item types at each site
Litter type Site A Site B Site C All sites
Paper 54% 23% 25% 29%
Food packaging 23% 29% 22% 25%
Food 0% 19% 16% 14%
Coffee cup 8% 10% 6% 8%
Plastic bags 15% 6% 3% 7% Base: Site A = 13, Site B = 31, Site C = 32, Overall = 76
Small items of food and drinks related packaging are a litter issue around the park kiosks, particularly
at Site B, a large portion of which were paper sugar packets. Because of their small size, even when
sugar packets were disposed of in the general rubbish bin, they constantly escaped through the mesh
wire wall of the bins or blew out in the wind, especially when bins were full. This may cause people to
perceive these sites as littered, and Keep Britain Tidy’s previous research has found that people are
more likely to litter where litter is present5. We suggest replacing the sugar packets with sugar
dispensers to reduce the amount of small litter generated around the kiosks. These kiosks already
have dispensers for other items such as milk and ketchup.
Figure 7. Various dispensers are already in place at kiosks
3.2.3. Who is littering?
Age groups
Under 16s were more likely to litter than all the other age groups, though the majority of people
observed in each age group did place their rubbish in a bin.
5 The Little Book of Litter, Keep Britain Tidy, 2012.

15
Figure 8. Proportion of people who littered in each age group
Bases: U16 = 61; 16-24 = 51; 25-34 = 104; 35-54 = 83; 55+ = 36.
Gender
Females were more likely to litter their rubbish than males across all age groups except for the U16s,
in which males were more likely to litter.
Figure 9. Proportion of people who littered by gender
Base: Females = 159; Males = 175.
3.2.4. When are people likely to litter?
When accompanied by others
There is a clear trend showing that people are more likely to litter when they are accompanied by at
least one other person, and this likelihood increases again when people are in groups of four or more.
38%16% 17% 13% 8%
62%84% 83% 87% 89%
0%
20%
40%
60%
80%
100%
U16 16 - 24 25 - 34 35 - 54 55+
Proportion of people who littered in each
age group
Littered Binned
24% 17%
76% 83%
0%
50%
100%
Female Male
Proportion of people who
littered by gender
Littered Binned

16
Figure 10. Proportion of people who littered by group size
Base: Individual = 89; Group 2-3 people = 157; Group 4+ people = 88.
This trend is apparent across all age groups except for the over 55s. The finding reflects previous
research by Keep Britain Tidy which has found that people are more likely to litter when accompanied
by others6, particularly younger age groups who tend to feel supported by their peers
7. Other factors
are also likely to contribute to the increased likelihood of people littering when in groups. For
example, people may be less willing (even subconsciously) to disrupt what they are doing in the group
to go over to a litter bin, however further research in this area is required.
Interestingly, it appears that of all group types, people are least likely to litter when in a couple (e.g.
on a date or with their partner). Previous research conducted by Keep Britain Tidy had similar
findings, with 18-25 year olds stating they would never litter in front of a date as they felt this could
be a turn-off, and they would hold reservations about dating someone who littered8.
6 Beacons of Litter, Keep Britain Tidy, 2015 (unpublished); ‘We’re Watching You’: A poster intervention trial to
reduce littering in the Beaconsfield Motorway Service Area, Keep Britain Tidy, 2015 (unpublished). 7 Soft drinks littering: Understanding young adult littering, Keep Britain Tidy, 2015 (unpublished).
8 Soft drinks littering: Understanding young adult littering, Keep Britain Tidy, 2015 (unpublished).
6%
17%
36%
0%
5%
10%
15%
20%
25%
30%
35%
40%
Individual Group 2 -3 Group 4+
Proportion of people who littered
by group size
Individual
Group 2 -3
Group 4+

17
Figure 11. Proportion of people who littered when accompanied by family, friends and partners
Bases: with family = 68; with friends/peers = 112; in a couple = 56.
When visiting for leisure/sightseeing
The research identified two broad types of park users at the sites who handled waste items: leisure
visitors and commuters. The leisure visitor category includes anyone observed who was obviously
there to sightsee or visit the park for enjoyment purposes. It includes both local and foreign visitors.
When we look at the proportion of users per type (commuter or leisure visitor) we can see that the
majority of littering was from leisure visitors.
Figure 12. Rubbish disposal behaviour – commuters and leisure visitors
Bases: Commuter = 75; Leisure visitors = 259.
The majority of leisure visitors who littered were children (aged under 16) on school trips,
representing 73% of the 63 leisure visitors seen littering. This suggests that engaging schools
5%
24%
95%
76%
0%
10%
20%
30%
40%
50%
60%
70%
80%
90%
100%
Commuter Leisure visitor
Rubbish disposal behaviour -
commuters and leisure visitors
Binned
Littered

18
participating in school trips to the parks could help to reduce littering, e.g. by highlighting the
responsibility of visiting teachers to ensure that children do not litter.
When sitting down
It is worth noting from our observations that there is a strong trend in the disposal behaviour of park
users in relation to their activity prior to disposal. Overall, people who were sitting (either on a bench
or on the ground) were significantly more likely to litter than those who were standing or walking
through the site.
Figure 13. Proportion of people who littered by action prior to waste disposal
Bases: sitting = 96; standing = 79; walking = 159.
This issue was especially noticeable in Site C, where 78% of people observed littering were sitting
down prior to waste disposal, the majority (80%) of whom were sitting on the benches located at the
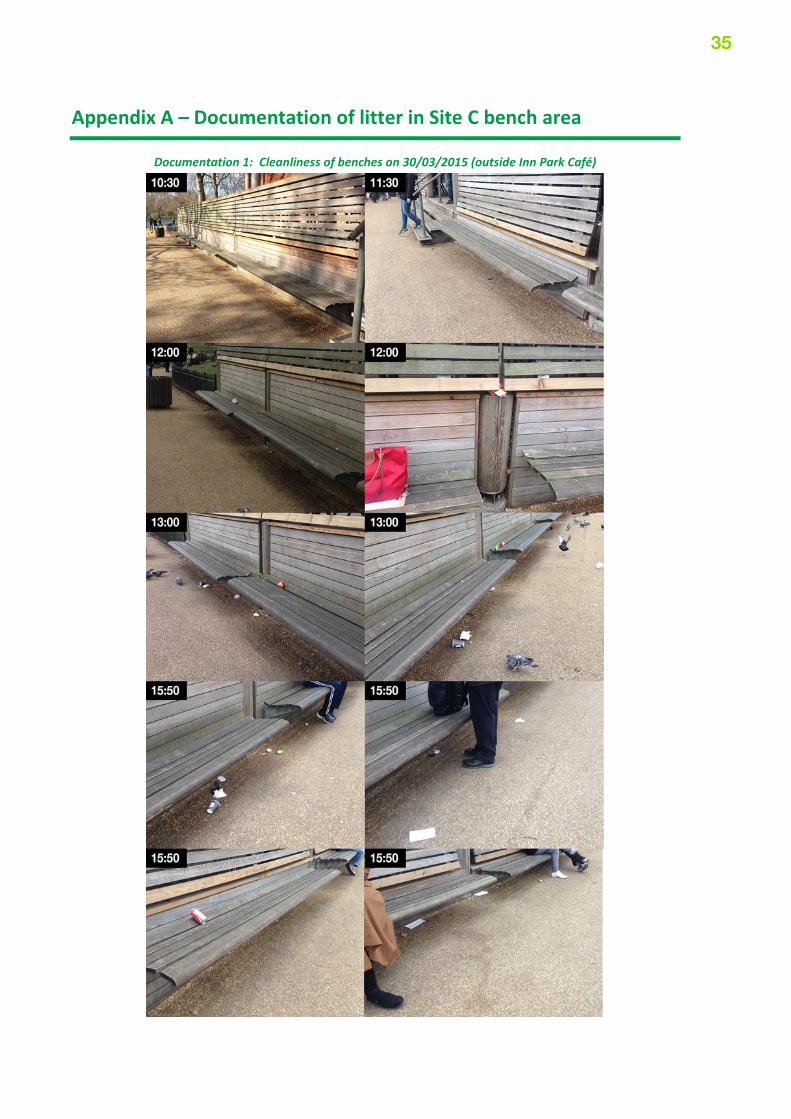
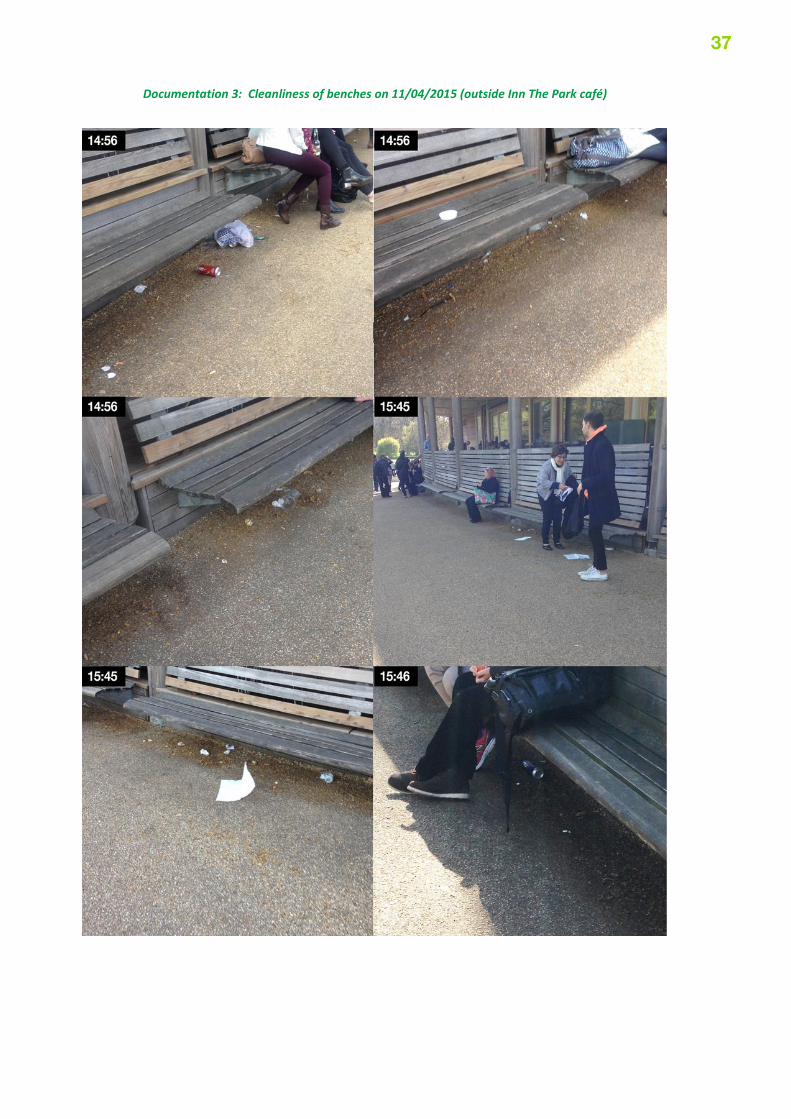
Inn the Park café9. Our observations found a clear issue with litter accumulating on and around the
benches surrounding the café and measures to increase the cleanliness of this site may in turn
discourage littering. We understand from our discussions with The Royal Parks that Inn The Park staff
are responsible for cleaning this area on a reactive basis. At the time of research this did not appear
to be sufficient (as requested, a photographic record of our observations is included with this report
at Appendix A). However, our observations suggest that most litter in this area appears to come from
leisure visitors using the benches to eat food they have brought into the park with them, rather than
from costumers of Inn the Park. Consequently, we recommend that the Royal Parks work with Inn
the Park to develop a clear and consistent routine to ensure cleaning happens around these benches
at regular intervals. For example, Inn the Park could be responsible for pre and post lunchtime
sweeps, while the Royal Parks cleanse team could be responsible for morning and evening sweeps.
9 It should be noted that the research was conducted during colder months and that during warmer periods,
this issue may simply move to grassed areas.
45%
15% 8%
55%
85% 92%
0%
20%
40%
60%
80%
100%
Sitting Standing Walking
Proportion of people who littered by
action prior to waste disposal
Littered Binned
19
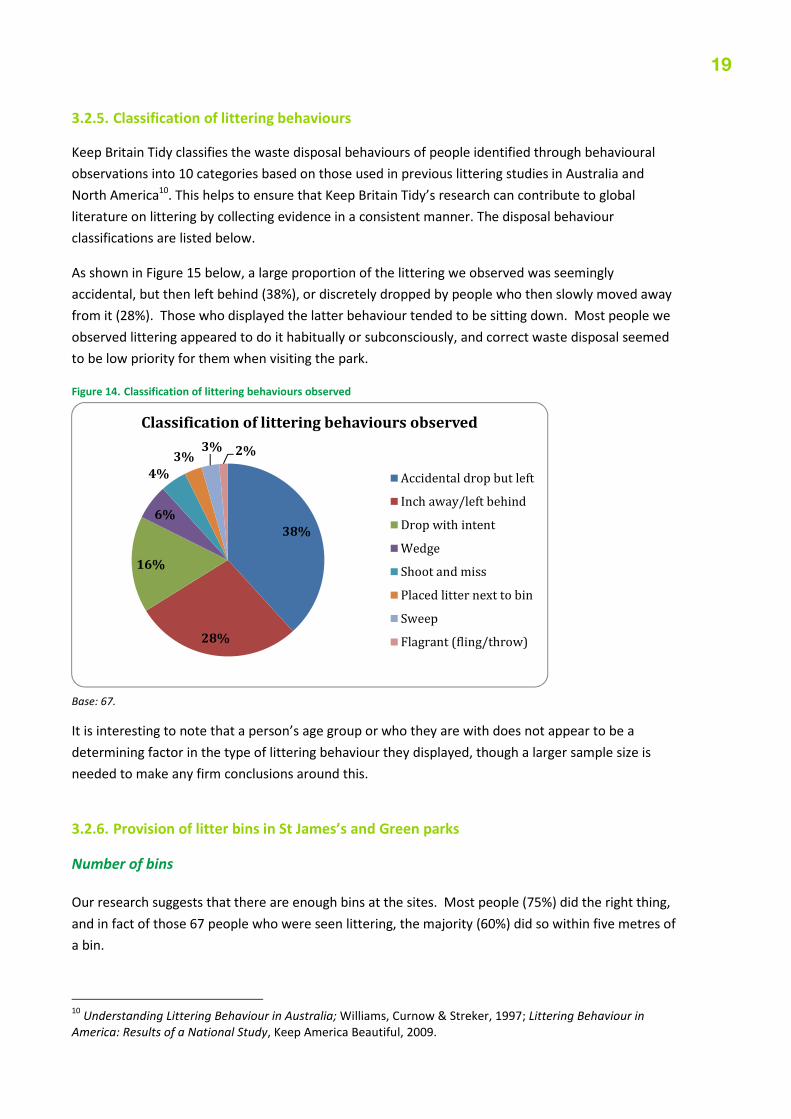
3.2.5. Classification of littering behaviours
Keep Britain Tidy classifies the waste disposal behaviours of people identified through behavioural
observations into 10 categories based on those used in previous littering studies in Australia and
North America10
. This helps to ensure that Keep Britain Tidy’s research can contribute to global
literature on littering by collecting evidence in a consistent manner. The disposal behaviour
classifications are listed below.
As shown in Figure 15 below, a large proportion of the littering we observed was seemingly
accidental, but then left behind (38%), or discretely dropped by people who then slowly moved away
from it (28%). Those who displayed the latter behaviour tended to be sitting down. Most people we
observed littering appeared to do it habitually or subconsciously, and correct waste disposal seemed
to be low priority for them when visiting the park.
Figure 14. Classification of littering behaviours observed
Base: 67.
It is interesting to note that a person’s age group or who they are with does not appear to be a
determining factor in the type of littering behaviour they displayed, though a larger sample size is
needed to make any firm conclusions around this.
3.2.6. Provision of litter bins in St James’s and Green parks
Number of bins
Our research suggests that there are enough bins at the sites. Most people (75%) did the right thing,
and in fact of those 67 people who were seen littering, the majority (60%) did so within five metres of
a bin.
10
Understanding Littering Behaviour in Australia; Williams, Curnow & Streker, 1997; Littering Behaviour in
America: Results of a National Study, Keep America Beautiful, 2009.
38%
28%
16%
6%
4%
3%3% 2%
Classification of littering behaviours observed
Accidental drop but left
Inch away/left behind
Drop with intent
Wedge
Shoot and miss
Placed litter next to bin
Sweep
Flagrant (fling/throw)

20
Bin design
Our discussions with The Royal Parks made evident that there are several specifications and
requirements that need to be considered for an optimal bin design for St James’s and Green parks.
These relate to conservation and security measures, and being able to adapt bin provision to varying
volumes of park visitors throughout the year. In this sense, the litter bins at the parks need to:
• be see-through so that rubbish disposed in the bin is identifiable from the outside;
• be lightweight, allowing bins to be moved out of the way when they are not needed (winter/low
season) or for security reasons due to specific events taking place;
• have a wide enough aperture to fit large rubbish items such as pizza boxes, a commonly
disposed item during the summer months; and
• be easily identifiable and attractive while remaining discreet in order to keep the aesthetics of
the park undisturbed. This also applies to any signage in the parks.
Current bin design issues that contribute to litter in the parks
There are currently different types of bins in use across the park. Most bins have mesh wire walls and
no lid. Sometimes they are lined with bags and sometimes left without. We were also told that
occasionally bags are placed over the top of the bin apertures to prevent people from using them, but
this is not clear to park users.
Unfortunately our observations found that the mesh wire bins are not appropriate for the sites due to
the large gaps they have in the walls of the bins. When a bin bag had been used to line a bin, we
repeatedly saw the wind blow the bag outside of the bin, and often rubbish with it. Park users then
placed their rubbish on top of the bin bag without rearranging it inside the bin, causing it to disperse
around the bin instead of inside it. Sometimes the bins wouldn’t be lined with a bin bag at all. This
meant that when there was strong wind, smaller items of rubbish that had been placed inside the
bins, such as sugar packets and receipts, flew out through the gaps in the mesh wire walls and littered
the area. We make a number of recommendations for improving the design of the bins in Section 4.

21
Figure 15. A photograph showing litter dropped on top of the bin lining inside a bin
3.2.7. Cigarette litter analysis
Cigarette litter is a major issue at the sites, representing 44% of all items littered during the
observations. Our observations show that people were more likely to litter their cigarette butts than
not (63% of smokers littered). The issue was most prevalent at Site A, where 73% of items littered
were cigarette butts. The underground station entrance is heavily used by smokers before or after
their journeys, or while waiting to meet someone.
Our observations found that the cigarette bin currently provided at Site A is not appropriate for
encouraging people to bin their cigarette butts. It is in a position that does not allow it to be used by
several people at the same time. Once one person stands in front of it, he or she blocks the access to
the bin. Additionally, a ‘no smoking’ sign is currently displayed on the bin, sending mixed messages to
smokers. Our observations suggest that moving the bin to a more appropriate location within the site
or introducing an additional cigarette bin as well as removing the ‘no smoking’ sign on the bin could
help to encourage smokers to dispose of their litter responsibly (see recommendations at Section 4).
We also recommend providing for cigarette litter across the other sites, e.g. by using general waste
bins with ash trays, to encourage people to place their cigarette butts in a bin. Keep Britain Tidy’s
previous research has found that smokers are unlikely to dispose of their cigarettes in general waste
bins as they are afraid other items could catch fire11
.
An alternative option which could have a significant impact on cigarette litter in the parks is to ban
smoking within the parks altogether.
11
Research with smokers, Keep Britain Tidy, 2013.

22
Figure 16. Cigarette bin at Site A
3.3. Recycling behaviours
3.3.1. Extent of recycling at the sites
At the time of research, there were four recycling bins across the three monitoring sites – two
paper/newspaper12
and two mixed recycling bins13
. Of all waste items we observed being deposited
at the sites (in litter bins, recycling bins and on the ground as litter), 41% (or 157 items) were
recyclable in common on-the-go recycling schemes in the UK. These items include plastic drinks and
food containers, glass bottles and jars, metal tins and cans, paper (including magazines and
newspapers), cardboard and coffee cups14
. Unfortunately, however, just 7% of all waste items were
recycled. If The Royal Parks introduced more infrastructure and all of these items were captured for
recycling, The Royal Parks could be on track towards achieving its target of 40% of all waste recycled
by 2016. It is our understanding that this option is currently being explored by management.
12
Located in Site A (near the entrance to Green Park underground) and Site B (next to the ice cream kiosk). 13
Located at Site B (outside the toilets near Malborough Gate) and Site C (near Inn The Park café). 14
While we have included coffee cups in our analysis, it should be noted that some recycling plants do not
accept coffee cups and The Royal Parks should confirm with its contractor whether coffee cups are accepted.

23
Figure 17. Disposal of recyclable items
Bases: Site A = 80; Site B = 28, Site C = 49, Total = 157.
3.3.2. What is being recycled?
Newspaper and paper had the highest rate of recycling at the sites, with 36% of these items being
recycled, while glass drinks containers had the lowest rate of recycling (no items recycled).
Figure 18. Rate of recycling per item type
Bases: Newspaper & paper = 42; plastic drinks = 31; canned drinks = 7; recyclable food packaging = 26; coffee cups = 44;
glass drink = 7.
The types of waste most commonly disposed in general waste bins at the site that had the potential
to be recycled were coffee cups (28% of recyclable items disposed), newspaper/paper items (27%)
and plastic drinks containers (20%). Interventions that successfully capture these waste types are
therefore likely to have the biggest impact on recycling rates. One approach to achieve this could be
to introduce clear signage on the recycling bins that illustrate the items that can be recycled, with the
illustrations of the most common recyclable items being more prominent (see recommendations at
Section 4).
Recycled, Site A,
20%Recycled, Site B,
14%
Recycled, Site C,
14%
Recycled, Total,
17%
Littered, Site A,
6%Littered, Site B,
14%
Littered, Site C,
24%Littered, Total,
13%
Binned, Site A,
74%
Binned, Site B,
71%
Binned, Site C,
61%Binned, Total,
69%
Pro
po
rtio
n o
f it
em
s
Site
Disposal of recyclable items
Binned
Littered
Recycled
Recycled,
Newspaper &
paper, 36%Recycled, Plastic
drinks, 19%Recycled, Canned
drinks, 14%
Recycled,
Recyclable food
packaging, 12%
Recycled, Coffee
cup, 5%
Binned/ littered,
Newspaper &
paper, 64%
Binned/ littered,
Plastic drinks,
81%
Binned/ littered,
Canned drinks,
86%
Binned/ littered,
Recyclable food
packaging, 88%
Binned/ littered,
Coffee cup, 95%Binned/ littered,
Glass drink, 100%
Pro
po
rtio
n o
f it
em
s
Item type
Rate of recycling per item type
Binned/
littered
Recycled

24
Figure 19. Example of recycling bins signage that uses illustrations to show what can be recycled
Image from www.cibshygiene.com.
Another approach that could be considered is engaging the kiosks and cafes within the park in a
campaign to increase recycling rates. Employees of the kiosks could be asked to remind customers to
‘please remember to recycle their coffee cups/plastic bottles/waste’ or to display signage at their
counters encouraging people to recycle and informing them of The Royal Parks’ recycling targets (see
recommendations at section 4).
3.3.3. Use of the newspaper/magazines recycling bin at Site A
There is currently only one recycling bin at Site A and it is a newspaper/magazines-only recycling bin.
Commuters traveling to this site seem to be using this recycling bin regularly to dispose their
newspapers. Nonetheless, of the total amount of recyclable paper disposed in the area, only 45% was
recycled, while 45% was placed in general rubbish bins and 10% was littered.
Contamination
Of all items placed in the newspaper/magazines recycling bin, by number 59% were the correct items
(newspaper/paper), while 32% of waste deposited were non-paper items, causing contamination.
However, a number of items placed in the bin were other recyclable items, indicating that changing
this bin from a newspaper/magazine to a mixed recyclables bin could help to increase recycling rates
at Green Park (see recommendations in Section 4).

25
Figure 20. Proportion of items disposed in newspaper/magazines recycling bin in Site A
Base: 22 waste items.
3.3.4. Use of recycling bins at Site B
During the first half of research, there were two recycling bins at Site B – one mixed recycling bin
outside the toilets and one newspaper/magazines recycling bin by the ice cream kiosk. These bins
were removed halfway through the research, therefore the analysis presented in this section refers
only to the eight hours of observations during which the recycling bins were in place.
The recycling bins at Site B were hardly used by park visitors. Our observations found that only seven
(13%) out of 55 people observed used either of the recycling bins when depositing waste items at the
site. Of these, only four deposited the correct recyclable items in the appropriate bin. Nonetheless,
we believe these numbers should not be a discouragement from having recycling bins at this site,
rather their provision could be improved. The locations of the bins at this site were not ideal. The
mixed recycling bin outside the public toilets near Malborough Gate was in an out-of-sight location
without any signage to assist people in finding it, meaning that only those who were previously aware
of its location or using the toilets were likely to find it. The newspaper/magazines bin located by the
kiosk was hardly used (only one instance recorded) and most waste generated at this site is food and
drinks related, therefore a mixed recycling bin would be more appropriate at this location. Overall,
recycling bins should be located in easy-to-find and predictable locations throughout the parks at the
points at which where people are most likely to need them, e.g. near food and beverage outlets
rather than by the toilets (see recommendations at Section 4).
3.3.5. Who is recycling?
Age group
16 to 24 year olds were the biggest recyclers amongst all of the age groups, followed by 35-54 year
olds. Under 16s, which was the age group that littered the most, also recycled the least.
59%14%
18%
9%
Proportion of items disposed in
newspaper/magazines recycling bin
in Site A
Paper/Newspaper
Other recyclable waste
Non recyclable waste
Unsure

26
Figure 21. Proportion of people who recycled in each age group
15%30% 23% 23% 29%
65%
60%64% 66% 57%
20%10% 14% 11% 14%
0%
20%
40%
60%
80%
100%
U16 16 - 24 25 - 34 35 - 54 55+Pro
po
rtio
n o
f p
eo
ple
ob
serv
ed
Age group
Disposal of recyclables by age group
Littered
Binned
Recycled
Bases: U16 = 20; 16-24 = 20; 25-34 = 44; 35-54 = 35; 55+ = 7.
Gender
Females were significantly more likely to deposit their recyclable waste in a recycling bin than males.
Figure 22. Proportion of people who recycled correctly/incorrectly in each age group
30%17%
56%70%
14% 13%
0%
20%
40%
60%
80%
100%
Female MalePro
po
rtio
n o
f p
eo
ple
ob
serv
ed
Gender
Disposal of recyclables by gender
Littered
Binned
Recycled
Base: Females = 57; Males = 69.
3.3.6. Barriers to recycling at the parks
Lack of recycling bins
The main barrier to recycling at the parks is clearly the low provision of recycling bins across the sites.
There are very few opportunities for people to recycle onsite and only the most committed are likely
to carry their recyclables with them until they find an appropriate recycling bin (either in the parks or
at other locations). This is evidenced by our intercept interviews, in which 59% of park users we spoke
to admitted they didn’t recycle at the parks and added that they would if there were more bins
available.
The intercept interviews also showed that the importance respondents give to recycling decreases
when no facilities are provided, as shown in Table 5 below.

27
Table 5: Intercept interview comments regarding the importance of recycling when out and about
Do you think it is important to recycle even when out and about? Proportion of
interviewees
Yes, it is always important 19%
Yes, but only if there are facilities 41%
Yes, but only if there are a lot of/easily accessible facilities 9%
Yes, but I need signage/reminders to do so 3%
Only if people want to recycle 16%
If it is compulsory 1%
No 8%
Base: 68
Intercept interviewees were asked to rate how much effort they would put into finding an
appropriate bin for their litter or recycling when challenged by three different scenarios (when ill,
when in a rush and when there were no recycling bins around), as shown in Figure 22 below. This
found that respondents’ personal obligation to recycle appears to be lowest when they feel that the
provision of facilities is inadequate. Therefore, providing more recycling bins is imperative; this is also
likely to communicate to park users that recycling is a priority to The Royal Parks.
Figure 23. Proportion of people who recycled correctly/incorrectly in each age group
Mean values based on 87 respondents
Additionally, our findings show that the design of the bins and clear signage on them is key to
increasing recycling rates and avoiding contamination. Our intercepts showed that only 15% of
respondents would always stop to think whether an item can be recycled or not when they are in a
rush, and only 11% would stop ‘sometimes’ (base was 87 respondents) strengthening the case for
easy to use, mixed recycling bins.
I DO feel like it’s too
much effort to find the
correct bin
I DO NOT feel like it’s too
much effort to find the
correct bin

28
Lack of clear signage and reminders
In our intercept interviews we asked people who said they didn’t recycle at the park what they
thought would make them more likely to recycle. Again, 59% of respondents said more bins that are
more visible or more accessible would make them more likely to recycle, while 33% of respondents
said that signs or reminders would also be useful to encourage them to use the bins. A further 6% said
greater education around recycling would encourage them to recycle more.
Table 6: Intercept answers on what makes park users more likely to recycle when in the park
What do you think would make you more likely to recycle when in the park?
More bins/more visible bins/more accessible bins 59%
Signs/reminders to help me remember to recycle 33%
Making it compulsory 27%
Education 6%
I never recycle 2%
Base: 51
Recycling bin cleanliness
Previous research conducted by Keep Britain Tidy has found that one of the key barriers to people
using a bin is perceptions of uncleanliness and whether or not they need to touch the bin in order to
dispose of their items. In the case of recycling bins at the sites, our observations showed these were
often dirty and the openings blocked by items. (See recommendations at Section 4) Part or the reason
bins are dirty seems to be the lack of cigarette ashtrays, park users are stubbing out their cigarettes
against the surface of the recycling bin, leaving black marks on it. Cigarette ashtrays could be
positioned in key spots around the park to try to avoid this issue.
Figure 24. Cigarette burn marks on the recycling bin.

29
3.3.7. Provision of recycling bins in St James’s and Green parks
All of these findings suggest that an effective approach to increasing recycling rates, especially to
achieve The Royal Parks’ recycling rate target of 40%, would be to introduce more recycling bins and
appropriate signage throughout the park. Additionally, recycling bins should be placed in prominent
locations at points where people are most likely to need them or look for them, i.e. by food and
beverage kiosks, rather than by the public toilets. Ideally, more recycling bins than general waste bins
should be provided in order to communicate to park users the importance of and expectations
around them recycling their waste. These could be located at each footpath intersection throughout
the parks or in every location where there is currently a general rubbish bin. At each location, the
bins should provide for all recyclables collected at the parks (e.g. if The Royal Parks would like to
continue collecting paper/newspapers and other mixed recyclables in separate bins, both bin types
should be provided at all sites), be clearly labelled, colour-coded and kept clean.
4. Recommendations
Our research found that much of the littering that occurs in St James’s and Green parks appears to be
thoughtless or subconscious, and comes from tourists and leisure visitors, rather than regular park
users. In terms of recycling, the main barrier appears to be a lack of suitable recycling bins.
Additionally, recycling was found to be a low priority for park users, with visitors being unlikely to
carry their recyclables with them until they find an appropriate bin (e.g. at the main gates or outside
the park). Our recommendations are therefore based around practical measures to improve the
provision of bins across the parks and make correct waste disposal easy and attractive for park
visitors.
Unfortunately due to security and conservation concerns, The Royal Parks is limited in what it can do
in terms of bin design and provision. For recycling bins, this includes only placing bins in locations
that do not obstruct main pathways through the parks and where they can be accessed by vehicle so
that they can be quickly removed if necessary. In view of this, a number of our recommendations may
not be fully appropriate for the site but are provided for inspiration. However, without improving
infrastructure it is unlikely that the Royal Parks will meet its recycling rate target of 40%. Ideally, more
recycling bins than general waste bins should be provided in order to communicate to park users the
importance of and expectations around them recycling their waste.
Our recommendations include ‘nudge’ style approaches that engage visitors at the point when they
are likely to need a bin. We suggest that ‘nudge’ approaches are appropriate in this context because
they can overcome language barriers, they aim to engage with people on a subconscious level, and
they are likely to reach a large number of people in a cost effective way. Awareness raising activities
such as stunts, community engagement stalls and one-off events, while still important, should be
lower priority, as these are likely to have the least impact at the parks due to most littering coming
from tourists and leisure visitors who do not appear to visit the parks on a regular basis. This means

30
that there is a very small window of opportunity to engage them and change their behaviour through
education without significant resource input.
We understand there is currently a plan to roll out the implementation of recycling bins across the
sites and that the design of these will be different from the current one, we emphasise the
importance of getting the design of the bins right, particularly as our intercept interviews showed that
only a small proportion of park users would always stop to think whether an item can be recycled or
not. Therefore having easy to use bins that can be quickly read and understood by users is vital to
increasing recycling rates.
In order to maximise the effectiveness of future interventions to reduce littering and increase
recycling rates, we suggest these should follow the Behavioural Insights Team’s EAST framework15
,
whereby solutions should be made Easy, Attractive, Social and Timely. Below we present a series of
recommendations under these four headlines. We also make some additional recommendations that
seek to tackle specific issues we have identified through the research.
Recommendation 1. Make doing the right things with rubbish and recyclables easy
• Provide more recycling bins in easy-to-find and predictable locations, e.g. at path intersections.
• Provide bins for all waste streams collected in the parks (e.g. newspaper/paper and mixed) at
each bin location.
• Make recycling easy to understand quickly – provide illustrations of what is collected at the bins,
use colour coding, consider using real examples of what is collected on the bins (e.g. by using the
material collected in the design of the bin or by displaying glass bottles etc. on glass recycling
bins), or use see-through bins. Emphasis could be given to the items most commonly disposed at
the parks (coffee cups, plastic bottles and paper) through displaying larger illustrations of these.
• Ensure that all bin apertures are free of items, easily accessible and facing the best direction for
easy disposal (e.g. facing outwards towards the footpath where most people walk, rather than
inwards so that people have to walk around the bin).
Recommendation 2. Attract attention to the bins and make doing the right thing attractive
• Increase the salience of bins and attract attention through signage, colourful or interesting bin
wraps (e.g. with pictures of landmarks, maps of the area, facts about the parks) and/or the use of
footprints to nudge people towards bins (e.g. green human footprints, which we have found to
be effective in parks, or animal footprints that allude to wildlife present in the parks, e.g. yellow
duck footprints for general waste and orange squirrel footprints for recycling).
• Consider installing ‘fun’ interactive bins at the Marlborough Gate (Site B) and Inn The Park (Site
C) litter hotspots to draw people towards the bins, as we found that people were more likely to
litter if they were sitting down at these locations. Examples of interactive bins include the
‘world’s deepest bin’16
and voting bins, whereby people indicate their preference between a
number of choices (e.g. members of the Royal Family , favourite park animal – duck or squirrel,
15
Behavioural Insights Team, 2014. EAST: Four simple ways to apply behavioural insights. 16
See http://www.thefuntheory.com/worlds-deepest-bin.

31
species of tree, plants that you would like to see growing in the park, etc.) by placing their
rubbish in the appropriate bin.
• Apply our ‘Bin it for good’ approach to increase recycling rates whereby through recycling, park
users are helping a cause (e.g. each item recycled could turn into a flower with The Royal Parks
promising to plant one seed for each recycling bin filled correctly).
• Ensure that bins are cleaned regularly (e.g. a quick wipe around the aperture with each
collection).
Recommendation 3. Show that doing the right thing with waste when at the parks is the social
norm i.e. what most people do and/or what most people think should be done
• Feature positive reinforcement/social norming messages in signs at the parks as well as in
external communications and the Park’s website along the lines of ‘you have told us recycling in St
James’s/Green Park is important for you and we have listened, please use the new recycling bins
we have provided for you’. These could be effective by triggering two different behavioural
motivations, ‘reciprocation’ and also the motivation of ‘preserving our public image’ or how we
are seen by others. Make sure when possible to specify the name of the park as more targeted
messages tend to be more effective than general ones.
• Use the rolling out of the new bins as an opportunity to reframe The Royal Parks as ‘recycling
zones’ making recycling the clear norm and expected behaviour. For example, signs could be
placed at the entrances informing people they are now inside a ‘recycling zone’ to make people
feel they are making a public commitment to behave accordingly. Signs could also be positioned
in the kiosks emphasizing the message that ‘80% of park users think recycling is important’.
Recommendation 4. Ensure interventions are timely by reminding or prompting people to use bins
correctly at the points where they are more likely to need a litter or recycling bin
• Place recycling reminders at litter hotspots (benches and picnic areas) and in places where people
are currently disposing of their items incorrectly. If recycling bins are placed next to or near
general rubbish bins, signs on the general rubbish bins asking users ‘could this be recycled? Help
us achieve our 40% recycling rate’ or simply having a recycling sign with a cross on top, could
prevent them from disposing recyclables in general litter bins (as long as there is a recycling bin
nearby).
• The Royal Parks cleansing staff uniforms provide an opportunity to communicate different
messages to park users in a timely manner. For example, uniforms could display the message
‘wildlife conservation manager’ to prompt park users who see staff litter picking in uniform to
make links between litter and the welfare of park wildlife, and to highlight that even if they are
litter picking, it is not their job to clean up after people, but to look after the environment.
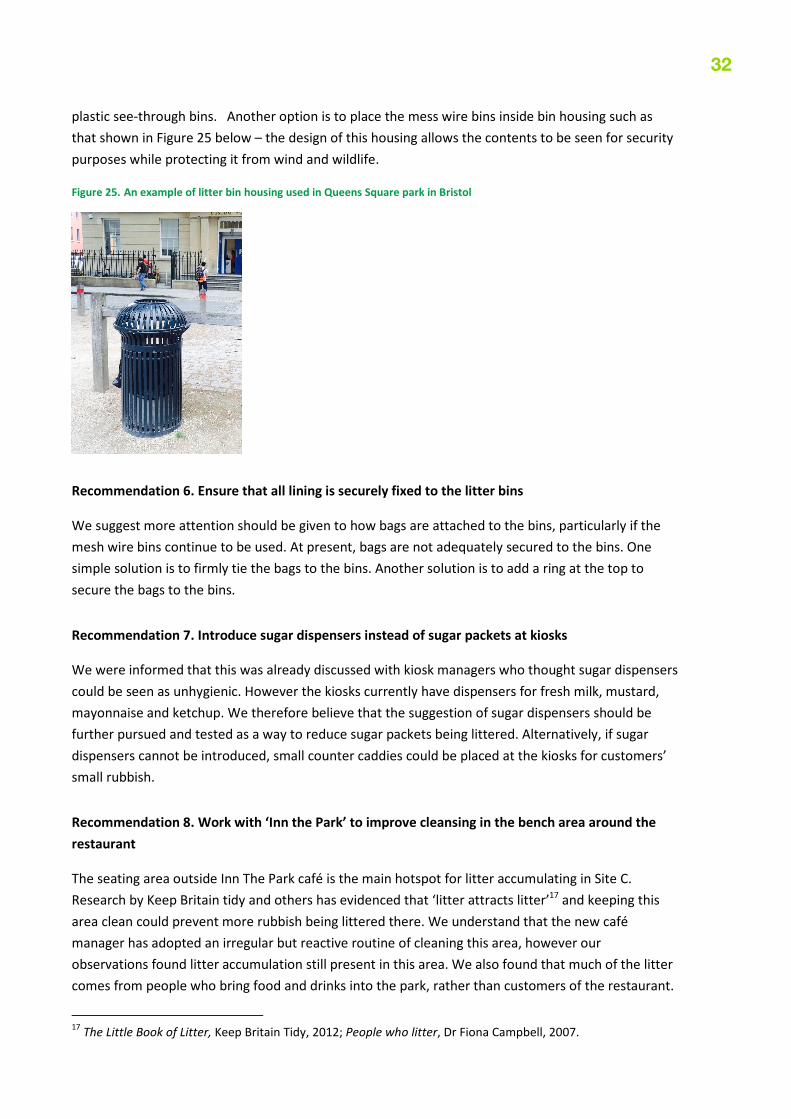
Recommendation 5. Consider replacing the mesh wire litter bins throughout the park
The current mesh wire bins are not suitable as the mesh walls allow rubbish to escape in the wind.
The wooden bin housing already being used in some locations in the park appear to work well in
containing rubbish and fitting with the aesthetics of the park. We understand that being able to see
into the bins is important for security, therefore The Royal Parks could consider alternatives, such as
32
plastic see-through bins. Another option is to place the mess wire bins inside bin housing such as
that shown in Figure 25 below – the design of this housing allows the contents to be seen for security
purposes while protecting it from wind and wildlife.
Figure 25. An example of litter bin housing used in Queens Square park in Bristol
Recommendation 6. Ensure that all lining is securely fixed to the litter bins
We suggest more attention should be given to how bags are attached to the bins, particularly if the
mesh wire bins continue to be used. At present, bags are not adequately secured to the bins. One
simple solution is to firmly tie the bags to the bins. Another solution is to add a ring at the top to
secure the bags to the bins.
Recommendation 7. Introduce sugar dispensers instead of sugar packets at kiosks
We were informed that this was already discussed with kiosk managers who thought sugar dispensers
could be seen as unhygienic. However the kiosks currently have dispensers for fresh milk, mustard,
mayonnaise and ketchup. We therefore believe that the suggestion of sugar dispensers should be
further pursued and tested as a way to reduce sugar packets being littered. Alternatively, if sugar
dispensers cannot be introduced, small counter caddies could be placed at the kiosks for customers’
small rubbish.
Recommendation 8. Work with ‘Inn the Park’ to improve cleansing in the bench area around the
restaurant
The seating area outside Inn The Park café is the main hotspot for litter accumulating in Site C.
Research by Keep Britain tidy and others has evidenced that ‘litter attracts litter’17
and keeping this
area clean could prevent more rubbish being littered there. We understand that the new café
manager has adopted an irregular but reactive routine of cleaning this area, however our
observations found litter accumulation still present in this area. We also found that much of the litter
comes from people who bring food and drinks into the park, rather than customers of the restaurant.
17
The Little Book of Litter, Keep Britain Tidy, 2012; People who litter, Dr Fiona Campbell, 2007.

33
Therefore, we recommend working with Inn the Park to develop a shared cleansing routine. For
example, The Royal Parks could cleanse every morning and evening, while Inn The Park could be
responsible for pre- and post-lunchtime cleanses, while also monitoring the site and conducting ad-
hoc cleanses as necessary.
Recommendation 9. Improve the provision of cigarette bins, particularly at Site A
Cigarette litter is a big issue at the sites, constituting 44% of all items littered during our observations.
People appear to avoid using the general waste bins for cigarette butts because they are on fire and
could melt the bin lining, while the current cigarette bin at Site A (where the issue is most prevalent)
is not located in the best location to maximise usage and displays a ‘No smoking’ sign that send a
confusing message to smokers by implying that the bin shouldn’t be used for cigarettes.
We recommend moving the current cigarette bin at Site A out to a more salient and accessible
location where more people can stand around it (e.g. at the opposite side of the Green Park
underground station entrance, across the square from its current location) and adding an additional
cigarette bin to this site.
Additionally, the ‘No smoking’ sign should be removed from the cigarette bin.
We also recommend providing for cigarette litter across the other sites, e.g. by providing ash trays
attached to the general waste bins.
5. Conclusions
Overall our observations show that the majority of site users, both commuters and leisure visitors, do
the right things with their rubbish by disposing of it in bins when in the parks. Moreover our research
suggests that park users are willing to recycle, but only where there is adequate provision for this, and
they are unlikely to carry their recyclables with them until they find the correct recycling bin.
Our findings indicate that the main cause of litter is park users not being mindful enough of their
rubbish and people littering habitually or subconsciously. Leisure visitors/tourists are also more likely
to litter than commuters or people who appear to visit regularly. These findings suggest that ‘nudge’
style approaches are the most appropriate style of intervention for encouraging correct waste
disposal at the sites (rather than awareness raising activities such as stunts or community
engagement stalls) and we have made recommendations for this. Additionally, park users are more
likely to litter when sitting down or in groups, and we have made recommendations for drawing
people towards bins and making them fun and social at sites B and C.
The main barrier for recycling in the parks is the low provision of bins and lack of signage towards
these. The park users we spoke to felt a duty to recycle, but only felt accountable when there are
enough and easy to use facilities provided. We have therefore made recommendations for improving
the provision of recycling bins.

34
Overall given the nature of park users at Green and St James’s parks, we recommend a combined
approach of improved infrastructure and prompts using the Behavioural Insight Team’s EAST
framework: that is, making interventions to encourage correct waste disposal easy, attractive, social
and timely. We believe that by implementing these measures, The Royal Park could significantly
increase recycling rates at the parks towards its target of 40% while reducing litter at the same time.
35
Appendix A – Documentation of litter in Site C bench area
Documentation 1: Cleanliness of benches on 30/03/2015 (outside Inn Park Café)

36
Documentation 2: Cleanliness of benches on 10/04/2015 (outside Inn The Park café)
37
Documentation 3: Cleanliness of benches on 11/04/2015 (outside Inn The Park café)

Keep Britain Tidy
Elizabeth House The Pier Wigan WN3 4EX T 01942 612621
Development House 56-64 Leonard Street London EC2A 4LT T 020 7549 0300
[email protected] www.keepbritaintidy.org
facebook.com/keepbritaintidy
@keepbritaintidy
Printed on 100% recycled material
This report was first published in 2014 by Keep Britain Tidy
Copyright © 2015 Keep Britain Tidy
No part of this report may be reproduced in any form whatsoever
without prior permission in writing from the publisher. Permission
will normally be given free of charge to charitable and other
non-profit making organisations.
Keep Britain Tidy is a registered charity. No. 1071737.