Katie A specialty mental health services report
12
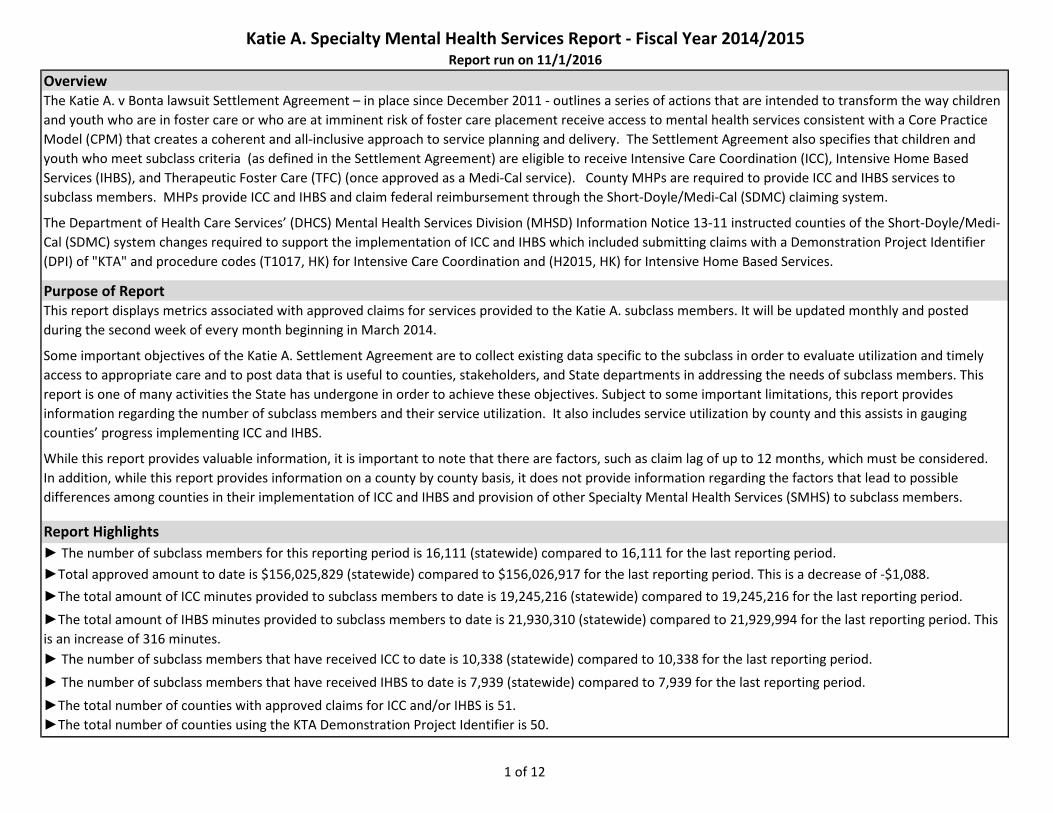
Katie A. Specialty Mental Health Services Report - Fiscal Year 2014/2015 Report run on 11/1/2016 Overview The Katie A. v Bonta lawsuit Settlement Agreement – in place since December 2011 - outlines a series of actions that are intended to transform the way children and youth who are in foster care or who are at imminent risk of foster care placement receive access to mental health services consistent with a Core Practice Model (CPM) that creates a coherent and all-inclusive approach to service planning and delivery. The Settlement Agreement also specifies that children and youth who meet subclass criteria (as defined in the Settlement Agreement) are eligible to receive Intensive Care Coordination (ICC), Intensive Home Based Services (IHBS), and Therapeutic Foster Care (TFC) (once approved as a Medi-Cal service). County MHPs are required to provide ICC and IHBS services to subclass members. MHPs provide ICC and IHBS and claim federal reimbursement through the Short-Doyle/Medi-Cal (SDMC) claiming system. The Department of Health Care Services’ (DHCS) Mental Health Services Division (MHSD) Information Notice 13-11 instructed counties of the Short-Doyle/Medi- Cal (SDMC) system changes required to support the implementation of ICC and IHBS which included submitting claims with a Demonstration Project Identifier (DPI) of "KTA" and procedure codes (T1017, HK) for Intensive Care Coordination and (H2015, HK) for Intensive Home Based Services. Purpose of Report This report displays metrics associated with approved claims for services provided to the Katie A. subclass members. It will be updated monthly and posted during the second week of every month beginning in March 2014. Some important objectives of the Katie A. Settlement Agreement are to collect existing data specific to the subclass in order to evaluate utilization and timely access to appropriate care and to post data that is useful to counties, stakeholders, and State departments in addressing the needs of subclass members. This report is one of many activities the State has undergone in order to achieve these objectives. Subject to some important limitations, this report provides information regarding the number of subclass members and their service utilization. It also includes service utilization by county and this assists in gauging counties’ progress implementing ICC and IHBS. While this report provides valuable information, it is important to note that there are factors, such as claim lag of up to 12 months, which must be considered. In addition, while this report provides information on a county by county basis, it does not provide information regarding the factors that lead to possible differences among counties in their implementation of ICC and IHBS and provision of other Specialty Mental Health Services (SMHS) to subclass members. Report Highlights ► The number of subclass members for this reporting period is 16,111 (statewide) compared to 16,111 for the last reporting period. ►Total approved amount to date is $156,025,829 (statewide) compared to $156,026,917 for the last reporting period. This is a decrease of -$1,088. ►The total amount of ICC minutes provided to subclass members to date is 19,245,216 (statewide) compared to 19,245,216 for the last reporting period. ►The total amount of IHBS minutes provided to subclass members to date is 21,930,310 (statewide) compared to 21,929,994 for the last reporting period. This is an increase of 316 minutes. ► The number of subclass members that have received ICC to date is 10,338 (statewide) compared to 10,338 for the last reporting period. ► The number of subclass members that have received IHBS to date is 7,939 (statewide) compared to 7,939 for the last reporting period. ►The total number of counties with approved claims for ICC and/or IHBS is 51. ►The total number of counties using the KTA Demonstration Project Identifier is 50. 1 of 12
Transcript of Katie A specialty mental health services report
Katie A. Specialty Mental Health Services Report - Fiscal Year 2014/2015Report run on 11/1/2016
OverviewThe Katie A. v Bonta lawsuit Settlement Agreement – in place since December 2011 - outlines a series of actions that are intended to transform the way children and youth who are in foster care or who are at imminent risk of foster care placement receive access to mental health services consistent with a Core Practice Model (CPM) that creates a coherent and all-inclusive approach to service planning and delivery. The Settlement Agreement also specifies that children and youth who meet subclass criteria (as defined in the Settlement Agreement) are eligible to receive Intensive Care Coordination (ICC), Intensive Home Based Services (IHBS), and Therapeutic Foster Care (TFC) (once approved as a Medi-Cal service). County MHPs are required to provide ICC and IHBS services to subclass members. MHPs provide ICC and IHBS and claim federal reimbursement through the Short-Doyle/Medi-Cal (SDMC) claiming system.
The Department of Health Care Services’ (DHCS) Mental Health Services Division (MHSD) Information Notice 13-11 instructed counties of the Short-Doyle/Medi-Cal (SDMC) system changes required to support the implementation of ICC and IHBS which included submitting claims with a Demonstration Project Identifier (DPI) of "KTA" and procedure codes (T1017, HK) for Intensive Care Coordination and (H2015, HK) for Intensive Home Based Services.
Purpose of ReportThis report displays metrics associated with approved claims for services provided to the Katie A. subclass members. It will be updated monthly and posted during the second week of every month beginning in March 2014.
Some important objectives of the Katie A. Settlement Agreement are to collect existing data specific to the subclass in order to evaluate utilization and timely access to appropriate care and to post data that is useful to counties, stakeholders, and State departments in addressing the needs of subclass members. This report is one of many activities the State has undergone in order to achieve these objectives. Subject to some important limitations, this report provides information regarding the number of subclass members and their service utilization. It also includes service utilization by county and this assists in gauging counties’ progress implementing ICC and IHBS.
While this report provides valuable information, it is important to note that there are factors, such as claim lag of up to 12 months, which must be considered. In addition, while this report provides information on a county by county basis, it does not provide information regarding the factors that lead to possible differences among counties in their implementation of ICC and IHBS and provision of other Specialty Mental Health Services (SMHS) to subclass members.
Report Highlights ► The number of subclass members for this reporting period is 16,111 (statewide) compared to 16,111 for the last reporting period.►Total approved amount to date is $156,025,829 (statewide) compared to $156,026,917 for the last reporting period. This is a decrease of -$1,088.►The total amount of ICC minutes provided to subclass members to date is 19,245,216 (statewide) compared to 19,245,216 for the last reporting period. ►The total amount of IHBS minutes provided to subclass members to date is 21,930,310 (statewide) compared to 21,929,994 for the last reporting period. This is an increase of 316 minutes.► The number of subclass members that have received ICC to date is 10,338 (statewide) compared to 10,338 for the last reporting period. ► The number of subclass members that have received IHBS to date is 7,939 (statewide) compared to 7,939 for the last reporting period. ►The total number of counties with approved claims for ICC and/or IHBS is 51.►The total number of counties using the KTA Demonstration Project Identifier is 50.
1 of 12
Katie A. Specialty Mental Health Services Report - Fiscal Year 2014/2015
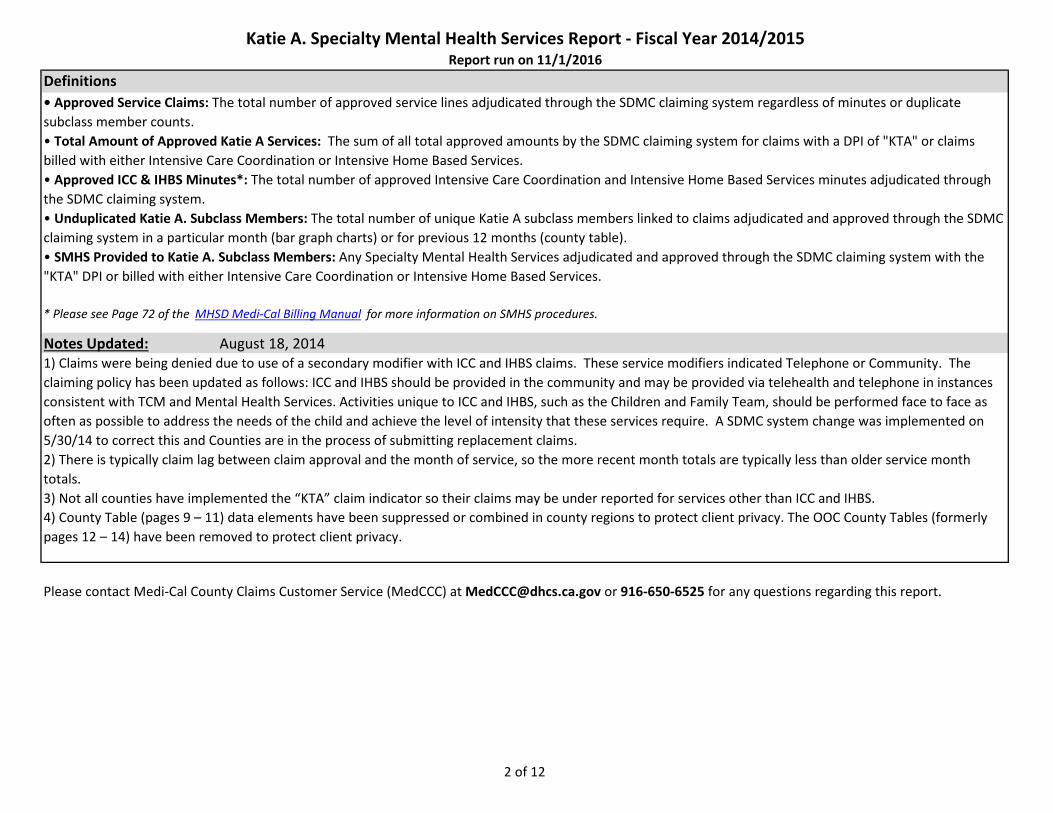
DefinitionsReport run on 11/1/2016
• Approved Service Claims: The total number of approved service lines adjudicated through the SDMC claiming system regardless of minutes or duplicate subclass member counts.• Total Amount of Approved Katie A Services: The sum of all total approved amounts by the SDMC claiming system for claims with a DPI of "KTA" or claims billed with either Intensive Care Coordination or Intensive Home Based Services.• Approved ICC & IHBS Minutes*: The total number of approved Intensive Care Coordination and Intensive Home Based Services minutes adjudicated through the SDMC claiming system.• Unduplicated Katie A. Subclass Members: The total number of unique Katie A subclass members linked to claims adjudicated and approved through the SDMC claiming system in a particular month (bar graph charts) or for previous 12 months (county table).• SMHS Provided to Katie A. Subclass Members: Any Specialty Mental Health Services adjudicated and approved through the SDMC claiming system with the "KTA" DPI or billed with either Intensive Care Coordination or Intensive Home Based Services.
* Please see Page 72 of the MHSD Medi-Cal Billing Manual for more information on SMHS procedures.
Notes Updated: August 18, 20141) Claims were being denied due to use of a secondary modifier with ICC and IHBS claims. These service modifiers indicated Telephone or Community. The claiming policy has been updated as follows: ICC and IHBS should be provided in the community and may be provided via telehealth and telephone in instances consistent with TCM and Mental Health Services. Activities unique to ICC and IHBS, such as the Children and Family Team, should be performed face to face as often as possible to address the needs of the child and achieve the level of intensity that these services require. A SDMC system change was implemented on 5/30/14 to correct this and Counties are in the process of submitting replacement claims.2) There is typically claim lag between claim approval and the month of service, so the more recent month totals are typically less than older service month totals.3) Not all counties have implemented the “KTA” claim indicator so their claims may be under reported for services other than ICC and IHBS.4) County Table (pages 9 – 11) data elements have been suppressed or combined in county regions to protect client privacy. The OOC County Tables (formerly pages 12 – 14) have been removed to protect client privacy.
Please contact Medi-Cal County Claims Customer Service (MedCCC) at [email protected] or 916-650-6525 for any questions regarding this report.
2 of 12
SMHS Provided to Katie A. Subclass Members by MonthProcedure Codes H2015 (IHBS)/T1017 (ICC), Modifier HK; And
Claims Submitted with DPI Element "KTA"Report Run on 11/1/2016
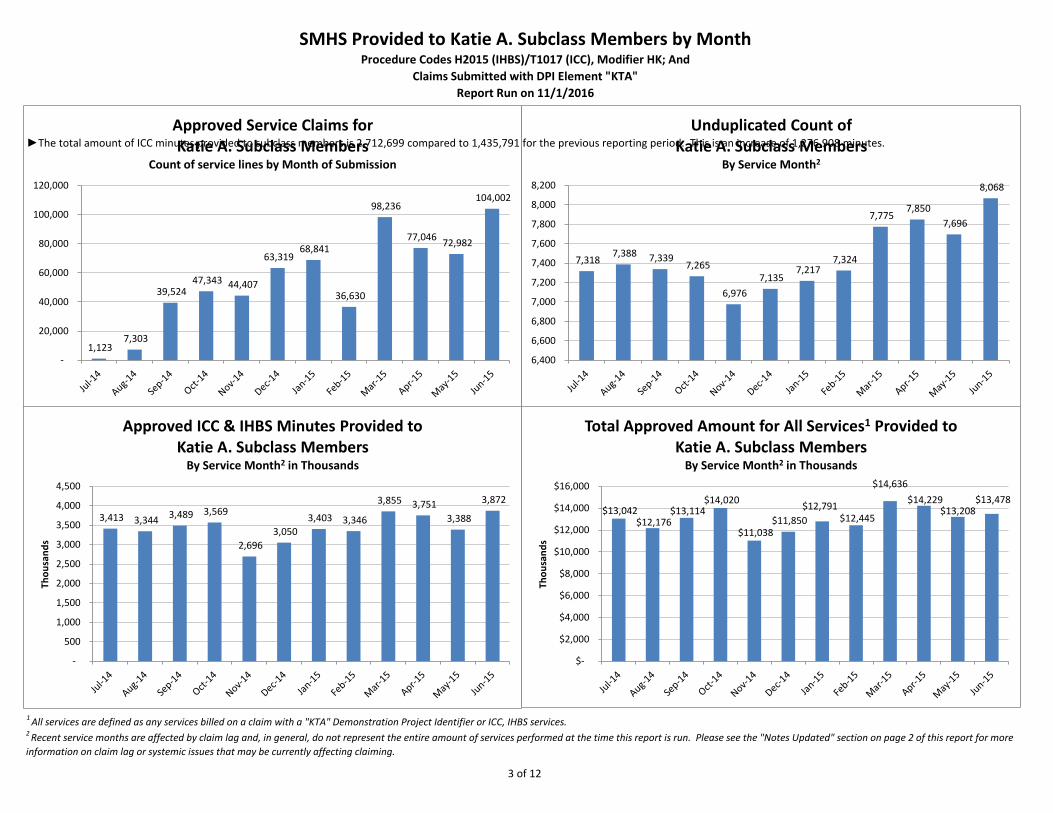
Approved Service Claims for►The total amount of ICC minutes provided to subclass members is 2,712,699 compared to 1,435,791Katie A. Subclass Members
Count of service lines by Month of Submission 120,000
100,000
80,000
60,000
40,000
20,000
-
72,982
Unduplicated Count of for the previous reporting period. This is an increase of 1,276,908 minutes.Katie A. Subclass Members
By Service Month2
8,068 8,200
8,000
7,800
7,600
7,400
7,200
7,000
6,800
6,600
6,400
7,696
2,696
4,500
4,000
3,500
3,000
2,500
2,000
1,500
1,000
500
-
Thou
sand
s
Approved ICC & IHBS Minutes Provided to Katie A. Subclass Members
By Service Month2 in Thousands$14,636 $16,000
$14,000
$12,000
$10,000
$8,000
$6,000
$4,000
$2,000
$-
Thou
sand
s
Total Approved Amount for All Services1 Provided to Katie A. Subclass Members
By Service Month2 in Thousands
104,002 98,236
77,046 68,841
63,319
47,343 44,407 39,524 36,630
7,303 1,123
7,850 7,775
7,318 7,388 7,324 7,339
7,265 7,135
7,217
6,976
3,855 3,751 3,872
3,413 3,344 3,489 3,569 3,403 3,346 3,388 3,050
$14,020 $14,229 $13,478 $12,791 $13,042 $12,176
$13,114 $11,850
$13,208 $12,445
$11,038
1 All services are defined as any services billed on a claim with a "KTA" Demonstration Project Identifier or ICC, IHBS services.2 Recent service months are affected by claim lag and, in general, do not represent the entire amount of services performed at the time this report is run. Please see the "Notes Updated" section on page 2 of this report for more information on claim lag or systemic issues that may be currently affecting claiming.
3 of 12
SMHS Provided to Katie A. Subclass Members by MonthProcedure Codes H2015 (IHBS)/T1017 (ICC), Modifier HK; And
Claims Submitted with DPI Element "KTA"Report Run on 11/1/2016
3,678
4,197
3,183
5,000
4,500
4,000
3,500
3,000
2,500
2,000
1,500
1,000
500
-
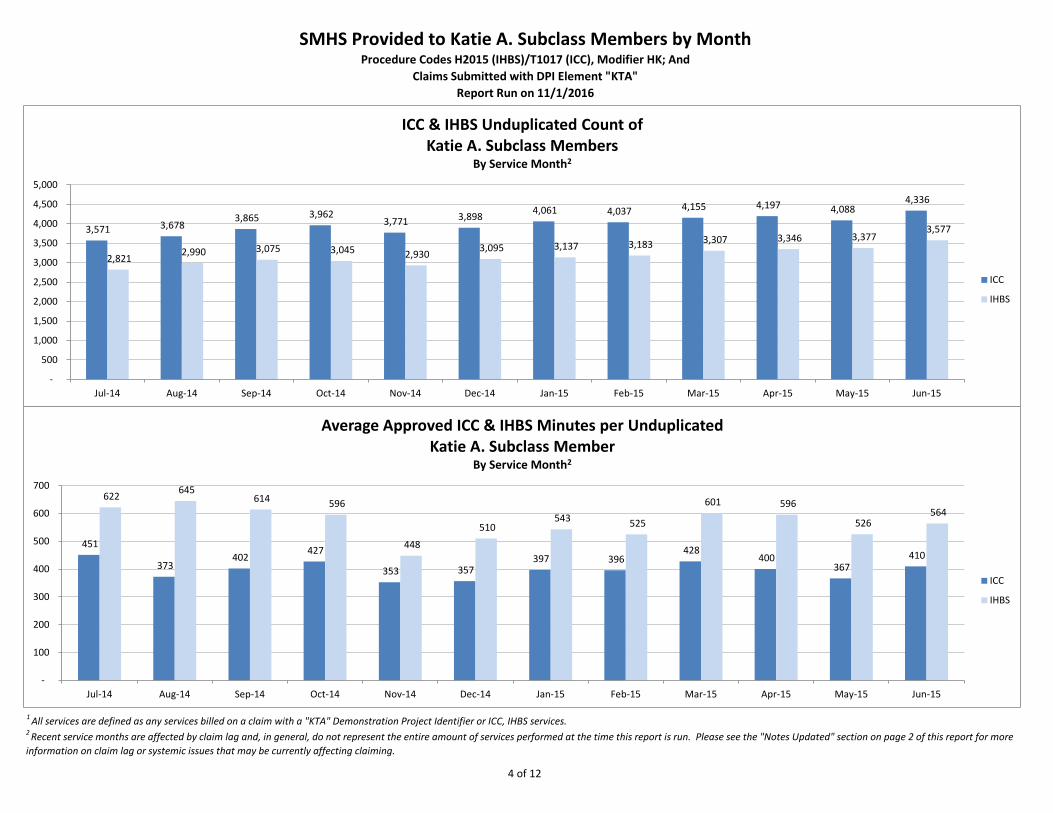
ICC & IHBS Unduplicated Count of Katie A. Subclass Members
By Service Month2
ICC
IHBS
Jun-15May-15Apr-15Mar-15Feb-15Jan-15Dec-14Nov-14Oct-14Sep-14Aug-14Jul-14
357
700
600
500
400
300
200
100
-
Average Approved ICC & IHBS Minutes per Unduplicated Katie A. Subclass Member
By Service Month2
ICC
IHBS
Jun-15May-15Apr-15Mar-15Feb-15Jan-15Dec-14Nov-14Oct-14Sep-14Aug-14Jul-14
4,336
3,865 3,962 3,771
4,061 3,898 4,037 4,155 4,088
3,571 3,307 3,346
3,577 3,377
3,075 2,990 3,045 2,930 3,137 3,095
2,821
645 614 596 601 596
564 622
543 510 526 525
451
373
448 427 402 397
428 396 410 400
367 353
1 All services are defined as any services billed on a claim with a "KTA" Demonstration Project Identifier or ICC, IHBS services.2 Recent service months are affected by claim lag and, in general, do not represent the entire amount of services performed at the time this report is run. Please see the "Notes Updated" section on page 2 of this report for more information on claim lag or systemic issues that may be currently affecting claiming.
4 of 12
SMHS Provided to Katie A. Subclass Members by MonthProcedure Codes H2015 (IHBS)/T1017 (ICC), Modifier HK; And
Claims Submitted with DPI Element "KTA"Report Run on 11/1/2016
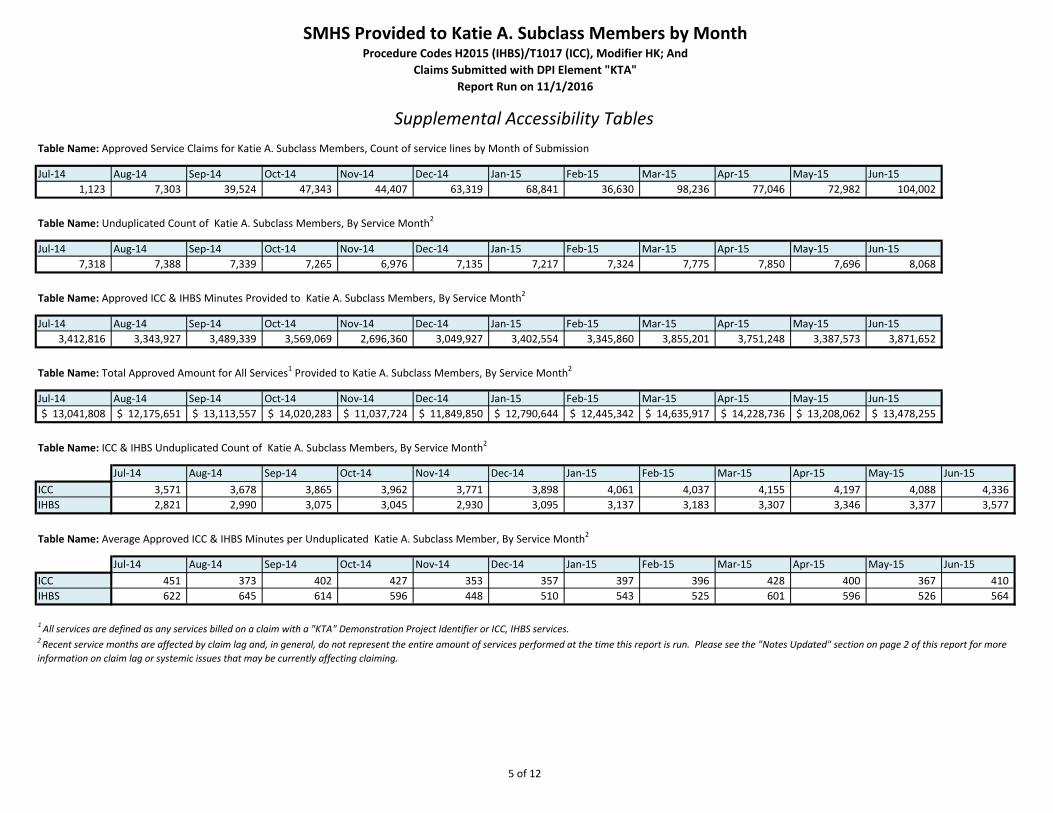
Supplemental Accessibility TablesTable Name: Approved Service Claims for Katie A. Subclass Members, Count of service lines by Month of Submission
Jul-14 Aug-14 Sep-14 Oct-14 Nov-14 Dec-14 Jan-15 Feb-15 Mar-15 Apr-15 May-15 Jun-151,123 7,303 39,524 47,343 44,407 63,319 68,841 36,630 98,236 77,046 72,982 104,002
Table Name: Unduplicated Count of Katie A. Subclass Members, By Service Month2
Jul-14 Aug-14 Sep-14 Oct-14 Nov-14 Dec-14 Jan-15 Feb-15 Mar-15 Apr-15 May-15 Jun-157,318 7,388 7,339 7,265 6,976 7,135 7,217 7,324 7,775 7,850 7,696 8,068
Table Name: Approved ICC & IHBS Minutes Provided to Katie A. Subclass Members, By Service Month2
Jul-14 Aug-14 Sep-14 Oct-14 Nov-14 Dec-14 Jan-15 Feb-15 Mar-15 Apr-15 May-15 Jun-153,412,816 3,343,927 3,489,339 3,569,069 2,696,360 3,049,927 3,402,554 3,345,860 3,855,201 3,751,248 3,387,573 3,871,652
Table Name: Total Approved Amount for All Services1 Provided to Katie A. Subclass Members, By Service Month2
Jul-14 Aug-14 Sep-14 Oct-14 Nov-14 Dec-14 Jan-15 Feb-15 Mar-15 Apr-15 May-15 Jun-15$ 13,041,808 $ 12,175,651 $ 13,113,557 $ 14,020,283 $ 11,037,724 $ 11,849,850 $ 12,790,644 $ 12,445,342 $ 14,635,917 $ 14,228,736 $ 13,208,062 $ 13,478,255
Table Name: ICC & IHBS Unduplicated Count of Katie A. Subclass Members, By Service Month2
Jul-14 Aug-14 Sep-14 Oct-14 Nov-14 Dec-14 Jan-15 Feb-15 Mar-15 Apr-15 May-15 Jun-15ICC 3,571 3,678 3,865 3,962 3,771 3,898 4,061 4,037 4,155 4,197 4,088 4,336IHBS 2,821 2,990 3,075 3,045 2,930 3,095 3,137 3,183 3,307 3,346 3,377 3,577
Table Name: Average Approved ICC & IHBS Minutes per Unduplicated Katie A. Subclass Member, By Service Month2
Jul-14 Aug-14 Sep-14 Oct-14 Nov-14 Dec-14 Jan-15 Feb-15 Mar-15 Apr-15 May-15 Jun-15ICC 451 373 402 427 353 357 397 396 428 400 367 410IHBS 622 645 614 596 448 510 543 525 601 596 526 564
1 All services are defined as any services billed on a claim with a "KTA" Demonstration Project Identifier or ICC, IHBS services.2 Recent service months are affected by claim lag and, in general, do not represent the entire amount of services performed at the time this report is run. Please see the "Notes Updated" section on page 2 of this report for more information on claim lag or systemic issues that may be currently affecting claiming.
5 of 12
SMHS Provided to Katie A. Subclass Members Treated Out of County (OOC)1 by MonthProcedure Codes H2015 (IHBS)/T1017 (ICC), Modifier HK; And
Claims Submitted with DPI Element "KTA"Report Run on 11/1/2016
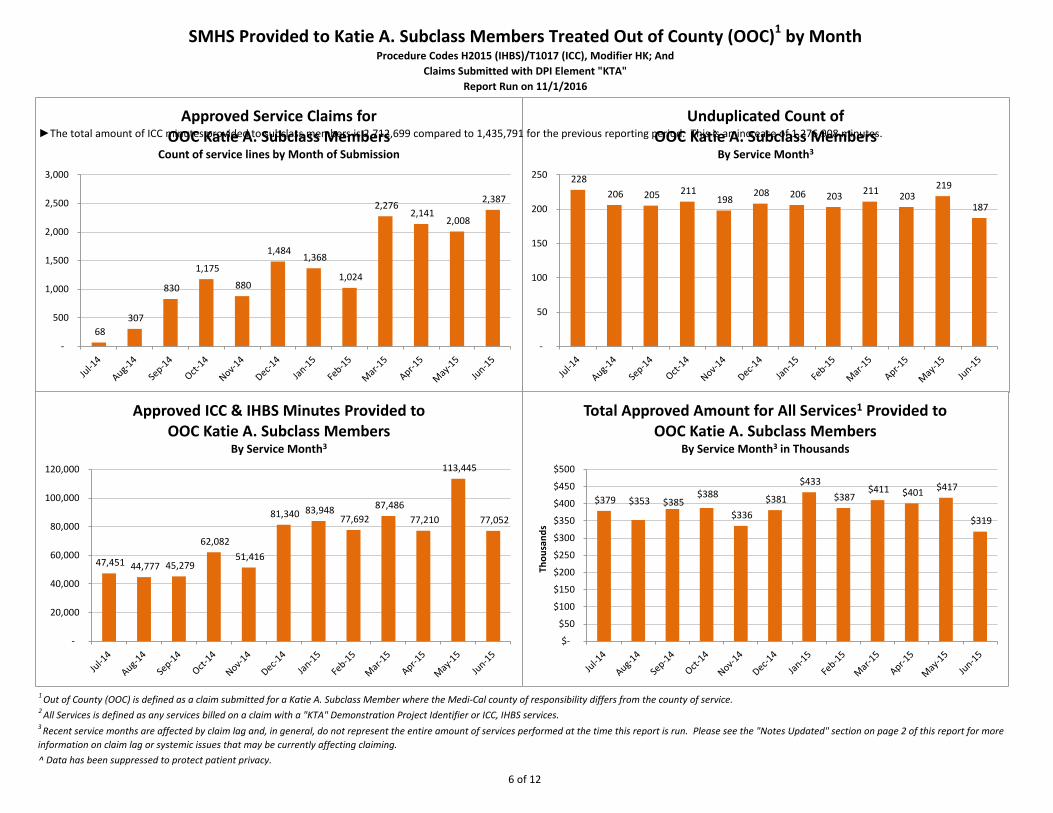
Approved Service Claims for►The total amount of ICC minutes provided to subclass members is 2,712,699 compared to 1,435,791OOC Katie A. Subclass Members
Count of service lines by Month of Submission 3,000
2,500
2,000
1,500
1,000
500
-
307
830
Unduplicated Count of for the previous reporting period. This is an increase of 1,276,908 minutes.OOC Katie A. Subclass Members
By Service Month3
250
200
150
100
50
-
228 206 205 211
198 208 206 203 211 219
203 187
2,387 2,276 2,141
2,008
1,484 1,368
1,175
880 1,024
68
51,416
113,445 120,000
100,000
80,000
60,000
40,000
20,000
-
Approved ICC & IHBS Minutes Provided to OOC Katie A. Subclass Members
By Service Month3
$417
$319
$500
$450
$400
$350
$300
$250
$200
$150
$100
$50
$-
Thou
sand
s
Total Approved Amount for All Services1 Provided to OOC Katie A. Subclass Members
By Service Month3 in Thousands
$433 $387 $381 $388
$385 $353 $379 $411 $401
$336 81,340 83,948 77,692
87,486 77,210 77,052
62,082
47,451 44,777 45,279
1 Out of County (OOC) is defined as a claim submitted for a Katie A. Subclass Member where the Medi-Cal county of responsibility differs from the county of service.2 All Services is defined as any services billed on a claim with a "KTA" Demonstration Project Identifier or ICC, IHBS services.
^ Data has been suppressed to protect patient privacy.
3 Recent service months are affected by claim lag and, in general, do not represent the entire amount of services performed at the time this report is run. Please see the "Notes Updated" section on page 2 of this report for more information on claim lag or systemic issues that may be currently affecting claiming.
6 of 12
SMHS Provided to Katie A. Subclass Members Treated Out of County (OOC)1 by MonthProcedure Codes H2015 (IHBS)/T1017 (ICC), Modifier HK; And
Claims Submitted with DPI Element "KTA"Report Run on 11/1/2016
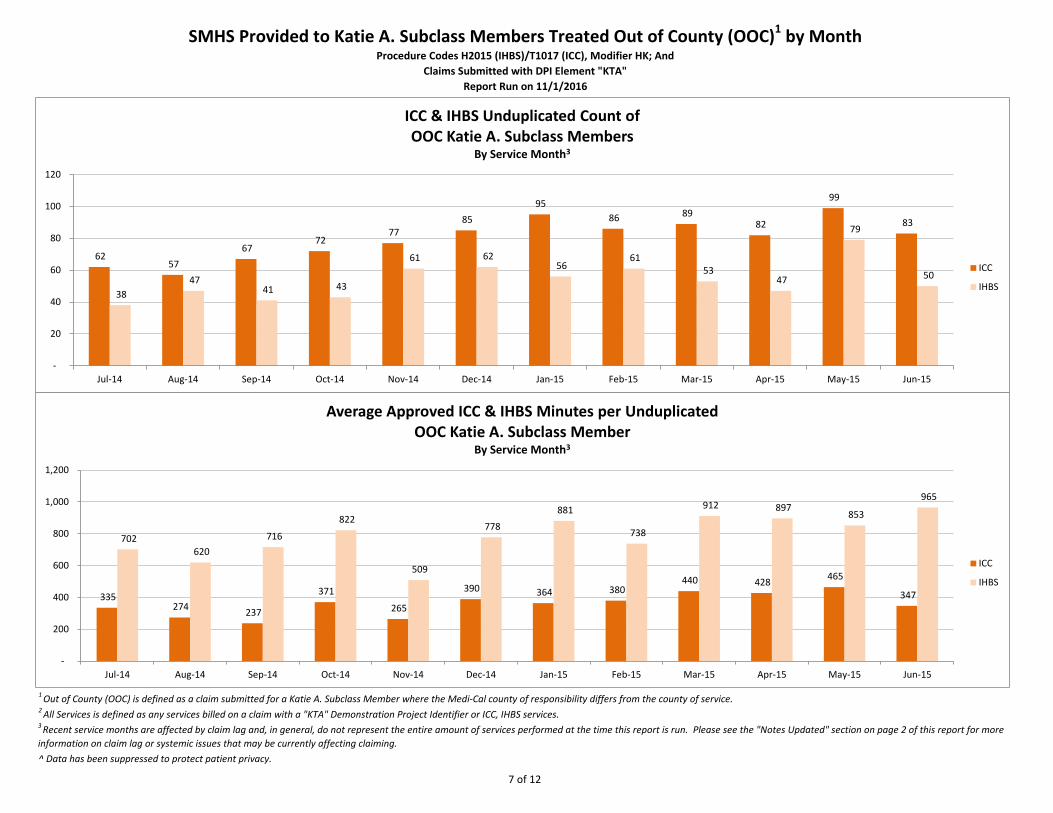
53
120
100
80
60
40
20
-
ICC & IHBS Unduplicated Count of OOC Katie A. Subclass Members
By Service Month3
ICC
IHBS
Jun-15May-15Apr-15Mar-15Feb-15Jan-15Dec-14Nov-14Oct-14Sep-14Aug-14Jul-14
335
738
1,200
1,000
800
600
400
200
-
Average Approved ICC & IHBS Minutes per Unduplicated OOC Katie A. Subclass Member
By Service Month3
ICC
IHBS
Jun-15May-15Apr-15Mar-15Feb-15Jan-15Dec-14Nov-14Oct-14Sep-14Aug-14Jul-14
95 99
86 85 77
89 79 83 82
67 57
72
61 56
62 61 62
47 38 41
47 43 50
965
822 881 912 897
853 778
702 716 620
465
347 428 440
380
509
364 390 371 274 265 237
1 Out of County (OOC) is defined as a claim submitted for a Katie A. Subclass Member where the Medi-Cal county of responsibility differs from the county of service.2 All Services is defined as any services billed on a claim with a "KTA" Demonstration Project Identifier or ICC, IHBS services.3 Recent service months are affected by claim lag and, in general, do not represent the entire amount of services performed at the time this report is run. Please see the "Notes Updated" section on page 2 of this report for more information on claim lag or systemic issues that may be currently affecting claiming.^ Data has been suppressed to protect patient privacy.
7 of 12
SMHS Provided to Katie A. Subclass Members Treated Out of County (OOC)1 by MonthProcedure Codes H2015 (IHBS)/T1017 (ICC), Modifier HK; And
Claims Submitted with DPI Element "KTA"Report Run on 11/1/2016
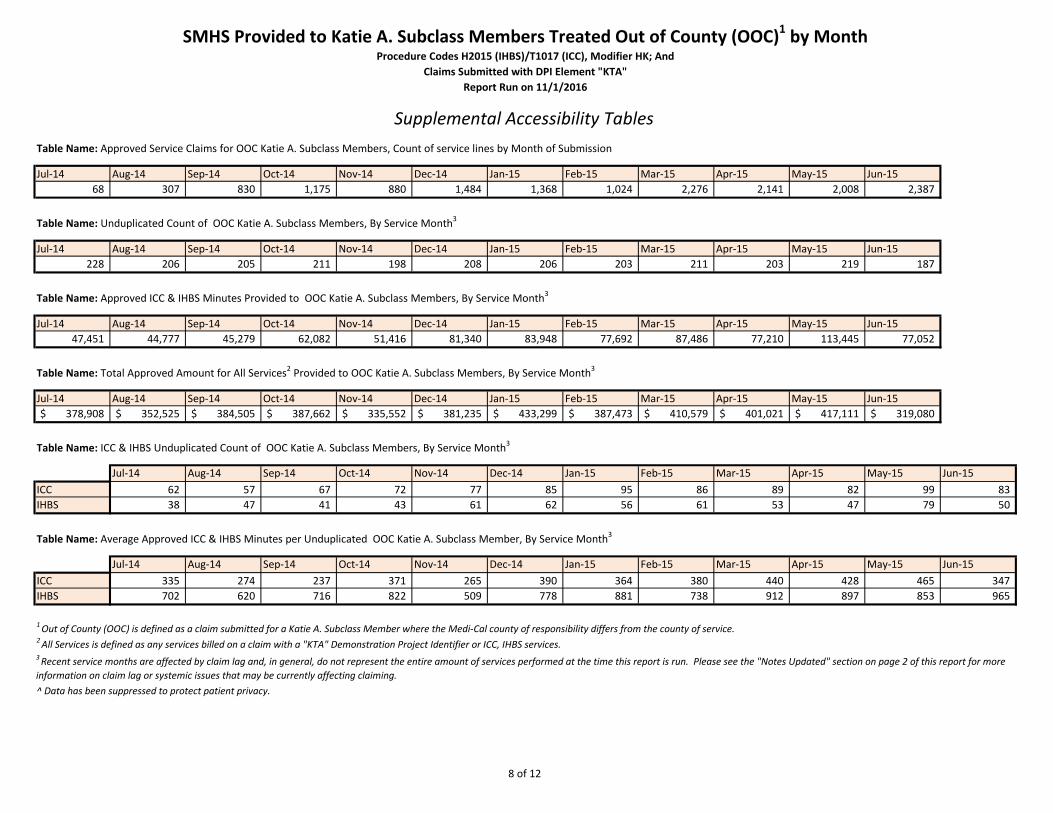
Supplemental Accessibility TablesTable Name: Approved Service Claims for OOC Katie A. Subclass Members, Count of service lines by Month of Submission
Jul-14 Aug-14 Sep-14 Oct-14 Nov-14 Dec-14 Jan-15 Feb-15 Mar-15 Apr-15 May-15 Jun-1568 307 830 1,175 880 1,484 1,368 1,024 2,276 2,141 2,008 2,387
Table Name: Unduplicated Count of OOC Katie A. Subclass Members, By Service Month3
Jul-14 Aug-14 Sep-14 Oct-14 Nov-14 Dec-14 Jan-15 Feb-15 Mar-15 Apr-15 May-15 Jun-15228 206 205 211 198 208 206 203 211 203 219 187
Table Name: Approved ICC & IHBS Minutes Provided to OOC Katie A. Subclass Members, By Service Month3
Jul-14 Aug-14 Sep-14 Oct-14 Nov-14 Dec-14 Jan-15 Feb-15 Mar-15 Apr-15 May-15 Jun-1547,451 44,777 45,279 62,082 51,416 81,340 83,948 77,692 87,486 77,210 113,445 77,052
Table Name: Total Approved Amount for All Services2 Provided to OOC Katie A. Subclass Members, By Service Month3
Jul-14 Aug-14 Sep-14 Oct-14 Nov-14 Dec-14 Jan-15 Feb-15 Mar-15 Apr-15 May-15 Jun-15$ 378,908 $ 352,525 $ 384,505 $ 387,662 $ 335,552 $ 381,235 $ 433,299 $ 387,473 $ 410,579 $ 401,021 $ 417,111 $ 319,080
Table Name: ICC & IHBS Unduplicated Count of OOC Katie A. Subclass Members, By Service Month3
Jul-14 Aug-14 Sep-14 Oct-14 Nov-14 Dec-14 Jan-15 Feb-15 Mar-15 Apr-15 May-15 Jun-15ICC 62 57 67 72 77 85 95 86 89 82 99 83IHBS 38 47 41 43 61 62 56 61 53 47 79 50
Table Name: Average Approved ICC & IHBS Minutes per Unduplicated OOC Katie A. Subclass Member, By Service Month3
Jul-14 Aug-14 Sep-14 Oct-14 Nov-14 Dec-14 Jan-15 Feb-15 Mar-15 Apr-15 May-15 Jun-15ICC 335 274 237 371 265 390 364 380 440 428 465 347IHBS 702 620 716 822 509 778 881 738 912 897 853 965
3 Recent service months are affected by claim lag and, in general, do not represent the entire amount of services performed at the time this report is run. Please see the "Notes Updated" section on page 2 of this report for more information on claim lag or systemic issues that may be currently affecting claiming.
1 Out of County (OOC) is defined as a claim submitted for a Katie A. Subclass Member where the Medi-Cal county of responsibility differs from the county of service.2 All Services is defined as any services billed on a claim with a "KTA" Demonstration Project Identifier or ICC, IHBS services.
^ Data has been suppressed to protect patient privacy.
8 of 12
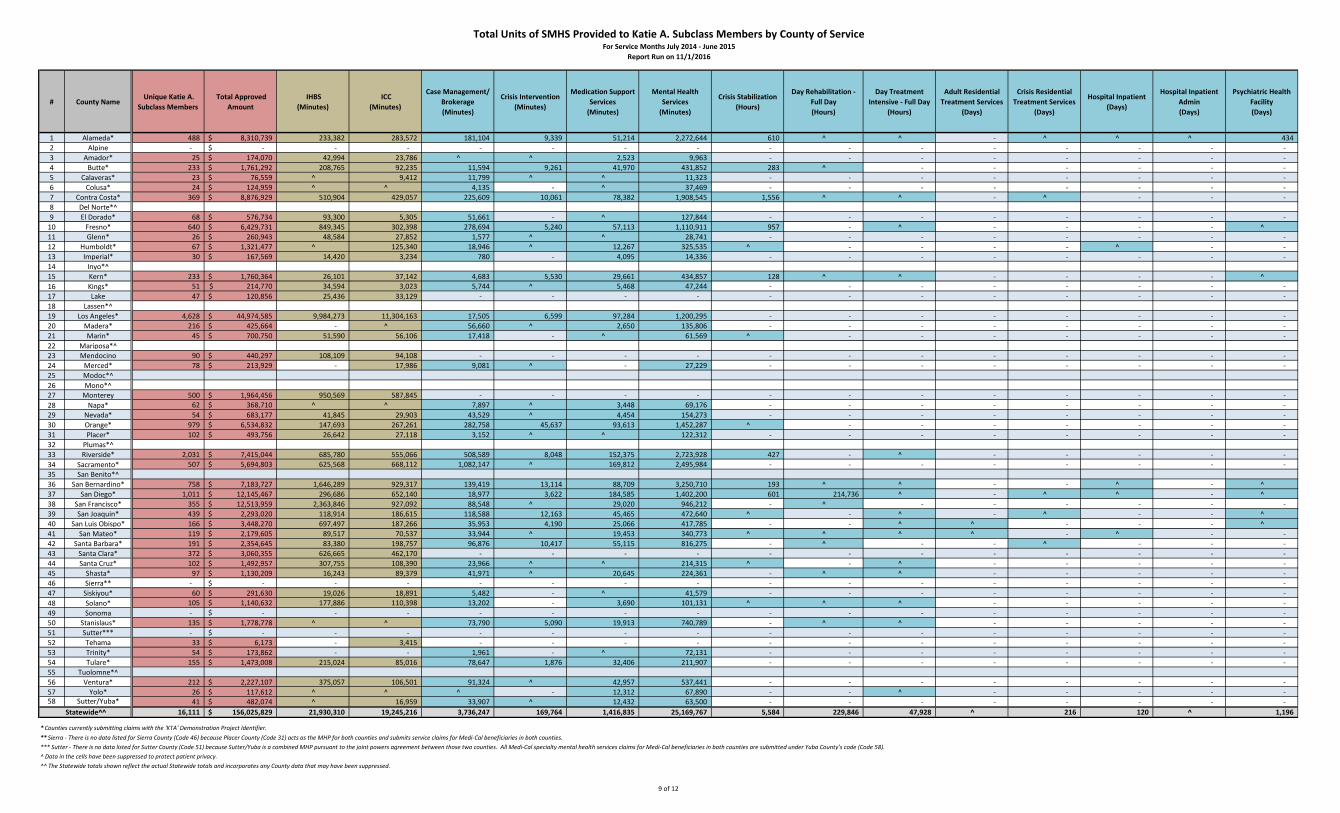
Total Units of SMHS Provided to Katie A. Subclass Members by County of ServiceFor Service Months July 2014 - June 2015
Report Run on 11/1/2016
# County Name Unique Katie A.
Subclass Members Total Approved
Amount IHBS
(Minutes) ICC
(Minutes)
Case Management/ Brokerage (Minutes)
Crisis Intervention (Minutes)
Medication Support Services
(Minutes)
Mental Health Services
(Minutes)
Crisis Stabilization (Hours)
Day Rehabilitation - Full Day(Hours)
Day Treatment Intensive - Full Day
(Hours)
Adult Residential Treatment Services
(Days)
Crisis Residential Treatment Services
(Days)
Hospital Inpatient (Days)
Hospital Inpatient Admin (Days)
Psychiatric Health Facility (Days)
1 Alameda* 488 $ 8,310,739 233,382 283,572 181,104 9,339 51,214 2,272,644 610 ^ ^ - ^ ^ ^ 4342 Alpine - $ - - - - - - - - - - - - - - -3 Amador* 25 $ 174,070 42,994 23,786 ^ ^ 2,523 9,963 - - - - - - - -4 Butte* 233 $ 1,761,292 208,765 92,235 11,594 9,261 41,970 431,852 283 ^ - - - - - -5 Calaveras* 23 $ 76,559 ^ 9,412 11,799 ^ ^ 11,323 - - - - - - - -6 Colusa* 24 $ 124,959 ^ ^ 4,135 - ^ 37,469 - - - - - - - -7 Contra Costa* 369 $ 8,876,929 510,904 429,057 225,609 10,061 78,382 1,908,545 1,556 ^ ^ - ^ - - -8 Del Norte*^9 El Dorado* 68 $ 576,734 93,300 5,305 51,661 - ^ 127,844 - - - - - - - -
10 Fresno* 640 $ 6,429,731 849,345 302,398 278,694 5,240 57,113 1,110,911 957 - ^ - - - - ^11 Glenn* 26 $ 260,943 48,584 27,852 1,577 ^ ^ 28,741 - - - - - - - -12 Humboldt* 67 $ 1,321,477 ^ 125,340 18,946 ^ 12,267 325,535 ^ - - - - ^ - -13 Imperial* 30 $ 167,569 14,420 3,234 780 - 4,095 14,336 - - - - - - - -14 Inyo*^15 Kern* 233 $ 1,760,364 26,101 37,142 4,683 5,530 29,661 434,857 128 ^ ^ - - - - ^16 Kings* 51 $ 214,770 34,594 3,023 5,744 ^ 5,468 47,244 - - - - - - - -17 Lake 47 $ 120,856 25,436 33,129 - - - - - - - - - - - -18 Lassen*^19 Los Angeles* 4,628 $ 44,974,585 9,984,273 11,304,163 17,505 6,599 97,284 1,200,295 - - - - - - - -20 Madera* 216 $ 425,664 - ^ 56,660 ^ 2,650 135,806 - - - - - - - -21 Marin* 45 $ 700,750 51,590 56,106 17,418 - ^ 61,569 ^ - - - - - - -22 Mariposa*^23 Mendocino 90 $ 440,297 108,109 94,108 - - - - - - - - - - - -24 Merced* 78 $ 213,929 - 17,986 9,081 ^ - 27,229 - - - - - - - -25 Modoc*^26 Mono*^27 Monterey 500 $ 1,964,456 950,569 587,845 - - - - - - - - - - - -28 Napa* 62 $ 368,710 ^ ^ 7,897 ^ 3,448 69,176 - - - - - - - -29 Nevada* 54 $ 683,177 41,845 29,903 43,529 ^ 4,454 154,273 - - - - - - - -30 Orange* 979 $ 6,534,832 147,693 267,261 282,758 45,637 93,613 1,452,287 ^ - - - - - - -31 Placer* 102 $ 493,756 26,642 27,118 3,152 ^ ^ 122,312 - - - - - - - -32 Plumas*^33 Riverside* 2,031 $ 7,415,044 685,780 555,066 508,589 8,048 152,375 2,723,928 427 - ^ - - - - -34 Sacramento* 507 $ 5,694,803 625,568 668,112 1,082,147 ^ 169,812 2,495,984 - - - - - - - -35 San Benito*^36 San Bernardino* 758 $ 7,183,727 1,646,289 929,317 139,419 13,114 88,709 3,250,710 193 ^ ^ - - ^ - ^37 San Diego* 1,011 $ 12,145,467 296,686 652,140 18,977 3,622 184,585 1,402,200 601 214,736 ^ - ^ ^ - ^38 San Francisco* 355 $ 12,513,959 2,363,846 927,092 88,548 ^ 29,020 946,212 - ^ - - - - - -39 San Joaquin* 439 $ 2,293,020 118,914 186,615 118,588 12,163 45,465 472,640 ^ - ^ - ^ - - ^40 San Luis Obispo* 166 $ 3,448,270 697,497 187,266 35,953 4,190 25,066 417,785 - - ^ ^ - - - ^41 San Mateo* 119 $ 2,179,605 89,517 70,537 33,944 ^ 19,453 340,773 ^ ^ ^ ^ - ^ - -42 Santa Barbara* 191 $ 2,354,645 83,380 198,757 96,876 10,417 55,115 816,275 - ^ - - ^ - - -43 Santa Clara* 372 $ 3,060,355 626,665 462,170 - - - - - - - - - - - -44 Santa Cruz* 102 $ 1,492,957 307,755 108,390 23,966 ^ ^ 214,315 ^ - ^ - - - - -45 Shasta* 97 $ 1,130,209 16,243 89,379 41,971 ^ 20,645 224,361 - ^ ^ - - - - -46 Sierra** - $ - - - - - - - - - - - - - - -47 Siskiyou* 60 $ 291,630 19,026 18,891 5,482 - ^ 41,579 - - - - - - - -48 Solano* 105 $ 1,140,632 177,886 110,398 13,202 - 3,690 101,131 ^ ^ ^ - - - - -49 Sonoma - $ - - - - - - - - - - - - - - -50 Stanislaus* 135 $ 1,778,778 ^ ^ 73,790 5,090 19,913 740,789 - ^ ^ - - - - -51 Sutter*** - $ - - - - - - - - - - - - - - -52 Tehama 33 $ 6,173 - 3,415 - - - - - - - - - - - -53 Trinity* 54 $ 173,862 - - 1,961 - ^ 72,131 - - - - - - - -54 Tulare* 155 $ 1,473,008 215,024 85,016 78,647 1,876 32,406 211,907 - - - - - - - -55 Tuolomne*^56 Ventura* 212 $ 2,227,107 375,057 106,501 91,324 ^ 42,957 537,441 - - - - - - - -57 Yolo* 26 $ 117,612 ^ ^ ^ - 12,312 67,890 - - ^ - - - - -58 Sutter/Yuba* 41 $ 482,074 ^ 16,959 33,907 ^ 12,432 63,500 - - - - - - - -
Statewide^^ 16,111 $ 156,025,829 21,930,310 19,245,216 3,736,247 169,764 1,416,835 25,169,767 5,584 229,846 47,928 ^ 216 120 ^ 1,196
*** Sutter - There is no data listed for Sutter County (Code 51) because Sutter/Yuba is a combined MHP pursuant to the joint powers agreement between those two counties. All Medi-Cal specialty mental health services claims for Medi-Cal beneficiaries in both counties are submitted under Yuba County’s code (Code 58).
* Counties currently submitting claims with the 'KTA' Demonstration Project Identifier.** Sierra - There is no data listed for Sierra County (Code 46) because Placer County (Code 31) acts as the MHP for both counties and submits service claims for Medi-Cal beneficiaries in both counties.
^ Data in the cells have been suppressed to protect patient privacy.^^ The Statewide totals shown reflect the actual Statewide totals and incorporates any County data that may have been suppressed.
9 of 12
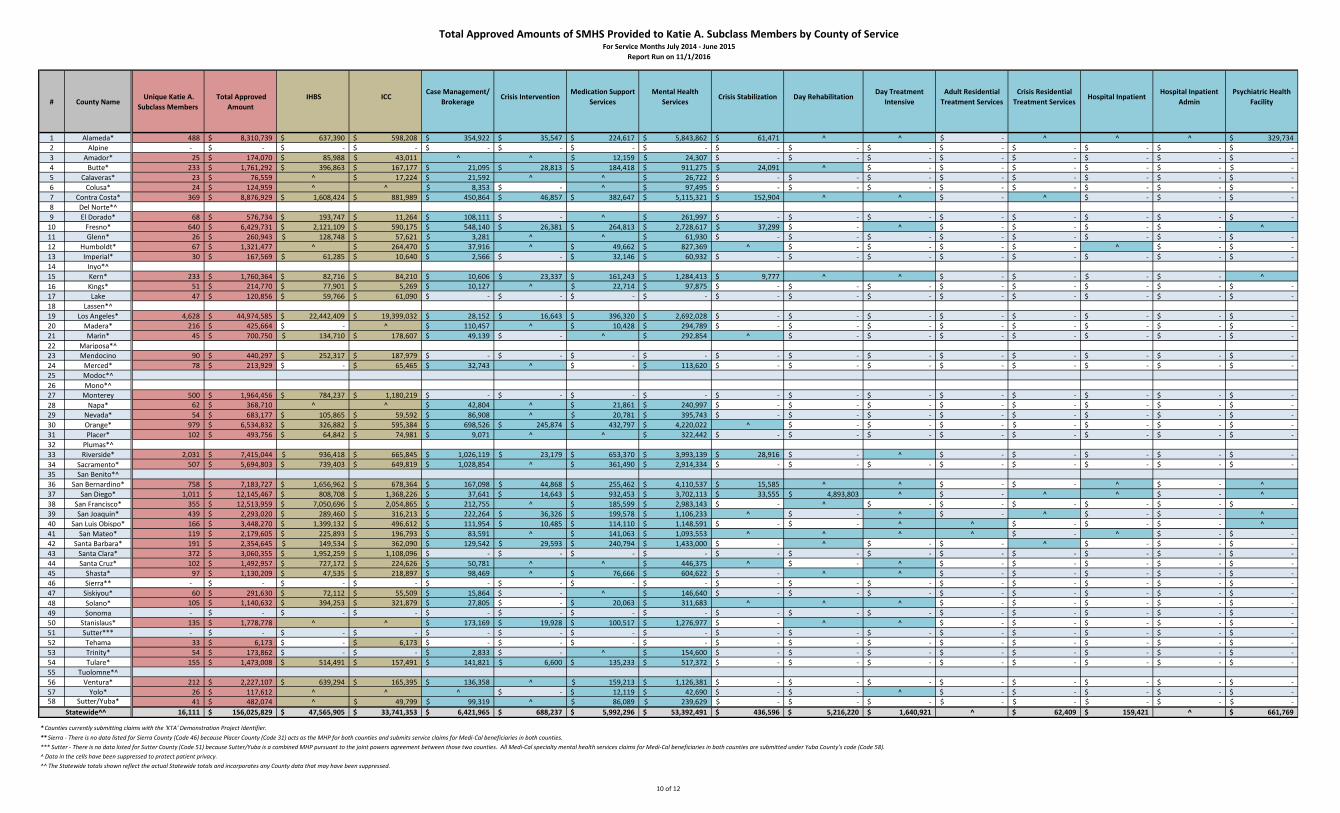
Total Approved Amounts of SMHS Provided to Katie A. Subclass Members by County of ServiceFor Service Months July 2014 - June 2015
Report Run on 11/1/2016
# County Name Unique Katie A.
Subclass Members Total Approved
Amount IHBS ICC
Case Management/ Brokerage
Crisis Intervention Medication Support
Services Mental Health
Services Crisis Stabilization Day Rehabilitation
Day Treatment Intensive
Adult Residential Treatment Services
Crisis Residential Treatment Services
Hospital Inpatient Hospital Inpatient
Admin Psychiatric Health
Facility
1 Alameda* 488 $ 8,310,739 $ 637,390 $ 598,208 $ 354,922 $ 35,547 $ 224,617 $ 5,843,862 $ 61,471 ^ ^ $ - ^ ^ ^ $ 329,7342 Alpine - $ - $ - $ - $ - $ - $ - $ - $ - $ - $ - $ - $ - $ - $ - $ -3 Amador* 25 $ 174,070 $ 85,988 $ 43,011 ^ ^ $ 12,159 $ 24,307 $ - $ - $ - $ - $ - $ - $ - $ -4 Butte* 233 $ 1,761,292 $ 396,863 $ 167,177 $ 21,095 $ 28,813 $ 184,418 $ 911,275 $ 24,091 ^ $ - $ - $ - $ - $ - $ -5 Calaveras* 23 $ 76,559 ^ $ 17,224 $ 21,592 ^ ^ $ 26,722 $ - $ - $ - $ - $ - $ - $ - $ -6 Colusa* 24 $ 124,959 ^ ^ $ 8,353 $ - ^ $ 97,495 $ - $ - $ - $ - $ - $ - $ - $ -7 Contra Costa* 369 $ 8,876,929 $ 1,608,424 $ 881,989 $ 450,864 $ 46,857 $ 382,647 $ 5,115,321 $ 152,904 ^ ^ $ - ^ $ - $ - $ -8 Del Norte*^9 El Dorado* 68 $ 576,734 $ 193,747 $ 11,264 $ 108,111 $ - ^ $ 261,997 $ - $ - $ - $ - $ - $ - $ - $ -
10 Fresno* 640 $ 6,429,731 $ 2,121,109 $ 590,175 $ 548,140 $ 26,381 $ 264,813 $ 2,728,617 $ 37,299 $ - ^ $ - $ - $ - $ - ^11 Glenn* 26 $ 260,943 $ 128,748 $ 57,621 $ 3,281 ^ ^ $ 61,930 $ - $ - $ - $ - $ - $ - $ - $ -12 Humboldt* 67 $ 1,321,477 ^ $ 264,470 $ 37,916 ^ $ 49,662 $ 827,369 ^ $ - $ - $ - $ - ^ $ - $ -13 Imperial* 30 $ 167,569 $ 61,285 $ 10,640 $ 2,566 $ - $ 32,146 $ 60,932 $ - $ - $ - $ - $ - $ - $ - $ -14 Inyo*^15 Kern* 233 $ 1,760,364 $ 82,716 $ 84,210 $ 10,606 $ 23,337 $ 161,243 $ 1,284,413 $ 9,777 ^ ^ $ - $ - $ - $ - ^16 Kings* 51 $ 214,770 $ 77,901 $ 5,269 $ 10,127 ^ $ 22,714 $ 97,875 $ - $ - $ - $ - $ - $ - $ - $ -17 Lake 47 $ 120,856 $ 59,766 $ 61,090 $ - $ - $ - $ - $ - $ - $ - $ - $ - $ - $ - $ -18 Lassen*^19 Los Angeles* 4,628 $ 44,974,585 $ 22,442,409 $ 19,399,032 $ 28,152 $ 16,643 $ 396,320 $ 2,692,028 $ - $ - $ - $ - $ - $ - $ - $ -20 Madera* 216 $ 425,664 $ - ^ $ 110,457 ^ $ 10,428 $ 294,789 $ - $ - $ - $ - $ - $ - $ - $ -21 Marin* 45 $ 700,750 $ 134,710 $ 178,607 $ 49,139 $ - ^ $ 292,854 ^ $ - $ - $ - $ - $ - $ - $ -22 Mariposa*^23 Mendocino 90 $ 440,297 $ 252,317 $ 187,979 $ - $ - $ - $ - $ - $ - $ - $ - $ - $ - $ - $ -24 Merced* 78 $ 213,929 $ - $ 65,465 $ 32,743 ^ $ - $ 113,620 $ - $ - $ - $ - $ - $ - $ - $ -25 Modoc*^26 Mono*^27 Monterey 500 $ 1,964,456 $ 784,237 $ 1,180,219 $ - $ - $ - $ - $ - $ - $ - $ - $ - $ - $ - $ -28 Napa* 62 $ 368,710 ^ ^ $ 42,804 ^ $ 21,861 $ 240,997 $ - $ - $ - $ - $ - $ - $ - $ -29 Nevada* 54 $ 683,177 $ 105,865 $ 59,592 $ 86,908 ^ $ 20,781 $ 395,743 $ - $ - $ - $ - $ - $ - $ - $ -30 Orange* 979 $ 6,534,832 $ 326,882 $ 595,384 $ 698,526 $ 245,874 $ 432,797 $ 4,220,022 ^ $ - $ - $ - $ - $ - $ - $ -31 Placer* 102 $ 493,756 $ 64,842 $ 74,981 $ 9,071 ^ ^ $ 322,442 $ - $ - $ - $ - $ - $ - $ - $ -32 Plumas*^33 Riverside* 2,031 $ 7,415,044 $ 936,418 $ 665,845 $ 1,026,119 $ 23,179 $ 653,370 $ 3,993,139 $ 28,916 $ - ^ $ - $ - $ - $ - $ -34 Sacramento* 507 $ 5,694,803 $ 739,403 $ 649,819 $ 1,028,854 ^ $ 361,490 $ 2,914,334 $ - $ - $ - $ - $ - $ - $ - $ -35 San Benito*^36 San Bernardino* 758 $ 7,183,727 $ 1,656,962 $ 678,364 $ 167,098 $ 44,868 $ 255,462 $ 4,110,537 $ 15,585 ^ ^ $ - $ - ^ $ - ^37 San Diego* 1,011 $ 12,145,467 $ 808,708 $ 1,368,226 $ 37,641 $ 14,643 $ 932,453 $ 3,702,113 $ 33,555 $ 4,893,803 ^ $ - ^ ^ $ - ^38 San Francisco* 355 $ 12,513,959 $ 7,050,696 $ 2,054,865 $ 212,755 ^ $ 185,599 $ 2,983,143 $ - ^ $ - $ - $ - $ - $ - $ -39 San Joaquin* 439 $ 2,293,020 $ 289,460 $ 316,213 $ 222,264 $ 36,326 $ 199,578 $ 1,106,233 ^ $ - ^ $ - ^ $ - $ - ^40 San Luis Obispo* 166 $ 3,448,270 $ 1,399,132 $ 496,612 $ 111,954 $ 10,485 $ 114,110 $ 1,148,591 $ - $ - ^ ^ $ - $ - $ - ^41 San Mateo* 119 $ 2,179,605 $ 225,893 $ 196,793 $ 83,591 ^ $ 141,063 $ 1,093,553 ^ ^ ^ ^ $ - ^ $ - $ -42 Santa Barbara* 191 $ 2,354,645 $ 149,534 $ 362,090 $ 129,542 $ 29,593 $ 240,794 $ 1,433,000 $ - ^ $ - $ - ^ $ - $ - $ -43 Santa Clara* 372 $ 3,060,355 $ 1,952,259 $ 1,108,096 $ - $ - $ - $ - $ - $ - $ - $ - $ - $ - $ - $ -44 Santa Cruz* 102 $ 1,492,957 $ 727,172 $ 224,626 $ 50,781 ^ ^ $ 446,375 ^ $ - ^ $ - $ - $ - $ - $ -45 Shasta* 97 $ 1,130,209 $ 47,535 $ 218,897 $ 98,469 ^ $ 76,666 $ 604,622 $ - ^ ^ $ - $ - $ - $ - $ -46 Sierra** - $ - $ - $ - $ - $ - $ - $ - $ - $ - $ - $ - $ - $ - $ - $ -47 Siskiyou* 60 $ 291,630 $ 72,112 $ 55,509 $ 15,864 $ - ^ $ 146,640 $ - $ - $ - $ - $ - $ - $ - $ -48 Solano* 105 $ 1,140,632 $ 394,253 $ 321,879 $ 27,805 $ - $ 20,063 $ 311,683 ^ ^ ^ $ - $ - $ - $ - $ -49 Sonoma - $ - $ - $ - $ - $ - $ - $ - $ - $ - $ - $ - $ - $ - $ - $ -50 Stanislaus* 135 $ 1,778,778 ^ ^ $ 173,169 $ 19,928 $ 100,517 $ 1,276,977 $ - ^ ^ $ - $ - $ - $ - $ -51 Sutter*** - $ - $ - $ - $ - $ - $ - $ - $ - $ - $ - $ - $ - $ - $ - $ -52 Tehama 33 $ 6,173 $ - $ 6,173 $ - $ - $ - $ - $ - $ - $ - $ - $ - $ - $ - $ -53 Trinity* 54 $ 173,862 $ - $ - $ 2,833 $ - ^ $ 154,600 $ - $ - $ - $ - $ - $ - $ - $ -54 Tulare* 155 $ 1,473,008 $ 514,491 $ 157,491 $ 141,821 $ 6,600 $ 135,233 $ 517,372 $ - $ - $ - $ - $ - $ - $ - $ -55 Tuolomne*^56 Ventura* 212 $ 2,227,107 $ 639,294 $ 165,395 $ 136,358 ^ $ 159,213 $ 1,126,381 $ - $ - $ - $ - $ - $ - $ - $ -57 Yolo* 26 $ 117,612 ^ ^ ^ $ - $ 12,119 $ 42,690 $ - $ - ^ $ - $ - $ - $ - $ -58 Sutter/Yuba* 41 $ 482,074 ^ $ 49,799 $ 99,319 ^ $ 86,089 $ 239,629 $ - $ - $ - $ - $ - $ - $ - $ -
Statewide^^ 16,111 $ 156,025,829 $ 47,565,905 $ 33,741,353 $ 6,421,965 $ 688,237 $ 5,992,296 $ 53,392,491 $ 436,596 $ 5,216,220 $ 1,640,921 ^ $ 62,409 $ 159,421 ^ $ 661,769
*** Sutter - There is no data listed for Sutter County (Code 51) because Sutter/Yuba is a combined MHP pursuant to the joint powers agreement between those two counties. All Medi-Cal specialty mental health services claims for Medi-Cal beneficiaries in both counties are submitted under Yuba County’s code (Code 58).
* Counties currently submitting claims with the 'KTA' Demonstration Project Identifier.** Sierra - There is no data listed for Sierra County (Code 46) because Placer County (Code 31) acts as the MHP for both counties and submits service claims for Medi-Cal beneficiaries in both counties.
^ Data in the cells have been suppressed to protect patient privacy.^^ The Statewide totals shown reflect the actual Statewide totals and incorporates any County data that may have been suppressed.
10 of 12
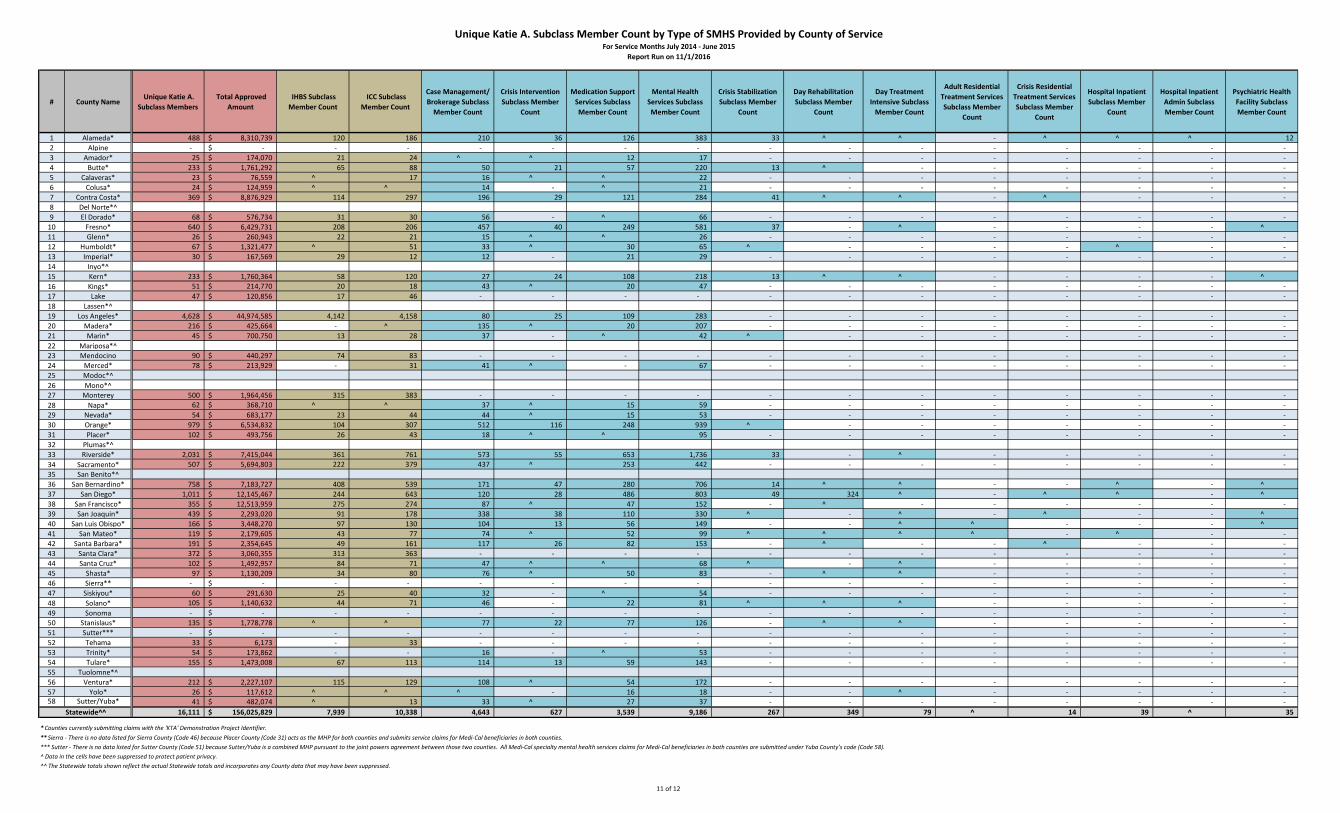
Unique Katie A. Subclass Member Count by Type of SMHS Provided by County of ServiceFor Service Months July 2014 - June 2015
Report Run on 11/1/2016
# County Name Unique Katie A.
Subclass Members Total Approved
Amount IHBS Subclass Member Count
ICC Subclass Member Count
Case Management/ Brokerage Subclass
Member Count
Crisis Intervention Subclass Member
Count
Medication Support Services Subclass Member Count
Mental Health Services Subclass Member Count
Crisis Stabilization Subclass Member
Count
Day Rehabilitation Subclass Member
Count
Day Treatment Intensive Subclass
Member Count
Adult Residential Treatment Services Subclass Member
Count
Crisis Residential Treatment Services Subclass Member
Count
Hospital Inpatient Subclass Member
Count
Hospital Inpatient Admin Subclass Member Count
Psychiatric Health Facility Subclass Member Count
1 Alameda* 488 $ 8,310,739 120 186 210 36 126 383 33 ^ ^ - ^ ^ ^ 122 Alpine - $ - - - - - - - - - - - - - - -3 Amador* 25 $ 174,070 21 24 ^ ^ 12 17 - - - - - - - -4 Butte* 233 $ 1,761,292 65 88 50 21 57 220 13 ^ - - - - - -5 Calaveras* 23 $ 76,559 ^ 17 16 ^ ^ 22 - - - - - - - -6 Colusa* 24 $ 124,959 ^ ^ 14 - ^ 21 - - - - - - - -7 Contra Costa* 369 $ 8,876,929 114 297 196 29 121 284 41 ^ ^ - ^ - - -8 Del Norte*^9 El Dorado* 68 $ 576,734 31 30 56 - ^ 66 - - - - - - - -
10 Fresno* 640 $ 6,429,731 208 206 457 40 249 581 37 - ^ - - - - ^11 Glenn* 26 $ 260,943 22 21 15 ^ ^ 26 - - - - - - - -12 Humboldt* 67 $ 1,321,477 ^ 51 33 ^ 30 65 ^ - - - - ^ - -13 Imperial* 30 $ 167,569 29 12 12 - 21 29 - - - - - - - -14 Inyo*^15 Kern* 233 $ 1,760,364 58 120 27 24 108 218 13 ^ ^ - - - - ^16 Kings* 51 $ 214,770 20 18 43 ^ 20 47 - - - - - - - -17 Lake 47 $ 120,856 17 46 - - - - - - - - - - - -18 Lassen*^19 Los Angeles* 4,628 $ 44,974,585 4,142 4,158 80 25 109 283 - - - - - - - -20 Madera* 216 $ 425,664 - ^ 135 ^ 20 207 - - - - - - - -21 Marin* 45 $ 700,750 13 28 37 - ^ 42 ^ - - - - - - -22 Mariposa*^23 Mendocino 90 $ 440,297 74 83 - - - - - - - - - - - -24 Merced* 78 $ 213,929 - 31 41 ^ - 67 - - - - - - - -25 Modoc*^26 Mono*^27 Monterey 500 $ 1,964,456 315 383 - - - - - - - - - - - -28 Napa* 62 $ 368,710 ^ ^ 37 ^ 15 59 - - - - - - - -29 Nevada* 54 $ 683,177 23 44 44 ^ 15 53 - - - - - - - -30 Orange* 979 $ 6,534,832 104 307 512 116 248 939 ^ - - - - - - -31 Placer* 102 $ 493,756 26 43 18 ^ ^ 95 - - - - - - - -32 Plumas*^33 Riverside* 2,031 $ 7,415,044 361 761 573 55 653 1,736 33 - ^ - - - - -34 Sacramento* 507 $ 5,694,803 222 379 437 ^ 253 442 - - - - - - - -35 San Benito*^36 San Bernardino* 758 $ 7,183,727 408 539 171 47 280 706 14 ^ ^ - - ^ - ^37 San Diego* 1,011 $ 12,145,467 244 643 120 28 486 803 49 324 ^ - ^ ^ - ^38 San Francisco* 355 $ 12,513,959 275 274 87 ^ 47 152 - ^ - - - - - -39 San Joaquin* 439 $ 2,293,020 91 178 338 38 110 330 ^ - ^ - ^ - - ^40 San Luis Obispo* 166 $ 3,448,270 97 130 104 13 56 149 - - ^ ^ - - - ^41 San Mateo* 119 $ 2,179,605 43 77 74 ^ 52 99 ^ ^ ^ ^ - ^ - -42 Santa Barbara* 191 $ 2,354,645 49 161 117 26 82 153 - ^ - - ^ - - -43 Santa Clara* 372 $ 3,060,355 313 363 - - - - - - - - - - - -44 Santa Cruz* 102 $ 1,492,957 84 71 47 ^ ^ 68 ^ - ^ - - - - -45 Shasta* 97 $ 1,130,209 34 80 76 ^ 50 83 - ^ ^ - - - - -46 Sierra** - $ - - - - - - - - - - - - - - -47 Siskiyou* 60 $ 291,630 25 40 32 - ^ 54 - - - - - - - -48 Solano* 105 $ 1,140,632 44 71 46 - 22 81 ^ ^ ^ - - - - -49 Sonoma - $ - - - - - - - - - - - - - - -50 Stanislaus* 135 $ 1,778,778 ^ ^ 77 22 77 126 - ^ ^ - - - - -51 Sutter*** - $ - - - - - - - - - - - - - - -52 Tehama 33 $ 6,173 - 33 - - - - - - - - - - - -53 Trinity* 54 $ 173,862 - - 16 - ^ 53 - - - - - - - -54 Tulare* 155 $ 1,473,008 67 113 114 13 59 143 - - - - - - - -55 Tuolomne*^56 Ventura* 212 $ 2,227,107 115 129 108 ^ 54 172 - - - - - - - -57 Yolo* 26 $ 117,612 ^ ^ ^ - 16 18 - - ^ - - - - -58 Sutter/Yuba* 41 $ 482,074 ^ 13 33 ^ 27 37 - - - - - - - -
Statewide^^ 16,111 $ 156,025,829 7,939 10,338 4,643 627 3,539 9,186 267 349 79 ^ 14 39 ^ 35
*** Sutter - There is no data listed for Sutter County (Code 51) because Sutter/Yuba is a combined MHP pursuant to the joint powers agreement between those two counties. All Medi-Cal specialty mental health services claims for Medi-Cal beneficiaries in both counties are submitted under Yuba County’s code (Code 58).
* Counties currently submitting claims with the 'KTA' Demonstration Project Identifier.** Sierra - There is no data listed for Sierra County (Code 46) because Placer County (Code 31) acts as the MHP for both counties and submits service claims for Medi-Cal beneficiaries in both counties.
^ Data in the cells have been suppressed to protect patient privacy.^^ The Statewide totals shown reflect the actual Statewide totals and incorporates any County data that may have been suppressed.
11 of 12
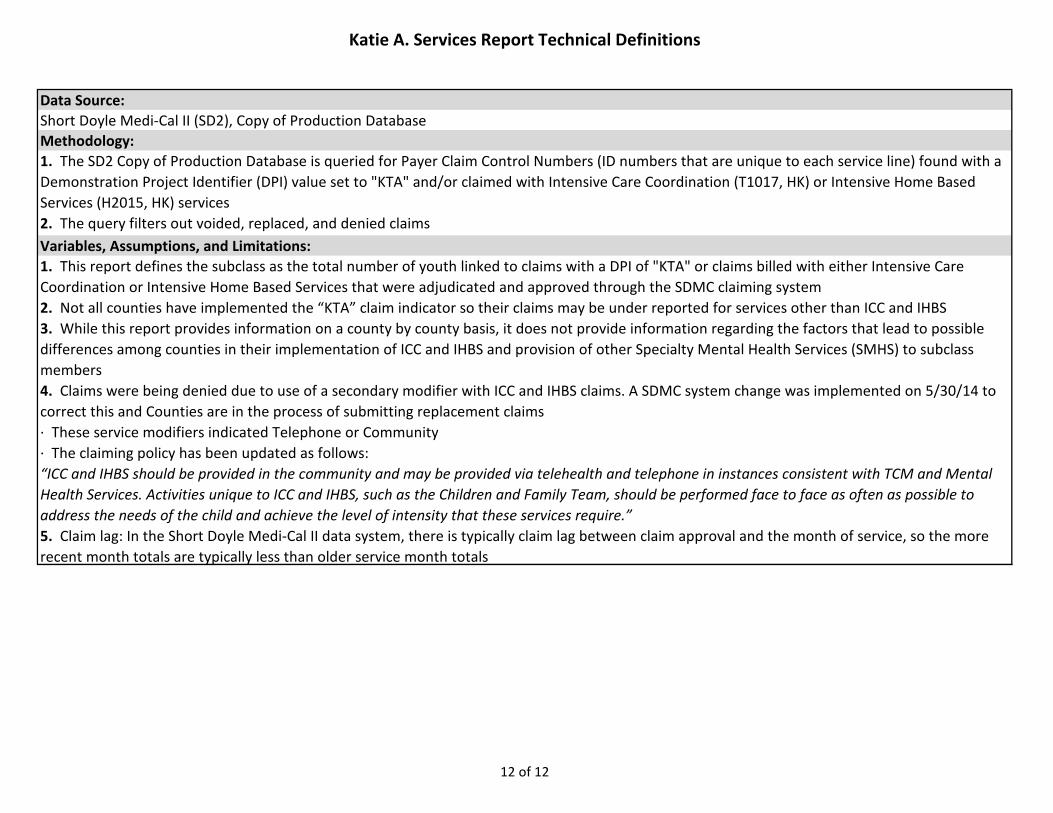
Katie A. Services Report Technical Definitions
Data Source:Short Doyle Medi-Cal II (SD2), Copy of Production DatabaseMethodology:1. The SD2 Copy of Production Database is queried for Payer Claim Control Numbers (ID numbers that are unique to each service line) found with a Demonstration Project Identifier (DPI) value set to "KTA" and/or claimed with Intensive Care Coordination (T1017, HK) or Intensive Home Based Services (H2015, HK) services2. The query filters out voided, replaced, and denied claimsVariables, Assumptions, and Limitations:1. This report defines the subclass as the total number of youth linked to claims with a DPI of "KTA" or claims billed with either Intensive Care Coordination or Intensive Home Based Services that were adjudicated and approved through the SDMC claiming system2. Not all counties have implemented the “KTA” claim indicator so their claims may be under reported for services other than ICC and IHBS3. While this report provides information on a county by county basis, it does not provide information regarding the factors that lead to possible differences among counties in their implementation of ICC and IHBS and provision of other Specialty Mental Health Services (SMHS) to subclass members4. Claims were being denied due to use of a secondary modifier with ICC and IHBS claims. A SDMC system change was implemented on 5/30/14 to correct this and Counties are in the process of submitting replacement claims· These service modifiers indicated Telephone or Community· The claiming policy has been updated as follows:“ICC and IHBS should be provided in the community and may be provided via telehealth and telephone in instances consistent with TCM and Mental Health Services. Activities unique to ICC and IHBS, such as the Children and Family Team, should be performed face to face as often as possible to address the needs of the child and achieve the level of intensity that these services require.”5. Claim lag: In the Short Doyle Medi-Cal II data system, there is typically claim lag between claim approval and the month of service, so the more recent month totals are typically less than older service month totals
12 of 12