Karyotyping and Molecular Cytogenetic Studies Using ...
80
Karyotyping and Molecular Cytogenetic Studies Using Repetitive Sequences in Lettuce January 2020 WINNY DEWI WIDARMI Graduate School of Horticulture CHIBA UNIVERSITY
Transcript of Karyotyping and Molecular Cytogenetic Studies Using ...
Karyotyping and Molecular Cytogenetic Studies
Using Repetitive Sequences in Lettuce
January 2020
WINNY DEWI WIDARMI
Graduate School of Horticulture
CHIBA UNIVERSITY
2
CONTENTS
GENERAL INTRODUCTION ................................................................................................. 4
CHAPTER I ............................................................................................................................. 10
Characterization of Lettuce Chromosomes Based on Condensation Patterns and Physical
Mapping of 45S and 5S rDNAs Using Fluorescence in situ Hybridization ............................ 10
1.1 Introduction ..................................................................................................................... 12
1.2 Materials and Methods .................................................................................................... 16
1.3 Results ............................................................................................................................. 19
1.4 Discussion ....................................................................................................................... 22
1.5 Table and Figures ............................................................................................................ 26
CHAPTER 2 ............................................................................................................................ 30
Cytological variation of (AAG)7 repeat on lettuce chromosomes by fluorescence in situ
hybridization ............................................................................................................................ 30
2.1 Introduction ..................................................................................................................... 32
2.2 Materials and Methods .................................................................................................... 34
2.3 Results ............................................................................................................................. 36

3
2.4 Discussion ....................................................................................................................... 37
2.5 Figures ............................................................................................................................. 40
CHAPTER 3 ............................................................................................................................ 43
Physical localization of rDNAs and microsatellite sequences on the chromosomes of Lactuca
saligna using fluorescence in situ hybridization ..................................................................... 43
3. 1 Introduction .................................................................................................................... 45
3.2 Materilas and Methods .................................................................................................... 47
3.3 Results ............................................................................................................................. 49
3.4 Discussion ....................................................................................................................... 51
3.5 Figures ............................................................................................................................. 54
GENERAL DISCUSSION ...................................................................................................... 58
REFERENCES ........................................................................................................................ 66
SUMMARY ............................................................................................................................ 77
ACKNOWLEDGMENTS ............................................................................................ 79
4
GENERAL INTRODUCTION
Lettuce is an important vegetable crop species in the group of leafy vegetables
produced commercially in many countries worldwide. It is especially important as a
commercial crop in Asia, North and Central America, and Europe. China, U.S., Spain, Italy,
India and Japan are among the world’s largest producers (Lebeda et al. 2007; Mou 2008). An
annual plant in the daisy family, Compositae (Asteraceae), tribe Lactuceae of subfamily
Cichorioideae (Křístková et al. 2008). Due to its economic importance, most current studies
of the genus Lactuca have focused on lettuce cultivars and the species that can be easily
crossed to domesticated lettuce (Koopman et al. 1998; Zohary 1991), including studies of
phylogeny and trait breeding. However, the broader phylogenetic relationships of
domesticated lettuce and wild lettuce species remain unclear, including the taxonomic
boundary of the genus Lactuca L. itself.
Cultivated lettuce (Lactuca sativa L.) is a diploid (2n= 18) species and there are three
wild species in the subsection Lactuca, L. serriola, L. saligna, and L. virosa; all are 2n = 18
and self-fertilizing and important genitors for lettuce breeding (Michelmore et al. 1994;
Koopman et al. 1998). The estimated genome size of L. sativa was 2.7 Gb, with repetitive
5
sequences accounting for 74.2% of the genome (Michelmore et al. 1994; Koopman et al.
1998; Reyes-Chin-Wo, S. et al. 2017).
L. saligna is considered one of the most important species in the lettuce genepool
(Lebeda et al. 2007). It has come to play a considerable part in lettuce resistance breeding to
Bremia lactucae (downy mildew pathogen) (Lebeda et al. 2002, 2007; Beharav et al. 2006).
The wild relatives of agricultural crops conserved in genebank collections constitute a broad
genetic base that can provide essential materials for plant breeding (Lebeda et al. 2007).
In the last dozen years, relationships among the cultivated lettuce and its allied species
have been studied using molecular techniques (Kesseli et al. 1991; Hill et al. 1996;
Witsenboer et al. 1997; Koopman et al. 1998). These analyses clarify that the closest species
of the cultivated lettuce is L. serriola.
Cytological studies, karyotype analysis (Lindqvist 1960; Haque and Godward 1985;
Koopman and De Jong, 1996; Matoba et al. 2007) and chromosome banding (Koopman et al.
1993), have been demonstrated the relationships among lettuce and its closely related species.
However, they observed metaphase chromosomes which are in highly condensed condition.
Components of metaphase chromosomes, i.e., number, length and arm ratio, had been
commonly used to identify the karyotype of species, except for maize and rice pachytene
6
chromosomes. Metaphase chromosomes of horticultural plants in particular is relatively small
compared to those of other plant species, it had been difficult to discriminate individual
chromosomes.
Fukui (1986) and Fukui and Mukai (1988) used the first-generation chromosome
image analyzing system (CHIAS) and observed specific condensation patterns (CPs) in small
plant chromosomes at the somatic prometaphase. So far, chromosomes have been
characterized by CP in saltbush (Fukui and Mukai, 1988), rice (Fukui and Iijima, 1991), and
soybean (Yanagisawa et al. 1991). CP considered to be a useful procedure to characterized
morphological traits and identify the chromosomes in many plant species.
Fluorescence in situ hybridization (FISH) techniques provide the phylogenetic
information in closely related taxa, and FISH with ribosomal RNA genes and telomeric
sequences has been widely utilized for karyotyping and studying chromosomal organization
and evolution in many plant species, e.g., spinach (Ito et al. 2000); rose (Akasaka et al.
2003); lettuce (Matoba et al. 2007); and cucumber (Zhang et al. 2012). Combinations of
FISH and condensation pattern has not been carried out in the lettuce chromosomes.
FISH with repetitive DNA probes results in chromosome-specific hybridization
pattern that allows identification of all chromosomes within a species, making this technique
7
a powerful tool for the karyotyping and studying chromosomal organization and evolution in
many plant species (Jiang and Gill 2006; Mukai et al. 1993; Pedersen and Langridge 1997).
Karyotype analysis and chromosomal distribution of 5S and 18S rDNAs were detected by
FISH method (Matoba et al. 2007). The karyotype analysis revealed the dissimilarity
between L. virosa and L. sativa, L. serriola, L. saligna.
Microsatellites or simple sequence repeats (SSRs) are tandem repeats of DNA motifs
composed of short repeated units about 1-6 nucleotides, that can be found anywhere in the
genome, both in protein-coding and noncoding regions (Toth et al. 2000). Because of their
high mutability, microsatellites are thought to play a significant role in genome evolution by
creating and maintaining quantitative genetic variation (Tautz et al. 1986; Kashi et al. 1997).
Microsatellite markers can be developed as polymerase chain reaction-based markers
and used as probes in the fluorescence in situ hybridization (FISH) which is a crucial tool for
plant molecular cytogenetic researches (Jiang and Gill 2006). Microsatellites have been
widely used for chromosome identification and study of genome organization and evolution
in different plant species e.g. Triticeae (Cuadrado et al. 2008), Allium (Monkheang et al.
2016) and Panax ginseng (Waminal et al. 2018). As far as we know, no previous FISH
experiments using microsatellites sequences as probes have been reported in L. saligna.
8
The distribution of microsatellite AAG on the chromosomes of wheat, barley, and
related species in Triticeae are well reported, the sequence (AAG)5 was used for in situ
hybridization to identify different chromatin classes in wheat (Cuadrado et al. 2000, 2008).
The oligonucleotide sequence (AAG)7 was used for genome and chromosome identification
via in situ hybridization in cultivated barley and related species of the Triticeae (Poaceae)
(Pedersen et al. 1996). The sequence (AAG)9 was used for the complementary identification
of all A-genome chromosomes in diploid and polyploid wheat (Badaeva et al. 2015, 2016).
The sequence (AAG)6 was firstly applied to the species of Zanthoxylum to perform a more
accurate karyotype analysis of Z. armatum (Luo et al. 2018). Probing AAG repeats using in
situ hybridization is a useful diagnostic tool in cytogenetics and for understanding genome
organization.
The aims of the present studies are (1) to identify and discriminate of lettuce
chromosomes in prometaphase cells through karyotype analysis based on condensation
patterns using CHIAS IV, also localize the sites for 45S and 5S rDNAs by FISH method, (2)
to perform FISH using (AAG)7 as the probe in order to clarify the possibility of using the
microsatellite repetitive sequences for discrimination and/or identification of the
chromosomes in Lactuca species, and (3) to perform FISH using nine SSRs and 45S and 5S

9
rDNA sequences as the probes, on the mitotic, and meiotic diakinesis and pachytene
chromosomes of L. saligna in order to identify the distribution of the repetitive sequences.

10
CHAPTER I
Characterization of Lettuce Chromosomes Based on Condensation Patterns and
Physical Mapping of 45S and 5S rDNAs Using Fluorescence in situ Hybridization
11
Summary
Lactuca sativa L. is one of the most important reference species for genome research
in Compositae. In the present study, fluorescence in situ hybridization (FISH) and
chromosome image analysis system IV (CHIAS IV) were applied to obtain detailed
information of the characteristics of lettuce chromosomes. One lettuce cultivar (L. sativa
L.) and three wild species L. serriola, L. saligna and L. virosa were used to analyze
chromosome lengths, arm ratios and degrees of chromosomal condensation at prometaphase.
Locations of 45S and 5S rRNA genes were determined by FISH technique. Our results
showed that nine pairs of homologous chromosomes could be discriminated for all four
species by their morphological characteristics, condensation patterns (CPs) and localization
of rRNA loci. Statistical analysis showed that the total length of L. saligna chromosomes
was significantly the shortest among the species tested. The present study is the first for
physical mapping of condensed regions and rDNAs using CPs and FISH of prometaphase
chromosomes in lettuce. The information provided here would be valuable for practical
breeding and genetics of lettuce.
Key words: CHIAS IV, Condensation pattern, FISH, Lettuce, rDNA.
12
1.1 Introduction
Cultivated lettuce, Lactuca sativa L. (2n = 18), is one of the most important
vegetables in the group of leafy plants produced commercially in many countries worldwide.
World production of lettuce in 2016 was more than 26 million tons, and those were mainly
produced in Asia, North and Central America and Europe (FAO 2017,
http://faostat.fao.org/site/567/DesktopDefault.aspx?PageID=567#ancor). L. sativa is an
annual plant in the subtribe Lactucinae, tribe Lactuceae (Cichorieae), subfamily
Cichorioideae of the family Compositae (Asteraceae) (Křístková et al. 2008). However, there
are uncertainties about the phylogenetic relationships within the genus Lactuca, mainly due
to the complex and variable morphological characters of the species (Zhen et al. 2017).
Lebeda et al. (2004, 2009) divided the genus into seven sections and two geographical groups
based on taxonomic and biogeographical criteria, i.e., Lactuca (subsection Lactuca and
Cyanicae), Phaenixopus, Mulgedium, Lactucopsis, Tuberosae, Micranthae and Sororiae, and
African and North American groups.
There are three wild species in the subsection Lactuca, namely, L. serriola, L.
saligna and L. virosa; all being 2n = 18, self-pollinated plants and important genetic
resources for lettuce breeding (Michelmore et al. 1994, Koopman et al. 1998). It is estimated
13
that L. serriola, was at first domesticated in Egypt more than 4000 years ago, and was the
ancestral species of the present cultivated lettuce (Harlan 1986).
So far, many cytological studies, karyotype analyses, chromosome banding and
FISH techniques were carried out to demonstrate the relationships among the cultivated
lettuce and its closely related species. Lindqvist (1960) was the first who studied the most
comprehensive chromosome morphology of Lactuca species. He observed distinct
differences in metaphase chromosome morphology between L. virosa and the other three
species, L. sativa, L. serriola and L. saligna and found that the karyotypes of L. sativa and L.
serriola were identical, and the measurements of the chromosomes revealed certain
dissimilarities between these two species and L. saligna. Haque and Godward (1985)
described the somatic metaphase chromosome pairs on the basis of their lengths, centromere
positions and presence or absence of satellites of three cultivars of L. sativa, L. serriola and a
cultivar of Cichorium intybus. He found slight differences in chromosome lengths, the L.
sativa cultivars and L. serriola being distinguishable by their mean lengths. Koopman et al.
(1993) obtained chromosome banding patterns with C- and N- bandings, and AgNO3 staining
in somatic metaphase of four Lactuca species and found out that L. sativa and L. serriola had
almost identical chromosome morphology, and L. saligna differed only slightly from them,
14
but L. virosa was quite distinct from the other species. Koopman and de Jong (1996) applied
a numerical analysis to study the evolutionary relationships among L. sativa, L. serriola, L.
saligna and L. virosa using karyotypes and relative DNA content. They found that L. sativa
and L. serriola were very closely related, and L. saligna differed significantly from L.
sativa/serriola only in its relative DNA amount. L. virosa differed from L. saligna and L.
sativa/serriola for all parameters. They also found the largest difference between L. saligna
and L. virosa, and considered that L. saligna and L. virosa are advanced species that evolved
in different directions.
Matoba et al. (2007) examined karyotypes and chromosomal distribution of 5S and
18S rDNAs in L. sativa, L. serriola, L. saligna and L. virosa by FISH method. The karyotype
analysis revealed dissimilarity between L. virosa and the other three species, and it was
difficult to distinguish L. sativa and L. serriola based solely on karyotype analysis. FISH
result showed one 5S rDNA and two 18S rDNA loci in all four species. They revealed that
both 5S and 18S rDNA loci of L. sativa, L. serriola and L. saligna were identical in their
numbers and locations. However, the locations of rDNAs of L. virosa were different from
those of the other species.
15
Since metaphase chromosomes of horticultural plants are relatively small compared
to those of other plant, e.g., wheat and barley, it has been rather difficult to discriminate their
individual chromosomes. In lettuce, all cytological studies, karyotype analyses, and
chromosome banding have been conducted mainly using metaphase chromosomes, which are
in highly condensed condition (Matoba et al. 2007). Fukui (1986) and Fukui and Mukai
(1988) developed the CHIAS through measuring chromosome condensation patterns (CPs) in
small plant chromosomes at prometaphase. So far, chromosomes of many species have been
characterized with CHIAS, e.g., in saltbush (Fukui and Mukai 1988), rice (Fukui and Iijima
1991), soybean (Yanagisawa et al. 1991), tea plant (Furukawa et al. 2017), etc. CP is
considered to be a useful and reliable parameter to characterize morphological traits and
identify the chromosomes in many plant species, having small chromosomes. On the other
hand, FISH technique provides phylogenetical information in closely related taxa, and FISH
technique using ribosomal RNA genes and telomere sequences as the probes have been
widely applied for karyotyping and studying chromosomal organization and evolution in
many plant species.
Combination of CP and FISH analyses have provided novel aspects of chromosome
images via physical localization of repetitive sequences on the elongated prometaphase
16
chromosomes. The aim of the present study is to identify and discriminate lettuce
chromosomes in prometaphase cells through karyotype analysis based on the CPs using
CHIAS IV and determining the locations of 45S and 5S rDNAs by FISH method.
1.2 Materials and Methods
Plant materials and chromosome sample preparation
The seeds of Lactuca sativa cv. 'Patriot', L. serriola, L. saligna and L. virosa
investigated were supplied from Nagano Vegetable and Ornamental Crops Experimental
Station, Japan. Root tips of 1 cm long were collected from the seedlings or young plants
grown for a few weeks after seedling stage in 500-mL pots. The root tips were fixed in the
solution of 3 ethanol : 1 acetic acid (v/v) at 4°C for at least one day before chromosome
preparation. Fixed root tips were washed three times with distilled water, and were stored in
70% ethanol at 4°C until use. Chromosome preparations were made through enzymatic
maceration, where root tips were digested with an enzymatic mixture [4% cellulase
Onozuka RS (Yakult), 2% pectolyase Y-23 (Kyowa), and 1% pectinase (Sigma)] at 37°C for
45-90 min. Squashing was made in 45% acetic acid on the glass slides and the slides were
stored at -80°C more than 12 h, and the coverslips were removed with a razor blade.

17
Chromosomes were stained with 1% (v/v) Giemsa (Merck) in 1/15 M sodium phosphate
buffer (pH 6.8) for 2 min and air dried.
DNA probe preparation
The 45S rDNA (pTa71, Gerlach and Bedbrook 1979) and 5S rDNA (Fukui et al.
1994) were used as the probes for FISH analyses. The 5S rDNA was amplified from the
genomic DNA of L. sativa by polymerase chain reaction (PCR) using coding regions of 5S
rDNA as the primers (5’-GATCCCATCAGAACTCCGAAG-3’ and
5’-CGGTGATTTAGTGCTGGTAT-3’) (Fukui et al. 1994). PCR products with about 300 bp
were inserted into the EcoRV site of pZErO-2 Vector (Invitrogen) according to the
manufacturer’s instruction. The plasmid inserted with 5S rDNA unit was used as probe. The
45S and 5S rDNAs were labeled with DIG-Nick Translation Mix (Roche), and Biotin-Nick
Translation Mix (Roche) according to manufacturer’s instruction, respectively.
FISH analysis
Chromosome slides were re-fixed in 1% paraformaldehyde in PBS for 10 min at room
temperature. Procedures for FISH were followed as described by Kikuchi et al. (2008). The

18
10 µL of hybridization cocktail containing 50% formamide, 10% dextran sulfate, 2×SSC, and
100-500 ng labeling probe was applied to the slide, covered with a coverslip, and then
denatured for 3 min at 80°C on a heat block. After incubation at 37°C for one day, the slide
was washed and briefly dried. Detection of the biotin- and DIG-labeled probes was
performed with biotinylated streptavidin-FITC (Vector Laboratories) and
anti-digoxigenin-rhodamine (Roche), respectively. The slides were counter-stained with 5
µg/mL, 4,6-diamidino-2-phenylindole (DAPI) in a VectaShield antifade mounting medium
(Vector Laboratories). All FISH images were captured with an Olympus BX53 fluorescence
microscope equipped with a CCD camera (CoolSNAP MYO; Photometrics). The FISH
images were processed by MetaMorph, Meta imaging series version 7.8 (Molecular Devices,
San Jose) and edited with Photoshop CC 2017 (Adobe).
Image analysis
CHIAS IV (http://www2.kobe-u.ac.jp/~ohmido/index03.htm) was used to analyze the
images of the lettuce prometaphase chromosomes. Giemsa-stained chromosome images were
converted to 8-bit grey scale and the fluorescence signal images were captured as
red-green-blue (RGB) images with 8-bit grey levels for the construction of the ideogram.

19
Homologous chromosomes were detected by observing morphological characteristics and
CPs, and designated as Chromosomes 1 to 9 according to their lengths, excluding satellite.
Data for arm lengths and degrees of condensation of nine pairs of chromosomes were
collected in six chromosome spreads. The arm ratio was calculated as the length of the long
arm divided by the length of the short arm (Levan et al. 1964). The comparison of the mean
lettuce chromosome lengths among species was done by Tukey’s t-test. For statistical
analysis, StatPlus ver. 6 (AnalystSoft Inc., Walnut) was used.
1.3 Results
Morphology of lettuce prometaphase chromosomes
Squashed prometaphase chromosomes stained with Giemsa of the four species are
shown in Fig. 1-1. In all species, chromosome pairs could be discriminated with their
morphologies and condensation patterns; heavily condensed chromosome regions were
recognizable as densely stained regions and were distinguished from weakly as loosely
condensed regions.
Table 1 shows numerical data of the prometaphase chromosomes. The lengths of the
chromosomes varied from 5.34 to 13.24 µm in four species. The four longest chromosomes
20
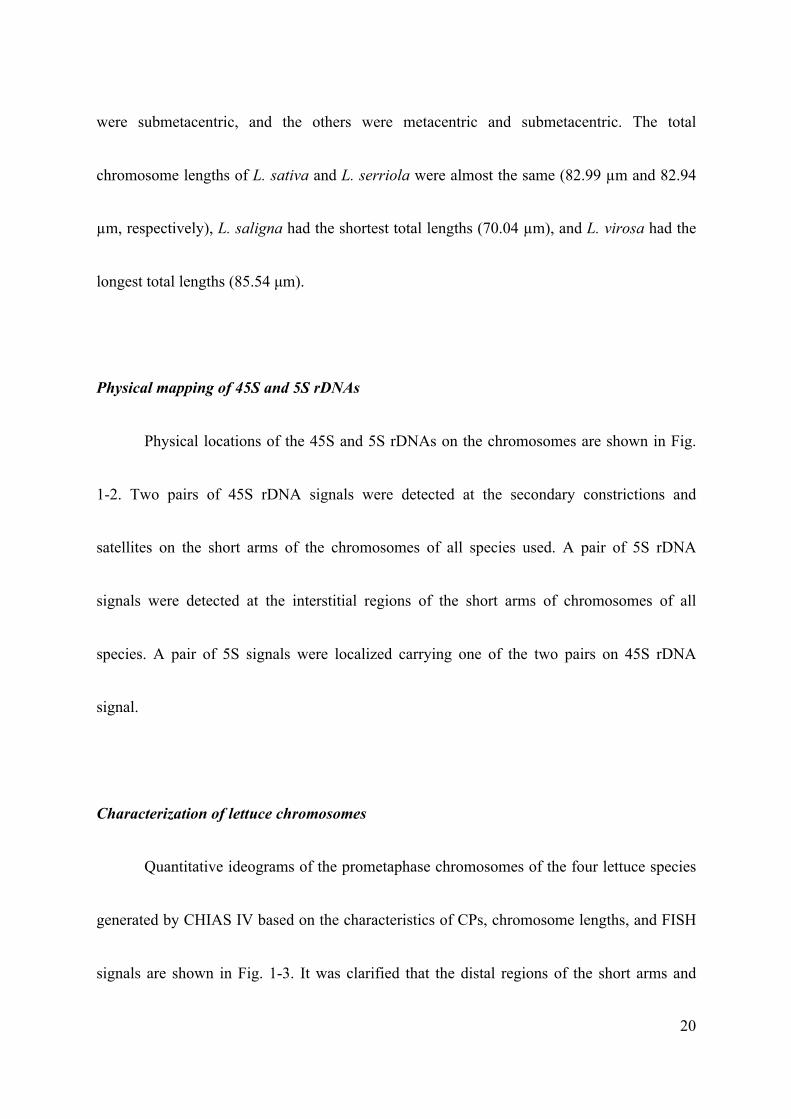
were submetacentric, and the others were metacentric and submetacentric. The total
chromosome lengths of L. sativa and L. serriola were almost the same (82.99 µm and 82.94
µm, respectively), L. saligna had the shortest total lengths (70.04 µm), and L. virosa had the
longest total lengths (85.54 µm).
Physical mapping of 45S and 5S rDNAs
Physical locations of the 45S and 5S rDNAs on the chromosomes are shown in Fig.
1-2. Two pairs of 45S rDNA signals were detected at the secondary constrictions and
satellites on the short arms of the chromosomes of all species used. A pair of 5S rDNA
signals were detected at the interstitial regions of the short arms of chromosomes of all
species. A pair of 5S signals were localized carrying one of the two pairs on 45S rDNA
signal.
Characterization of lettuce chromosomes
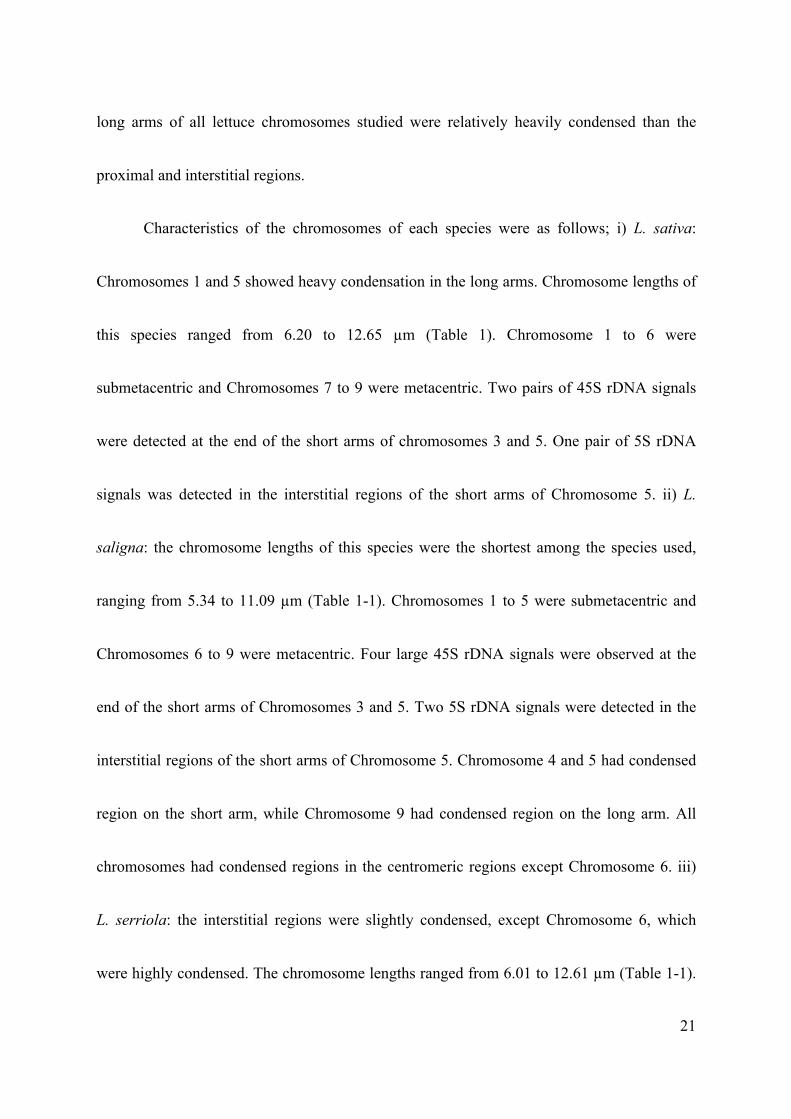
Quantitative ideograms of the prometaphase chromosomes of the four lettuce species
generated by CHIAS IV based on the characteristics of CPs, chromosome lengths, and FISH
signals are shown in Fig. 1-3. It was clarified that the distal regions of the short arms and
21
long arms of all lettuce chromosomes studied were relatively heavily condensed than the
proximal and interstitial regions.
Characteristics of the chromosomes of each species were as follows; i) L. sativa:
Chromosomes 1 and 5 showed heavy condensation in the long arms. Chromosome lengths of
this species ranged from 6.20 to 12.65 µm (Table 1). Chromosome 1 to 6 were
submetacentric and Chromosomes 7 to 9 were metacentric. Two pairs of 45S rDNA signals
were detected at the end of the short arms of chromosomes 3 and 5. One pair of 5S rDNA
signals was detected in the interstitial regions of the short arms of Chromosome 5. ii) L.
saligna: the chromosome lengths of this species were the shortest among the species used,
ranging from 5.34 to 11.09 µm (Table 1-1). Chromosomes 1 to 5 were submetacentric and
Chromosomes 6 to 9 were metacentric. Four large 45S rDNA signals were observed at the
end of the short arms of Chromosomes 3 and 5. Two 5S rDNA signals were detected in the
interstitial regions of the short arms of Chromosome 5. Chromosome 4 and 5 had condensed
region on the short arm, while Chromosome 9 had condensed region on the long arm. All
chromosomes had condensed regions in the centromeric regions except Chromosome 6. iii)
L. serriola: the interstitial regions were slightly condensed, except Chromosome 6, which
were highly condensed. The chromosome lengths ranged from 6.01 to 12.61 µm (Table 1-1).
22
Chromosomes 1 to 7 were submetacentric and Chromosomes 8 and 9 were metacentric. The
positions of the rDNA signals in the karyotype were similar to those of L. sativa and L.
saligna, in which four 45S rDNA signals were observed at the end of the short arms of
Chromosomes 3 and 5. A pair of 5S rDNA signals were detected in the interstitial regions of
the short arms of Chromosome 5. iv) L. virosa: chromosome length of this species was the
longest among the species used, ranging from 6.21 to 13.24 µm (Table 1). Chromosomes 1 to
4, and 6, 8 and 9 were submetacentric, and Chromosomes 5 and 7 were metacentric.
Chromosomes 2 and 7 had highly condensed regions along the whole chromosomes.
Locations of the 45S and 5S rDNAs were different from the other species, namely, two pairs
of 45S and one pair of 5S rDNAs located at the end of the short arm of Chromosome 5 and
interstitial region of Chromosome 7, respectively.
1.4 Discussion
In the present study, homologous chromosome pairs in four Lactuca species were
identified by observing prometaphase chromosomes stained with Giemsa solution.
Condensed chromosome regions at prometaphase were recognized as densely stained regions
distinguish from other regions. Our results of karyotype were coincident with the previous
23
reports (Lindqvist 1960, Haque and Godward 1985, Koopman et al. 1993, Koopman and de
Jong 1996, and Matoba et al. 2007); the karyotypes of L. sativa and L. serriola were almost
similar to each other and they seemed to be closely related. Although it was reported that the
karyotypes of them were difficult to distinguish based solely on the karyotype analysis of
metaphase chromosomes (Matoba et al. 2007), the present results suggest that the use of
prometaphase chromosomes are helpful to discriminate the chromosomes based on the CPs in
L. sativa and L. serriola.
It is considered that the total chromosome length of a plant is reflected with the
genome size of it. The genome sizes of L. sativa, L. saligna, L. serriola and L. virosa were
reported to be 2.7 Gb, 2.2 Gb, 2.7 Gb and 3.3 Gb, respectively (Koopman 2000,
Reyes-Chin-Wo et al. 2017). The L. virosa genome is larger than those of the other lettuce
species. Here, we can find a clear correlation between the genome sizes and the total
chromosome lengths. The difference of the genome sizes might be due to the difference in
the amounts of condensed region on the interstitial and distal regions of short and long arms
of the chromosomes. The majority of L. virosa chromosomes exhibited highly condensed
(Figs. 1-1 and 1-3) and the longest chromosome length (Table 1) in comparison with the
other three species. It is suggested that genome sizes of the plants are strongly correlated with
24
chromosome length mainly due to the amount of repetitive DNA sequences in Lilium (Du et
al. 2017) and Nigella damascena (Kuznetsova et al. 2017). Therefore, the present results
suggest that the abundance of repetitive DNA in the genomes may contribute to the genome
sizes in Lactuca species, and it is reflected as the CPs of the chromosomes.
Karyotyping using CHIAS IV and FISH mapping facilitated the construction of
quantitative and physical ideograms of plant chromosomes. Through combining these two
techniques, comprehensive lettuce chromosome maps would be constructed using DNA
sequences.
The loci of the 45S and 5S rDNA of L. sativa, L. serriola and L. saligna were
identical in their numbers and locations, except the locations of rDNAs of L. virosa was
different from those of the other species. This result was similar to the previous study by
Matoba et al. (2007) who used 18S and 5S rDNAs as the probes on metaphase chromosomes.
As the conclusion, the present study is the first for physical mapping of condensed
regions and rDNAs using CP and FISH of prometaphase chromosomes in lettuce. The
development of a quantitative chromosome map as shown in the present report is
fundamental for physical mapping of the genes and quite useful not only for basic genome
research and chromosome analysis but also practical breeding and genetics of lettuce. In

25
future studies, other probes prepared from different kinds of repetitive sequences, single copy
genes and DNA markers would be localized for the construction of precise physical
chromosome maps of lettuce.

26
1.5 Table and Figures

27
Fig. 1-1. Giemsa-stained prometaphase chromosomes of L. sativa (A), L. saligna (B), L.
serriola (C) and L. virosa (D). Numerals indicate the chromosome numbers according to
their length (see text for explanation). Bars = 10 µm

28
Fig. 1-2. FISH prometaphase chromosome spreads (A, C, E, G) and karyotypes (B, D, F,
H) of the lettuce showing 45S (red) and 5S (green) rDNAs signals in. L. sativa (A), L. saligna
(B), L. serriola (C) and L. virosa (D). Chromosomes are arranged according to their length
in karyotypes. Bars = 10 µm

29
Fig 1-3. Ideogram of prometaphase chromosomes of L. sativa (A), L. saligna (B), L. serriola
(C) and L. virosa (D), constructed by CHIAS IV. Numerals denote the chromosome
numbers according to their chromosome lengths (see text for details). Black, gray, and white
areas represent chromosome regions with heavy, intermediate and slight condensation,
respectively. The gaps in the middle of the chromosomes indicate the centromere regions.
Red and green circles demonstrate 45S and 5S rDNA loci, respectively.

30
CHAPTER 2
Cytological variation of (AAG)7 repeat on lettuce chromosomes by
fluorescence in situ hybridization
31
Summary
Cytological studies using fluorescence in situ hybridization (FISH) technique
provides phylogenetical information in closely related taxa and have been widely applied for
karyotyping and studying chromosomal organization and evolution in plant species. In the
present study, FISH using a microsatellite sequence of (AAG)7 as the probe was performed in
order to discriminate the chromosomes in four Lactuca species, i.e., L. sativa, L. serriola, L.
saligna, and L. virosa. Different distribution patterns of (AAG)n signals were shown on the
chromosomes in the four Lactuca species studied, suggesting that these signals could be used
as cytogenetic landmarks for chromosome identification in Lactuca species.
Key words FISH; microsatellite; (AAG)7 repeat; lettuce
32
2.1 Introduction
Cultivated lettuce (Lactuca sativa L.) is an economically important member of the
genus Lactuca, which includes closely related wild species, L. serriola, L. saligna and L.
virosa. All of them have 2n = 2x =18 chromosomes, and the estimated genome size of L.
sativa is 2.7 Gb, with repetitive sequences accounting for 74.2% of the genome (Koopman et
al. 1998; Michelmore et al. 1994; Reyes-Chin-Wo et al. 2017). So far, karyotype analyses
were carried out to demonstrate the relationships among the cultivated lettuce and its closely
related species (Haque and Godward 1985; Koopman and De Jong 1996; Lindqvist 1960;
Matoba et al. 2007). Koopman et al. (1993) applied chromosome banding techniques to
discriminate the chromosomes of Lactuca species. Widarmi et al. (2019) and Matoba et al.
(2007) applied FISH technique using 45S and 5SrDNAs to identify the chromosomes of
Lactuca species. From these studies, it was clarified that chromosomal characteristics of L.
sativa and L. serriola were almost similar to each other, while cytological features of L.
saligna are slightly different from L. sativa/L. serriola, and L. virosa is significantly different
from the other species.
Fluorescence in situ hybridization (FISH) using repetitive DNA sequences as the
probes results in chromosome-specific hybridization patterns that allows identification of all
33
chromosomes within a species, making this technique a powerful tool for the karyotyping and
studying chromosomal organization and evolution in many plant species ((Mukai et al. 1993;
Pedersen and Langridge 1997; Jiang and Gill 2006).
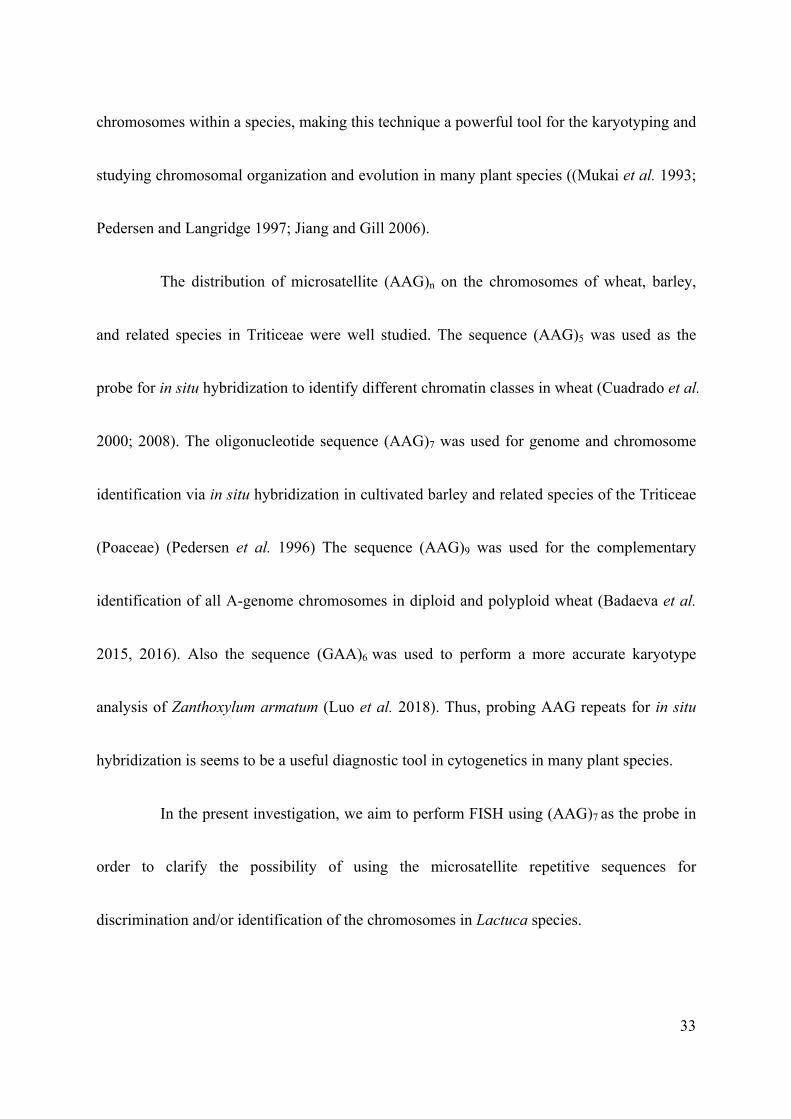
The distribution of microsatellite (AAG)n on the chromosomes of wheat, barley,
and related species in Triticeae were well studied. The sequence (AAG)5 was used as the
probe for in situ hybridization to identify different chromatin classes in wheat (Cuadrado et al.
2000; 2008). The oligonucleotide sequence (AAG)7 was used for genome and chromosome
identification via in situ hybridization in cultivated barley and related species of the Triticeae
(Poaceae) (Pedersen et al. 1996) The sequence (AAG)9 was used for the complementary
identification of all A-genome chromosomes in diploid and polyploid wheat (Badaeva et al.
2015, 2016). Also the sequence (GAA)6 was used to perform a more accurate karyotype
analysis of Zanthoxylum armatum (Luo et al. 2018). Thus, probing AAG repeats for in situ
hybridization is seems to be a useful diagnostic tool in cytogenetics in many plant species.
In the present investigation, we aim to perform FISH using (AAG)7 as the probe in
order to clarify the possibility of using the microsatellite repetitive sequences for
discrimination and/or identification of the chromosomes in Lactuca species.
34
2.2 Materials and Methods
Plant materials and chromosome sample preparation
Seeds of L. sativa ‘Shinano Hope’, L. saligna, L. serriola, and L. virosa were kindly
provided by Nagano Vegetable and Ornamental Crops Experimental Station, Japan. They
were germinated and planted at the Graduate School of Horticulture, Chiba University,
Matsudo, Japan. Root tips of 1-2 cm long were collected from the seedlings and young plants
after a few weeks growth in 500-mL pots. The root tips were fixed in 3 ethanol : 1 acetic acid
(v/v) at 4°C for least 1 day before preparation. Fixed root tips were washed three times with
distilled water, and the samples were stored in 70% ethanol at 4°C. Chromosomes
preparations were made through enzymatic maceration, i.e., root tips were digested with 10
µl enzymatic mixture (4% Cellulase Onozuka RS, Yakult; 2% Pectolyase Y-23, Kyowa; and
1% Pectinase from Aspergillus, Sigma) at 37°C for 45-90 minutes. Squashing was made in
45% acetic acid and the slides were stored at -80°C for more than 12 h. The glass covers
were removed by forceps for the following FISH experiment.
DNA probe preparation

35
The (AAG)7 probe was labelled with digoxigenin-11-dUTP (Roche) by terminal
deoxynucleotidyl transferase (TdT) (Thermo Fisher Scientific) following the manufacturer’s
instructions.
FISH analysis
Chromosome slides were re-fixed in 1% paraformaldehyde/1× PBS for 10 min at
room temperature. Procedures for hybridization and detection were followed as those
described by Kikuchi et al. (2008). The slides were counter-stained with
4,6-diamidino-2-phenylindole (DAPI) in a VectaShield antifade solution (Vector
Laboratories). All FISH images were captured with an Olympus BX53 fluorescence
microscope with a CCD camera (CoolSNAP MYO; Photometrics). The FISH images were
processed by Metamorph, Metavue imaging series version 7.8 and edited with Adobe
Photoshop CC 2017. CHIAS IV (http://www2.kobe-u.ac.jp/~ohmido/index03.htm) was used
for the construction of the ideogram.

36
2.3 Results
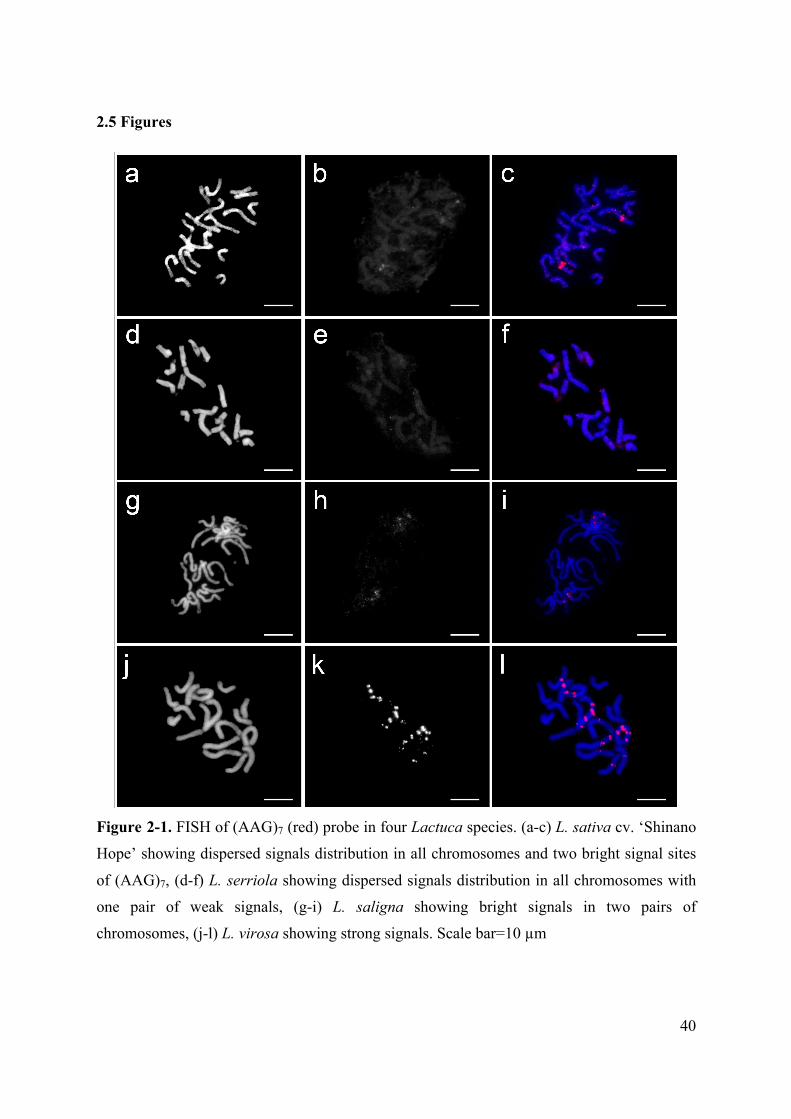
Images of mitotic prometaphase of four Lactuca species visualized after FISH
using (AAG)7 sequence as the probe are shown in Figure. 2-1. Different distribution
patterns of (AAG)n signals were shown in all four Lactuca species studied. In L. sativa and L.
serriola, FISH with (AAG)7 sequences revealed dispersed distribution patterns with one pair
of bright signals, respectively. While in L. saligna and L. virosa, distinct signals with
different intensities were observed in two pairs of chromosomes of L. saligna and five pairs
of chromosomes of L. virosa.
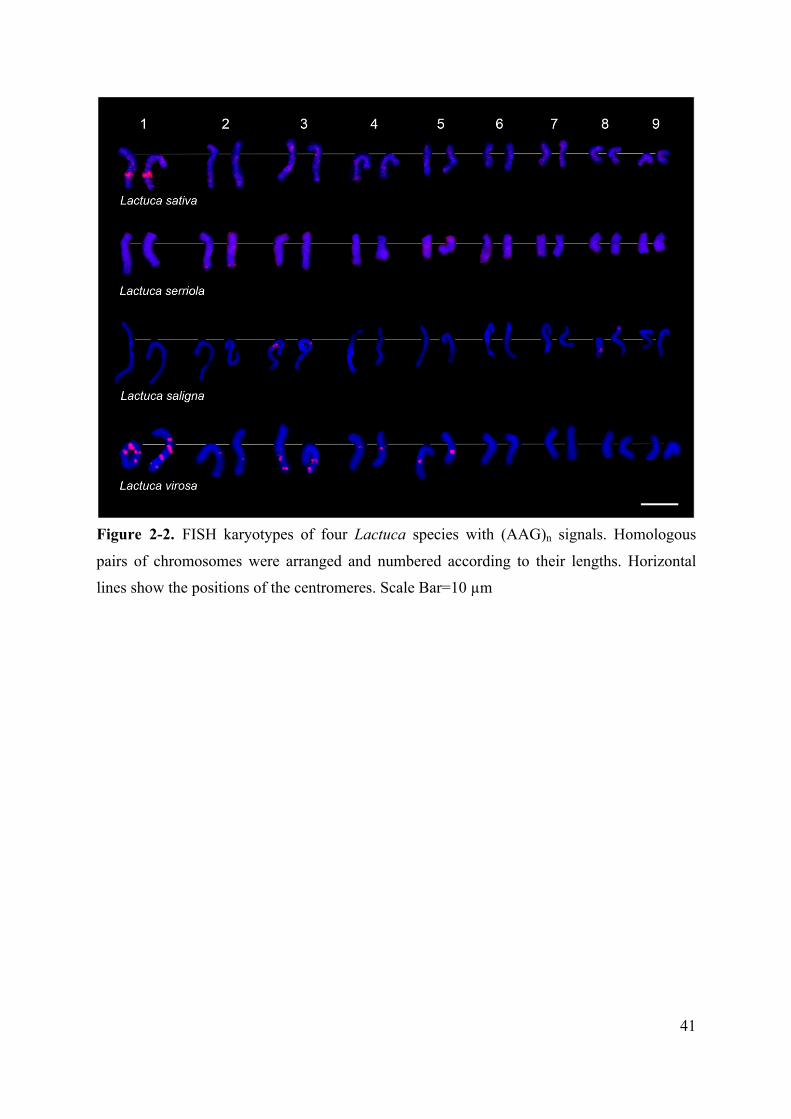
Figure 2-2 shows FISH karyotypes of four Lactuca species, which were arranged
according to the order of the lengths of the chromosomes based on the FISH images shown in
Figure 2-1. Quantitative ideograms of the prometaphase chromosomes of the four lettuce
species generated by CHIAS IV based on the characteristics of condensation patterns,
chromosome lengths, and FISH signals are shown in Fig. 2-3. Dispersed signal distribution
was observed in prometaphase chromosomes of L. sativa, with one pair of strong
pericentromeric signals on Chromosome 1. L. serriola also showed similar dispersed
distribution as those of L. sativa chromosomes, with one pair of small telomeric signals on
Chromosome 2. By contrast, distinct signals were observed on L. saligna and L. virosa

37
chromosomes. In L. saligna, Chromosomes 3 and 8 showed clear signals at the interstitial
regions of the long arm and subtelomeric region of the short arm, respectively. While, in L.
virosa, Chromosome 1 had four major signals, two on the proximal region of the short and
long arms, and two on the interstitial region of the long arm. Chromosome 3 showed two
pairs of signals, one on the interstitial region and one on the subtelomeric region of the long
arm. Chromosomes 2 and 5 showed one pair of clear signals on the long arms of the
chromosomes and Chromosome 4 had one pair of signals on the proximal region of the
chromosome. With their distribution patterns, Chromosomes 1 to 5 could be clearly
discriminated by using (AAG)7 probe.
2.4 Discussion
Schmidt and Heslop-harrison (1996) demonstrated that microsatellites, representing
a substantial fraction of the genome, showed chromosome-specific amplification in plants.
The repeat AAG presented different in situ hybridization patterns that provided cytogenetic
landmarks for chromosome identification in barley, Hordeum vulgare ssp. vulgare (Carmona
et al. 2013). Also, Sonah et al. (2011) described that AAG repeat units are major contributors
to the genomes of dicots.

38
As shown in the previous reports (Lindqvist 1960; Koopman and De Jong 1996),
the karyotype analyses indicated the closest relationship between L. sativa and L. serriola.
Our results showed that karyotype of L. sativa was similar to that of L. serriola, since the
dispersed signal distribution patterns of (AAG)7 repeats were similarly observed in both
species studied. However, L. sativa and L. serriola could be distinguished easily by the
presence of the AAG pericentromeric and telomeric signals on the Chromosomes 1 and 2,
respectively. On the other hand, L. saligna and L. virosa showed their specific karyotype
features with AAG signals compare to the other two species (Figure 2). Lindqvist (1960),
Haque and Godward (1985), Koopman et al. (1993), and Koopman and De Jong (1996)
described that cytological features of L. saligna and L. virosa are different from those of L.
sativa/L. serriola. Based on the sequence comparisons of chloroplast DNAs in Lactuca
species, Wei et al. (2017) revealed that L. sativa/L. serriola group was different from that of
L. saligna/L. virosa. This fact indicates that the distribution of microsatellite sequence on the
chromosomes reflects the phylogenetic differentiation of the species in the genus Lactuca.
Cytological analyses on the distribution of microsatellite sequences would provide insight
into the phylogenetic differentiation of the species in the genus Lactuca. In conclusion, the

39
AAG repeat presented different in situ hybridization patterns that provided cytogenetic
landmarks for chromosome identification in Lactuca species.
40
2.5 Figures
Figure 2-1. FISH of (AAG)7 (red) probe in four Lactuca species. (a-c) L. sativa cv. ‘Shinano
Hope’ showing dispersed signals distribution in all chromosomes and two bright signal sites
of (AAG)7, (d-f) L. serriola showing dispersed signals distribution in all chromosomes with
one pair of weak signals, (g-i) L. saligna showing bright signals in two pairs of
chromosomes, (j-l) L. virosa showing strong signals. Scale bar=10 µm
41
Figure 2-2. FISH karyotypes of four Lactuca species with (AAG)n signals. Homologous
pairs of chromosomes were arranged and numbered according to their lengths. Horizontal
lines show the positions of the centromeres. Scale Bar=10 µm
42
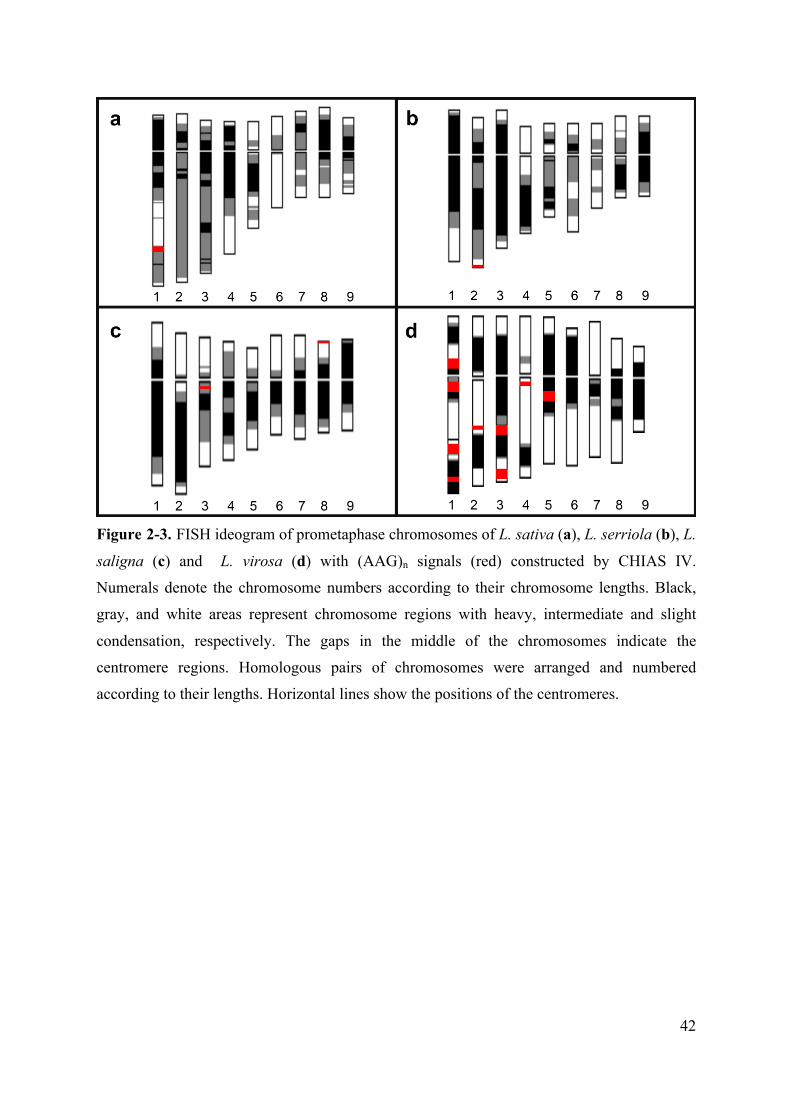
Figure 2-3. FISH ideogram of prometaphase chromosomes of L. sativa (a), L. serriola (b), L.
saligna (c) and L. virosa (d) with (AAG)n signals (red) constructed by CHIAS IV.
Numerals denote the chromosome numbers according to their chromosome lengths. Black,
gray, and white areas represent chromosome regions with heavy, intermediate and slight
condensation, respectively. The gaps in the middle of the chromosomes indicate the
centromere regions. Homologous pairs of chromosomes were arranged and numbered
according to their lengths. Horizontal lines show the positions of the centromeres.

43
CHAPTER 3
Physical localization of rDNAs and microsatellite sequences on the chromosomes of
Lactuca saligna using fluorescence in situ hybridization
44
Summary Lactuca saligna L. is one of the wild species in the genus Lactuca and is
considered to be the most important genetic resources in the lettuce genepool. In the present
study, fluorescence in situ hybridization (FISH) was applied to localize 45S and 5S rDNA
sequences and nine microsatellites on mitotic, and meiotic diakinesis and pachytene
chromosomes of L. saligna. FISH using 45S and 5S rDNAs as the probes provided high
resolution FISH images. Insertion of 5S rDNA into the region of 45S rDNA was also found
on Chromosome 5. This is the first report of high-resolution FISH with 45S and 5S rDNAs
on pachytene chromosomes of L. saligna. Of the nine microsatellite probes tested, (AAC)7,
(ACG)7, (CAC)7, and (CG)10 yielded no signals. The other five microsatellite probes, (AG)10,
(AC)10, (GCC)7, (ACT)7, and (AAG)7 successfully produced FISH signals. The signals of
(AG)n, (AC)n, and (GCC)n were found to be distributed across the prometaphase
chromosomes. In contrast, the signals of (ACT)n and (AAG)n showed chromosome specific
patterns, indicating these signals could be used as chromosomal markers of L. saligna. Our
FISH images using rDNAs and microsatellites as the probes provided valuable information
for discrimination of chromosomes in L. saligna, and it would be beneficial for future
cytogenetic studies on Lactuca genomes.
Key words L. saligna, FISH, microsatellites, rDNAs
45
3. 1 Introduction
Willow-leaf lettuce (Lactuca saligna L.) is a diploid wild species with chromosome
number n = 9, with the features of annual life cycle, characteristic glabrous stems, spike-like
inflorescences, sessile capitules, and almost linear steam leaves (Zohary 1991). L. saligna is
considered to be one of the most important species in the lettuce genepool (Lebeda et al.
2007). It has come to play a considerable role in lettuce resistance breeding to Bremia
lactucae (downy mildew pathogen) (Lebeda et al. 2002, 2007; Beharav et al. 2006).
Fluorescence in situ hybridization (FISH) technique using ribosomal RNA genes
and telomere sequences as the probes have been widely applied for karyotyping and studying
chromosomal organization and evolution in many plant species. Karyotype analyses and
chromosomal distribution of 5S and 18S rDNAs in L. sativa, L. serriola, L. saligna and L.
virosa by FISH method were examined by Matoba et al. (2007) and Widarmi et al. (2019).
These analyses revealed the dissimilarity among the karyotypes of L. virosa, L. sativa, L.
serriola and L. saligna. The FISH result showed that although the loci of the both rDNAs of
L. sativa, L. serriola and L. saligna were identical, those of L. virosa were different from
other species.
46
Microsatellites or simple sequence repeats (SSRs) are tandem repeats of DNA motifs
composed of short repeated units of 1-6 nucleotides, that can be found anywhere in the
genome, both in protein-coding and noncoding regions (Toth et al. 2000). Because of their
high mutability, microsatellites are thought to play a significant role in genome evolution by
creating and maintaining quantitative genetic variation (Tautz et al. 1986; Kashi et al. 1997).
Microsatellite markers were developed as polymerase chain reaction-based markers
and used as probes in fluorescence in situ hybridization (FISH) technique which is a crucial
tool for plant molecular cytogenetic researches (Jiang and Gill 2006). Microsatellites have
been widely used for chromosome identification and studies of genome organization and
evolution in different plant species e.g. Triticeae (Cuadrado et al. 2008), Allium (Monkheang
et al. 2016) and Panax ginseng (Waminal et al. 2018). As far as we know, no previous FISH
experiments using microsatellite sequences as the probes have been reported in Lactuca
species.
In the present study, we aimed to perform FISH using nine SSRs and 45S and 5S
rDNA sequences as the probes, on the mitotic, and meiotic diakinesis and pachytene
chromosomes of L. saligna in order to identify the distribution of the repetitive sequences.

47
3.2 Materials and Methods
Plant materials and chromosome sample preparation
Seeds of L. saligna were provided by Nagano Vegetable and Ornamental Crops
Experimental Station, Nagano, Japan. They were germinated in petri dishes in room
temperature and planted in pots in a greenhouse. Mitotic cells were obtained from root tips of
1-2 cm long collected from the seedlings and young plants grown in 500-mL pots for a few
weeks, whereas meiotic cells were obtained from immature flower buds of 0.8-3.0 mm in
size. The root tips and flower buds were fixed in 3 ethanol : 1 acetic acid (v/v) at 4°C for 5
days before chromosome preparation. Fixed root tips and flower buds were washed three
times with distilled water, and stored in 70% ethanol at 4°C until use. Chromosome
preparations were made through enzymatic maceration; root tips were digested with 10 µL
enzymatic mixture (4% Cellulase Onozuka RS, Yakult; 2% Pectolyase Y-23, Kyowa; and 1%
Pectinase from Aspergillus, Sigma) at 37°C for 45-90 min. Squashing was made in 60%
acetic acid and the slides were stored at -80°C for over 12 h until observation
DNA probe preparation
48
Wheat 45S rDNA (pTa71) and 5S rDNA were used as the probes for FISH analyses
(Gerlach and Bedbrook 1979; Fukui et al. 1994; Widarmi et al. (in press)). 5S rDNA was
amplified from Lactuca sativa L. genomic DNA by polymerase chain reaction (PCR) using
coding regions of 5S rDNA as the primers (Fukui et al. 1994; Widarmi et al. (in press)). PCR
products with expected size of 301 bp were cloned into pZErO-2 Vector (Invitrogen)
according to manufacturer’s instruction. Both 45S and 5S rDNA probes were labeled with
Biotin-Nick Translation Mix (Roche), whereas 45S rDNA was labeled with DIG-Nick
Translation Mix (Roche) according to the manufacturer’s instructions. The (AAC)7, (ACG)7,
(ACT)7, and (CAC)7 probes were end-labelled with biotin-16-dUTP (Roche) and the (AG)10,
(CG)10, (AC)10, (AAG)7, and (GCC)7 probes with digoxigenin-11-dUTP (Roche) by terminal
deoxynucleotidyl transferase (TdT) (Thermo Fisher Scientific) following the manufacturer’s
instructions.
FISH analysis
Chromosome slides were re-fixed in 1% paraformaldehyde/1× PBS for 10 min at
room temperature. Procedures for hybridization and detection were followed as described by
Kikuchi et al. (2008). Biotin and digoxigenin labeled probes were detected using a
49
biotinylated streptavidin-FITC (vector laboratories) and anti-digoxigenin rhodamine (Roche),
respectively. The slides were counter-stained with 4,6-diamidino-2-phenylindole (DAPI) in a
VectaShield antifade solution (Vector Laboratories). All FISH images were captured with an
Olympus BX53 fluorescence microscope with a CCD camera (CoolSNAP MYO;
Photometrics). The FISH images were processed by Metamorph, Metavue imaging series
version 7.8 and edited with Adobe Photoshop CC 2017. In the karyotype analyses,
chromosomes were arranged and numbered according to their lengths.
3.3 Results
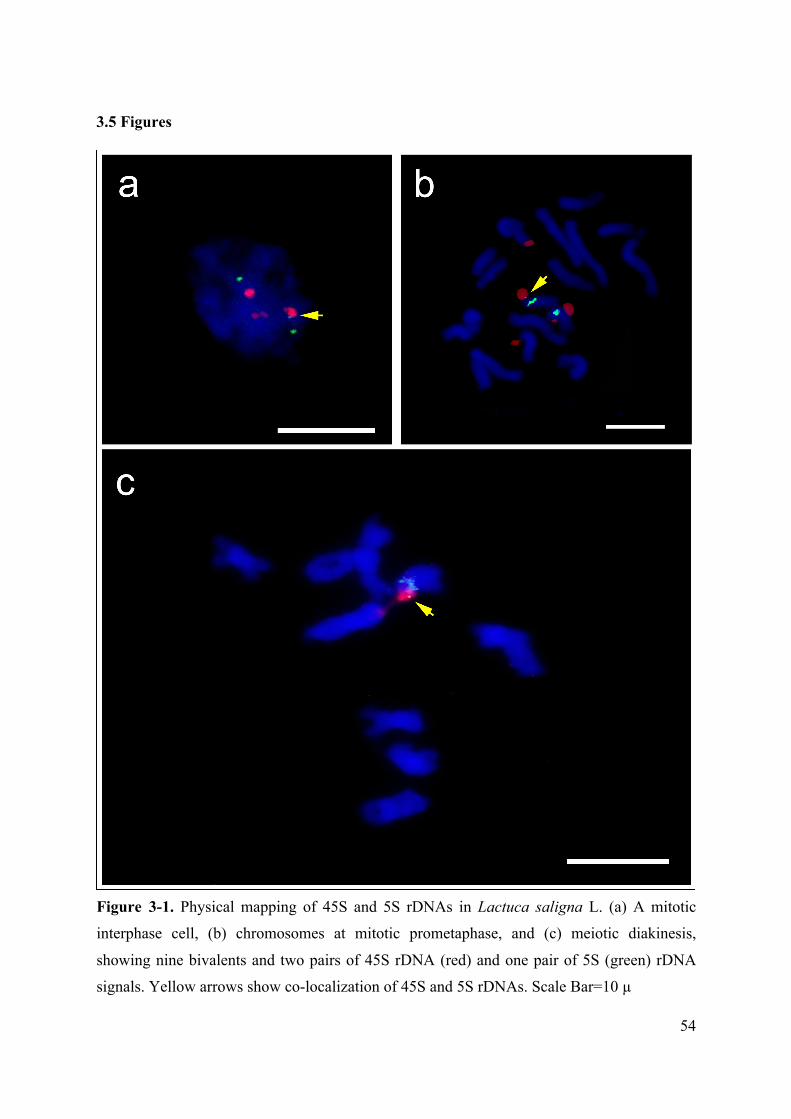
Physical locations of 45S and 5S RNA genes on the chromosomes of L. saligna are
shown in Fig. 3-1. Two large pairs of 45S rDNA signals were detected in the interphase cells
at the nucleolus organizer regions (NOR) and were on the short arms of the prometaphase
chromosomes. A pair of 5S rDNA signals were detected at the interstitial regions of the short
arms of the chromosomes. It was also found another 5S rDNA site co-localizing with one site
of 45S rDNA loci.
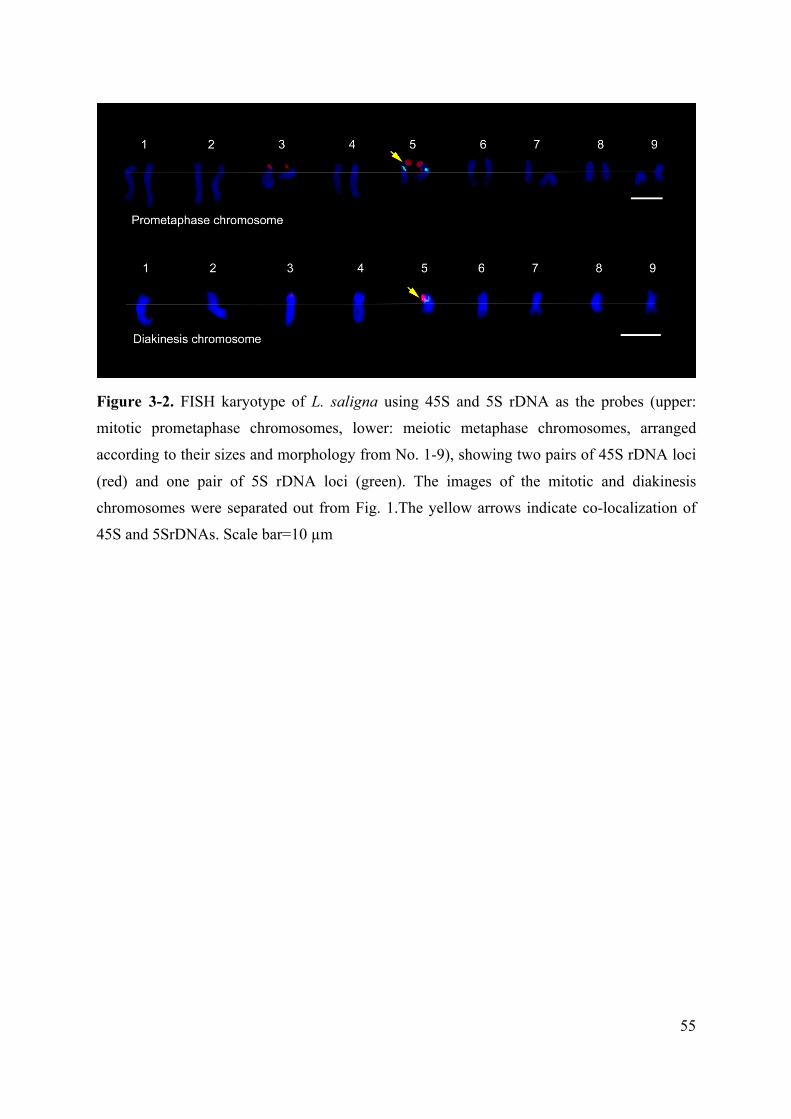
Fig. 3-2 shows FISH karyotypes at mitotic prometaphase and meiotic diakinesis
stages. Two pairs of 45S rDNA signals could be localized at the ends of the short arms of
50
Chromosome 3, and Chromosome 5, respectively. Two 5S rDNA signals were localized in
the interstitial regions of the short arms of Chromosome 5. Moreover, Chromosomes 5 had
another 5S rDNA site co-localizing with 45S rDNA loci.
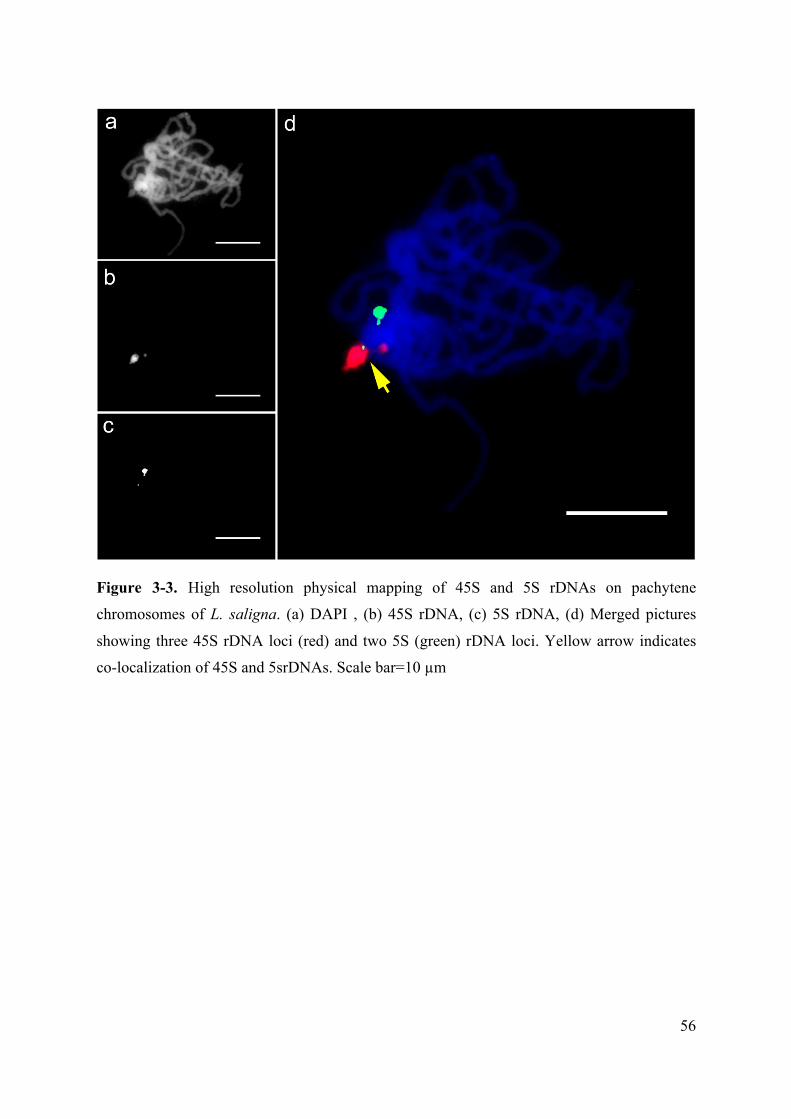
FISH experiment using 45S and 5S rDNAs on the pachytene chromosomes
provided a much higher resolution of the signals located on the corresponding mitotic and
meiotic bivalent chromosomes (Fig. 3-3). Two clear 45S rDNA signals and one 5S rDNA
signal were detected in the pachytene chromosomes. Moreover, another 5S rDNA site was
found clearly to be co-localized with 45S rDNA. (Fig. 3-3d).
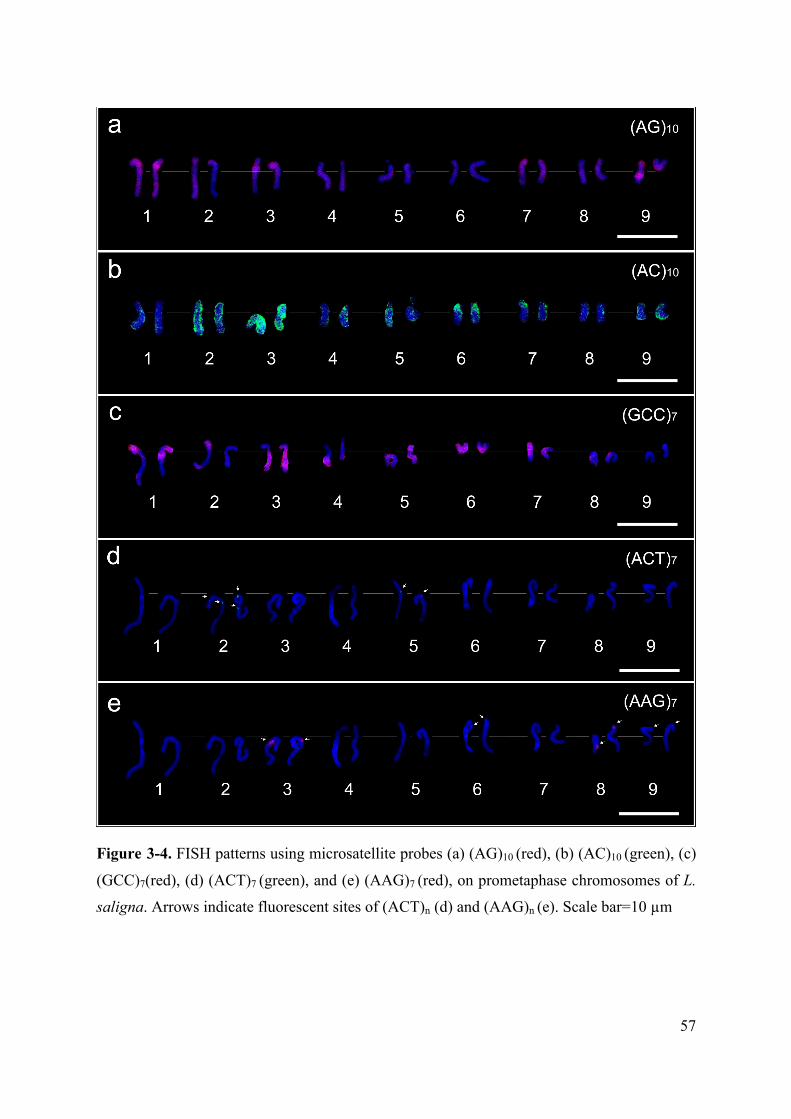
After FISH using nine microsatellite sequences as the probes, (AAC)7, (ACG)7,
(ACT)7, (CAC)7, (AG)10, (CG)10, (AC)10, (AAG)7, and (GCC)7 , only five, (AG)10, (AC)10,
(GCC)7, (ACT)7, and (AAG)7 were successful in producing FISH signals. The signals of
(AG)n, (AC)n, and (GCC)n were found to be distributed across the prometaphase
chromosomes of L. saligna (Fig. 3-4a-c). In contrast, FISH signals of (ACT)n and (AAG)n
showed intensively limited localization on the chromosomes. Two pairs of signals of (ACT)n
were localized at the centromeric and interstitial regions of Chromosomes 2, and one pair of
the signals at the centromeric regions of Chromosome 5 (Fig. 4d). One pair of signals of
(AAG)n were found at the interstitial regions of the long arms of Chromosome 3, and three

51
pairs of the signals at the interstitial regions of the short arms of Chromosomes 6, 8, and 9
(Fig. 3-4e).
3.4 Discussion
In the present study, two pairs of 45S rDNA signals were detected at the nucleolus
organizer regions (NOR) on the short arms of the Chromosomes 3 and 5, and a pair of 5S
rDNA signals were detected at the interstitial regions of the short arms of Chromosome 5.
Our results confirmed the results of Matoba et al. (2007). However, it was clarified that
meiotic diakinesis and pachytene chromosomes of L. saligna provide much higher resolution
of FISH analysis, namely, new 5S rDNAs signal were detected (Figs. 3-1, 3-2 and 3-3). This
is the first report of high-resolution FISH with 45S and 5S rDNA on pachytene chromosome
of L. saligna.
In the present study, insertion of 5S rDNA into the region of 45S rDNA was found on
Chromosome 5 (Fig2. 3-1, 3-2, and 3-3). This phenomenon is considered accidentally
occurred by transposon-like DNA-mediated or retrotransposon-like RNA-mediated
transposition in some lower eukaryotes (Drouin and de Sa 1995; Sone et al. 1999). By using
molecular cytogenetics, Southern blot hybridization, PCR-based techniques and DNA
52
sequencing, 5S genes can be embedded within the 45S multigene family in angiosperms
(Asteraceae; Garcia et al. 2009, 2010). These authors suggested that the 5S gene integration
within the 45S multigene family probably occurred once in Asteraceae, but might have
repeatedly occurred elsewhere during plant evolution. Also, it was reported that rDNA loci
can rapidly change places on chromosomes (Dubcovsky and Dvorak 1995). Our present
finding of the insertion of 5S rDNA into 45S rDNA seems to have taken place during the
divergence in evolution.
Schmidt and Heslop-Harrison (1996) demonstrated that microsatellites, representing a
substantial fraction of the genome, showed chromosome-specific amplification in plants. In
the present work, only five, (AG)10, (AC)10, (GCC)7, (ACT)7, and (AAG)7 were successful in
producing FISH signals. Cuadrado and Jouve (2007) reported that AG and AC repeat sites
were remarkably similar and uniformly dispersed along the euchromatic portion of metaphase
chromosomes of human, barley and Drosophila melanogaster. Also, Dou et al. (2016) found
that the distribution of GCC repeat sites were dispersed in metaphase chromosome of
Hordeum brevisubulatum. It was found that the (AG)10, (AC)10, and (GCC)7, repeats gave
dispersed distribution in almost all chromosomes of L. saligna. Therefore, it might be

53
possible that these three repetitive sequences are universally distributed among the eukaryote
chromosomes including L. saligna.
On the other hand, it was found that (ACT)n, and (AAG)n could be used as
chromosomal markers of L. saligna, since the homologous chromosome could be
distinguished based on the karyotype of prometaphase chromosomes and the distribution
patterns of the SSRs hybridized with these two probes. Dou et al. (2016) also showed that the
SSRs, (ACT)n and (AAG)n, are ideal markers for chromosome identification because of their
abundance and their large number of polymorphic sites across individual chromosomes of H.
bogdanii
As the conclusion, locations of 45S and 5S rDNAs and five SSRs, (AG)n, (AC)n,
(GCC)n, (ACT)n, and (AAG)n were physically mapped on the chromosomes of L. saligna.
The FISH results presented here using rDNA and SSRs as the probes provide beneficial
information that might be used for future cytogenetic studies and could contribute physical
assembly of the L. saligna genome.
54
3.5 Figures
Figure 3-1. Physical mapping of 45S and 5S rDNAs in Lactuca saligna L. (a) A mitotic
interphase cell, (b) chromosomes at mitotic prometaphase, and (c) meiotic diakinesis,
showing nine bivalents and two pairs of 45S rDNA (red) and one pair of 5S (green) rDNA
signals. Yellow arrows show co-localization of 45S and 5S rDNAs. Scale Bar=10 µ
55
Figure 3-2. FISH karyotype of L. saligna using 45S and 5S rDNA as the probes (upper:
mitotic prometaphase chromosomes, lower: meiotic metaphase chromosomes, arranged
according to their sizes and morphology from No. 1-9), showing two pairs of 45S rDNA loci
(red) and one pair of 5S rDNA loci (green). The images of the mitotic and diakinesis
chromosomes were separated out from Fig. 1.The yellow arrows indicate co-localization of
45S and 5SrDNAs. Scale bar=10 µm
56
Figure 3-3. High resolution physical mapping of 45S and 5S rDNAs on pachytene
chromosomes of L. saligna. (a) DAPI , (b) 45S rDNA, (c) 5S rDNA, (d) Merged pictures
showing three 45S rDNA loci (red) and two 5S (green) rDNA loci. Yellow arrow indicates
co-localization of 45S and 5srDNAs. Scale bar=10 µm
57
Figure 3-4. FISH patterns using microsatellite probes (a) (AG)10 (red), (b) (AC)10 (green), (c)
(GCC)7(red), (d) (ACT)7 (green), and (e) (AAG)7 (red), on prometaphase chromosomes of L.
saligna. Arrows indicate fluorescent sites of (ACT)n (d) and (AAG)n (e). Scale bar=10 µm

58
GENERAL DISCUSSION
Cultivated lettuce (Lactuca sativa L.) belongs to the genus Lactuca and is an
important vegetable worldwide, which has been a problematic genus in terms of its
taxonomic circumscription and phylogenetic affinities for more than a century. Over the past
decades, there have been many controversies about the phylogeny of Lactuca species, due to
the morphological characters of Lactuca species are complex and diverse, adding up the
difficulty of studying phylogenetic relationships within Lactuca.
FISH-based karyotyping is a powerful cytogenetics tool to study chromosome
organization, behavior, and chromosome evolution that provide phylogenetical information in
closely related taxa and have been widely applied for karyotyping and studying chromosomal
organization and evolution in many plant species. The pattern of hybridization signals greatly
facilitates chromosome identification and accurate karyotype analysis (Kato et al. 2004,
Paesold et al. 2012, Wolny et al. 2013). Furthermore, comparative studies of plant repetitive
sequences are useful for the investigation of evolutionary relationships among plant species
(Menzel et al. 2008). Various combinations of repetitive sequences, both those occurring in
tandem and forming large clusters, such as ribosomal genes, telomeric repeats, and satellite
59
DNAs, including centromere-specific repeats, and those having a dispersed distribution
typical for transposable elements have been cytogenetically mapped by FISH
(Heslop-Harrison 2000, Schwarzacher 2003).
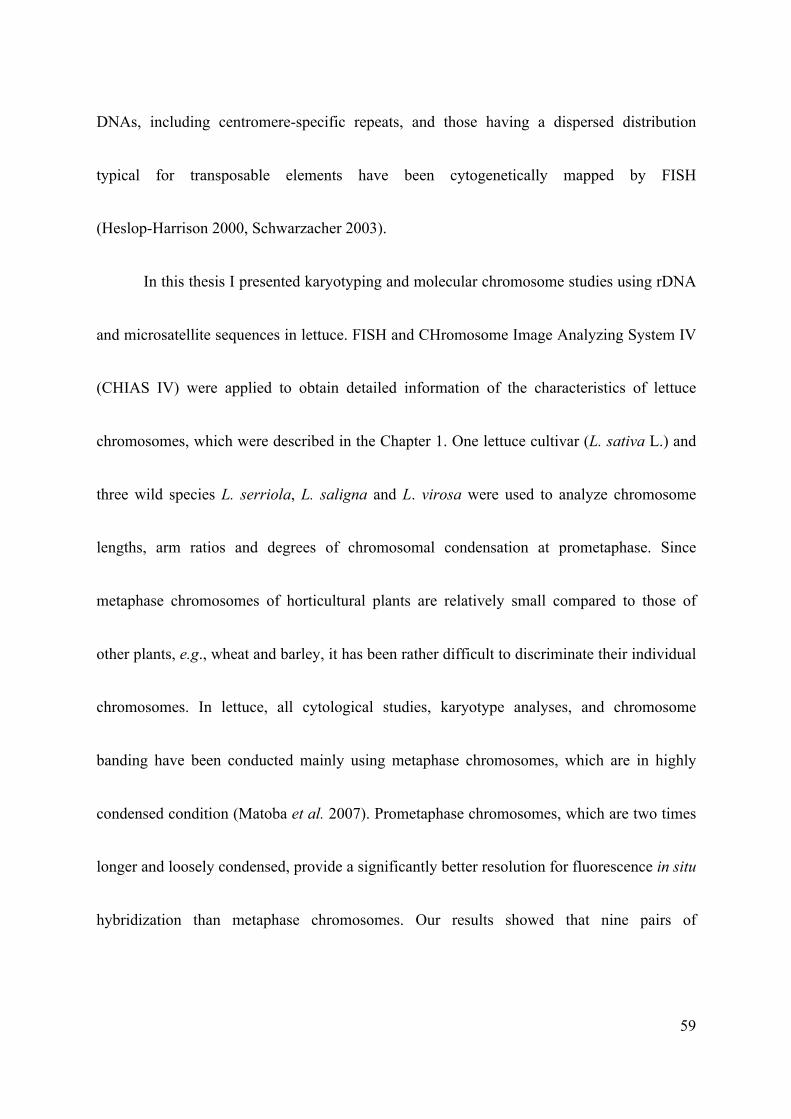
In this thesis I presented karyotyping and molecular chromosome studies using rDNA
and microsatellite sequences in lettuce. FISH and CHromosome Image Analyzing System IV
(CHIAS IV) were applied to obtain detailed information of the characteristics of lettuce
chromosomes, which were described in the Chapter 1. One lettuce cultivar (L. sativa L.) and
three wild species L. serriola, L. saligna and L. virosa were used to analyze chromosome
lengths, arm ratios and degrees of chromosomal condensation at prometaphase. Since
metaphase chromosomes of horticultural plants are relatively small compared to those of
other plants, e.g., wheat and barley, it has been rather difficult to discriminate their individual
chromosomes. In lettuce, all cytological studies, karyotype analyses, and chromosome
banding have been conducted mainly using metaphase chromosomes, which are in highly
condensed condition (Matoba et al. 2007). Prometaphase chromosomes, which are two times
longer and loosely condensed, provide a significantly better resolution for fluorescence in situ
hybridization than metaphase chromosomes. Our results showed that nine pairs of

60
homologous chromosomes could be discriminated for all four species using their
morphological characteristics, condensation patterns (CPs) and localization of rRNA loci.
In chapter 2, it is shown the distribution of (AAG)7 of Lactuca species was performed
to clarify the possibility of using the microsatellite repetitive sequences for discrimination
and/or identification of the chromosomes in Lactuca species.
Different distribution patterns of (AAG)n signals were shown in all four Lactuca
species studied. In L. sativa and L. serriola, FISH with (AAG)7 sequences revealed dispersed
distribution patterns with one pair of bright signals, respectively. While in L. saligna and L.
virosa, distinct signals with different intensities were observed in two pairs of chromosomes
of L. saligna and five pairs of chromosomes of L. virosa. Schmidt and Heslop-harrison
(1996) demonstrated that microsatellites, representing a substantial fraction of the genome,
showed chromosome-specific amplification in plants. The repeat AAG presented different in
situ hybridization patterns that provided cytogenetic landmarks for chromosome
identification in barley, Hordeum vulgare ssp. vulgare (Carmona et al. 2013). Also, Sonah et
al. (2011) described that AAG repeat units are major contributors to the genomes of dicots.
As shown in the previous reports (Lindqvist 1960; Koopman and De Jong 1996), the
present karyotype analyses indicated the closest relationship between L. sativa and L. serriola.
61
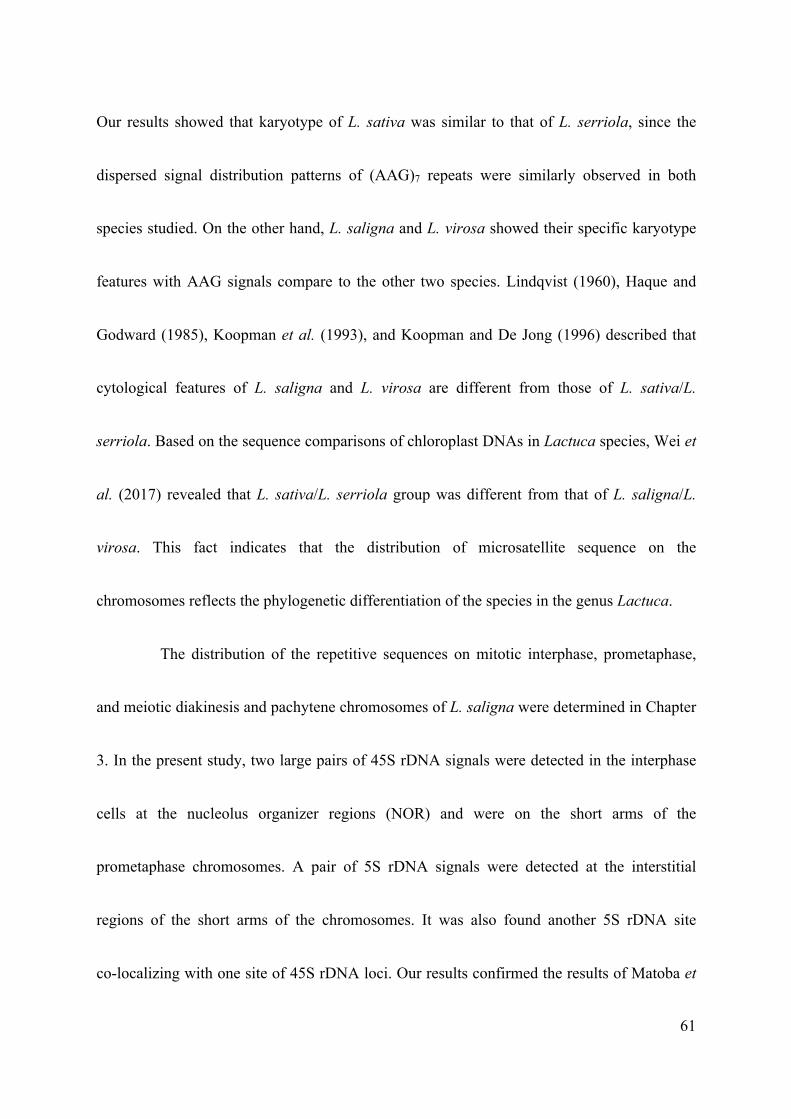
Our results showed that karyotype of L. sativa was similar to that of L. serriola, since the
dispersed signal distribution patterns of (AAG)7 repeats were similarly observed in both
species studied. On the other hand, L. saligna and L. virosa showed their specific karyotype
features with AAG signals compare to the other two species. Lindqvist (1960), Haque and
Godward (1985), Koopman et al. (1993), and Koopman and De Jong (1996) described that
cytological features of L. saligna and L. virosa are different from those of L. sativa/L.
serriola. Based on the sequence comparisons of chloroplast DNAs in Lactuca species, Wei et
al. (2017) revealed that L. sativa/L. serriola group was different from that of L. saligna/L.
virosa. This fact indicates that the distribution of microsatellite sequence on the
chromosomes reflects the phylogenetic differentiation of the species in the genus Lactuca.
The distribution of the repetitive sequences on mitotic interphase, prometaphase,
and meiotic diakinesis and pachytene chromosomes of L. saligna were determined in Chapter
3. In the present study, two large pairs of 45S rDNA signals were detected in the interphase
cells at the nucleolus organizer regions (NOR) and were on the short arms of the
prometaphase chromosomes. A pair of 5S rDNA signals were detected at the interstitial
regions of the short arms of the chromosomes. It was also found another 5S rDNA site
co-localizing with one site of 45S rDNA loci. Our results confirmed the results of Matoba et
62
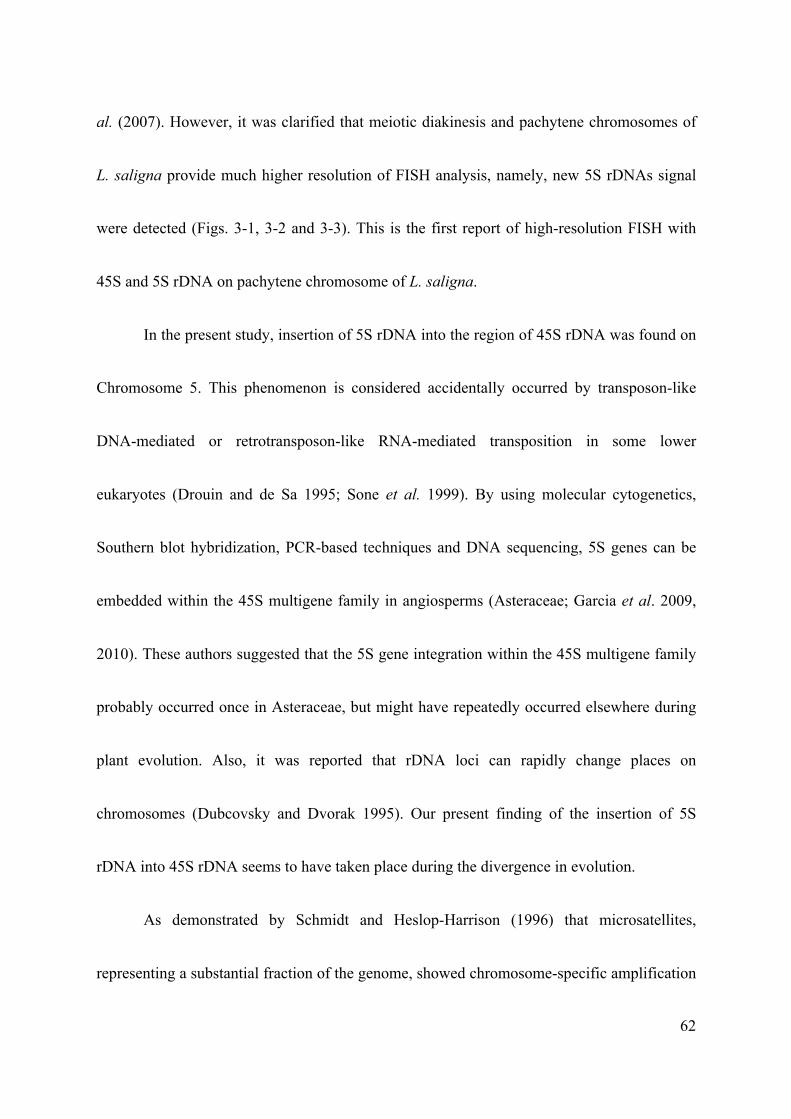
al. (2007). However, it was clarified that meiotic diakinesis and pachytene chromosomes of
L. saligna provide much higher resolution of FISH analysis, namely, new 5S rDNAs signal
were detected (Figs. 3-1, 3-2 and 3-3). This is the first report of high-resolution FISH with
45S and 5S rDNA on pachytene chromosome of L. saligna.
In the present study, insertion of 5S rDNA into the region of 45S rDNA was found on
Chromosome 5. This phenomenon is considered accidentally occurred by transposon-like
DNA-mediated or retrotransposon-like RNA-mediated transposition in some lower
eukaryotes (Drouin and de Sa 1995; Sone et al. 1999). By using molecular cytogenetics,
Southern blot hybridization, PCR-based techniques and DNA sequencing, 5S genes can be
embedded within the 45S multigene family in angiosperms (Asteraceae; Garcia et al. 2009,
2010). These authors suggested that the 5S gene integration within the 45S multigene family
probably occurred once in Asteraceae, but might have repeatedly occurred elsewhere during
plant evolution. Also, it was reported that rDNA loci can rapidly change places on
chromosomes (Dubcovsky and Dvorak 1995). Our present finding of the insertion of 5S
rDNA into 45S rDNA seems to have taken place during the divergence in evolution.
As demonstrated by Schmidt and Heslop-Harrison (1996) that microsatellites,
representing a substantial fraction of the genome, showed chromosome-specific amplification
63
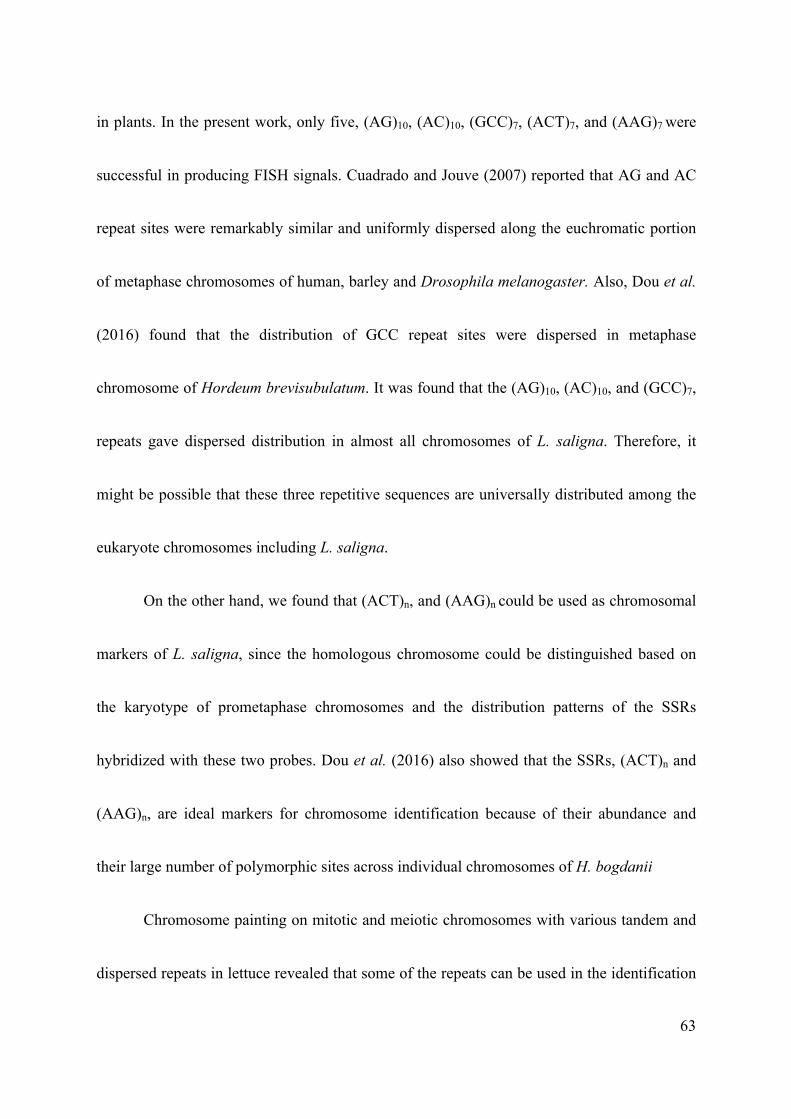
in plants. In the present work, only five, (AG)10, (AC)10, (GCC)7, (ACT)7, and (AAG)7 were
successful in producing FISH signals. Cuadrado and Jouve (2007) reported that AG and AC
repeat sites were remarkably similar and uniformly dispersed along the euchromatic portion
of metaphase chromosomes of human, barley and Drosophila melanogaster. Also, Dou et al.
(2016) found that the distribution of GCC repeat sites were dispersed in metaphase
chromosome of Hordeum brevisubulatum. It was found that the (AG)10, (AC)10, and (GCC)7,
repeats gave dispersed distribution in almost all chromosomes of L. saligna. Therefore, it
might be possible that these three repetitive sequences are universally distributed among the
eukaryote chromosomes including L. saligna.
On the other hand, we found that (ACT)n, and (AAG)n could be used as chromosomal
markers of L. saligna, since the homologous chromosome could be distinguished based on
the karyotype of prometaphase chromosomes and the distribution patterns of the SSRs
hybridized with these two probes. Dou et al. (2016) also showed that the SSRs, (ACT)n and
(AAG)n, are ideal markers for chromosome identification because of their abundance and
their large number of polymorphic sites across individual chromosomes of H. bogdanii
Chromosome painting on mitotic and meiotic chromosomes with various tandem and
dispersed repeats in lettuce revealed that some of the repeats can be used in the identification
64
of individual chromosomes. The 45S rDNA hybridized to chromosomes 3 and 5 of L. sativa,
L. saligna, and L. seriolla, and chromosomes 5 and 7 of L. virosa. The 5S rDNA hybridized
to chromosomes 5 of L. sativa, L. saligna, and L. seriolla, and chromosomes 7 of L. virosa.
(AAG)7 microsatellite repeats were hybridized to Chromosome 1 and 2 of L. sativa and L.
serriola, respectively. Two pairs of AAG repeat signals were observed in L. saligna at the
pericentromeric of Chromosome 3 and subtelomeric signal at Chromosome 8. And, five pairs
of microsatellite probe were observed in L. virosa at Chromosome 1 to 5. These analyses
clarify that the chromosomal characteristics, while cytological features of L. saligna and L.
virosa are different from L. sativa/L. serriola as reported by Lindqvist (1960), Haque and
Godward (1985), Koopman and De Jong (1996) and Koopman et al. (1993).
In conclusion, FISH results using rDNA and SSR probes presented different in situ
hybridization patterns that provided cytogenetic landmarks for chromosome identification in
Lactuca species, also provide information that may be beneficial for future cytogenetic
studies and could contribute the physical assembly of the Lactuca genome. The development
of cytogenetic markers should facilitate physical mapping of the genome. In future studies,
other probes prepared from different kinds of repetitive sequences, single copy genes and

65
DNA markers would be localized for the construction of precise physical chromosome maps
of lettuce.
66
REFERENCES
Akasaka, M., Ueda, Y. and Koba, T. 2003. Karyotype analysis of wild rose species belonging
to septets B, C, and D by molecular cytogenetic method. Breed Sci. 53: 177-182.
Badaeva, E.D., Amosova, A.V., Goncharov, N.P., Macas, J., Ruban, A.S., Grechishnikova,
I.V., Zoshchuk, S.A. and Houben, A. 2015. A set of cytogenetic markers allows the
precise identification of all A-genome chromosomes in diploid and polyploid wheat.
Cytogenet. Genome Res. 146: 71–79. doi:10.1159/000433458.
Badaeva, E.D., Ruban, A.S., Zoshchuk, S.A., Surzhikov, S.A., Knüpffer, H. and Kilian, B.
2016. Molecular cytogenetic characterization of Triticum timopheevii chromosomes
provides new insight on genome evolution of T. zhukovskyi. Plant Syst. Evol. 302:
943–956. doi:10.1007/s00606-016-1309-3.
Beharav, A., Lewinsohn, D., Lebeda, A. and Nevo, E. 2006. New wild Lactuca genetic
resources with resistance against Bremia lactucae. Genet. Res. Crop Evol. 53: 467–474.
Carmona, A., Friero, E., de Bustos, A., Jouve, N. and Cuadrado, A. 2013. Cytogenetic
diversity of SSR motifs within and between Hordeum species carrying the H genome:
H. vulgare L. and H. bulbosum L. Theor. Appl. Genet. 126: 949–961. doi
10.1007/s00122-012-2028-y
67
Cuadrado, A. and Jouve, N. 2007. Similarities in the chromosomal distribution of AG and
AC repeats within and between Drosophila, human and barley chromosomes.
Cytogenet. Genome Res. 119: 91–99. doi: 10.1159/000109624
Cuadrado, A., Cardoso, M. and Jouve, N. 2008. Physical organisation of simple sequence
repeats (SSRs) in Triticeae: structural, functional and evolutionary implications.
Cytogenet. Genome Res. 120: 210–219. doi: 10.1159/000121069
Cuadrado, A., Schwarzacher, T. and Jouve, N. 2000. Identification of different chromatin
classes in wheat using in situ hybridization with simple sequence repeat
oligonucleotides. Theor. Appl. Genet. 101: 711–717. doi: 10.1007/s001220051535
Dou, Q., Liu, R. and Yu, F. 2016. Chromosomal organization of repetitive DNAs in
Hordeum bogdanii and H. brevisubulatum (Poaceae). Comparative Cytogenetics 10(4):
465-481. doi.org/10.3897/CompCytogen.v10i4.9666
Du, Y., Bi Y., Zhang, M., Yang, F., Jia, G. and Zhang, X. 2017. Genome size diversity in
Lilium (Liliaceae) is correlated with karyotype and environmental traits. Front. Plant
Sci. 8: 1-11.
Fukui, K. 1986. Standardization of karyotyping plant chromosomes by a newly developed
chromosome image analyzing system (CHIAS). Theor. Appl. Genet. 72: 27-32.
68
Fukui, K. and Iijima, K. 1991. Somatic chromosome map of rice by imaging methods. Theor.
Appl. Genet. 81: 589-596.
Fukui, K., Kamisugi, Y. and Sakai, F. 1994. Physical mapping of 5S rDNA loci by
direct-cloned biotinylated probes in barley chromosomes. Genome 37: 105-111.
Fukui, K. and Mukai, Y. 1988. Condensation pattern as a new image parameter for
identification of small chromosomes in plants. Jpn. J. Genet. 63: 359-366.
Furukawa, K., Sugiyama, S., Ohta, T. and Ohmido, N. 2017. Chromosome analysis of tea
plant (Camellia sinensis) and ornamental camellia (Camellia japonica). Chromosome.
Sci. 20: 9-15.
Gerlach W. L. and Bedbrook J.R. 1979. Cloning and characterization of ribosomal RNA
genes from wheat and barley. Nucleic Acids Res. 7:1869–1885
Haque, M. Z. and Godward, M.B.E. 1985. Comparison between two genera, species and
cultivars in Lactuceae I. Karyotype analysis. Cytologia 50: 725-738.
Harlan, J.R. 1986. Lettuce and the sycomore: sex and romance in ancient Egypt. Econ. Bot.
40: 4–15.
Heslop-Harrison, J.S. 2000. Comparative genome organization in plants: from sequence and
markers to chromatin and chromosomes. Plant Cell 12: 617-635,
69
Hill, M., Witsenboer, H., Zabeau, M., Vos P., Kesseli R. and Michelmore R. 1996.
PCR-based fingerprinting using AFLPs as a tool for studying genetic relationships in
Lactuca spp. Theor. Appl. Genet. 93:1202-1210.
Ito, M., Ohmido, N., Akiyama, Y., Fukui, K. and Koba, T. 2000. Characterization of spinach
chromosomes by condensation patterns and physical mapping of 5S and 45S rDNAs by
FISH. J. Am. Soc. Hort. Sci. 125: 59-62.
Jiang, J. and Gill, B.S. 2006. Current status and the future of fluorescence in situ
hybridization (FISH) in plant genome research. Genome 49: 1057–1068.
Kashi, Y., King, D. and Soller, M. 1997. Simple sequence repeats as a source of quantitative
genetic variation. Trends Genet. 13: 74–78.
Kato, A., Lamb, J.C. and Birchler, J.A. 2004. Chromosome painting using repetitive DNA
sequences as probes for somatic chromosome identification in maize. Proc. Nat. Acad.
Sci. USA 101: 13554-13559,
Kesseli, R., Ochoa, O. and Michelmore, R.W. 1991.Variation at RFLP loci in Lactuca spp.
and origin of cultivated lettuce (L. sativa). Genome 34: 430436

70
Kikuchi, S., Matsui, K., Tanaka, H., Ohnishi, O. and Tsujimoto, H. 2008. Chromosome
evolution among seven Fagopyrum species revealed by fluorescence in situ
hybridization (FISH) probed with rDNAs. Chromosome Sci. 11: 37-43.
Koopman, W. J. M. 2000. Identifying lettuce species (Lactuca subsect. Lactuca, Asteraceae):
A practical application of flow cytometry. Euphytica 116: 151-159.
Koopman, W. J. M. and De Jong, J.H. 1996. A numerical analysis of karyotypes and DNA
amounts in lettuce cultivars and species (Lactuca subsect. Lactuca, Compositae). Acta
Bot. Neerl. 45: 211-222.
Koopman, W.J.M., De Jong, J.H. and De Vries, I.M. 1993. Chromosome banding patterns in
lettuce species (Lactuca sect. Lactuca, Compositae) Plant Syst. Evol. 185: 249-257.
Koopman, W.J.M., Guetta, E., van de Wiel, C.C.M., Vosman, B. and van den Berg, R.G.
1998. Phylogenetic relationships among Lactuca (Asteraceae) species and related
genera based on ITS-1 DNA sequences. Am. J. Bot. 85: 1517-1530.
Křístková, E., Doležalová, I., Lebeda, A., Vinter, V. and Novotná, A. 2008. Description of
morphological characters of lettuce (Lactuca sativa L.) genetic resources. Hort. Sci. 35:
113-129.
71
Kuznetsova, M. A., Chaban, I. A. and Sheval, E. V. 2017. Visualization of chromosome
condensation in plants with large chromosomes. BMC Plant Biol. 17: 1–12.
Lebeda, A., Doležalová, I., Feráková, V. and Astley, D. 2004. Geographical distribution of
wild Lactuca species (Asteraceae, Lactuceae). Bot. Rev. 70: 328s–356.
Lebeda, A., Doležalová, I., Křístková, E., Kitner, M., Petrželová, I., Mieslerová, B. and
Novotná, A. 2009. Wild Lactuca germplasm for lettuce breeding: current status, gaps
and challenges. Euphytica 170: 15–34.
Lebeda, A., Pink, D.A.C., Astley, D. 2002. Aspects of the interactions between wild Lactuca
spp. and related genera and lettuce downy mildew (Bremia lactucae). In:
Spencer-Phillips, P.T.N., Gisi, U., Lebeda, A., (eds.) Advances in downy mildew
research. Kluwer Academic Publishers, Dordrecht, pp. 85–117.
Lebeda, A., Ryder, E.J., Grube, R., Doležalová, I. and Křístková, E. 2007. Lettuce
(Asteraceae; Lactuca spp.), Chapter 9. In: R. Singh (ed.), Genetic Resources,
Chromosome Engineering, and Crop Improvement, Volume 3 – Vegetable Crops. CRC
Press, Boca Raton, FL, USA. pp. 377-472.
Levan, A., Fredga, K. and Sandberg, A.A. 1964. Nomenclature for centromeric position on
chromosome. Hereditas 52: 201-220.
72
Lindqvist, K. 1960. Cytogenetic studies in the serriola group of Lactuca. Hereditas 46:
75-151.
Luo X., Liu J., Wang J., Gong W., Chen L. and Wan W. 2018. FISH analysis of Zanthoxylum
armatum based on oligonucleotides for 5S rDNA and (GAA)6. Genome, 61: 699-702.
doi.org/10.1139/gen-2018-0009
Matoba, H., and Uchiyama, H. 2009. Physical mapping of 5S rDNA, 18S rDNA and telomere
sequences in three species of the genus Artemisia (Asteraceae) with distinct basic
chromosome numbers. Cytologia 74: 115–123, 2009.
Matoba, H., Mizutani, T., Nagano, K., Hoshi, Y. and Uchiyama, H. 2007. Chromosomal
study of lettuce and its allied species (Lactuca spp., Asteraceae) by means of karyotype
analysis and fluorescence in situ hybridization. Hereditas 144: 235-243.
Menzel, G., Dechyeva, D., Wenke, T., Holtgraewe, D., Weisshaar, B. and Schmidt, T. 2008.
Diversity of a complex centromeric satellite and molecular characterization of
dispersed sequence families in sugar beet (Beta vulgaris). Ann. Bot. 102: 521-530.
Michelmore, R. W., Kesseli, R. V. and Ryder, E. J. 1994. Genetic Mapping in Lettuce. In:
Phillips, R. L. and Vasil, I. K. (eds.), DNA-Based Markers in Plants, Kluwer Academic
Publishers, Dordrecht. pp. 223-239.

73
Monkheang, P., Sudmoon, R., Tanee, T. and Chaveerach, A. 2016. Differences in the
patterns of a microsatellite marker on chromosomes in four Allium species. Cytologia
81: 179–181.
Mou, B. 2008. Lettuce. In: Prohens, J. and Nuez, F. (eds.), Handbook of Plant Breeding.
Vegetables I. Asteraceae, Brassicaceae, Chenopodiaceae, and Cucurbitaceae. New
York, Springer Science: 75–116.
Mukai, Y., Nakahara, Y. and Yamamoto, M. 1993. Simultaneous discrimination of the three
genomes in hexaploid wheat by multicolor fluorescence in situ hybridization using total
genomic and highly repeated DNA probes. Genome 36: 489-494.
Paesold, S., Borchardt, D., Schmidt, T. and Dechyeva, D. 2012. A sugar beet (Beta vulgaris
L.) reference FISH karyotype for chromosome and chromosome-arm identification,
integration of genetic linkage groups and analysis of major repeat family distribution.
Plant J. 72: 600-611,
Pedersen, C. and Langridge, P. 1997. Identification of the entire chromosome complement of
bread wheat by two-color FISH. Genome 40: 589–593.
Pedersen, C., Rasmussen, S. K. and Linde-Laursen, I. 1996. Genome and chromosome
identification in cultivated barley and related species of the Triticeae (Poaceae) by in
74
situ hybridization with the GAA-satellite sequence. Genome 39: 93–104. doi:
10.1139/g96-013
Reyes-Chin-Wo, S., Wang, Z., Yang, X., Kozik, A., Arikit, S., Song, C. and Michelmore, R.
W. 2017. Genome assembly with in vitro proximity ligation data and whole-genome
triplication in lettuce. Nature Commun. 8 :14953.
Schmidt, T. and Heslop-Harrison, J.S. 1996. The physical and genomic organization of
microsatellites in sugar beet. Proc. Natl. Acad. Sci. USA. 93: 8761–8765. doi:
10.1073/pnas.93.16.8761
Sonah, H., Deshmukh, R.K., Sharma, A., Singh, V.P., Gupta D.K., Gacche R.N., Rana, J.C.,
Singh, N.K. and Sharma, T.R. 2011. Genome-wide distribution and organization of
microsatellites in plants: an insight into marker development in Brachypodium. PLoS
ONE 6: e21298 10.1371/journal.pone.0021298
Schwarzacher, T. 2003. DNA, chromosomes, and in situ hybridization. Genome 46: 953-962.
Tautz, D., Trick, M. and Dover, G. 1986. Cryptic simplicity in DNA is a major source of
genetic variation. Nature 322: 652–656.
Toth, G., Gaspari, Z. and Jurka, J. 2000. Microsatellites in different eukaryotic genomes:
survey and analysis. Genome Res. 10: 967–981.
75
Waminal, N.E., Pellerin, R.J., Jang, W., Kim, H.H. and Yang, T.J. 2018. Characterization of
chromosome-specific microsatellite repeats and telomere repeats based on low
coverage whole genome sequence reads in Panax ginseng. Pl. Breed. Biotechnol. 6:
74-81. doi.org/10.9787/PBB.2018.6.1.74
Wei Shi-Xin Zhu G Van den Berg Freek T Bakker M Eric Schranz ZR. 2017. Phylogenetic
relationships within Lactuca L. (Asteraceae), including African species, based on chloroplast
DNA sequence comparisons. Genet Resour Crop Evol. 64. doi:10.1007/s10722-015-0332-5.
Widarmi, W.D., Kikuchi, S., Sassa, H. and Koba, T. Characterization of lettuce chromosomes
based on condensation patterns and physical mapping of 45S and 5S rDNAs using
fluorescence in situ hybridization. Cytologia (in press)
Witsenboer, H., Vogel, J. and Michelmore, R. W. 1997. Identification, genetic localization,
and allelic diversity of selectively amplified microsatellite polymorphic loci in lettuce
and wild relatives (Lactuca spp.). Genome 40: 923936.
Wolny, E., Fidyk, W. and Hasterok, R. 2013. Karyotyping of Brachypodium pinnatum (2n =
18) chromosomes using cross-species BAC-FISH. Genome 56: 239-243.
Yanagisawa, T., Tano, S., Fukui, K. and Harada, K. 1991. Marker chromosomes commonly
observed in the genus Glycine. Theor. Appl. Genet. 81: 606–612.
76
Zhang, C., Kikuchi, S. and Koba, T. 2012. Karyotype comparison of Indian and Japanese
cucumber cultivars by fluorescence in situ hybridization probed with tandem repeat
sequences. Chromosome. Sci. 15: 17-21.
Zhen, W., Zhu, S.-X., Van den Berg, R. G., Bakker, F. T. and Schranz, M. E. 2017.
Phylogenetic relationships within Lactuca L. (Asteraceae), including African species,
based on chloroplast DNA sequence comparisons. Genet. Res. Crop Evol. 64: 55-71.
Ziolkowski P.A., Sadowski J. 2002. FISH-mapping of rDNAs and Arabidopsis BACs on
pachytene complements of selected Brassicas. Genome 45:189–197.
Zohary, D. 1991. The wild genetic resources of cultivated lettuce (Lactuca sativa L.).
Euphytica 53: 31–35.

77
SUMMARY
Cytological studies using fluorescence in situ hybridization (FISH) technique
provide phylogenetical information in closely related taxa and have been widely applied for
karyotyping and studying chromosomal organization and evolution in many plant species.
In the present study, FISH and chromosome image analysis system IV (CHIAS IV) were
applied to obtain detailed information of the characteristics of lettuce chromosomes. FISH
using 45S and 5S rRNA genes and (AAG)n of Lactuca species was performed in order to
identify the distribution of the repetitive sequences. One lettuce cultivar (L. sativa L.) and
three wild species L. serriola, L. saligna and L. virosa were used to analyze chromosome
lengths, arm ratios and degrees of chromosomal condensation at mitotic prometaphase stage.
Different distribution patterns of rRNA genes and (AAG)n signals were shown on the
chromosomes in the four Lactuca species studied, suggesting that these signals could be used
as cytogenetic landmarks for chromosome identification in Lactuca species. Also, FISH was
conducted to identify the regions of repetitive sequences on the chromosomes at mitotic
prometaphase, and meiotic diakinesis and pachytene stages of Lactuca saligna using nine
microsatellites and 45S and 5S rDNA sequences as the probes. FISH using 45S and 5S
78
rDNAs as the probes provided high resolution FISH images. Insertion of 5S rDNA into the
region of 45S rDNA was also found on Chromosome 5. This is the first report of
high-resolution FISH with 45S and 5S rDNAs on pachytene chromosomes of L. saligna. Of
the nine microsatellite probes tested, (AAC)7, (ACG)7, (CAC)7, and (CG)10 yielded no signals.
The other five microsatellite probes, (AG)10, (AC)10, (GCC)7, (ACT)7, and (AAG)7
successfully produced FISH signals. The signals of (AG)n, (AC)n, and (GCC)n were found to
be distributed across the prometaphase chromosomes. In contrast, the signals of (ACT)n and
(AAG)n showed chromosome specific patterns, indicating these signals could be used as
chromosomal markers of L. saligna. Our FISH images using rDNAs and microsatellites as
the probes provided valuable information for discrimination of chromosomes in L. saligna,
and it would be beneficial for future cytogenetic studies on Lactuca genomes.

79
ACKNOWLEDGMENTS
I came to Japan in 2013, I started my school life as an exchange student at Chiba
University. It was my first experience of staying away far from my family for a long time and
facing the consequences of being in an entire new place alone. But I enjoyed my life in Japan
a lot. I am grateful I could continue my study in Chiba University as a Ph.D. student.
First of all, I would like to send my great appreciation to the support,
encouragement, and guidance from my supervisor Prof. Takato Koba. Without him, none of
the work would have been possible. His guidance helped me in all the time of research and
writing of this thesis. I could not have imagined having a better advisor and mentor for my
Ph.D. study. I would also like to express my sincere gratitude to Prof. Hidenori Sassa and
Assoc. Prof. Shinji Kikuchi for their help and guidance throughout the project. Thanks very
much for your support and help. I would like to thank to my thesis committee members Prof.
Nakamura and Prof. Sakamoto for their insightful comments and encouragement.
I gratefully acknowledge the funding from the Ministry of Education, Culture,
Sports, Science and Technology Japan, during my Ph.D. course, and the tuition exemption
from Chiba University.

80
I also would like to thank many people in the lab who have contributed to my
progress on my projects, Chino San, Tang San, Duc San, Yamashita San, Naomi San, Iku San,
Fukuhara San and Agus San.
Lastly but not the least, I would like to thank my family: my parents and to my
husband and my children for their patience and all their support. Everything will come to you
at the perfect time. I love you Mama and Ayah.