Karyotyping and in silico characterisation of the ...
137
Karyotyping and in silico characterisation of the chromosomes of Diuraphis noxia (Hemiptera: Aphididae) By Louis Johannes Steyn Thesis presented in fulfilment of the requirements for the degree of Magister Scientiae in the Faculty of Natural Science at Stellenbosch University Department of Genetics Stellenbosch University Private Bag X1 Matieland 7602 South Africa Supervisor: Professor Anna-Maria Oberholster Co-supervisor: Doctor Anandi Bierman December 2016 Magister Scientiae
Transcript of Karyotyping and in silico characterisation of the ...
Karyotyping and in silico characterisation of the
chromosomes of Diuraphis noxia (Hemiptera
Aphididae)
By
Louis Johannes Steyn
Thesis presented in fulfilment of the requirements for the degree of Magister Scientiae in the Faculty of Natural Science at Stellenbosch University
Department of Genetics
Stellenbosch University
Private Bag X1
Matieland
7602
South Africa
Supervisor Professor Anna-Maria Oberholster
Co-supervisor Doctor Anandi Bierman
December 2016
Magister Scientiae
ii
Declaration
By submitting this thesis electronically I declare that the entirety of the work contained
therein is my own original work that I am the sole author thereof (save to the extent
where explicitly otherwise stated) that reproduction and publication thereof by
Stellenbosch University will not infringe any third party rights and that I have not
previously in its entirety or in part submitted it for obtaining any qualification
Date December 2016
Copyright copy 2016 Stellenbosch UniversityAll rights reserved
Stellenbosch University httpsscholarsunacza
iii
Abstract
Diuraphis noxia Kurdjumov (Russian wheat aphid (RWA)) is an economically important
agricultural pest that causes substantial losses in small grain production particularly
wheat and barley Approaches that can be taken to manage this invasive pest include the
cultivation of RWA resistant cultivars The development of new RWA biotypes virulent
against previously classified resistant wheat cultivars presents an additional problem to
the goal of reducing crop losses Therefore studying the underlying molecular genetics
of the RWA brings us closer to understanding wheat resistance to the RWA and ultimately
battling this pest in small grain fields The objectives of this study were to study the sex
(X) chromosome of the RWA by karyotyping and isolation using flow cytometry to
sequence the X chromosome and then to map it against the reference genomes of the
RWA and Acyrthosiphon pisum (pea aphid) Since aphids reproduce via
parthenogenesis mapping populations reliant on sexual recombination are not available
and therefore information about the locations of genes on chromosomes is completely
lacking To this end reference mapping against the X chromosome of Drosophila
melanogaster (fruit fly) was conducted to identify orthologous regions spanning the X
chromosome of RWA The results confirmed that the RWA karyotype consists of a diploid
chromosome number of 10 with a large X chromosome pair and four autosomal
chromosome pairs Flow sorting yielded 2047296 X chromosomes and sequencing
produced a total read count of 136814894 with a Q20 score of 9632 The X
chromosome had a higher mapping percentage to the RWA genome (8288) compared
to that of the pea aphid (513) Interestingly a high mapping coverage across the entire
genome of both aphids was observed suggesting that flow cytometry did not separate
the X chromosome from the rest of the chromosomes of the RWA but allowed unintended
chromosomes to contaminate the series Mapping against the fruit fly X chromosome
produced eight orthologous regions of which six was confirmed to be present in the RWA
Stellenbosch University httpsscholarsunacza
iv
karyotype through in situ hybridization while a protein BLAST of the fruit fly X
chromosome against the RWA genome aided in determining approximately 6742 of
the length of the RWA X chromosome
Stellenbosch University httpsscholarsunacza
v
Uittreksel
Diuraphis noxia Kurdjumov algemeen bekend as die Russiese koringluis (RWA) is lsquon
ekonomiese belangrike landboupes wat lsquon groot afname in klein graangewas produksie
spesifiek koring en gars veroorsaak Metodes wat geiimplementeer kan word om hierdie
indringer pes te beheer en gewas verliese te verhoed sluit die kultivering van RWA
weerstandbiedende kultivars in Die ontwikkeling van RWA-biotipes wat luis populasies
is virulent teen voorheen weerstandbiedende koring kultivars dra addisioneel tot die
probleem by Daarom is dit belangrik om die onderliggende molekulecircre genetika van die
RWA te verstaan sodat ons ook koring weerstand tot RWA kan begryp om uiteindelik
graangewasse teen die pes te beskerm Die doel van hierdie studie is om die seks (X-)
chromosoom van die RWA te bestudeer deur kariotipering en te isoleer deur van
vloeisitometrie gebruik te maak die X-chromosoom se volgorde te bepaal en om dit dan
teen die verwysings genome van RWA en Acyrthosiphon pisum (ertjieluis) te vergelyk
Aangesien hierdie luise ongeslagtelik voortplant bestaan daar nie karteringspopulasies
vir RWA nie en daarom ontbreek inligting oor die ligging van gene op die chromosome
Ten einde die studie doel te bereik was verwysingkartering teen Drosophila
melanogaster (vrugtevlieg) se X-chromosoom gedoen met die doel om
ooreenstemmende areas oor die X-chromosoom te identifiseer Die resultate het bewys
dat die RWA-kariotipe uit lsquon diploiumlde chromosoomgetal van 10 bestaan met lsquon groot X-
chromosoompaar en vier outosomale chromosoompare Vloeisortering het 2047296 X-
chromosome opgelewer en volgordebepaling het lsquon totale leesraam-telling van
136814894 teen lsquon Q20-telling van 9632 gelewer Die X-chromosoom het lsquon hoeumlr
ooreenstemming teenoor die genoom van die RWA (8288) in vergelyking met die
ertjieluis (513) vertoon Beide luise het n hoeuml karteringdekking oor hulle hele genoom
gehad Dit was onverwags en dui daarop dat vloeisitometrie nie spesifiek genoeg was vir
net die X-chromosoom nie en het dus nie-geteikende chromosome deur gelaat wat die
Stellenbosch University httpsscholarsunacza
vi
monster gekontamineer het Kartering teenoor die vrugtevlieg X-chromosoom het agt
ooreenstemende streke geproduseer waarvan ses bewys was om voor te kom in die
RWA kariotipe deur in situ hibridisering terwyl lsquon proteiumlen BLAST van die vrugtevlieg X-
chromosoom teenoor die RWA genoom bygedra het tot die bepaling van minstens
6742 van die lengte van die RWA X-chromosoom
Stellenbosch University httpsscholarsunacza
vii
Acknowledgements
I would like to thank and express my heartfelt appreciation to the following people and
organisations for their support guidance and patience during the period of this study
Professor Anna-Maria Oberholster whose vast knowledge and proficiency made this
MSc a reality Thank you for growing my fascination with agriculture and the
improvement thereof I want to especially express my gratitude for your assistance in
securing me with a National Research Foundation (NRF) grantholder bursary as well as
appointing me as your lab assistant to gain experience outside of my particular line of
work
Thank you so much Doctor Anandi Bierman for all the time and effort you put into guiding
and helping me with this project ie the writing of this thesis with lab work and the
planning around presentations No task is ever too small or big for you and your ability to
pass on information reasonably is truly a gift
Lize Engelbrecht and Rozanne Adams at the Central Analytical Facility (CAF) Fluoresent
Microscopy Unit Stellenbosch University for their assistance and guidance during my
fluorescent microscopy and flow cytometry training and experiments
Colleagues in the Cereal Genomic Laboratory at the Department of Genetics
Stellenbosch University Ilze Visser Francois Burger Nadia Fisher Kelly Breeds Marlon
Le Roux and Hendrik Swiegers
Department of Genetics Stellenbosch University for providing me the education and
infrastructure I needed to facilitate my studies
To my inspirational parents Lops and Hanlie Steyn for their infinite love support and
motivation during my education
Stellenbosch University httpsscholarsunacza
viii
To my biggest enthusiast and fianceacute Louzel Lombard for supporting me in accomplishing
my dreams I appreciate your continuous love and reassurance the last few years
Stellenbosch University httpsscholarsunacza
ix
Table of contents
Declaration ii
Abstract iii
Uittreksel v
Acknowledgements vii
Table of contents ix
List of figures xiii
List of tables xvii
List of abbreviations xix
Chapter 1 - Introduction
11 Introduction 2
12 Thesis outline 4
13 Preface 4
14 Research outputs 4
15 List of references 6
Chapter 2 ndash Literature review
21 Insect pests 9
22 Insect-plant interactions 9
23 Aphids 10
24 Russian wheat aphid (RWA) 11
241 Host plant 11
242 RWA background 12
243 RWA feeding 13
244 Symptoms of RWA infestation 15
245 RWA-wheat interaction 16
246 RWA biotypes 17
Stellenbosch University httpsscholarsunacza
x
247 RWA karyotype 19
248 RWA reproduction 22
249 RWA sex chromosome system 23
25 Insect genomes 25
26 Single-chromosome analysis 28
261 MicromanipulationMicrodissection 29
262 Gradient centrifugation 30
263 Magnetic chromosome separation 30
264 Flow cytometry 31
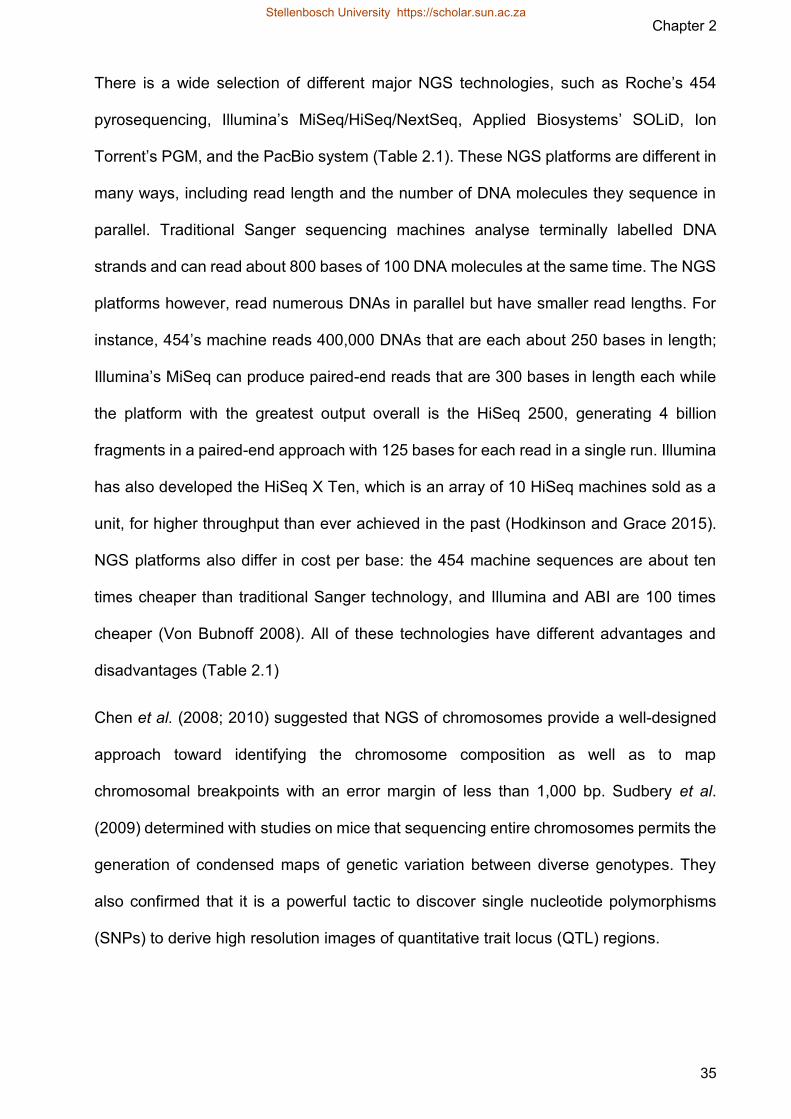
27 Sequencing 34
271 Sequencing platforms 34
272 Next generation sequencing (NGS) analysis 37
28 List of references 40
Chapter 3 ndash Research
31 Introduction 59
32 Materials and methods 62
321 Karyotyping of RWA chromosomes 62
3211 Slide preparation 62
3212 Chromosome staining and visualisation 63
322 Flow cytometry of RWA chromosomes 64
3221 Preparation of mitotic chromosome suspensions 64
3222 Flow cytometry optimization Gating 64
3223 Flow sorting 66
3224 DNA purification 67
3225 Estimation of RWA genome size 67
3226 Sequencing 68
323 Next generation sequencing (NGS) and bioinformatic analysis of the RWA
sex chromosome fraction 68
Stellenbosch University httpsscholarsunacza
xi
3231 Next generation sequencing 68
3232 Reference mapping of the RWA X chromosome sequence data set
to that of the whole genome of the RWA and pea aphid 68
3233 Physical mapping against the X chromosome of the fruit fly 70
324 Fluorescent in situ hybridization 71
3241 Fluorescent probes 71
3242 Slide preparation and treatment 73
3243 Probe denaturation and hybridization 73
3244 Probe detection and signal enhancement 74
3245 Slide staining and visualisation 75
33 Results 76
331 Karyotyping of RWA chromosomes 76
332 Flow cytometry separation of RWA chromosomes 79
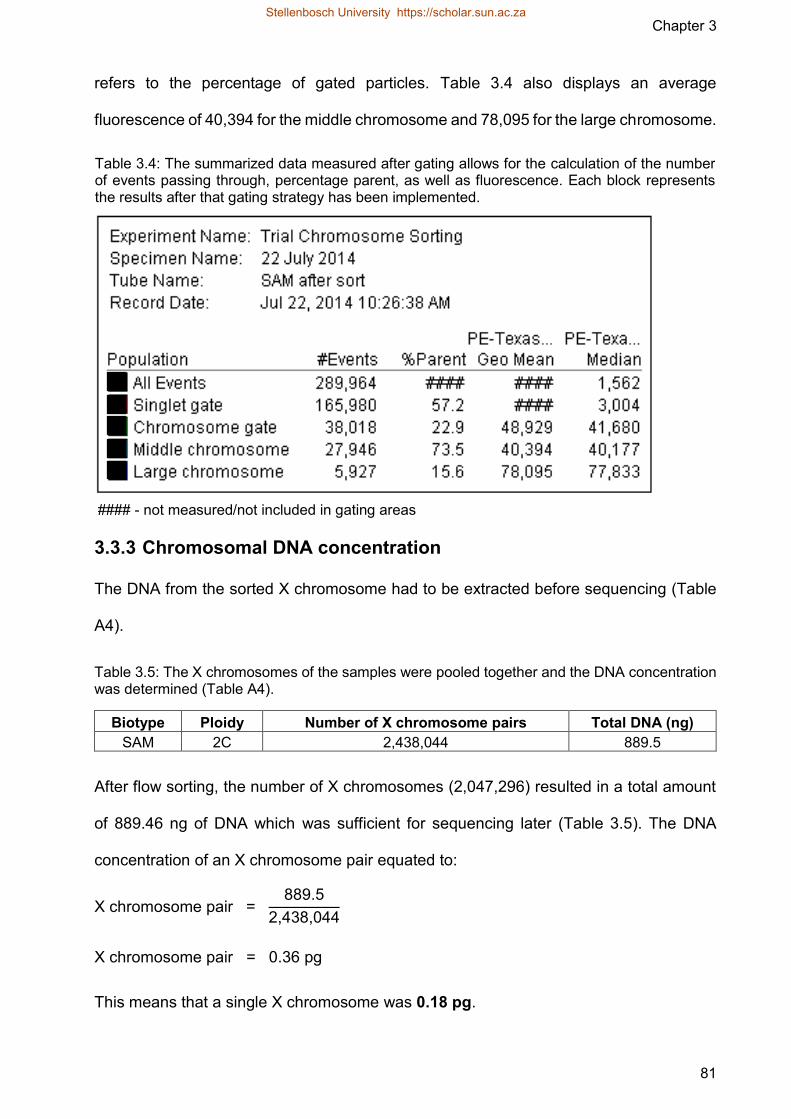
333 Chromosomal DNA concentration 81
334 Estimation of RWA genome size 82
335 Next generation sequencing (NGS) and bioinformatics analysis of RWA X
chromosome 82
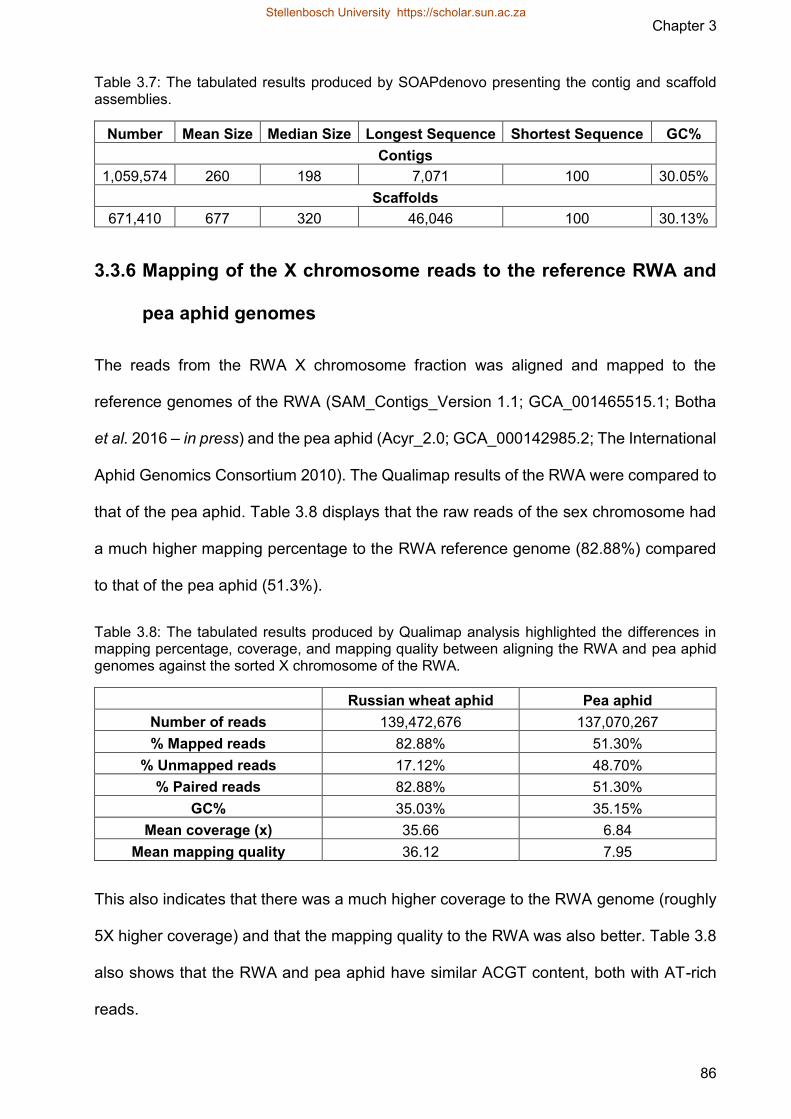
336 Mapping of the X chromosome reads to the reference RWA and pea aphid
genomes 86
337 Physical mapping of the X chromosome of the fruit fly to the available X
chromosome sequence of the RWA 88
338 Fluorescent in situ hybridization (FISH) 89
3381 Probe generation for the RWA sex chromosomes 89
3382 Visualisation 90
34 Discussion 92
341 RWA karyotype and genome size estimation 92
342 Flow cytometry and next generation sequencing 94
343 Bioinformatic analysis and reference mapping 96
344 Physical mapping of the X chromosome 97
Stellenbosch University httpsscholarsunacza
xii
35 Appendix 99
36 List of references 103
Chapter 4 ndash Summary
41 Summary 110
42 List of references 113
Stellenbosch University httpsscholarsunacza
xiii
List of figures
Figure 21 Physical characteristics of the RWA (Stoetzel 1987) Side and top view
displaying the distinct morphological features of the RWA
Figure 22 Symptoms of RWA infestation A) Leaf rolling (httpcaliforniaagriculture
ucanrorg) B) Chlorotic streaking (httpentomologyk-stateedu) C) Head
trapping (httpwwwfaoorg)
Figure 23 A general distribution map of the four RWA biotypes found in South Africa
(Jankielsohn 2016)
Figure 24 Female RWA karyotype A) Two large X (sex) chromosomes B) and C) four
autosome chromosome pairs (Novotnaacute et al 2011)
Figure 25 Monocentric (A) and holocentric (B) chromosomes A) Single site of
chromosomal attachment to the centromere B) Multiple sites of
chromosomal attachment
Figure 26 The yearly life cycle of the aphid and ploidy levels for autosomes (A) and
sexual chromosomes (X) (Jaquieacutery et al 2013)
Figure 27 Inheritance of the X chromosome in XXXY standard XXX0 and aphid-like
XXX0 sex-determining systems In aphid-like XXX0 systems the male
transfer its X chromosome to 100 of its progeny giving rise to only
asexual daughters (Jaquieacutery et al 2012)
Figure 28 Process of magnetic sorting The particle of interest is covalently bound with
magnetic beads and sorted using a simple magnet
Figure 29 Schematic view of the components used by the flow cytometer during
sorting of particles The particles move through the sample stream (B)
Stellenbosch University httpsscholarsunacza
xiv
where a charge is pulsed at the break-off point the precise area where the
selected particle is formed into a droplet (C) Two charged deflection plates
(D) situated below the break-off point deflect the charged droplets
containing the particles of interest towards a collection tube and the
uncharged droplets are collected into a waste tube
Figure 210 Example of a flow karyotype generated during flow sorting The peaks
represent the positive datasets In this case the chromosomes of interest
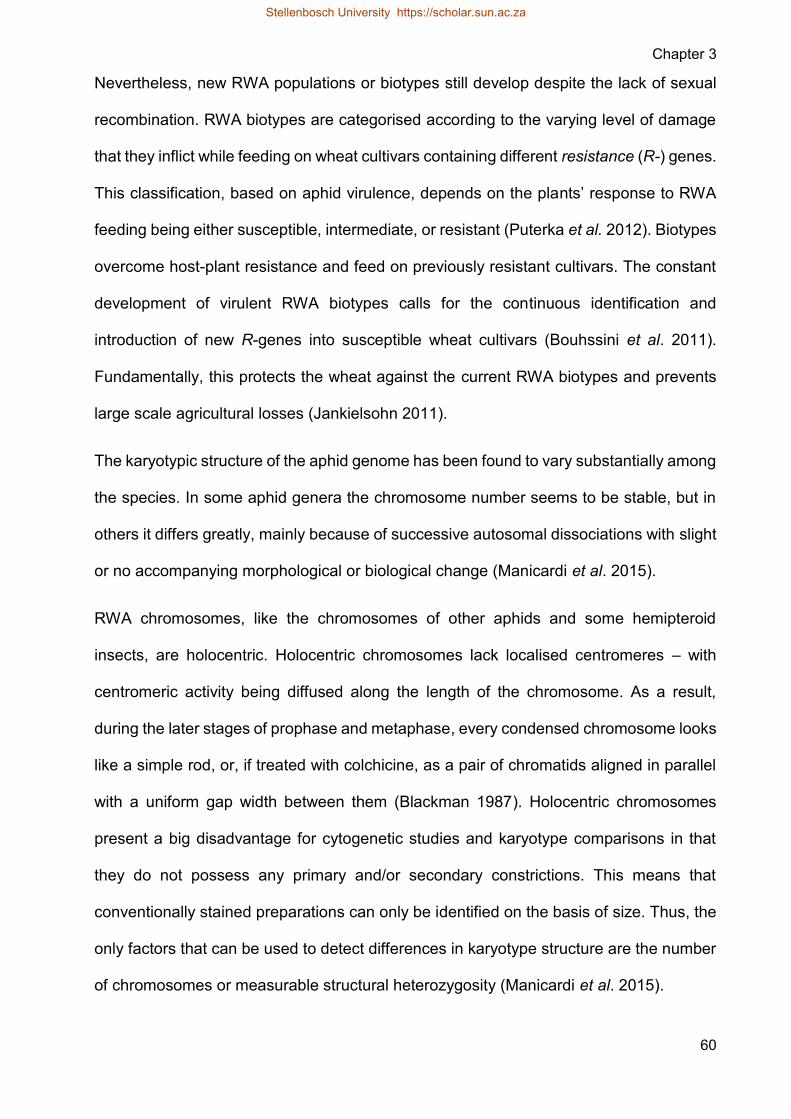
Figure 31 Two embryos (as indicated by arrows) dissected from an adult female RWA
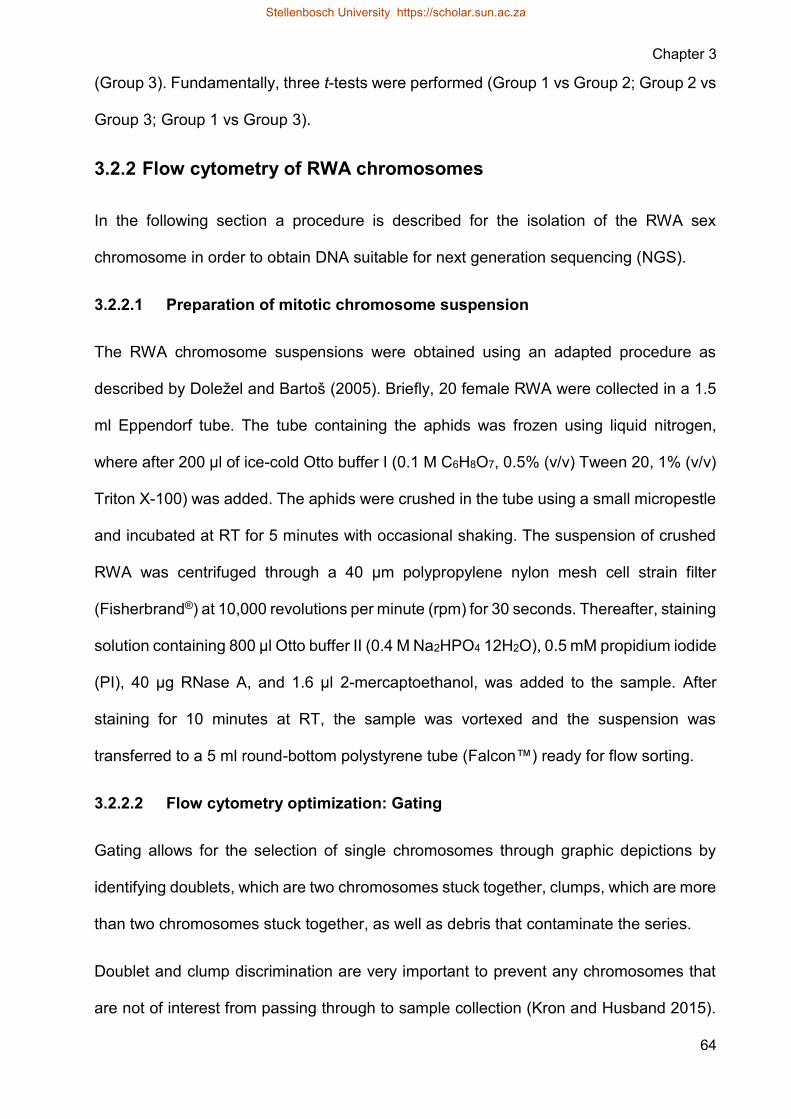
Figure 32 The singlet gate scatter plot was used to exclude doublets and clumps from
the analysis Gate A is an area that is straight diagonal 45ordm and passing
through zero (yellow dotted line) which includes all the single
chromosomes of interest while all the particles outside the gate are
excluded as they consist of doublets clumps or debris
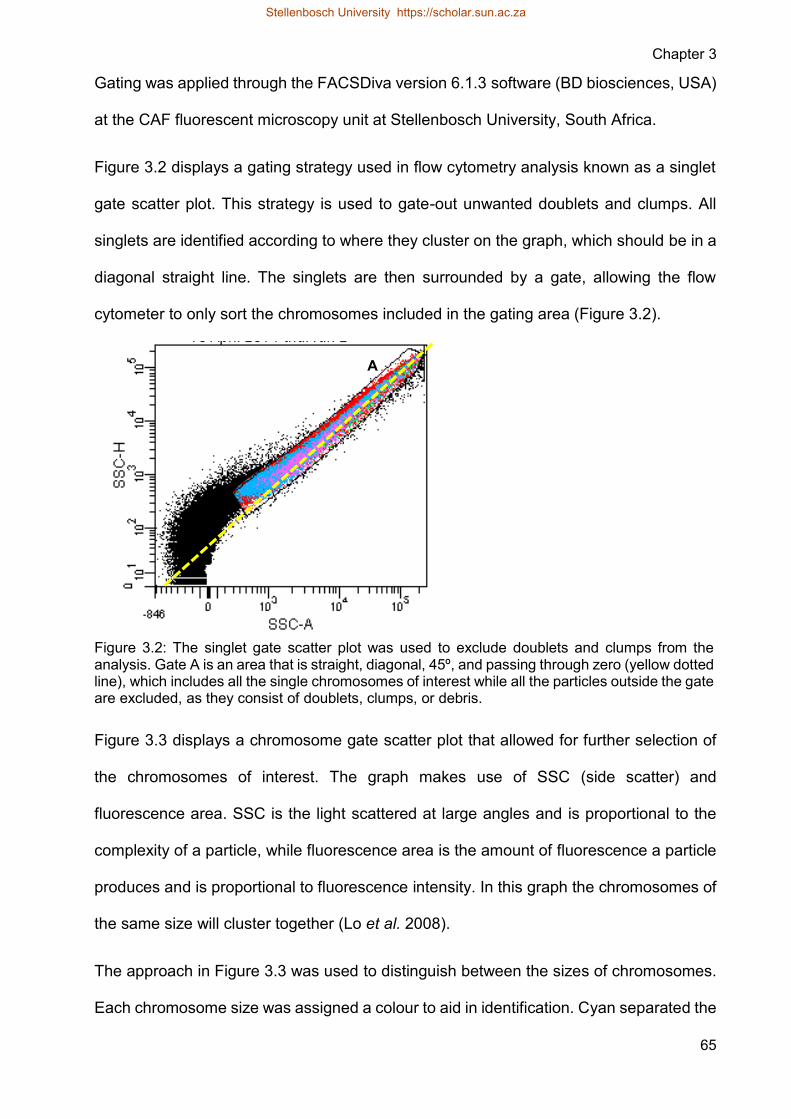
Figure 33 The chromosome gate scatter plot was used to identify the chromosome
sizes based on fluorescence intensity The different sized chromosomes
were given a random colour to aid in identification
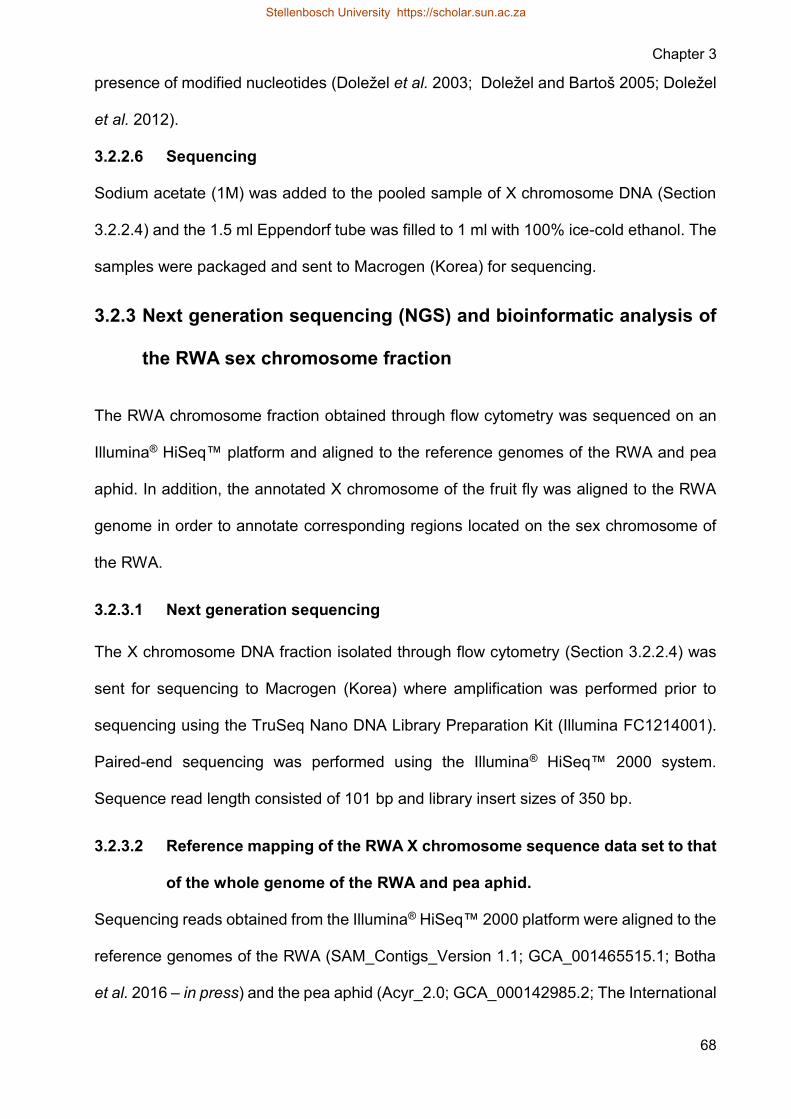
Figure 34 Workflow of the quality filtering and alignment of the raw reads obtained
from sequencing at Macrogen (Korea) to the RWA and pea aphid genomes
Where raw read alignment was done using the Alighn to reference tool in
Geneious (v717) and quality filtered reads were aligned using Burrows-
Wheeler aligner (BWA) Raw reads were quality filtered using FastQC and
FastX-Toolkit
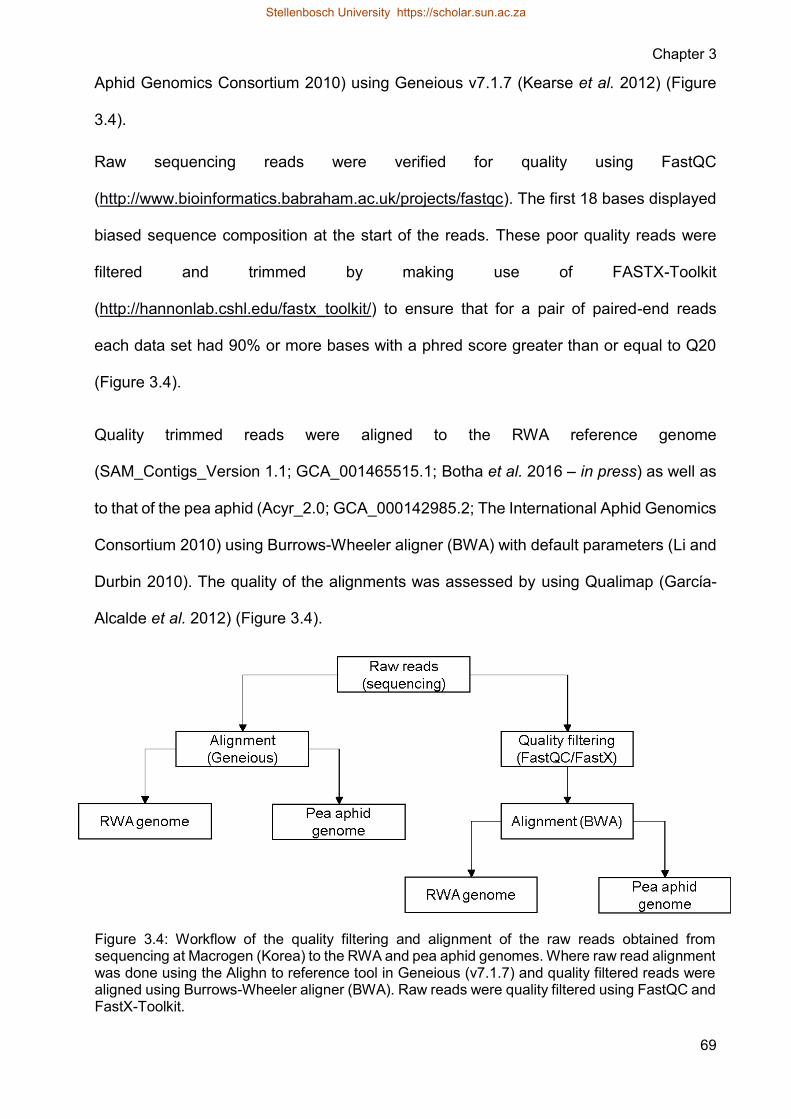
Figure 35 Workflow of k-mer analysis and SOAPdenovo of the raw reads obtained
from sequencing at Macrogen (Korea) to generate contigs and scaffolds
Stellenbosch University httpsscholarsunacza
xv
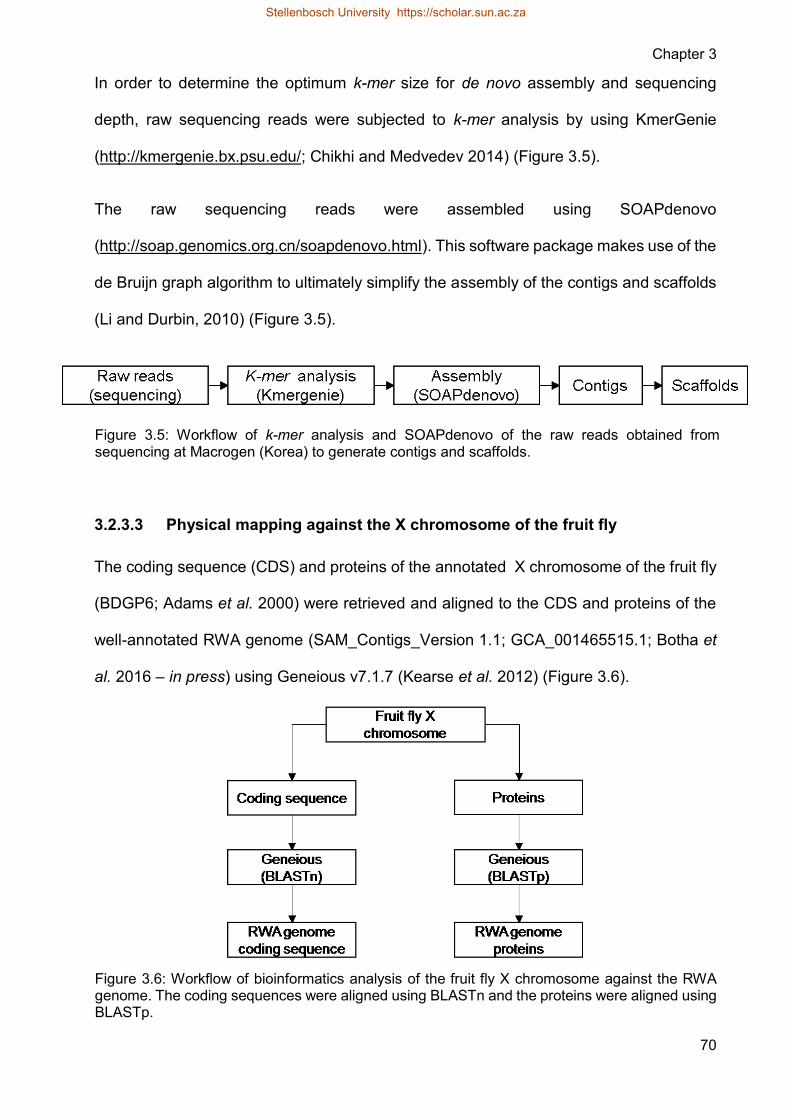
Figure 36 Workflow of bioinformatics analysis of the fruit fly X chromosome against
the RWA genome The coding sequences were aligned using BLASTn and
the proteins were aligned using BLASTp
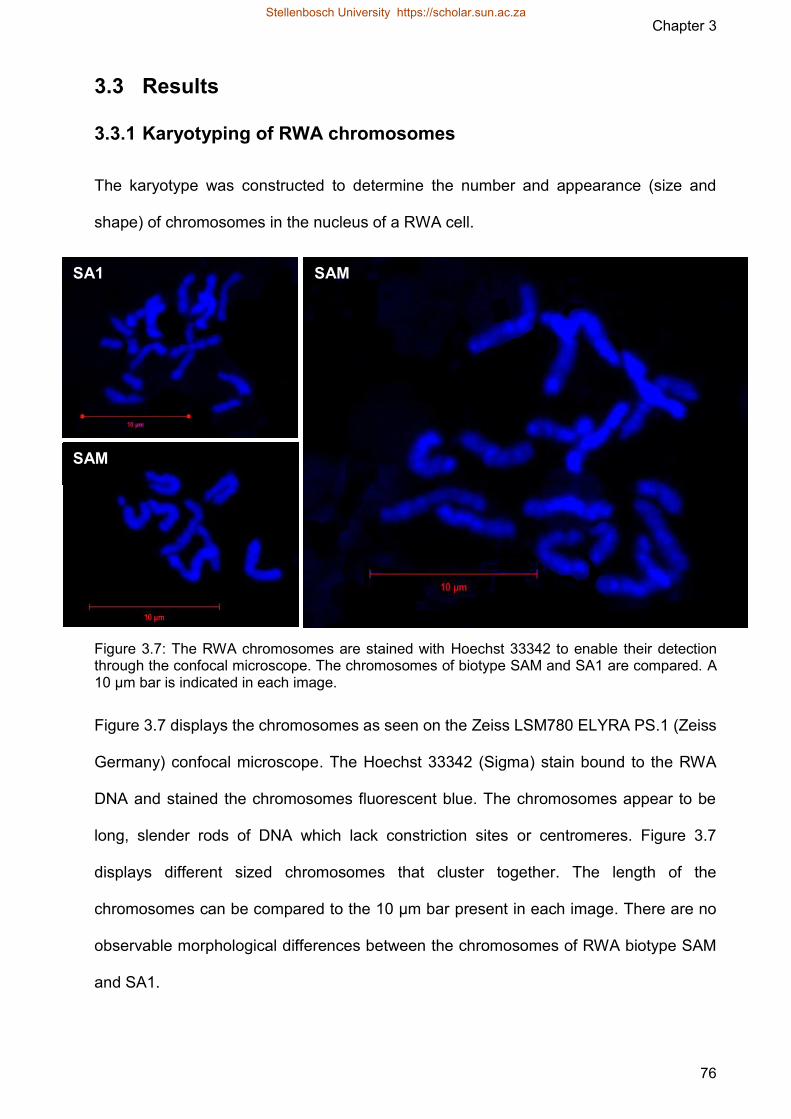
Figure 37 The RWA chromosomes are stained with Hoechst 33342 to enable their
detection through the confocal microscope The chromosomes of biotype
SAM and SA1 are compared A 10 microm bar is indicated in each image
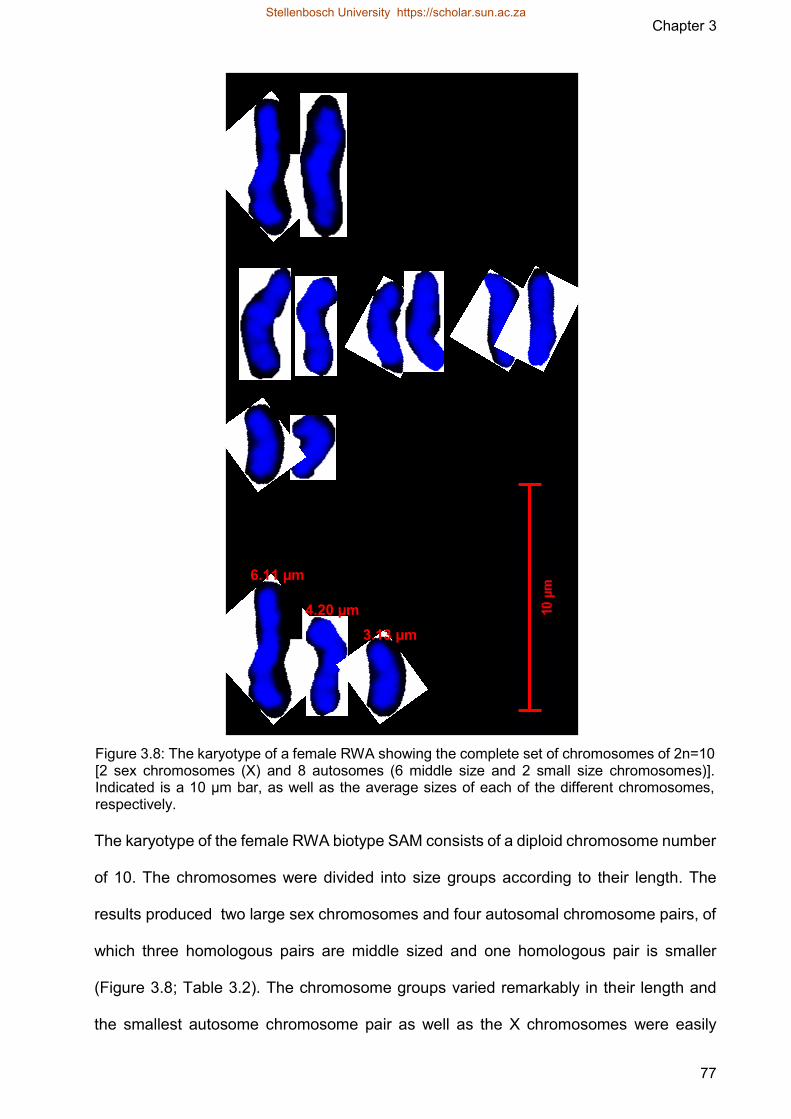
Figure 38 The karyotype of a female RWA showing the complete set of chromosomes
of 2n=10 [2 sex chromosomes (X) and 8 autosomes (6 middle size and 2
small size chromosomes)] Indicated is a 10 μm-scale bar as well as the
average sizes of each of the different chromosomes respectively
Figure 39 The bar chart is a visual representation of the size differences of the RWA
chromosomes
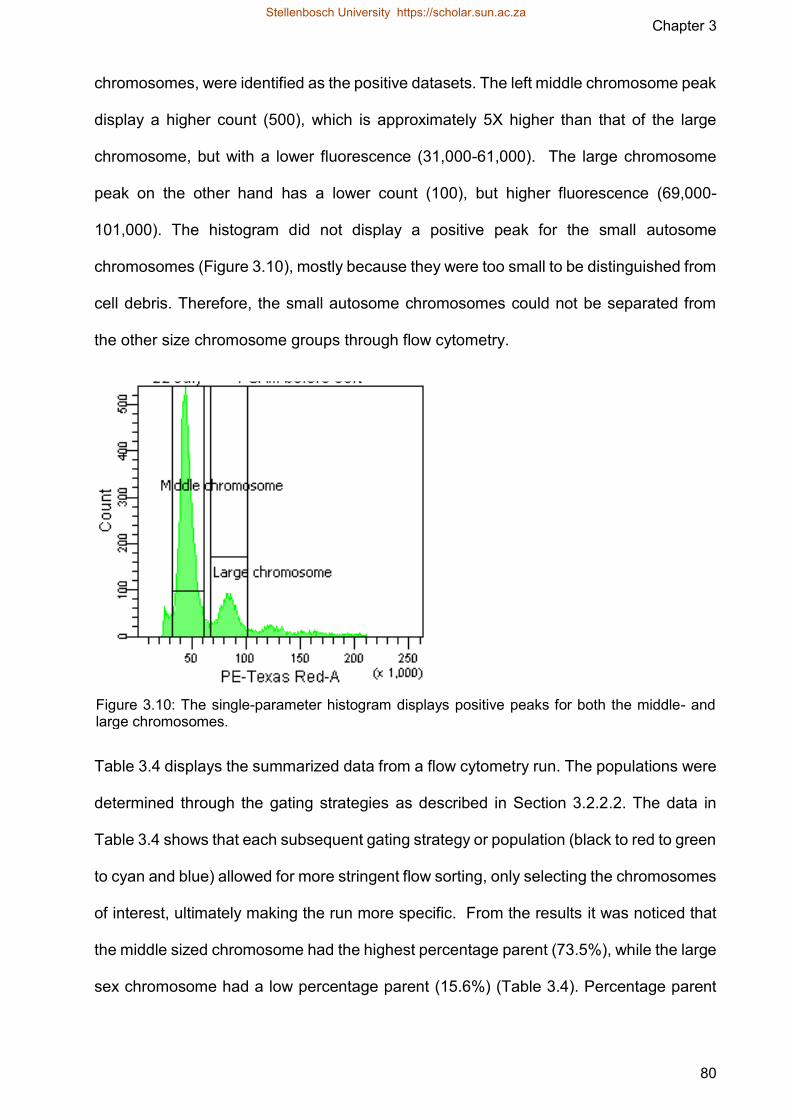
Figure 310 The single-parameter histogram displays positive peaks for both the middle-
and large chromosomes
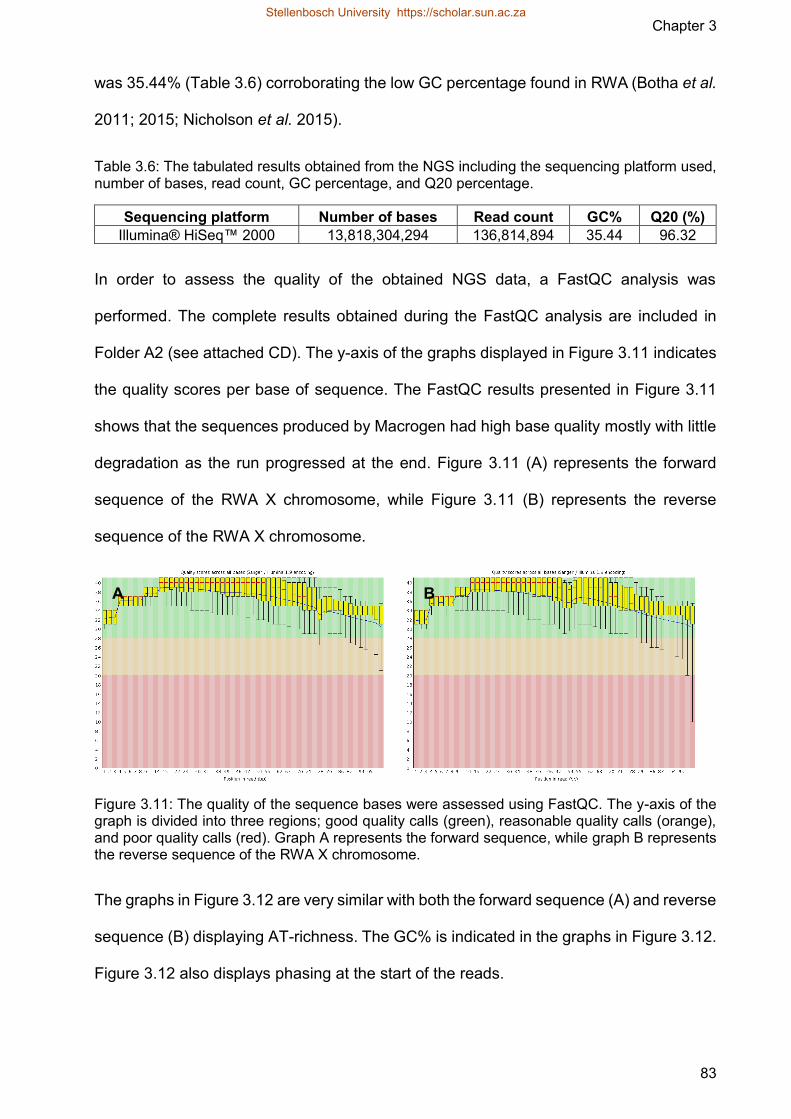
Figure 311 The quality of the sequence bases were assessed using FastQC The y-
axis of the graph is divided into three regions good quality calls (green)
reasonable quality calls (orange) and poor quality calls (red) Graph A
represents the forward sequence while graph B represents the reverse
sequence of the RWA X chromosome
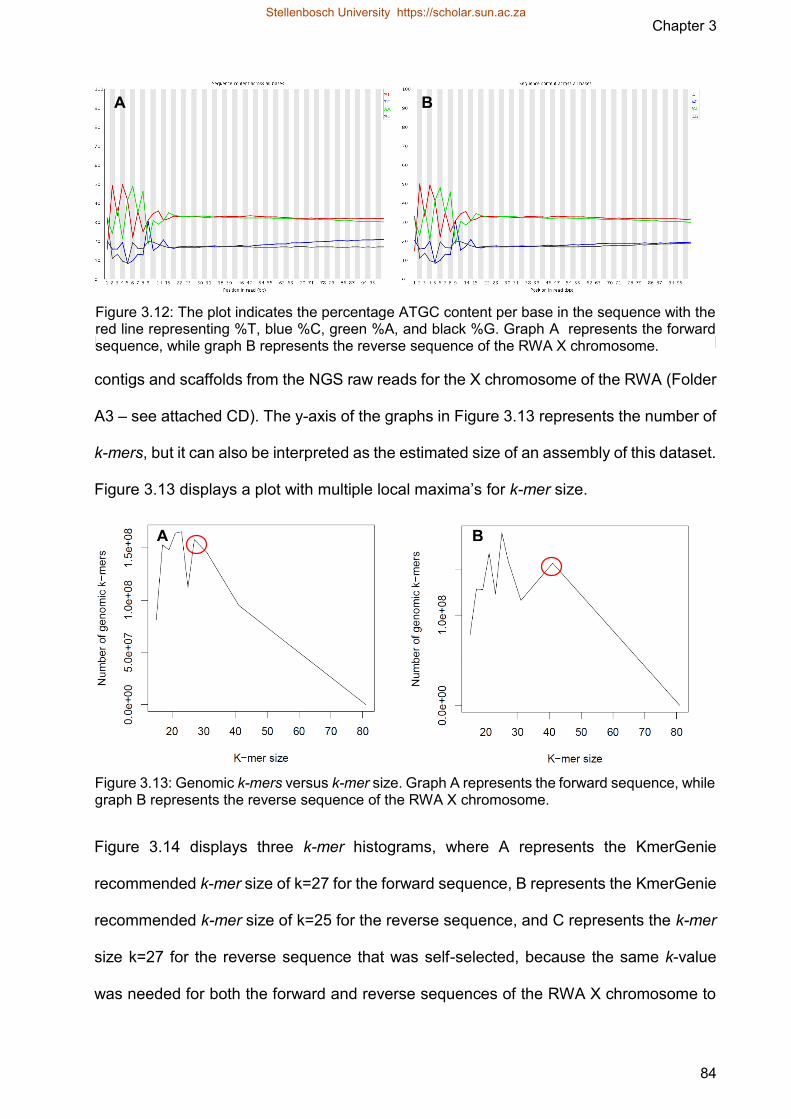
Figure 312 The plot indicates the percentage ATGC content per base in the sequence
with the red line representing T blue C green A and black G
Graph A represents the forward sequence while graph B represents the
reverse sequence of the RWA X chromosome
Stellenbosch University httpsscholarsunacza
xvi
Figure 313 Genomic k-mers versus k-mer size Graph A represents the forward
sequence while graph B represents the reverse sequence of the RWA X
chromosome
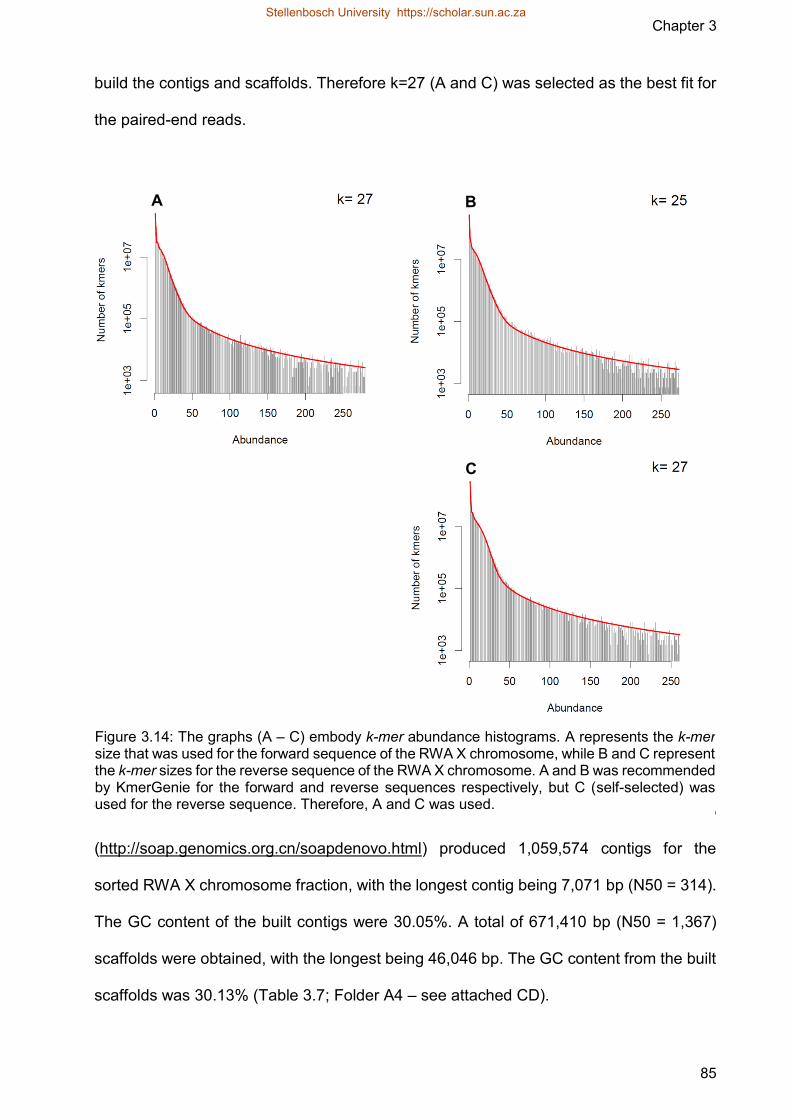
Figure 314 The graphs embody k-mer abundance histograms A represents the k-mer
size that was used for the forward sequence of the RWA X chromosome
while B and C represent the k-mer sizes for the reverse sequence of the
RWA X chromosome A and B was recommended by KmerGenie for the
forward and reverse sequences respectively but C (self-selected) was used
for the reverse sequence Therefore A and C was used
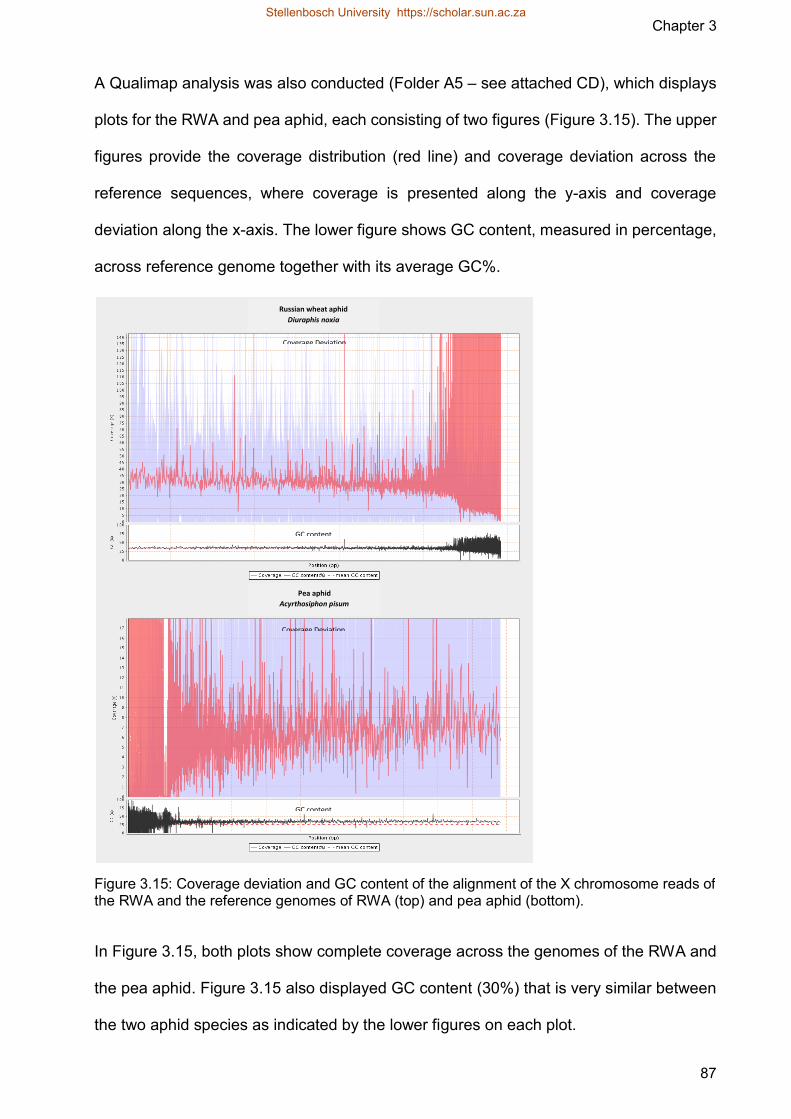
Figure 315 Coverage deviation and GC content of the alignment of the X chromosome
reads of the RWA and the reference genomes of RWA (top) and pea aphid
(bottom)
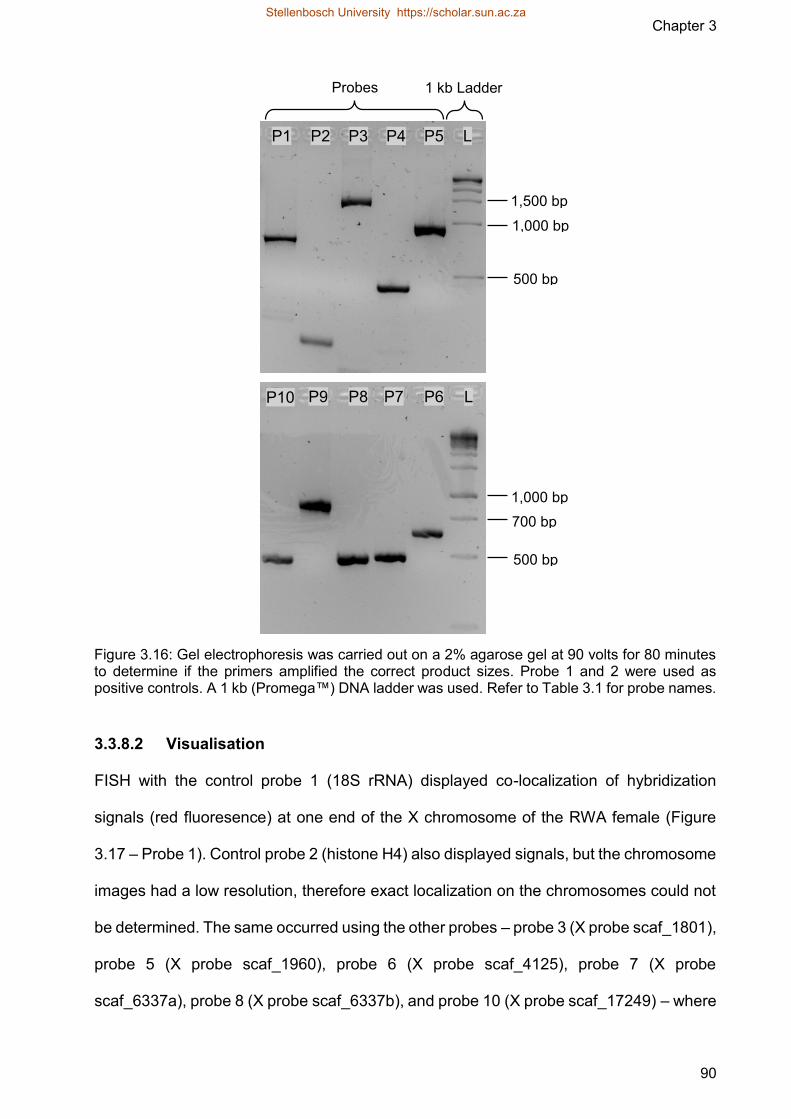
Figure 316 Gel electrophoresis was carried out on a 2 agarose gel at 90 volts for 80
minutes to determine if the primers amplified the correct product sizes
Probe 1 and 2 were used as positive controls A 1 kb (Promegatrade) DNA
ladder was used Refer to Table 31 for probe names
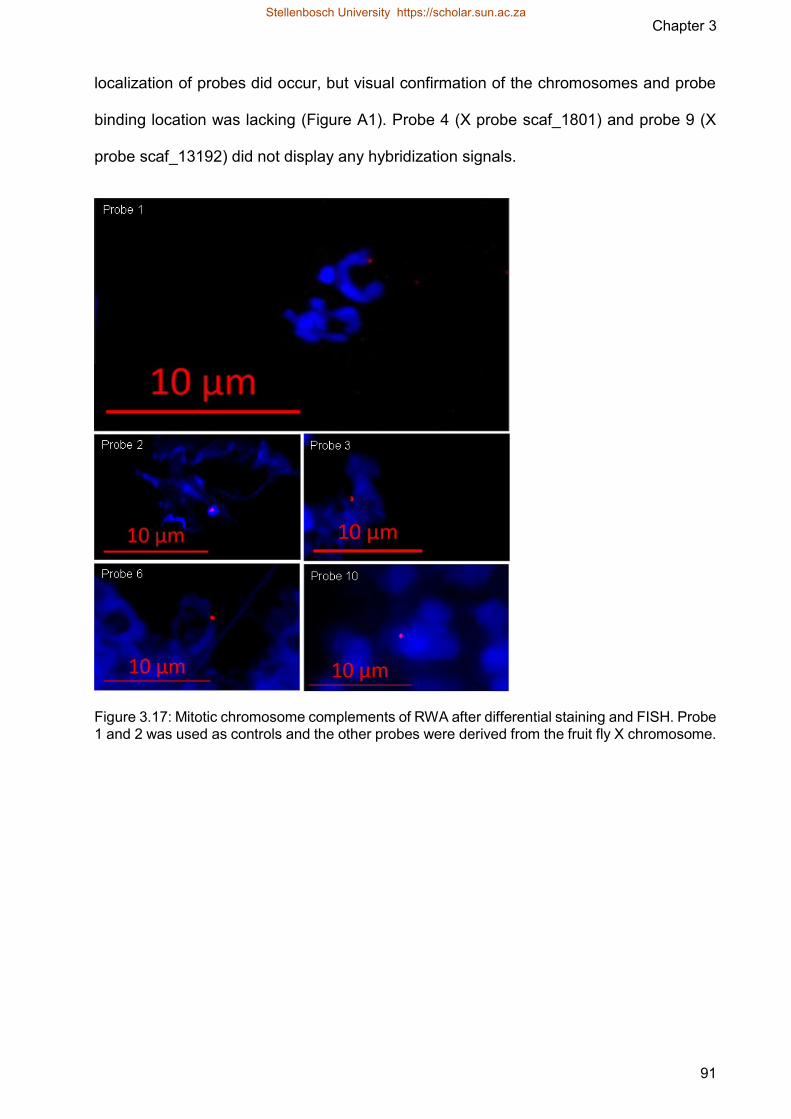
Figure 317 Mitotic chromosome complements of RWA after differential staining and
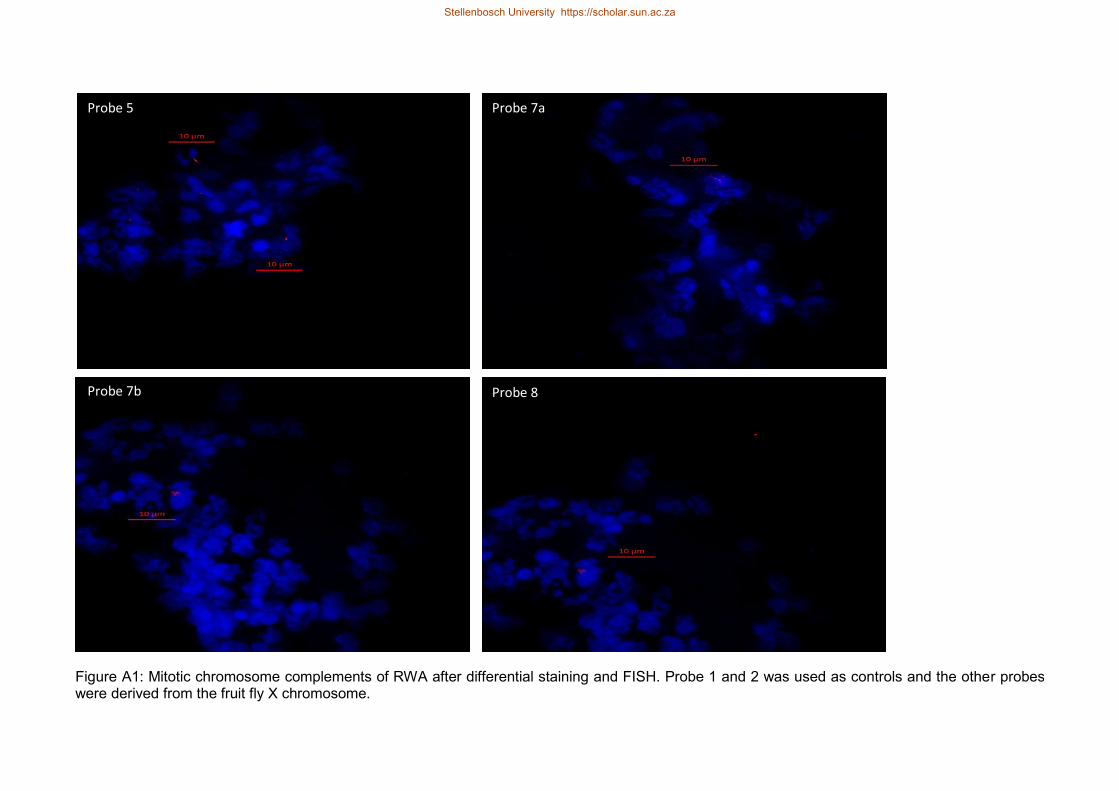
FISH Probe 1 and 2 was used as controls and the other probes were
derived from the fruit fly X chromosome
Figure A1 Mitotic chromosome complements of RWA after differential staining and
FISH Probe 1 and 2 was used as controls and the other probes were
derived from the fruit fly X chromosome
Stellenbosch University httpsscholarsunacza
xvii
List of tables
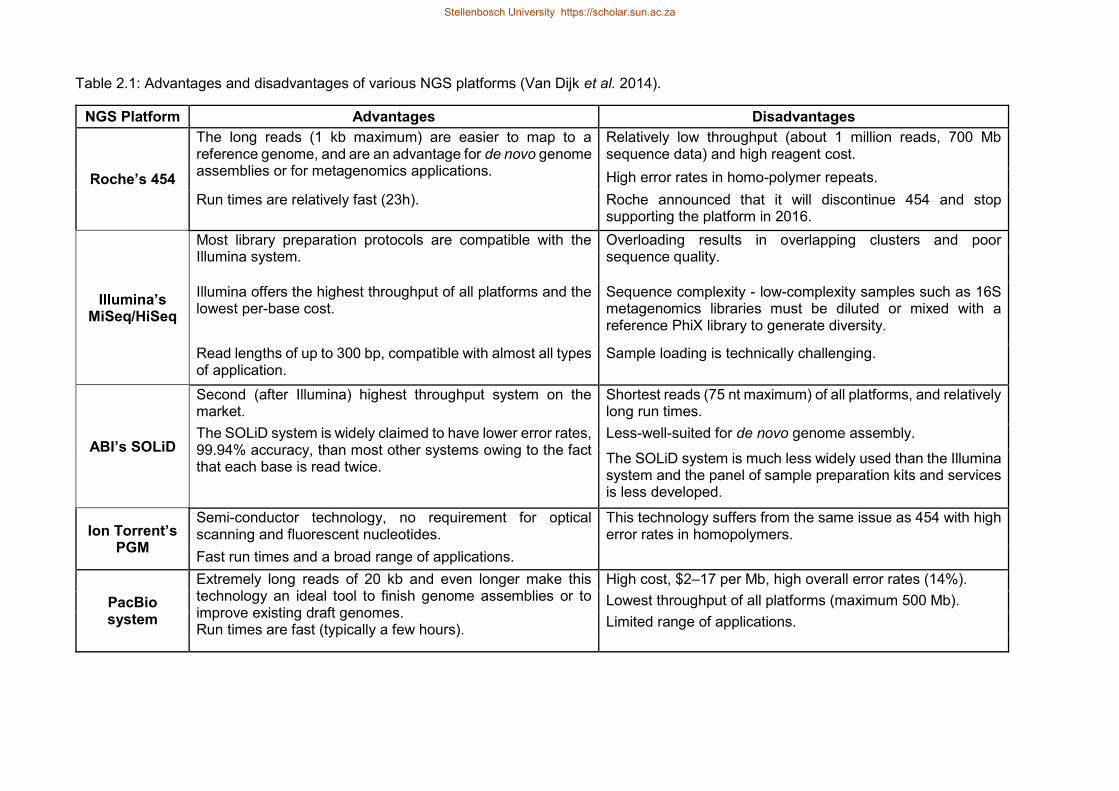
Table 21 Advantages and disadvantages of various NGS platforms (Van Dijk et al
2014)
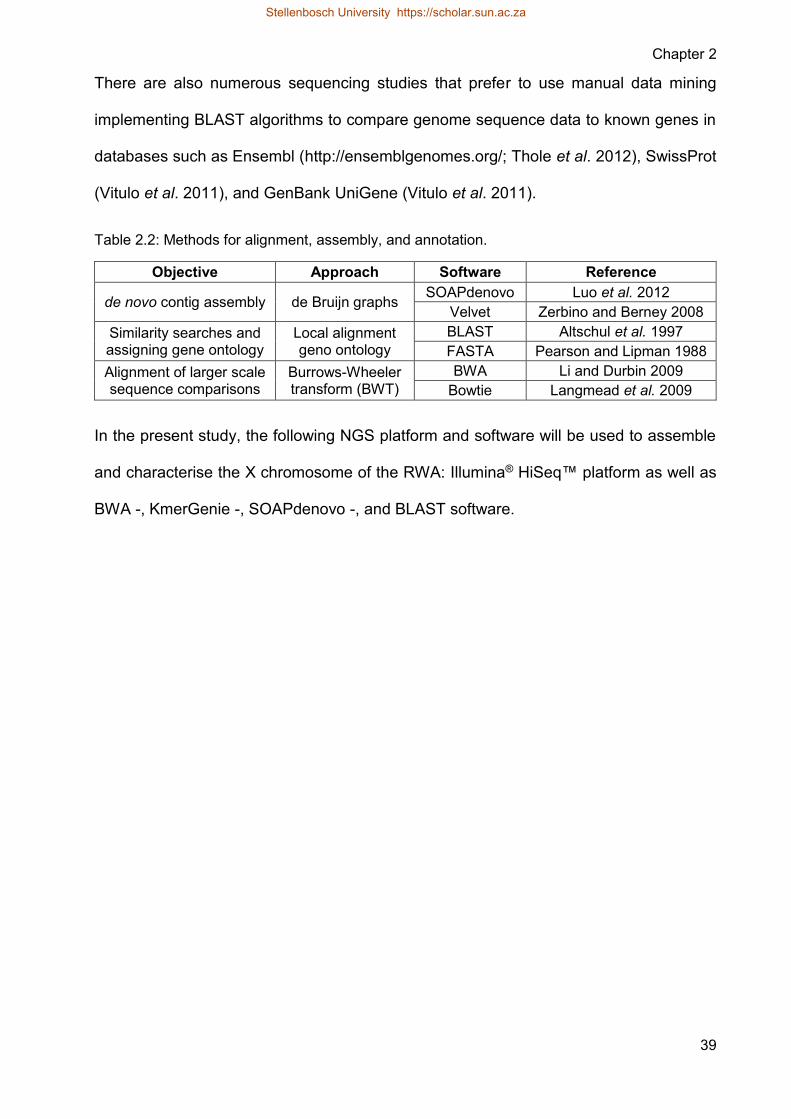
Table 22 Methods for alignment assembly and annotation
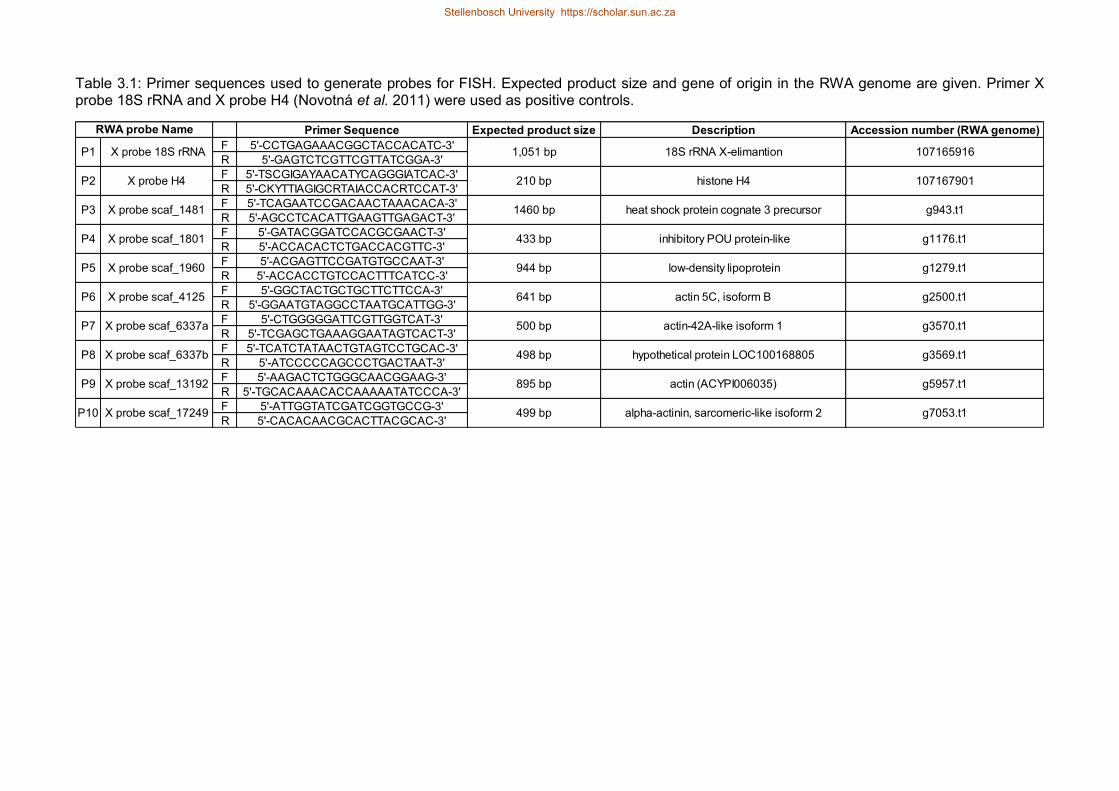
Table 31 Primer sequences used to generate probes for FISH Expected product size
and gene of origin in the RWA genome are given Primer X probe 18S rRNA
and X probe H4 (Novotnaacute et al 2011) were used as positive controls
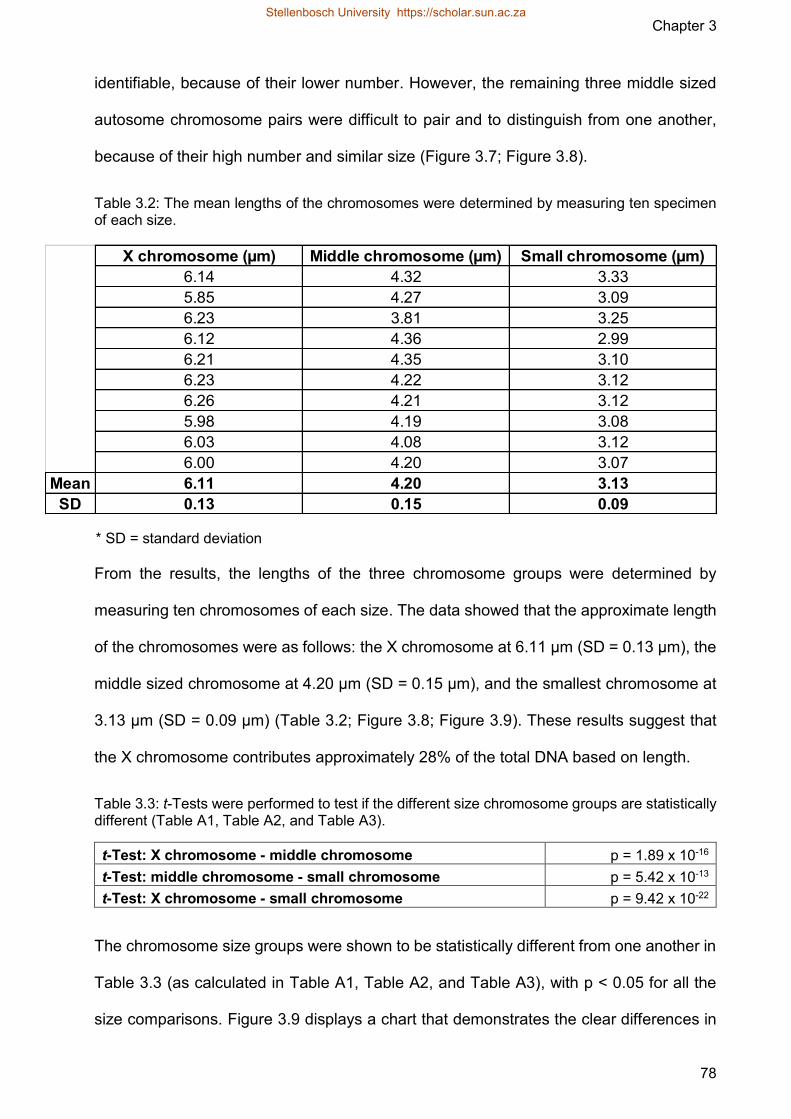
Table 32 The mean lengths of the chromosomes were determined by measuring ten
specimen of each size
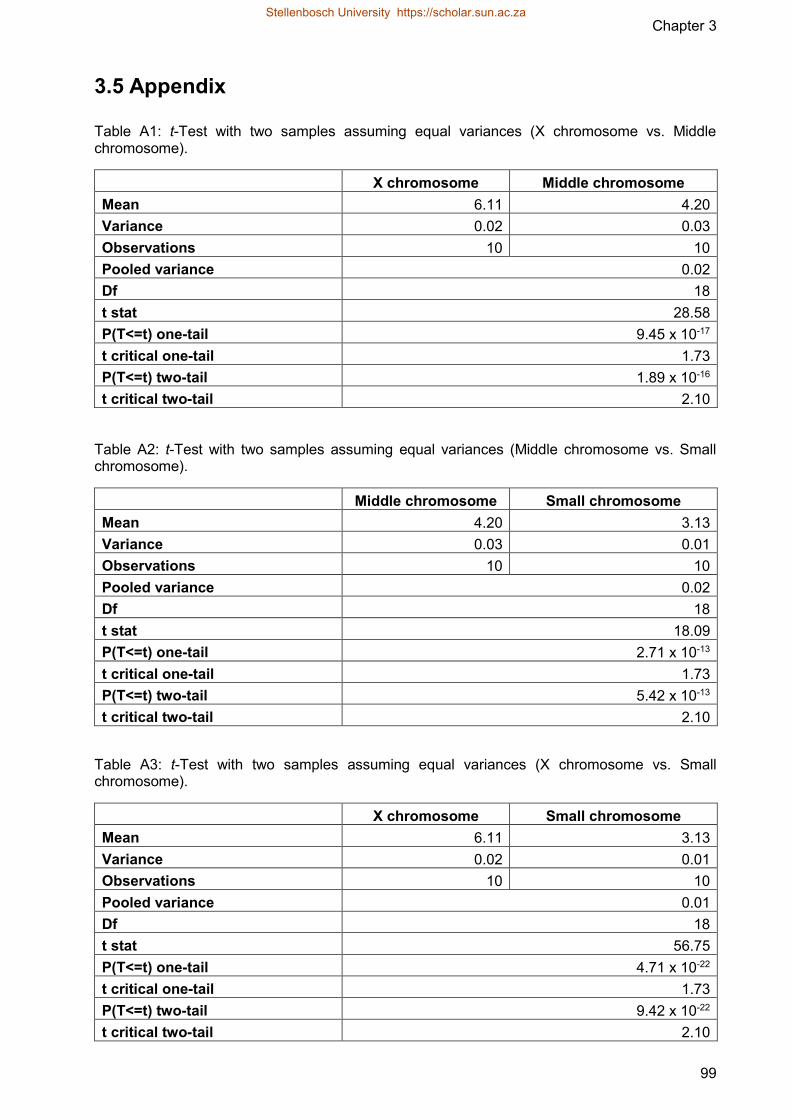
Table 33 t-Tests were performed to test if the different size chromosome groups are
statistically different (Table A1 Table A2 and Table A3)
Table 34 The summarized data measured after gating allows for the calculation of
the number of events passing through percentage parent as well as
fluorescence
Table 35 The X chromosomes of the samples were pooled together and the DNA
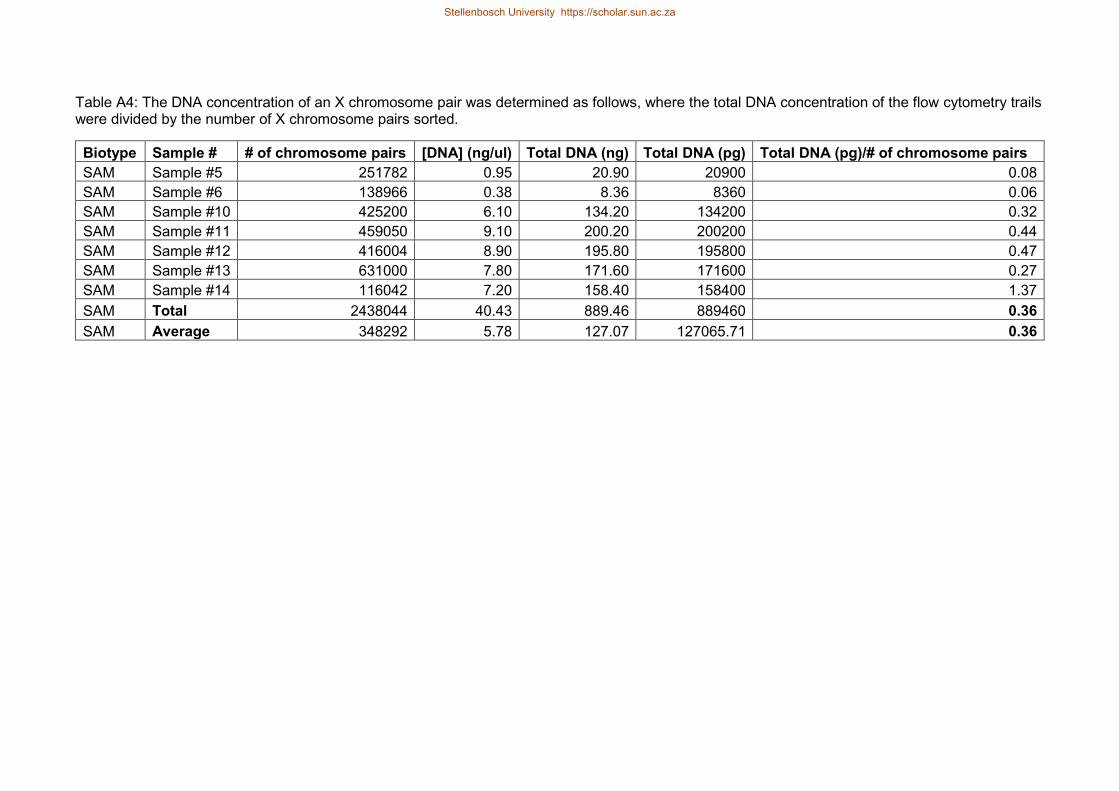
concentration was determined (Table A4)
Table 36 The tabulated results obtained from the NGS including the sequencing
platform used number of bases read count GC percentage and Q20
percentage
Table 37 The tabulated results produced by SOAPdenovo presenting the contig and
scaffold assemblies
Table 38 The tabulated results produced by Qualimap analysis highlighted the
differences in mapping percentage coverage and mapping quality
Stellenbosch University httpsscholarsunacza
xviii
between aligning the RWA and pea aphid genomes against the sorted X
chromosome of the RWA
Table 39 The genome and X chromosome of the fruit fly is compared to that of the
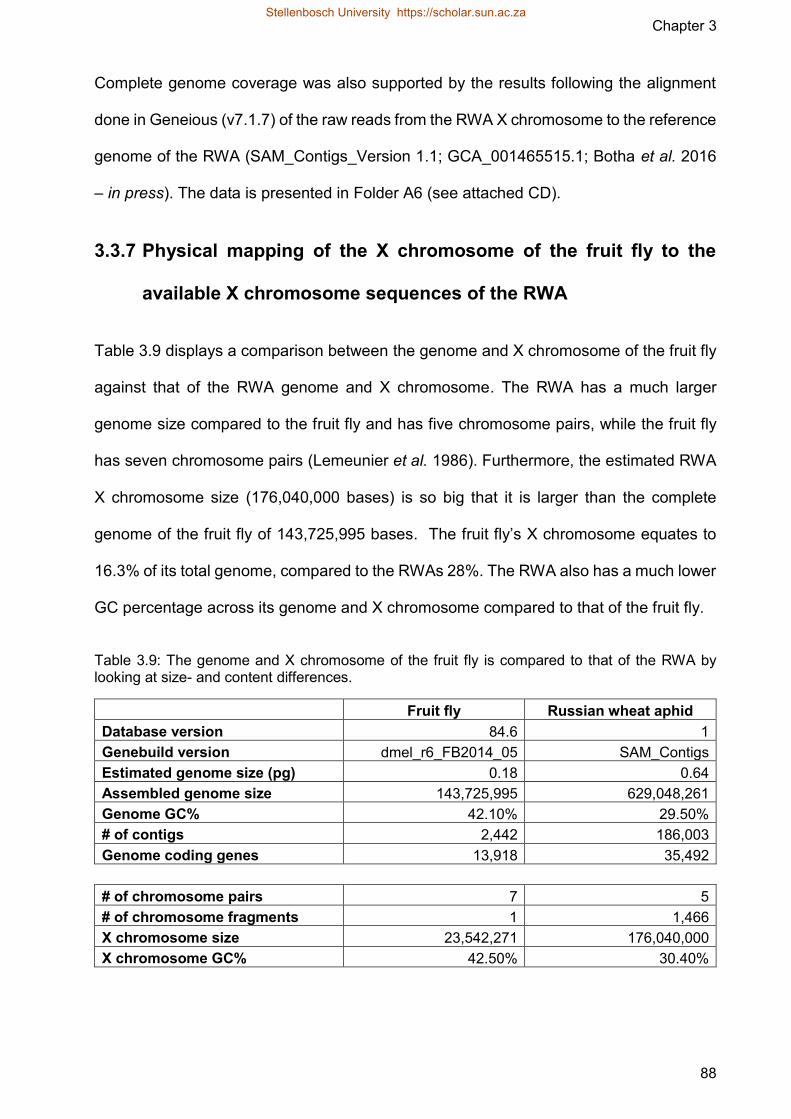
RWA by looking at size- and content differences
Table 310 The fruit fly X chromosome CDS and proteins were aligned against the
RWA genome CDS and proteins in order to characterise the RWA X
chromosome
Table A1 t-Test with two samples assuming equal variances (X chromosome vs
Middle chromosome)
Table A2 t-Test with two samples assuming equal variances (Middle chromosome vs
Small chromosome)
Table A3 t-Test with two samples assuming equal variances (X chromosome vs
Small chromosome)
Table A4 The DNA concentration of an X chromosome pair was determined as
follows where the total DNA concentration of the flow cytometry trails were
divided by the number of X chromosome pairs sorted
Stellenbosch University httpsscholarsunacza
xix
List of abbreviations
degC ndash degrees Celsius
microg ndash microgram
microl ndash microliter
microm ndash micrometre
1C ndash haploid genome size
2C ndash diploid genome size
2N ndash diploid
A ndash adenine
a ndash area
ABI ndash Applied Biosystems
BLAST ndash Basic Local Alignment Search Tool
BLASTn ndash nucleotide BLAST
BLASTp ndash protein BLAST
bp ndash base pair
BSA ndash bovine serum albumin
BWA ndash Burrows-Wheeler aligner
BWT ndash Burrows-Wheeler transform
C ndash cytosine
CAF ndash Central Analytical Facility
Stellenbosch University httpsscholarsunacza
xx
CDS ndash coding sequence
Cy ndash cyanine
Dn ndash Diuraphis noxia
DNA ndash deoxyribonucleic acid
dNTP ndash deoxynucleotide triphosphate
dUTP ndash deoxyuridine triphosphate
FISH ndash fluorescent in situ hybridization
FunCat ndash Functional Catalogue
G ndash guanine
GO ndash Gene Ontology
H ndash height
h ndash hour
ha ndash hectare
IPRI ndash International Plant Resistance to Insects
kb ndash kilobase
kgha ndash kilogram per hectare
M ndash molar or molelitre
mv ndash massvolume
mb ndash megabase
mgml ndash milligrammillilitre
mm ndash millimetre
Stellenbosch University httpsscholarsunacza
xxi
N ndash normality
ngmicrol ndash nanogrammicroliter
NGS ndash next generation sequencing
nm ndash nanometre
NOR ndash nucleolus organiser region
nt ndash nucleotide
PALM ndash photo-activated localization microscopy
PBS ndash phosphate-buffered saline
PCR ndash polymerase chain reaction
pg ndash picogram
PGM ndash personal genome machine
PGS ndash protein coding gene
PI ndash propidium iodide
PR ndash pathogenesis related
PVC-U ndash unplasticized polyvinyl chloride
Q20 ndash quality score (20)
QTL ndash quantitative trait locus
R ndash rand
R ndash resistance
RAM ndash random access memory
RNA ndash ribonucleic acid
Stellenbosch University httpsscholarsunacza
xxii
rpm ndash revolutions per minute
rRNA ndash ribosomal RNA
RT ndash room temperature
RWA ndash Russian wheat aphid
s ndash second
S ndash string
SA1 ndash South African biotype 1
SA2 ndash South African biotype 2
SA3 ndash South African biotype 3
SA4 ndash South African biotype 4
SAM ndash South African mutant biotype
SD ndash standard deviation
SNP ndash single nucleotide polymorphism
SSC ndash saline sodium citrate
ssc ndash side scatter
T ndash thiamine
Taq ndash thermus aquaticus polymerase
US ndash United States
v ndash version
vv ndash volumevolume
wv ndash weightvolume
Stellenbosch University httpsscholarsunacza
xxiii
x ndash times
X chromosome ndash sex chromosome
XXXO or XXXY ndash XO or XY sex-determination system
Stellenbosch University httpsscholarsunacza
Chapter 1
Introduction
Stellenbosch University httpsscholarsunacza
Chapter 1
2
11 Introduction
Diuraphis noxia (Kurdjumov Hemiptera Aphididae) frequently referred to as the Russian
wheat aphid (RWA) is a severe agricultural pest of many cereal crops such as wheat
(Triticum aestivum L) and barley (Hordeum vulgare L) and has had a significant
economic impact worldwide especially on wheat The RWA is characterised by its ability
to develop virulent biotypes that are capable of feeding on former resistant wheat cultivars
(Burd et al 2006) thus counteracting the hostrsquos defensive responses Therefore it is
crucial to research and understand the constant evolutionary struggle between the RWA
and wheat (Botha 2013)
Cytogeneticists have been using aphids as a model group more frequently in the twentieth
century with numerous species within the Aphididae family that have already been
karyotyped The results show a big inconsistency in chromosome number and
morphology between and even within the species (Novotnaacute et al 2011) Furthermore
most of the studies on chromosomes of aphids only mention the diploid chromosome
numbers without providing further information on their karyotypes (Samkaria et al 2010)
Aphids have holocentric chromosomes that lack centromeres and therefore display
kinetic activity along most of the chromosome length (Blackman 1987) The absence of
centromeres makes it almost impossible to distinguish between aphid chromosomes of
similar size mostly because in karyotype studies the centromere is an important
identification feature (Novotnaacute et al 2011)
In the RWA the karyotype differs between sexes with females showing a diploid
chromosome number of 2n = 10 and males 2n = 9 Furthermore the chromosomes are
classified by size into three groups a pair of large chromosomes three pairs of middle-
sized chromosomes and one pair of small chromosomes The male RWA only has one
copy of the X chromosome whereas the female has two copies (Novotnaacute et al 2011)
Stellenbosch University httpsscholarsunacza
Chapter 1
3
The large size of the X chromosome in the RWA makes it an ideal candidate to isolate
and characterise in silico Flow cytometry sorting is a method that is successful in isolating
chromosomes of interest especially if it can be distinguished from other chromosomes in
the karyotype Sorting of chromosomes play a particularly important role in the analysis
of nuclear genome structure and the study of specific and unusual chromosomes (Doležel
et al 2012)
Therefore the aim of this study was to verify the karyotype of the South African RWA by
investigating the chromosomal ultrastructure where after we wanted to characterise the
X chromosome of the RWA through the analysis of chromosomal properties and with high
resolution mapping techniques In order to reach these research goals the following
objectives were set Firstly to construct the RWA karyotype through fluorescent
microscopy using mitotic chromosomes obtained from whole RWA embryos Secondly
to isolate the X chromosome of the RWA using a flow cytometry approach thereby
obtaining DNA from only the X chromosome to sequence it Thirdly to map the
sequenced reads obtained from the X chromosome against the genomes of the RWA
(SAM_Contigs_Version 11 GCA_0014655151 Botha et al 2016 ndash in press) and
Acyrthosiphon pisum (pea aphid) (Acyr_20 GCA_0001429852 The International Aphid
Genomics Consortium 2010) Fourthly to align the well characterised X chromosome of
Drosophila melanogaster (fruit fly) (BDGP6 Adams et al 2000) against the RWA
genome in order to identify orthologous regions with high similarity Lastly to perform
fluorescent in situ hybridization (FISH) with probes derived from the X chromosome of
the fruit fly that is suspected to also hybridize to the X chromosome of the RWA
Stellenbosch University httpsscholarsunacza
Chapter 1
4
12 Thesis outline
The thesis consist of four chapters Chapter 2 contains a brief summary of literature on
the RWA its relationship to wheat virulent biotypes the RWA karyotype RWA
reproduction sequencing platforms and single-chromosome isolation techniques
Chapter 3 focuses on the research conducted in this study and consists of the
constructed karyotype of the RWA the isolation of the X chromosome of the RWA through
flow cytometry bioinformatic analysis of the RWA X chromosome through reference
mapping against the RWA genome pea aphid genome and the X chromosome of the
fruit fly and then finally also FISH studies
Appendix A contains tables and supplemental folders of flow cytometry gating strategies
and results raw data and mapping comparisons of the isolated X chromosome of the
RWA against the RWA and pea aphid genomes raw data of the alignments of the RWA
genome against the X chromosome of the fruit fly and also figures related to FISH
Chapter 4 contains a summary of the main findings of this study and the implications
thereof
13 Preface
The findings obtained and presented in this thesis are the results of a study undertaken
between January 2014 and July 2016 in the Department of Genetics Stellenbosch
University under the supervision of Professor Anna-Maria Oberholster
14 Research outputs
The following outputs were achieved
Steyn L J A Bierman and A M Botha 2016 Karyotyping and in silico characterisation
of the chromosomes of Diuraphis noxia (Hemiptera Aphididae) Biennial
Stellenbosch University httpsscholarsunacza
Chapter 1
5
International Plant Resistance to Insects (IPRI) conference International oral
presentation Cape Town South Africa ndash award for first runner up in MSc
studentrsquos category
Steyn L J A Bierman N F V Burger and A M Botha 2016 Partial characterisation
of the X chromosome of Diuraphis noxia (Hemiptera Aphididae) Chromosome
Research ndash in preparation
Botha A M N F V Burger W Cloete L van Eck K Breeds L J Steyn et al 2016
Draft genome of female Diuraphis noxia (Hemiptera Aphididae) reveals high
levels of genetic diversity despite parthenogenecity and hypomethylation as a
mean to enhance genomic plasticity Genome Biology ndash in press
Stellenbosch University httpsscholarsunacza
Chapter 1
6
15 List of references
Adams M D S E Celniker R A Holt C A Evans J D Cocayne et al 2000 The
genome sequence of Drosophila melanogaster Science 287 2185-2195
Botha A M 2013 A co-evolutionary conundrum The arms race between Diuraphis noxia
(Kurdmojov) a specialist pest and its host Triticum aestivum (L) Arthropod Plant
Interactions 7 359-372
Botha A M N F V Burger W Cloete L van Eck K Breeds et al 2016 Draft genome
of female Diuraphis noxia (Hemiptera Aphididae) reveals high levels of genetic
diversity despite parthenogenecity and hypomethylation as a mean to enhance
genomic plasticity Genome Biology ndash in press
Blackman R L 1987 Reproduction cytogenetics and development In A K Minsk and
P Harrewijn (eds) Aphids their biology natural enemies and control 2 163-195
Burd J D D R Porter G J Puterka S D Haley and F B Peairs 2006 Biotypic
variation among North American Russian wheat aphid (Homoptera Aphididae)
populations Journal of Economical Entomology 99 1862-1866
Doležel J J Vraacutena J Šafaacuteř J Bartoš M Kubalaacutekovaacute et al 2012 Chromosomes in
the flow to simplify genome analysis Functional and Integrative Genomics 12
397-416
Novotnaacute J J Havelka P Staryacute P Kouteckyacute and M Viacutetkovaacute 2011 Karyotype analysis
of the Russian wheat aphid Diuraphis noxia (Kurdjumov) (Hemiptera Aphididae)
reveals a large X chromosome with rRNA and histone gene families Genetica 139
281-289
Samkaria R J Bala and D C Gautum 2010 Karyotype studies on some commonly
occurring aphid species Nucleus 53 55-59
Stellenbosch University httpsscholarsunacza
Chapter 1
7
The International Aphid Genomics Consortium 2010 Genome sequence of the pea aphid
Acyrthosiphon pisum PLoS Biology 8 e1000313
Stellenbosch University httpsscholarsunacza
Chapter 2
Literature review
Stellenbosch University httpsscholarsunacza
Chapter 2
9
21 Insect pests
An insect is characterised as a pest if it has an impact on human lifestyle natural habitats
or ecosystems (Meyer 2007) One of the main problems associated with insect pests
include the damaging effects on crops and subsequently a decrease in food production
(Bailey et al 2010) There are approximately 6 million species of insects of which 50
are known to be herbivorous (Schoonhoven et al 2005) Different insect pests use
various approaches to salvage nutrients from plants All known plant feeding
(phytophagous) insects cause mechanical damage to plant tissues but the degree of
injury varies between different species of insect mainly because of their contrasting
strategies of feeding (Howe and Jander 2008)
The majority (60) of herbivorous insect species have been identified as leaf-eating
beetles (Coleoptera) or caterpillars (Lepidoptera) that mainly cause damage with their
mouthparts which have evolved for chewing snipping or tearing (Schoonhoven et al
2005) Other insects like thrips and spider mites suck the liquid content from lacerated
cells through tube-like structures whereas leaf miners develop and feed on soft tissue
between epidermal cell layers Aphids whiteflies and other Hemiptera insert specialized
stylets between cells to create a feeding site in the phloem (Howe and Jander 2008)
22 Insect-plant interactions
In the course of insect-plant interactions both partners send and receive chemical cues
that influence the outcome of the interaction Contact chemoreceptors on the insect
mouthparts antennae and tarsi measure the suitability of the host as a food source In
opposition plant cells detect and respond to insect movement wound trauma caused by
feeding and compounds in insect oral secretions (Howe and Jander 2008)
The choice of an insect to reject or accept a host plant is influenced by a number of
chemical deterrents and attractants A considerable amount of specialised plant
Stellenbosch University httpsscholarsunacza
Chapter 2
10
compound (secondary metabolites) diversity is a result of the co-evolutionary struggle
between insects and plants (Becerra 2007)
23 Aphids
The Aphididae family consists of approximately 4700 aphid species of which 450 have
been identified as small grain pests One hundred of these aphids have taken advantage
of the monoculture environment of modern agriculture resulting in extensive economic
damage globally (Van Emden and Harrington 2007)
Aphids have small soft bodies and belong to the order Hemiptera (Sternorrhyncha) that
also include whiteflies mealybugs and psyllids The insects that belong to this order are
all evolutionary adapted to consume phloem sap as a main or only food source Aphids
are further grouped into two subfamilies namely the Aphididae that comprise of ldquotruerdquo
aphids as well as the Aphidinae that consist of several aphid pests of food crops (De
Jager et al 2014)
Aphids are dispersed worldwide and are specialised phloem feeders that cause severe
damage to numerous cultivated plants (Tagu et al 2008) The devastating impact of
aphids is associated with their efficient colonization and settlement traits because of
several advantageous biological characteristics Firstly parthenogenesis allows a double
intrinsic rate of increase and a shortened reproductive time Secondly the aphids can
colonize new host plants through winged adults while the wingless adults invest more of
their energy in reproduction Thirdly they cause a significant nutrient withdrawal from
sieve tubes because of high population densities and lastly they transmit numerous
phytoviruses (Giordanengo et al 2010)
The survival of aphids depend on their ability to access phloem bundles disrupting and
evading the plant defence responses and their capability of keeping the phloem cells
functioning while withdrawing their liquid diet In contrast to grazing insects that remove
Stellenbosch University httpsscholarsunacza
Chapter 2
11
big sections of plant tissues aphids only cause minor physical damage Aphids insert
long and flexible stylets that primarily move in the cell wall apoplasm between cells to
access the sieve tubes (Tjallingii 2006)
The best studied aphids and their hosts include Schizaphis graminum (greenbug) that
feed on winter and spring grain (Kindler et al 2002) Acyrthosiphon pisum (pea aphid)
that feed on legume crops (Edwards 2001) and Diuraphis noxia Kurdjumov (Russian
wheat aphid) that feed on wheat and barley (Botha et al 2005) All of these host-specific
aphids are considered as agricultural pests and are highly adapted to their specific
environmental conditions
24 Russian wheat aphid (RWA)
241 Host plant
Bread wheat (Triticum aestivum L) was one of the first domesticated crops and is the
most recent polyploid species among the agricultural crops Wheat is classified as a major
food source as it is one of the worldrsquos leading crops and holds the record for the highest
trade value amongst the cereal species (Gill et al 2004) A total area of approximately
21846 million ha of the world is occupied by wheat production with a grain yield of around
71318 million tons and an average yield of 2900 kgha (Khan et al 2015) Wheat has a
higher nutritive value than other grains and together with other major crops like rice and
maize supplies almost two thirds of the worldrsquos daily calorie and protein intake It is an
important source of protein vitamins and minerals and serves as the staple food source
of 30 of the human population Wheat thrives in temperate regions unlike other similar
cereal crops rice and maize that is best adapted for tropical environments (Gill et al
2004)
Over 600 million tons of wheat is harvested annually but the yield must rise exponentially
(2 per annum on an area of land) over the next 50 years in order to meet the ever
Stellenbosch University httpsscholarsunacza
Chapter 2
12
increasing human demand Food security is projected to become more critical as a result
of population growth (Gill et al 2004) Therefore a multidisciplinary combined approach
to crop enhancement is necessary to guarantee sustainability To reach this objective
high-production irrigated regions will carry on to play a key role but the total yield will
mostly be affected by genetic potential the level of diseases and pests (Duveiller et al
2007) Wheat is susceptible to many kinds of insects but the few species with damaging
effects on yields are especially presenting a challenge to farmers It has been calculated
that pest infestations on average cause 20-37 wheat yield loss worldwide This
calculation translates to approximately $70 billion a year (Dilbirligi et al 2004)
242 RWA background
Russian wheat aphid (RWA) is an economically important agricultural pest that causes
substantial losses in small grains particularly wheat (Lapitan et al 2007) but also
damages barley rye oats and other triticale crops (Webster et al 1987) It is an
elongated small insect relatively 15 to 18 mm in length This phloem-feeding pest is a
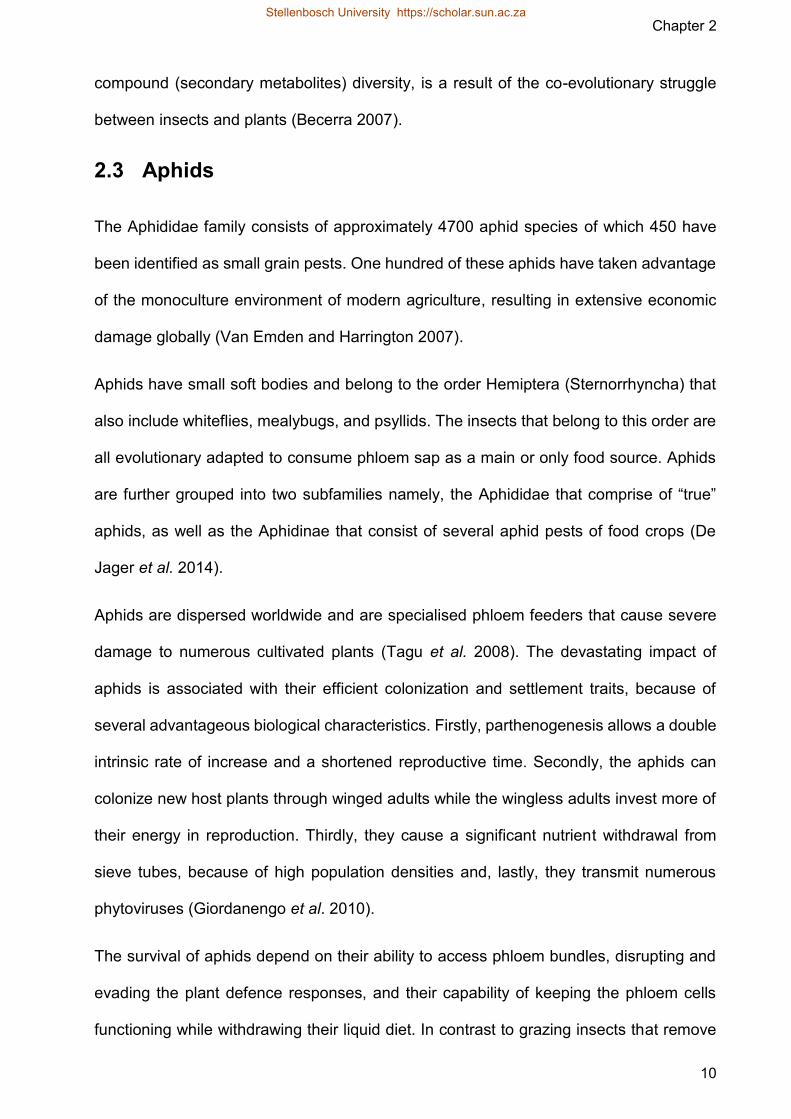
lime-green colour and its body is spindle shaped The RWA has short antennae and when
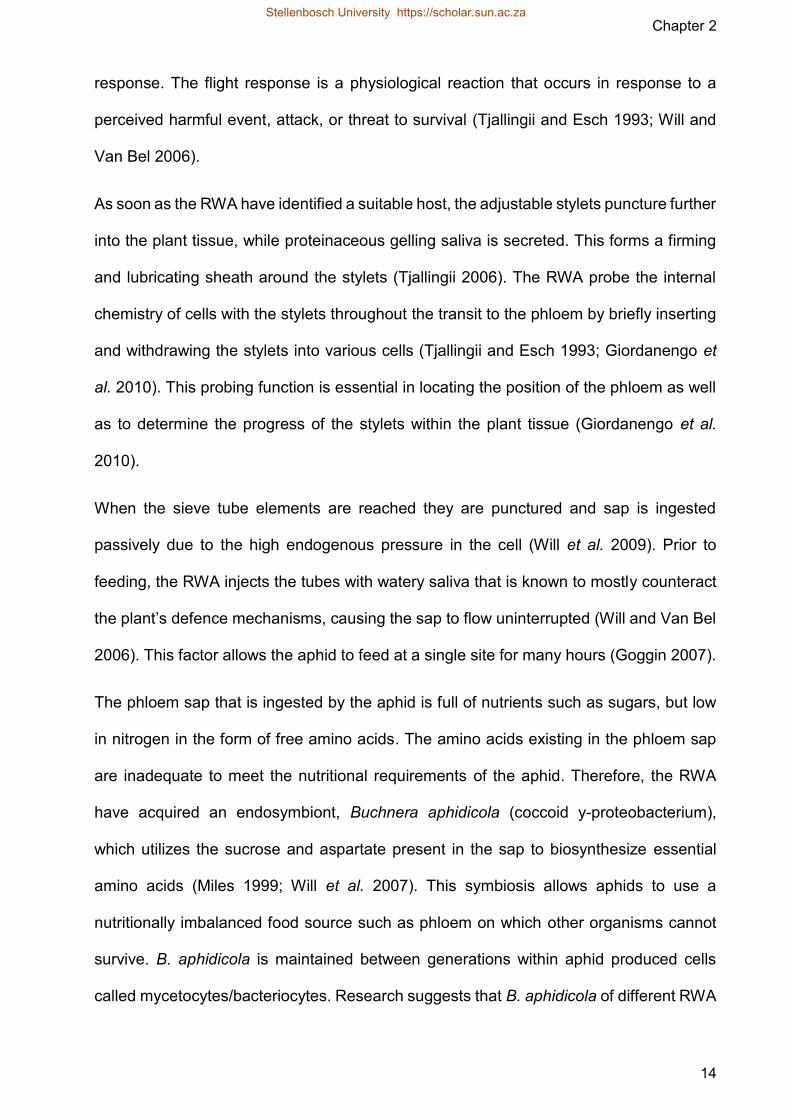
it is viewed from the side a characteristic double tail can be seen (Figure 21) (Stoetzel
1987)
Figure 21 Physical characteristics of the RWA (Stoetzel 1987) Side and top view displaying the distinct morphological features of the RWA
Side view
Top view
Stellenbosch University httpsscholarsunacza
Chapter 2
13
The RWA is native to southern Russia and central Asia from where it dispersed to all
cereal producing areas of the world with the most severe cases occurring in South Africa
USA Canada and South America (Burd et al 2006 Jankielsohn 2011) The RWA is
characterised as an invasive species and was reported for the first time in South Africa in
1978 in an area around Bethlehem in the eastern Free State from where it spread to the
western Free State and parts of Lesotho It was also present in small areas of Gauteng
the North West province as well as Kwazulu-Natal (Walters et al 1980) and more
recently it has been reported in the Western Cape (Jankielsohn 2011)
Cilliers et al (1992) predicted that the economic damage caused by the RWA in South
Africa would amount to approximately R30 million in 1993 with almost half of that sum
being spent on chemical control The yield losses caused by the RWA are severe with
recorded crop losses of 35-60 in South Africa for wheat alone (Robinson 1992) In the
United States (US) damage has been estimated at $890 million from 1987-1993 (Morrison
and Peairs 1998) with more recent research showing that in the US the RWA can reduce
wheat grain yield up to 829 and vegetative biomass up to 765 in Texas and the
Oklahoma Panhandles (Mirik et al 2009)
243 RWA feeding
The RWA feeds on phloem and maintains the interaction at a specific feeding site (Goggin
2007 Giordanengo et al 2010) This must be done without killing the phloem cells in
addition to avoiding and disrupting plant defences (Powell et al 2006) Before the RWA
can establish a suitable relationship with its host the aphid must firstly differentiate
between host and non-host The RWA inserts its stylet comprised of two outer
mandibules and two inner maxillae into the host epidermal apoplasm initiating shallow
probes that last briefly (lt 2 minutes) but result in host recognition by the aphid This
provokes the feeding response or host rejection that ultimately stimulates the flight
Stellenbosch University httpsscholarsunacza
Chapter 2
14
response The flight response is a physiological reaction that occurs in response to a
perceived harmful event attack or threat to survival (Tjallingii and Esch 1993 Will and
Van Bel 2006)
As soon as the RWA have identified a suitable host the adjustable stylets puncture further
into the plant tissue while proteinaceous gelling saliva is secreted This forms a firming
and lubricating sheath around the stylets (Tjallingii 2006) The RWA probe the internal
chemistry of cells with the stylets throughout the transit to the phloem by briefly inserting
and withdrawing the stylets into various cells (Tjallingii and Esch 1993 Giordanengo et
al 2010) This probing function is essential in locating the position of the phloem as well
as to determine the progress of the stylets within the plant tissue (Giordanengo et al
2010)
When the sieve tube elements are reached they are punctured and sap is ingested
passively due to the high endogenous pressure in the cell (Will et al 2009) Prior to
feeding the RWA injects the tubes with watery saliva that is known to mostly counteract
the plantrsquos defence mechanisms causing the sap to flow uninterrupted (Will and Van Bel
2006) This factor allows the aphid to feed at a single site for many hours (Goggin 2007)
The phloem sap that is ingested by the aphid is full of nutrients such as sugars but low
in nitrogen in the form of free amino acids The amino acids existing in the phloem sap
are inadequate to meet the nutritional requirements of the aphid Therefore the RWA
have acquired an endosymbiont Buchnera aphidicola (coccoid у-proteobacterium)
which utilizes the sucrose and aspartate present in the sap to biosynthesize essential
amino acids (Miles 1999 Will et al 2007) This symbiosis allows aphids to use a
nutritionally imbalanced food source such as phloem on which other organisms cannot
survive B aphidicola is maintained between generations within aphid produced cells
called mycetocytesbacteriocytes Research suggests that B aphidicola of different RWA
Stellenbosch University httpsscholarsunacza
Chapter 2
15
biotypes display small amounts of variation in sequence and have contrasting plasmid
copy numbers (Swanevelder et al 2010)
244 Symptoms of RWA infestation
While the RWA feeds it injects eliciting agents into the host plant causing chloroplast and
cellular membrane breakdown in the host plant and activating pathogenesis-related (PR)
genes (Botha et al 2005) The RWA feeds on the most recent plant growth and ultimately
causes chlorophyll production standstill in those leaves (Botha et al 2011) Damage
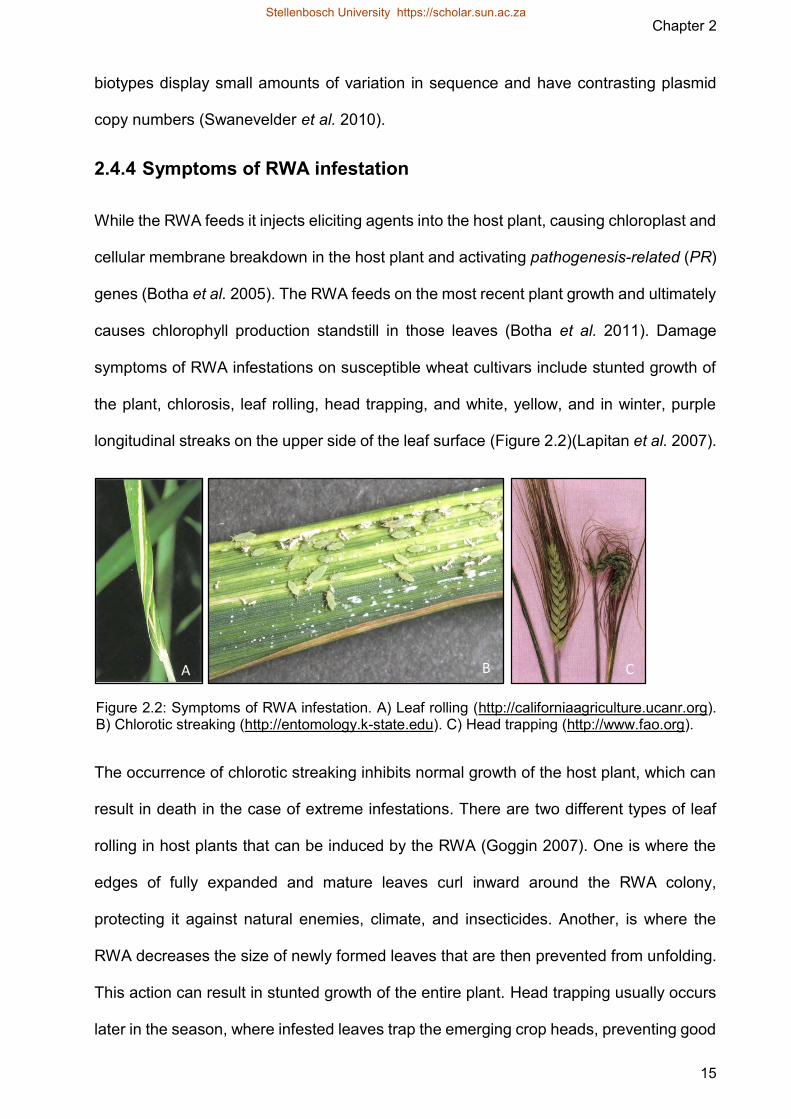
symptoms of RWA infestations on susceptible wheat cultivars include stunted growth of
the plant chlorosis leaf rolling head trapping and white yellow and in winter purple
longitudinal streaks on the upper side of the leaf surface (Figure 22)(Lapitan et al 2007)
The occurrence of chlorotic streaking inhibits normal growth of the host plant which can
result in death in the case of extreme infestations There are two different types of leaf
rolling in host plants that can be induced by the RWA (Goggin 2007) One is where the
edges of fully expanded and mature leaves curl inward around the RWA colony
protecting it against natural enemies climate and insecticides Another is where the
RWA decreases the size of newly formed leaves that are then prevented from unfolding
This action can result in stunted growth of the entire plant Head trapping usually occurs
later in the season where infested leaves trap the emerging crop heads preventing good
B C A
Figure 22 Symptoms of RWA infestation A) Leaf rolling (httpcaliforniaagricultureucanrorg) B) Chlorotic streaking (httpentomologyk-stateedu) C) Head trapping (httpwwwfaoorg)
Stellenbosch University httpsscholarsunacza
Chapter 2
16
grain fill and ultimately affecting the yield production of the crops (Botha et al 2005 Jyoti
et al 2006)
Approaches that can be taken to manage this pest to reduce crop losses include a mixture
of contact and systemic insecticide the cultivation of RWA resistant cultivars as well as
the introduction of natural biological control agents such as predators parasitoids and
pathogens which are also used to control aphid numbers when they are protected in the
leaf sheath (Carver 2009 Webster et al 1987)
245 RWA-wheat interaction
The RWA affects wheat throughout the growth season and infestations would usually
commence from the appearance of the crop in autumn straight through to crop maturity
(Shea et al 2000) RWA infestations can result in 100 reductions in wheat yield or
cause death of the plant especially if the pest is abundant (Elliot et al 2007) Therefore
early detection and timely controls are very important especially during the winter and
spring growing seasons (Pike et al 1989)
Host plants react to RWA infestations according to three categories These can be
defined as (1) tolerance ie the host withstands conditions of infestations which will
severely harm susceptible plants (2) antibiosis ie the capability of the host plant to
fatally change the biology of the pest and (3) antixenosis ie the disfavour or non-
preference of plants for insect oviposition shelter or food (Painter 1958)
Wheat resistance to RWA can occur through one or a combination of factors Firstly the
pest may not recognise the plant as a suitable host because it is less attractive or
distasteful which is expressed as reduced feeding and oviposition Preformed barriers
and defence molecules may prevent attack and plants may initiate defence responses
against the pest once it has been recognised That negatively impacts the pest
Stellenbosch University httpsscholarsunacza
Chapter 2
17
performance which is expressed as longer larval development time mortality and
reduced larval mass (Hammon-Kosack and Jones 1996)
Resistance (R-) genes also confer resistance to the RWA in wheat (Dogimont et al 2010)
The genetic employment of R-genes in wheat is an efficient economical and well-tested
method in controlling insect pests (Dilbirligi et al 2004) Presently 14 R-genes conferring
RWA resistance have been identified in wheat and its relatives and are titled as Dn
(Diuraphis noxia) genes These Dn genes are designated as follows Dn1 and Dn2 (Du
Toit 1987 1988 1989) dn3 (Nkongolo et al 1991a) Dn4 (Nkongolo et al 1991b) Dn5
(Marais and Du Toit 1993) Dn6 (Saidi and Quick 1996) Dn7 (Marais and Du Toit 1993)
Dn8 and Dn9 (Liu et al 2001) Dnx (Harvey and Martin 1990) Dny (Smith et al 2004)
Dn2414 (Peng et al 2007) Dn626580 (Valdez 2012) and DnCI2401 (Fazel-Najafabadi
2015) Each R-gene may provide resistance to a single or to multiple biotypes which is
the case in wheat containing the Dn7 resistance gene the only recorded germplasm line
resistant to all South African RWA biotypes (Dogimont et al 2010 Jankielsohn 2011)
The mode of response of these genes has been determined as well as the location for
some of these genes on wheat chromosomes The majority of these genes are located
on either chromosome 1B or 7D in hexaploid wheat (Botha et al 2005 Dogimont et al
2010)
246 RWA biotypes
A RWA biotype is a population of aphids that can damage a wheat cultivar that was
previously reported resistant to other biotypes of RWA (Burd et al 2006) There is an
arms race between plant resistance and aphid virulence RWA adaptation results in new
biotypes that are morphologically alike to the original biotypes but different in their
behavioural performance such as their preference for different host genotypes (Lapitan
et al 2007) New RWA biotypes are likely due to the diversification theory ndash two
Stellenbosch University httpsscholarsunacza
Chapter 2
18
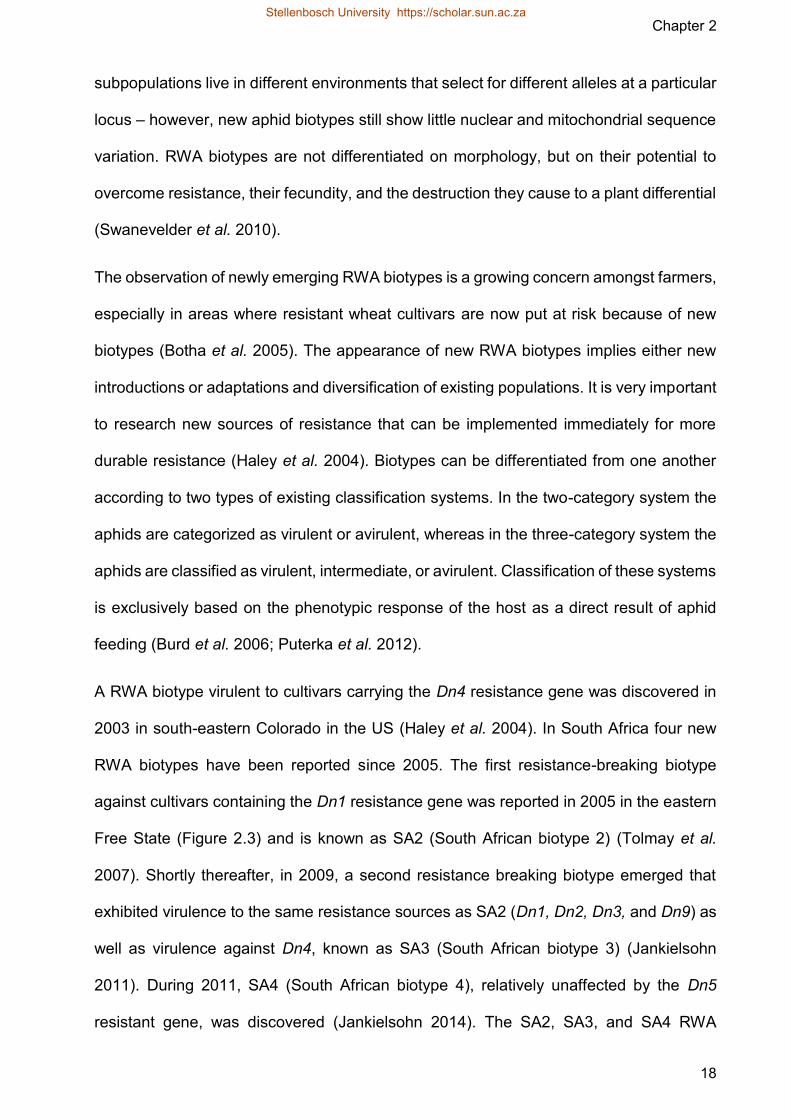
subpopulations live in different environments that select for different alleles at a particular
locus ndash however new aphid biotypes still show little nuclear and mitochondrial sequence
variation RWA biotypes are not differentiated on morphology but on their potential to
overcome resistance their fecundity and the destruction they cause to a plant differential
(Swanevelder et al 2010)
The observation of newly emerging RWA biotypes is a growing concern amongst farmers
especially in areas where resistant wheat cultivars are now put at risk because of new
biotypes (Botha et al 2005) The appearance of new RWA biotypes implies either new
introductions or adaptations and diversification of existing populations It is very important
to research new sources of resistance that can be implemented immediately for more
durable resistance (Haley et al 2004) Biotypes can be differentiated from one another
according to two types of existing classification systems In the two-category system the
aphids are categorized as virulent or avirulent whereas in the three-category system the
aphids are classified as virulent intermediate or avirulent Classification of these systems
is exclusively based on the phenotypic response of the host as a direct result of aphid
feeding (Burd et al 2006 Puterka et al 2012)
A RWA biotype virulent to cultivars carrying the Dn4 resistance gene was discovered in
2003 in south-eastern Colorado in the US (Haley et al 2004) In South Africa four new
RWA biotypes have been reported since 2005 The first resistance-breaking biotype
against cultivars containing the Dn1 resistance gene was reported in 2005 in the eastern
Free State (Figure 23) and is known as SA2 (South African biotype 2) (Tolmay et al
2007) Shortly thereafter in 2009 a second resistance breaking biotype emerged that
exhibited virulence to the same resistance sources as SA2 (Dn1 Dn2 Dn3 and Dn9) as
well as virulence against Dn4 known as SA3 (South African biotype 3) (Jankielsohn
2011) During 2011 SA4 (South African biotype 4) relatively unaffected by the Dn5
resistant gene was discovered (Jankielsohn 2014) The SA2 SA3 and SA4 RWA
Stellenbosch University httpsscholarsunacza
Chapter 2
19
biotypes are highly virulent when compared to the original South African biotype SA1
(Jankielsohn 2016) SA1 infestations do not cause damage to resistant wheat cultivars
except in the germplasm containing the dn3 gene
The South African mutant biotype SAM was developed from SA1 after laboratory
induced selective pressure on Dn resistant cultivars (Swanevelder et al 2010) SAM
causes symptoms in all known resistant wheat cultivars including those containing Dn7
247 RWA karyotype
Cytogenetic research was restricted in aphids in the past and confined to counting and
size-sorting of the chromosomes However presently aphids are a popular model group
among cytogeneticists (Novotnaacute et al 2011) The interaction between histones and non-
histone proteins leads to the formation of chromosomes (Margueron and Reinberg 2010
Zhou et al 2011) Even though there is no noticeable connection between genome size
and the amount of chromosomes (Heslop-Harrison and Schwarzacher 2011) Schubert
et al (2001) believed that large genomes must be spread into a number of smaller
Biotype 1 Biotype 2 Biotype 3
Figure 23 A general distribution map of the four RWA biotypes found in South Africa (Jankielsohn 2016)
Biotype 4
Stellenbosch University httpsscholarsunacza
Chapter 2
20
chromosomes ultimately because chromosome size has an upper boundary The
karyotype of aphids has been shown to vary in chromosome number and morphology
between and even within the species (Novotnaacute et al 2011)
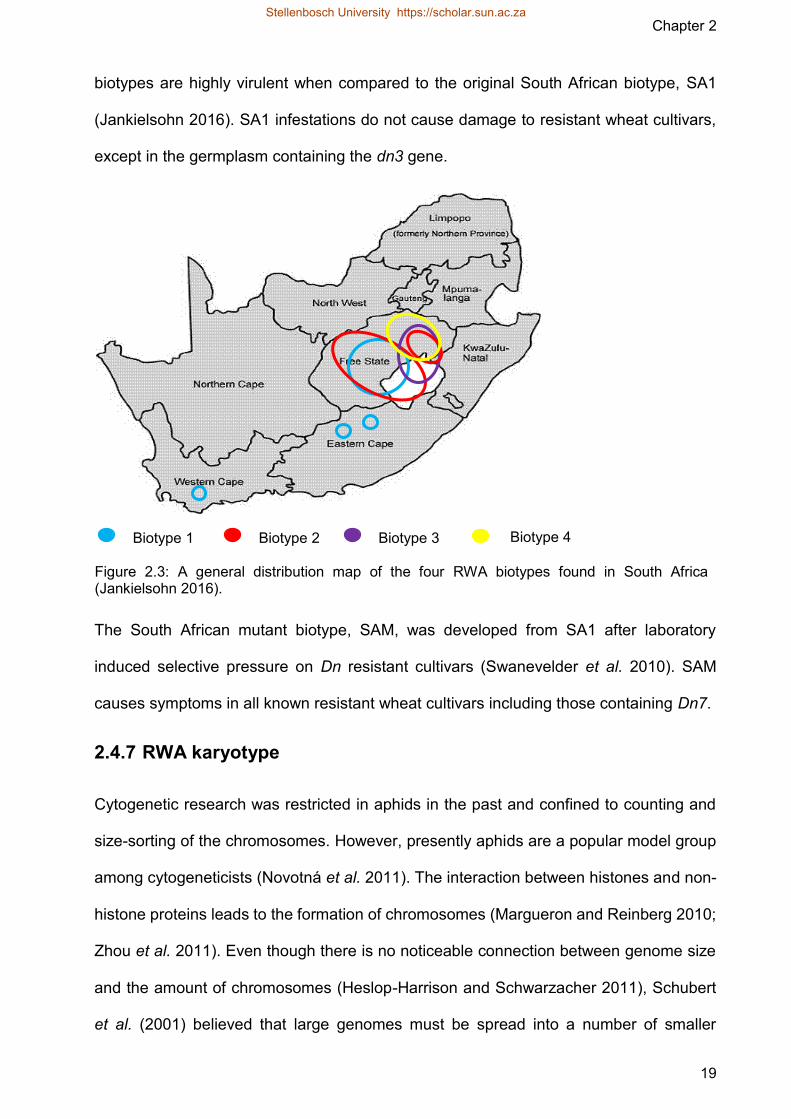
The female karyotype of the RWA (2n = 10) consists of 4 autosomal chromosome pairs
as well as a pair of large X (sex) chromosomes (Figure 24) The male karyotype of the
RWA (2n = 9) consists of 4 autosomal pairs but only a single large X chromosome The
4 autosomal chromosome pairs present in both sexes of the RWA can be classified
according to size into 2 classes 3 pairs of middle-sized chromosomes and 1 pair of small
chromosomes The X chromosomechromosomes are classified as the largest
component of the karyotype (Novotnaacute et al 2011)
The estimated genome sizes of the female and male RWA is 2C = 086 pg and 2C = 070
pg respectively The differences with regard to the DNA content of the two genders
proposes that the X chromosomes occupies approximately 35 (1C = 043 pg) of the
female haploid genome The X chromosome in the RWA is one of the largest sex
Figure 24 Female RWA karyotype A) Two large X (sex) chromosomes B) and C) four autosome chromosome pairs (Novotnaacute et al 2011)
X chromosomes (A)
Middle autosome chromosomes (B)
Small autosome chromosomes (C)
Stellenbosch University httpsscholarsunacza
Chapter 2
21
chromosomes in the animal kingdom measuring approximately 10 microm (Novotnaacute et al
2011)
Large X chromosomes are described in several aphid species The Neuquenaphis
(Neuquenaphidinae) have X chromosome sizes ranging from 11 to 15 of the total
genome (Blackman et al 2003) and for the related Myzus persicae the X chromosome
reaches almost 27 of the genome size (Blackman and Takada 1976) Several papers
have presented data on large heterochromatin blocks and highly repetitive sequences in
the X chromosomes of some aphid species (Mandrioli et al 1999)
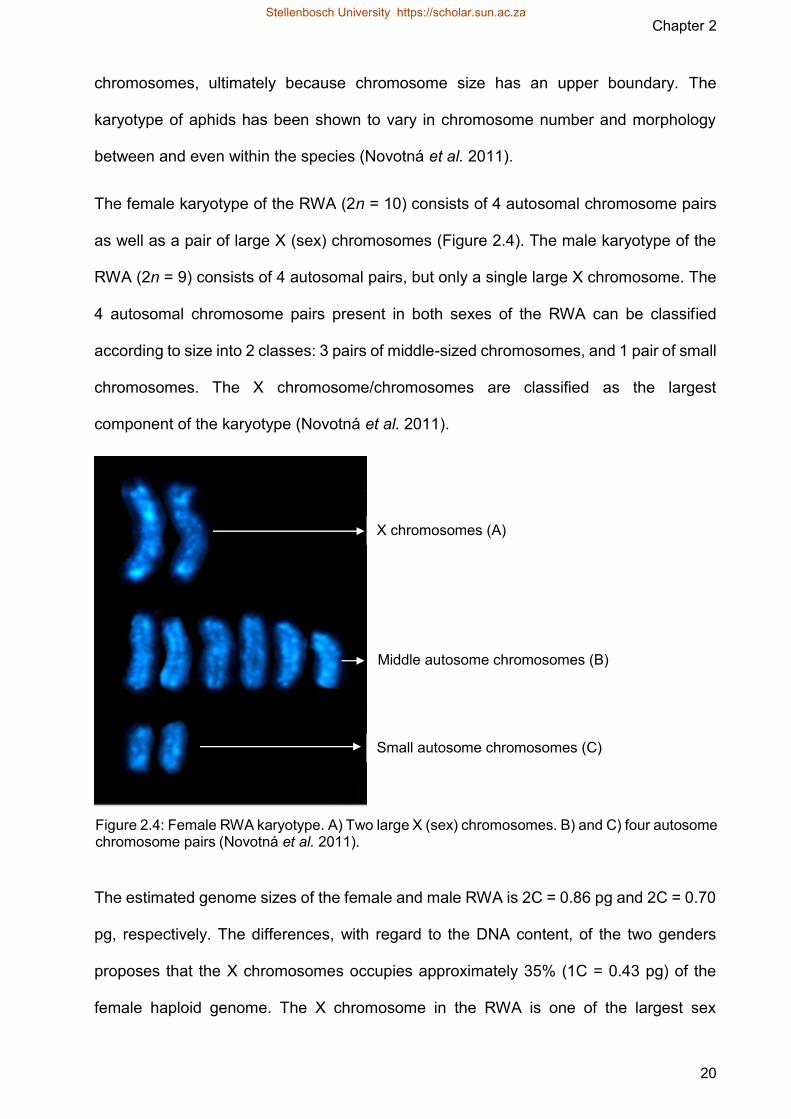
Karyotype variation is likely due to the holocentric chromosomes of the RWA Holocentric
chromosomes lack primary constrictions (centromeres) and thus have multiple sites of
attachment to the spindle (Figure 25) Therefore these holocentric chromosomes have
kinetic activity spanning across most of the chromosome axis (Monti et al 2012)
In the course of mitotic anaphase these chromosomesrsquo sister chromatids disconnect in
parallel and display a lsquoholokineticrsquo movement (Peacuterez et al 1997) The kinetic activity along
the chromosome causes chromosomal fragments to bind to the microtubules which
causes them to move into the daughter cells during cell division (Blackman 1987) In
Figure 25 Monocentric (A) and holocentric (B) chromosomes A) Single site of chromosomal attachment to the centromere B) Multiple sites of chromosomal attachment
A
B
Stellenbosch University httpsscholarsunacza
Chapter 2
22
contrast these chromosomal fragments may be lost during mitosis and meiosis in
monocentric chromosomes (Figure 25) because chromosomes attach to microtubules
at a certain region (the centromere) and move in the direction of the pole during anaphase
with the centromere in front (Monti et al 2012)
The position of the centromere in organisms with monocentric chromosomes is a valuable
descriptive factor The fact that the aphid chromosome lacks a centromere makes
chromosomes of similar size almost indistinguishable within the species (Novotnaacute et al
2011)
248 RWA reproduction
In places where the RWA is indigenous right before winter males and females will mate
and lay eggs These eggs will stay as eggs for the whole winter and then hatch in the
spring However male RWA rarely develop and only exist in colder climates (Hodgson
and Karren 2008)
There are no male RWA present in South Africa (Webster et al 1987) and colonies are
established by apterous virginopara (wingless parthenogenetic females) (Jyoti et al
2006) Various reproductive and dispersal strategies are used by the RWA that finally
result in their abundance (Goggin 2007) Parthenogenesis and vivipary which are the
primary modes of RWA reproduction impart a highly efficient colonisation habit of new
hosts to these aphids Parthenogenesis is reproduction through development of
unfertilised eggs These unfertilised eggs will usually only give rise to females Vivipary
is the ability of each female RWA to give birth to live daughters (Goggin 2007
Giordanengo et al 2010) and these daughters are already pregnant with embryonic
granddaughters (Michaud and Sloderbeck 2005) These abilities of the RWA shortens
the time between generations allowing nymphs to reach maturity and reproduce at a
rapid rate ndash a factor implicated for their large economic impact (Giordanengo et al 2010)
Stellenbosch University httpsscholarsunacza
Chapter 2
23
Another effective method the RWA uses to colonize is through the winged dimorphism
which enable winged adults to colonize new distant hosts during unfavourable seasons
or in situations of high population densities while the wingless adults redirect the energy
required for producing flying organs into their reproductive cycles (Goggin 2007)
249 RWA sex chromosome system
The sex chromosome system for RWA has been identified as XXXO as seen in a
number of different aphid species This system never possesses a Y chromosome and is
essential for parthenogenesis Crucial biological processes like sex determination
imprinting speciation and genomic conflicts are all influenced by the sex chromosomes
Sex chromosomes display many unusual characteristics like inheritance patterns
reduced recombination and hemizygosity which all play a big role in their response to
evolutionary factors (Jaquieacutery et al 2012)
The RWA male that has the sex-chromosome constitution XO can only be produced
through modified mitosis by parthenogenetic XX females During this process one of the
X chromosomes is discarded to create eggs that consist of a single X chromosome as
well as two autosomal sets Thereafter while the autosomes divide or disconnect
independently the two X chromosomes are linked with one another at a single end unlike
normal mitosis which forms a C-shaped structure Thereafter one of the X chromosomes
is discarded from the complement and the sister chromatids of the other X chromosome
move to the daughter cells (Orlando 1974 Blackman and Hales 1986)
One of the most prominent distinctions between RWA and other XXXO organisms such
as nematodes insects or molluscs is their unusual pattern of inheritance of the X
chromosome during a life cycle where asexual and sexual reproduction is combined
Figure 26 displays the life cycle of the RWA and shows that it consists of numerous
events of apomictic parthenogenesis proceeding with a single round of sexual
Stellenbosch University httpsscholarsunacza
Chapter 2
24
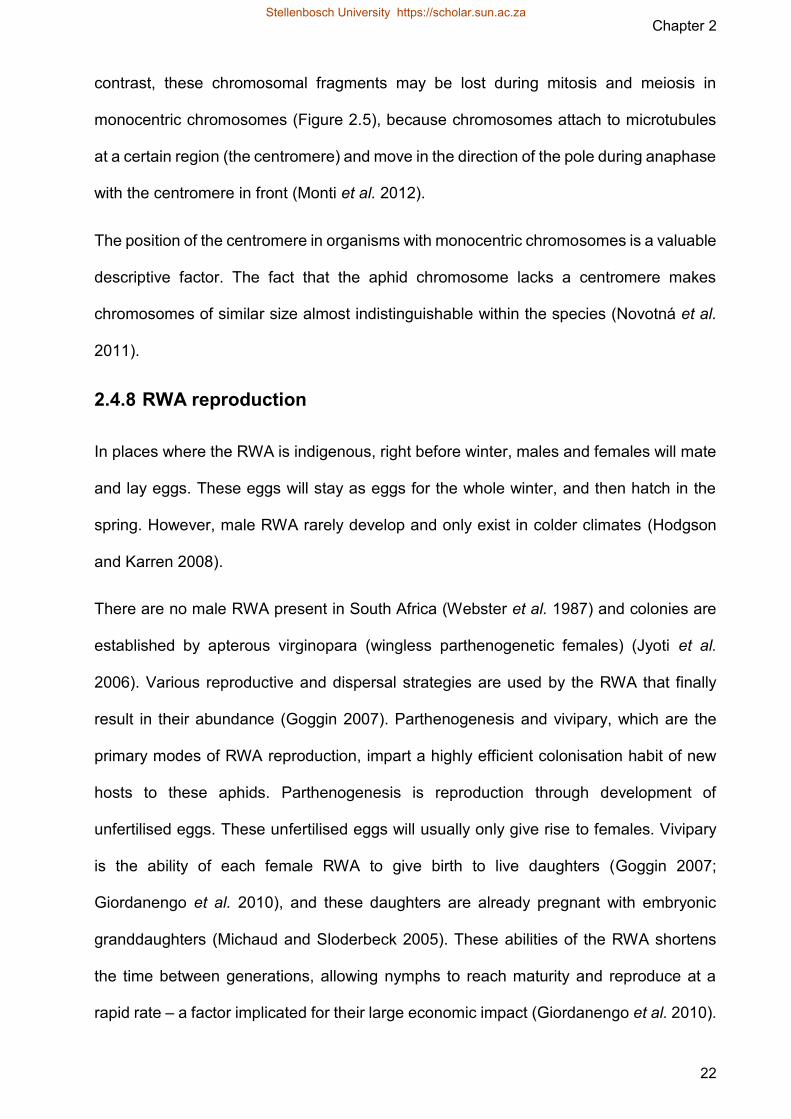
reproduction in autumn After 10-20 generations of apomictic parthenogenesis asexual
reproduction finally leads to the production of sexual RWA individuals where the male
aphids randomly inherit only one of the X chromosomes of the asexual female (Wilson et
al 1997 Caillaud et al 2002)
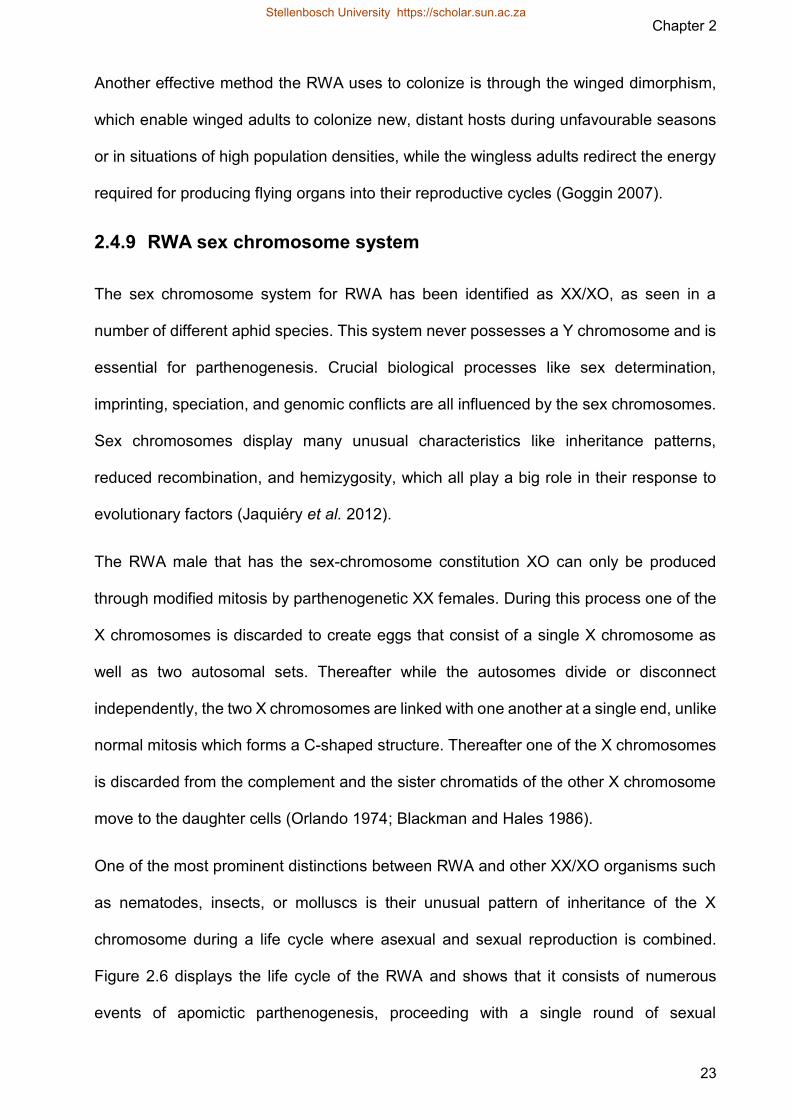
The male RWA produces gametes that are haploid for the X as well as autosome
chromosomes Therefore when the male and female gametes fuse the diploidy of the X
and autosome chromosomes are restored to generate an asexual female This means
that after sexual reproduction the asexual progeny inherited half of the autosomes and X
chromosomes from the mother and the other half from the father (Figure 27)
Figure 27 Inheritance of the X chromosome in XXXY standard XXX0 and aphid-like XXX0 sex-determining systems In aphid-like XXX0 systems the male transfer its X chromosome to 100 of its progeny giving rise to only asexual daughters (Jaquieacutery et al 2012)
Figure 26 The yearly life cycle of the aphid and ploidy levels for autosomes (A) and sexual chromosomes (X) (Jaquieacutery et al 2013)
Stellenbosch University httpsscholarsunacza
Chapter 2
25
The RWA pattern of X chromosome inheritance is different from standard XXXO or
XXXY systems where the female offspring inherits one X chromosome from each parent
(mother and father) but where males only receive a copy of the X chromosome from the
mother As explained previously during RWA sexual reproduction male aphids transmit
their X chromosome to 100 of their progeny ultimately only producing asexual
daughters (Figure 27) (Jaquieacutery et al 2012)
25 Insect genomes
Over the last few years of declining DNA sequencing cost as well as more accessible
sequencing services in primary laboratories and companies it has become more
economical for many entomologists to make use of de novo genome sequencing and
assembly methods for insect species However in order to produce a high quality
reference genome sequence generation alone is not enough and in various cases
extremely fragmented genome assemblies prevent high quality gene annotation and
other sought after analysis of sequencing data (Richardson and Murali 2015)
The de novo assembly of insect genomes is often hampered by high polymorphism the
lack of ability to breed for genome homozygosity and finally the small physical size of
insects that ultimately limits the amount of DNA to be extracted from a single individual
Modern improvements in sequencing technology and assembly strategies allows insect
genomes to be studied more effectively (Richardson and Murali 2015)
Arthropod genome sizes exhibit considerable diversity with the largest reported to date
being that of the grasshopper (Orthotera Neoconocephalus triops L) (1C = 7 125 Mb
(male)7 752 Mb (female) 793 pg) and the smallest being the two spotted spider mite
(Trombidiformes Tetranychus urticae) (1C = 907 Mb 009 pg) (Hanraham and Johnston
2001 Johnston et al 2007)
Stellenbosch University httpsscholarsunacza
Chapter 2
26
Drosophila melanogaster (fruit fly) was the first arthropod high quality complete genome
to be sequenced using shot-gun sequencing (BDGP6 Adams et al 2000) and presently
the model dataset for whole genome assembly amongst insects (Myers et al 2000) The
genome of the fruit fly has been determined to be 180 Mb in size of which a third consists
of centric heterochromatin The 120 Mb of euchromatin is located on the sex chromosome
and two large autosomal chromosomes whereas the fourth small chromosome only
comprises of 1 Mb of euchromatin The heterochromatin mainly includes short simple
sequence elements repeated for many bases which is occasionally interrupted by
inserted transposable elements and tandem arrays of ribosomal RNA genes (Adams et
al 2000)
The first aphid genome to be sequenced belonged to the pea aphid Acyrthosiphon pisum
(Acyr_20 GCA_0001429852 The International Aphid Genomics Consortium 2010) It
was also the first published whole genome sequence of a basal hemi-metabolous insect
in contrast to the numerous published genomes of homo-metabolous insects The pea
aphid that is commonly used in laboratory research is a pest of legume crops (Fabaceae)
and is very closely related to many significant crop pests such as the RWA as well as
the green peach aphid (Myzus persicae) (Von Dohlen et al 2006) The 464 Mb draft
genome assembly of the pea aphid together with the genomes of its dependant bacterial
symbionts (Shigenobu et al 2000 Degnan et al 2009 2010) offers important information
that will enable researchers to discover the genetic basis of co-evolved symbiotic
associations of host plant specialization of insect-plant interactions and of the
developmental causes of extreme phenotypic plasticity
The International Aphid Genomics Consortium (2010) discovered that there was a major
gene duplication in the pea aphid genome that seemed to come from the time around the
origin of aphids They also revealed that the pea aphid genome has more coding genes
than any previously sequenced insects with the high gene number being an indication of
Stellenbosch University httpsscholarsunacza
Chapter 2
27
both extensive duplication as well as the presence of genes with no orthologs in other
insects There are more than 2000 gene families (for example chromatin modification
miRNA synthesis and sugar transport) expanded in the aphid lineage relative to other
published genomes (The International Aphid Genomics Consortium 2010)
Recently the genome sequence of the RWA (GCA_0011863851) was published for the
first time by Nickolson et al (2015) The assembled genomic scaffolds cover 393 Mb
which is equal to 93 of its estimated 421 Mb genome and contained 19097 genes The
authors determined that the RWA has the most AT-rich insect genome that have been
sequenced to date reaching 709 with a bimodal CpG distribution and a whole set of
methylation related genes Nickolson et al (2015) determined that the genome of the
RWA has a prevalent general reduction in the number of genes per ortholog group which
include defensive detoxification chemosensory and sugar transporter groups when
compared to the pea aphid genome as well as a 65 decrease in chemoreceptor genes
Thirty of 34 known RWA salivary genes were found in the genome assembly that
exhibited less homology with the salivary genes commonly expressed in insect saliva
including glucose dehydrogenase and trehalase However greater conservation was
displayed among genes that are expressed in RWA saliva but which is not detected in
the saliva of other insects Genes that are involved in insecticide activity and
endosymbiont-derived genes were also discovered in the assembly along with genes
involved in virus transmission even though RWA is not a viral vector (Nickolson et al
2015)
The mitochondrial genomes of insects are closed double stranded and circular Their
sizes range between 13-20 kb while their gene content is well conserved and they have
a low rearrangement rate These features make mitochondrial genomes of insects a very
valuable tool to study deep divergences and molecular evolution (Hu et al 2009) The
insect mitochondrial genome characteristically encodes 37 genes that include 13 protein-
Stellenbosch University httpsscholarsunacza
Chapter 2
28
coding genes 2 ribosomal RNA and 22 transfer RNA The whole insect mitochondrial
genome is compactly arranged with very limited intergenic nucleotides overlapping
neighboring genes and no introns (Chai et al 2012) Furthermore the gene order of
mitochondria in aphids psylids and many whiteflies is known to resemble the projected
Insecta ancestral gene order with a mitochondrial sequence divergence of only 131
for aphids which is significantly less than that of psylids and whiteflies (Baumann et al
2004)
Nucleotide diversity in aphid mitochondrial genomes has been extensively studied even
though only three genomes are currently available which includes the RWA The
complete RWA mitochondrial genome is 15721 bp long and is comprised of 38 genes
which is characteristic within most insects These 38 genes consist of 20 different transfer
RNA genes 13 protein-coding genes and 2 ribosomal genes (De Jager et al 2014) The
mitochondrial genome size of the RWA falls in the range of animal mitochondrial genomes
(~16000 bp) and corresponds to that of the ancestral aphid species (Crozier and Crozier
1993)
26 Single-chromosome analysis
Genomes may be large and complex because of a high content of repetitive and
duplicated sequences or as a result of ploidy Even though it is not a problem to fingerprint
the large numbers of clones necessary to create a physical map (Luo et al 2003) and to
sequence billions of DNA bases (Metzker 2010) the problem is to assemble the large
number of fingerprints and short reads into an unambiguous order that correctly
represents the genome (Wei et al 2009 Alkan et al 2011 Treangen and Salzberg 2012)
These factors hinder the construction of clone-based physical maps positional gene
cloning and de novo genome sequencing One solution is to reduce the sample
complexity by dissecting the genomes to single chromosomes Another area which will
Stellenbosch University httpsscholarsunacza
Chapter 2
29
benefit from the analysis at single-chromosome level is the assembly of haplotype-
resolved genome sequences (Yang et al 2011)
Most of the cells in an organism contain chromosomes that are at interphase Their nuclei
consist of decondensed chromosomes that make it impossible to separate from one
another Separation is only possible when chromosomes are more condensed during the
metaphase stage of cell devision (Doležel et al 2012)
The utility of isolated separated chromosome fractions is determined by their purity and
quality of DNA Purity depends on the degree to which the chromosome of interest can
be resolved from other chromosomes chromosome clumps chromatids and
chromosome fragments in the sample (Doležel et al 2012) Currently different methods
of chromosome isolation exist which include the following micromanipulation gradient
centrifugation magnetic chromosome separation flow cytometry etc
261 MicromanipulationMicrodissection
Initial isolations of single chromosomes from spreads of metaphase chromosomes of
dividing cells made use of a micromanipulator (Chambers and Sands 1923 Barigozzi
1939 Scalenghe et al 1981 Schondelmaier et al 1993) This device is used to physically
interact with a sample under a microscope where a level of precision of movement is
required that simply cannot be achieved by the unaided human hand Originally the
process of microdissection involved isolating the chromosome by using glass
microneedles which was a technically challenging task (Scalenghe et al 1981) The
introduction of laser microbeams in microdissection (Monajembashi et al 1986) improved
the isolation procedure however it still involved the use of the glass microneedles to
collect the chromosome isolated via the laser (Zhou and Hu 2007) More recently the
PALMreg Robot-Microbeam system was introduced that uses a laser to cut chromosomes
from microscope slides as well as to catapult fragments into a collection tube (Olofsson
Stellenbosch University httpsscholarsunacza
Chapter 2
30
et al 2012) This resulted in the negation of the glass needles and improvement of
accuracy One of the most prominent advantages of this technique is that the individual
operating the micromanipulator can clearly identify the chromosomes to be isolated A
disadvantage is that only a few chromosomes can be collected or isolated at a time
(Hobza and Vyskot 2007) which affects the quality of the chromosomal DNA making it
only suitable for basic types of analysis (Ma et al 2010) Ultimately microdissection
cannot meet the requirements for sequencing complete chromosomes because of low
coverage The latest developments in the area of isolating chromosomes through
micromanipulation include the atomic force microscope nanolithography that makes the
dissectionextraction of fragments as small as 04 microm possible (Di Bucchianico et al
2011)
262 Gradient centrifugation
Another method that is presented to isolate chromosomes in large numbers is by making
use of relative density by gradient centrifugation Chromosomes are obtained from
populations of dividing cells in an aqueous suspension This method however only allows
the large and small chromosomes to be separated from one another and is therefore not
a viable option to isolate selected chromosomes within these fractions (Stubblefield and
Oro 1982)
263 Magnetic chromosome separation
Magnetic sorting is a method that is used to separate cells cell organelles and
microorganisms (Molday et al 1977 Owen 1983) The process of magnetic sorting entails
an affinity couple usually an antibody that is covalently bound or physically absorbed to
magnetic microspheres Ugelstad et al (1988) designed polysterene magnetic
microspheres or beads for this purpose Magnetic beads contain iron oxide (Fe3O4) (Lea
et al 1985 Howell et al 1988) and by binding the chromosome of interest to these beads
Stellenbosch University httpsscholarsunacza
Chapter 2
31
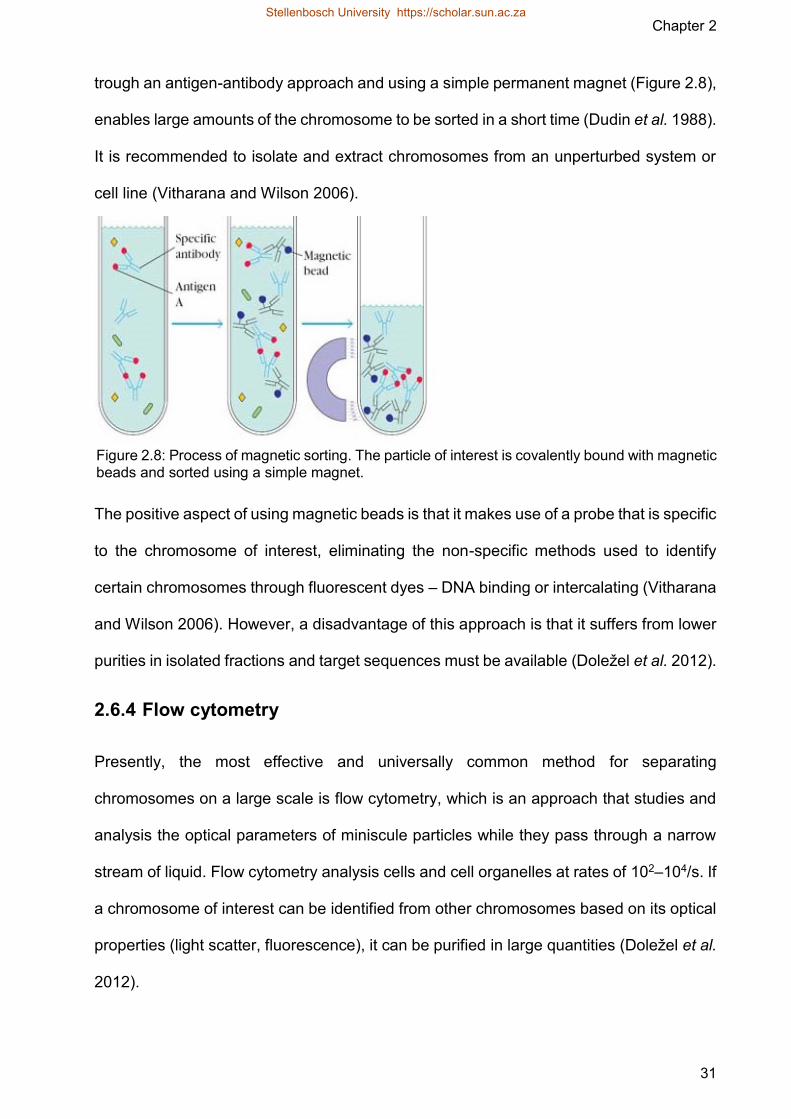
trough an antigen-antibody approach and using a simple permanent magnet (Figure 28)
enables large amounts of the chromosome to be sorted in a short time (Dudin et al 1988)
It is recommended to isolate and extract chromosomes from an unperturbed system or
cell line (Vitharana and Wilson 2006)
The positive aspect of using magnetic beads is that it makes use of a probe that is specific
to the chromosome of interest eliminating the non-specific methods used to identify
certain chromosomes through fluorescent dyes ndash DNA binding or intercalating (Vitharana
and Wilson 2006) However a disadvantage of this approach is that it suffers from lower
purities in isolated fractions and target sequences must be available (Doležel et al 2012)
264 Flow cytometry
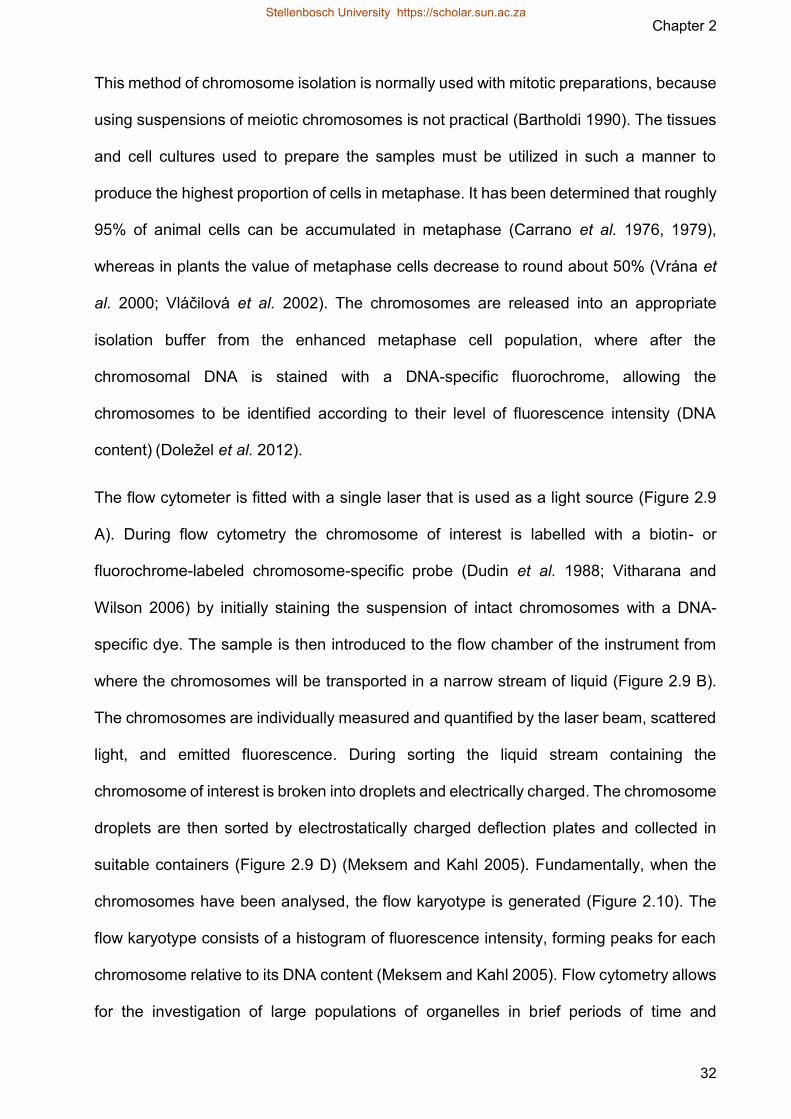
Presently the most effective and universally common method for separating
chromosomes on a large scale is flow cytometry which is an approach that studies and
analysis the optical parameters of miniscule particles while they pass through a narrow
stream of liquid Flow cytometry analysis cells and cell organelles at rates of 102ndash104s If
a chromosome of interest can be identified from other chromosomes based on its optical
properties (light scatter fluorescence) it can be purified in large quantities (Doležel et al
2012)
Figure 28 Process of magnetic sorting The particle of interest is covalently bound with magnetic beads and sorted using a simple magnet
a b c
Stellenbosch University httpsscholarsunacza
Chapter 2
32
This method of chromosome isolation is normally used with mitotic preparations because
using suspensions of meiotic chromosomes is not practical (Bartholdi 1990) The tissues
and cell cultures used to prepare the samples must be utilized in such a manner to
produce the highest proportion of cells in metaphase It has been determined that roughly
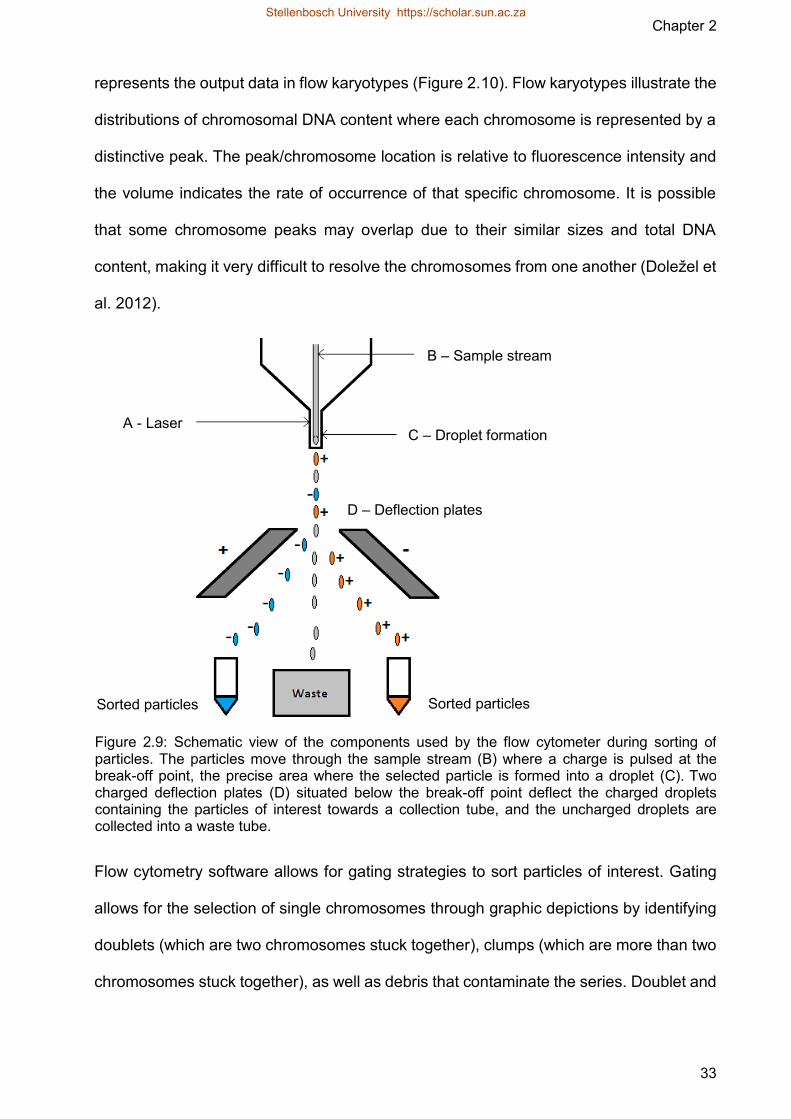
95 of animal cells can be accumulated in metaphase (Carrano et al 1976 1979)
whereas in plants the value of metaphase cells decrease to round about 50 (Vraacutena et
al 2000 Vlaacutečilovaacute et al 2002) The chromosomes are released into an appropriate
isolation buffer from the enhanced metaphase cell population where after the
chromosomal DNA is stained with a DNA-specific fluorochrome allowing the
chromosomes to be identified according to their level of fluorescence intensity (DNA
content) (Doležel et al 2012)
The flow cytometer is fitted with a single laser that is used as a light source (Figure 29
A) During flow cytometry the chromosome of interest is labelled with a biotin- or
fluorochrome-labeled chromosome-specific probe (Dudin et al 1988 Vitharana and
Wilson 2006) by initially staining the suspension of intact chromosomes with a DNA-
specific dye The sample is then introduced to the flow chamber of the instrument from
where the chromosomes will be transported in a narrow stream of liquid (Figure 29 B)
The chromosomes are individually measured and quantified by the laser beam scattered
light and emitted fluorescence During sorting the liquid stream containing the
chromosome of interest is broken into droplets and electrically charged The chromosome
droplets are then sorted by electrostatically charged deflection plates and collected in
suitable containers (Figure 29 D) (Meksem and Kahl 2005) Fundamentally when the
chromosomes have been analysed the flow karyotype is generated (Figure 210) The
flow karyotype consists of a histogram of fluorescence intensity forming peaks for each
chromosome relative to its DNA content (Meksem and Kahl 2005) Flow cytometry allows
for the investigation of large populations of organelles in brief periods of time and
Stellenbosch University httpsscholarsunacza
Chapter 2
33
represents the output data in flow karyotypes (Figure 210) Flow karyotypes illustrate the
distributions of chromosomal DNA content where each chromosome is represented by a
distinctive peak The peakchromosome location is relative to fluorescence intensity and
the volume indicates the rate of occurrence of that specific chromosome It is possible
that some chromosome peaks may overlap due to their similar sizes and total DNA
content making it very difficult to resolve the chromosomes from one another (Doležel et
al 2012)
Flow cytometry software allows for gating strategies to sort particles of interest Gating
allows for the selection of single chromosomes through graphic depictions by identifying
doublets (which are two chromosomes stuck together) clumps (which are more than two
chromosomes stuck together) as well as debris that contaminate the series Doublet and
A - Laser C ndash Droplet formation
B ndash Sample stream
Sorted particles Sorted particles
D ndash Deflection plates
Figure 29 Schematic view of the components used by the flow cytometer during sorting of particles The particles move through the sample stream (B) where a charge is pulsed at the break-off point the precise area where the selected particle is formed into a droplet (C) Two charged deflection plates (D) situated below the break-off point deflect the charged droplets containing the particles of interest towards a collection tube and the uncharged droplets are collected into a waste tube
Stellenbosch University httpsscholarsunacza
Chapter 2
34
clump discrimination are very important to prevent any chromosomes that are not of
interest from passing through to sample collection (Kron and Husband 2015)
27 Sequencing
271 Sequencing platforms
Frederick Sanger and his associates developed the first method of determining the exact
sequence of single stranded DNA molecules in 1977 The method became known as
Sanger sequencing and is based on the selective incorporation of chain terminating
labelled dideoxynucleotides by DNA polymerase during in vitro amplification (Sanger et
al 1977) In 2005 next generation sequencing (NGS) technologies were introduced and
have since transformed genomic research The development of NGS technologies were
catalysed by the great demand for revolutionary methods that deliver rapid low-cost and
accurate genome information The inexpensive production of large volumes of sequence
data - in some cases in excess of one billion short reads per instrument run - is the primary
advantage over conventional methods (Metzker 2010) NGS methods overcome the
limited scalability of traditional Sanger sequencing by either creating micro-reactors
andor attaching the DNA molecules to be sequenced to solid surfaces or beads allowing
for millions of sequencing reactions to happen in parallel (Reis-Filho 2009)
Figure 210 Example of a flow karyotype generated during flow sorting The peaks represent the positive datasets In this case the chromosomes of interest
Stellenbosch University httpsscholarsunacza
Chapter 2
35
There is a wide selection of different major NGS technologies such as Rochersquos 454
pyrosequencing Illuminarsquos MiSeqHiSeqNextSeq Applied Biosystemsrsquo SOLiD Ion
Torrentrsquos PGM and the PacBio system (Table 21) These NGS platforms are different in
many ways including read length and the number of DNA molecules they sequence in
parallel Traditional Sanger sequencing machines analyse terminally labelled DNA
strands and can read about 800 bases of 100 DNA molecules at the same time The NGS
platforms however read numerous DNAs in parallel but have smaller read lengths For
instance 454rsquos machine reads 400000 DNAs that are each about 250 bases in length
Illuminarsquos MiSeq can produce paired-end reads that are 300 bases in length each while
the platform with the greatest output overall is the HiSeq 2500 generating 4 billion
fragments in a paired-end approach with 125 bases for each read in a single run Illumina
has also developed the HiSeq X Ten which is an array of 10 HiSeq machines sold as a
unit for higher throughput than ever achieved in the past (Hodkinson and Grace 2015)
NGS platforms also differ in cost per base the 454 machine sequences are about ten
times cheaper than traditional Sanger technology and Illumina and ABI are 100 times
cheaper (Von Bubnoff 2008) All of these technologies have different advantages and
disadvantages (Table 21)
Chen et al (2008 2010) suggested that NGS of chromosomes provide a well-designed
approach toward identifying the chromosome composition as well as to map
chromosomal breakpoints with an error margin of less than 1000 bp Sudbery et al
(2009) determined with studies on mice that sequencing entire chromosomes permits the
generation of condensed maps of genetic variation between diverse genotypes They
also confirmed that it is a powerful tactic to discover single nucleotide polymorphisms
(SNPs) to derive high resolution images of quantitative trait locus (QTL) regions
Stellenbosch University httpsscholarsunacza
Table 21 Advantages and disadvantages of various NGS platforms (Van Dijk et al 2014)
NGS Platform Advantages Disadvantages
Rochersquos 454
The long reads (1 kb maximum) are easier to map to a reference genome and are an advantage for de novo genome assemblies or for metagenomics applications
Relatively low throughput (about 1 million reads 700 Mb sequence data) and high reagent cost
High error rates in homo-polymer repeats
Run times are relatively fast (23h) Roche announced that it will discontinue 454 and stop supporting the platform in 2016
Illuminarsquos MiSeqHiSeq
Most library preparation protocols are compatible with the Illumina system
Overloading results in overlapping clusters and poor sequence quality
Illumina offers the highest throughput of all platforms and the lowest per-base cost
Sequence complexity - low-complexity samples such as 16S metagenomics libraries must be diluted or mixed with a reference PhiX library to generate diversity
Read lengths of up to 300 bp compatible with almost all types of application
Sample loading is technically challenging
ABIrsquos SOLiD
Second (after Illumina) highest throughput system on the market
Shortest reads (75 nt maximum) of all platforms and relatively long run times
The SOLiD system is widely claimed to have lower error rates 9994 accuracy than most other systems owing to the fact that each base is read twice
Less-well-suited for de novo genome assembly
The SOLiD system is much less widely used than the Illumina system and the panel of sample preparation kits and services is less developed
Ion Torrentrsquos PGM
Semi-conductor technology no requirement for optical scanning and fluorescent nucleotides
This technology suffers from the same issue as 454 with high error rates in homopolymers
Fast run times and a broad range of applications
PacBio system
Extremely long reads of 20 kb and even longer make this technology an ideal tool to finish genome assemblies or to improve existing draft genomes Run times are fast (typically a few hours)
High cost $2ndash17 per Mb high overall error rates (14)
Lowest throughput of all platforms (maximum 500 Mb)
Limited range of applications
Stellenbosch University httpsscholarsunacza
Stellenbosch University httpsscholarsunacza
Chapter 2
37
272 Next generation sequencing (NGS) analysis
Sequencing the chromosomes of organisms with available reference genomes is a fast
approach to study variation at DNA level Single chromosome sequencing not only
decreases cost but it also simplifies data analysis compared to whole genome
sequencing (Doležel et al 2012)
The advent of NGS technologies is accompanied by the development of many whole-
genome sequence assembly methods and software especially for de novo fragment
assembly Selecting a suitable assembler becomes a tough task as computational time
access to maximum random access memory (RAM) assembly accuracy and integrity
should be considered (Zhang et al 2011)
Pevzner and Tang (2001) as well as Pevzner et al (2001) pioneered short read assembly
that is based on de Bruijn graphs (Table 22) Other methods beside the de Bruijn graph-
based method include prefix tree-based approaches (Warren et al 2007) plus overlap-
layout-consensus approaches (Hernandez et al 2008) The genome size as well as the
sequencing error rate both have an impact on the speed at which these programs function
(Li and Durbin 2009)
Alignment-based methods were often used as a substitute when data volume produced
by larger eukaryotic genomes became an obstructing factor Therefore Simpson et al
(2009) developed assemblers that ran the task in parallel which increased the memory
for assembly and consequently permitted the use of much larger data sets An alternative
method to construct functional sequence scaffolds from shorter reads is to make use of
alignment-based approaches and comparisons to known reference genomes The
Burrows-Wheeler transform (BWT) algorithms (Table 22) have demonstrated to be very
effective by means of collapsing exact reads together and not aligning reads against
simpler copies (Li and Durbin 2009)
Stellenbosch University httpsscholarsunacza
Chapter 2
38
The k-mer is a very important parameter in sequence data analysis The k-mer is defined
as a short DNA sequence consisting of a fixed number (K) of bases In other words it
refers to all the possible substrings of length k that are contained in a string (S)
Detemining k-mer occurrence in numbers is known as k-mer counting K-mer counting
is essential because various genome assemblers use this parameter to identify overlaps
in sequence and a genome size estimation can be made with the k-mer count statistics
(Marccedilais and Kingsford 2011) The likelihood of sequencing errors are assessed by using
k-mer frequencies (Kelley et al 2010) These frequencies are also used to identify
candidate regions in de novo repeat annotation (Campagna et al 2004 Healy et al
2003) KmerGenie (Chikhi and Medvedev 2014) and Jellyfish (Marccedilais and Kingsford
2011) are two of the more popular k-mer counting algorithms
Several strategies are available to estimate the genes present in a sequencing data set
Genes have long been regarded as discrete entities located linearly along chromosomes
but recent investigations have demonstrated extensive transcriptional overlap between
different genes (Denoeud et al 2007) An experimental approach is described by Vossen
et al (2013) in which degenerate primers are designed for specific motifs associated with
for instance resistance genes This method of profiling permits gene candidates to be
amplified as well as either analysed on a gel cut out and sequenced Alternatively NGS
platforms can be used to directly sequence the polymerase chain reaction (PCR)
products Another approach allows protein coding genes (PGS) to be explored using
software packages like FunCat (Functional Catalogue) that classify proteins from whole
genome data (Ruepp et al 2004) or Gene Ontology (GO) (Ashburner et al 2000) The
vast majority of the biology of a newly sequenced genome is inferred from the set of
encoded proteins Predicting the gene set is therefore invariably the first step that is taken
after the genome sequence has been determined (Harrow et al 2009)
Stellenbosch University httpsscholarsunacza
Chapter 2
39
There are also numerous sequencing studies that prefer to use manual data mining
implementing BLAST algorithms to compare genome sequence data to known genes in
databases such as Ensembl (httpensemblgenomesorg Thole et al 2012) SwissProt
(Vitulo et al 2011) and GenBank UniGene (Vitulo et al 2011)
Table 22 Methods for alignment assembly and annotation
Objective Approach Software Reference
de novo contig assembly de Bruijn graphs SOAPdenovo Luo et al 2012
Velvet Zerbino and Berney 2008
Similarity searches and assigning gene ontology
Local alignment geno ontology
BLAST Altschul et al 1997
FASTA Pearson and Lipman 1988
Alignment of larger scale sequence comparisons
Burrows-Wheeler transform (BWT)
BWA Li and Durbin 2009
Bowtie Langmead et al 2009
In the present study the following NGS platform and software will be used to assemble
and characterise the X chromosome of the RWA Illuminareg HiSeqtrade platform as well as
BWA - KmerGenie - SOAPdenovo - and BLAST software
Stellenbosch University httpsscholarsunacza
Chapter 2
40
28 List of references
Adams M D S E Celniker R A Holt C A Evans J D Gocayne et al 2000 The
genome sequence of Drosophila melanogaster Science 287 2185-2195
Alkan C S Sajjadian and E E Eichler 2011 Limitations of next generation genome
sequence assembly Nature Methods 8 61-65
Altschul S F T L Madden A A Schaumlffer J Zhang Z Zhang et al 1997 Gapped
BLAST and PSI-BLAST a new generation of protein database search programs
Nucleic Acids Research 25 3389-3402
Ashburner M C A Ball J A Blake D Botstein H Butler et al 2000 Gene ontology
tool for the unification of biology Nature Genetics 25 25-29
Bailey A D Chandler W P Grant J Greaves G Prince et al 2010 Pests of crops
Biopesticides pest management and regulation 19-70
Barigozzi C 1939 Experiments with microdissection of the chromosome of the salivary
glands of Chironomus sp Archiv Exp Zellforsch 22 190-194
Bartholdi M F J D Parson K A Albright and L S Cram 1990 System for flow sorting
chromosomes on the basis of pulse shape Cytometry 11 165-172
Baumann P L Baumann and M L Thao 2004 Organization of the mitochondrial
genomes of whiteflies aphids and psylids (Hemiptera Sternorrhyncha) BMS
Evolutionary Biology 4 25
Becerra J X 2007 The impact of herbivore-plant coevolution on plant community
structure Proceedings of the National Academy of Sciences 104 7483-7488
Blackman R L and H Takada 1976 Naturally occurring chromosomal translocation in
Myzus persicae (Sulzer) Journal of Entomology 50 147-156
Stellenbosch University httpsscholarsunacza
Chapter 2
41
Blackman R L and D F Hales 1986 Behaviour of the X chromosomes during growth
and maturation of parthenogenetic eggs of Amphorophora tuberculata
(Homoptera Aphididae) in relation to sex determination Chromosoma 94 59-64
Blackman R L 1987 Reproduction cytogenetics and development In A K Minsk and
P Harrewijn (eds) Aphids their biology natural enemies and control 2 163-195
Blackman R L P A Brown C C Ramfrez and H M Niemeyer 2003 Karyotype
variation in the South American aphid genus Neuquenaphis (Hemiptera
Aphididae Neuquenaphidinae) Hereditas 138 6-10
Botha A M Y Li and N L V Lapitan 2005 Cereal host interactions with Russian wheat
aphid A review Journal of Plant Interactions 1 211-222
Botha A M L van Eck C S Jackson N F V Burger and T Schultz 2011 Phloem
feeding insect stress and photosynthetic gene expression Applied
Photosynthesis Online at httpwwwintechopencombooksapplied-photosynthe
sisphloem-feeding-insect-stress-and-photosynthetic-gene-expression
Hodkinson B P and E A Grace 2015 Next-Generation Sequencing A review of
technologies and tools for wound microbiome research Advances in Wound Care
4 50-58
Burd J D D R Porter G J Puterka S D Haley and F B Pears 2006 Biotypic
variation among North American Russian wheat aphid (Homoptera Aphididae)
populations Journal of Economic Entomology 99 1862-1866
Caillaud M C M Boutin C Braendle and J C Simon 2002 A sex-linked locus controls
wing polymorphism in males of the pea aphid Acyrthosiphon pisum (Harris)
Heredity 89 346-352
Stellenbosch University httpsscholarsunacza
Chapter 2
42
Campagna D C Romualdi N Vitulo M Del Favero M Lexa et al 2004 RAP a new
computer program for de novo identification of repeated sequences in whole
genomes Bioinformatics 21 582-588
Carrano A V J W Gray D H Moore J L Minkler B H Mayall et al 1976
Purification of the chromosomes of the Indian muntjac by flow sorting Journal of
Histochemistry and Cytochemistry 24 348-354
Carrano A V J W Gray R G Langlios K J Burkhart-Schultz and M A van Dilla
1979 Measurement and purification of human chromosomes by flow cytometry and
sorting Proceedings of the National Academy of Sciences 76 1382-1384
Carver B F 2009 Wheat science and trade The Journal of Agricultural Science 148
736-737
Chai H N Y Z Du and B P Zhai 2012 Characterisation of the complete mitochondrial
genome of Cnaphalocrocis medinalis and Chilo suppressalis (Lepidoptera
Pyralidae) International Journal of Biological Sciences 8 561-579
Chambers R and C Sands 1923 A dissection of the chromosomes in the pollen mother
cells of Tradescantia virginiana The Journal of General Physiology 5 815-821
Chen W V Kalscheuer A Tzschach C Menzel R Ullmann et al 2008 Mapping
translocation breakpoints by next generation sequencing Genome Research 18
1143-1149
Chen W R Ullmann C Langnick C Menzel Z Wotschofsky et al 2010 Breakpoint
analysis of balanced chromosome rearrangements by next generation paired-end
sequencing European Journal of Human Genetics 18 539-543
Chikhi R and P Medvedev 2014 Informed and automated k-mer size selection for
genome assembly Bioinformatics 30 31-37
Stellenbosch University httpsscholarsunacza
Chapter 2
43
Cilliers P R V L Tolmay and H A van Niekerk 1992 Kleingraansentrum stuur
Russiese luis planke (Afrikaans) Wheat Focus 10 7
Crozier R H and Y C Crozier 1993 The mitochondrial genome of the honeybee Apis
mellifera Complete sequence and genome organization Genetics 133 97-117
Degnan P H Y Yu N Sisneros R A Wing and N A Moran 2009 Hamiltonella
defensa genome evolution of a protective bacterial endosymbiont from pathogenic
ancestors Proceedings of the National Academy of Sciences 106 9063-9068
Degnan P H T E Leonardo B Cass B Hurwitz S Richards et al 2010 Dynamics
of genome evolution in faculatitve symbionts of aphids Environmental
Microbiology 12 2060-2069
De Jager L N F V Burger and A M Botha 2014 Complete mitochondrial genome of
Diuraphis noxia (Hemiptera Aphididae) from nine populations SNP variation
between populations and comparison with other Aphididae species African
Entomology 22 847-862
Denoeud F P Kapranov C Ucla A Frankish R Castelo et al 2007 Prominent use
of distal 5 transcription start sites and discovery of a large number of additional
exons in ENCODE regions Genome Research 17 746-759
Di Bucchianico S A M Poma M F Giardi L Di Leandro F Valle et al 2011 Atomic
force microscope nanolithography on chromosomes to generate single-cell genetic
probes Journal of Nanobiotechnology 9 27-33
Dilbirligi M M Erayman D Sandhu D Sidhu and K S Gill 2004 Identification of wheat
chromosomal regions containing expressed resistance genes Genetics 166 461-
481
Stellenbosch University httpsscholarsunacza
Chapter 2
44
Dogimont C A Bendahmane V Chovelon and N Boissot 2010 Host plant resistance
to aphids in cultivated crops genetic and molecular bases and interaction with
aphid populations Comptes Rendus Biologies 333 566-573
Doležel J J Vraacutena J Šafaacuteř J Bartoš M Kubalaacutekovaacute et al 2012 Chromosomes in
the flow to simplify genome analysis Functional and Integrative Genomics 12
397-416
Dudin G E W Steegmayer P Vogt H Schnitzer E Diaz et al 1988 Sorting of
chromosomes by magnetic separation Human Genetics 80 111-116
Du Toit F 1987 Resistance in wheat (Triticum aestivum) to Diuraphis noxia (Homoptera
Aphididae) Cereal Research Communications 15 175-179
Du Toit F 1988 Another source of Russian wheat aphid (Diuraphis noxia) resistance in
Triticum aestivum Cereal Research Communications 16 105-106
Du Toit F 1989 Components of resistance in three bread wheat lines to Russian wheat
aphid (Homoptera Aphididae) in South Africa Journal of Economic Entomology
82 1779-1781
Duveiller E R P Singh and J M Nicol 2007 The challenges of maintaining wheat
productivity pests diseases and potential epidemics Euphytica 157 417-430
Edwards O R 2001 Interspecific and intraspecific variation in the performance of three
pest aphid species on five grain legume hosts Entomologia Experimentalis et
Applicata 100 21-30
Elliott N M Mirik Z Yang T Dvorak M Rao et al 2007 Airborne multi-spectral remote
sensing of Russian wheat aphid injury to wheat Southwestern Entomologist 32
213-219
Stellenbosch University httpsscholarsunacza
Chapter 2
45
Fazel-Najafabadi M J Peng F B Peairs H Simkova A Killian et al 2015 Genetic
mapping of resistance to Diuraphis noxia (Kurdjumov) biotype 2 in wheat (Triticum
aestivum L) accession CI2401 Euphytica 203 607-614
Gill B S R Appels A M Botha-Oberholster C R Buell J L Bennetzen et al 2004
A workshop report on wheat genome sequencing International Genome Research
on Wheat Consortium Genetics 168 1087-1096
Giordanengo P L Brunissen C Rusterucci C Vincent A Van Bel et al 2010
Compatible plant-aphid interaction how aphids manipulate plant responses
Comptes Rendus Biologies 333 516-523
Goggin F L 2007 Plant-aphid interactions molecular and ecological perspectives
Current Opinion in Plant Biology 10 399-408
Haley S D F B Peairs C B Walker J B Rudolph and T L Randolph 2004
Occurrence of a new Russian wheat aphid biotype in Colorado Crop Science 44
1589-1592
Hammon-Kosack K E and J D G Jones 1996 Resistance gene-dependent plant
defence responses American Society of Plant Physiologists 8 1773-1791
Hanrahan S J and J S Johnston 2001 New genome size estimates of 134 species of
arthropods Chromosome Research 19 809-823
Harrow J A Nagy A Reymond T Aliota L Patthy et al 2009 Identifying protein-
coding genes in genomic sequences Genome Biology 10 201
Harvey T L and T J Martin 1990 Resistance to Russian wheat aphid Diuraphis noxia
in wheat (Triticum aestivum) Cereal Research Communications 18 127- 129
Healy J E E Thomas J T Schwartz and M Wigler 2003 Annotating large genomes
with exact word matches Genome Research 13 2306-2315
Stellenbosch University httpsscholarsunacza
Chapter 2
46
Hernandez D P Francois L Farinelli M Osteras and J Schrenzel 2008 De novo
bacterial genome sequencing millions of very short reads assembled on a desktop
computer Genome Research 18 802-809
Heslop-Harrison J S and T Schwarzacher 2011 Organisation of the plant genome in
chromosomes Plant Journal 66 18-33
Hobza R and B Vyskot 2007 Laser microdissection-based analysis of plant sex
chromosomes Methods in Cell Biology 82 433-453
Hodgson E and J Karren 2008 Russian Wheat Aphid Online at httpextension
usuedufilespublicationsfactsheetrussian-wheat-aphids08pdf
Howe G A and G Jander 2008 Plant immunity to insect herbivores Annual Review of
Plant Biology 59 41-66
Howell K E J Gruenberg A Ito and G E Palade 1988 Immuno-isolation of
subcellular components Progress in Clinical Biological Research 270 77-90
Hu Li G Jianyu L Hayiyu and C Wanzhi 2009 Progress in researches on insect
mitochondrial genome and analysis of gene order Reviews Science Foundation
in China 17 39-45
Jankielsohn A 2011 Distribution and diversity of Russian wheat aphid (Hemiptera
Aphididae) biotypes in South Africa and Lesotho Journal of Economic Entomology
104 1736-1741
Jankielsohn A 2014 The Russian wheat aphid Farmer Weekly 17 22-23
Jankielsohn A 2016 Changes in the Russian wheat aphid (Hemiptera Aphididae)
biotype complex in South Africa Journal of Economic Entomology 109 907-912
Stellenbosch University httpsscholarsunacza
Chapter 2
47
Jaquieacutery J S Stoeckel C Rispe L Mieuzet F Legeai et al 2012 Accelerated
evolution of sex chromosomes in aphids an XO system Molecular Biology and
Evolution 29 837-847
Jaquieacutery J C Rispe D Roze F Legeai G Le Trionnaire et al 2013 Masculinization
of the X chromosome in the pea aphid Plos Genetics 9 e1003690
Johnston J S K S Yoon J P Strycharz B R Pittendrigh and J M Clark 2007 Body
lice and head lice (Anoplura Pediculidae) have the smallest genomes of any
hemimetabolous insect reported to date Journal of Medical Entomology 44 1009-
1012
Jyoti J L J A Quershi J P Michaud and T J Martin 2006 Virulence of two Russian
wheat aphid biotypes to eight wheat cultivars at two temperatures Crop Science
46 774-780
Kelley D R M C Schatz and S L Salzberg 2010 Quake quality-aware detection and
correction of sequencing errors Genome Biology 11 116
Khan W U F Mohammed F U Khan F Z Zafar and G Ghuttai 2015 Correlation
studies among production traits in bread wheat under rainfed conditions
American-Eurasian Journal of Agricultural and Environmental Sciences 15 2059-
2063
Kron P and B C Husband 2015 Distinguishing 2N gamete nuclei from doublets in
pollen using flow cytometry and pulse analysis Cytometry Part A 87 943-957
Kindler S D N C Elliott K L Giles T A Royer R Fuentes-Granados et al 2002
Effect of Greenbugs (Homoptera Aphididae) on yield loss of winter wheat Journal
of Economic Entomology 95 89-95
Stellenbosch University httpsscholarsunacza
Chapter 2
48
Langmead B C Trapnell M Pop and S L Salzberg 2009 Ultrafast and memory-
efficient alignment of short DNA sequences to the human genome Genome
Biology 10 25
Lapitan N L V Y Li and A M Botha 2007 Fractional extracts of Russian wheat aphid
eliciting defense responses in wheat Journal of Economic Entomology 100 990-
999
Lea T F Vartdal C Davies and J Ugelstad 1985 Magnetic monosized polymer
particles for fast and specific fractionation of human mononuclear cells
Scandinavian Journal of Immunology 22 207-216
Li H and R Durbin 2009 Fast and accurate short read alignment with Burrows-Wheeler
transform Bioinformatics 25 1754-1760
Liu X M C M Smith B S Gill and V Tolmay 2001 Microsatellite markers linked to six
RWA resistance genes in wheat Theoretical and Applied Genetics 102 504-510
Luo MC C Thomas F M You J Hsiao O Y Shu et al 2003 High-throughput
fingerprinting of bacterial artificial chromosomes using the SNaPshot labeling kit
and sizing of restriction fragments by capillary electrophoresis Genomics 82 378-
389
Luo R B Liu Y Xie Z Li W Huang et al 2012 SOAPdenovo2 an empirically
improved memory-efficient short-read de novo assembler GigaScience 1 18
Ma L Y Xiao H Huang Q W Wang W N Rao et al 2010 Direct determination of
molecular haplotypes by chromosome microdissection Nature Methods 7 299-
301
Stellenbosch University httpsscholarsunacza
Chapter 2
49
Mandrioli M D Bizarro G C Manicardi D Gionghi L Bassoli et al 1999 Cytogenetic
and molecular characterisation of a highly repeated DNA sequence in the peach
potato aphid Myzus persicae Chromosoma 108 436-442
Marais G F and F Du Toit 1993 A monosomic analysis of Russian wheat aphid
resistance in the common wheat PI 292994 Plant Breeding 111 246-248
Marccedilais G C and Kingsford 2011 A fast lock-free approach for efficient parallel
counting of occurrences of k-mers Bioinformatics 27 764-770
Margueron R and D Reinberg 2010 Chromatin structure and the inheritance of
epigenetic information Nature Reviews Genetics 11 285-296
Meksem K and G Kahl 2005 The handbook of plant genome mapping Genetic and
Physical Mapping 151-171
Metzker M L 2010 Sequencing technologies - the next generation Nature Reviews
Genetics 11 31-46
Meyer J R 2007 A class of distinction Department of Entomology North Carolina State
University
Michaud J P and P E Sloderbeck 2005 Russian wheat aphid an introduced pest of
small grains in the high plains Kansas State University
Miles P W 1999 Aphid saliva Biological Reviews of the Cambridge Philosophical
Society 74 41-85
Mirik M J Ansley J Michels and N Elliott 2009 Grain and vegetative biomass
reduction by the Russian wheat aphid in winter wheat Southwestern Entomologist
34 131-157
Stellenbosch University httpsscholarsunacza
Chapter 2
50
Molday R S S P S Yen and A Rembaum 1977 Application of magnetic
microspheres in labelling and separation of cells Nature 268 437-438
Monajembashi S C Cremer T Cremer J Wolfrum and K O Greulich 1986
Microdissection of human chromosomes by a laser microbeam Expressive Cell
Research 167 262-265
Monti V M Mandriolo M Rivi and G C Manicardi 2012 The vanishing clone
karyotypic evidence for extensive intraclonal genetic variation in the peach potato
aphid Myzus persicae (Hemiptera Aphididae) Biological Journal of the Linnean
Society 105 350-358
Morrison W P and F B Peairs 1998 Response model concept and economic impact
In S S Quisenberry and F B Peairs (eds) Response model for an introduced
pest - Russian wheat aphid Entomological Society of America Lanham MD
Myers E W G G Sutton A L Delcher I M Dew D P Fasulo et al 2000 A whole-
genome assembly of Drosophila Science 287 2196-2204
Nickolson S J M L Nickerson M Dean Y Song P R Hoyt et al 2015 The genome
of Diuraphis noxia a global aphid pest of small grains BMC Genomics 16
doi 101186s12864-015-1525-1
Nkongolo K K J S Quick A E Limin and D B Fowler 1991a Sources and
inheritance of resistance to Russian wheat aphid in Triticum species amphiploids
and Triticum tauschii Canadian Journal of Plant Science 71 703-708
Nkongolo K K J S Quick F B Peairs and W I Meyer 1991b Inheritance of
resistance of PI 372129 wheat to the Russian wheat aphids Crop Science 31
905-907
Stellenbosch University httpsscholarsunacza
Chapter 2
51
Novotnaacute J J Havelka P Staryacute P Kouteckyacute and M Viacutetkovaacute 2011 Karyotype analysis
of the Russian wheat aphid Diuraphis noxia (Kurdjumov) (Hemiptera Aphididae)
reveals a large X chromosome with rRNA and histone gene families Genetica 139
281-289
Olofsson L A Lundgren and P E Brodelius 2012 Trichome isolation with and without
fixation using laser microdissection and pressure catapulting followed by RNA
amplification expression of genes of terpene metabolism in apical and sub-apical
trichome cells of Artemisia annua L Plant Science 183 9-13
Orlando E 1974 Sex determination in Megoura viciae Buckton (Homoptera Aphididae)
Monitore Zoologico Italiano 8 61-70
Owen C S 1983 Magnetic cell sorting Cell separation methods and selected
applications 5 127-144
Painter R H 1958 Resistance of plants to insects Annual Review of Entomology
Journal 3 267-290
Pearson W R and D J Lipman 1988 Improved tools for biological sequence
comparison Proceedings of the National Academy of Sciences 85 2444-2448
Peng J H Wang S D Haley F B Peairs and NLV Lapitan 2007 Molecular mapping
of the Russian wheat aphid resistance gene Dn2414 in wheat Crop Science 47
2418-2429
Peacuterez R F Panzera J Page J A Suja and J S Rufas 1997 Meiotic behaviour of
holocentric chromosomes orientation and segregation of autosomes in Triatoma
infestans (Heteroptera) Chromosome Research 5 47-56
Pevzner P A and H Tang 2001 Fragment assembly with double-barreled data
Bioinformatics 17 S225-S233
Stellenbosch University httpsscholarsunacza
Chapter 2
52
Pevzner P A H Tang and M S Waterman 2001 An Eulerian path approach to DNA
fragment assembly Proceedings of the National Academy of Sciences 98 9748-
9753
Pike K S D Allison L Boydston C O Qualset H E Vogt et al 1989 Suction trap
reveals 60 wheat aphid species including Russian wheat aphid California
Agriculture 43 22-24
Powell G C R Tosh and J Hardie 2006 Host plant selection by aphids behavioural
evolutionary and applied perspectives Annual Review of Entomology 51 309-
330
Puterka G J R W Hammon J D Burd F B Peairs T L Randolph et al 2012
Cyclical parthenogenetic reproduction in Russian Wheat Aphid (Hemiptera
Aphididae) in the United States Sexual reproduction and its outcome on biotypic
diversity Journal of Economic Entomology 105 1057-1068
Reis-Filho J S 2009 Next-generation sequencing Breast Cancer Research 11 1-7
Richardson S and S C Murali 2015 Best practices in insect genome sequencing what
works and what doesnrsquot Science Direct 7 1-7
Robinson J 1992 Russian wheat aphid A growing problem for small-grain farmers
Outlook on Agriculture 21 57-61
Ruepp A A Zollner D Maier K Albermann J Hani et al 2004 The FunCat a
functional annotation scheme for systematic classification of proteins from whole
genomes Nucleic Acids Research 32 5539-5545
Saidi A and J S Quick 1996 Inheritance and allelic relationships among Russian wheat
aphid resistance genes in winter wheat Crop Science 36 256-258
Stellenbosch University httpsscholarsunacza
Chapter 2
53
Sanger F S Nicklen A R and Coulson 1977 DNA sequencing with chain-terminating
inhibitors Proceedings of the National Academy of Science USA 74 5463-5467
Scalenghe F E Turco J E Ederstroumlm V Pirrotta and M Melli 1981 Microdissection
and cloning of DNA from a specific region of Drosophila melanogaster polytene
chromosomes Chromosoma 82 205-216
Schondelmaier J R Martin A Jahoor A Houben A Graner et al 1993
Microdissection and microcloning of the barley (Hordeum vulgare L) chromosome
1HS Theoretical and Applied Genetics 86 629-636
Schoonhoven L M J J A Van Loon and M Dicke 2005 Insect-Plant Biology Oxford
University Press UK
Schubert I P F Fransz J Fuchs and J H de Jong 2001 Chromosome painting in
plants Methods Cell Science 23 57-69
Shea G J Botha and D Hardie 2000 Russian wheat aphid (Diuraphis noxia) an exotic
threat to Western Australia GrainguardTM Initiative AGWEST
Shigenobu S H Watanabe M Hattori Y Sakaki and H Ishikawa 2000 Genome
sequence of the endocellular bacterial symbiont of aphids Buchnera sp APS
Nature 407 81-86
Simpson J T K Wong S D Jackman J E Schein S J M Jones and I Birol 2009
ABySS a parallel assembler for short read sequence data Genome Research 19
1117-1123
Smith C M T Belay C Stauffer P Stary I Kubeckova and S Starkey 2004
Identification of Russian wheat aphid (Homoptera Apididae) populations virulent
to the Dn4 resistance gene Journal of Economic Entomology 97 1112-1117
Stellenbosch University httpsscholarsunacza
Chapter 2
54
Stoetzel M B 1987 Information on and identification of Diuraphis noxia (Homoptera
Aphididae) and other aphid species colonizing leaves of wheat and barley in the
United States Journal of Economic Entomology 80 696-704
Stubblefield E and J Oro 1982 The isolation of specific chicken macro-chromosomes
by zonal centrifugation and flow sorting Cytometry 5 73-281
Sudbery I J Stalker J T Simpson T Keane A G Rust et al 2009 Deep short-read
sequencing of chromosome 17 from the mouse strains AJ and CASTEi identifies
significant germline variation and candidate genes that regulate liver triglyceride
levels Genome Biology 10 112
Swanevelder Z H A K J Surridge E Venter and A M Botha 2010 Limited
endosymbiont variation in Diuraphis noxia (HemipteraAphididae) biotypes from
the United States and South Africa Journal of Economic Entomology 103 887-
897
Tagu D J P Klingler A Moya and J C Simon 2008 Early progress in aphid genomics
and consequences for plant-aphid interactions studies Molecular Plant-Microbe
Interactions 21 701-708
The International Aphid Genomics Consortium 2010 Genome sequence of the pea aphid
Acyrthosiphon pisum PLoS Biology 8 e1000313
Thole V A Peraldi B Worland P Nicholson J H Doonan and P Vain 2012 T-DNA
mutagenesis in Brachypodium distachyon Journal of Experimental Botany 63
567-576
Tjallingii W F and T H Esch 1993 Fine structure of aphid stylet routes in plant tissues
in correlation with EPG signals Physiological Entomology 18 317-328
Stellenbosch University httpsscholarsunacza
Chapter 2
55
Tjallingi W F 2006 Salivary secretions by aphids interacting with proteins of phloem
wound responses Journal of Experimental Botany 57 739-745
Tolmay V L R C Lindeque and G J Prinsloo 2007 Preliminary evidence of a
resistance-breaking biotype of the Russian wheat aphid Diuraphis noxia
(Kurdjumov) (Homoptera Aphididae) in South Africa African Entomoly 15 228-
230
Treangen T J and S L Salzberg 2012 Repetitive DNA and next-generation
sequencing computational challenges and solutions Nature Reviews Genetics
13 36-46
Ugelstad J A Berge T Ellingsen O Aune L Kilaas et al 1988 Monosized magnetic
particles and their use in selective cell separation Macromolecular Chemistry 17
177-211
Valdez V A P E Byrnea N L V Lapitan F B Peairs A Bernardoc et al 2012
Inheritance and genetic mapping of Russian wheat aphid resistance in Iranian
wheat landrace accession PI 626580 Crop Science 52 676-682
Van Dijk E L H Auger Y Jaszczyszyn and C Thermes 2014 Ten years of next
generation sequencing technology Trends in Genetics 30 418-426
Van Emden H F and R Harrington 2007 Aphids as crop pests doi
10107997808519981900000
Vitharana S N and G S Wilson 2006 Fractionation of chromosome 15 with an affinity-
based approach using magnetic beads Genomics 87 158-164
Vitulo N A Albiero C Forcato D Campagna F Dal Pero et al 2011 First survey of
the wheat chromosome 5A composition through a next generation sequencing
approach PloS ONE 6 26421
Stellenbosch University httpsscholarsunacza
Chapter 2
56
Vlaacutečilovaacute K D Ohri J Vraacutena J Čiacutehaliacutekovaacute M Kubalaacutekovaacute et al 2002 Development
of flow cytogenetics and physical genome mapping in chickpea (Cicer arietinum
L) Chromosome Research 10 695-706
Von Bubnoff A 2008 Next-generation sequencing The race is on Cell 132 721-723
Von Dohlen C D C A Rowe and O E Heie 2006 A test of morphological hypotheses
for tribal and subtribal relationships of Aphidinae (Insecta Hemiptera Aphididae)
using DNA sequences Molecular Phylogenetics and Evolution 38 316-329
Vossen J H S Dezhsetan D Esselink M Arens M J Sanz et al 2013 Novel
applications of motif directed profiling to identify disease resistance genes in
plants Plant Methods 9 37
Vraacutena J M Kubalaacutekovaacute H Šimkovaacute J Čiacutehaliacutekovaacute M A Lysaacutek et al 2000 Flow
sorting of mitotic chromosomes in common wheat (Triticum aestivum L) Genetics
156 2033-2041
Walters M C F Penn F Du Toit T C Botha K Aalbersberg et al 1980 The Russian
wheat aphid Farming in South Africa Leaflet Series Wheat G3 1-6
Warren R L G G Sutton S J Jones and R A Holt 2007 Assembling millions of short
DNA sequences using SSAKE Bioinformatics 23 500-501
Webster J A R L Burton and K J Starks 1987 Diuraphis noxia a new US aphid
pest of small grains Journal of the Kansas Entomological Society 60 483-484
Wei F S J W Zhang S G Zhou R F He M Schaeffer et al 2009 The physical and
genetic framework of the maize B73 genome PLoS Genetics 5 e1000715
Will T and A J E Van Bel 2006 Physical and chemical interactions between aphids
and plants Journal of Experimental Botany 57 729-737
Stellenbosch University httpsscholarsunacza
Chapter 2
57
Will T W F Tjallingii A Thonnessen and A J E Van Bel 2007 Molecular sabotage
of plant defence by aphid saliva Proceedings of the National Academy of Sciences
104 10536-10541
Will T S R Kornermann A C U Furch W F Tjallingii and A J E Van Bel 2009
Aphid watery saliva counteracts sieve-tube occlusion a universal phenomenon
The Journal of Experimental Biology 212 3305-3312
Wilson A C C P Sunnucks and D F Hales 1997 Random loss of X chromosome at
male determination in an aphid Sitobion near fragariae detected using an X-linked
polymorphic microsatellite marker Genetics Research 69 233-236
Yang H X Chen and W H Wong 2011 Completely phased genome sequencing
through chromosome sorting Proceedings of the National Academy of Sciences
108 12-17
Zerbino DR and E Birney 2008 Velvet algorithms for de novo short read assembly
using de Bruijn graphs Genome Research 18 821-829
Zhang W J Chen Y Yang Y Tang J Shang and B Shen 2011 A practical
comparison of De Novo genome assembly software tools for next-generation
sequencing technologies Plos One 6 e17915
Zhou R N and Z M Hu 2007 The development of chromosome microdissection and
microcloning technique and its applications in genomic research Current
Genomics 8 67-72
Zhou V W A Goren and B E Bernstein 2011 Charting histone modifications and the
functional organization of mammalian genomes Nature Reviews Genetics 12 7-
18
Stellenbosch University httpsscholarsunacza
Chapter 3
Research
Stellenbosch University httpsscholarsunacza
Chapter 3
59
31 Introduction
Arthropods are known as the most speciose clade of animals on earth The Insecta class
which is the majority of arthropods is hypothesized to hold 75 of all animals (Gaston
1991) Hemipterans contain three important families the Phylloxeridae the Adelgidae
and the Aphididae The Aphididae family (order Hemiptera) represents the largest group
of aphid species comprising approximately of 4500 extant species (Miller et al 1994
Davis 2012) In general the piercing-sucking behaviour of aphids during feeding together
with their ingestion of phloem sap results in extensive plant damage due to either direct
feeding or indirect transmission of plant viruses (Tagu et al 2008)
Diuraphis noxia Kurdjumov more commonly known as the Russian wheat aphid (RWA)
is one of the main insect pests that affect Tritucum aestivum L (bread wheat) The RWA
belongs to the family Aphididae and is characterised as an invasive pest with a major
economic impact on wheat production (Haley et al 2004 Burd et al 2006 Jankielsohn
2011) It has the potential to cause considerable yield losses mainly because it
reproduces parthenogenically and has an exceptionally high intrinsic rate of increase
(Merril et al 2009) In areas where the RWA is considered to be endemic it can also
reproduce sexually The change between sexual and parthenogenetic reproduction
includes chromosome behavioural changes that take place in response to environmental
stimuli facilitated by endocrine factors Notable differences take place in the ways in
which aphid chromosomes pair and segregate during sex determination and meiosis
even within closely related species with consequences that can affect the inheritance of
all ndash or parts of ndash the genome (Manicardi et al 2015) Asexual reproduction permits for
non-recombinant vertical gene transfer from mother to offspring through successive
generations allowing little genetic variation in the RWA (Tagu et al 2008)
Stellenbosch University httpsscholarsunacza
Chapter 3
60
Nevertheless new RWA populations or biotypes still develop despite the lack of sexual
recombination RWA biotypes are categorised according to the varying level of damage
that they inflict while feeding on wheat cultivars containing different resistance (R-) genes
This classification based on aphid virulence depends on the plantsrsquo response to RWA
feeding being either susceptible intermediate or resistant (Puterka et al 2012) Biotypes
overcome host-plant resistance and feed on previously resistant cultivars The constant
development of virulent RWA biotypes calls for the continuous identification and
introduction of new R-genes into susceptible wheat cultivars (Bouhssini et al 2011)
Fundamentally this protects the wheat against the current RWA biotypes and prevents
large scale agricultural losses (Jankielsohn 2011)
The karyotypic structure of the aphid genome has been found to vary substantially among
the species In some aphid genera the chromosome number seems to be stable but in
others it differs greatly mainly because of successive autosomal dissociations with slight
or no accompanying morphological or biological change (Manicardi et al 2015)
RWA chromosomes like the chromosomes of other aphids and some hemipteroid
insects are holocentric Holocentric chromosomes lack localised centromeres ndash with
centromeric activity being diffused along the length of the chromosome As a result
during the later stages of prophase and metaphase every condensed chromosome looks
like a simple rod or if treated with colchicine as a pair of chromatids aligned in parallel
with a uniform gap width between them (Blackman 1987) Holocentric chromosomes
present a big disadvantage for cytogenetic studies and karyotype comparisons in that
they do not possess any primary andor secondary constrictions This means that
conventionally stained preparations can only be identified on the basis of size Thus the
only factors that can be used to detect differences in karyotype structure are the number
of chromosomes or measurable structural heterozygosity (Manicardi et al 2015)
Stellenbosch University httpsscholarsunacza
Chapter 3
61
Novotnaacute et al (2011) established that the karyotype of female RWA consist of 10
chromosomes (2n = 10) with four pairs of autosome chromosomes and a pair of large sex
(X) chromosomes They also noted that the male RWA only possess one sex (X)
chromosome and therefore has a karyotype of 2n = 9 For that reason the RWA sex
chromosome system has been identified as XXX0 as in a number of aphid species This
system never has a Y chromosome which is essential for parthenogenesis or asexual
reproduction (Kuznetsova and Shaposhnikov 1973) Aphids are known for their large X
chromosomes as reported by Novotnaacute et al (2011) for RWA The reason for the existence
of large sexual chromosomes relative to the autosomes in aphids and their origin are still
unknown (Mandrioli et al 1996 Bizzarro et al 2000)
In this study the chromosomes of biotypes SAM the most virulent RWA biotype recorded
(Botha et al 2013) and SA1 one of the least virulent biotypes (Jankielsohn 2011) were
studied The aim of this study was to verify the karyotype of the RWA and to characterise
the sex (X) chromosomes of the RWA To achieve these aims female RWA were
dissected in order to obtain the embryos which were used to make chromosome
squashes The squashes were used to determine the RWA karyotype Additionally the
metaphase X chromosomes were examined separately from the autosome chromosomes
by means of flow cytometry Next generation sequencing (NGS) of the separated X
chromosomes of biotype SAM was conducted and used to map against the genomes of
the RWA (SAM_Contigs_Version 11 GCA_0014655151 Botha et al 2016 ndash in press)
and Acyrthosiphon pisum (pea aphid) (Acyr_20 GCA_0001429852 The International
Aphid Genomics Consortium 2010) Orthologous regions spanning the X chromosome of
the RWA was also identified through reference mapping against the well characterised X
chromosome of Drosophila melanogaster (fruit fly) (BDGP6 Adams et al 2000)
Stellenbosch University httpsscholarsunacza
Chapter 3
62
32 Materials and methods
This study made use of adult female aphids of the South African mutant RWA biotype
(SAM) and its parent South African biotype 1 (SA1) The female RWA specimens were
obtained from the Department of Genetics Stellenbosch University Cereal Genomics
Laboratory The biotypes were kept on SST 387 RWA resistant wheat cultivars in
separate BugDormreg Insect cages (MegaView Science Co Ltd Taiwan) to prevent cross
contamination with other biotypes Aphids were kept at 20 degC plusmn 2 degC with continuous
artificial fluorescent lighting
321 Karyotyping of RWA chromosomes
In the following section the procedure for obtaining representative karyotypes for the
biotypes SAM and SA1 is described
3211 Slide preparation
Mitotic chromosomes were obtained from whole embryos dissected from adult female
RWA (Figure 31) The chromosome spreads were prepared according to a procedure
adapted from Novotnaacute et al (2011) In brief a Hund WETZLAR Wiloskop stereo-zoom-
microscope (Labotecreg) was used to dissect 15 embryos into a physiological solution for
Ephistia kuehniella (Lockwood 1961) that consisted of 09 (mv) NaCl 0042 (mv)
KCl 0033 (mv) CaCl2H2O 002 (mv) NaHCO3 and 025 (mv) glucose where
after the embryos were treated with a hypotonic solution (0075 M KCl) for 10 minutes
and fixed for 15 minutes in Carnoy fixative (Traut 1976) The freshly prepared Carnoy
fixative consisted of 100 ethanol chloroform and glacial acetic acid (1 N) in a 631
ratio The embryonic cells were separated in 60 microl of 60 glacial acetic acid (1 N) with
the assistance of a wooden micropestle and fixed on the slide using a heating plate at
45 degC
Stellenbosch University httpsscholarsunacza
Chapter 3
63
3212 Chromosome staining and visualisation
After the slides were prepared as described (Section 3211) the samples were stained
for 5-8 minutes with Hoechst 33342 (Sigma) solution (10 mgml) that was diluted 1100
to a final concentration of 001 mgml The stained slides were then briefly submerged in
distilled H2O and left to dry at room temperature (RT)
The chromosomes were visualised with a Zeiss LSM780 ELYRA PS1 (Zeiss Germany)
confocal microscope Images were edited on Zen Lite Software (Zeiss Germany) in order
to visualise the karyotype and determine the size of the different chromosome pairs using
a scale bar (Central Analytical Facility (CAF) fluorescent microscopy unit Stellenbosch
University South Africa)
The different sized chromosome pairs were then subjected to two-sample t-tests to
determine if their sizes were statistically different from one another The t-tests were
performed firstly between the large chromosome sizes (Group 1) and the middle
autosomal chromosome sizes (Group 2) then between the middle autosomal
chromosome sizes (Group 2) and the small autosomal chromosome sizes (Group 3) and
lastly between the large chromosomes (Group 1) and the small autosomal chromosomes
Figure 31 Two embryos (as indicated by arrows) dissected from an adult female RWA
Stellenbosch University httpsscholarsunacza
Chapter 3
64
(Group 3) Fundamentally three t-tests were performed (Group 1 vs Group 2 Group 2 vs
Group 3 Group 1 vs Group 3)
322 Flow cytometry of RWA chromosomes
In the following section a procedure is described for the isolation of the RWA sex
chromosome in order to obtain DNA suitable for next generation sequencing (NGS)
3221 Preparation of mitotic chromosome suspension
The RWA chromosome suspensions were obtained using an adapted procedure as
described by Doležel and Bartoš (2005) Briefly 20 female RWA were collected in a 15
ml Eppendorf tube The tube containing the aphids was frozen using liquid nitrogen
where after 200 microl of ice-cold Otto buffer I (01 M C6H8O7 05 (vv) Tween 20 1 (vv)
Triton X-100) was added The aphids were crushed in the tube using a small micropestle
and incubated at RT for 5 minutes with occasional shaking The suspension of crushed
RWA was centrifuged through a 40 microm polypropylene nylon mesh cell strain filter
(Fisherbrandreg) at 10000 revolutions per minute (rpm) for 30 seconds Thereafter staining
solution containing 800 microl Otto buffer II (04 M Na2HPO4 12H2O) 05 mM propidium iodide
(PI) 40 microg RNase A and 16 microl 2-mercaptoethanol was added to the sample After
staining for 10 minutes at RT the sample was vortexed and the suspension was
transferred to a 5 ml round-bottom polystyrene tube (Falcontrade) ready for flow sorting
3222 Flow cytometry optimization Gating
Gating allows for the selection of single chromosomes through graphic depictions by
identifying doublets which are two chromosomes stuck together clumps which are more
than two chromosomes stuck together as well as debris that contaminate the series
Doublet and clump discrimination are very important to prevent any chromosomes that
are not of interest from passing through to sample collection (Kron and Husband 2015)
Stellenbosch University httpsscholarsunacza
Chapter 3
65
Gating was applied through the FACSDiva version 613 software (BD biosciences USA)
at the CAF fluorescent microscopy unit at Stellenbosch University South Africa
Figure 32 displays a gating strategy used in flow cytometry analysis known as a singlet
gate scatter plot This strategy is used to gate-out unwanted doublets and clumps All
singlets are identified according to where they cluster on the graph which should be in a
diagonal straight line The singlets are then surrounded by a gate allowing the flow
cytometer to only sort the chromosomes included in the gating area (Figure 32)
Figure 33 displays a chromosome gate scatter plot that allowed for further selection of
the chromosomes of interest The graph makes use of SSC (side scatter) and
fluorescence area SSC is the light scattered at large angles and is proportional to the
complexity of a particle while fluorescence area is the amount of fluorescence a particle
produces and is proportional to fluorescence intensity In this graph the chromosomes of
the same size will cluster together (Lo et al 2008)
The approach in Figure 33 was used to distinguish between the sizes of chromosomes
Each chromosome size was assigned a colour to aid in identification Cyan separated the
Figure 32 The singlet gate scatter plot was used to exclude doublets and clumps from the analysis Gate A is an area that is straight diagonal 45ordm and passing through zero (yellow dotted line) which includes all the single chromosomes of interest while all the particles outside the gate are excluded as they consist of doublets clumps or debris
A
Stellenbosch University httpsscholarsunacza
Chapter 3
66
middle sized autosomal chromosomes at a fluorescence of 28000-58000 while blue
separated the large sex chromosomes at a fluorescence of 68000-98000 The red and
green areas in Figure 33 designate all the particles that are not included in this (Figure
33) and the previous gating strategy (Figure 32) respectively Therefore all the
chromosomes that clustered in the respective colours (Figure 33) were sorted
accordingly
3223 Flow sorting
The sample containing the chromosomes as described in Section 3221 was measured
on a FACSAria flow cytometer (BD biosciences USA) at the CAF fluorescent microscopy
unit at Stellenbosch University South Africa Data was presented using the FACSDiva
version 613 software (BD biosciences USA) The flow cytometer charges each
chromosome depending on its fluorescence intensity which is proportional to the size of
the chromosome Propidium iodide (PI) the dye the chromosomes are stained with is
excited at 488 nm and emits at a wavelength of 617 nm The large and middle
chromosome fractions were collected separately in 5 ml polystyrene round-bottom tubes
(Falcontrade) containing Otto Buffer II (Section 3221) and stored at ndash20 ˚C at the
Department of Genetics Stellenbosch University Cereal Genomics Laboratory
Figure 33 The chromosome gate scatter plot was used to identify the chromosome sizes based on fluorescence intensity The different sized chromosomes were given a random colour to aid in identification
Stellenbosch University httpsscholarsunacza
Chapter 3
67
3224 DNA purification
The different size fractionated frozen chromosomal samples (Section 3223) were
removed from the ndash20 ˚C freezer and thawed in a water bath at RT After thawing the
samples were centrifuged at 12000 rpm for 20 minutes at 8 ˚C The supernatant was
aspirated down to approximately 50 microl where after the chromosomal pellet was
resuspended A total of 100 microg proteinase K was added to digest any contaminating
proteins and the sample was incubated at 55 ˚C for 1 hour The DNA was precipitated by
adding 200 microl ice-cold 100 ethanol to the sample and incubated overnight in the ndash20 ˚C
freezer The sample was thawed at RT centrifuged at 12000 rpm for 15 minutes at 6 ˚C
and the supernatant discarded The resulting pellet was allowed to dry for 10 minutes and
resuspended in 25 microl distilled H2O DNA concentrations were quantified using the Qubitreg
20 Fluorometer (Invitrogen) at the CAF Analytical Services Unit Stellenbosch University
South Africa The five samples with the highest DNA concentrations were pooled The
DNA concentration of one pair of large X chromosomes could be determined as follows
3225 Estimation of RWA genome size
Using the measured sizes of the different chromosome sets (Section 321) the number
of different size chromosome pairs (Section 321) and the contribution of the X
chromosome (Section 3224) 1C of the RWA can be calculated as follows
The genome size of the RWA was calculated using the following assumption 1 pg DNA
= 0978 x 109 base pairs Based on the consideration that ATGC = 11 ignoring the
X chromosome pair = Total DNA (ng)
Number of X chromosome pairs
1C = [X chr (pg)] + [(number of middle chr pairs) (middle chr (microm)
X chr (microm)) (X chr (pg))]
+ [(number of small chr pairs) ( small chr (microm)
X chr (microm)) (X chr (pg))]
Stellenbosch University httpsscholarsunacza
Chapter 3
68
presence of modified nucleotides (Doležel et al 2003 Doležel and Bartoš 2005 Doležel
et al 2012)
3226 Sequencing
Sodium acetate (1M) was added to the pooled sample of X chromosome DNA (Section
3224) and the 15 ml Eppendorf tube was filled to 1 ml with 100 ice-cold ethanol The
samples were packaged and sent to Macrogen (Korea) for sequencing
323 Next generation sequencing (NGS) and bioinformatic analysis of
the RWA sex chromosome fraction
The RWA chromosome fraction obtained through flow cytometry was sequenced on an
Illuminareg HiSeqtrade platform and aligned to the reference genomes of the RWA and pea
aphid In addition the annotated X chromosome of the fruit fly was aligned to the RWA
genome in order to annotate corresponding regions located on the sex chromosome of
the RWA
3231 Next generation sequencing
The X chromosome DNA fraction isolated through flow cytometry (Section 3224) was
sent for sequencing to Macrogen (Korea) where amplification was performed prior to
sequencing using the TruSeq Nano DNA Library Preparation Kit (Illumina FC1214001)
Paired-end sequencing was performed using the Illuminareg HiSeqtrade 2000 system
Sequence read length consisted of 101 bp and library insert sizes of 350 bp
3232 Reference mapping of the RWA X chromosome sequence data set to that
of the whole genome of the RWA and pea aphid
Sequencing reads obtained from the Illuminareg HiSeqtrade 2000 platform were aligned to the
reference genomes of the RWA (SAM_Contigs_Version 11 GCA_0014655151 Botha
et al 2016 ndash in press) and the pea aphid (Acyr_20 GCA_0001429852 The International
Stellenbosch University httpsscholarsunacza
Chapter 3
69
Aphid Genomics Consortium 2010) using Geneious v717 (Kearse et al 2012) (Figure
34)
Raw sequencing reads were verified for quality using FastQC
(httpwwwbioinformaticsbabrahamacukprojectsfastqc) The first 18 bases displayed
biased sequence composition at the start of the reads These poor quality reads were
filtered and trimmed by making use of FASTX-Toolkit
(httphannonlabcshledufastx_toolkit) to ensure that for a pair of paired-end reads
each data set had 90 or more bases with a phred score greater than or equal to Q20
(Figure 34)
Quality trimmed reads were aligned to the RWA reference genome
(SAM_Contigs_Version 11 GCA_0014655151 Botha et al 2016 ndash in press) as well as
to that of the pea aphid (Acyr_20 GCA_0001429852 The International Aphid Genomics
Consortium 2010) using Burrows-Wheeler aligner (BWA) with default parameters (Li and
Durbin 2010) The quality of the alignments was assessed by using Qualimap (Garcίa-
Alcalde et al 2012) (Figure 34)
Figure 34 Workflow of the quality filtering and alignment of the raw reads obtained from sequencing at Macrogen (Korea) to the RWA and pea aphid genomes Where raw read alignment was done using the Alighn to reference tool in Geneious (v717) and quality filtered reads were aligned using Burrows-Wheeler aligner (BWA) Raw reads were quality filtered using FastQC and FastX-Toolkit
Stellenbosch University httpsscholarsunacza
Chapter 3
70
Figure 35 Workflow of k-mer analysis and SOAPdenovo of the raw reads obtained from sequencing at Macrogen (Korea) to generate contigs and scaffolds
In order to determine the optimum k-mer size for de novo assembly and sequencing
depth raw sequencing reads were subjected to k-mer analysis by using KmerGenie
(httpkmergeniebxpsuedu Chikhi and Medvedev 2014) (Figure 35)
The raw sequencing reads were assembled using SOAPdenovo
(httpsoapgenomicsorgcnsoapdenovohtml) This software package makes use of the
de Bruijn graph algorithm to ultimately simplify the assembly of the contigs and scaffolds
(Li and Durbin 2010) (Figure 35)
3233 Physical mapping against the X chromosome of the fruit fly
The coding sequence (CDS) and proteins of the annotated X chromosome of the fruit fly
(BDGP6 Adams et al 2000) were retrieved and aligned to the CDS and proteins of the
well-annotated RWA genome (SAM_Contigs_Version 11 GCA_0014655151 Botha et
al 2016 ndash in press) using Geneious v717 (Kearse et al 2012) (Figure 36)
Figure 36 Workflow of bioinformatics analysis of the fruit fly X chromosome against the RWA genome The coding sequences were aligned using BLASTn and the proteins were aligned using BLASTp
Stellenbosch University httpsscholarsunacza
Chapter 3
71
The data was processed on Microsoft Excel (Microsoft Office 2010) For the CDS BLASTn
the selection criteria was strict where only sequences with a 70 or more query coverage
and identity were included The protein BLASTp selection criteria included proteins with
40 or more query coverage and identity
324 Fluorescent in situ hybridization
3241 Fluorescent probes
In order to generate probes to hybridize against the RWA sex chromosome orthologous
regions were identified by aligning the X chromosome of the fruit fly to the RWA genome
(as seen in Section 3233) Primers were designed from target regions on the RWA
genome that aligned to X chromosome genes of the fruit fly using Geneious v717
(Kearse et al 2012) The eight primers used in the study were selected according to the
percentage identical sites and the region with a BLAST hit (Table 31) Two probes as
used by Novotnaacute et al (2011) were included as positive controls (ie 18S rRNA and
histone H4)
In order to generate unlabelled probes polymerase chain reactions (PCR) using the
primers listed in Table 31 were conducted The 20 μl PCR master mix contained 1X PCR
buffer (Thermo Scientific) 2 U Taq polymerase (Thermo Scientific) 02 mM dNTPrsquos mix
(Thermo Scientific) 500 nmol of each primer and 100 ng of template genomic RWA DNA
The PCR reaction conditions were as follows 5 minutes at 95 degC 35 cycles of 15 seconds
at 94 degC 15 seconds at 57 degC 60 seconds at 72 degC followed by a final elongation step
of 10 minutes at 72 degC PCR products were separated on a 2 agarose (SeaKemreg) gel
at 90 volts for 80 minutes and was visualised on a Gel Doc EZ imager (Bio-Rad) at the
Department of Genetics Stellenbosch University South Africa The PCR products (Table
31) were cleaned using a Qiagen MinElutereg Reaction Cleanup Kit and labelled by PCR
re-amplification with a dNTP mix containing 035 mM biotin-16-dUTP (Roche)
Stellenbosch University httpsscholarsunacza
Table 31 Primer sequences used to generate probes for FISH Expected product size and gene of origin in the RWA genome are given Primer X probe 18S rRNA and X probe H4 (Novotnaacute et al 2011) were used as positive controls
Primer Sequence Expected product size Description Accession number (RWA genome)
F 5-CCTGAGAAACGGCTACCACATC-3
R 5-GAGTCTCGTTCGTTATCGGA-3
F 5-TSCGIGAYAACATYCAGGGIATCAC-3
R 5-CKYTTIAGIGCRTAIACCACRTCCAT-3
F 5-TCAGAATCCGACAACTAAACACA-3
R 5-AGCCTCACATTGAAGTTGAGACT-3
F 5-GATACGGATCCACGCGAACT-3
R 5-ACCACACTCTGACCACGTTC-3
F 5-ACGAGTTCCGATGTGCCAAT-3
R 5-ACCACCTGTCCACTTTCATCC-3
F 5-GGCTACTGCTGCTTCTTCCA-3
R 5-GGAATGTAGGCCTAATGCATTGG-3
F 5-CTGGGGGATTCGTTGGTCAT-3
R 5-TCGAGCTGAAAGGAATAGTCACT-3
F 5-TCATCTATAACTGTAGTCCTGCAC-3
R 5-ATCCCCCAGCCCTGACTAAT-3
F 5-AAGACTCTGGGCAACGGAAG-3
R 5-TGCACAAACACCAAAAATATCCCA-3
F 5-ATTGGTATCGATCGGTGCCG-3
R 5-CACACAACGCACTTACGCAC-3
RWA probe Name
P9 X probe scaf_13192 895 bp
P10 X probe scaf_17249 499 bp
P7 X probe scaf_6337a 500 bp
P8 X probe scaf_6337b 498 bp
P5 X probe scaf_1960 944 bp
P6 X probe scaf_4125 641 bp
histone H4
heat shock protein cognate 3 precursor
low-density lipoprotein
actin 5C isoform B
P1 X probe 18S rRNA 1051 bp
P2 X probe H4 210 bp
P3 X probe scaf_1481 1460 bp
P4 X probe scaf_1801 433 bp
actin (ACYPI006035)
alpha-actinin sarcomeric-like isoform 2
107165916
107167901
g943t1
g1176t1
g1279t1
g2500t1
g3570t1
g3569t1
g5957t1
g7053t1
inhibitory POU protein-like
actin-42A-like isoform 1
hypothetical protein LOC100168805
18S rRNA X-elimantion
Stellenbosch University httpsscholarsunacza
Stellenbosch University httpsscholarsunacza
Chapter 3
73
3242 Slide preparation and treatment
Slides with mounted chromosomes were prepared as previously discussed in Section
3211 with modifications as described by Sahara et al (1999) Fukovaacute et al (2005) and
Novotnaacute et al (2011) Briefly chromosomes were dehydrated by passing them through
an ethanol series (70 80 and 96 for 30 seconds each) and aged at -20 degC
overnight The chromosomes were passed through the ethanol series and air-dried at RT
In order to remove excess proteins the chromosome slides were baked for 4 hours at 65
degC and incubated in 100 microg proteinase K (Fermentas) in 100 ml 1X Phosphate-buffered
saline (PBS) (137 mM NaCl 27 mM KCl 10 mM Na2HPO4 and 18 mM KH2PO4 pH 74)
for 5 minutes The chromosomes were washed twice in 1X PBS RNA was removed by
treating the chromosomes with 20 microg RNase A (Thermo Scientific) in 100 microl 2X Saline
sodium citrate (SSC) (03 M NaCl and 003 M Na3C6H5O7 pH 70) for 1 hour followed by
washing twice in 2X SSC The chromosomes were finally incubated in 5X Denhardtrsquos
solution (Sigma) for 30 minutes All the wash steps and incubation periods were
performed at 37 degC Denaturation of the chromosomes was performed at 68 degC for 3
minutes and 30 seconds in 70 deionized formamide (Merck) in 2X SSC The prepared
slides were subjected to a final ethanol dehydration series and air-dried at RT
3243 Probe denaturation and hybridization
Labelled probes (50 ngmicrol) in Section 3241 were mixed together with 25 microg of competitor
sonicated salmon sperm DNA (Sigma) where after 20 microl of cold 100 ethanol was also
added Probes were allowed to precipitate at -80 ordmC for 30 minutes and subsequently
centrifuged at 13000 rpm for 20 minutes The supernatant was discarded and the pellet
was washed with cold 70 ethanol and once more centrifuged at 13000 rpm for 10
minutes The supernatant was carefully discarded by pipetting and the sample was
allowed to air-dry at 37 ordmC Once the sample was dry it was dissolved in 5 microl pre-warmed
deionized formamide (Merck) at 37 ordmC for 30 minutes with vortexing every 10 minutes
Stellenbosch University httpsscholarsunacza
Chapter 3
74
where after 5 microl 20 (wv) dextran sulphate (Sigma) pre-warmed to 37 ordmC was added to
form the hybridization mix Probes were denatured by heating the hybridization mix to
90 ordmC for 5 minutes where after the hybridization mix was immediately chilled on ice for
10 minutes before applying to the chromosomal slides
The hybridization mix (10 microl) was spotted onto the prepared slide (Section 3242) and
covered with a 22x22 mm cover glass slip The cover glass was gently pressed down to
avoid any bubbles and the edges were completely sealed with PVC-U cement (Tangit)
The slides were incubated overnight at 37 ordmC
3244 Probe detection and signal enhancement
The PVC-U cement (Tangit) was carefully removed from slides (Section 3243) by using
forceps and slides were submerged in 50 (vv) formamide (Merck) allowing the cover
slip to detach The labelled chromosome slides were then subjected to wash steps as
follows three times with 2X SSC containing 50 (vv) formamide (Merck) at 46 ordmC for
5 minutes five times with 2X SSC at 46 ordmC for 2 minutes three times with 01X SSC at
62 ordmC for 5 minutes and finally once with 4X SSC containing 01 (vv) Tweenreg 20
(Merck) at RT for 5 minutes
To enable probe detection 450 microl of 25 Bovine Serum Albumin (BSA) (Sigma)
dissolved in 4X SSC was dropped on each slide covered with a 22x50 mm cover glass
slip and incubated at RT for 20 minutes From here on incubations were performed in a
dark room Labelled chromosomes were then submerged for 1 minute in 2X SSC to
remove the BSA and allow the cover glass to detach Thereafter 100 microl Cy3-streptavidine
(Jackson Research Laboratories) was dropped onto each slide covered with a 22x50
mm cover glass and once again incubated at RT for 30 minutes followed by a 1 minute
submersion in 2X SSC to remove the Cy3-streptavidine and detach the cover glass The
labelled chromosomes were subjected to three washes with 4X SSC containing 01
(vv) Tweenreg 20 at 37 ordmC for 3 minutes
Stellenbosch University httpsscholarsunacza
Chapter 3
75
To enhance the probe signals 450 microl of 25 BSA dissolved in 4X SSC was dropped on
each slide covered with a 22x50 mm cover glass and incubated at RT for 10 minutes
followed by a 1 minute submersion in 2X SSC to remove the BSA and detach the cover
glass slip Thereafter 50 microl Biotinylated antistreptavidine (Vector) was dropped onto each
slide covered with a 22x50 mm cover glass and incubated at 37 ordmC for 20 minutes
followed by a 1 minute wash with 2X SSC to remove the antistreptavidine and cover glass
The slides were subjected to three washes with 4X SSC containing 01 (vv) Tweenreg
20 at 37 ordmC for 3 minutes The probe detection and signal enhancement steps were
repeated once more to obtain optimal signal enhancement
3245 Slide staining and visualisation
Labelled samples were stained for 5-8 minutes with Hoechst 33342 (Sigma) solution (10
mgml) that was diluted 1100 to a final concentration of 001 mgml The stained slides
were then briefly submerged in distilled H2O and left to dry at RT in the dark
After staining the chromosomes were visualised using a Zeiss LSM780 ELYRA PS1
(Zeiss Germany) confocal microscope equipped with Zen Lite Software (Zeiss Germany)
(CAF fluorescent microscopy unit Stellenbosch University South Africa)
Stellenbosch University httpsscholarsunacza
Chapter 3
76
33 Results
331 Karyotyping of RWA chromosomes
The karyotype was constructed to determine the number and appearance (size and
shape) of chromosomes in the nucleus of a RWA cell
Figure 37 displays the chromosomes as seen on the Zeiss LSM780 ELYRA PS1 (Zeiss
Germany) confocal microscope The Hoechst 33342 (Sigma) stain bound to the RWA
DNA and stained the chromosomes fluorescent blue The chromosomes appear to be
long slender rods of DNA which lack constriction sites or centromeres Figure 37
displays different sized chromosomes that cluster together The length of the
chromosomes can be compared to the 10 microm bar present in each image There are no
observable morphological differences between the chromosomes of RWA biotype SAM
and SA1
Figure 37 The RWA chromosomes are stained with Hoechst 33342 to enable their detection through the confocal microscope The chromosomes of biotype SAM and SA1 are compared A 10 microm bar is indicated in each image
SA1 SAM
SAM
Stellenbosch University httpsscholarsunacza
Chapter 3
77
The karyotype of the female RWA biotype SAM consists of a diploid chromosome number
of 10 The chromosomes were divided into size groups according to their length The
results produced two large sex chromosomes and four autosomal chromosome pairs of
which three homologous pairs are middle sized and one homologous pair is smaller
(Figure 38 Table 32) The chromosome groups varied remarkably in their length and
the smallest autosome chromosome pair as well as the X chromosomes were easily
Figure 38 The karyotype of a female RWA showing the complete set of chromosomes of 2n=10 [2 sex chromosomes (X) and 8 autosomes (6 middle size and 2 small size chromosomes)] Indicated is a 10 μm bar as well as the average sizes of each of the different chromosomes respectively
611 microm
420 microm
313 microm
Stellenbosch University httpsscholarsunacza
Chapter 3
78
identifiable because of their lower number However the remaining three middle sized
autosome chromosome pairs were difficult to pair and to distinguish from one another
because of their high number and similar size (Figure 37 Figure 38)
Table 32 The mean lengths of the chromosomes were determined by measuring ten specimen of each size
From the results the lengths of the three chromosome groups were determined by
measuring ten chromosomes of each size The data showed that the approximate length
of the chromosomes were as follows the X chromosome at 611 μm (SD = 013 microm) the
middle sized chromosome at 420 μm (SD = 015 microm) and the smallest chromosome at
313 μm (SD = 009 microm) (Table 32 Figure 38 Figure 39) These results suggest that
the X chromosome contributes approximately 28 of the total DNA based on length
Table 33 t-Tests were performed to test if the different size chromosome groups are statistically different (Table A1 Table A2 and Table A3)
t-Test X chromosome - middle chromosome p = 189 x 10-16
t-Test middle chromosome - small chromosome p = 542 x 10-13
t-Test X chromosome - small chromosome p = 942 x 10-22
The chromosome size groups were shown to be statistically different from one another in
Table 33 (as calculated in Table A1 Table A2 and Table A3) with p lt 005 for all the
size comparisons Figure 39 displays a chart that demonstrates the clear differences in
X chromosome (microm) Middle chromosome (microm) Small chromosome (microm)
614 432 333
585 427 309
623 381 325
612 436 299
621 435 310
623 422 312
626 421 312
598 419 308
603 408 312
600 420 307
Mean 611 420 313
SD 013 015 009
SD = standard deviation
Stellenbosch University httpsscholarsunacza
Chapter 3
79
size The X chromosome is nearly twice the size of the small chromosome and almost
15X the size of the middle chromosome making it by far the largest chromosome in the
karyotype of the RWA (Figure 39)
332 Flow cytometry separation of RWA chromosomes
Because of the size differences flow cytometry offered an attractive protocol that could
be used to isolate chromosomes from one another In this study the method is
implemented to separate the different sized chromosome groups of RWA biotype SAM
All of the flow cytometry results obtained during the study can be found in a supplemental
file named Folder A1 (see attached CD)
Figure 310 displays a single-parameter histogram that measures the relative
fluorescence area (PE-Texas Red-A) on the x-axis versus the number of events
(chromosome count) on the y-axis The histogram in Figure 310 shows the total number
of chromosomes that possess the physical properties ndash relative area and fluorescence -
selected for The peaks with the desired characteristics in this case the middle- and large
00
10
20
30
40
50
60
70
X chromosome Middle chromosome Small chromosome
Length
(micro
m)
Figure 39 The bar chart is a visual representation of the size differences of the RWA chromosomes
Stellenbosch University httpsscholarsunacza
Chapter 3
80
chromosomes were identified as the positive datasets The left middle chromosome peak
display a higher count (500) which is approximately 5X higher than that of the large
chromosome but with a lower fluorescence (31000-61000) The large chromosome
peak on the other hand has a lower count (100) but higher fluorescence (69000-
101000) The histogram did not display a positive peak for the small autosome
chromosomes (Figure 310) mostly because they were too small to be distinguished from
cell debris Therefore the small autosome chromosomes could not be separated from
the other size chromosome groups through flow cytometry
Table 34 displays the summarized data from a flow cytometry run The populations were
determined through the gating strategies as described in Section 3222 The data in
Table 34 shows that each subsequent gating strategy or population (black to red to green
to cyan and blue) allowed for more stringent flow sorting only selecting the chromosomes
of interest ultimately making the run more specific From the results it was noticed that
the middle sized chromosome had the highest percentage parent (735) while the large
sex chromosome had a low percentage parent (156) (Table 34) Percentage parent
Figure 310 The single-parameter histogram displays positive peaks for both the middle- and large chromosomes
Stellenbosch University httpsscholarsunacza
Chapter 3
81
refers to the percentage of gated particles Table 34 also displays an average
fluorescence of 40394 for the middle chromosome and 78095 for the large chromosome
333 Chromosomal DNA concentration
The DNA from the sorted X chromosome had to be extracted before sequencing (Table
A4)
Table 35 The X chromosomes of the samples were pooled together and the DNA concentration was determined (Table A4)
Biotype Ploidy Number of X chromosome pairs Total DNA (ng)
SAM 2C 2438044 8895
After flow sorting the number of X chromosomes (2047296) resulted in a total amount
of 88946 ng of DNA which was sufficient for sequencing later (Table 35) The DNA
concentration of an X chromosome pair equated to
This means that a single X chromosome was 018 pg
Table 34 The summarized data measured after gating allows for the calculation of the number of events passing through percentage parent as well as fluorescence Each block represents the results after that gating strategy has been implemented
X chromosome pair = 036 pg
X chromosome pair = 8895
2438044
- not measurednot included in gating areas
Stellenbosch University httpsscholarsunacza
Chapter 3
82
334 Estimation of RWA genome size
An estimate of the size of the RWA genome was calculated by using the lengths of the
chromosome groups (Section 331) the number of different chromosome pairs (Section
331) the DNA concentration of a single X chromosome (Section 333) as well as the
assumption that 1 pg DNA = 0978 x 109 base pairs (Doležel et al 2003 Doležel and
Bartoš 2005 Doležel et al 2012)
1C was determined as follows
Thus the estimated genome size was calculated as follows
Therefore
335 Next generation sequencing (NGS) and bioinformatic analysis of
RWA X chromosome
Using the Illuminareg HiSeqtrade 2000 platform offered by Macrogen NGS produced a total
of 13818304294 bases from the RWA sex chromosome fraction with a read count of
136814894 (Table 36) The resulting NGS reads were of high quality as revealed by a
Phred score of 9632 The GC content of the sequence data of the sex chromosome
1C = [018] + [(3) (420
611) (018)] + [(1) (
313
611) (018)]
1C = 018 + 037 + 009
1C = 064340425 pg
1 pg = 0978 times 109 base pairs
= 1C times (0978 times 109)
= 064340425 times (0978 times 109)
= 629 Mb
Stellenbosch University httpsscholarsunacza
Chapter 3
83
was 3544 (Table 36) corroborating the low GC percentage found in RWA (Botha et al
2011 2015 Nicholson et al 2015)
Table 36 The tabulated results obtained from the NGS including the sequencing platform used number of bases read count GC percentage and Q20 percentage
Sequencing platform Number of bases Read count GC Q20 ()
Illuminareg HiSeqtrade 2000 13818304294 136814894 3544 9632
In order to assess the quality of the obtained NGS data a FastQC analysis was
performed The complete results obtained during the FastQC analysis are included in
Folder A2 (see attached CD) The y-axis of the graphs displayed in Figure 311 indicates
the quality scores per base of sequence The FastQC results presented in Figure 311
shows that the sequences produced by Macrogen had high base quality mostly with little
degradation as the run progressed at the end Figure 311 (A) represents the forward
sequence of the RWA X chromosome while Figure 311 (B) represents the reverse
sequence of the RWA X chromosome
The graphs in Figure 312 are very similar with both the forward sequence (A) and reverse
sequence (B) displaying AT-richness The GC is indicated in the graphs in Figure 312
Figure 312 also displays phasing at the start of the reads
Figure 311 The quality of the sequence bases were assessed using FastQC The y-axis of the graph is divided into three regions good quality calls (green) reasonable quality calls (orange) and poor quality calls (red) Graph A represents the forward sequence while graph B represents the reverse sequence of the RWA X chromosome
A B
Stellenbosch University httpsscholarsunacza
Chapter 3
84
KmerGenie estimated the best k-mer length for genome de novo assembly to build
contigs and scaffolds from the NGS raw reads for the X chromosome of the RWA (Folder
A3 ndash see attached CD) The y-axis of the graphs in Figure 313 represents the number of
k-mers but it can also be interpreted as the estimated size of an assembly of this dataset
Figure 313 displays a plot with multiple local maximarsquos for k-mer size
Figure 314 displays three k-mer histograms where A represents the KmerGenie
recommended k-mer size of k=27 for the forward sequence B represents the KmerGenie
recommended k-mer size of k=25 for the reverse sequence and C represents the k-mer
size k=27 for the reverse sequence that was self-selected because the same k-value
was needed for both the forward and reverse sequences of the RWA X chromosome to
Figure 313 Genomic k-mers versus k-mer size Graph A represents the forward sequence while graph B represents the reverse sequence of the RWA X chromosome
A B
Figure 312 The plot indicates the percentage ATGC content per base in the sequence with the red line representing T blue C green A and black G Graph A represents the forward sequence while graph B represents the reverse sequence of the RWA X chromosome
A B
Stellenbosch University httpsscholarsunacza
Chapter 3
85
build the contigs and scaffolds Therefore k=27 (A and C) was selected as the best fit for
the paired-end reads
The reads that were subjected to de novo sequence assembly using SOAPdenovo
(httpsoapgenomicsorgcnsoapdenovohtml) produced 1059574 contigs for the
sorted RWA X chromosome fraction with the longest contig being 7071 bp (N50 = 314)
The GC content of the built contigs were 3005 A total of 671410 bp (N50 = 1367)
scaffolds were obtained with the longest being 46046 bp The GC content from the built
scaffolds was 3013 (Table 37 Folder A4 ndash see attached CD)
Figure 314 The graphs (A ndash C) embody k-mer abundance histograms A represents the k-mer size that was used for the forward sequence of the RWA X chromosome while B and C represent the k-mer sizes for the reverse sequence of the RWA X chromosome A and B was recommended by KmerGenie for the forward and reverse sequences respectively but C (self-selected) was used for the reverse sequence Therefore A and C was used
A B
C
Stellenbosch University httpsscholarsunacza
Chapter 3
86
Table 37 The tabulated results produced by SOAPdenovo presenting the contig and scaffold assemblies
Number Mean Size Median Size Longest Sequence Shortest Sequence GC
Contigs
1059574 260 198 7071 100 3005
Scaffolds
671410 677 320 46046 100 3013
336 Mapping of the X chromosome reads to the reference RWA and
pea aphid genomes
The reads from the RWA X chromosome fraction was aligned and mapped to the
reference genomes of the RWA (SAM_Contigs_Version 11 GCA_0014655151 Botha
et al 2016 ndash in press) and the pea aphid (Acyr_20 GCA_0001429852 The International
Aphid Genomics Consortium 2010) The Qualimap results of the RWA were compared to
that of the pea aphid Table 38 displays that the raw reads of the sex chromosome had
a much higher mapping percentage to the RWA reference genome (8288) compared
to that of the pea aphid (513)
Table 38 The tabulated results produced by Qualimap analysis highlighted the differences in mapping percentage coverage and mapping quality between aligning the RWA and pea aphid genomes against the sorted X chromosome of the RWA
Russian wheat aphid Pea aphid
Number of reads 139472676 137070267
Mapped reads 8288 5130
Unmapped reads 1712 4870
Paired reads 8288 5130
GC 3503 3515
Mean coverage (x) 3566 684
Mean mapping quality 3612 795
This also indicates that there was a much higher coverage to the RWA genome (roughly
5X higher coverage) and that the mapping quality to the RWA was also better Table 38
also shows that the RWA and pea aphid have similar ACGT content both with AT-rich
reads
Stellenbosch University httpsscholarsunacza
Chapter 3
87
A Qualimap analysis was also conducted (Folder A5 ndash see attached CD) which displays
plots for the RWA and pea aphid each consisting of two figures (Figure 315) The upper
figures provide the coverage distribution (red line) and coverage deviation across the
reference sequences where coverage is presented along the y-axis and coverage
deviation along the x-axis The lower figure shows GC content measured in percentage
across reference genome together with its average GC
In Figure 315 both plots show complete coverage across the genomes of the RWA and
the pea aphid Figure 315 also displayed GC content (30) that is very similar between
the two aphid species as indicated by the lower figures on each plot
Figure 315 Coverage deviation and GC content of the alignment of the X chromosome reads of the RWA and the reference genomes of RWA (top) and pea aphid (bottom)
Russian wheat aphid
Diuraphis noxia
Pea aphid
Acyrthosiphon pisum
Coverage Deviation
Coverage Deviation
GC content
GC content
Stellenbosch University httpsscholarsunacza
Chapter 3
88
Complete genome coverage was also supported by the results following the alignment
done in Geneious (v717) of the raw reads from the RWA X chromosome to the reference
genome of the RWA (SAM_Contigs_Version 11 GCA_0014655151 Botha et al 2016
ndash in press) The data is presented in Folder A6 (see attached CD)
337 Physical mapping of the X chromosome of the fruit fly to the
available X chromosome sequences of the RWA
Table 39 displays a comparison between the genome and X chromosome of the fruit fly
against that of the RWA genome and X chromosome The RWA has a much larger
genome size compared to the fruit fly and has five chromosome pairs while the fruit fly
has seven chromosome pairs (Lemeunier et al 1986) Furthermore the estimated RWA
X chromosome size (176040000 bases) is so big that it is larger than the complete
genome of the fruit fly of 143725995 bases The fruit flyrsquos X chromosome equates to
163 of its total genome compared to the RWAs 28 The RWA also has a much lower
GC percentage across its genome and X chromosome compared to that of the fruit fly
Table 39 The genome and X chromosome of the fruit fly is compared to that of the RWA by looking at size- and content differences
Fruit fly Russian wheat aphid
Database version 846 1
Genebuild version dmel_r6_FB2014_05 SAM_Contigs
Estimated genome size (pg) 018 064
Assembled genome size 143725995 629048261
Genome GC 4210 2950
of contigs 2442 186003
Genome coding genes 13918 35492
of chromosome pairs 7 5
of chromosome fragments 1 1466
X chromosome size 23542271 176040000
X chromosome GC 4250 3040
Stellenbosch University httpsscholarsunacza
Chapter 3
89
The results in Table 310 show that when the coding sequence of the fruit flyrsquos X
chromosome was mapped against the RWA genome that only 831 of the length of the
RWA X chromosome was aligned However when the proteins of the fruit fly X
chromosome was mapped against the RWA genome the results were much better with
6742 of the proteins of the RWA X chromosome being reported The complete dataset
obtained during the BLASTn and BLASTp analysis is presented in spreadsheet format in
Folder A7 (see attached CD)
Table 310 The fruit fly X chromosome CDS and proteins were aligned against the RWA genome CDS and proteins in order to characterise the RWA X chromosome
Fruit fly X chromosome CDS vs RWA genome CDS (BLASTn)
Total length of RWA X chromosome aligned 14631822
aligned 831
Fruit fly X chromosome proteins vs RWA genome proteins (BLASTp)
Total length of RWA X chromosome aligned 118687515
aligned 6742
338 Fluorescent in situ hybridization (FISH)
3381 Probe generation for the RWA sex chromosomes
The primers that were ordered for probe generation were verified as correct through gel
electrophoresis to test if they amplified the correct product sizes
All of the primers produced single bands of the correct size (Table 31) and no
contamination was visible in the series (Figure 316)
Stellenbosch University httpsscholarsunacza
Chapter 3
90
3382 Visualisation
FISH with the control probe 1 (18S rRNA) displayed co-localization of hybridization
signals (red fluoresence) at one end of the X chromosome of the RWA female (Figure
317 ndash Probe 1) Control probe 2 (histone H4) also displayed signals but the chromosome
images had a low resolution therefore exact localization on the chromosomes could not
be determined The same occurred using the other probes ndash probe 3 (X probe scaf_1801)
probe 5 (X probe scaf_1960) probe 6 (X probe scaf_4125) probe 7 (X probe
scaf_6337a) probe 8 (X probe scaf_6337b) and probe 10 (X probe scaf_17249) ndash where
Figure 316 Gel electrophoresis was carried out on a 2 agarose gel at 90 volts for 80 minutes to determine if the primers amplified the correct product sizes Probe 1 and 2 were used as positive controls A 1 kb (Promegatrade) DNA ladder was used Refer to Table 31 for probe names
Probes 1 kb Ladder
500 bp
1500 bp
1000 bp
1000 bp
700 bp
500 bp
P1 P2 P3 P4 P5 L
P10 P9 P8 P7 P6 L
Stellenbosch University httpsscholarsunacza
Chapter 3
91
localization of probes did occur but visual confirmation of the chromosomes and probe
binding location was lacking (Figure A1) Probe 4 (X probe scaf_1801) and probe 9 (X
probe scaf_13192) did not display any hybridization signals
Figure 317 Mitotic chromosome complements of RWA after differential staining and FISH Probe 1 and 2 was used as controls and the other probes were derived from the fruit fly X chromosome
Stellenbosch University httpsscholarsunacza
Chapter 3
92
34 Discussion
341 RWA karyotype and genome size estimation
In RWA embryonic tissue cells are constantly in the process of multiplication and
differentiation Therefore a proportion of the cells are in late prophase or metaphase of
mitosis when the number and relative sizes of their chromosomes can be observed RWA
embryos were used in the study because most of the cells are multiplying and
differentiating constantly meaning a large proportion of them will be in late prophase or
metaphase of mitosis when chromosomes can be best observed (Novotnaacute et al 2011)
Hoechst 33342 (Sigma) is a membrane permeant dye that binds to adenine-thymine-rich
regions of DNA in the minor groove Botha et al (2012) found that the RWA has the most
AT-rich insect genome sequenced therefore enabling the Hoechst that was used to stain
the RWA slide preparations to bind to the entire chromosomes as presented in Figure
37
The chromosome preparations that were obtained from RWA biotype SA1 and SAM after
staining did not display any variations in chromosome number size and shape This
might be because SAM was developed from SA1 after laboratory induced selective
pressure (Swanevelder et al 2010) leading to no differences in these areas Also the
fact that the RWA reproduces asexually contributes to the lack in chromosomal
differences During asexual reproduction the traits of only the female RWA is passed on
to progeny resulting in identical offspring with a lower genetic diversity These factors
could be the reason that the chromosomes between these two RWA biotypes are visually
identical as seen in Figure 37
The results of this study indicated that the X chromosome of the RWA is 15X the size of
the middle sized chromosomes as well as twice the size of the smallest chromosomes
therefore it is easy to identify the chromosomes based on their size (Figure 37 Figure
Stellenbosch University httpsscholarsunacza
Chapter 3
93
38 Table 32 and Table 33) The X chromosome pair and small autosome chromosome
pair are easily distinguished because of their size and low numbers (Figure 38) however
the three remaining middle autosome chromosome pairs are difficult to separate and
identify because of their similar size and the fact that RWA chromosomes lack
centromeres Apart from the lengths of the chromosomes there are no other
morphological features that would aid in the identification of different chromosomes
(Figure 38)
The statistical investigations into X chromosome sizes of aphids are somewhat
uncommon The only data available is for a few species of the genus Neuquenaphis
(Neuquenaphidinae) where the sizes of the X chromosomes vary from 11 to 15 of the
total genome (Blackman et al 2003) and for the related Myzus persicae species where
the size of the X chromosome almost reach 27 of the genome (Blackman and Takada
1976) In 2011 Novotnaacute et al compared female and male RWA genome sizes They
found the female genome size to be 2C = 086 pg while the male genome size was 2C
= 070 pg The difference in DNA content between the males and females suggested that
the RWA X chromosome occupies around 35 of the female haploid genome (1C = 043
pg) making it one of the largest sex chromosomes in the animal kingdom The assembly
of the karyotype (Figure 38) and statistical investigation (Table 32 Table33 and Figure
39) confirms that the X chromosome is by far the largest element in the karyotype of the
RWA The results in this study further suggests that the DNA content of a single X
chromosome is 018 pg (Section 333) while the genome equates to 1C = 064 pg
(Section 334) suggesting that the X chromosome contributed approximately 28 of the
total DNA which is slightly less than that measured by Novotnaacute et al (2011) but very
close to that of the related green peach aphid where the X chromosome reaches almost
27 of the genome size (Blackman and Takada 1976)
Stellenbosch University httpsscholarsunacza
Chapter 3
94
Arthropod genome sizes exhibit considerable diversity with the largest reported to date
being that of the grasshopper (Orthotera Neoconocephalus triops L) (1C = 7 125
(male)7 752 (female) Mb 793 pg) and the smallest being the two spotted spider mite
(Trombidiformes Tetranychus urticae) (1C = 907 Mb 009 pg) (Hanraham and Johnston
2001 Johnston et al 2007) In this study the genome of the female RWA is estimated to
be 629 Mb (Section 334) which is more than the 421 Mb that Novotnaacute et al (2011)
predicted using flow cytometry The genome of the model aphid pea aphid is 517 Mb
roughly 178 smaller than the RWA genome size predicted in this study
342 Flow cytometry and next generation sequencing
Ultimately the flow cytometry that was used to isolate the X chromosomes of the RWA
also proved to be a method to identify the X chromosome based on its relative size and
fluorescence Figure 310 presented that the X chromosomes had a higher fluorescence
than the middle chromosomes because of its bigger surface area A larger surface area
allows for more fluorescent dye in this case propidium iodide (PI) to bind to double
stranded DNA by intercalating between base pairs The results of the histogram in Figure
310 compares with the karyotype of the RWA The karyotype of the female RWA consists
of 10 chromosomes ndash two large sex (X) chromosomes six middle autosome
chromosomes and a single set of small autosome chromosomes (Figure 38) The
histogram in Figure 310 supports this data by the two distinct peaks The large
chromosomes have a larger area than the autosome chromosomes resulting in a higher
fluorescence peak However the fact that the RWA possesses more middle
chromosomes in their karyotype resulted in the peak with the higher count particles
passing through the instrument (Figure 310) The small chromosomes did not generate
a peak because of its small size and low fluorescence causing the instrument to classify
the small autosomes as debris and sorting it under the negative dataset with the
undesired characteristics (waste) Table 34 also linked in with the karyotype when the
Stellenbosch University httpsscholarsunacza
Chapter 3
95
percentage parent was studied In this case the large chromosomes had a lower
percentage parent (156) compared to the middle chromosomes (735) because of
their frequency - two out of ten chromosomes are large Furthermore Table 34 also
shows that the X chromosome is almost 15X times the size when the fluorescence
intensity was calculated correlating with Figure 39
The samples collected during flow cytometry for DNA extraction were chosen based on
the trails (Folder A1) that presented the best peaks and physical properties selected for
as seen in Figure 310 The samples all contained a large amount of chromosomes and
had sufficient DNA concentrations and the samples were pooled together
The NGS results produced by Macrogen were subjected to further analysis It is stipulated
that in a random library there should be little to no difference between the different bases
of a sequence run (ie A T G and C) In other words the lines in the plot presented in
Figure 312 were expected to run parallel with one another as close as possible However
the results in Figure 312 is explained in a study conducted by Botha et al (2012) and a
more recent study by Nicholson et al (2015) where they showed that the RWA has the
most AT-rich insect genome sequenced to date Briefly Botha et al (2012) reported it to
be comparable to the GC content described in A pisum (pea aphid) (296) (The
International Aphid Genomics Consortium 2010) and A mellifera (honeybee) (33) (The
Honeybee Genome Sequencing Consortium 2006) The high AT-rich genomes of the
RWA and the pea aphid contradict the hypothesized positive correlation between insect
genome size and AT content This AT-richness of the RWA genome has also recently
been reported by Nicholson et al (2015) and according to them the RWA genome is
composed of 291 GC and 709 AT which is the lowest GC of any currently-
assembled insect genome including the pea aphid The data (Figure 312 Table 36
Table 37 and Table 38) in this study correspond with these findings The high AT-
richness within aphid genomes may be evidence of relaxed GC biases and previous
Stellenbosch University httpsscholarsunacza
Chapter 3
96
mutational hotspots (Rocha et al 2010) which may be indicative of RWA genome
plasticity
343 Bioinformatic analysis and reference mapping
Libraries produced by amplification such as in this case through using the Truseq Nano
DNA Sample Prep Kit (Illumina) inherit an intrinsic bias in the position at which reads start
(Figure 312) This bias does not concern an absolute sequence but instead provides
enrichment of a number of different k-mers at the 5 end of the reads According to Chikhi
and Medvedev (2014) in cases like these the statistical model in KmerGenie does not
always correctly fit the input data for some values of k KmerGenie software suggests that
the plot in Figure 313 should ideally be concave with a smooth curve and a clear global
maximum (Chikhi and Medvedev 2014) However Figure 313 does not display a smooth
curve but rather a plot with multiple local maximarsquos for k-mer size Therefore the best k-
mer value that KmerGenie predicted may be suboptimal Subsequently KmerGenie
recommends that in later analysis (eg de novo assembly) a larger k than the one
predicted by the software should also be attempted In principal when the number of
predicted genomic k-mers remains high during a large range of ks the largest k value in
this range is likely to be a better choice (as indicated by the red circles in Figure 313)
resulting in the selected k=27 rather than k=25 (Figure 314)
The mapping (Table 38) and coverage (Figure 315) results of the RWA and pea aphid
were compared because the pea aphid is closely related to the RWA and well
characterised Figure 315 displays coverage - if one genomic region has a coverage of
10X it means that on average 10 different reads are mapped to each nucleotide of the
region The data presented an expected outcome with higher mapping percentage
coverage and quality to the RWA These results are due to the fact that the X
chromosome is isolated from the RWA Because of the close relation between these two
Stellenbosch University httpsscholarsunacza
Chapter 3
97
species mapping and coverage against the pea aphid also produced high quality results
as well as conformation that the RWA and pea aphid have nearly similar AT content
However from the results in Figure 315 it can be concluded that mapping coverage
stretches the whole genome of the RWA and pea aphid suggesting that the RWA X
chromosome fraction sent for sequencing was contaminated with other autosome
chromosomes resulting in whole genome coverage Therefore the process of flow
cytometry is not considered specific enough as it does not allow sorting of only the
chromosome of interest in this case the X chromosome
344 Physical mapping of the X chromosome
The fruit fly is a well-known model organism because of its abundance simplicity to breed
and that they are low cost subjects What is more important is that mapping populations
exist to enable for physical mapping The fruit fly X chromosome is well characterised and
studied with its coding genes non-coding genes and pseudogenes identified Mapping
the X chromosome of the fruit fly to the RWA genome allowed for some characterisation
of the RWA X chromosome The X chromosome of the fruit fly aided in the alignment of
6742 of the proteins of the RWA X chromosome by using the proteins of the fruit fly
and determining on which contigs of the RWA these proteins were mapped This
information will aid in the identification of these proteins and what their functions are
As an additional means of X chromosome characterisation fluorescent in situ
hybridization (FISH) was conducted to identify regions of interest on the sex chromosome
The probes were chosen based on mapping the X chromosome of the fruit fly against the
RWA genome to identify possible orthologous regions The gene descriptions are
presented in Table 31 After the product sizes of the probes were confirmed the
hybridization was conducted to obtain the images in Figure 317 Probe 1 (18S rRNA)
and 2 (histone H4) were used as controls in the study
Stellenbosch University httpsscholarsunacza
Chapter 3
98
In aphids nucleolus organiser regions (NORs) ie clusters of genes for 18S rRNA
(Probe 1) have been examined not only as chromosomal markers but also for their
possible role in X-chromosome elimination in oocytes destined to develop as males
During this process one of the X chromosomes is eliminated to generate eggs with two
autosomal sets and a single X chromosome (Orlando 1974 Blackman and Hales 1986)
It has been shown that the prometaphase X chromosomes are connected by a narrow
protein-DNA bridge carrying the NOR (Mandrioli et al 1999) From the results in Figure
317 it can be observed that probe 1 localized a terminal cluster of rRNA on the X
chromosome in female RWA This confirmed that the RWA X chromosome bears the
NOR Novotnaacute et al (2011) confirmed that the H4 probe also localizes a single cluster of
histone genes at the end of the X chromosome In Figure 317 it can be seen that probe
2 (H4) localization definitely occurs however in these cases the localization area cannot
be confirmed The same results can be observed in the other probes (3 5 6 7 8 and
10) where localization takes place but resolution in the images were insufficient to allow
for separation of single chromosomes on a spread Despite this limitation it was
nonetheless confirmed that these genes are also present in the RWA X chromosome data
set
Stellenbosch University httpsscholarsunacza
Chapter 3
99
35 Appendix
Table A1 t-Test with two samples assuming equal variances (X chromosome vs Middle chromosome)
X chromosome Middle chromosome
Mean 611 420
Variance 002 003
Observations 10 10
Pooled variance 002
Df 18
t stat 2858
P(Tlt=t) one-tail 945 x 10-17
t critical one-tail 173
P(Tlt=t) two-tail 189 x 10-16
t critical two-tail 210
Table A2 t-Test with two samples assuming equal variances (Middle chromosome vs Small chromosome)
Middle chromosome Small chromosome
Mean 420 313
Variance 003 001
Observations 10 10
Pooled variance 002
Df 18
t stat 1809
P(Tlt=t) one-tail 271 x 10-13
t critical one-tail 173
P(Tlt=t) two-tail 542 x 10-13
t critical two-tail 210
Table A3 t-Test with two samples assuming equal variances (X chromosome vs Small chromosome)
X chromosome Small chromosome
Mean 611 313
Variance 002 001
Observations 10 10
Pooled variance 001
Df 18
t stat 5675
P(Tlt=t) one-tail 471 x 10-22
t critical one-tail 173
P(Tlt=t) two-tail 942 x 10-22
t critical two-tail 210
Stellenbosch University httpsscholarsunacza
Table A4 The DNA concentration of an X chromosome pair was determined as follows where the total DNA concentration of the flow cytometry trails were divided by the number of X chromosome pairs sorted
Biotype Sample of chromosome pairs [DNA] (ngul) Total DNA (ng) Total DNA (pg) Total DNA (pg) of chromosome pairs
SAM Sample 5 251782 095 2090 20900 008
SAM Sample 6 138966 038 836 8360 006
SAM Sample 10 425200 610 13420 134200 032
SAM Sample 11 459050 910 20020 200200 044
SAM Sample 12 416004 890 19580 195800 047
SAM Sample 13 631000 780 17160 171600 027
SAM Sample 14 116042 720 15840 158400 137
SAM Total 2438044 4043 88946 889460 036
SAM Average 348292 578 12707 12706571 036
Stellenbosch University httpsscholarsunacza
Stellenbosch University httpsscholarsunacza
Chapter 3
101
Flow cytometry data and trails included in the study can be found in a supplemental file
named Folder A1 (see attached CD)
FastQC results achieved from assessing the quality of the data obtained from the NGS
analysis can be found in a supplemental file named Folder A2 (see attached CD)
KmerGenie estimated the best k-mer length for genome de novo assembly to build
contigs and scaffolds from the NGS raw reads for the X chromosome of the RWA and
can be found in a supplemental file named Folder A3 (see attached CD)
The tabulated results produced by SOAPdenovo presenting the contig and scaffold
assemblies can be found in a supplemental file named Folder A4 (see attached CD)
Qualimap results obtained from mapping the flow sorted RWA X chromosome against
the RWA genome and pea aphid genome can be found in a supplemental file named
Folder A5 (see attached CD)
Physical mapping of the flow sorted X chromosome against the RWA genome can be
found in a supplemental file named Folder A6 All of the data is presented in a spread
sheet format obtained from Geneious (v717) (see attached CD)
Physical mapping of the fruit fly X chromosome against the RWA genome can be found
in a supplemental file named Folder A7 All of the data is presented in a spread sheet
format (see attached CD)
Stellenbosch University httpsscholarsunacza
Probe 5 Probe 7a
Probe 8 Probe 7b
Figure A1 Mitotic chromosome complements of RWA after differential staining and FISH Probe 1 and 2 was used as controls and the other probes were derived from the fruit fly X chromosome
Stellenbosch University httpsscholarsunacza
Stellenbosch University httpsscholarsunacza
Chapter 3
103
36 List of references
Adams M D S E Celniker R A Holt C A Evans J D Cocayne et al 2000 The
genome sequence of Drosophila melanogaster Science 287 2185-2195
Bizzaro D M Mandrioli M Zanotti M Giusti and G C Manicardi 2000 Chromosome
analysis and molecular characterisation of highly repeated DNAs in the aphid
Acyrthosiphon pisum (Aphididae Hemiptera) Genetica 108 197-202
Blackman R L and H Takada 1976 Naturally occurring chromosomal translocation in
Myzus persicae (Sulzer) Journal of Entomology 50 147-156
Blackman RL and D F Hales 1986 Behavior of the X-chromosomes during growth
and maturation of parthenogenetic eggs of Amphorophora tuberculata
(Homoptera Aphididae) in relation to sex determination Chromosoma 94 59-64
Blackman R L 1987 Reproduction cytogenetics and development In A K Minsk and
P Harrewijn (eds) Aphids their biology natural enemies and control 2A 163-195
Blackman R L P A Brown C C Ramfrez and H M Niemeyer 2003 Karyotype
variation in the South American aphid genus Neuquenaphis (Hemiptera
Aphididae Neuquenaphidinae) Hereditas 138 6-10
Botha A M L van Eck C S Jackson N F V Burger and T Schultz 2011 Phloem
feeding insect stress and photosynthetic gene expression Applied
Photosynthesis Online at httpwwwintechopencombooksapplied-photosynthe
sisphloem-feeding-insect-stress-and-photosynthetic-gene-expression
Botha A M 2013 A co-evolutionary conundrum The arms race between Diuraphis noxia
(Kurdmojov) a specialist pest and its host Triticum aestivum (L) Arthropod Plant
Interactions 7 359-372
Stellenbosch University httpsscholarsunacza
Chapter 3
104
Botha A M N F V Burger W Cloete L van Eck K Breeds et al 2016 Draft genome
of female Diuraphis noxia (Hemiptera Aphididae) reveals high levels of genetic
diversity despite parthenogenecity and hypomethylation as a mean to enhance
genomic plasticity Genome Biology ndash in press
Bouhsinni M E F C Ogbonnaya M M Mosaad K Street A Amri et al 2011
Progress in host plant resistance in wheat to Russian wheat aphid (Hemiptera
Aphididae) in North Africa and West Asia Australian Journal of Crop Science 5
1108-1113
Burd J D D R Porter G J Puterka S D Haley and F B Peairs 2006 Biotypic
variation among North American Russian wheat aphid (Homoptera Aphididae)
populations Journal of Economical Entomology 99 1862-1866
Chikhi R and P Medvedev 2014 Informed and automated k-mer size selection for
genome assembly Bioinformatics 30 31-37
Davis G K 2012 Cyclical parthenogenesis and viviparity in aphids as evolutionary
novelties Journal of Experimental Zoology 318 448-459
Doležel J J Bartoš H Voglmayr and J Greilhuber 2003 Nuclear DNA content and
genome size of trout and human Cytometry 51127-128
Doležel J and J Bartoš 2005 Plant DNA flow cytometry and estimation of nuclear
genome size Annals of Botany 95 99-110
Doležel J J Vraacutena J Šafaacuteř J Bartoš M Kubalaacutekovaacute et al 2012 Chromosomes in
the flow to simplify genome analysis Functional and Integrative Genomics 12
397-416
Stellenbosch University httpsscholarsunacza
Chapter 3
105
Fukovaacute I P Nguyen and F Marec 2005 Codling moth cytogenetics karyotype
chromosomal location of rDNA and molecular differentiation of sex chromosomes
Genome 48 1083-1092
Garciacutea-Alcalde F K Okonechnikov J Carbonell L M Cruz S Goumltz et al 2012
Qualimap evaluating next generation sequencing alignment data Bioinformatics
28 2678-2679
Gaston K G 1991 The magnitude of global insect species richness Conserved Biology
5 283-296
Haley S D F B Peairs C B Walker J B Rudolph and T L Randolph 2004
Occurrence of a new Russian wheat aphid biotype in Colorado Crop Science 44
1589-1592
Hanrahan S J and J S Johnston 2001 New genome size estimates of 134 species of
arthropods Chromosome Research 19 809-823
Jankielsohn A 2011 Distribution and diversity of Russian wheat aphid (Hemiptera
Aphididae) biotypes in South Africa and Lesotho Entomological Society of
America 11 1736-1741
Johnston J S K S Yoon J P Strycharz B R Pittendrigh and J M Clark 2007 Body
lice and head lice (Anoplura Pediculidae) have the smallest genomes of any
hemimetabolous imsect reported to date Journal of Medical Entomology 44 1009-
1012
Kearse M R Moir A Wilson S Stones-Havis M Cheung et al 2012 Geneious basic
an integrated and extendable desktop software platform for the organization and
analysis of sequence data Bioinformatics 28 1647-1649
Stellenbosch University httpsscholarsunacza
Chapter 3
106
Kron P and B C Husband 2015 Distinguishing 2N gamete nuclei from doublets in
pollen using flow cytometry and pulse analysis Cytometry Part A 87 943-957
Kuznetsova V G and G C Shaposhnikov 1973 Chromosome numbers of aphids
(Homoptera Aphidinea) of the world auna Entomologicheskoe Obozrenie 52
116-135
Lemeunier F J R David and L Tsacas 1986 The melanogaster species group In
Ashburner M H I Carson and J K Thompson eds The Genetics and Biology
of Drosophila London Academic Press 3 147-188
Li H and R Durbin 2010 Fast and accurate long-read alignment with Burrows- Wheeler
transform Bioinformatics 26 589-595
Lockwood A P M 1961 lsquolsquoRingerrsquorsquo solutions and some notes on the physiological basis
of their ionic composition Comparative Biochemistry and Physiology 2 241-289
Lo K R R Brinkman and R Gottardo 2008 Automated gating of flow cytometry data
via robust model-based clustering Journal of the International Society for
Advancement of Cytometry 73 321-332
Mandrioli M D Bizarro G C Manicardi D Gionghi L Bassoli et al 1996 Cytogenetic
and molecular characterisation of a highly repeated DNA sequence in the peach
potato aphid Myzus persicae Chromosoma 108 436-442
Mandrioli M D Bizzaro M Giusti G C Manicardi and U Bianchi 1999 The role of
rDNA genes in X chromosome association in the aphid Acyrthosiphon pisum
Genome 42 381-386
Manicardi G C M Mandrioli and R L Blackman 2015 The cytogenetic architecture of
the aphid genome Biological Reviews 90 112ndash125
Stellenbosch University httpsscholarsunacza
Chapter 3
107
Merrill S C T O Holtzer and F B Peairs 2009 Diuraphis noxia reproduction and
development with a comparison of intrinsic rates of increase to other important
small grain aphids a meta-analysis Environmental Entomology 38 1061-1068
Miller H D R Porter J D Burd D W Mornhinweg and R L Burton 1994
Physiological effects of Russian wheat aphid (Homoptera Aphididae) on resistant
and susceptible barley Journal of Economic Entomology 87 493-499
Nicholson S J M L Nickerson M Dean Y Song P R Hoyt et al 2015 The genome
of Diuraphis noxia a global aphid pest of small grains BMC Genomics 16 429
Novotnaacute J J Havelka P Staryacute P Kouteckyacute and M Viacutetkovaacute 2011 Karyotype analysis
of the Russian wheat aphid Diuraphis noxia (Kurdjumov) (Hemiptera Aphididae)
reveals a large X chromosome with rRNA and histone gene families Genetica 139
281-289
Orlando E 1974 Sex determination in Megoura viciae Buckton (Homoptera Aphididae)
Monitore Zoologico Italiano 8 61-70
Puterka G J R W Hammon J D Burd F B Peairs T L Randolph et al 2012
Cyclical parthenogenetic reproduction in Russian Wheat Aphid (Hemiptera
Aphididae) in the United States Sexual reproduction and its outcome on biotypic
diversity Journal of Economic Entomology 105 1057-1068
Rocha E P C and E J Feil 2010 Mutational patterns cannot explain genome
composition Are there any neutral sites in the genomes of bacteria PLoS
Genetics doi 101371journalpgen1001104
Sahara K F Marec and W Traut 1999 TTAGG telomeric repeats in chromosomes of
some insects and other arthropods Chromosomes Research 7 449-460
Stellenbosch University httpsscholarsunacza
Chapter 3
108
Swanevelder Z H A K J Surridge E Venter and A M Botha 2010 Limited
endosymbiont variation in Diuraphis noxia (HemipteraAphididae) biotypes from
the United States and South Africa Journal of Economic Entomology 103 887-
897
Tagu D J P Klingler A Moya and J C Simon 2008 Early progress in aphid genomics
and consequences for plant-aphid interactions studies Molecular Plant Microbes
21 701-708
The Honeybee Genome Sequencing Consortium 2006 Insights into social insects from
the genome of the honeybee Apis mellifera Nature 443 931-949
The International Aphid Genomics Consortium 2010 Genome sequence of the pea aphid
Acyrthosiphon pisum PLoS Biology 8 e1000313
Thomas T J Gilbert and F Meyer 2012 Metagenomics ndash a guide from sampling to
data analysis Microbial Informatics and Experimentation 2 3
Traut W 1976 Pachytene mapping in female silkworm Bombyx mori L (Lepidoptera)
Chromosoma 58 275-284
Stellenbosch University httpsscholarsunacza
Chapter 4
Summary
Stellenbosch University httpsscholarsunacza
Chapter 4
110
41 Summary
Aphids are recognized as global agricultural pests that cause significant economic losses
worldwide with devastating effects on crop production Diuraphis noxia Kurdjumov more
commonly known as the Russian wheat aphid (RWA) is a widely distributed pest of
especially wheat Triticum austivum L (Stoetzel 1987) mostly because of the
development of new RWA biotypes that are virulent to different deployed resistant wheat
cultivars RWA biotypes have raised major concerns regarding durability of future RWA
resistance sources (Haley et al 2004)
Over the past 100 years aphids have been extensively studied as a popular model group
among cytogeneticists and thus far approximately a 1000 species have been karyotyped
of which numerous show big differences in chromosome number and morphology
(Kuznetsova and Shaposhnikov 1973 Blackman 1980) The chromosomes of aphids
have been shown to be holocentric meaning that they lack centromeres and display
kinetic activity along the length of the chromosome (Blackman 1987) This makes
chromosomes of similar size and shape almost identical making it impossible to
differentiate from one another However since then modern technology has afforded
scientists an opportunity to isolate specific DNA sequences in aphids Molecular
techniques along with fluorescent in situ hybridization (FISH) have allowed the
localization of rRNA satellites and telomeric (TTAGG)n repeats (Spence et al 1998
Bizarro et al 2000) Furthermore advances in science has also contributed to answering
the research questions presented in this study
In order to address the first research question relating to the composition of the karyotype
of the RWA and identifying the large X chromosome from the other autosome
chromosomes the embryos of female RWA were dissected to isolate differentiating cells
that are mostly in metaphase when chromosomes can be best observed The karyotype
Stellenbosch University httpsscholarsunacza
Chapter 4
111
was constructed from these samples and it was shown that the female RWA does in fact
possess a diploid (2n) chromosome number of 10 corroborating with results
demonstrated by Novotnaacute et al (2011) The X chromosomes were shown to be the largest
chromosomes in the karyotype and could easily be distinguished from the other
chromosomes
The successful differentiation of the RWA X chromosome led to the next research
question which was the physical contribution of the X chromosome to the genome of the
RWA To address this an attempt was made to isolate the RWA X chromosome using
flow cytometry The RWA chromosomes were sorted from one another based on their
size however the small autosome chromosomes could not be separated from the debris
because of their small size and low fluorescence The flow cytometry results displayed
successful separation of the large X chromosomes and middle autosome chromosomes
Using the size differences and the measured lengths of the chromosome pairs the size
of the X chromosomes were calculated to be 018 pg (equating to 1769 Mb)
The next question then was to conduct physical mapping on the sorted chromosomes
To accomplish this the DNA from the isolated X chromosomes was sequenced
Bioinformatic analysis confirmed that the RWA genome is AT-rich Physical mapping of
the proteins of the RWA against the proteins of the fruit fly X chromosome aided in further
characterisation of the RWA X chromosome resulting in the alignment of 6742 of the
length of the RWA X chromosome Fluorescent in situ hybridization also confirmed
orthologous regions of the fruit fly X chromosome to be present in the RWA karyotype
which ultimately suggested that these PCGs are present in the RWA X chromosome data
set
In conclusion it is clear from the karyotype results obtained in this study that the RWA X
chromosome is really large compared to the other autosome chromosomes and that
Stellenbosch University httpsscholarsunacza
Chapter 4
112
further investigation of the RWA X chromosome through flow cytometry sequencing and
FISH allowed for the determination of important characteristics like genome size X
chromosome protein content and possible X chromosome genes The results in the study
also suggested that the X chromosome occupies more than a quarter of the RWA
genome suggesting that more investigation studies into X chromosome genetic variability
would be beneficial and might even help with future resistance programmes
Stellenbosch University httpsscholarsunacza
Chapter 4
113
42 List of references
Bizzaro D M Mandrioli M Zanotti M Giusti and G C Manicardi 2000 Chromosome
analysis and molecular characterisation of highly repeated DNAs in the aphid
Acyrthosiphon pisum (Aphididae Hemiptera) Genetica 108 197-202
Blackman R L 1980 Chromosome numbers in the Aphididae and their taxonomic
significance Systematic Entomology 5 7-25
Blackman R L 1987 Reproduction cytogenetics and development In A K Minsk and
P Harrewijn (eds) Aphids their biology natural enemies and control 2 163-195
Haley S D F B Peairs C B Walker J B Rudolph and T L Randolph 2004
Occurrence of a new Russian wheat aphid biotype in Colorado Crop Science 44
1589-1592
Kuznetsova V G and G C Shaposhnikov 1973 Chromosome numbers of aphids
(Homoptera Aphidinea) of the world auna Entomologicheskoe Obozrenie 52
116-135
Novotnaacute J J Havelka P Staryacute P Kouteckyacute and M Viacutetkovaacute 2011 Karyotype analysis
of the Russian wheat aphid Diuraphis noxia (Kurdjumov) (Hemiptera Aphididae)
reveals a large X chromosome with rRNA and histone gene families Genetica 139
281-289
Spence J M R L Blackman J M Testa and P D Ready 1998 A 169 base pair
tandem repeat DNA marker for subtelomeric heterochromatin and chromosomal
rearrangements in aphids of the Myzus persicae group Chromosome Research
6 167-175
Stellenbosch University httpsscholarsunacza
Chapter 4
114
Stoetzel M B 1987 Information on and identification of Diuraphis noxia (Homoptera
Aphididae) and other aphid species colonizing leaves of wheat and barley in the
United States Journal of Economic Entomology 80 696-704
Stellenbosch University httpsscholarsunacza
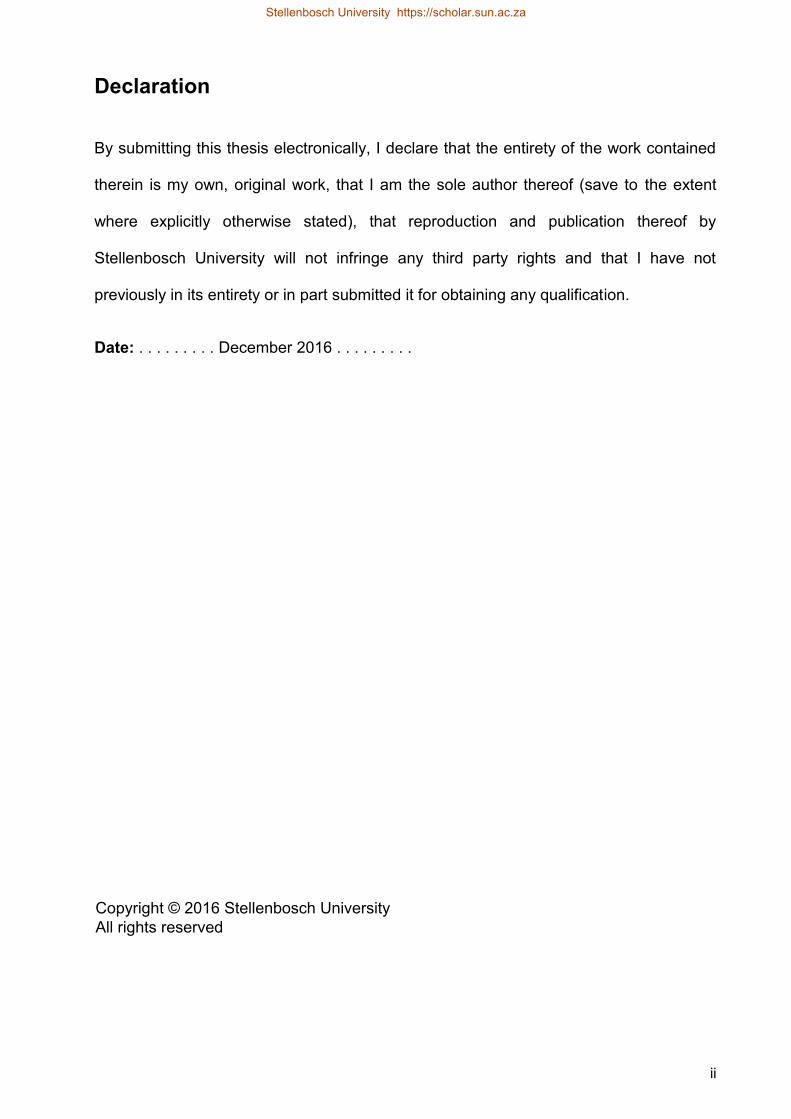
ii
Declaration
By submitting this thesis electronically I declare that the entirety of the work contained
therein is my own original work that I am the sole author thereof (save to the extent
where explicitly otherwise stated) that reproduction and publication thereof by
Stellenbosch University will not infringe any third party rights and that I have not
previously in its entirety or in part submitted it for obtaining any qualification
Date December 2016
Copyright copy 2016 Stellenbosch UniversityAll rights reserved
Stellenbosch University httpsscholarsunacza
iii
Abstract
Diuraphis noxia Kurdjumov (Russian wheat aphid (RWA)) is an economically important
agricultural pest that causes substantial losses in small grain production particularly
wheat and barley Approaches that can be taken to manage this invasive pest include the
cultivation of RWA resistant cultivars The development of new RWA biotypes virulent
against previously classified resistant wheat cultivars presents an additional problem to
the goal of reducing crop losses Therefore studying the underlying molecular genetics
of the RWA brings us closer to understanding wheat resistance to the RWA and ultimately
battling this pest in small grain fields The objectives of this study were to study the sex
(X) chromosome of the RWA by karyotyping and isolation using flow cytometry to
sequence the X chromosome and then to map it against the reference genomes of the
RWA and Acyrthosiphon pisum (pea aphid) Since aphids reproduce via
parthenogenesis mapping populations reliant on sexual recombination are not available
and therefore information about the locations of genes on chromosomes is completely
lacking To this end reference mapping against the X chromosome of Drosophila
melanogaster (fruit fly) was conducted to identify orthologous regions spanning the X
chromosome of RWA The results confirmed that the RWA karyotype consists of a diploid
chromosome number of 10 with a large X chromosome pair and four autosomal
chromosome pairs Flow sorting yielded 2047296 X chromosomes and sequencing
produced a total read count of 136814894 with a Q20 score of 9632 The X
chromosome had a higher mapping percentage to the RWA genome (8288) compared
to that of the pea aphid (513) Interestingly a high mapping coverage across the entire
genome of both aphids was observed suggesting that flow cytometry did not separate
the X chromosome from the rest of the chromosomes of the RWA but allowed unintended
chromosomes to contaminate the series Mapping against the fruit fly X chromosome
produced eight orthologous regions of which six was confirmed to be present in the RWA
Stellenbosch University httpsscholarsunacza
iv
karyotype through in situ hybridization while a protein BLAST of the fruit fly X
chromosome against the RWA genome aided in determining approximately 6742 of
the length of the RWA X chromosome
Stellenbosch University httpsscholarsunacza
v
Uittreksel
Diuraphis noxia Kurdjumov algemeen bekend as die Russiese koringluis (RWA) is lsquon
ekonomiese belangrike landboupes wat lsquon groot afname in klein graangewas produksie
spesifiek koring en gars veroorsaak Metodes wat geiimplementeer kan word om hierdie
indringer pes te beheer en gewas verliese te verhoed sluit die kultivering van RWA
weerstandbiedende kultivars in Die ontwikkeling van RWA-biotipes wat luis populasies
is virulent teen voorheen weerstandbiedende koring kultivars dra addisioneel tot die
probleem by Daarom is dit belangrik om die onderliggende molekulecircre genetika van die
RWA te verstaan sodat ons ook koring weerstand tot RWA kan begryp om uiteindelik
graangewasse teen die pes te beskerm Die doel van hierdie studie is om die seks (X-)
chromosoom van die RWA te bestudeer deur kariotipering en te isoleer deur van
vloeisitometrie gebruik te maak die X-chromosoom se volgorde te bepaal en om dit dan
teen die verwysings genome van RWA en Acyrthosiphon pisum (ertjieluis) te vergelyk
Aangesien hierdie luise ongeslagtelik voortplant bestaan daar nie karteringspopulasies
vir RWA nie en daarom ontbreek inligting oor die ligging van gene op die chromosome
Ten einde die studie doel te bereik was verwysingkartering teen Drosophila
melanogaster (vrugtevlieg) se X-chromosoom gedoen met die doel om
ooreenstemmende areas oor die X-chromosoom te identifiseer Die resultate het bewys
dat die RWA-kariotipe uit lsquon diploiumlde chromosoomgetal van 10 bestaan met lsquon groot X-
chromosoompaar en vier outosomale chromosoompare Vloeisortering het 2047296 X-
chromosome opgelewer en volgordebepaling het lsquon totale leesraam-telling van
136814894 teen lsquon Q20-telling van 9632 gelewer Die X-chromosoom het lsquon hoeumlr
ooreenstemming teenoor die genoom van die RWA (8288) in vergelyking met die
ertjieluis (513) vertoon Beide luise het n hoeuml karteringdekking oor hulle hele genoom
gehad Dit was onverwags en dui daarop dat vloeisitometrie nie spesifiek genoeg was vir
net die X-chromosoom nie en het dus nie-geteikende chromosome deur gelaat wat die
Stellenbosch University httpsscholarsunacza
vi
monster gekontamineer het Kartering teenoor die vrugtevlieg X-chromosoom het agt
ooreenstemende streke geproduseer waarvan ses bewys was om voor te kom in die
RWA kariotipe deur in situ hibridisering terwyl lsquon proteiumlen BLAST van die vrugtevlieg X-
chromosoom teenoor die RWA genoom bygedra het tot die bepaling van minstens
6742 van die lengte van die RWA X-chromosoom
Stellenbosch University httpsscholarsunacza
vii
Acknowledgements
I would like to thank and express my heartfelt appreciation to the following people and
organisations for their support guidance and patience during the period of this study
Professor Anna-Maria Oberholster whose vast knowledge and proficiency made this
MSc a reality Thank you for growing my fascination with agriculture and the
improvement thereof I want to especially express my gratitude for your assistance in
securing me with a National Research Foundation (NRF) grantholder bursary as well as
appointing me as your lab assistant to gain experience outside of my particular line of
work
Thank you so much Doctor Anandi Bierman for all the time and effort you put into guiding
and helping me with this project ie the writing of this thesis with lab work and the
planning around presentations No task is ever too small or big for you and your ability to
pass on information reasonably is truly a gift
Lize Engelbrecht and Rozanne Adams at the Central Analytical Facility (CAF) Fluoresent
Microscopy Unit Stellenbosch University for their assistance and guidance during my
fluorescent microscopy and flow cytometry training and experiments
Colleagues in the Cereal Genomic Laboratory at the Department of Genetics
Stellenbosch University Ilze Visser Francois Burger Nadia Fisher Kelly Breeds Marlon
Le Roux and Hendrik Swiegers
Department of Genetics Stellenbosch University for providing me the education and
infrastructure I needed to facilitate my studies
To my inspirational parents Lops and Hanlie Steyn for their infinite love support and
motivation during my education
Stellenbosch University httpsscholarsunacza
viii
To my biggest enthusiast and fianceacute Louzel Lombard for supporting me in accomplishing
my dreams I appreciate your continuous love and reassurance the last few years
Stellenbosch University httpsscholarsunacza
ix
Table of contents
Declaration ii
Abstract iii
Uittreksel v
Acknowledgements vii
Table of contents ix
List of figures xiii
List of tables xvii
List of abbreviations xix
Chapter 1 - Introduction
11 Introduction 2
12 Thesis outline 4
13 Preface 4
14 Research outputs 4
15 List of references 6
Chapter 2 ndash Literature review
21 Insect pests 9
22 Insect-plant interactions 9
23 Aphids 10
24 Russian wheat aphid (RWA) 11
241 Host plant 11
242 RWA background 12
243 RWA feeding 13
244 Symptoms of RWA infestation 15
245 RWA-wheat interaction 16
246 RWA biotypes 17
Stellenbosch University httpsscholarsunacza
x
247 RWA karyotype 19
248 RWA reproduction 22
249 RWA sex chromosome system 23
25 Insect genomes 25
26 Single-chromosome analysis 28
261 MicromanipulationMicrodissection 29
262 Gradient centrifugation 30
263 Magnetic chromosome separation 30
264 Flow cytometry 31
27 Sequencing 34
271 Sequencing platforms 34
272 Next generation sequencing (NGS) analysis 37
28 List of references 40
Chapter 3 ndash Research
31 Introduction 59
32 Materials and methods 62
321 Karyotyping of RWA chromosomes 62
3211 Slide preparation 62
3212 Chromosome staining and visualisation 63
322 Flow cytometry of RWA chromosomes 64
3221 Preparation of mitotic chromosome suspensions 64
3222 Flow cytometry optimization Gating 64
3223 Flow sorting 66
3224 DNA purification 67
3225 Estimation of RWA genome size 67
3226 Sequencing 68
323 Next generation sequencing (NGS) and bioinformatic analysis of the RWA
sex chromosome fraction 68
Stellenbosch University httpsscholarsunacza
xi
3231 Next generation sequencing 68
3232 Reference mapping of the RWA X chromosome sequence data set
to that of the whole genome of the RWA and pea aphid 68
3233 Physical mapping against the X chromosome of the fruit fly 70
324 Fluorescent in situ hybridization 71
3241 Fluorescent probes 71
3242 Slide preparation and treatment 73
3243 Probe denaturation and hybridization 73
3244 Probe detection and signal enhancement 74
3245 Slide staining and visualisation 75
33 Results 76
331 Karyotyping of RWA chromosomes 76
332 Flow cytometry separation of RWA chromosomes 79
333 Chromosomal DNA concentration 81
334 Estimation of RWA genome size 82
335 Next generation sequencing (NGS) and bioinformatics analysis of RWA X
chromosome 82
336 Mapping of the X chromosome reads to the reference RWA and pea aphid
genomes 86
337 Physical mapping of the X chromosome of the fruit fly to the available X
chromosome sequence of the RWA 88
338 Fluorescent in situ hybridization (FISH) 89
3381 Probe generation for the RWA sex chromosomes 89
3382 Visualisation 90
34 Discussion 92
341 RWA karyotype and genome size estimation 92
342 Flow cytometry and next generation sequencing 94
343 Bioinformatic analysis and reference mapping 96
344 Physical mapping of the X chromosome 97
Stellenbosch University httpsscholarsunacza
xii
35 Appendix 99
36 List of references 103
Chapter 4 ndash Summary
41 Summary 110
42 List of references 113
Stellenbosch University httpsscholarsunacza
xiii
List of figures
Figure 21 Physical characteristics of the RWA (Stoetzel 1987) Side and top view
displaying the distinct morphological features of the RWA
Figure 22 Symptoms of RWA infestation A) Leaf rolling (httpcaliforniaagriculture
ucanrorg) B) Chlorotic streaking (httpentomologyk-stateedu) C) Head
trapping (httpwwwfaoorg)
Figure 23 A general distribution map of the four RWA biotypes found in South Africa
(Jankielsohn 2016)
Figure 24 Female RWA karyotype A) Two large X (sex) chromosomes B) and C) four
autosome chromosome pairs (Novotnaacute et al 2011)
Figure 25 Monocentric (A) and holocentric (B) chromosomes A) Single site of
chromosomal attachment to the centromere B) Multiple sites of
chromosomal attachment
Figure 26 The yearly life cycle of the aphid and ploidy levels for autosomes (A) and
sexual chromosomes (X) (Jaquieacutery et al 2013)
Figure 27 Inheritance of the X chromosome in XXXY standard XXX0 and aphid-like
XXX0 sex-determining systems In aphid-like XXX0 systems the male
transfer its X chromosome to 100 of its progeny giving rise to only
asexual daughters (Jaquieacutery et al 2012)
Figure 28 Process of magnetic sorting The particle of interest is covalently bound with
magnetic beads and sorted using a simple magnet
Figure 29 Schematic view of the components used by the flow cytometer during
sorting of particles The particles move through the sample stream (B)
Stellenbosch University httpsscholarsunacza
xiv
where a charge is pulsed at the break-off point the precise area where the
selected particle is formed into a droplet (C) Two charged deflection plates
(D) situated below the break-off point deflect the charged droplets
containing the particles of interest towards a collection tube and the
uncharged droplets are collected into a waste tube
Figure 210 Example of a flow karyotype generated during flow sorting The peaks
represent the positive datasets In this case the chromosomes of interest
Figure 31 Two embryos (as indicated by arrows) dissected from an adult female RWA
Figure 32 The singlet gate scatter plot was used to exclude doublets and clumps from
the analysis Gate A is an area that is straight diagonal 45ordm and passing
through zero (yellow dotted line) which includes all the single
chromosomes of interest while all the particles outside the gate are
excluded as they consist of doublets clumps or debris
Figure 33 The chromosome gate scatter plot was used to identify the chromosome
sizes based on fluorescence intensity The different sized chromosomes
were given a random colour to aid in identification
Figure 34 Workflow of the quality filtering and alignment of the raw reads obtained
from sequencing at Macrogen (Korea) to the RWA and pea aphid genomes
Where raw read alignment was done using the Alighn to reference tool in
Geneious (v717) and quality filtered reads were aligned using Burrows-
Wheeler aligner (BWA) Raw reads were quality filtered using FastQC and
FastX-Toolkit
Figure 35 Workflow of k-mer analysis and SOAPdenovo of the raw reads obtained
from sequencing at Macrogen (Korea) to generate contigs and scaffolds
Stellenbosch University httpsscholarsunacza
xv
Figure 36 Workflow of bioinformatics analysis of the fruit fly X chromosome against
the RWA genome The coding sequences were aligned using BLASTn and
the proteins were aligned using BLASTp
Figure 37 The RWA chromosomes are stained with Hoechst 33342 to enable their
detection through the confocal microscope The chromosomes of biotype
SAM and SA1 are compared A 10 microm bar is indicated in each image
Figure 38 The karyotype of a female RWA showing the complete set of chromosomes
of 2n=10 [2 sex chromosomes (X) and 8 autosomes (6 middle size and 2
small size chromosomes)] Indicated is a 10 μm-scale bar as well as the
average sizes of each of the different chromosomes respectively
Figure 39 The bar chart is a visual representation of the size differences of the RWA
chromosomes
Figure 310 The single-parameter histogram displays positive peaks for both the middle-
and large chromosomes
Figure 311 The quality of the sequence bases were assessed using FastQC The y-
axis of the graph is divided into three regions good quality calls (green)
reasonable quality calls (orange) and poor quality calls (red) Graph A
represents the forward sequence while graph B represents the reverse
sequence of the RWA X chromosome
Figure 312 The plot indicates the percentage ATGC content per base in the sequence
with the red line representing T blue C green A and black G
Graph A represents the forward sequence while graph B represents the
reverse sequence of the RWA X chromosome
Stellenbosch University httpsscholarsunacza
xvi
Figure 313 Genomic k-mers versus k-mer size Graph A represents the forward
sequence while graph B represents the reverse sequence of the RWA X
chromosome
Figure 314 The graphs embody k-mer abundance histograms A represents the k-mer
size that was used for the forward sequence of the RWA X chromosome
while B and C represent the k-mer sizes for the reverse sequence of the
RWA X chromosome A and B was recommended by KmerGenie for the
forward and reverse sequences respectively but C (self-selected) was used
for the reverse sequence Therefore A and C was used
Figure 315 Coverage deviation and GC content of the alignment of the X chromosome
reads of the RWA and the reference genomes of RWA (top) and pea aphid
(bottom)
Figure 316 Gel electrophoresis was carried out on a 2 agarose gel at 90 volts for 80
minutes to determine if the primers amplified the correct product sizes
Probe 1 and 2 were used as positive controls A 1 kb (Promegatrade) DNA
ladder was used Refer to Table 31 for probe names
Figure 317 Mitotic chromosome complements of RWA after differential staining and
FISH Probe 1 and 2 was used as controls and the other probes were
derived from the fruit fly X chromosome
Figure A1 Mitotic chromosome complements of RWA after differential staining and
FISH Probe 1 and 2 was used as controls and the other probes were
derived from the fruit fly X chromosome
Stellenbosch University httpsscholarsunacza
xvii
List of tables
Table 21 Advantages and disadvantages of various NGS platforms (Van Dijk et al
2014)
Table 22 Methods for alignment assembly and annotation
Table 31 Primer sequences used to generate probes for FISH Expected product size
and gene of origin in the RWA genome are given Primer X probe 18S rRNA
and X probe H4 (Novotnaacute et al 2011) were used as positive controls
Table 32 The mean lengths of the chromosomes were determined by measuring ten
specimen of each size
Table 33 t-Tests were performed to test if the different size chromosome groups are
statistically different (Table A1 Table A2 and Table A3)
Table 34 The summarized data measured after gating allows for the calculation of
the number of events passing through percentage parent as well as
fluorescence
Table 35 The X chromosomes of the samples were pooled together and the DNA
concentration was determined (Table A4)
Table 36 The tabulated results obtained from the NGS including the sequencing
platform used number of bases read count GC percentage and Q20
percentage
Table 37 The tabulated results produced by SOAPdenovo presenting the contig and
scaffold assemblies
Table 38 The tabulated results produced by Qualimap analysis highlighted the
differences in mapping percentage coverage and mapping quality
Stellenbosch University httpsscholarsunacza
xviii
between aligning the RWA and pea aphid genomes against the sorted X
chromosome of the RWA
Table 39 The genome and X chromosome of the fruit fly is compared to that of the
RWA by looking at size- and content differences
Table 310 The fruit fly X chromosome CDS and proteins were aligned against the
RWA genome CDS and proteins in order to characterise the RWA X
chromosome
Table A1 t-Test with two samples assuming equal variances (X chromosome vs
Middle chromosome)
Table A2 t-Test with two samples assuming equal variances (Middle chromosome vs
Small chromosome)
Table A3 t-Test with two samples assuming equal variances (X chromosome vs
Small chromosome)
Table A4 The DNA concentration of an X chromosome pair was determined as
follows where the total DNA concentration of the flow cytometry trails were
divided by the number of X chromosome pairs sorted
Stellenbosch University httpsscholarsunacza
xix
List of abbreviations
degC ndash degrees Celsius
microg ndash microgram
microl ndash microliter
microm ndash micrometre
1C ndash haploid genome size
2C ndash diploid genome size
2N ndash diploid
A ndash adenine
a ndash area
ABI ndash Applied Biosystems
BLAST ndash Basic Local Alignment Search Tool
BLASTn ndash nucleotide BLAST
BLASTp ndash protein BLAST
bp ndash base pair
BSA ndash bovine serum albumin
BWA ndash Burrows-Wheeler aligner
BWT ndash Burrows-Wheeler transform
C ndash cytosine
CAF ndash Central Analytical Facility
Stellenbosch University httpsscholarsunacza
xx
CDS ndash coding sequence
Cy ndash cyanine
Dn ndash Diuraphis noxia
DNA ndash deoxyribonucleic acid
dNTP ndash deoxynucleotide triphosphate
dUTP ndash deoxyuridine triphosphate
FISH ndash fluorescent in situ hybridization
FunCat ndash Functional Catalogue
G ndash guanine
GO ndash Gene Ontology
H ndash height
h ndash hour
ha ndash hectare
IPRI ndash International Plant Resistance to Insects
kb ndash kilobase
kgha ndash kilogram per hectare
M ndash molar or molelitre
mv ndash massvolume
mb ndash megabase
mgml ndash milligrammillilitre
mm ndash millimetre
Stellenbosch University httpsscholarsunacza
xxi
N ndash normality
ngmicrol ndash nanogrammicroliter
NGS ndash next generation sequencing
nm ndash nanometre
NOR ndash nucleolus organiser region
nt ndash nucleotide
PALM ndash photo-activated localization microscopy
PBS ndash phosphate-buffered saline
PCR ndash polymerase chain reaction
pg ndash picogram
PGM ndash personal genome machine
PGS ndash protein coding gene
PI ndash propidium iodide
PR ndash pathogenesis related
PVC-U ndash unplasticized polyvinyl chloride
Q20 ndash quality score (20)
QTL ndash quantitative trait locus
R ndash rand
R ndash resistance
RAM ndash random access memory
RNA ndash ribonucleic acid
Stellenbosch University httpsscholarsunacza
xxii
rpm ndash revolutions per minute
rRNA ndash ribosomal RNA
RT ndash room temperature
RWA ndash Russian wheat aphid
s ndash second
S ndash string
SA1 ndash South African biotype 1
SA2 ndash South African biotype 2
SA3 ndash South African biotype 3
SA4 ndash South African biotype 4
SAM ndash South African mutant biotype
SD ndash standard deviation
SNP ndash single nucleotide polymorphism
SSC ndash saline sodium citrate
ssc ndash side scatter
T ndash thiamine
Taq ndash thermus aquaticus polymerase
US ndash United States
v ndash version
vv ndash volumevolume
wv ndash weightvolume
Stellenbosch University httpsscholarsunacza
xxiii
x ndash times
X chromosome ndash sex chromosome
XXXO or XXXY ndash XO or XY sex-determination system
Stellenbosch University httpsscholarsunacza
Chapter 1
Introduction
Stellenbosch University httpsscholarsunacza
Chapter 1
2
11 Introduction
Diuraphis noxia (Kurdjumov Hemiptera Aphididae) frequently referred to as the Russian
wheat aphid (RWA) is a severe agricultural pest of many cereal crops such as wheat
(Triticum aestivum L) and barley (Hordeum vulgare L) and has had a significant
economic impact worldwide especially on wheat The RWA is characterised by its ability
to develop virulent biotypes that are capable of feeding on former resistant wheat cultivars
(Burd et al 2006) thus counteracting the hostrsquos defensive responses Therefore it is
crucial to research and understand the constant evolutionary struggle between the RWA
and wheat (Botha 2013)
Cytogeneticists have been using aphids as a model group more frequently in the twentieth
century with numerous species within the Aphididae family that have already been
karyotyped The results show a big inconsistency in chromosome number and
morphology between and even within the species (Novotnaacute et al 2011) Furthermore
most of the studies on chromosomes of aphids only mention the diploid chromosome
numbers without providing further information on their karyotypes (Samkaria et al 2010)
Aphids have holocentric chromosomes that lack centromeres and therefore display
kinetic activity along most of the chromosome length (Blackman 1987) The absence of
centromeres makes it almost impossible to distinguish between aphid chromosomes of
similar size mostly because in karyotype studies the centromere is an important
identification feature (Novotnaacute et al 2011)
In the RWA the karyotype differs between sexes with females showing a diploid
chromosome number of 2n = 10 and males 2n = 9 Furthermore the chromosomes are
classified by size into three groups a pair of large chromosomes three pairs of middle-
sized chromosomes and one pair of small chromosomes The male RWA only has one
copy of the X chromosome whereas the female has two copies (Novotnaacute et al 2011)
Stellenbosch University httpsscholarsunacza
Chapter 1
3
The large size of the X chromosome in the RWA makes it an ideal candidate to isolate
and characterise in silico Flow cytometry sorting is a method that is successful in isolating
chromosomes of interest especially if it can be distinguished from other chromosomes in
the karyotype Sorting of chromosomes play a particularly important role in the analysis
of nuclear genome structure and the study of specific and unusual chromosomes (Doležel
et al 2012)
Therefore the aim of this study was to verify the karyotype of the South African RWA by
investigating the chromosomal ultrastructure where after we wanted to characterise the
X chromosome of the RWA through the analysis of chromosomal properties and with high
resolution mapping techniques In order to reach these research goals the following
objectives were set Firstly to construct the RWA karyotype through fluorescent
microscopy using mitotic chromosomes obtained from whole RWA embryos Secondly
to isolate the X chromosome of the RWA using a flow cytometry approach thereby
obtaining DNA from only the X chromosome to sequence it Thirdly to map the
sequenced reads obtained from the X chromosome against the genomes of the RWA
(SAM_Contigs_Version 11 GCA_0014655151 Botha et al 2016 ndash in press) and
Acyrthosiphon pisum (pea aphid) (Acyr_20 GCA_0001429852 The International Aphid
Genomics Consortium 2010) Fourthly to align the well characterised X chromosome of
Drosophila melanogaster (fruit fly) (BDGP6 Adams et al 2000) against the RWA
genome in order to identify orthologous regions with high similarity Lastly to perform
fluorescent in situ hybridization (FISH) with probes derived from the X chromosome of
the fruit fly that is suspected to also hybridize to the X chromosome of the RWA
Stellenbosch University httpsscholarsunacza
Chapter 1
4
12 Thesis outline
The thesis consist of four chapters Chapter 2 contains a brief summary of literature on
the RWA its relationship to wheat virulent biotypes the RWA karyotype RWA
reproduction sequencing platforms and single-chromosome isolation techniques
Chapter 3 focuses on the research conducted in this study and consists of the
constructed karyotype of the RWA the isolation of the X chromosome of the RWA through
flow cytometry bioinformatic analysis of the RWA X chromosome through reference
mapping against the RWA genome pea aphid genome and the X chromosome of the
fruit fly and then finally also FISH studies
Appendix A contains tables and supplemental folders of flow cytometry gating strategies
and results raw data and mapping comparisons of the isolated X chromosome of the
RWA against the RWA and pea aphid genomes raw data of the alignments of the RWA
genome against the X chromosome of the fruit fly and also figures related to FISH
Chapter 4 contains a summary of the main findings of this study and the implications
thereof
13 Preface
The findings obtained and presented in this thesis are the results of a study undertaken
between January 2014 and July 2016 in the Department of Genetics Stellenbosch
University under the supervision of Professor Anna-Maria Oberholster
14 Research outputs
The following outputs were achieved
Steyn L J A Bierman and A M Botha 2016 Karyotyping and in silico characterisation
of the chromosomes of Diuraphis noxia (Hemiptera Aphididae) Biennial
Stellenbosch University httpsscholarsunacza
Chapter 1
5
International Plant Resistance to Insects (IPRI) conference International oral
presentation Cape Town South Africa ndash award for first runner up in MSc
studentrsquos category
Steyn L J A Bierman N F V Burger and A M Botha 2016 Partial characterisation
of the X chromosome of Diuraphis noxia (Hemiptera Aphididae) Chromosome
Research ndash in preparation
Botha A M N F V Burger W Cloete L van Eck K Breeds L J Steyn et al 2016
Draft genome of female Diuraphis noxia (Hemiptera Aphididae) reveals high
levels of genetic diversity despite parthenogenecity and hypomethylation as a
mean to enhance genomic plasticity Genome Biology ndash in press
Stellenbosch University httpsscholarsunacza
Chapter 1
6
15 List of references
Adams M D S E Celniker R A Holt C A Evans J D Cocayne et al 2000 The
genome sequence of Drosophila melanogaster Science 287 2185-2195
Botha A M 2013 A co-evolutionary conundrum The arms race between Diuraphis noxia
(Kurdmojov) a specialist pest and its host Triticum aestivum (L) Arthropod Plant
Interactions 7 359-372
Botha A M N F V Burger W Cloete L van Eck K Breeds et al 2016 Draft genome
of female Diuraphis noxia (Hemiptera Aphididae) reveals high levels of genetic
diversity despite parthenogenecity and hypomethylation as a mean to enhance
genomic plasticity Genome Biology ndash in press
Blackman R L 1987 Reproduction cytogenetics and development In A K Minsk and
P Harrewijn (eds) Aphids their biology natural enemies and control 2 163-195
Burd J D D R Porter G J Puterka S D Haley and F B Peairs 2006 Biotypic
variation among North American Russian wheat aphid (Homoptera Aphididae)
populations Journal of Economical Entomology 99 1862-1866
Doležel J J Vraacutena J Šafaacuteř J Bartoš M Kubalaacutekovaacute et al 2012 Chromosomes in
the flow to simplify genome analysis Functional and Integrative Genomics 12
397-416
Novotnaacute J J Havelka P Staryacute P Kouteckyacute and M Viacutetkovaacute 2011 Karyotype analysis
of the Russian wheat aphid Diuraphis noxia (Kurdjumov) (Hemiptera Aphididae)
reveals a large X chromosome with rRNA and histone gene families Genetica 139
281-289
Samkaria R J Bala and D C Gautum 2010 Karyotype studies on some commonly
occurring aphid species Nucleus 53 55-59
Stellenbosch University httpsscholarsunacza
Chapter 1
7
The International Aphid Genomics Consortium 2010 Genome sequence of the pea aphid
Acyrthosiphon pisum PLoS Biology 8 e1000313
Stellenbosch University httpsscholarsunacza
Chapter 2
Literature review
Stellenbosch University httpsscholarsunacza
Chapter 2
9
21 Insect pests
An insect is characterised as a pest if it has an impact on human lifestyle natural habitats
or ecosystems (Meyer 2007) One of the main problems associated with insect pests
include the damaging effects on crops and subsequently a decrease in food production
(Bailey et al 2010) There are approximately 6 million species of insects of which 50
are known to be herbivorous (Schoonhoven et al 2005) Different insect pests use
various approaches to salvage nutrients from plants All known plant feeding
(phytophagous) insects cause mechanical damage to plant tissues but the degree of
injury varies between different species of insect mainly because of their contrasting
strategies of feeding (Howe and Jander 2008)
The majority (60) of herbivorous insect species have been identified as leaf-eating
beetles (Coleoptera) or caterpillars (Lepidoptera) that mainly cause damage with their
mouthparts which have evolved for chewing snipping or tearing (Schoonhoven et al
2005) Other insects like thrips and spider mites suck the liquid content from lacerated
cells through tube-like structures whereas leaf miners develop and feed on soft tissue
between epidermal cell layers Aphids whiteflies and other Hemiptera insert specialized
stylets between cells to create a feeding site in the phloem (Howe and Jander 2008)
22 Insect-plant interactions
In the course of insect-plant interactions both partners send and receive chemical cues
that influence the outcome of the interaction Contact chemoreceptors on the insect
mouthparts antennae and tarsi measure the suitability of the host as a food source In
opposition plant cells detect and respond to insect movement wound trauma caused by
feeding and compounds in insect oral secretions (Howe and Jander 2008)
The choice of an insect to reject or accept a host plant is influenced by a number of
chemical deterrents and attractants A considerable amount of specialised plant
Stellenbosch University httpsscholarsunacza
Chapter 2
10
compound (secondary metabolites) diversity is a result of the co-evolutionary struggle
between insects and plants (Becerra 2007)
23 Aphids
The Aphididae family consists of approximately 4700 aphid species of which 450 have
been identified as small grain pests One hundred of these aphids have taken advantage
of the monoculture environment of modern agriculture resulting in extensive economic
damage globally (Van Emden and Harrington 2007)
Aphids have small soft bodies and belong to the order Hemiptera (Sternorrhyncha) that
also include whiteflies mealybugs and psyllids The insects that belong to this order are
all evolutionary adapted to consume phloem sap as a main or only food source Aphids
are further grouped into two subfamilies namely the Aphididae that comprise of ldquotruerdquo
aphids as well as the Aphidinae that consist of several aphid pests of food crops (De
Jager et al 2014)
Aphids are dispersed worldwide and are specialised phloem feeders that cause severe
damage to numerous cultivated plants (Tagu et al 2008) The devastating impact of
aphids is associated with their efficient colonization and settlement traits because of
several advantageous biological characteristics Firstly parthenogenesis allows a double
intrinsic rate of increase and a shortened reproductive time Secondly the aphids can
colonize new host plants through winged adults while the wingless adults invest more of
their energy in reproduction Thirdly they cause a significant nutrient withdrawal from
sieve tubes because of high population densities and lastly they transmit numerous
phytoviruses (Giordanengo et al 2010)
The survival of aphids depend on their ability to access phloem bundles disrupting and
evading the plant defence responses and their capability of keeping the phloem cells
functioning while withdrawing their liquid diet In contrast to grazing insects that remove
Stellenbosch University httpsscholarsunacza
Chapter 2
11
big sections of plant tissues aphids only cause minor physical damage Aphids insert
long and flexible stylets that primarily move in the cell wall apoplasm between cells to
access the sieve tubes (Tjallingii 2006)
The best studied aphids and their hosts include Schizaphis graminum (greenbug) that
feed on winter and spring grain (Kindler et al 2002) Acyrthosiphon pisum (pea aphid)
that feed on legume crops (Edwards 2001) and Diuraphis noxia Kurdjumov (Russian
wheat aphid) that feed on wheat and barley (Botha et al 2005) All of these host-specific
aphids are considered as agricultural pests and are highly adapted to their specific
environmental conditions
24 Russian wheat aphid (RWA)
241 Host plant
Bread wheat (Triticum aestivum L) was one of the first domesticated crops and is the
most recent polyploid species among the agricultural crops Wheat is classified as a major
food source as it is one of the worldrsquos leading crops and holds the record for the highest
trade value amongst the cereal species (Gill et al 2004) A total area of approximately
21846 million ha of the world is occupied by wheat production with a grain yield of around
71318 million tons and an average yield of 2900 kgha (Khan et al 2015) Wheat has a
higher nutritive value than other grains and together with other major crops like rice and
maize supplies almost two thirds of the worldrsquos daily calorie and protein intake It is an
important source of protein vitamins and minerals and serves as the staple food source
of 30 of the human population Wheat thrives in temperate regions unlike other similar
cereal crops rice and maize that is best adapted for tropical environments (Gill et al
2004)
Over 600 million tons of wheat is harvested annually but the yield must rise exponentially
(2 per annum on an area of land) over the next 50 years in order to meet the ever
Stellenbosch University httpsscholarsunacza
Chapter 2
12
increasing human demand Food security is projected to become more critical as a result
of population growth (Gill et al 2004) Therefore a multidisciplinary combined approach
to crop enhancement is necessary to guarantee sustainability To reach this objective
high-production irrigated regions will carry on to play a key role but the total yield will
mostly be affected by genetic potential the level of diseases and pests (Duveiller et al
2007) Wheat is susceptible to many kinds of insects but the few species with damaging
effects on yields are especially presenting a challenge to farmers It has been calculated
that pest infestations on average cause 20-37 wheat yield loss worldwide This
calculation translates to approximately $70 billion a year (Dilbirligi et al 2004)
242 RWA background
Russian wheat aphid (RWA) is an economically important agricultural pest that causes
substantial losses in small grains particularly wheat (Lapitan et al 2007) but also
damages barley rye oats and other triticale crops (Webster et al 1987) It is an
elongated small insect relatively 15 to 18 mm in length This phloem-feeding pest is a
lime-green colour and its body is spindle shaped The RWA has short antennae and when
it is viewed from the side a characteristic double tail can be seen (Figure 21) (Stoetzel
1987)
Figure 21 Physical characteristics of the RWA (Stoetzel 1987) Side and top view displaying the distinct morphological features of the RWA
Side view
Top view
Stellenbosch University httpsscholarsunacza
Chapter 2
13
The RWA is native to southern Russia and central Asia from where it dispersed to all
cereal producing areas of the world with the most severe cases occurring in South Africa
USA Canada and South America (Burd et al 2006 Jankielsohn 2011) The RWA is
characterised as an invasive species and was reported for the first time in South Africa in
1978 in an area around Bethlehem in the eastern Free State from where it spread to the
western Free State and parts of Lesotho It was also present in small areas of Gauteng
the North West province as well as Kwazulu-Natal (Walters et al 1980) and more
recently it has been reported in the Western Cape (Jankielsohn 2011)
Cilliers et al (1992) predicted that the economic damage caused by the RWA in South
Africa would amount to approximately R30 million in 1993 with almost half of that sum
being spent on chemical control The yield losses caused by the RWA are severe with
recorded crop losses of 35-60 in South Africa for wheat alone (Robinson 1992) In the
United States (US) damage has been estimated at $890 million from 1987-1993 (Morrison
and Peairs 1998) with more recent research showing that in the US the RWA can reduce
wheat grain yield up to 829 and vegetative biomass up to 765 in Texas and the
Oklahoma Panhandles (Mirik et al 2009)
243 RWA feeding
The RWA feeds on phloem and maintains the interaction at a specific feeding site (Goggin
2007 Giordanengo et al 2010) This must be done without killing the phloem cells in
addition to avoiding and disrupting plant defences (Powell et al 2006) Before the RWA
can establish a suitable relationship with its host the aphid must firstly differentiate
between host and non-host The RWA inserts its stylet comprised of two outer
mandibules and two inner maxillae into the host epidermal apoplasm initiating shallow
probes that last briefly (lt 2 minutes) but result in host recognition by the aphid This
provokes the feeding response or host rejection that ultimately stimulates the flight
Stellenbosch University httpsscholarsunacza
Chapter 2
14
response The flight response is a physiological reaction that occurs in response to a
perceived harmful event attack or threat to survival (Tjallingii and Esch 1993 Will and
Van Bel 2006)
As soon as the RWA have identified a suitable host the adjustable stylets puncture further
into the plant tissue while proteinaceous gelling saliva is secreted This forms a firming
and lubricating sheath around the stylets (Tjallingii 2006) The RWA probe the internal
chemistry of cells with the stylets throughout the transit to the phloem by briefly inserting
and withdrawing the stylets into various cells (Tjallingii and Esch 1993 Giordanengo et
al 2010) This probing function is essential in locating the position of the phloem as well
as to determine the progress of the stylets within the plant tissue (Giordanengo et al
2010)
When the sieve tube elements are reached they are punctured and sap is ingested
passively due to the high endogenous pressure in the cell (Will et al 2009) Prior to
feeding the RWA injects the tubes with watery saliva that is known to mostly counteract
the plantrsquos defence mechanisms causing the sap to flow uninterrupted (Will and Van Bel
2006) This factor allows the aphid to feed at a single site for many hours (Goggin 2007)
The phloem sap that is ingested by the aphid is full of nutrients such as sugars but low
in nitrogen in the form of free amino acids The amino acids existing in the phloem sap
are inadequate to meet the nutritional requirements of the aphid Therefore the RWA
have acquired an endosymbiont Buchnera aphidicola (coccoid у-proteobacterium)
which utilizes the sucrose and aspartate present in the sap to biosynthesize essential
amino acids (Miles 1999 Will et al 2007) This symbiosis allows aphids to use a
nutritionally imbalanced food source such as phloem on which other organisms cannot
survive B aphidicola is maintained between generations within aphid produced cells
called mycetocytesbacteriocytes Research suggests that B aphidicola of different RWA
Stellenbosch University httpsscholarsunacza
Chapter 2
15
biotypes display small amounts of variation in sequence and have contrasting plasmid
copy numbers (Swanevelder et al 2010)
244 Symptoms of RWA infestation
While the RWA feeds it injects eliciting agents into the host plant causing chloroplast and
cellular membrane breakdown in the host plant and activating pathogenesis-related (PR)
genes (Botha et al 2005) The RWA feeds on the most recent plant growth and ultimately
causes chlorophyll production standstill in those leaves (Botha et al 2011) Damage
symptoms of RWA infestations on susceptible wheat cultivars include stunted growth of
the plant chlorosis leaf rolling head trapping and white yellow and in winter purple
longitudinal streaks on the upper side of the leaf surface (Figure 22)(Lapitan et al 2007)
The occurrence of chlorotic streaking inhibits normal growth of the host plant which can
result in death in the case of extreme infestations There are two different types of leaf
rolling in host plants that can be induced by the RWA (Goggin 2007) One is where the
edges of fully expanded and mature leaves curl inward around the RWA colony
protecting it against natural enemies climate and insecticides Another is where the
RWA decreases the size of newly formed leaves that are then prevented from unfolding
This action can result in stunted growth of the entire plant Head trapping usually occurs
later in the season where infested leaves trap the emerging crop heads preventing good
B C A
Figure 22 Symptoms of RWA infestation A) Leaf rolling (httpcaliforniaagricultureucanrorg) B) Chlorotic streaking (httpentomologyk-stateedu) C) Head trapping (httpwwwfaoorg)
Stellenbosch University httpsscholarsunacza
Chapter 2
16
grain fill and ultimately affecting the yield production of the crops (Botha et al 2005 Jyoti
et al 2006)
Approaches that can be taken to manage this pest to reduce crop losses include a mixture
of contact and systemic insecticide the cultivation of RWA resistant cultivars as well as
the introduction of natural biological control agents such as predators parasitoids and
pathogens which are also used to control aphid numbers when they are protected in the
leaf sheath (Carver 2009 Webster et al 1987)
245 RWA-wheat interaction
The RWA affects wheat throughout the growth season and infestations would usually
commence from the appearance of the crop in autumn straight through to crop maturity
(Shea et al 2000) RWA infestations can result in 100 reductions in wheat yield or
cause death of the plant especially if the pest is abundant (Elliot et al 2007) Therefore
early detection and timely controls are very important especially during the winter and
spring growing seasons (Pike et al 1989)
Host plants react to RWA infestations according to three categories These can be
defined as (1) tolerance ie the host withstands conditions of infestations which will
severely harm susceptible plants (2) antibiosis ie the capability of the host plant to
fatally change the biology of the pest and (3) antixenosis ie the disfavour or non-
preference of plants for insect oviposition shelter or food (Painter 1958)
Wheat resistance to RWA can occur through one or a combination of factors Firstly the
pest may not recognise the plant as a suitable host because it is less attractive or
distasteful which is expressed as reduced feeding and oviposition Preformed barriers
and defence molecules may prevent attack and plants may initiate defence responses
against the pest once it has been recognised That negatively impacts the pest
Stellenbosch University httpsscholarsunacza
Chapter 2
17
performance which is expressed as longer larval development time mortality and
reduced larval mass (Hammon-Kosack and Jones 1996)
Resistance (R-) genes also confer resistance to the RWA in wheat (Dogimont et al 2010)
The genetic employment of R-genes in wheat is an efficient economical and well-tested
method in controlling insect pests (Dilbirligi et al 2004) Presently 14 R-genes conferring
RWA resistance have been identified in wheat and its relatives and are titled as Dn
(Diuraphis noxia) genes These Dn genes are designated as follows Dn1 and Dn2 (Du
Toit 1987 1988 1989) dn3 (Nkongolo et al 1991a) Dn4 (Nkongolo et al 1991b) Dn5
(Marais and Du Toit 1993) Dn6 (Saidi and Quick 1996) Dn7 (Marais and Du Toit 1993)
Dn8 and Dn9 (Liu et al 2001) Dnx (Harvey and Martin 1990) Dny (Smith et al 2004)
Dn2414 (Peng et al 2007) Dn626580 (Valdez 2012) and DnCI2401 (Fazel-Najafabadi
2015) Each R-gene may provide resistance to a single or to multiple biotypes which is
the case in wheat containing the Dn7 resistance gene the only recorded germplasm line
resistant to all South African RWA biotypes (Dogimont et al 2010 Jankielsohn 2011)
The mode of response of these genes has been determined as well as the location for
some of these genes on wheat chromosomes The majority of these genes are located
on either chromosome 1B or 7D in hexaploid wheat (Botha et al 2005 Dogimont et al
2010)
246 RWA biotypes
A RWA biotype is a population of aphids that can damage a wheat cultivar that was
previously reported resistant to other biotypes of RWA (Burd et al 2006) There is an
arms race between plant resistance and aphid virulence RWA adaptation results in new
biotypes that are morphologically alike to the original biotypes but different in their
behavioural performance such as their preference for different host genotypes (Lapitan
et al 2007) New RWA biotypes are likely due to the diversification theory ndash two
Stellenbosch University httpsscholarsunacza
Chapter 2
18
subpopulations live in different environments that select for different alleles at a particular
locus ndash however new aphid biotypes still show little nuclear and mitochondrial sequence
variation RWA biotypes are not differentiated on morphology but on their potential to
overcome resistance their fecundity and the destruction they cause to a plant differential
(Swanevelder et al 2010)
The observation of newly emerging RWA biotypes is a growing concern amongst farmers
especially in areas where resistant wheat cultivars are now put at risk because of new
biotypes (Botha et al 2005) The appearance of new RWA biotypes implies either new
introductions or adaptations and diversification of existing populations It is very important
to research new sources of resistance that can be implemented immediately for more
durable resistance (Haley et al 2004) Biotypes can be differentiated from one another
according to two types of existing classification systems In the two-category system the
aphids are categorized as virulent or avirulent whereas in the three-category system the
aphids are classified as virulent intermediate or avirulent Classification of these systems
is exclusively based on the phenotypic response of the host as a direct result of aphid
feeding (Burd et al 2006 Puterka et al 2012)
A RWA biotype virulent to cultivars carrying the Dn4 resistance gene was discovered in
2003 in south-eastern Colorado in the US (Haley et al 2004) In South Africa four new
RWA biotypes have been reported since 2005 The first resistance-breaking biotype
against cultivars containing the Dn1 resistance gene was reported in 2005 in the eastern
Free State (Figure 23) and is known as SA2 (South African biotype 2) (Tolmay et al
2007) Shortly thereafter in 2009 a second resistance breaking biotype emerged that
exhibited virulence to the same resistance sources as SA2 (Dn1 Dn2 Dn3 and Dn9) as
well as virulence against Dn4 known as SA3 (South African biotype 3) (Jankielsohn
2011) During 2011 SA4 (South African biotype 4) relatively unaffected by the Dn5
resistant gene was discovered (Jankielsohn 2014) The SA2 SA3 and SA4 RWA
Stellenbosch University httpsscholarsunacza
Chapter 2
19
biotypes are highly virulent when compared to the original South African biotype SA1
(Jankielsohn 2016) SA1 infestations do not cause damage to resistant wheat cultivars
except in the germplasm containing the dn3 gene
The South African mutant biotype SAM was developed from SA1 after laboratory
induced selective pressure on Dn resistant cultivars (Swanevelder et al 2010) SAM
causes symptoms in all known resistant wheat cultivars including those containing Dn7
247 RWA karyotype
Cytogenetic research was restricted in aphids in the past and confined to counting and
size-sorting of the chromosomes However presently aphids are a popular model group
among cytogeneticists (Novotnaacute et al 2011) The interaction between histones and non-
histone proteins leads to the formation of chromosomes (Margueron and Reinberg 2010
Zhou et al 2011) Even though there is no noticeable connection between genome size
and the amount of chromosomes (Heslop-Harrison and Schwarzacher 2011) Schubert
et al (2001) believed that large genomes must be spread into a number of smaller
Biotype 1 Biotype 2 Biotype 3
Figure 23 A general distribution map of the four RWA biotypes found in South Africa (Jankielsohn 2016)
Biotype 4
Stellenbosch University httpsscholarsunacza
Chapter 2
20
chromosomes ultimately because chromosome size has an upper boundary The
karyotype of aphids has been shown to vary in chromosome number and morphology
between and even within the species (Novotnaacute et al 2011)
The female karyotype of the RWA (2n = 10) consists of 4 autosomal chromosome pairs
as well as a pair of large X (sex) chromosomes (Figure 24) The male karyotype of the
RWA (2n = 9) consists of 4 autosomal pairs but only a single large X chromosome The
4 autosomal chromosome pairs present in both sexes of the RWA can be classified
according to size into 2 classes 3 pairs of middle-sized chromosomes and 1 pair of small
chromosomes The X chromosomechromosomes are classified as the largest
component of the karyotype (Novotnaacute et al 2011)
The estimated genome sizes of the female and male RWA is 2C = 086 pg and 2C = 070
pg respectively The differences with regard to the DNA content of the two genders
proposes that the X chromosomes occupies approximately 35 (1C = 043 pg) of the
female haploid genome The X chromosome in the RWA is one of the largest sex
Figure 24 Female RWA karyotype A) Two large X (sex) chromosomes B) and C) four autosome chromosome pairs (Novotnaacute et al 2011)
X chromosomes (A)
Middle autosome chromosomes (B)
Small autosome chromosomes (C)
Stellenbosch University httpsscholarsunacza
Chapter 2
21
chromosomes in the animal kingdom measuring approximately 10 microm (Novotnaacute et al
2011)
Large X chromosomes are described in several aphid species The Neuquenaphis
(Neuquenaphidinae) have X chromosome sizes ranging from 11 to 15 of the total
genome (Blackman et al 2003) and for the related Myzus persicae the X chromosome
reaches almost 27 of the genome size (Blackman and Takada 1976) Several papers
have presented data on large heterochromatin blocks and highly repetitive sequences in
the X chromosomes of some aphid species (Mandrioli et al 1999)
Karyotype variation is likely due to the holocentric chromosomes of the RWA Holocentric
chromosomes lack primary constrictions (centromeres) and thus have multiple sites of
attachment to the spindle (Figure 25) Therefore these holocentric chromosomes have
kinetic activity spanning across most of the chromosome axis (Monti et al 2012)
In the course of mitotic anaphase these chromosomesrsquo sister chromatids disconnect in
parallel and display a lsquoholokineticrsquo movement (Peacuterez et al 1997) The kinetic activity along
the chromosome causes chromosomal fragments to bind to the microtubules which
causes them to move into the daughter cells during cell division (Blackman 1987) In
Figure 25 Monocentric (A) and holocentric (B) chromosomes A) Single site of chromosomal attachment to the centromere B) Multiple sites of chromosomal attachment
A
B
Stellenbosch University httpsscholarsunacza
Chapter 2
22
contrast these chromosomal fragments may be lost during mitosis and meiosis in
monocentric chromosomes (Figure 25) because chromosomes attach to microtubules
at a certain region (the centromere) and move in the direction of the pole during anaphase
with the centromere in front (Monti et al 2012)
The position of the centromere in organisms with monocentric chromosomes is a valuable
descriptive factor The fact that the aphid chromosome lacks a centromere makes
chromosomes of similar size almost indistinguishable within the species (Novotnaacute et al
2011)
248 RWA reproduction
In places where the RWA is indigenous right before winter males and females will mate
and lay eggs These eggs will stay as eggs for the whole winter and then hatch in the
spring However male RWA rarely develop and only exist in colder climates (Hodgson
and Karren 2008)
There are no male RWA present in South Africa (Webster et al 1987) and colonies are
established by apterous virginopara (wingless parthenogenetic females) (Jyoti et al
2006) Various reproductive and dispersal strategies are used by the RWA that finally
result in their abundance (Goggin 2007) Parthenogenesis and vivipary which are the
primary modes of RWA reproduction impart a highly efficient colonisation habit of new
hosts to these aphids Parthenogenesis is reproduction through development of
unfertilised eggs These unfertilised eggs will usually only give rise to females Vivipary
is the ability of each female RWA to give birth to live daughters (Goggin 2007
Giordanengo et al 2010) and these daughters are already pregnant with embryonic
granddaughters (Michaud and Sloderbeck 2005) These abilities of the RWA shortens
the time between generations allowing nymphs to reach maturity and reproduce at a
rapid rate ndash a factor implicated for their large economic impact (Giordanengo et al 2010)
Stellenbosch University httpsscholarsunacza
Chapter 2
23
Another effective method the RWA uses to colonize is through the winged dimorphism
which enable winged adults to colonize new distant hosts during unfavourable seasons
or in situations of high population densities while the wingless adults redirect the energy
required for producing flying organs into their reproductive cycles (Goggin 2007)
249 RWA sex chromosome system
The sex chromosome system for RWA has been identified as XXXO as seen in a
number of different aphid species This system never possesses a Y chromosome and is
essential for parthenogenesis Crucial biological processes like sex determination
imprinting speciation and genomic conflicts are all influenced by the sex chromosomes
Sex chromosomes display many unusual characteristics like inheritance patterns
reduced recombination and hemizygosity which all play a big role in their response to
evolutionary factors (Jaquieacutery et al 2012)
The RWA male that has the sex-chromosome constitution XO can only be produced
through modified mitosis by parthenogenetic XX females During this process one of the
X chromosomes is discarded to create eggs that consist of a single X chromosome as
well as two autosomal sets Thereafter while the autosomes divide or disconnect
independently the two X chromosomes are linked with one another at a single end unlike
normal mitosis which forms a C-shaped structure Thereafter one of the X chromosomes
is discarded from the complement and the sister chromatids of the other X chromosome
move to the daughter cells (Orlando 1974 Blackman and Hales 1986)
One of the most prominent distinctions between RWA and other XXXO organisms such
as nematodes insects or molluscs is their unusual pattern of inheritance of the X
chromosome during a life cycle where asexual and sexual reproduction is combined
Figure 26 displays the life cycle of the RWA and shows that it consists of numerous
events of apomictic parthenogenesis proceeding with a single round of sexual
Stellenbosch University httpsscholarsunacza
Chapter 2
24
reproduction in autumn After 10-20 generations of apomictic parthenogenesis asexual
reproduction finally leads to the production of sexual RWA individuals where the male
aphids randomly inherit only one of the X chromosomes of the asexual female (Wilson et
al 1997 Caillaud et al 2002)
The male RWA produces gametes that are haploid for the X as well as autosome
chromosomes Therefore when the male and female gametes fuse the diploidy of the X
and autosome chromosomes are restored to generate an asexual female This means
that after sexual reproduction the asexual progeny inherited half of the autosomes and X
chromosomes from the mother and the other half from the father (Figure 27)
Figure 27 Inheritance of the X chromosome in XXXY standard XXX0 and aphid-like XXX0 sex-determining systems In aphid-like XXX0 systems the male transfer its X chromosome to 100 of its progeny giving rise to only asexual daughters (Jaquieacutery et al 2012)
Figure 26 The yearly life cycle of the aphid and ploidy levels for autosomes (A) and sexual chromosomes (X) (Jaquieacutery et al 2013)
Stellenbosch University httpsscholarsunacza
Chapter 2
25
The RWA pattern of X chromosome inheritance is different from standard XXXO or
XXXY systems where the female offspring inherits one X chromosome from each parent
(mother and father) but where males only receive a copy of the X chromosome from the
mother As explained previously during RWA sexual reproduction male aphids transmit
their X chromosome to 100 of their progeny ultimately only producing asexual
daughters (Figure 27) (Jaquieacutery et al 2012)
25 Insect genomes
Over the last few years of declining DNA sequencing cost as well as more accessible
sequencing services in primary laboratories and companies it has become more
economical for many entomologists to make use of de novo genome sequencing and
assembly methods for insect species However in order to produce a high quality
reference genome sequence generation alone is not enough and in various cases
extremely fragmented genome assemblies prevent high quality gene annotation and
other sought after analysis of sequencing data (Richardson and Murali 2015)
The de novo assembly of insect genomes is often hampered by high polymorphism the
lack of ability to breed for genome homozygosity and finally the small physical size of
insects that ultimately limits the amount of DNA to be extracted from a single individual
Modern improvements in sequencing technology and assembly strategies allows insect
genomes to be studied more effectively (Richardson and Murali 2015)
Arthropod genome sizes exhibit considerable diversity with the largest reported to date
being that of the grasshopper (Orthotera Neoconocephalus triops L) (1C = 7 125 Mb
(male)7 752 Mb (female) 793 pg) and the smallest being the two spotted spider mite
(Trombidiformes Tetranychus urticae) (1C = 907 Mb 009 pg) (Hanraham and Johnston
2001 Johnston et al 2007)
Stellenbosch University httpsscholarsunacza
Chapter 2
26
Drosophila melanogaster (fruit fly) was the first arthropod high quality complete genome
to be sequenced using shot-gun sequencing (BDGP6 Adams et al 2000) and presently
the model dataset for whole genome assembly amongst insects (Myers et al 2000) The
genome of the fruit fly has been determined to be 180 Mb in size of which a third consists
of centric heterochromatin The 120 Mb of euchromatin is located on the sex chromosome
and two large autosomal chromosomes whereas the fourth small chromosome only
comprises of 1 Mb of euchromatin The heterochromatin mainly includes short simple
sequence elements repeated for many bases which is occasionally interrupted by
inserted transposable elements and tandem arrays of ribosomal RNA genes (Adams et
al 2000)
The first aphid genome to be sequenced belonged to the pea aphid Acyrthosiphon pisum
(Acyr_20 GCA_0001429852 The International Aphid Genomics Consortium 2010) It
was also the first published whole genome sequence of a basal hemi-metabolous insect
in contrast to the numerous published genomes of homo-metabolous insects The pea
aphid that is commonly used in laboratory research is a pest of legume crops (Fabaceae)
and is very closely related to many significant crop pests such as the RWA as well as
the green peach aphid (Myzus persicae) (Von Dohlen et al 2006) The 464 Mb draft
genome assembly of the pea aphid together with the genomes of its dependant bacterial
symbionts (Shigenobu et al 2000 Degnan et al 2009 2010) offers important information
that will enable researchers to discover the genetic basis of co-evolved symbiotic
associations of host plant specialization of insect-plant interactions and of the
developmental causes of extreme phenotypic plasticity
The International Aphid Genomics Consortium (2010) discovered that there was a major
gene duplication in the pea aphid genome that seemed to come from the time around the
origin of aphids They also revealed that the pea aphid genome has more coding genes
than any previously sequenced insects with the high gene number being an indication of
Stellenbosch University httpsscholarsunacza
Chapter 2
27
both extensive duplication as well as the presence of genes with no orthologs in other
insects There are more than 2000 gene families (for example chromatin modification
miRNA synthesis and sugar transport) expanded in the aphid lineage relative to other
published genomes (The International Aphid Genomics Consortium 2010)
Recently the genome sequence of the RWA (GCA_0011863851) was published for the
first time by Nickolson et al (2015) The assembled genomic scaffolds cover 393 Mb
which is equal to 93 of its estimated 421 Mb genome and contained 19097 genes The
authors determined that the RWA has the most AT-rich insect genome that have been
sequenced to date reaching 709 with a bimodal CpG distribution and a whole set of
methylation related genes Nickolson et al (2015) determined that the genome of the
RWA has a prevalent general reduction in the number of genes per ortholog group which
include defensive detoxification chemosensory and sugar transporter groups when
compared to the pea aphid genome as well as a 65 decrease in chemoreceptor genes
Thirty of 34 known RWA salivary genes were found in the genome assembly that
exhibited less homology with the salivary genes commonly expressed in insect saliva
including glucose dehydrogenase and trehalase However greater conservation was
displayed among genes that are expressed in RWA saliva but which is not detected in
the saliva of other insects Genes that are involved in insecticide activity and
endosymbiont-derived genes were also discovered in the assembly along with genes
involved in virus transmission even though RWA is not a viral vector (Nickolson et al
2015)
The mitochondrial genomes of insects are closed double stranded and circular Their
sizes range between 13-20 kb while their gene content is well conserved and they have
a low rearrangement rate These features make mitochondrial genomes of insects a very
valuable tool to study deep divergences and molecular evolution (Hu et al 2009) The
insect mitochondrial genome characteristically encodes 37 genes that include 13 protein-
Stellenbosch University httpsscholarsunacza
Chapter 2
28
coding genes 2 ribosomal RNA and 22 transfer RNA The whole insect mitochondrial
genome is compactly arranged with very limited intergenic nucleotides overlapping
neighboring genes and no introns (Chai et al 2012) Furthermore the gene order of
mitochondria in aphids psylids and many whiteflies is known to resemble the projected
Insecta ancestral gene order with a mitochondrial sequence divergence of only 131
for aphids which is significantly less than that of psylids and whiteflies (Baumann et al
2004)
Nucleotide diversity in aphid mitochondrial genomes has been extensively studied even
though only three genomes are currently available which includes the RWA The
complete RWA mitochondrial genome is 15721 bp long and is comprised of 38 genes
which is characteristic within most insects These 38 genes consist of 20 different transfer
RNA genes 13 protein-coding genes and 2 ribosomal genes (De Jager et al 2014) The
mitochondrial genome size of the RWA falls in the range of animal mitochondrial genomes
(~16000 bp) and corresponds to that of the ancestral aphid species (Crozier and Crozier
1993)
26 Single-chromosome analysis
Genomes may be large and complex because of a high content of repetitive and
duplicated sequences or as a result of ploidy Even though it is not a problem to fingerprint
the large numbers of clones necessary to create a physical map (Luo et al 2003) and to
sequence billions of DNA bases (Metzker 2010) the problem is to assemble the large
number of fingerprints and short reads into an unambiguous order that correctly
represents the genome (Wei et al 2009 Alkan et al 2011 Treangen and Salzberg 2012)
These factors hinder the construction of clone-based physical maps positional gene
cloning and de novo genome sequencing One solution is to reduce the sample
complexity by dissecting the genomes to single chromosomes Another area which will
Stellenbosch University httpsscholarsunacza
Chapter 2
29
benefit from the analysis at single-chromosome level is the assembly of haplotype-
resolved genome sequences (Yang et al 2011)
Most of the cells in an organism contain chromosomes that are at interphase Their nuclei
consist of decondensed chromosomes that make it impossible to separate from one
another Separation is only possible when chromosomes are more condensed during the
metaphase stage of cell devision (Doležel et al 2012)
The utility of isolated separated chromosome fractions is determined by their purity and
quality of DNA Purity depends on the degree to which the chromosome of interest can
be resolved from other chromosomes chromosome clumps chromatids and
chromosome fragments in the sample (Doležel et al 2012) Currently different methods
of chromosome isolation exist which include the following micromanipulation gradient
centrifugation magnetic chromosome separation flow cytometry etc
261 MicromanipulationMicrodissection
Initial isolations of single chromosomes from spreads of metaphase chromosomes of
dividing cells made use of a micromanipulator (Chambers and Sands 1923 Barigozzi
1939 Scalenghe et al 1981 Schondelmaier et al 1993) This device is used to physically
interact with a sample under a microscope where a level of precision of movement is
required that simply cannot be achieved by the unaided human hand Originally the
process of microdissection involved isolating the chromosome by using glass
microneedles which was a technically challenging task (Scalenghe et al 1981) The
introduction of laser microbeams in microdissection (Monajembashi et al 1986) improved
the isolation procedure however it still involved the use of the glass microneedles to
collect the chromosome isolated via the laser (Zhou and Hu 2007) More recently the
PALMreg Robot-Microbeam system was introduced that uses a laser to cut chromosomes
from microscope slides as well as to catapult fragments into a collection tube (Olofsson
Stellenbosch University httpsscholarsunacza
Chapter 2
30
et al 2012) This resulted in the negation of the glass needles and improvement of
accuracy One of the most prominent advantages of this technique is that the individual
operating the micromanipulator can clearly identify the chromosomes to be isolated A
disadvantage is that only a few chromosomes can be collected or isolated at a time
(Hobza and Vyskot 2007) which affects the quality of the chromosomal DNA making it
only suitable for basic types of analysis (Ma et al 2010) Ultimately microdissection
cannot meet the requirements for sequencing complete chromosomes because of low
coverage The latest developments in the area of isolating chromosomes through
micromanipulation include the atomic force microscope nanolithography that makes the
dissectionextraction of fragments as small as 04 microm possible (Di Bucchianico et al
2011)
262 Gradient centrifugation
Another method that is presented to isolate chromosomes in large numbers is by making
use of relative density by gradient centrifugation Chromosomes are obtained from
populations of dividing cells in an aqueous suspension This method however only allows
the large and small chromosomes to be separated from one another and is therefore not
a viable option to isolate selected chromosomes within these fractions (Stubblefield and
Oro 1982)
263 Magnetic chromosome separation
Magnetic sorting is a method that is used to separate cells cell organelles and
microorganisms (Molday et al 1977 Owen 1983) The process of magnetic sorting entails
an affinity couple usually an antibody that is covalently bound or physically absorbed to
magnetic microspheres Ugelstad et al (1988) designed polysterene magnetic
microspheres or beads for this purpose Magnetic beads contain iron oxide (Fe3O4) (Lea
et al 1985 Howell et al 1988) and by binding the chromosome of interest to these beads
Stellenbosch University httpsscholarsunacza
Chapter 2
31
trough an antigen-antibody approach and using a simple permanent magnet (Figure 28)
enables large amounts of the chromosome to be sorted in a short time (Dudin et al 1988)
It is recommended to isolate and extract chromosomes from an unperturbed system or
cell line (Vitharana and Wilson 2006)
The positive aspect of using magnetic beads is that it makes use of a probe that is specific
to the chromosome of interest eliminating the non-specific methods used to identify
certain chromosomes through fluorescent dyes ndash DNA binding or intercalating (Vitharana
and Wilson 2006) However a disadvantage of this approach is that it suffers from lower
purities in isolated fractions and target sequences must be available (Doležel et al 2012)
264 Flow cytometry
Presently the most effective and universally common method for separating
chromosomes on a large scale is flow cytometry which is an approach that studies and
analysis the optical parameters of miniscule particles while they pass through a narrow
stream of liquid Flow cytometry analysis cells and cell organelles at rates of 102ndash104s If
a chromosome of interest can be identified from other chromosomes based on its optical
properties (light scatter fluorescence) it can be purified in large quantities (Doležel et al
2012)
Figure 28 Process of magnetic sorting The particle of interest is covalently bound with magnetic beads and sorted using a simple magnet
a b c
Stellenbosch University httpsscholarsunacza
Chapter 2
32
This method of chromosome isolation is normally used with mitotic preparations because
using suspensions of meiotic chromosomes is not practical (Bartholdi 1990) The tissues
and cell cultures used to prepare the samples must be utilized in such a manner to
produce the highest proportion of cells in metaphase It has been determined that roughly
95 of animal cells can be accumulated in metaphase (Carrano et al 1976 1979)
whereas in plants the value of metaphase cells decrease to round about 50 (Vraacutena et
al 2000 Vlaacutečilovaacute et al 2002) The chromosomes are released into an appropriate
isolation buffer from the enhanced metaphase cell population where after the
chromosomal DNA is stained with a DNA-specific fluorochrome allowing the
chromosomes to be identified according to their level of fluorescence intensity (DNA
content) (Doležel et al 2012)
The flow cytometer is fitted with a single laser that is used as a light source (Figure 29
A) During flow cytometry the chromosome of interest is labelled with a biotin- or
fluorochrome-labeled chromosome-specific probe (Dudin et al 1988 Vitharana and
Wilson 2006) by initially staining the suspension of intact chromosomes with a DNA-
specific dye The sample is then introduced to the flow chamber of the instrument from
where the chromosomes will be transported in a narrow stream of liquid (Figure 29 B)
The chromosomes are individually measured and quantified by the laser beam scattered
light and emitted fluorescence During sorting the liquid stream containing the
chromosome of interest is broken into droplets and electrically charged The chromosome
droplets are then sorted by electrostatically charged deflection plates and collected in
suitable containers (Figure 29 D) (Meksem and Kahl 2005) Fundamentally when the
chromosomes have been analysed the flow karyotype is generated (Figure 210) The
flow karyotype consists of a histogram of fluorescence intensity forming peaks for each
chromosome relative to its DNA content (Meksem and Kahl 2005) Flow cytometry allows
for the investigation of large populations of organelles in brief periods of time and
Stellenbosch University httpsscholarsunacza
Chapter 2
33
represents the output data in flow karyotypes (Figure 210) Flow karyotypes illustrate the
distributions of chromosomal DNA content where each chromosome is represented by a
distinctive peak The peakchromosome location is relative to fluorescence intensity and
the volume indicates the rate of occurrence of that specific chromosome It is possible
that some chromosome peaks may overlap due to their similar sizes and total DNA
content making it very difficult to resolve the chromosomes from one another (Doležel et
al 2012)
Flow cytometry software allows for gating strategies to sort particles of interest Gating
allows for the selection of single chromosomes through graphic depictions by identifying
doublets (which are two chromosomes stuck together) clumps (which are more than two
chromosomes stuck together) as well as debris that contaminate the series Doublet and
A - Laser C ndash Droplet formation
B ndash Sample stream
Sorted particles Sorted particles
D ndash Deflection plates
Figure 29 Schematic view of the components used by the flow cytometer during sorting of particles The particles move through the sample stream (B) where a charge is pulsed at the break-off point the precise area where the selected particle is formed into a droplet (C) Two charged deflection plates (D) situated below the break-off point deflect the charged droplets containing the particles of interest towards a collection tube and the uncharged droplets are collected into a waste tube
Stellenbosch University httpsscholarsunacza
Chapter 2
34
clump discrimination are very important to prevent any chromosomes that are not of
interest from passing through to sample collection (Kron and Husband 2015)
27 Sequencing
271 Sequencing platforms
Frederick Sanger and his associates developed the first method of determining the exact
sequence of single stranded DNA molecules in 1977 The method became known as
Sanger sequencing and is based on the selective incorporation of chain terminating
labelled dideoxynucleotides by DNA polymerase during in vitro amplification (Sanger et
al 1977) In 2005 next generation sequencing (NGS) technologies were introduced and
have since transformed genomic research The development of NGS technologies were
catalysed by the great demand for revolutionary methods that deliver rapid low-cost and
accurate genome information The inexpensive production of large volumes of sequence
data - in some cases in excess of one billion short reads per instrument run - is the primary
advantage over conventional methods (Metzker 2010) NGS methods overcome the
limited scalability of traditional Sanger sequencing by either creating micro-reactors
andor attaching the DNA molecules to be sequenced to solid surfaces or beads allowing
for millions of sequencing reactions to happen in parallel (Reis-Filho 2009)
Figure 210 Example of a flow karyotype generated during flow sorting The peaks represent the positive datasets In this case the chromosomes of interest
Stellenbosch University httpsscholarsunacza
Chapter 2
35
There is a wide selection of different major NGS technologies such as Rochersquos 454
pyrosequencing Illuminarsquos MiSeqHiSeqNextSeq Applied Biosystemsrsquo SOLiD Ion
Torrentrsquos PGM and the PacBio system (Table 21) These NGS platforms are different in
many ways including read length and the number of DNA molecules they sequence in
parallel Traditional Sanger sequencing machines analyse terminally labelled DNA
strands and can read about 800 bases of 100 DNA molecules at the same time The NGS
platforms however read numerous DNAs in parallel but have smaller read lengths For
instance 454rsquos machine reads 400000 DNAs that are each about 250 bases in length
Illuminarsquos MiSeq can produce paired-end reads that are 300 bases in length each while
the platform with the greatest output overall is the HiSeq 2500 generating 4 billion
fragments in a paired-end approach with 125 bases for each read in a single run Illumina
has also developed the HiSeq X Ten which is an array of 10 HiSeq machines sold as a
unit for higher throughput than ever achieved in the past (Hodkinson and Grace 2015)
NGS platforms also differ in cost per base the 454 machine sequences are about ten
times cheaper than traditional Sanger technology and Illumina and ABI are 100 times
cheaper (Von Bubnoff 2008) All of these technologies have different advantages and
disadvantages (Table 21)
Chen et al (2008 2010) suggested that NGS of chromosomes provide a well-designed
approach toward identifying the chromosome composition as well as to map
chromosomal breakpoints with an error margin of less than 1000 bp Sudbery et al
(2009) determined with studies on mice that sequencing entire chromosomes permits the
generation of condensed maps of genetic variation between diverse genotypes They
also confirmed that it is a powerful tactic to discover single nucleotide polymorphisms
(SNPs) to derive high resolution images of quantitative trait locus (QTL) regions
Stellenbosch University httpsscholarsunacza
Table 21 Advantages and disadvantages of various NGS platforms (Van Dijk et al 2014)
NGS Platform Advantages Disadvantages
Rochersquos 454
The long reads (1 kb maximum) are easier to map to a reference genome and are an advantage for de novo genome assemblies or for metagenomics applications
Relatively low throughput (about 1 million reads 700 Mb sequence data) and high reagent cost
High error rates in homo-polymer repeats
Run times are relatively fast (23h) Roche announced that it will discontinue 454 and stop supporting the platform in 2016
Illuminarsquos MiSeqHiSeq
Most library preparation protocols are compatible with the Illumina system
Overloading results in overlapping clusters and poor sequence quality
Illumina offers the highest throughput of all platforms and the lowest per-base cost
Sequence complexity - low-complexity samples such as 16S metagenomics libraries must be diluted or mixed with a reference PhiX library to generate diversity
Read lengths of up to 300 bp compatible with almost all types of application
Sample loading is technically challenging
ABIrsquos SOLiD
Second (after Illumina) highest throughput system on the market
Shortest reads (75 nt maximum) of all platforms and relatively long run times
The SOLiD system is widely claimed to have lower error rates 9994 accuracy than most other systems owing to the fact that each base is read twice
Less-well-suited for de novo genome assembly
The SOLiD system is much less widely used than the Illumina system and the panel of sample preparation kits and services is less developed
Ion Torrentrsquos PGM
Semi-conductor technology no requirement for optical scanning and fluorescent nucleotides
This technology suffers from the same issue as 454 with high error rates in homopolymers
Fast run times and a broad range of applications
PacBio system
Extremely long reads of 20 kb and even longer make this technology an ideal tool to finish genome assemblies or to improve existing draft genomes Run times are fast (typically a few hours)
High cost $2ndash17 per Mb high overall error rates (14)
Lowest throughput of all platforms (maximum 500 Mb)
Limited range of applications
Stellenbosch University httpsscholarsunacza
Stellenbosch University httpsscholarsunacza
Chapter 2
37
272 Next generation sequencing (NGS) analysis
Sequencing the chromosomes of organisms with available reference genomes is a fast
approach to study variation at DNA level Single chromosome sequencing not only
decreases cost but it also simplifies data analysis compared to whole genome
sequencing (Doležel et al 2012)
The advent of NGS technologies is accompanied by the development of many whole-
genome sequence assembly methods and software especially for de novo fragment
assembly Selecting a suitable assembler becomes a tough task as computational time
access to maximum random access memory (RAM) assembly accuracy and integrity
should be considered (Zhang et al 2011)
Pevzner and Tang (2001) as well as Pevzner et al (2001) pioneered short read assembly
that is based on de Bruijn graphs (Table 22) Other methods beside the de Bruijn graph-
based method include prefix tree-based approaches (Warren et al 2007) plus overlap-
layout-consensus approaches (Hernandez et al 2008) The genome size as well as the
sequencing error rate both have an impact on the speed at which these programs function
(Li and Durbin 2009)
Alignment-based methods were often used as a substitute when data volume produced
by larger eukaryotic genomes became an obstructing factor Therefore Simpson et al
(2009) developed assemblers that ran the task in parallel which increased the memory
for assembly and consequently permitted the use of much larger data sets An alternative
method to construct functional sequence scaffolds from shorter reads is to make use of
alignment-based approaches and comparisons to known reference genomes The
Burrows-Wheeler transform (BWT) algorithms (Table 22) have demonstrated to be very
effective by means of collapsing exact reads together and not aligning reads against
simpler copies (Li and Durbin 2009)
Stellenbosch University httpsscholarsunacza
Chapter 2
38
The k-mer is a very important parameter in sequence data analysis The k-mer is defined
as a short DNA sequence consisting of a fixed number (K) of bases In other words it
refers to all the possible substrings of length k that are contained in a string (S)
Detemining k-mer occurrence in numbers is known as k-mer counting K-mer counting
is essential because various genome assemblers use this parameter to identify overlaps
in sequence and a genome size estimation can be made with the k-mer count statistics
(Marccedilais and Kingsford 2011) The likelihood of sequencing errors are assessed by using
k-mer frequencies (Kelley et al 2010) These frequencies are also used to identify
candidate regions in de novo repeat annotation (Campagna et al 2004 Healy et al
2003) KmerGenie (Chikhi and Medvedev 2014) and Jellyfish (Marccedilais and Kingsford
2011) are two of the more popular k-mer counting algorithms
Several strategies are available to estimate the genes present in a sequencing data set
Genes have long been regarded as discrete entities located linearly along chromosomes
but recent investigations have demonstrated extensive transcriptional overlap between
different genes (Denoeud et al 2007) An experimental approach is described by Vossen
et al (2013) in which degenerate primers are designed for specific motifs associated with
for instance resistance genes This method of profiling permits gene candidates to be
amplified as well as either analysed on a gel cut out and sequenced Alternatively NGS
platforms can be used to directly sequence the polymerase chain reaction (PCR)
products Another approach allows protein coding genes (PGS) to be explored using
software packages like FunCat (Functional Catalogue) that classify proteins from whole
genome data (Ruepp et al 2004) or Gene Ontology (GO) (Ashburner et al 2000) The
vast majority of the biology of a newly sequenced genome is inferred from the set of
encoded proteins Predicting the gene set is therefore invariably the first step that is taken
after the genome sequence has been determined (Harrow et al 2009)
Stellenbosch University httpsscholarsunacza
Chapter 2
39
There are also numerous sequencing studies that prefer to use manual data mining
implementing BLAST algorithms to compare genome sequence data to known genes in
databases such as Ensembl (httpensemblgenomesorg Thole et al 2012) SwissProt
(Vitulo et al 2011) and GenBank UniGene (Vitulo et al 2011)
Table 22 Methods for alignment assembly and annotation
Objective Approach Software Reference
de novo contig assembly de Bruijn graphs SOAPdenovo Luo et al 2012
Velvet Zerbino and Berney 2008
Similarity searches and assigning gene ontology
Local alignment geno ontology
BLAST Altschul et al 1997
FASTA Pearson and Lipman 1988
Alignment of larger scale sequence comparisons
Burrows-Wheeler transform (BWT)
BWA Li and Durbin 2009
Bowtie Langmead et al 2009
In the present study the following NGS platform and software will be used to assemble
and characterise the X chromosome of the RWA Illuminareg HiSeqtrade platform as well as
BWA - KmerGenie - SOAPdenovo - and BLAST software
Stellenbosch University httpsscholarsunacza
Chapter 2
40
28 List of references
Adams M D S E Celniker R A Holt C A Evans J D Gocayne et al 2000 The
genome sequence of Drosophila melanogaster Science 287 2185-2195
Alkan C S Sajjadian and E E Eichler 2011 Limitations of next generation genome
sequence assembly Nature Methods 8 61-65
Altschul S F T L Madden A A Schaumlffer J Zhang Z Zhang et al 1997 Gapped
BLAST and PSI-BLAST a new generation of protein database search programs
Nucleic Acids Research 25 3389-3402
Ashburner M C A Ball J A Blake D Botstein H Butler et al 2000 Gene ontology
tool for the unification of biology Nature Genetics 25 25-29
Bailey A D Chandler W P Grant J Greaves G Prince et al 2010 Pests of crops
Biopesticides pest management and regulation 19-70
Barigozzi C 1939 Experiments with microdissection of the chromosome of the salivary
glands of Chironomus sp Archiv Exp Zellforsch 22 190-194
Bartholdi M F J D Parson K A Albright and L S Cram 1990 System for flow sorting
chromosomes on the basis of pulse shape Cytometry 11 165-172
Baumann P L Baumann and M L Thao 2004 Organization of the mitochondrial
genomes of whiteflies aphids and psylids (Hemiptera Sternorrhyncha) BMS
Evolutionary Biology 4 25
Becerra J X 2007 The impact of herbivore-plant coevolution on plant community
structure Proceedings of the National Academy of Sciences 104 7483-7488
Blackman R L and H Takada 1976 Naturally occurring chromosomal translocation in
Myzus persicae (Sulzer) Journal of Entomology 50 147-156
Stellenbosch University httpsscholarsunacza
Chapter 2
41
Blackman R L and D F Hales 1986 Behaviour of the X chromosomes during growth
and maturation of parthenogenetic eggs of Amphorophora tuberculata
(Homoptera Aphididae) in relation to sex determination Chromosoma 94 59-64
Blackman R L 1987 Reproduction cytogenetics and development In A K Minsk and
P Harrewijn (eds) Aphids their biology natural enemies and control 2 163-195
Blackman R L P A Brown C C Ramfrez and H M Niemeyer 2003 Karyotype
variation in the South American aphid genus Neuquenaphis (Hemiptera
Aphididae Neuquenaphidinae) Hereditas 138 6-10
Botha A M Y Li and N L V Lapitan 2005 Cereal host interactions with Russian wheat
aphid A review Journal of Plant Interactions 1 211-222
Botha A M L van Eck C S Jackson N F V Burger and T Schultz 2011 Phloem
feeding insect stress and photosynthetic gene expression Applied
Photosynthesis Online at httpwwwintechopencombooksapplied-photosynthe
sisphloem-feeding-insect-stress-and-photosynthetic-gene-expression
Hodkinson B P and E A Grace 2015 Next-Generation Sequencing A review of
technologies and tools for wound microbiome research Advances in Wound Care
4 50-58
Burd J D D R Porter G J Puterka S D Haley and F B Pears 2006 Biotypic
variation among North American Russian wheat aphid (Homoptera Aphididae)
populations Journal of Economic Entomology 99 1862-1866
Caillaud M C M Boutin C Braendle and J C Simon 2002 A sex-linked locus controls
wing polymorphism in males of the pea aphid Acyrthosiphon pisum (Harris)
Heredity 89 346-352
Stellenbosch University httpsscholarsunacza
Chapter 2
42
Campagna D C Romualdi N Vitulo M Del Favero M Lexa et al 2004 RAP a new
computer program for de novo identification of repeated sequences in whole
genomes Bioinformatics 21 582-588
Carrano A V J W Gray D H Moore J L Minkler B H Mayall et al 1976
Purification of the chromosomes of the Indian muntjac by flow sorting Journal of
Histochemistry and Cytochemistry 24 348-354
Carrano A V J W Gray R G Langlios K J Burkhart-Schultz and M A van Dilla
1979 Measurement and purification of human chromosomes by flow cytometry and
sorting Proceedings of the National Academy of Sciences 76 1382-1384
Carver B F 2009 Wheat science and trade The Journal of Agricultural Science 148
736-737
Chai H N Y Z Du and B P Zhai 2012 Characterisation of the complete mitochondrial
genome of Cnaphalocrocis medinalis and Chilo suppressalis (Lepidoptera
Pyralidae) International Journal of Biological Sciences 8 561-579
Chambers R and C Sands 1923 A dissection of the chromosomes in the pollen mother
cells of Tradescantia virginiana The Journal of General Physiology 5 815-821
Chen W V Kalscheuer A Tzschach C Menzel R Ullmann et al 2008 Mapping
translocation breakpoints by next generation sequencing Genome Research 18
1143-1149
Chen W R Ullmann C Langnick C Menzel Z Wotschofsky et al 2010 Breakpoint
analysis of balanced chromosome rearrangements by next generation paired-end
sequencing European Journal of Human Genetics 18 539-543
Chikhi R and P Medvedev 2014 Informed and automated k-mer size selection for
genome assembly Bioinformatics 30 31-37
Stellenbosch University httpsscholarsunacza
Chapter 2
43
Cilliers P R V L Tolmay and H A van Niekerk 1992 Kleingraansentrum stuur
Russiese luis planke (Afrikaans) Wheat Focus 10 7
Crozier R H and Y C Crozier 1993 The mitochondrial genome of the honeybee Apis
mellifera Complete sequence and genome organization Genetics 133 97-117
Degnan P H Y Yu N Sisneros R A Wing and N A Moran 2009 Hamiltonella
defensa genome evolution of a protective bacterial endosymbiont from pathogenic
ancestors Proceedings of the National Academy of Sciences 106 9063-9068
Degnan P H T E Leonardo B Cass B Hurwitz S Richards et al 2010 Dynamics
of genome evolution in faculatitve symbionts of aphids Environmental
Microbiology 12 2060-2069
De Jager L N F V Burger and A M Botha 2014 Complete mitochondrial genome of
Diuraphis noxia (Hemiptera Aphididae) from nine populations SNP variation
between populations and comparison with other Aphididae species African
Entomology 22 847-862
Denoeud F P Kapranov C Ucla A Frankish R Castelo et al 2007 Prominent use
of distal 5 transcription start sites and discovery of a large number of additional
exons in ENCODE regions Genome Research 17 746-759
Di Bucchianico S A M Poma M F Giardi L Di Leandro F Valle et al 2011 Atomic
force microscope nanolithography on chromosomes to generate single-cell genetic
probes Journal of Nanobiotechnology 9 27-33
Dilbirligi M M Erayman D Sandhu D Sidhu and K S Gill 2004 Identification of wheat
chromosomal regions containing expressed resistance genes Genetics 166 461-
481
Stellenbosch University httpsscholarsunacza
Chapter 2
44
Dogimont C A Bendahmane V Chovelon and N Boissot 2010 Host plant resistance
to aphids in cultivated crops genetic and molecular bases and interaction with
aphid populations Comptes Rendus Biologies 333 566-573
Doležel J J Vraacutena J Šafaacuteř J Bartoš M Kubalaacutekovaacute et al 2012 Chromosomes in
the flow to simplify genome analysis Functional and Integrative Genomics 12
397-416
Dudin G E W Steegmayer P Vogt H Schnitzer E Diaz et al 1988 Sorting of
chromosomes by magnetic separation Human Genetics 80 111-116
Du Toit F 1987 Resistance in wheat (Triticum aestivum) to Diuraphis noxia (Homoptera
Aphididae) Cereal Research Communications 15 175-179
Du Toit F 1988 Another source of Russian wheat aphid (Diuraphis noxia) resistance in
Triticum aestivum Cereal Research Communications 16 105-106
Du Toit F 1989 Components of resistance in three bread wheat lines to Russian wheat
aphid (Homoptera Aphididae) in South Africa Journal of Economic Entomology
82 1779-1781
Duveiller E R P Singh and J M Nicol 2007 The challenges of maintaining wheat
productivity pests diseases and potential epidemics Euphytica 157 417-430
Edwards O R 2001 Interspecific and intraspecific variation in the performance of three
pest aphid species on five grain legume hosts Entomologia Experimentalis et
Applicata 100 21-30
Elliott N M Mirik Z Yang T Dvorak M Rao et al 2007 Airborne multi-spectral remote
sensing of Russian wheat aphid injury to wheat Southwestern Entomologist 32
213-219
Stellenbosch University httpsscholarsunacza
Chapter 2
45
Fazel-Najafabadi M J Peng F B Peairs H Simkova A Killian et al 2015 Genetic
mapping of resistance to Diuraphis noxia (Kurdjumov) biotype 2 in wheat (Triticum
aestivum L) accession CI2401 Euphytica 203 607-614
Gill B S R Appels A M Botha-Oberholster C R Buell J L Bennetzen et al 2004
A workshop report on wheat genome sequencing International Genome Research
on Wheat Consortium Genetics 168 1087-1096
Giordanengo P L Brunissen C Rusterucci C Vincent A Van Bel et al 2010
Compatible plant-aphid interaction how aphids manipulate plant responses
Comptes Rendus Biologies 333 516-523
Goggin F L 2007 Plant-aphid interactions molecular and ecological perspectives
Current Opinion in Plant Biology 10 399-408
Haley S D F B Peairs C B Walker J B Rudolph and T L Randolph 2004
Occurrence of a new Russian wheat aphid biotype in Colorado Crop Science 44
1589-1592
Hammon-Kosack K E and J D G Jones 1996 Resistance gene-dependent plant
defence responses American Society of Plant Physiologists 8 1773-1791
Hanrahan S J and J S Johnston 2001 New genome size estimates of 134 species of
arthropods Chromosome Research 19 809-823
Harrow J A Nagy A Reymond T Aliota L Patthy et al 2009 Identifying protein-
coding genes in genomic sequences Genome Biology 10 201
Harvey T L and T J Martin 1990 Resistance to Russian wheat aphid Diuraphis noxia
in wheat (Triticum aestivum) Cereal Research Communications 18 127- 129
Healy J E E Thomas J T Schwartz and M Wigler 2003 Annotating large genomes
with exact word matches Genome Research 13 2306-2315
Stellenbosch University httpsscholarsunacza
Chapter 2
46
Hernandez D P Francois L Farinelli M Osteras and J Schrenzel 2008 De novo
bacterial genome sequencing millions of very short reads assembled on a desktop
computer Genome Research 18 802-809
Heslop-Harrison J S and T Schwarzacher 2011 Organisation of the plant genome in
chromosomes Plant Journal 66 18-33
Hobza R and B Vyskot 2007 Laser microdissection-based analysis of plant sex
chromosomes Methods in Cell Biology 82 433-453
Hodgson E and J Karren 2008 Russian Wheat Aphid Online at httpextension
usuedufilespublicationsfactsheetrussian-wheat-aphids08pdf
Howe G A and G Jander 2008 Plant immunity to insect herbivores Annual Review of
Plant Biology 59 41-66
Howell K E J Gruenberg A Ito and G E Palade 1988 Immuno-isolation of
subcellular components Progress in Clinical Biological Research 270 77-90
Hu Li G Jianyu L Hayiyu and C Wanzhi 2009 Progress in researches on insect
mitochondrial genome and analysis of gene order Reviews Science Foundation
in China 17 39-45
Jankielsohn A 2011 Distribution and diversity of Russian wheat aphid (Hemiptera
Aphididae) biotypes in South Africa and Lesotho Journal of Economic Entomology
104 1736-1741
Jankielsohn A 2014 The Russian wheat aphid Farmer Weekly 17 22-23
Jankielsohn A 2016 Changes in the Russian wheat aphid (Hemiptera Aphididae)
biotype complex in South Africa Journal of Economic Entomology 109 907-912
Stellenbosch University httpsscholarsunacza
Chapter 2
47
Jaquieacutery J S Stoeckel C Rispe L Mieuzet F Legeai et al 2012 Accelerated
evolution of sex chromosomes in aphids an XO system Molecular Biology and
Evolution 29 837-847
Jaquieacutery J C Rispe D Roze F Legeai G Le Trionnaire et al 2013 Masculinization
of the X chromosome in the pea aphid Plos Genetics 9 e1003690
Johnston J S K S Yoon J P Strycharz B R Pittendrigh and J M Clark 2007 Body
lice and head lice (Anoplura Pediculidae) have the smallest genomes of any
hemimetabolous insect reported to date Journal of Medical Entomology 44 1009-
1012
Jyoti J L J A Quershi J P Michaud and T J Martin 2006 Virulence of two Russian
wheat aphid biotypes to eight wheat cultivars at two temperatures Crop Science
46 774-780
Kelley D R M C Schatz and S L Salzberg 2010 Quake quality-aware detection and
correction of sequencing errors Genome Biology 11 116
Khan W U F Mohammed F U Khan F Z Zafar and G Ghuttai 2015 Correlation
studies among production traits in bread wheat under rainfed conditions
American-Eurasian Journal of Agricultural and Environmental Sciences 15 2059-
2063
Kron P and B C Husband 2015 Distinguishing 2N gamete nuclei from doublets in
pollen using flow cytometry and pulse analysis Cytometry Part A 87 943-957
Kindler S D N C Elliott K L Giles T A Royer R Fuentes-Granados et al 2002
Effect of Greenbugs (Homoptera Aphididae) on yield loss of winter wheat Journal
of Economic Entomology 95 89-95
Stellenbosch University httpsscholarsunacza
Chapter 2
48
Langmead B C Trapnell M Pop and S L Salzberg 2009 Ultrafast and memory-
efficient alignment of short DNA sequences to the human genome Genome
Biology 10 25
Lapitan N L V Y Li and A M Botha 2007 Fractional extracts of Russian wheat aphid
eliciting defense responses in wheat Journal of Economic Entomology 100 990-
999
Lea T F Vartdal C Davies and J Ugelstad 1985 Magnetic monosized polymer
particles for fast and specific fractionation of human mononuclear cells
Scandinavian Journal of Immunology 22 207-216
Li H and R Durbin 2009 Fast and accurate short read alignment with Burrows-Wheeler
transform Bioinformatics 25 1754-1760
Liu X M C M Smith B S Gill and V Tolmay 2001 Microsatellite markers linked to six
RWA resistance genes in wheat Theoretical and Applied Genetics 102 504-510
Luo MC C Thomas F M You J Hsiao O Y Shu et al 2003 High-throughput
fingerprinting of bacterial artificial chromosomes using the SNaPshot labeling kit
and sizing of restriction fragments by capillary electrophoresis Genomics 82 378-
389
Luo R B Liu Y Xie Z Li W Huang et al 2012 SOAPdenovo2 an empirically
improved memory-efficient short-read de novo assembler GigaScience 1 18
Ma L Y Xiao H Huang Q W Wang W N Rao et al 2010 Direct determination of
molecular haplotypes by chromosome microdissection Nature Methods 7 299-
301
Stellenbosch University httpsscholarsunacza
Chapter 2
49
Mandrioli M D Bizarro G C Manicardi D Gionghi L Bassoli et al 1999 Cytogenetic
and molecular characterisation of a highly repeated DNA sequence in the peach
potato aphid Myzus persicae Chromosoma 108 436-442
Marais G F and F Du Toit 1993 A monosomic analysis of Russian wheat aphid
resistance in the common wheat PI 292994 Plant Breeding 111 246-248
Marccedilais G C and Kingsford 2011 A fast lock-free approach for efficient parallel
counting of occurrences of k-mers Bioinformatics 27 764-770
Margueron R and D Reinberg 2010 Chromatin structure and the inheritance of
epigenetic information Nature Reviews Genetics 11 285-296
Meksem K and G Kahl 2005 The handbook of plant genome mapping Genetic and
Physical Mapping 151-171
Metzker M L 2010 Sequencing technologies - the next generation Nature Reviews
Genetics 11 31-46
Meyer J R 2007 A class of distinction Department of Entomology North Carolina State
University
Michaud J P and P E Sloderbeck 2005 Russian wheat aphid an introduced pest of
small grains in the high plains Kansas State University
Miles P W 1999 Aphid saliva Biological Reviews of the Cambridge Philosophical
Society 74 41-85
Mirik M J Ansley J Michels and N Elliott 2009 Grain and vegetative biomass
reduction by the Russian wheat aphid in winter wheat Southwestern Entomologist
34 131-157
Stellenbosch University httpsscholarsunacza
Chapter 2
50
Molday R S S P S Yen and A Rembaum 1977 Application of magnetic
microspheres in labelling and separation of cells Nature 268 437-438
Monajembashi S C Cremer T Cremer J Wolfrum and K O Greulich 1986
Microdissection of human chromosomes by a laser microbeam Expressive Cell
Research 167 262-265
Monti V M Mandriolo M Rivi and G C Manicardi 2012 The vanishing clone
karyotypic evidence for extensive intraclonal genetic variation in the peach potato
aphid Myzus persicae (Hemiptera Aphididae) Biological Journal of the Linnean
Society 105 350-358
Morrison W P and F B Peairs 1998 Response model concept and economic impact
In S S Quisenberry and F B Peairs (eds) Response model for an introduced
pest - Russian wheat aphid Entomological Society of America Lanham MD
Myers E W G G Sutton A L Delcher I M Dew D P Fasulo et al 2000 A whole-
genome assembly of Drosophila Science 287 2196-2204
Nickolson S J M L Nickerson M Dean Y Song P R Hoyt et al 2015 The genome
of Diuraphis noxia a global aphid pest of small grains BMC Genomics 16
doi 101186s12864-015-1525-1
Nkongolo K K J S Quick A E Limin and D B Fowler 1991a Sources and
inheritance of resistance to Russian wheat aphid in Triticum species amphiploids
and Triticum tauschii Canadian Journal of Plant Science 71 703-708
Nkongolo K K J S Quick F B Peairs and W I Meyer 1991b Inheritance of
resistance of PI 372129 wheat to the Russian wheat aphids Crop Science 31
905-907
Stellenbosch University httpsscholarsunacza
Chapter 2
51
Novotnaacute J J Havelka P Staryacute P Kouteckyacute and M Viacutetkovaacute 2011 Karyotype analysis
of the Russian wheat aphid Diuraphis noxia (Kurdjumov) (Hemiptera Aphididae)
reveals a large X chromosome with rRNA and histone gene families Genetica 139
281-289
Olofsson L A Lundgren and P E Brodelius 2012 Trichome isolation with and without
fixation using laser microdissection and pressure catapulting followed by RNA
amplification expression of genes of terpene metabolism in apical and sub-apical
trichome cells of Artemisia annua L Plant Science 183 9-13
Orlando E 1974 Sex determination in Megoura viciae Buckton (Homoptera Aphididae)
Monitore Zoologico Italiano 8 61-70
Owen C S 1983 Magnetic cell sorting Cell separation methods and selected
applications 5 127-144
Painter R H 1958 Resistance of plants to insects Annual Review of Entomology
Journal 3 267-290
Pearson W R and D J Lipman 1988 Improved tools for biological sequence
comparison Proceedings of the National Academy of Sciences 85 2444-2448
Peng J H Wang S D Haley F B Peairs and NLV Lapitan 2007 Molecular mapping
of the Russian wheat aphid resistance gene Dn2414 in wheat Crop Science 47
2418-2429
Peacuterez R F Panzera J Page J A Suja and J S Rufas 1997 Meiotic behaviour of
holocentric chromosomes orientation and segregation of autosomes in Triatoma
infestans (Heteroptera) Chromosome Research 5 47-56
Pevzner P A and H Tang 2001 Fragment assembly with double-barreled data
Bioinformatics 17 S225-S233
Stellenbosch University httpsscholarsunacza
Chapter 2
52
Pevzner P A H Tang and M S Waterman 2001 An Eulerian path approach to DNA
fragment assembly Proceedings of the National Academy of Sciences 98 9748-
9753
Pike K S D Allison L Boydston C O Qualset H E Vogt et al 1989 Suction trap
reveals 60 wheat aphid species including Russian wheat aphid California
Agriculture 43 22-24
Powell G C R Tosh and J Hardie 2006 Host plant selection by aphids behavioural
evolutionary and applied perspectives Annual Review of Entomology 51 309-
330
Puterka G J R W Hammon J D Burd F B Peairs T L Randolph et al 2012
Cyclical parthenogenetic reproduction in Russian Wheat Aphid (Hemiptera
Aphididae) in the United States Sexual reproduction and its outcome on biotypic
diversity Journal of Economic Entomology 105 1057-1068
Reis-Filho J S 2009 Next-generation sequencing Breast Cancer Research 11 1-7
Richardson S and S C Murali 2015 Best practices in insect genome sequencing what
works and what doesnrsquot Science Direct 7 1-7
Robinson J 1992 Russian wheat aphid A growing problem for small-grain farmers
Outlook on Agriculture 21 57-61
Ruepp A A Zollner D Maier K Albermann J Hani et al 2004 The FunCat a
functional annotation scheme for systematic classification of proteins from whole
genomes Nucleic Acids Research 32 5539-5545
Saidi A and J S Quick 1996 Inheritance and allelic relationships among Russian wheat
aphid resistance genes in winter wheat Crop Science 36 256-258
Stellenbosch University httpsscholarsunacza
Chapter 2
53
Sanger F S Nicklen A R and Coulson 1977 DNA sequencing with chain-terminating
inhibitors Proceedings of the National Academy of Science USA 74 5463-5467
Scalenghe F E Turco J E Ederstroumlm V Pirrotta and M Melli 1981 Microdissection
and cloning of DNA from a specific region of Drosophila melanogaster polytene
chromosomes Chromosoma 82 205-216
Schondelmaier J R Martin A Jahoor A Houben A Graner et al 1993
Microdissection and microcloning of the barley (Hordeum vulgare L) chromosome
1HS Theoretical and Applied Genetics 86 629-636
Schoonhoven L M J J A Van Loon and M Dicke 2005 Insect-Plant Biology Oxford
University Press UK
Schubert I P F Fransz J Fuchs and J H de Jong 2001 Chromosome painting in
plants Methods Cell Science 23 57-69
Shea G J Botha and D Hardie 2000 Russian wheat aphid (Diuraphis noxia) an exotic
threat to Western Australia GrainguardTM Initiative AGWEST
Shigenobu S H Watanabe M Hattori Y Sakaki and H Ishikawa 2000 Genome
sequence of the endocellular bacterial symbiont of aphids Buchnera sp APS
Nature 407 81-86
Simpson J T K Wong S D Jackman J E Schein S J M Jones and I Birol 2009
ABySS a parallel assembler for short read sequence data Genome Research 19
1117-1123
Smith C M T Belay C Stauffer P Stary I Kubeckova and S Starkey 2004
Identification of Russian wheat aphid (Homoptera Apididae) populations virulent
to the Dn4 resistance gene Journal of Economic Entomology 97 1112-1117
Stellenbosch University httpsscholarsunacza
Chapter 2
54
Stoetzel M B 1987 Information on and identification of Diuraphis noxia (Homoptera
Aphididae) and other aphid species colonizing leaves of wheat and barley in the
United States Journal of Economic Entomology 80 696-704
Stubblefield E and J Oro 1982 The isolation of specific chicken macro-chromosomes
by zonal centrifugation and flow sorting Cytometry 5 73-281
Sudbery I J Stalker J T Simpson T Keane A G Rust et al 2009 Deep short-read
sequencing of chromosome 17 from the mouse strains AJ and CASTEi identifies
significant germline variation and candidate genes that regulate liver triglyceride
levels Genome Biology 10 112
Swanevelder Z H A K J Surridge E Venter and A M Botha 2010 Limited
endosymbiont variation in Diuraphis noxia (HemipteraAphididae) biotypes from
the United States and South Africa Journal of Economic Entomology 103 887-
897
Tagu D J P Klingler A Moya and J C Simon 2008 Early progress in aphid genomics
and consequences for plant-aphid interactions studies Molecular Plant-Microbe
Interactions 21 701-708
The International Aphid Genomics Consortium 2010 Genome sequence of the pea aphid
Acyrthosiphon pisum PLoS Biology 8 e1000313
Thole V A Peraldi B Worland P Nicholson J H Doonan and P Vain 2012 T-DNA
mutagenesis in Brachypodium distachyon Journal of Experimental Botany 63
567-576
Tjallingii W F and T H Esch 1993 Fine structure of aphid stylet routes in plant tissues
in correlation with EPG signals Physiological Entomology 18 317-328
Stellenbosch University httpsscholarsunacza
Chapter 2
55
Tjallingi W F 2006 Salivary secretions by aphids interacting with proteins of phloem
wound responses Journal of Experimental Botany 57 739-745
Tolmay V L R C Lindeque and G J Prinsloo 2007 Preliminary evidence of a
resistance-breaking biotype of the Russian wheat aphid Diuraphis noxia
(Kurdjumov) (Homoptera Aphididae) in South Africa African Entomoly 15 228-
230
Treangen T J and S L Salzberg 2012 Repetitive DNA and next-generation
sequencing computational challenges and solutions Nature Reviews Genetics
13 36-46
Ugelstad J A Berge T Ellingsen O Aune L Kilaas et al 1988 Monosized magnetic
particles and their use in selective cell separation Macromolecular Chemistry 17
177-211
Valdez V A P E Byrnea N L V Lapitan F B Peairs A Bernardoc et al 2012
Inheritance and genetic mapping of Russian wheat aphid resistance in Iranian
wheat landrace accession PI 626580 Crop Science 52 676-682
Van Dijk E L H Auger Y Jaszczyszyn and C Thermes 2014 Ten years of next
generation sequencing technology Trends in Genetics 30 418-426
Van Emden H F and R Harrington 2007 Aphids as crop pests doi
10107997808519981900000
Vitharana S N and G S Wilson 2006 Fractionation of chromosome 15 with an affinity-
based approach using magnetic beads Genomics 87 158-164
Vitulo N A Albiero C Forcato D Campagna F Dal Pero et al 2011 First survey of
the wheat chromosome 5A composition through a next generation sequencing
approach PloS ONE 6 26421
Stellenbosch University httpsscholarsunacza
Chapter 2
56
Vlaacutečilovaacute K D Ohri J Vraacutena J Čiacutehaliacutekovaacute M Kubalaacutekovaacute et al 2002 Development
of flow cytogenetics and physical genome mapping in chickpea (Cicer arietinum
L) Chromosome Research 10 695-706
Von Bubnoff A 2008 Next-generation sequencing The race is on Cell 132 721-723
Von Dohlen C D C A Rowe and O E Heie 2006 A test of morphological hypotheses
for tribal and subtribal relationships of Aphidinae (Insecta Hemiptera Aphididae)
using DNA sequences Molecular Phylogenetics and Evolution 38 316-329
Vossen J H S Dezhsetan D Esselink M Arens M J Sanz et al 2013 Novel
applications of motif directed profiling to identify disease resistance genes in
plants Plant Methods 9 37
Vraacutena J M Kubalaacutekovaacute H Šimkovaacute J Čiacutehaliacutekovaacute M A Lysaacutek et al 2000 Flow
sorting of mitotic chromosomes in common wheat (Triticum aestivum L) Genetics
156 2033-2041
Walters M C F Penn F Du Toit T C Botha K Aalbersberg et al 1980 The Russian
wheat aphid Farming in South Africa Leaflet Series Wheat G3 1-6
Warren R L G G Sutton S J Jones and R A Holt 2007 Assembling millions of short
DNA sequences using SSAKE Bioinformatics 23 500-501
Webster J A R L Burton and K J Starks 1987 Diuraphis noxia a new US aphid
pest of small grains Journal of the Kansas Entomological Society 60 483-484
Wei F S J W Zhang S G Zhou R F He M Schaeffer et al 2009 The physical and
genetic framework of the maize B73 genome PLoS Genetics 5 e1000715
Will T and A J E Van Bel 2006 Physical and chemical interactions between aphids
and plants Journal of Experimental Botany 57 729-737
Stellenbosch University httpsscholarsunacza
Chapter 2
57
Will T W F Tjallingii A Thonnessen and A J E Van Bel 2007 Molecular sabotage
of plant defence by aphid saliva Proceedings of the National Academy of Sciences
104 10536-10541
Will T S R Kornermann A C U Furch W F Tjallingii and A J E Van Bel 2009
Aphid watery saliva counteracts sieve-tube occlusion a universal phenomenon
The Journal of Experimental Biology 212 3305-3312
Wilson A C C P Sunnucks and D F Hales 1997 Random loss of X chromosome at
male determination in an aphid Sitobion near fragariae detected using an X-linked
polymorphic microsatellite marker Genetics Research 69 233-236
Yang H X Chen and W H Wong 2011 Completely phased genome sequencing
through chromosome sorting Proceedings of the National Academy of Sciences
108 12-17
Zerbino DR and E Birney 2008 Velvet algorithms for de novo short read assembly
using de Bruijn graphs Genome Research 18 821-829
Zhang W J Chen Y Yang Y Tang J Shang and B Shen 2011 A practical
comparison of De Novo genome assembly software tools for next-generation
sequencing technologies Plos One 6 e17915
Zhou R N and Z M Hu 2007 The development of chromosome microdissection and
microcloning technique and its applications in genomic research Current
Genomics 8 67-72
Zhou V W A Goren and B E Bernstein 2011 Charting histone modifications and the
functional organization of mammalian genomes Nature Reviews Genetics 12 7-
18
Stellenbosch University httpsscholarsunacza
Chapter 3
Research
Stellenbosch University httpsscholarsunacza
Chapter 3
59
31 Introduction
Arthropods are known as the most speciose clade of animals on earth The Insecta class
which is the majority of arthropods is hypothesized to hold 75 of all animals (Gaston
1991) Hemipterans contain three important families the Phylloxeridae the Adelgidae
and the Aphididae The Aphididae family (order Hemiptera) represents the largest group
of aphid species comprising approximately of 4500 extant species (Miller et al 1994
Davis 2012) In general the piercing-sucking behaviour of aphids during feeding together
with their ingestion of phloem sap results in extensive plant damage due to either direct
feeding or indirect transmission of plant viruses (Tagu et al 2008)
Diuraphis noxia Kurdjumov more commonly known as the Russian wheat aphid (RWA)
is one of the main insect pests that affect Tritucum aestivum L (bread wheat) The RWA
belongs to the family Aphididae and is characterised as an invasive pest with a major
economic impact on wheat production (Haley et al 2004 Burd et al 2006 Jankielsohn
2011) It has the potential to cause considerable yield losses mainly because it
reproduces parthenogenically and has an exceptionally high intrinsic rate of increase
(Merril et al 2009) In areas where the RWA is considered to be endemic it can also
reproduce sexually The change between sexual and parthenogenetic reproduction
includes chromosome behavioural changes that take place in response to environmental
stimuli facilitated by endocrine factors Notable differences take place in the ways in
which aphid chromosomes pair and segregate during sex determination and meiosis
even within closely related species with consequences that can affect the inheritance of
all ndash or parts of ndash the genome (Manicardi et al 2015) Asexual reproduction permits for
non-recombinant vertical gene transfer from mother to offspring through successive
generations allowing little genetic variation in the RWA (Tagu et al 2008)
Stellenbosch University httpsscholarsunacza
Chapter 3
60
Nevertheless new RWA populations or biotypes still develop despite the lack of sexual
recombination RWA biotypes are categorised according to the varying level of damage
that they inflict while feeding on wheat cultivars containing different resistance (R-) genes
This classification based on aphid virulence depends on the plantsrsquo response to RWA
feeding being either susceptible intermediate or resistant (Puterka et al 2012) Biotypes
overcome host-plant resistance and feed on previously resistant cultivars The constant
development of virulent RWA biotypes calls for the continuous identification and
introduction of new R-genes into susceptible wheat cultivars (Bouhssini et al 2011)
Fundamentally this protects the wheat against the current RWA biotypes and prevents
large scale agricultural losses (Jankielsohn 2011)
The karyotypic structure of the aphid genome has been found to vary substantially among
the species In some aphid genera the chromosome number seems to be stable but in
others it differs greatly mainly because of successive autosomal dissociations with slight
or no accompanying morphological or biological change (Manicardi et al 2015)
RWA chromosomes like the chromosomes of other aphids and some hemipteroid
insects are holocentric Holocentric chromosomes lack localised centromeres ndash with
centromeric activity being diffused along the length of the chromosome As a result
during the later stages of prophase and metaphase every condensed chromosome looks
like a simple rod or if treated with colchicine as a pair of chromatids aligned in parallel
with a uniform gap width between them (Blackman 1987) Holocentric chromosomes
present a big disadvantage for cytogenetic studies and karyotype comparisons in that
they do not possess any primary andor secondary constrictions This means that
conventionally stained preparations can only be identified on the basis of size Thus the
only factors that can be used to detect differences in karyotype structure are the number
of chromosomes or measurable structural heterozygosity (Manicardi et al 2015)
Stellenbosch University httpsscholarsunacza
Chapter 3
61
Novotnaacute et al (2011) established that the karyotype of female RWA consist of 10
chromosomes (2n = 10) with four pairs of autosome chromosomes and a pair of large sex
(X) chromosomes They also noted that the male RWA only possess one sex (X)
chromosome and therefore has a karyotype of 2n = 9 For that reason the RWA sex
chromosome system has been identified as XXX0 as in a number of aphid species This
system never has a Y chromosome which is essential for parthenogenesis or asexual
reproduction (Kuznetsova and Shaposhnikov 1973) Aphids are known for their large X
chromosomes as reported by Novotnaacute et al (2011) for RWA The reason for the existence
of large sexual chromosomes relative to the autosomes in aphids and their origin are still
unknown (Mandrioli et al 1996 Bizzarro et al 2000)
In this study the chromosomes of biotypes SAM the most virulent RWA biotype recorded
(Botha et al 2013) and SA1 one of the least virulent biotypes (Jankielsohn 2011) were
studied The aim of this study was to verify the karyotype of the RWA and to characterise
the sex (X) chromosomes of the RWA To achieve these aims female RWA were
dissected in order to obtain the embryos which were used to make chromosome
squashes The squashes were used to determine the RWA karyotype Additionally the
metaphase X chromosomes were examined separately from the autosome chromosomes
by means of flow cytometry Next generation sequencing (NGS) of the separated X
chromosomes of biotype SAM was conducted and used to map against the genomes of
the RWA (SAM_Contigs_Version 11 GCA_0014655151 Botha et al 2016 ndash in press)
and Acyrthosiphon pisum (pea aphid) (Acyr_20 GCA_0001429852 The International
Aphid Genomics Consortium 2010) Orthologous regions spanning the X chromosome of
the RWA was also identified through reference mapping against the well characterised X
chromosome of Drosophila melanogaster (fruit fly) (BDGP6 Adams et al 2000)
Stellenbosch University httpsscholarsunacza
Chapter 3
62
32 Materials and methods
This study made use of adult female aphids of the South African mutant RWA biotype
(SAM) and its parent South African biotype 1 (SA1) The female RWA specimens were
obtained from the Department of Genetics Stellenbosch University Cereal Genomics
Laboratory The biotypes were kept on SST 387 RWA resistant wheat cultivars in
separate BugDormreg Insect cages (MegaView Science Co Ltd Taiwan) to prevent cross
contamination with other biotypes Aphids were kept at 20 degC plusmn 2 degC with continuous
artificial fluorescent lighting
321 Karyotyping of RWA chromosomes
In the following section the procedure for obtaining representative karyotypes for the
biotypes SAM and SA1 is described
3211 Slide preparation
Mitotic chromosomes were obtained from whole embryos dissected from adult female
RWA (Figure 31) The chromosome spreads were prepared according to a procedure
adapted from Novotnaacute et al (2011) In brief a Hund WETZLAR Wiloskop stereo-zoom-
microscope (Labotecreg) was used to dissect 15 embryos into a physiological solution for
Ephistia kuehniella (Lockwood 1961) that consisted of 09 (mv) NaCl 0042 (mv)
KCl 0033 (mv) CaCl2H2O 002 (mv) NaHCO3 and 025 (mv) glucose where
after the embryos were treated with a hypotonic solution (0075 M KCl) for 10 minutes
and fixed for 15 minutes in Carnoy fixative (Traut 1976) The freshly prepared Carnoy
fixative consisted of 100 ethanol chloroform and glacial acetic acid (1 N) in a 631
ratio The embryonic cells were separated in 60 microl of 60 glacial acetic acid (1 N) with
the assistance of a wooden micropestle and fixed on the slide using a heating plate at
45 degC
Stellenbosch University httpsscholarsunacza
Chapter 3
63
3212 Chromosome staining and visualisation
After the slides were prepared as described (Section 3211) the samples were stained
for 5-8 minutes with Hoechst 33342 (Sigma) solution (10 mgml) that was diluted 1100
to a final concentration of 001 mgml The stained slides were then briefly submerged in
distilled H2O and left to dry at room temperature (RT)
The chromosomes were visualised with a Zeiss LSM780 ELYRA PS1 (Zeiss Germany)
confocal microscope Images were edited on Zen Lite Software (Zeiss Germany) in order
to visualise the karyotype and determine the size of the different chromosome pairs using
a scale bar (Central Analytical Facility (CAF) fluorescent microscopy unit Stellenbosch
University South Africa)
The different sized chromosome pairs were then subjected to two-sample t-tests to
determine if their sizes were statistically different from one another The t-tests were
performed firstly between the large chromosome sizes (Group 1) and the middle
autosomal chromosome sizes (Group 2) then between the middle autosomal
chromosome sizes (Group 2) and the small autosomal chromosome sizes (Group 3) and
lastly between the large chromosomes (Group 1) and the small autosomal chromosomes
Figure 31 Two embryos (as indicated by arrows) dissected from an adult female RWA
Stellenbosch University httpsscholarsunacza
Chapter 3
64
(Group 3) Fundamentally three t-tests were performed (Group 1 vs Group 2 Group 2 vs
Group 3 Group 1 vs Group 3)
322 Flow cytometry of RWA chromosomes
In the following section a procedure is described for the isolation of the RWA sex
chromosome in order to obtain DNA suitable for next generation sequencing (NGS)
3221 Preparation of mitotic chromosome suspension
The RWA chromosome suspensions were obtained using an adapted procedure as
described by Doležel and Bartoš (2005) Briefly 20 female RWA were collected in a 15
ml Eppendorf tube The tube containing the aphids was frozen using liquid nitrogen
where after 200 microl of ice-cold Otto buffer I (01 M C6H8O7 05 (vv) Tween 20 1 (vv)
Triton X-100) was added The aphids were crushed in the tube using a small micropestle
and incubated at RT for 5 minutes with occasional shaking The suspension of crushed
RWA was centrifuged through a 40 microm polypropylene nylon mesh cell strain filter
(Fisherbrandreg) at 10000 revolutions per minute (rpm) for 30 seconds Thereafter staining
solution containing 800 microl Otto buffer II (04 M Na2HPO4 12H2O) 05 mM propidium iodide
(PI) 40 microg RNase A and 16 microl 2-mercaptoethanol was added to the sample After
staining for 10 minutes at RT the sample was vortexed and the suspension was
transferred to a 5 ml round-bottom polystyrene tube (Falcontrade) ready for flow sorting
3222 Flow cytometry optimization Gating
Gating allows for the selection of single chromosomes through graphic depictions by
identifying doublets which are two chromosomes stuck together clumps which are more
than two chromosomes stuck together as well as debris that contaminate the series
Doublet and clump discrimination are very important to prevent any chromosomes that
are not of interest from passing through to sample collection (Kron and Husband 2015)
Stellenbosch University httpsscholarsunacza
Chapter 3
65
Gating was applied through the FACSDiva version 613 software (BD biosciences USA)
at the CAF fluorescent microscopy unit at Stellenbosch University South Africa
Figure 32 displays a gating strategy used in flow cytometry analysis known as a singlet
gate scatter plot This strategy is used to gate-out unwanted doublets and clumps All
singlets are identified according to where they cluster on the graph which should be in a
diagonal straight line The singlets are then surrounded by a gate allowing the flow
cytometer to only sort the chromosomes included in the gating area (Figure 32)
Figure 33 displays a chromosome gate scatter plot that allowed for further selection of
the chromosomes of interest The graph makes use of SSC (side scatter) and
fluorescence area SSC is the light scattered at large angles and is proportional to the
complexity of a particle while fluorescence area is the amount of fluorescence a particle
produces and is proportional to fluorescence intensity In this graph the chromosomes of
the same size will cluster together (Lo et al 2008)
The approach in Figure 33 was used to distinguish between the sizes of chromosomes
Each chromosome size was assigned a colour to aid in identification Cyan separated the
Figure 32 The singlet gate scatter plot was used to exclude doublets and clumps from the analysis Gate A is an area that is straight diagonal 45ordm and passing through zero (yellow dotted line) which includes all the single chromosomes of interest while all the particles outside the gate are excluded as they consist of doublets clumps or debris
A
Stellenbosch University httpsscholarsunacza
Chapter 3
66
middle sized autosomal chromosomes at a fluorescence of 28000-58000 while blue
separated the large sex chromosomes at a fluorescence of 68000-98000 The red and
green areas in Figure 33 designate all the particles that are not included in this (Figure
33) and the previous gating strategy (Figure 32) respectively Therefore all the
chromosomes that clustered in the respective colours (Figure 33) were sorted
accordingly
3223 Flow sorting
The sample containing the chromosomes as described in Section 3221 was measured
on a FACSAria flow cytometer (BD biosciences USA) at the CAF fluorescent microscopy
unit at Stellenbosch University South Africa Data was presented using the FACSDiva
version 613 software (BD biosciences USA) The flow cytometer charges each
chromosome depending on its fluorescence intensity which is proportional to the size of
the chromosome Propidium iodide (PI) the dye the chromosomes are stained with is
excited at 488 nm and emits at a wavelength of 617 nm The large and middle
chromosome fractions were collected separately in 5 ml polystyrene round-bottom tubes
(Falcontrade) containing Otto Buffer II (Section 3221) and stored at ndash20 ˚C at the
Department of Genetics Stellenbosch University Cereal Genomics Laboratory
Figure 33 The chromosome gate scatter plot was used to identify the chromosome sizes based on fluorescence intensity The different sized chromosomes were given a random colour to aid in identification
Stellenbosch University httpsscholarsunacza
Chapter 3
67
3224 DNA purification
The different size fractionated frozen chromosomal samples (Section 3223) were
removed from the ndash20 ˚C freezer and thawed in a water bath at RT After thawing the
samples were centrifuged at 12000 rpm for 20 minutes at 8 ˚C The supernatant was
aspirated down to approximately 50 microl where after the chromosomal pellet was
resuspended A total of 100 microg proteinase K was added to digest any contaminating
proteins and the sample was incubated at 55 ˚C for 1 hour The DNA was precipitated by
adding 200 microl ice-cold 100 ethanol to the sample and incubated overnight in the ndash20 ˚C
freezer The sample was thawed at RT centrifuged at 12000 rpm for 15 minutes at 6 ˚C
and the supernatant discarded The resulting pellet was allowed to dry for 10 minutes and
resuspended in 25 microl distilled H2O DNA concentrations were quantified using the Qubitreg
20 Fluorometer (Invitrogen) at the CAF Analytical Services Unit Stellenbosch University
South Africa The five samples with the highest DNA concentrations were pooled The
DNA concentration of one pair of large X chromosomes could be determined as follows
3225 Estimation of RWA genome size
Using the measured sizes of the different chromosome sets (Section 321) the number
of different size chromosome pairs (Section 321) and the contribution of the X
chromosome (Section 3224) 1C of the RWA can be calculated as follows
The genome size of the RWA was calculated using the following assumption 1 pg DNA
= 0978 x 109 base pairs Based on the consideration that ATGC = 11 ignoring the
X chromosome pair = Total DNA (ng)
Number of X chromosome pairs
1C = [X chr (pg)] + [(number of middle chr pairs) (middle chr (microm)
X chr (microm)) (X chr (pg))]
+ [(number of small chr pairs) ( small chr (microm)
X chr (microm)) (X chr (pg))]
Stellenbosch University httpsscholarsunacza
Chapter 3
68
presence of modified nucleotides (Doležel et al 2003 Doležel and Bartoš 2005 Doležel
et al 2012)
3226 Sequencing
Sodium acetate (1M) was added to the pooled sample of X chromosome DNA (Section
3224) and the 15 ml Eppendorf tube was filled to 1 ml with 100 ice-cold ethanol The
samples were packaged and sent to Macrogen (Korea) for sequencing
323 Next generation sequencing (NGS) and bioinformatic analysis of
the RWA sex chromosome fraction
The RWA chromosome fraction obtained through flow cytometry was sequenced on an
Illuminareg HiSeqtrade platform and aligned to the reference genomes of the RWA and pea
aphid In addition the annotated X chromosome of the fruit fly was aligned to the RWA
genome in order to annotate corresponding regions located on the sex chromosome of
the RWA
3231 Next generation sequencing
The X chromosome DNA fraction isolated through flow cytometry (Section 3224) was
sent for sequencing to Macrogen (Korea) where amplification was performed prior to
sequencing using the TruSeq Nano DNA Library Preparation Kit (Illumina FC1214001)
Paired-end sequencing was performed using the Illuminareg HiSeqtrade 2000 system
Sequence read length consisted of 101 bp and library insert sizes of 350 bp
3232 Reference mapping of the RWA X chromosome sequence data set to that
of the whole genome of the RWA and pea aphid
Sequencing reads obtained from the Illuminareg HiSeqtrade 2000 platform were aligned to the
reference genomes of the RWA (SAM_Contigs_Version 11 GCA_0014655151 Botha
et al 2016 ndash in press) and the pea aphid (Acyr_20 GCA_0001429852 The International
Stellenbosch University httpsscholarsunacza
Chapter 3
69
Aphid Genomics Consortium 2010) using Geneious v717 (Kearse et al 2012) (Figure
34)
Raw sequencing reads were verified for quality using FastQC
(httpwwwbioinformaticsbabrahamacukprojectsfastqc) The first 18 bases displayed
biased sequence composition at the start of the reads These poor quality reads were
filtered and trimmed by making use of FASTX-Toolkit
(httphannonlabcshledufastx_toolkit) to ensure that for a pair of paired-end reads
each data set had 90 or more bases with a phred score greater than or equal to Q20
(Figure 34)
Quality trimmed reads were aligned to the RWA reference genome
(SAM_Contigs_Version 11 GCA_0014655151 Botha et al 2016 ndash in press) as well as
to that of the pea aphid (Acyr_20 GCA_0001429852 The International Aphid Genomics
Consortium 2010) using Burrows-Wheeler aligner (BWA) with default parameters (Li and
Durbin 2010) The quality of the alignments was assessed by using Qualimap (Garcίa-
Alcalde et al 2012) (Figure 34)
Figure 34 Workflow of the quality filtering and alignment of the raw reads obtained from sequencing at Macrogen (Korea) to the RWA and pea aphid genomes Where raw read alignment was done using the Alighn to reference tool in Geneious (v717) and quality filtered reads were aligned using Burrows-Wheeler aligner (BWA) Raw reads were quality filtered using FastQC and FastX-Toolkit
Stellenbosch University httpsscholarsunacza
Chapter 3
70
Figure 35 Workflow of k-mer analysis and SOAPdenovo of the raw reads obtained from sequencing at Macrogen (Korea) to generate contigs and scaffolds
In order to determine the optimum k-mer size for de novo assembly and sequencing
depth raw sequencing reads were subjected to k-mer analysis by using KmerGenie
(httpkmergeniebxpsuedu Chikhi and Medvedev 2014) (Figure 35)
The raw sequencing reads were assembled using SOAPdenovo
(httpsoapgenomicsorgcnsoapdenovohtml) This software package makes use of the
de Bruijn graph algorithm to ultimately simplify the assembly of the contigs and scaffolds
(Li and Durbin 2010) (Figure 35)
3233 Physical mapping against the X chromosome of the fruit fly
The coding sequence (CDS) and proteins of the annotated X chromosome of the fruit fly
(BDGP6 Adams et al 2000) were retrieved and aligned to the CDS and proteins of the
well-annotated RWA genome (SAM_Contigs_Version 11 GCA_0014655151 Botha et
al 2016 ndash in press) using Geneious v717 (Kearse et al 2012) (Figure 36)
Figure 36 Workflow of bioinformatics analysis of the fruit fly X chromosome against the RWA genome The coding sequences were aligned using BLASTn and the proteins were aligned using BLASTp
Stellenbosch University httpsscholarsunacza
Chapter 3
71
The data was processed on Microsoft Excel (Microsoft Office 2010) For the CDS BLASTn
the selection criteria was strict where only sequences with a 70 or more query coverage
and identity were included The protein BLASTp selection criteria included proteins with
40 or more query coverage and identity
324 Fluorescent in situ hybridization
3241 Fluorescent probes
In order to generate probes to hybridize against the RWA sex chromosome orthologous
regions were identified by aligning the X chromosome of the fruit fly to the RWA genome
(as seen in Section 3233) Primers were designed from target regions on the RWA
genome that aligned to X chromosome genes of the fruit fly using Geneious v717
(Kearse et al 2012) The eight primers used in the study were selected according to the
percentage identical sites and the region with a BLAST hit (Table 31) Two probes as
used by Novotnaacute et al (2011) were included as positive controls (ie 18S rRNA and
histone H4)
In order to generate unlabelled probes polymerase chain reactions (PCR) using the
primers listed in Table 31 were conducted The 20 μl PCR master mix contained 1X PCR
buffer (Thermo Scientific) 2 U Taq polymerase (Thermo Scientific) 02 mM dNTPrsquos mix
(Thermo Scientific) 500 nmol of each primer and 100 ng of template genomic RWA DNA
The PCR reaction conditions were as follows 5 minutes at 95 degC 35 cycles of 15 seconds
at 94 degC 15 seconds at 57 degC 60 seconds at 72 degC followed by a final elongation step
of 10 minutes at 72 degC PCR products were separated on a 2 agarose (SeaKemreg) gel
at 90 volts for 80 minutes and was visualised on a Gel Doc EZ imager (Bio-Rad) at the
Department of Genetics Stellenbosch University South Africa The PCR products (Table
31) were cleaned using a Qiagen MinElutereg Reaction Cleanup Kit and labelled by PCR
re-amplification with a dNTP mix containing 035 mM biotin-16-dUTP (Roche)
Stellenbosch University httpsscholarsunacza
Table 31 Primer sequences used to generate probes for FISH Expected product size and gene of origin in the RWA genome are given Primer X probe 18S rRNA and X probe H4 (Novotnaacute et al 2011) were used as positive controls
Primer Sequence Expected product size Description Accession number (RWA genome)
F 5-CCTGAGAAACGGCTACCACATC-3
R 5-GAGTCTCGTTCGTTATCGGA-3
F 5-TSCGIGAYAACATYCAGGGIATCAC-3
R 5-CKYTTIAGIGCRTAIACCACRTCCAT-3
F 5-TCAGAATCCGACAACTAAACACA-3
R 5-AGCCTCACATTGAAGTTGAGACT-3
F 5-GATACGGATCCACGCGAACT-3
R 5-ACCACACTCTGACCACGTTC-3
F 5-ACGAGTTCCGATGTGCCAAT-3
R 5-ACCACCTGTCCACTTTCATCC-3
F 5-GGCTACTGCTGCTTCTTCCA-3
R 5-GGAATGTAGGCCTAATGCATTGG-3
F 5-CTGGGGGATTCGTTGGTCAT-3
R 5-TCGAGCTGAAAGGAATAGTCACT-3
F 5-TCATCTATAACTGTAGTCCTGCAC-3
R 5-ATCCCCCAGCCCTGACTAAT-3
F 5-AAGACTCTGGGCAACGGAAG-3
R 5-TGCACAAACACCAAAAATATCCCA-3
F 5-ATTGGTATCGATCGGTGCCG-3
R 5-CACACAACGCACTTACGCAC-3
RWA probe Name
P9 X probe scaf_13192 895 bp
P10 X probe scaf_17249 499 bp
P7 X probe scaf_6337a 500 bp
P8 X probe scaf_6337b 498 bp
P5 X probe scaf_1960 944 bp
P6 X probe scaf_4125 641 bp
histone H4
heat shock protein cognate 3 precursor
low-density lipoprotein
actin 5C isoform B
P1 X probe 18S rRNA 1051 bp
P2 X probe H4 210 bp
P3 X probe scaf_1481 1460 bp
P4 X probe scaf_1801 433 bp
actin (ACYPI006035)
alpha-actinin sarcomeric-like isoform 2
107165916
107167901
g943t1
g1176t1
g1279t1
g2500t1
g3570t1
g3569t1
g5957t1
g7053t1
inhibitory POU protein-like
actin-42A-like isoform 1
hypothetical protein LOC100168805
18S rRNA X-elimantion
Stellenbosch University httpsscholarsunacza
Stellenbosch University httpsscholarsunacza
Chapter 3
73
3242 Slide preparation and treatment
Slides with mounted chromosomes were prepared as previously discussed in Section
3211 with modifications as described by Sahara et al (1999) Fukovaacute et al (2005) and
Novotnaacute et al (2011) Briefly chromosomes were dehydrated by passing them through
an ethanol series (70 80 and 96 for 30 seconds each) and aged at -20 degC
overnight The chromosomes were passed through the ethanol series and air-dried at RT
In order to remove excess proteins the chromosome slides were baked for 4 hours at 65
degC and incubated in 100 microg proteinase K (Fermentas) in 100 ml 1X Phosphate-buffered
saline (PBS) (137 mM NaCl 27 mM KCl 10 mM Na2HPO4 and 18 mM KH2PO4 pH 74)
for 5 minutes The chromosomes were washed twice in 1X PBS RNA was removed by
treating the chromosomes with 20 microg RNase A (Thermo Scientific) in 100 microl 2X Saline
sodium citrate (SSC) (03 M NaCl and 003 M Na3C6H5O7 pH 70) for 1 hour followed by
washing twice in 2X SSC The chromosomes were finally incubated in 5X Denhardtrsquos
solution (Sigma) for 30 minutes All the wash steps and incubation periods were
performed at 37 degC Denaturation of the chromosomes was performed at 68 degC for 3
minutes and 30 seconds in 70 deionized formamide (Merck) in 2X SSC The prepared
slides were subjected to a final ethanol dehydration series and air-dried at RT
3243 Probe denaturation and hybridization
Labelled probes (50 ngmicrol) in Section 3241 were mixed together with 25 microg of competitor
sonicated salmon sperm DNA (Sigma) where after 20 microl of cold 100 ethanol was also
added Probes were allowed to precipitate at -80 ordmC for 30 minutes and subsequently
centrifuged at 13000 rpm for 20 minutes The supernatant was discarded and the pellet
was washed with cold 70 ethanol and once more centrifuged at 13000 rpm for 10
minutes The supernatant was carefully discarded by pipetting and the sample was
allowed to air-dry at 37 ordmC Once the sample was dry it was dissolved in 5 microl pre-warmed
deionized formamide (Merck) at 37 ordmC for 30 minutes with vortexing every 10 minutes
Stellenbosch University httpsscholarsunacza
Chapter 3
74
where after 5 microl 20 (wv) dextran sulphate (Sigma) pre-warmed to 37 ordmC was added to
form the hybridization mix Probes were denatured by heating the hybridization mix to
90 ordmC for 5 minutes where after the hybridization mix was immediately chilled on ice for
10 minutes before applying to the chromosomal slides
The hybridization mix (10 microl) was spotted onto the prepared slide (Section 3242) and
covered with a 22x22 mm cover glass slip The cover glass was gently pressed down to
avoid any bubbles and the edges were completely sealed with PVC-U cement (Tangit)
The slides were incubated overnight at 37 ordmC
3244 Probe detection and signal enhancement
The PVC-U cement (Tangit) was carefully removed from slides (Section 3243) by using
forceps and slides were submerged in 50 (vv) formamide (Merck) allowing the cover
slip to detach The labelled chromosome slides were then subjected to wash steps as
follows three times with 2X SSC containing 50 (vv) formamide (Merck) at 46 ordmC for
5 minutes five times with 2X SSC at 46 ordmC for 2 minutes three times with 01X SSC at
62 ordmC for 5 minutes and finally once with 4X SSC containing 01 (vv) Tweenreg 20
(Merck) at RT for 5 minutes
To enable probe detection 450 microl of 25 Bovine Serum Albumin (BSA) (Sigma)
dissolved in 4X SSC was dropped on each slide covered with a 22x50 mm cover glass
slip and incubated at RT for 20 minutes From here on incubations were performed in a
dark room Labelled chromosomes were then submerged for 1 minute in 2X SSC to
remove the BSA and allow the cover glass to detach Thereafter 100 microl Cy3-streptavidine
(Jackson Research Laboratories) was dropped onto each slide covered with a 22x50
mm cover glass and once again incubated at RT for 30 minutes followed by a 1 minute
submersion in 2X SSC to remove the Cy3-streptavidine and detach the cover glass The
labelled chromosomes were subjected to three washes with 4X SSC containing 01
(vv) Tweenreg 20 at 37 ordmC for 3 minutes
Stellenbosch University httpsscholarsunacza
Chapter 3
75
To enhance the probe signals 450 microl of 25 BSA dissolved in 4X SSC was dropped on
each slide covered with a 22x50 mm cover glass and incubated at RT for 10 minutes
followed by a 1 minute submersion in 2X SSC to remove the BSA and detach the cover
glass slip Thereafter 50 microl Biotinylated antistreptavidine (Vector) was dropped onto each
slide covered with a 22x50 mm cover glass and incubated at 37 ordmC for 20 minutes
followed by a 1 minute wash with 2X SSC to remove the antistreptavidine and cover glass
The slides were subjected to three washes with 4X SSC containing 01 (vv) Tweenreg
20 at 37 ordmC for 3 minutes The probe detection and signal enhancement steps were
repeated once more to obtain optimal signal enhancement
3245 Slide staining and visualisation
Labelled samples were stained for 5-8 minutes with Hoechst 33342 (Sigma) solution (10
mgml) that was diluted 1100 to a final concentration of 001 mgml The stained slides
were then briefly submerged in distilled H2O and left to dry at RT in the dark
After staining the chromosomes were visualised using a Zeiss LSM780 ELYRA PS1
(Zeiss Germany) confocal microscope equipped with Zen Lite Software (Zeiss Germany)
(CAF fluorescent microscopy unit Stellenbosch University South Africa)
Stellenbosch University httpsscholarsunacza
Chapter 3
76
33 Results
331 Karyotyping of RWA chromosomes
The karyotype was constructed to determine the number and appearance (size and
shape) of chromosomes in the nucleus of a RWA cell
Figure 37 displays the chromosomes as seen on the Zeiss LSM780 ELYRA PS1 (Zeiss
Germany) confocal microscope The Hoechst 33342 (Sigma) stain bound to the RWA
DNA and stained the chromosomes fluorescent blue The chromosomes appear to be
long slender rods of DNA which lack constriction sites or centromeres Figure 37
displays different sized chromosomes that cluster together The length of the
chromosomes can be compared to the 10 microm bar present in each image There are no
observable morphological differences between the chromosomes of RWA biotype SAM
and SA1
Figure 37 The RWA chromosomes are stained with Hoechst 33342 to enable their detection through the confocal microscope The chromosomes of biotype SAM and SA1 are compared A 10 microm bar is indicated in each image
SA1 SAM
SAM
Stellenbosch University httpsscholarsunacza
Chapter 3
77
The karyotype of the female RWA biotype SAM consists of a diploid chromosome number
of 10 The chromosomes were divided into size groups according to their length The
results produced two large sex chromosomes and four autosomal chromosome pairs of
which three homologous pairs are middle sized and one homologous pair is smaller
(Figure 38 Table 32) The chromosome groups varied remarkably in their length and
the smallest autosome chromosome pair as well as the X chromosomes were easily
Figure 38 The karyotype of a female RWA showing the complete set of chromosomes of 2n=10 [2 sex chromosomes (X) and 8 autosomes (6 middle size and 2 small size chromosomes)] Indicated is a 10 μm bar as well as the average sizes of each of the different chromosomes respectively
611 microm
420 microm
313 microm
Stellenbosch University httpsscholarsunacza
Chapter 3
78
identifiable because of their lower number However the remaining three middle sized
autosome chromosome pairs were difficult to pair and to distinguish from one another
because of their high number and similar size (Figure 37 Figure 38)
Table 32 The mean lengths of the chromosomes were determined by measuring ten specimen of each size
From the results the lengths of the three chromosome groups were determined by
measuring ten chromosomes of each size The data showed that the approximate length
of the chromosomes were as follows the X chromosome at 611 μm (SD = 013 microm) the
middle sized chromosome at 420 μm (SD = 015 microm) and the smallest chromosome at
313 μm (SD = 009 microm) (Table 32 Figure 38 Figure 39) These results suggest that
the X chromosome contributes approximately 28 of the total DNA based on length
Table 33 t-Tests were performed to test if the different size chromosome groups are statistically different (Table A1 Table A2 and Table A3)
t-Test X chromosome - middle chromosome p = 189 x 10-16
t-Test middle chromosome - small chromosome p = 542 x 10-13
t-Test X chromosome - small chromosome p = 942 x 10-22
The chromosome size groups were shown to be statistically different from one another in
Table 33 (as calculated in Table A1 Table A2 and Table A3) with p lt 005 for all the
size comparisons Figure 39 displays a chart that demonstrates the clear differences in
X chromosome (microm) Middle chromosome (microm) Small chromosome (microm)
614 432 333
585 427 309
623 381 325
612 436 299
621 435 310
623 422 312
626 421 312
598 419 308
603 408 312
600 420 307
Mean 611 420 313
SD 013 015 009
SD = standard deviation
Stellenbosch University httpsscholarsunacza
Chapter 3
79
size The X chromosome is nearly twice the size of the small chromosome and almost
15X the size of the middle chromosome making it by far the largest chromosome in the
karyotype of the RWA (Figure 39)
332 Flow cytometry separation of RWA chromosomes
Because of the size differences flow cytometry offered an attractive protocol that could
be used to isolate chromosomes from one another In this study the method is
implemented to separate the different sized chromosome groups of RWA biotype SAM
All of the flow cytometry results obtained during the study can be found in a supplemental
file named Folder A1 (see attached CD)
Figure 310 displays a single-parameter histogram that measures the relative
fluorescence area (PE-Texas Red-A) on the x-axis versus the number of events
(chromosome count) on the y-axis The histogram in Figure 310 shows the total number
of chromosomes that possess the physical properties ndash relative area and fluorescence -
selected for The peaks with the desired characteristics in this case the middle- and large
00
10
20
30
40
50
60
70
X chromosome Middle chromosome Small chromosome
Length
(micro
m)
Figure 39 The bar chart is a visual representation of the size differences of the RWA chromosomes
Stellenbosch University httpsscholarsunacza
Chapter 3
80
chromosomes were identified as the positive datasets The left middle chromosome peak
display a higher count (500) which is approximately 5X higher than that of the large
chromosome but with a lower fluorescence (31000-61000) The large chromosome
peak on the other hand has a lower count (100) but higher fluorescence (69000-
101000) The histogram did not display a positive peak for the small autosome
chromosomes (Figure 310) mostly because they were too small to be distinguished from
cell debris Therefore the small autosome chromosomes could not be separated from
the other size chromosome groups through flow cytometry
Table 34 displays the summarized data from a flow cytometry run The populations were
determined through the gating strategies as described in Section 3222 The data in
Table 34 shows that each subsequent gating strategy or population (black to red to green
to cyan and blue) allowed for more stringent flow sorting only selecting the chromosomes
of interest ultimately making the run more specific From the results it was noticed that
the middle sized chromosome had the highest percentage parent (735) while the large
sex chromosome had a low percentage parent (156) (Table 34) Percentage parent
Figure 310 The single-parameter histogram displays positive peaks for both the middle- and large chromosomes
Stellenbosch University httpsscholarsunacza
Chapter 3
81
refers to the percentage of gated particles Table 34 also displays an average
fluorescence of 40394 for the middle chromosome and 78095 for the large chromosome
333 Chromosomal DNA concentration
The DNA from the sorted X chromosome had to be extracted before sequencing (Table
A4)
Table 35 The X chromosomes of the samples were pooled together and the DNA concentration was determined (Table A4)
Biotype Ploidy Number of X chromosome pairs Total DNA (ng)
SAM 2C 2438044 8895
After flow sorting the number of X chromosomes (2047296) resulted in a total amount
of 88946 ng of DNA which was sufficient for sequencing later (Table 35) The DNA
concentration of an X chromosome pair equated to
This means that a single X chromosome was 018 pg
Table 34 The summarized data measured after gating allows for the calculation of the number of events passing through percentage parent as well as fluorescence Each block represents the results after that gating strategy has been implemented
X chromosome pair = 036 pg
X chromosome pair = 8895
2438044
- not measurednot included in gating areas
Stellenbosch University httpsscholarsunacza
Chapter 3
82
334 Estimation of RWA genome size
An estimate of the size of the RWA genome was calculated by using the lengths of the
chromosome groups (Section 331) the number of different chromosome pairs (Section
331) the DNA concentration of a single X chromosome (Section 333) as well as the
assumption that 1 pg DNA = 0978 x 109 base pairs (Doležel et al 2003 Doležel and
Bartoš 2005 Doležel et al 2012)
1C was determined as follows
Thus the estimated genome size was calculated as follows
Therefore
335 Next generation sequencing (NGS) and bioinformatic analysis of
RWA X chromosome
Using the Illuminareg HiSeqtrade 2000 platform offered by Macrogen NGS produced a total
of 13818304294 bases from the RWA sex chromosome fraction with a read count of
136814894 (Table 36) The resulting NGS reads were of high quality as revealed by a
Phred score of 9632 The GC content of the sequence data of the sex chromosome
1C = [018] + [(3) (420
611) (018)] + [(1) (
313
611) (018)]
1C = 018 + 037 + 009
1C = 064340425 pg
1 pg = 0978 times 109 base pairs
= 1C times (0978 times 109)
= 064340425 times (0978 times 109)
= 629 Mb
Stellenbosch University httpsscholarsunacza
Chapter 3
83
was 3544 (Table 36) corroborating the low GC percentage found in RWA (Botha et al
2011 2015 Nicholson et al 2015)
Table 36 The tabulated results obtained from the NGS including the sequencing platform used number of bases read count GC percentage and Q20 percentage
Sequencing platform Number of bases Read count GC Q20 ()
Illuminareg HiSeqtrade 2000 13818304294 136814894 3544 9632
In order to assess the quality of the obtained NGS data a FastQC analysis was
performed The complete results obtained during the FastQC analysis are included in
Folder A2 (see attached CD) The y-axis of the graphs displayed in Figure 311 indicates
the quality scores per base of sequence The FastQC results presented in Figure 311
shows that the sequences produced by Macrogen had high base quality mostly with little
degradation as the run progressed at the end Figure 311 (A) represents the forward
sequence of the RWA X chromosome while Figure 311 (B) represents the reverse
sequence of the RWA X chromosome
The graphs in Figure 312 are very similar with both the forward sequence (A) and reverse
sequence (B) displaying AT-richness The GC is indicated in the graphs in Figure 312
Figure 312 also displays phasing at the start of the reads
Figure 311 The quality of the sequence bases were assessed using FastQC The y-axis of the graph is divided into three regions good quality calls (green) reasonable quality calls (orange) and poor quality calls (red) Graph A represents the forward sequence while graph B represents the reverse sequence of the RWA X chromosome
A B
Stellenbosch University httpsscholarsunacza
Chapter 3
84
KmerGenie estimated the best k-mer length for genome de novo assembly to build
contigs and scaffolds from the NGS raw reads for the X chromosome of the RWA (Folder
A3 ndash see attached CD) The y-axis of the graphs in Figure 313 represents the number of
k-mers but it can also be interpreted as the estimated size of an assembly of this dataset
Figure 313 displays a plot with multiple local maximarsquos for k-mer size
Figure 314 displays three k-mer histograms where A represents the KmerGenie
recommended k-mer size of k=27 for the forward sequence B represents the KmerGenie
recommended k-mer size of k=25 for the reverse sequence and C represents the k-mer
size k=27 for the reverse sequence that was self-selected because the same k-value
was needed for both the forward and reverse sequences of the RWA X chromosome to
Figure 313 Genomic k-mers versus k-mer size Graph A represents the forward sequence while graph B represents the reverse sequence of the RWA X chromosome
A B
Figure 312 The plot indicates the percentage ATGC content per base in the sequence with the red line representing T blue C green A and black G Graph A represents the forward sequence while graph B represents the reverse sequence of the RWA X chromosome
A B
Stellenbosch University httpsscholarsunacza
Chapter 3
85
build the contigs and scaffolds Therefore k=27 (A and C) was selected as the best fit for
the paired-end reads
The reads that were subjected to de novo sequence assembly using SOAPdenovo
(httpsoapgenomicsorgcnsoapdenovohtml) produced 1059574 contigs for the
sorted RWA X chromosome fraction with the longest contig being 7071 bp (N50 = 314)
The GC content of the built contigs were 3005 A total of 671410 bp (N50 = 1367)
scaffolds were obtained with the longest being 46046 bp The GC content from the built
scaffolds was 3013 (Table 37 Folder A4 ndash see attached CD)
Figure 314 The graphs (A ndash C) embody k-mer abundance histograms A represents the k-mer size that was used for the forward sequence of the RWA X chromosome while B and C represent the k-mer sizes for the reverse sequence of the RWA X chromosome A and B was recommended by KmerGenie for the forward and reverse sequences respectively but C (self-selected) was used for the reverse sequence Therefore A and C was used
A B
C
Stellenbosch University httpsscholarsunacza
Chapter 3
86
Table 37 The tabulated results produced by SOAPdenovo presenting the contig and scaffold assemblies
Number Mean Size Median Size Longest Sequence Shortest Sequence GC
Contigs
1059574 260 198 7071 100 3005
Scaffolds
671410 677 320 46046 100 3013
336 Mapping of the X chromosome reads to the reference RWA and
pea aphid genomes
The reads from the RWA X chromosome fraction was aligned and mapped to the
reference genomes of the RWA (SAM_Contigs_Version 11 GCA_0014655151 Botha
et al 2016 ndash in press) and the pea aphid (Acyr_20 GCA_0001429852 The International
Aphid Genomics Consortium 2010) The Qualimap results of the RWA were compared to
that of the pea aphid Table 38 displays that the raw reads of the sex chromosome had
a much higher mapping percentage to the RWA reference genome (8288) compared
to that of the pea aphid (513)
Table 38 The tabulated results produced by Qualimap analysis highlighted the differences in mapping percentage coverage and mapping quality between aligning the RWA and pea aphid genomes against the sorted X chromosome of the RWA
Russian wheat aphid Pea aphid
Number of reads 139472676 137070267
Mapped reads 8288 5130
Unmapped reads 1712 4870
Paired reads 8288 5130
GC 3503 3515
Mean coverage (x) 3566 684
Mean mapping quality 3612 795
This also indicates that there was a much higher coverage to the RWA genome (roughly
5X higher coverage) and that the mapping quality to the RWA was also better Table 38
also shows that the RWA and pea aphid have similar ACGT content both with AT-rich
reads
Stellenbosch University httpsscholarsunacza
Chapter 3
87
A Qualimap analysis was also conducted (Folder A5 ndash see attached CD) which displays
plots for the RWA and pea aphid each consisting of two figures (Figure 315) The upper
figures provide the coverage distribution (red line) and coverage deviation across the
reference sequences where coverage is presented along the y-axis and coverage
deviation along the x-axis The lower figure shows GC content measured in percentage
across reference genome together with its average GC
In Figure 315 both plots show complete coverage across the genomes of the RWA and
the pea aphid Figure 315 also displayed GC content (30) that is very similar between
the two aphid species as indicated by the lower figures on each plot
Figure 315 Coverage deviation and GC content of the alignment of the X chromosome reads of the RWA and the reference genomes of RWA (top) and pea aphid (bottom)
Russian wheat aphid
Diuraphis noxia
Pea aphid
Acyrthosiphon pisum
Coverage Deviation
Coverage Deviation
GC content
GC content
Stellenbosch University httpsscholarsunacza
Chapter 3
88
Complete genome coverage was also supported by the results following the alignment
done in Geneious (v717) of the raw reads from the RWA X chromosome to the reference
genome of the RWA (SAM_Contigs_Version 11 GCA_0014655151 Botha et al 2016
ndash in press) The data is presented in Folder A6 (see attached CD)
337 Physical mapping of the X chromosome of the fruit fly to the
available X chromosome sequences of the RWA
Table 39 displays a comparison between the genome and X chromosome of the fruit fly
against that of the RWA genome and X chromosome The RWA has a much larger
genome size compared to the fruit fly and has five chromosome pairs while the fruit fly
has seven chromosome pairs (Lemeunier et al 1986) Furthermore the estimated RWA
X chromosome size (176040000 bases) is so big that it is larger than the complete
genome of the fruit fly of 143725995 bases The fruit flyrsquos X chromosome equates to
163 of its total genome compared to the RWAs 28 The RWA also has a much lower
GC percentage across its genome and X chromosome compared to that of the fruit fly
Table 39 The genome and X chromosome of the fruit fly is compared to that of the RWA by looking at size- and content differences
Fruit fly Russian wheat aphid
Database version 846 1
Genebuild version dmel_r6_FB2014_05 SAM_Contigs
Estimated genome size (pg) 018 064
Assembled genome size 143725995 629048261
Genome GC 4210 2950
of contigs 2442 186003
Genome coding genes 13918 35492
of chromosome pairs 7 5
of chromosome fragments 1 1466
X chromosome size 23542271 176040000
X chromosome GC 4250 3040
Stellenbosch University httpsscholarsunacza
Chapter 3
89
The results in Table 310 show that when the coding sequence of the fruit flyrsquos X
chromosome was mapped against the RWA genome that only 831 of the length of the
RWA X chromosome was aligned However when the proteins of the fruit fly X
chromosome was mapped against the RWA genome the results were much better with
6742 of the proteins of the RWA X chromosome being reported The complete dataset
obtained during the BLASTn and BLASTp analysis is presented in spreadsheet format in
Folder A7 (see attached CD)
Table 310 The fruit fly X chromosome CDS and proteins were aligned against the RWA genome CDS and proteins in order to characterise the RWA X chromosome
Fruit fly X chromosome CDS vs RWA genome CDS (BLASTn)
Total length of RWA X chromosome aligned 14631822
aligned 831
Fruit fly X chromosome proteins vs RWA genome proteins (BLASTp)
Total length of RWA X chromosome aligned 118687515
aligned 6742
338 Fluorescent in situ hybridization (FISH)
3381 Probe generation for the RWA sex chromosomes
The primers that were ordered for probe generation were verified as correct through gel
electrophoresis to test if they amplified the correct product sizes
All of the primers produced single bands of the correct size (Table 31) and no
contamination was visible in the series (Figure 316)
Stellenbosch University httpsscholarsunacza
Chapter 3
90
3382 Visualisation
FISH with the control probe 1 (18S rRNA) displayed co-localization of hybridization
signals (red fluoresence) at one end of the X chromosome of the RWA female (Figure
317 ndash Probe 1) Control probe 2 (histone H4) also displayed signals but the chromosome
images had a low resolution therefore exact localization on the chromosomes could not
be determined The same occurred using the other probes ndash probe 3 (X probe scaf_1801)
probe 5 (X probe scaf_1960) probe 6 (X probe scaf_4125) probe 7 (X probe
scaf_6337a) probe 8 (X probe scaf_6337b) and probe 10 (X probe scaf_17249) ndash where
Figure 316 Gel electrophoresis was carried out on a 2 agarose gel at 90 volts for 80 minutes to determine if the primers amplified the correct product sizes Probe 1 and 2 were used as positive controls A 1 kb (Promegatrade) DNA ladder was used Refer to Table 31 for probe names
Probes 1 kb Ladder
500 bp
1500 bp
1000 bp
1000 bp
700 bp
500 bp
P1 P2 P3 P4 P5 L
P10 P9 P8 P7 P6 L
Stellenbosch University httpsscholarsunacza
Chapter 3
91
localization of probes did occur but visual confirmation of the chromosomes and probe
binding location was lacking (Figure A1) Probe 4 (X probe scaf_1801) and probe 9 (X
probe scaf_13192) did not display any hybridization signals
Figure 317 Mitotic chromosome complements of RWA after differential staining and FISH Probe 1 and 2 was used as controls and the other probes were derived from the fruit fly X chromosome
Stellenbosch University httpsscholarsunacza
Chapter 3
92
34 Discussion
341 RWA karyotype and genome size estimation
In RWA embryonic tissue cells are constantly in the process of multiplication and
differentiation Therefore a proportion of the cells are in late prophase or metaphase of
mitosis when the number and relative sizes of their chromosomes can be observed RWA
embryos were used in the study because most of the cells are multiplying and
differentiating constantly meaning a large proportion of them will be in late prophase or
metaphase of mitosis when chromosomes can be best observed (Novotnaacute et al 2011)
Hoechst 33342 (Sigma) is a membrane permeant dye that binds to adenine-thymine-rich
regions of DNA in the minor groove Botha et al (2012) found that the RWA has the most
AT-rich insect genome sequenced therefore enabling the Hoechst that was used to stain
the RWA slide preparations to bind to the entire chromosomes as presented in Figure
37
The chromosome preparations that were obtained from RWA biotype SA1 and SAM after
staining did not display any variations in chromosome number size and shape This
might be because SAM was developed from SA1 after laboratory induced selective
pressure (Swanevelder et al 2010) leading to no differences in these areas Also the
fact that the RWA reproduces asexually contributes to the lack in chromosomal
differences During asexual reproduction the traits of only the female RWA is passed on
to progeny resulting in identical offspring with a lower genetic diversity These factors
could be the reason that the chromosomes between these two RWA biotypes are visually
identical as seen in Figure 37
The results of this study indicated that the X chromosome of the RWA is 15X the size of
the middle sized chromosomes as well as twice the size of the smallest chromosomes
therefore it is easy to identify the chromosomes based on their size (Figure 37 Figure
Stellenbosch University httpsscholarsunacza
Chapter 3
93
38 Table 32 and Table 33) The X chromosome pair and small autosome chromosome
pair are easily distinguished because of their size and low numbers (Figure 38) however
the three remaining middle autosome chromosome pairs are difficult to separate and
identify because of their similar size and the fact that RWA chromosomes lack
centromeres Apart from the lengths of the chromosomes there are no other
morphological features that would aid in the identification of different chromosomes
(Figure 38)
The statistical investigations into X chromosome sizes of aphids are somewhat
uncommon The only data available is for a few species of the genus Neuquenaphis
(Neuquenaphidinae) where the sizes of the X chromosomes vary from 11 to 15 of the
total genome (Blackman et al 2003) and for the related Myzus persicae species where
the size of the X chromosome almost reach 27 of the genome (Blackman and Takada
1976) In 2011 Novotnaacute et al compared female and male RWA genome sizes They
found the female genome size to be 2C = 086 pg while the male genome size was 2C
= 070 pg The difference in DNA content between the males and females suggested that
the RWA X chromosome occupies around 35 of the female haploid genome (1C = 043
pg) making it one of the largest sex chromosomes in the animal kingdom The assembly
of the karyotype (Figure 38) and statistical investigation (Table 32 Table33 and Figure
39) confirms that the X chromosome is by far the largest element in the karyotype of the
RWA The results in this study further suggests that the DNA content of a single X
chromosome is 018 pg (Section 333) while the genome equates to 1C = 064 pg
(Section 334) suggesting that the X chromosome contributed approximately 28 of the
total DNA which is slightly less than that measured by Novotnaacute et al (2011) but very
close to that of the related green peach aphid where the X chromosome reaches almost
27 of the genome size (Blackman and Takada 1976)
Stellenbosch University httpsscholarsunacza
Chapter 3
94
Arthropod genome sizes exhibit considerable diversity with the largest reported to date
being that of the grasshopper (Orthotera Neoconocephalus triops L) (1C = 7 125
(male)7 752 (female) Mb 793 pg) and the smallest being the two spotted spider mite
(Trombidiformes Tetranychus urticae) (1C = 907 Mb 009 pg) (Hanraham and Johnston
2001 Johnston et al 2007) In this study the genome of the female RWA is estimated to
be 629 Mb (Section 334) which is more than the 421 Mb that Novotnaacute et al (2011)
predicted using flow cytometry The genome of the model aphid pea aphid is 517 Mb
roughly 178 smaller than the RWA genome size predicted in this study
342 Flow cytometry and next generation sequencing
Ultimately the flow cytometry that was used to isolate the X chromosomes of the RWA
also proved to be a method to identify the X chromosome based on its relative size and
fluorescence Figure 310 presented that the X chromosomes had a higher fluorescence
than the middle chromosomes because of its bigger surface area A larger surface area
allows for more fluorescent dye in this case propidium iodide (PI) to bind to double
stranded DNA by intercalating between base pairs The results of the histogram in Figure
310 compares with the karyotype of the RWA The karyotype of the female RWA consists
of 10 chromosomes ndash two large sex (X) chromosomes six middle autosome
chromosomes and a single set of small autosome chromosomes (Figure 38) The
histogram in Figure 310 supports this data by the two distinct peaks The large
chromosomes have a larger area than the autosome chromosomes resulting in a higher
fluorescence peak However the fact that the RWA possesses more middle
chromosomes in their karyotype resulted in the peak with the higher count particles
passing through the instrument (Figure 310) The small chromosomes did not generate
a peak because of its small size and low fluorescence causing the instrument to classify
the small autosomes as debris and sorting it under the negative dataset with the
undesired characteristics (waste) Table 34 also linked in with the karyotype when the
Stellenbosch University httpsscholarsunacza
Chapter 3
95
percentage parent was studied In this case the large chromosomes had a lower
percentage parent (156) compared to the middle chromosomes (735) because of
their frequency - two out of ten chromosomes are large Furthermore Table 34 also
shows that the X chromosome is almost 15X times the size when the fluorescence
intensity was calculated correlating with Figure 39
The samples collected during flow cytometry for DNA extraction were chosen based on
the trails (Folder A1) that presented the best peaks and physical properties selected for
as seen in Figure 310 The samples all contained a large amount of chromosomes and
had sufficient DNA concentrations and the samples were pooled together
The NGS results produced by Macrogen were subjected to further analysis It is stipulated
that in a random library there should be little to no difference between the different bases
of a sequence run (ie A T G and C) In other words the lines in the plot presented in
Figure 312 were expected to run parallel with one another as close as possible However
the results in Figure 312 is explained in a study conducted by Botha et al (2012) and a
more recent study by Nicholson et al (2015) where they showed that the RWA has the
most AT-rich insect genome sequenced to date Briefly Botha et al (2012) reported it to
be comparable to the GC content described in A pisum (pea aphid) (296) (The
International Aphid Genomics Consortium 2010) and A mellifera (honeybee) (33) (The
Honeybee Genome Sequencing Consortium 2006) The high AT-rich genomes of the
RWA and the pea aphid contradict the hypothesized positive correlation between insect
genome size and AT content This AT-richness of the RWA genome has also recently
been reported by Nicholson et al (2015) and according to them the RWA genome is
composed of 291 GC and 709 AT which is the lowest GC of any currently-
assembled insect genome including the pea aphid The data (Figure 312 Table 36
Table 37 and Table 38) in this study correspond with these findings The high AT-
richness within aphid genomes may be evidence of relaxed GC biases and previous
Stellenbosch University httpsscholarsunacza
Chapter 3
96
mutational hotspots (Rocha et al 2010) which may be indicative of RWA genome
plasticity
343 Bioinformatic analysis and reference mapping
Libraries produced by amplification such as in this case through using the Truseq Nano
DNA Sample Prep Kit (Illumina) inherit an intrinsic bias in the position at which reads start
(Figure 312) This bias does not concern an absolute sequence but instead provides
enrichment of a number of different k-mers at the 5 end of the reads According to Chikhi
and Medvedev (2014) in cases like these the statistical model in KmerGenie does not
always correctly fit the input data for some values of k KmerGenie software suggests that
the plot in Figure 313 should ideally be concave with a smooth curve and a clear global
maximum (Chikhi and Medvedev 2014) However Figure 313 does not display a smooth
curve but rather a plot with multiple local maximarsquos for k-mer size Therefore the best k-
mer value that KmerGenie predicted may be suboptimal Subsequently KmerGenie
recommends that in later analysis (eg de novo assembly) a larger k than the one
predicted by the software should also be attempted In principal when the number of
predicted genomic k-mers remains high during a large range of ks the largest k value in
this range is likely to be a better choice (as indicated by the red circles in Figure 313)
resulting in the selected k=27 rather than k=25 (Figure 314)
The mapping (Table 38) and coverage (Figure 315) results of the RWA and pea aphid
were compared because the pea aphid is closely related to the RWA and well
characterised Figure 315 displays coverage - if one genomic region has a coverage of
10X it means that on average 10 different reads are mapped to each nucleotide of the
region The data presented an expected outcome with higher mapping percentage
coverage and quality to the RWA These results are due to the fact that the X
chromosome is isolated from the RWA Because of the close relation between these two
Stellenbosch University httpsscholarsunacza
Chapter 3
97
species mapping and coverage against the pea aphid also produced high quality results
as well as conformation that the RWA and pea aphid have nearly similar AT content
However from the results in Figure 315 it can be concluded that mapping coverage
stretches the whole genome of the RWA and pea aphid suggesting that the RWA X
chromosome fraction sent for sequencing was contaminated with other autosome
chromosomes resulting in whole genome coverage Therefore the process of flow
cytometry is not considered specific enough as it does not allow sorting of only the
chromosome of interest in this case the X chromosome
344 Physical mapping of the X chromosome
The fruit fly is a well-known model organism because of its abundance simplicity to breed
and that they are low cost subjects What is more important is that mapping populations
exist to enable for physical mapping The fruit fly X chromosome is well characterised and
studied with its coding genes non-coding genes and pseudogenes identified Mapping
the X chromosome of the fruit fly to the RWA genome allowed for some characterisation
of the RWA X chromosome The X chromosome of the fruit fly aided in the alignment of
6742 of the proteins of the RWA X chromosome by using the proteins of the fruit fly
and determining on which contigs of the RWA these proteins were mapped This
information will aid in the identification of these proteins and what their functions are
As an additional means of X chromosome characterisation fluorescent in situ
hybridization (FISH) was conducted to identify regions of interest on the sex chromosome
The probes were chosen based on mapping the X chromosome of the fruit fly against the
RWA genome to identify possible orthologous regions The gene descriptions are
presented in Table 31 After the product sizes of the probes were confirmed the
hybridization was conducted to obtain the images in Figure 317 Probe 1 (18S rRNA)
and 2 (histone H4) were used as controls in the study
Stellenbosch University httpsscholarsunacza
Chapter 3
98
In aphids nucleolus organiser regions (NORs) ie clusters of genes for 18S rRNA
(Probe 1) have been examined not only as chromosomal markers but also for their
possible role in X-chromosome elimination in oocytes destined to develop as males
During this process one of the X chromosomes is eliminated to generate eggs with two
autosomal sets and a single X chromosome (Orlando 1974 Blackman and Hales 1986)
It has been shown that the prometaphase X chromosomes are connected by a narrow
protein-DNA bridge carrying the NOR (Mandrioli et al 1999) From the results in Figure
317 it can be observed that probe 1 localized a terminal cluster of rRNA on the X
chromosome in female RWA This confirmed that the RWA X chromosome bears the
NOR Novotnaacute et al (2011) confirmed that the H4 probe also localizes a single cluster of
histone genes at the end of the X chromosome In Figure 317 it can be seen that probe
2 (H4) localization definitely occurs however in these cases the localization area cannot
be confirmed The same results can be observed in the other probes (3 5 6 7 8 and
10) where localization takes place but resolution in the images were insufficient to allow
for separation of single chromosomes on a spread Despite this limitation it was
nonetheless confirmed that these genes are also present in the RWA X chromosome data
set
Stellenbosch University httpsscholarsunacza
Chapter 3
99
35 Appendix
Table A1 t-Test with two samples assuming equal variances (X chromosome vs Middle chromosome)
X chromosome Middle chromosome
Mean 611 420
Variance 002 003
Observations 10 10
Pooled variance 002
Df 18
t stat 2858
P(Tlt=t) one-tail 945 x 10-17
t critical one-tail 173
P(Tlt=t) two-tail 189 x 10-16
t critical two-tail 210
Table A2 t-Test with two samples assuming equal variances (Middle chromosome vs Small chromosome)
Middle chromosome Small chromosome
Mean 420 313
Variance 003 001
Observations 10 10
Pooled variance 002
Df 18
t stat 1809
P(Tlt=t) one-tail 271 x 10-13
t critical one-tail 173
P(Tlt=t) two-tail 542 x 10-13
t critical two-tail 210
Table A3 t-Test with two samples assuming equal variances (X chromosome vs Small chromosome)
X chromosome Small chromosome
Mean 611 313
Variance 002 001
Observations 10 10
Pooled variance 001
Df 18
t stat 5675
P(Tlt=t) one-tail 471 x 10-22
t critical one-tail 173
P(Tlt=t) two-tail 942 x 10-22
t critical two-tail 210
Stellenbosch University httpsscholarsunacza
Table A4 The DNA concentration of an X chromosome pair was determined as follows where the total DNA concentration of the flow cytometry trails were divided by the number of X chromosome pairs sorted
Biotype Sample of chromosome pairs [DNA] (ngul) Total DNA (ng) Total DNA (pg) Total DNA (pg) of chromosome pairs
SAM Sample 5 251782 095 2090 20900 008
SAM Sample 6 138966 038 836 8360 006
SAM Sample 10 425200 610 13420 134200 032
SAM Sample 11 459050 910 20020 200200 044
SAM Sample 12 416004 890 19580 195800 047
SAM Sample 13 631000 780 17160 171600 027
SAM Sample 14 116042 720 15840 158400 137
SAM Total 2438044 4043 88946 889460 036
SAM Average 348292 578 12707 12706571 036
Stellenbosch University httpsscholarsunacza
Stellenbosch University httpsscholarsunacza
Chapter 3
101
Flow cytometry data and trails included in the study can be found in a supplemental file
named Folder A1 (see attached CD)
FastQC results achieved from assessing the quality of the data obtained from the NGS
analysis can be found in a supplemental file named Folder A2 (see attached CD)
KmerGenie estimated the best k-mer length for genome de novo assembly to build
contigs and scaffolds from the NGS raw reads for the X chromosome of the RWA and
can be found in a supplemental file named Folder A3 (see attached CD)
The tabulated results produced by SOAPdenovo presenting the contig and scaffold
assemblies can be found in a supplemental file named Folder A4 (see attached CD)
Qualimap results obtained from mapping the flow sorted RWA X chromosome against
the RWA genome and pea aphid genome can be found in a supplemental file named
Folder A5 (see attached CD)
Physical mapping of the flow sorted X chromosome against the RWA genome can be
found in a supplemental file named Folder A6 All of the data is presented in a spread
sheet format obtained from Geneious (v717) (see attached CD)
Physical mapping of the fruit fly X chromosome against the RWA genome can be found
in a supplemental file named Folder A7 All of the data is presented in a spread sheet
format (see attached CD)
Stellenbosch University httpsscholarsunacza
Probe 5 Probe 7a
Probe 8 Probe 7b
Figure A1 Mitotic chromosome complements of RWA after differential staining and FISH Probe 1 and 2 was used as controls and the other probes were derived from the fruit fly X chromosome
Stellenbosch University httpsscholarsunacza
Stellenbosch University httpsscholarsunacza
Chapter 3
103
36 List of references
Adams M D S E Celniker R A Holt C A Evans J D Cocayne et al 2000 The
genome sequence of Drosophila melanogaster Science 287 2185-2195
Bizzaro D M Mandrioli M Zanotti M Giusti and G C Manicardi 2000 Chromosome
analysis and molecular characterisation of highly repeated DNAs in the aphid
Acyrthosiphon pisum (Aphididae Hemiptera) Genetica 108 197-202
Blackman R L and H Takada 1976 Naturally occurring chromosomal translocation in
Myzus persicae (Sulzer) Journal of Entomology 50 147-156
Blackman RL and D F Hales 1986 Behavior of the X-chromosomes during growth
and maturation of parthenogenetic eggs of Amphorophora tuberculata
(Homoptera Aphididae) in relation to sex determination Chromosoma 94 59-64
Blackman R L 1987 Reproduction cytogenetics and development In A K Minsk and
P Harrewijn (eds) Aphids their biology natural enemies and control 2A 163-195
Blackman R L P A Brown C C Ramfrez and H M Niemeyer 2003 Karyotype
variation in the South American aphid genus Neuquenaphis (Hemiptera
Aphididae Neuquenaphidinae) Hereditas 138 6-10
Botha A M L van Eck C S Jackson N F V Burger and T Schultz 2011 Phloem
feeding insect stress and photosynthetic gene expression Applied
Photosynthesis Online at httpwwwintechopencombooksapplied-photosynthe
sisphloem-feeding-insect-stress-and-photosynthetic-gene-expression
Botha A M 2013 A co-evolutionary conundrum The arms race between Diuraphis noxia
(Kurdmojov) a specialist pest and its host Triticum aestivum (L) Arthropod Plant
Interactions 7 359-372
Stellenbosch University httpsscholarsunacza
Chapter 3
104
Botha A M N F V Burger W Cloete L van Eck K Breeds et al 2016 Draft genome
of female Diuraphis noxia (Hemiptera Aphididae) reveals high levels of genetic
diversity despite parthenogenecity and hypomethylation as a mean to enhance
genomic plasticity Genome Biology ndash in press
Bouhsinni M E F C Ogbonnaya M M Mosaad K Street A Amri et al 2011
Progress in host plant resistance in wheat to Russian wheat aphid (Hemiptera
Aphididae) in North Africa and West Asia Australian Journal of Crop Science 5
1108-1113
Burd J D D R Porter G J Puterka S D Haley and F B Peairs 2006 Biotypic
variation among North American Russian wheat aphid (Homoptera Aphididae)
populations Journal of Economical Entomology 99 1862-1866
Chikhi R and P Medvedev 2014 Informed and automated k-mer size selection for
genome assembly Bioinformatics 30 31-37
Davis G K 2012 Cyclical parthenogenesis and viviparity in aphids as evolutionary
novelties Journal of Experimental Zoology 318 448-459
Doležel J J Bartoš H Voglmayr and J Greilhuber 2003 Nuclear DNA content and
genome size of trout and human Cytometry 51127-128
Doležel J and J Bartoš 2005 Plant DNA flow cytometry and estimation of nuclear
genome size Annals of Botany 95 99-110
Doležel J J Vraacutena J Šafaacuteř J Bartoš M Kubalaacutekovaacute et al 2012 Chromosomes in
the flow to simplify genome analysis Functional and Integrative Genomics 12
397-416
Stellenbosch University httpsscholarsunacza
Chapter 3
105
Fukovaacute I P Nguyen and F Marec 2005 Codling moth cytogenetics karyotype
chromosomal location of rDNA and molecular differentiation of sex chromosomes
Genome 48 1083-1092
Garciacutea-Alcalde F K Okonechnikov J Carbonell L M Cruz S Goumltz et al 2012
Qualimap evaluating next generation sequencing alignment data Bioinformatics
28 2678-2679
Gaston K G 1991 The magnitude of global insect species richness Conserved Biology
5 283-296
Haley S D F B Peairs C B Walker J B Rudolph and T L Randolph 2004
Occurrence of a new Russian wheat aphid biotype in Colorado Crop Science 44
1589-1592
Hanrahan S J and J S Johnston 2001 New genome size estimates of 134 species of
arthropods Chromosome Research 19 809-823
Jankielsohn A 2011 Distribution and diversity of Russian wheat aphid (Hemiptera
Aphididae) biotypes in South Africa and Lesotho Entomological Society of
America 11 1736-1741
Johnston J S K S Yoon J P Strycharz B R Pittendrigh and J M Clark 2007 Body
lice and head lice (Anoplura Pediculidae) have the smallest genomes of any
hemimetabolous imsect reported to date Journal of Medical Entomology 44 1009-
1012
Kearse M R Moir A Wilson S Stones-Havis M Cheung et al 2012 Geneious basic
an integrated and extendable desktop software platform for the organization and
analysis of sequence data Bioinformatics 28 1647-1649
Stellenbosch University httpsscholarsunacza
Chapter 3
106
Kron P and B C Husband 2015 Distinguishing 2N gamete nuclei from doublets in
pollen using flow cytometry and pulse analysis Cytometry Part A 87 943-957
Kuznetsova V G and G C Shaposhnikov 1973 Chromosome numbers of aphids
(Homoptera Aphidinea) of the world auna Entomologicheskoe Obozrenie 52
116-135
Lemeunier F J R David and L Tsacas 1986 The melanogaster species group In
Ashburner M H I Carson and J K Thompson eds The Genetics and Biology
of Drosophila London Academic Press 3 147-188
Li H and R Durbin 2010 Fast and accurate long-read alignment with Burrows- Wheeler
transform Bioinformatics 26 589-595
Lockwood A P M 1961 lsquolsquoRingerrsquorsquo solutions and some notes on the physiological basis
of their ionic composition Comparative Biochemistry and Physiology 2 241-289
Lo K R R Brinkman and R Gottardo 2008 Automated gating of flow cytometry data
via robust model-based clustering Journal of the International Society for
Advancement of Cytometry 73 321-332
Mandrioli M D Bizarro G C Manicardi D Gionghi L Bassoli et al 1996 Cytogenetic
and molecular characterisation of a highly repeated DNA sequence in the peach
potato aphid Myzus persicae Chromosoma 108 436-442
Mandrioli M D Bizzaro M Giusti G C Manicardi and U Bianchi 1999 The role of
rDNA genes in X chromosome association in the aphid Acyrthosiphon pisum
Genome 42 381-386
Manicardi G C M Mandrioli and R L Blackman 2015 The cytogenetic architecture of
the aphid genome Biological Reviews 90 112ndash125
Stellenbosch University httpsscholarsunacza
Chapter 3
107
Merrill S C T O Holtzer and F B Peairs 2009 Diuraphis noxia reproduction and
development with a comparison of intrinsic rates of increase to other important
small grain aphids a meta-analysis Environmental Entomology 38 1061-1068
Miller H D R Porter J D Burd D W Mornhinweg and R L Burton 1994
Physiological effects of Russian wheat aphid (Homoptera Aphididae) on resistant
and susceptible barley Journal of Economic Entomology 87 493-499
Nicholson S J M L Nickerson M Dean Y Song P R Hoyt et al 2015 The genome
of Diuraphis noxia a global aphid pest of small grains BMC Genomics 16 429
Novotnaacute J J Havelka P Staryacute P Kouteckyacute and M Viacutetkovaacute 2011 Karyotype analysis
of the Russian wheat aphid Diuraphis noxia (Kurdjumov) (Hemiptera Aphididae)
reveals a large X chromosome with rRNA and histone gene families Genetica 139
281-289
Orlando E 1974 Sex determination in Megoura viciae Buckton (Homoptera Aphididae)
Monitore Zoologico Italiano 8 61-70
Puterka G J R W Hammon J D Burd F B Peairs T L Randolph et al 2012
Cyclical parthenogenetic reproduction in Russian Wheat Aphid (Hemiptera
Aphididae) in the United States Sexual reproduction and its outcome on biotypic
diversity Journal of Economic Entomology 105 1057-1068
Rocha E P C and E J Feil 2010 Mutational patterns cannot explain genome
composition Are there any neutral sites in the genomes of bacteria PLoS
Genetics doi 101371journalpgen1001104
Sahara K F Marec and W Traut 1999 TTAGG telomeric repeats in chromosomes of
some insects and other arthropods Chromosomes Research 7 449-460
Stellenbosch University httpsscholarsunacza
Chapter 3
108
Swanevelder Z H A K J Surridge E Venter and A M Botha 2010 Limited
endosymbiont variation in Diuraphis noxia (HemipteraAphididae) biotypes from
the United States and South Africa Journal of Economic Entomology 103 887-
897
Tagu D J P Klingler A Moya and J C Simon 2008 Early progress in aphid genomics
and consequences for plant-aphid interactions studies Molecular Plant Microbes
21 701-708
The Honeybee Genome Sequencing Consortium 2006 Insights into social insects from
the genome of the honeybee Apis mellifera Nature 443 931-949
The International Aphid Genomics Consortium 2010 Genome sequence of the pea aphid
Acyrthosiphon pisum PLoS Biology 8 e1000313
Thomas T J Gilbert and F Meyer 2012 Metagenomics ndash a guide from sampling to
data analysis Microbial Informatics and Experimentation 2 3
Traut W 1976 Pachytene mapping in female silkworm Bombyx mori L (Lepidoptera)
Chromosoma 58 275-284
Stellenbosch University httpsscholarsunacza
Chapter 4
Summary
Stellenbosch University httpsscholarsunacza
Chapter 4
110
41 Summary
Aphids are recognized as global agricultural pests that cause significant economic losses
worldwide with devastating effects on crop production Diuraphis noxia Kurdjumov more
commonly known as the Russian wheat aphid (RWA) is a widely distributed pest of
especially wheat Triticum austivum L (Stoetzel 1987) mostly because of the
development of new RWA biotypes that are virulent to different deployed resistant wheat
cultivars RWA biotypes have raised major concerns regarding durability of future RWA
resistance sources (Haley et al 2004)
Over the past 100 years aphids have been extensively studied as a popular model group
among cytogeneticists and thus far approximately a 1000 species have been karyotyped
of which numerous show big differences in chromosome number and morphology
(Kuznetsova and Shaposhnikov 1973 Blackman 1980) The chromosomes of aphids
have been shown to be holocentric meaning that they lack centromeres and display
kinetic activity along the length of the chromosome (Blackman 1987) This makes
chromosomes of similar size and shape almost identical making it impossible to
differentiate from one another However since then modern technology has afforded
scientists an opportunity to isolate specific DNA sequences in aphids Molecular
techniques along with fluorescent in situ hybridization (FISH) have allowed the
localization of rRNA satellites and telomeric (TTAGG)n repeats (Spence et al 1998
Bizarro et al 2000) Furthermore advances in science has also contributed to answering
the research questions presented in this study
In order to address the first research question relating to the composition of the karyotype
of the RWA and identifying the large X chromosome from the other autosome
chromosomes the embryos of female RWA were dissected to isolate differentiating cells
that are mostly in metaphase when chromosomes can be best observed The karyotype
Stellenbosch University httpsscholarsunacza
Chapter 4
111
was constructed from these samples and it was shown that the female RWA does in fact
possess a diploid (2n) chromosome number of 10 corroborating with results
demonstrated by Novotnaacute et al (2011) The X chromosomes were shown to be the largest
chromosomes in the karyotype and could easily be distinguished from the other
chromosomes
The successful differentiation of the RWA X chromosome led to the next research
question which was the physical contribution of the X chromosome to the genome of the
RWA To address this an attempt was made to isolate the RWA X chromosome using
flow cytometry The RWA chromosomes were sorted from one another based on their
size however the small autosome chromosomes could not be separated from the debris
because of their small size and low fluorescence The flow cytometry results displayed
successful separation of the large X chromosomes and middle autosome chromosomes
Using the size differences and the measured lengths of the chromosome pairs the size
of the X chromosomes were calculated to be 018 pg (equating to 1769 Mb)
The next question then was to conduct physical mapping on the sorted chromosomes
To accomplish this the DNA from the isolated X chromosomes was sequenced
Bioinformatic analysis confirmed that the RWA genome is AT-rich Physical mapping of
the proteins of the RWA against the proteins of the fruit fly X chromosome aided in further
characterisation of the RWA X chromosome resulting in the alignment of 6742 of the
length of the RWA X chromosome Fluorescent in situ hybridization also confirmed
orthologous regions of the fruit fly X chromosome to be present in the RWA karyotype
which ultimately suggested that these PCGs are present in the RWA X chromosome data
set
In conclusion it is clear from the karyotype results obtained in this study that the RWA X
chromosome is really large compared to the other autosome chromosomes and that
Stellenbosch University httpsscholarsunacza
Chapter 4
112
further investigation of the RWA X chromosome through flow cytometry sequencing and
FISH allowed for the determination of important characteristics like genome size X
chromosome protein content and possible X chromosome genes The results in the study
also suggested that the X chromosome occupies more than a quarter of the RWA
genome suggesting that more investigation studies into X chromosome genetic variability
would be beneficial and might even help with future resistance programmes
Stellenbosch University httpsscholarsunacza
Chapter 4
113
42 List of references
Bizzaro D M Mandrioli M Zanotti M Giusti and G C Manicardi 2000 Chromosome
analysis and molecular characterisation of highly repeated DNAs in the aphid
Acyrthosiphon pisum (Aphididae Hemiptera) Genetica 108 197-202
Blackman R L 1980 Chromosome numbers in the Aphididae and their taxonomic
significance Systematic Entomology 5 7-25
Blackman R L 1987 Reproduction cytogenetics and development In A K Minsk and
P Harrewijn (eds) Aphids their biology natural enemies and control 2 163-195
Haley S D F B Peairs C B Walker J B Rudolph and T L Randolph 2004
Occurrence of a new Russian wheat aphid biotype in Colorado Crop Science 44
1589-1592
Kuznetsova V G and G C Shaposhnikov 1973 Chromosome numbers of aphids
(Homoptera Aphidinea) of the world auna Entomologicheskoe Obozrenie 52
116-135
Novotnaacute J J Havelka P Staryacute P Kouteckyacute and M Viacutetkovaacute 2011 Karyotype analysis
of the Russian wheat aphid Diuraphis noxia (Kurdjumov) (Hemiptera Aphididae)
reveals a large X chromosome with rRNA and histone gene families Genetica 139
281-289
Spence J M R L Blackman J M Testa and P D Ready 1998 A 169 base pair
tandem repeat DNA marker for subtelomeric heterochromatin and chromosomal
rearrangements in aphids of the Myzus persicae group Chromosome Research
6 167-175
Stellenbosch University httpsscholarsunacza
Chapter 4
114
Stoetzel M B 1987 Information on and identification of Diuraphis noxia (Homoptera
Aphididae) and other aphid species colonizing leaves of wheat and barley in the
United States Journal of Economic Entomology 80 696-704
Stellenbosch University httpsscholarsunacza