Kartik anil reddy lab 1 u43452789
6
LAB 1 -Kartik Anil Reddy(U43452789) PROBLEM 1: a) Complete the table. Answer: Becnhmark Total # of instructions Load % Store % Unconditio nal branch% Conditional branch % Interger Computatio n% Floating Point Computatio n % anagram.al pha 170135580 25.38 9.89 4.98 10.41 43.01 6.25 go.alpha 545812406 30.62 8.17 2.58 10.96 47.64 0.03 Compress.a lpha 88199 1,61 79.17 0.19 5.74 13.27 0 Gcc.alpha 337331857 24.67 11.47 4.12 13.33 46.3 0.11
-
Upload
university-of-south-florida -
Category
Engineering
-
view
236 -
download
79
Transcript of Kartik anil reddy lab 1 u43452789

LAB 1
-Kartik Anil Reddy(U43452789)
PROBLEM 1:
a) Complete the table.
Answer:
Becnhmark Total # of
instructions
Load % Store % Unconditio
nal
branch%
Conditional
branch %
Interger
Computatio
n%
Floating
Point
Computatio
n %
anagram.al
pha 170135580 25.38 9.89 4.98 10.41 43.01 6.25
go.alpha 545812406 30.62 8.17 2.58 10.96 47.64 0.03
Compress.a
lpha 88199 1,61 79.17 0.19 5.74 13.27 0
Gcc.alpha 337331857 24.67 11.47 4.12 13.33 46.3 0.11
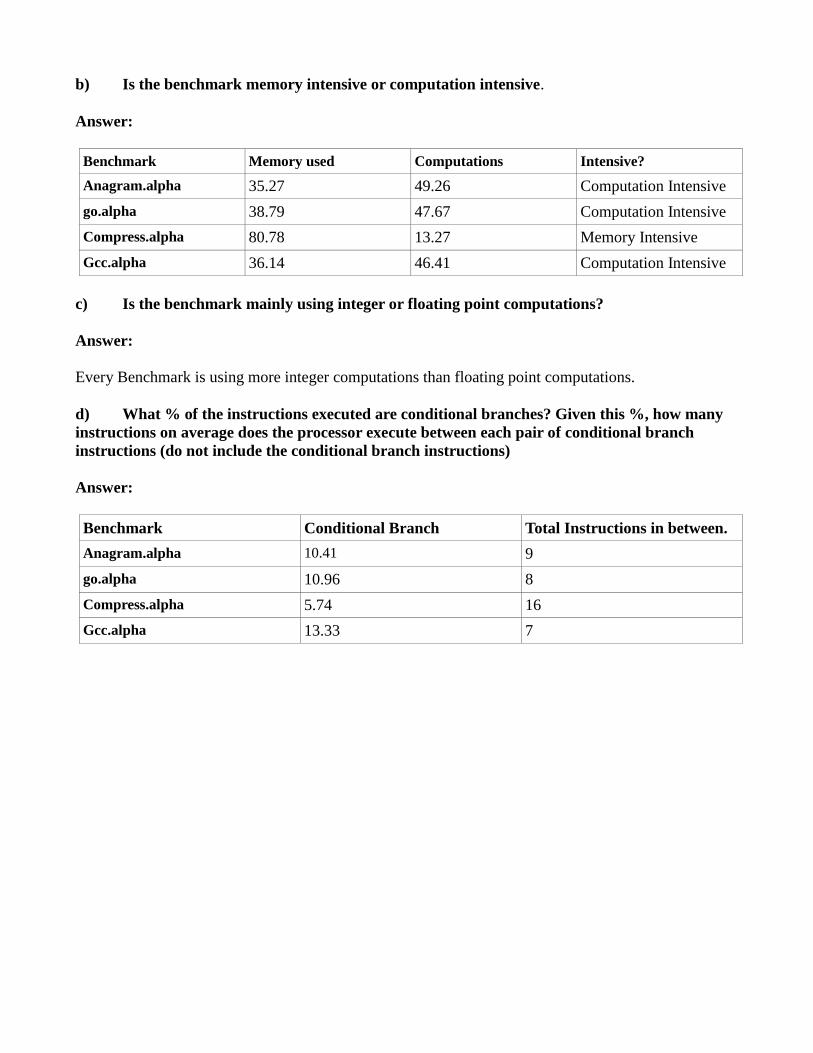
b) Is the benchmark memory intensive or computation intensive.
Answer:
Benchmark Memory used Computations Intensive?
Anagram.alpha 35.27 49.26 Computation Intensive
go.alpha 38.79 47.67 Computation Intensive
Compress.alpha 80.78 13.27 Memory Intensive
Gcc.alpha 36.14 46.41 Computation Intensive
c) Is the benchmark mainly using integer or floating point computations?
Answer:
Every Benchmark is using more integer computations than floating point computations.
d) What % of the instructions executed are conditional branches? Given this %, how many
instructions on average does the processor execute between each pair of conditional branch
instructions (do not include the conditional branch instructions)
Answer:
Benchmark Conditional Branch Total Instructions in between.
Anagram.alpha 10.41 9
go.alpha 10.96 8
Compress.alpha 5.74 16
Gcc.alpha 13.33 7

PROBLEM 2:
a) Complete the table.
Answer:
Becnhmark
ALPHA
Total # of
instructions
Load % Store % Unconditio
nal
branch%
Conditional
branch %
Interger
Computatio
n%
Floating
Point
Computatio
n %
test-math 49460 17.19 10.41 3.93 11.10 55.33 1.88
test-fmath 19549 17.76 12.49 4.69 11.34 53.14 0.42
test-llong 10677 17.88 14.53 5.40 12.50 49.40 0.10
test-printf 983523 17.99 10.73 4.82 11.39 54.85 0.09

b) Complete the table.
Answer:
Becnhmark
PISA
Total # of
instructions
Load % Store % Unconditio
nal
branch%
Conditional
branch %
Interger
Computatio
n%
Floating
Point
Computatio
n %
test-math 213703 15.96 10.67 4.22 13.84 54.42 0.88
test-fmath 53459 16.14 14.43 4.24 15.09 49.95 0.11
test-llong 29642 16.34 18.02 4.36 15.42 45.81 0
test-printf 1813891 19.22 9.28 5.13 17.01 49.33 0.01
c) Now compare the two ISAs using a plot (a Histogram is preferred). Use MATLAB or
EXCEL to plot the histogram. What can you conclude about the two ISAs from the Histogram.
Answer:

1) Test-math
Figure 1Graph of Test-math for alpha and pisa
2) Test-fmath
Figure 2Graph of Test-fmath for alpha and pisa

3) Test-llong
Figure 3Graph of Test-llong for alpha and pisa
4) Test-printf
Figure 4Graph of Test-printf for alpha and pisa