Kansas Kansas Workforce Initiative The Importance of Supervisors
Land Use/ Land Cover Mapping Initiativefor Kansas and the Kansas River
Watershed
Kansas Biological SurveyKansas Applied Remote Sensing Program
April 2008
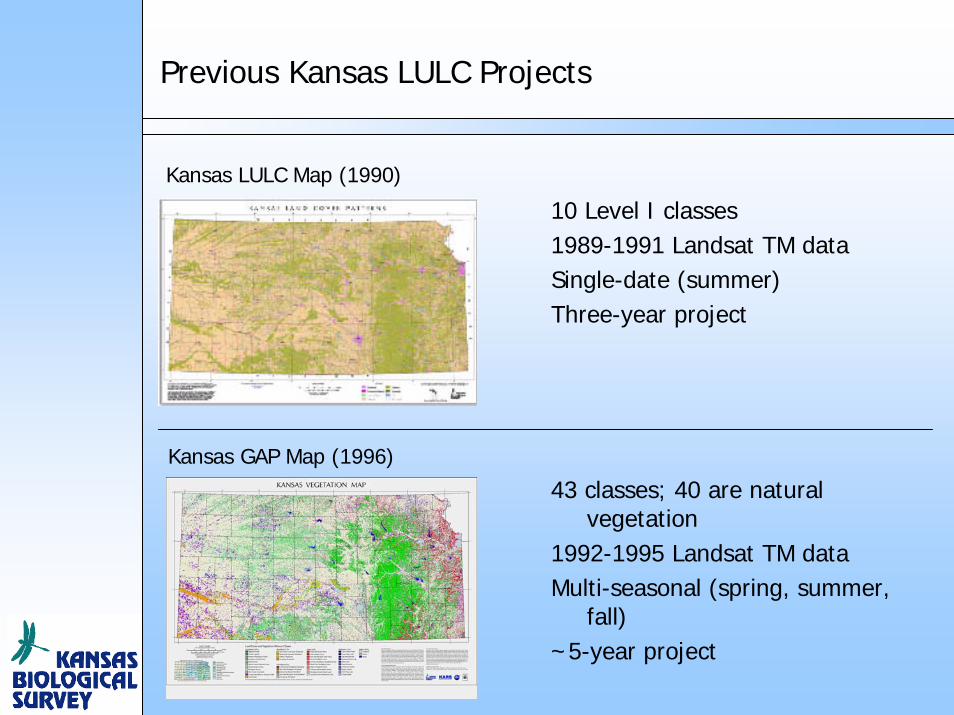
Previous Kansas LULC Projects
10 Level I classes1989-1991 Landsat TM dataSingle-date (summer)Three-year project
43 classes; 40 are natural vegetation
1992-1995 Landsat TM dataMulti-seasonal (spring, summer,
fall)~5-year project
Kansas LULC Map (1990)
Kansas GAP Map (1996)
Summary of LULC products for EPSCoR
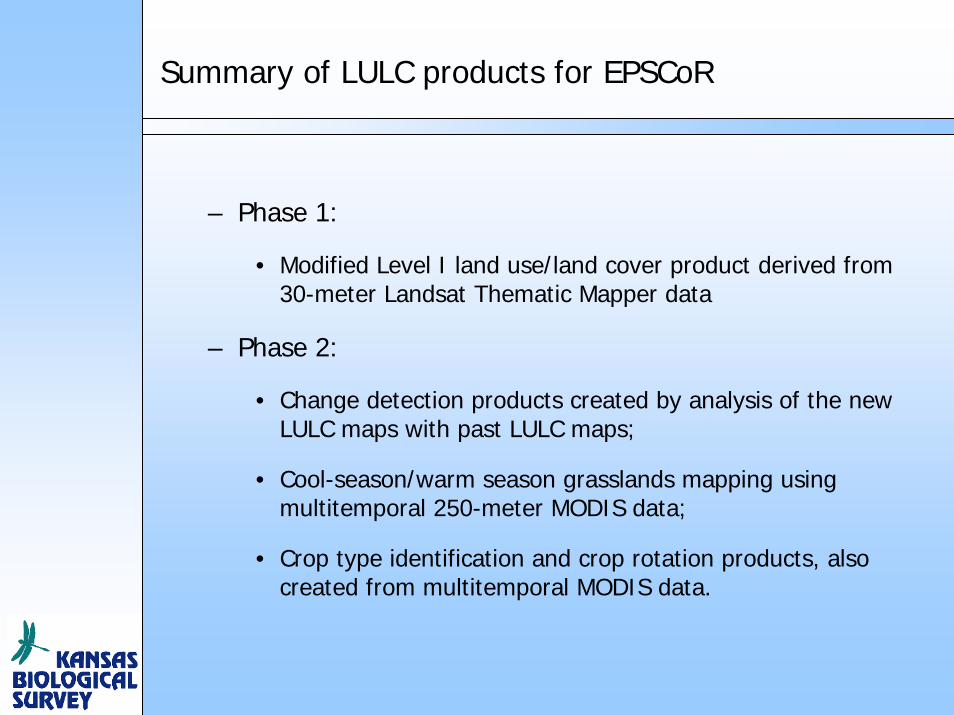
– Phase 1:
• Modified Level I land use/land cover product derived from 30-meter Landsat Thematic Mapper data
– Phase 2:
• Change detection products created by analysis of the new LULC maps with past LULC maps;
• Cool-season/warm season grasslands mapping using multitemporal 250-meter MODIS data;
• Crop type identification and crop rotation products, also created from multitemporal MODIS data.

Level 1 Land Use/Land Cover Map Description
Phase 1: Modified Level I LULC mapping– Multitemporal Landsat TM (30-meter resolution)
• Seasonal data: Spring, summer, & fall
– Maximum separability of classes
• Image dates: 2004-05
– Classes Mapped• Forest, water, cropland, grassland, rural developed, and
urban commercial/industrial, urban residential, urban open, and urban woodland.
– Comparable to 1990 LULC map (classes & MMU)• Allows change detection
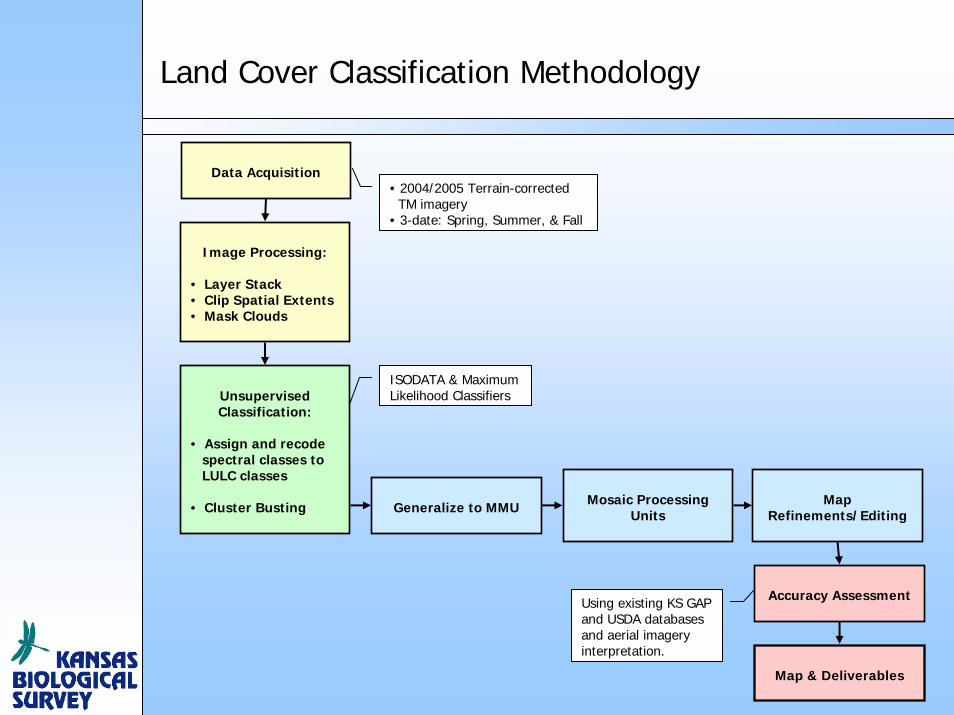
Data Acquisition
Generalize to MMU
Unsupervised Classification:
• Assign and recode spectral classes to LULC classes
• Cluster Busting
Image Processing:
• Layer Stack• Clip Spatial Extents• Mask Clouds
Mosaic Processing Units
Map Refinements/Editing
Accuracy Assessment
• 2004/2005 Terrain-corrected TM imagery
• 3-date: Spring, Summer, & Fall
ISODATA & Maximum Likelihood Classifiers
Using existing KS GAP and USDA databases and aerial imagery interpretation.
Map & Deliverables
Land Cover Classification Methodology
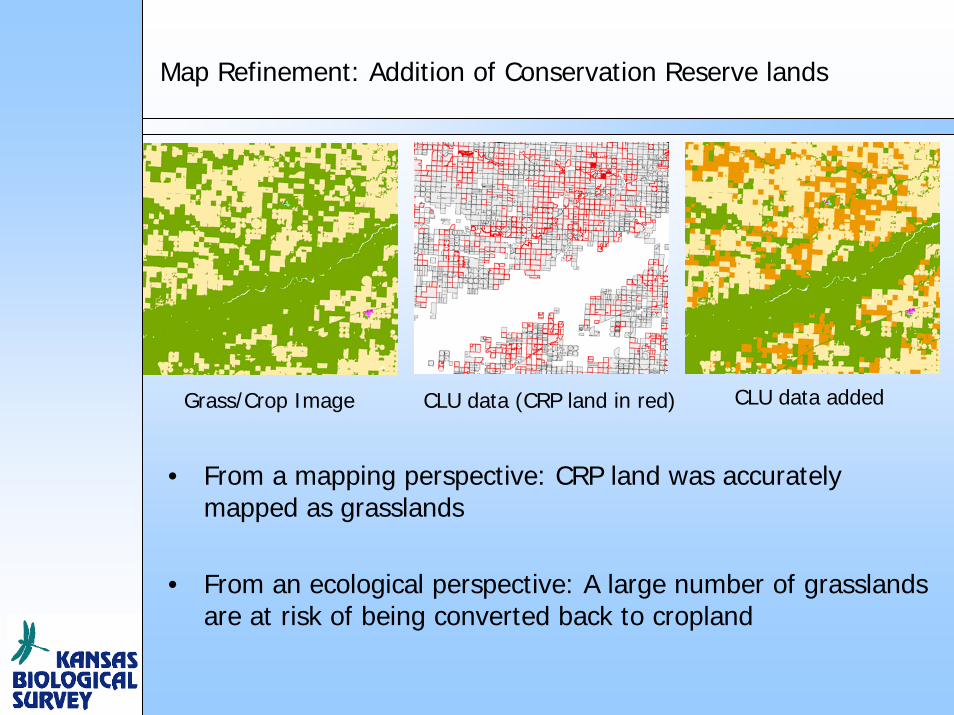
Map Refinement: Addition of Conservation Reserve lands
• From a mapping perspective: CRP land was accurately mapped as grasslands
• From an ecological perspective: A large number of grasslands are at risk of being converted back to cropland
Grass/Crop Image CLU data (CRP land in red) CLU data added
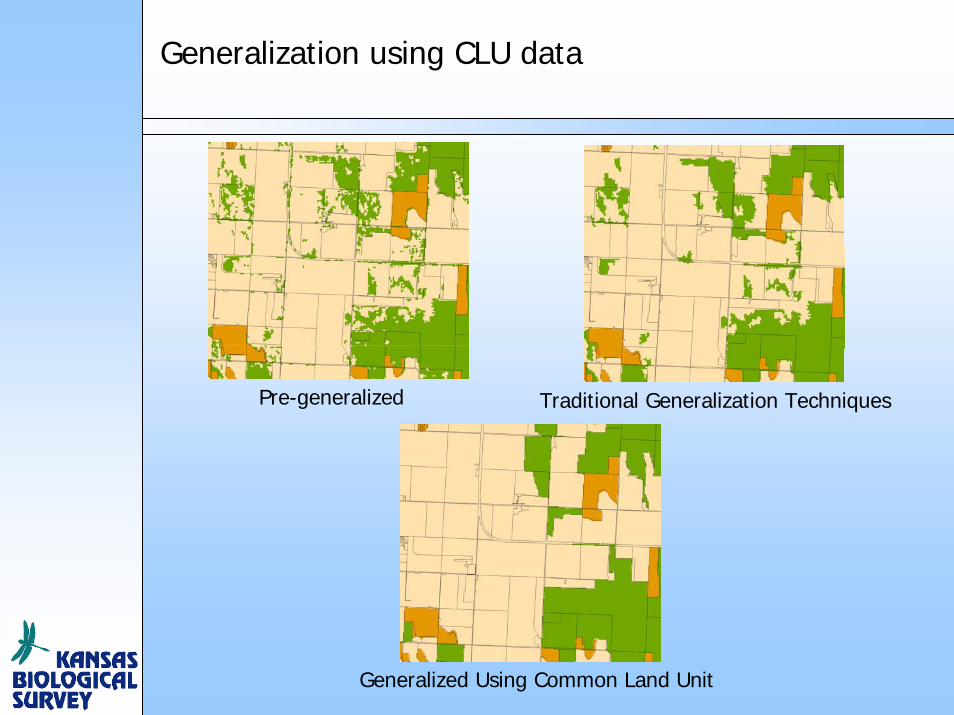
Generalization using CLU data
Pre-generalized Traditional Generalization Techniques
Generalized Using Common Land Unit
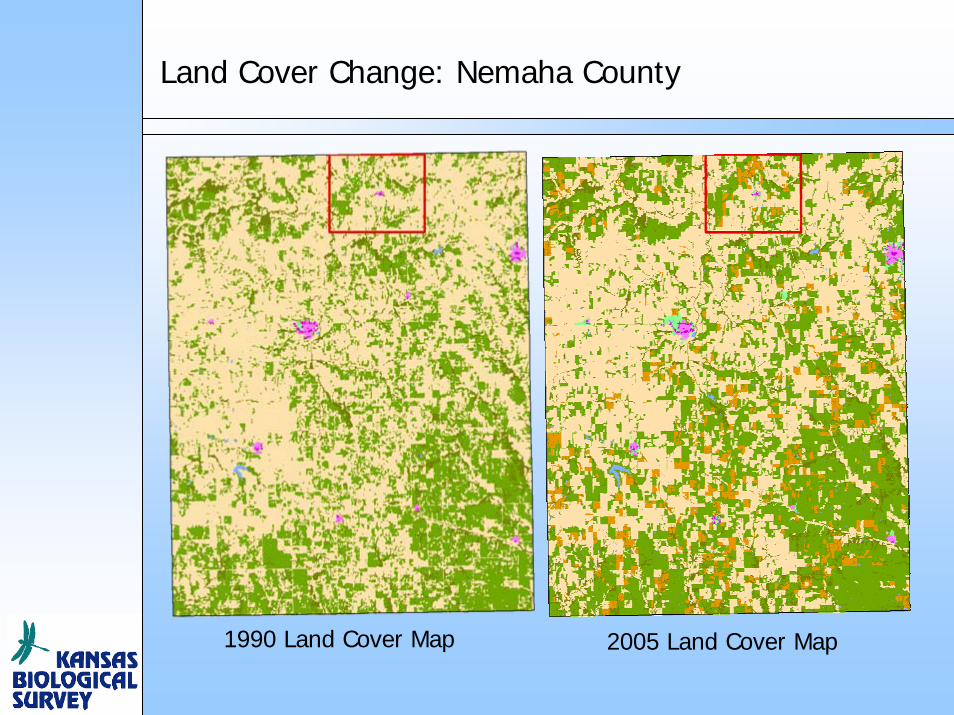
Land Cover Change: Nemaha County
1990 Land Cover Map 2005 Land Cover Map
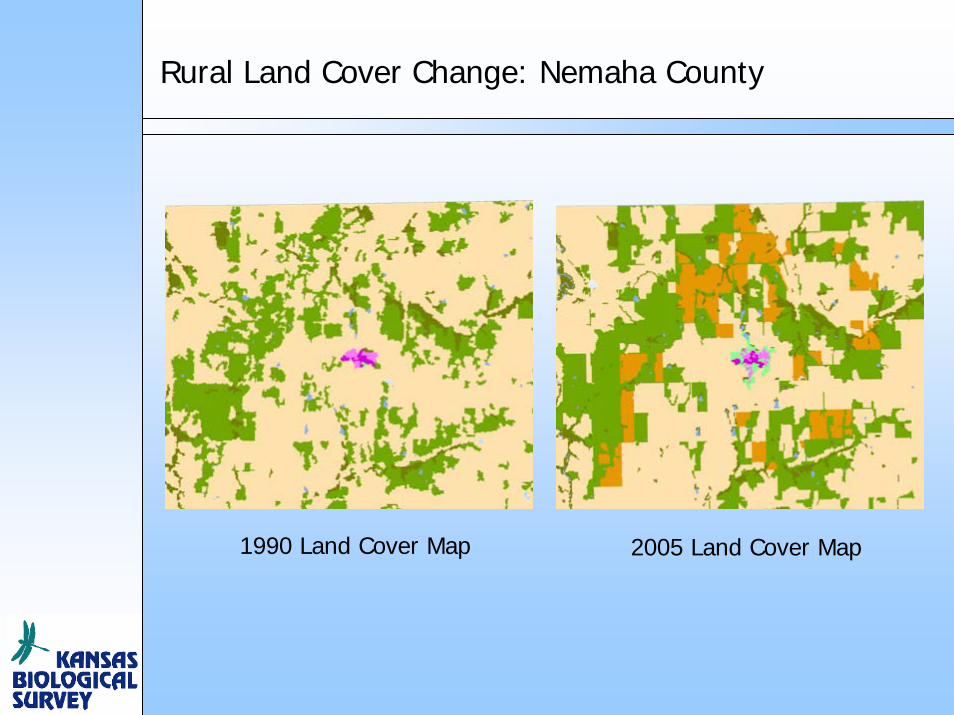
Rural Land Cover Change: Nemaha County
1990 Land Cover Map 2005 Land Cover Map
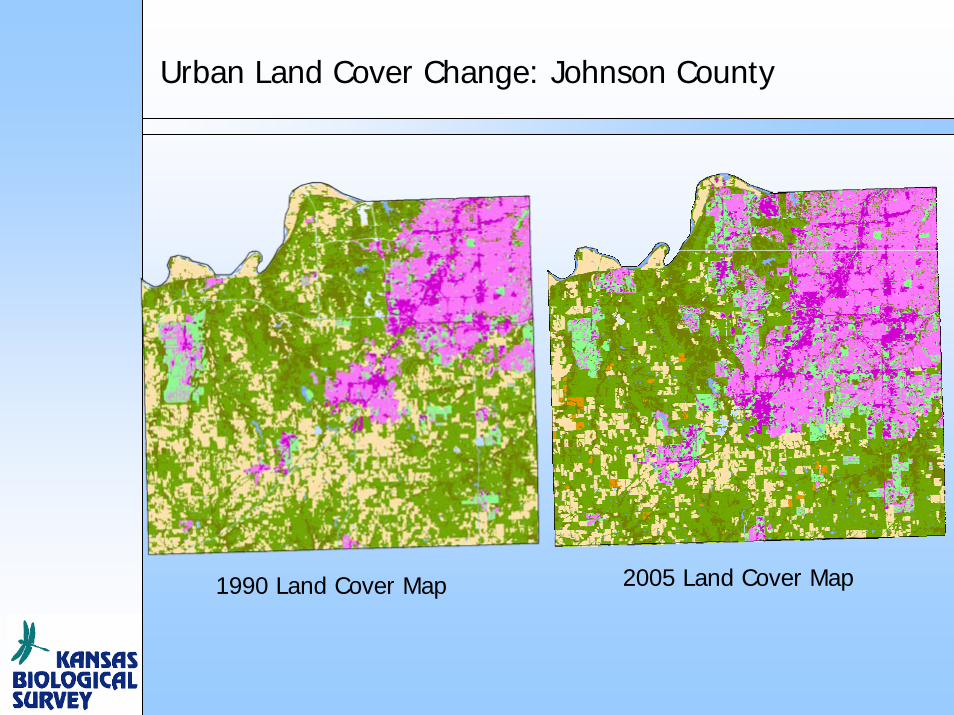
Urban Land Cover Change: Johnson County
1990 Land Cover Map 2005 Land Cover Map
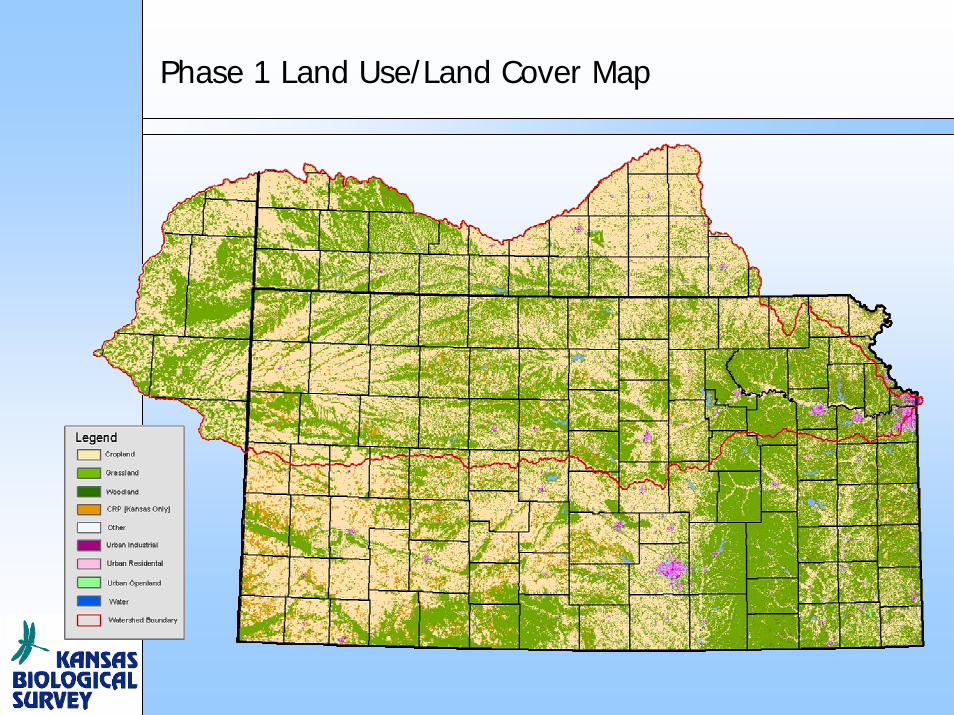
Phase 1 Land Use/Land Cover Map
Accuracy Assessment: In Progress
• Accuracy Levels reported: Overall, User’s, Producer’s, and the KAPPA statistic
• Stratified random sampling design– Sample size proportionate to the area mapped for each
land cover class
• Using existing databases as reference or ground-truth to assess accuracy levels for cropland, grassland, and woodland.– Kansas GAP database– USDA database
• Using aerial imagery (NAIP) interpretation techniques to assess accuracy levels for water and urban.
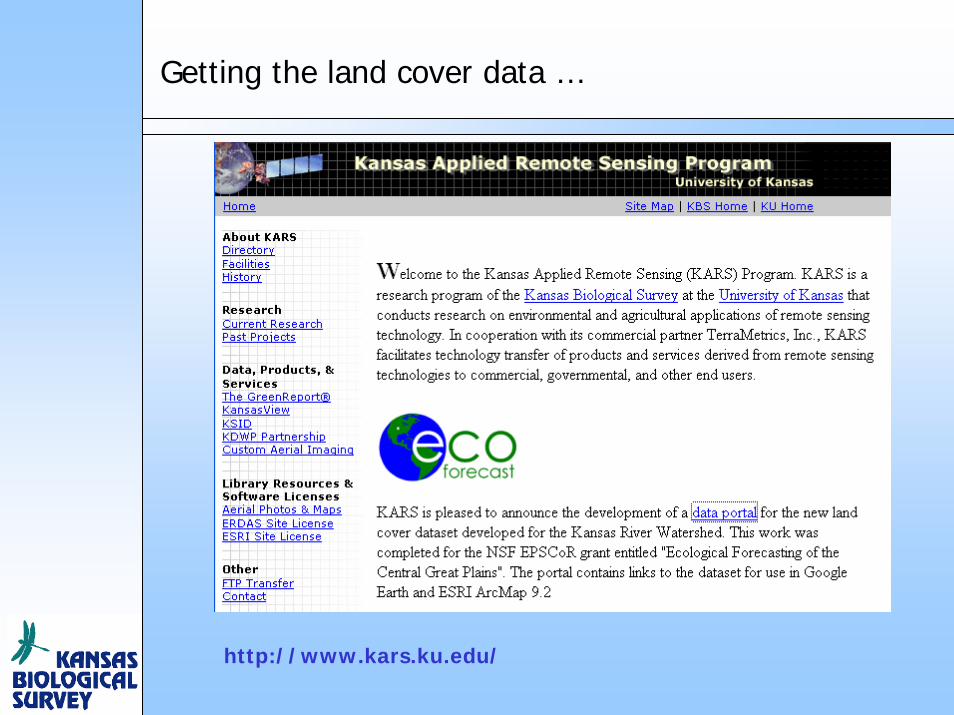
Getting the land cover data …
http://www.kars.ku.edu/
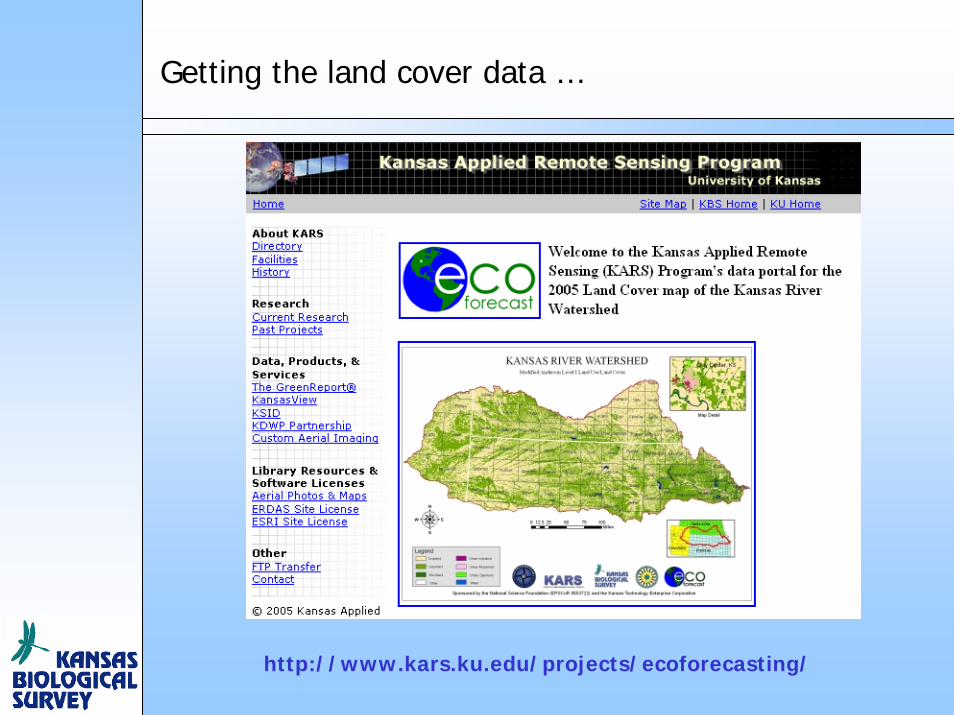
Getting the land cover data …
http://www.kars.ku.edu/projects/ecoforecasting/
Data contents
• Arc GRID files of watershed land cover (actual and buffered boundaries)
• Watershed boundary files: actual and buffered– Raster and vector formats
• County boundaries for watershed area• Ancillary data
– ArcMap .mxd file (Arc 9.2 document)– Arc layer (.lyr) file– Name files for land cover classes (.doc & .xls)
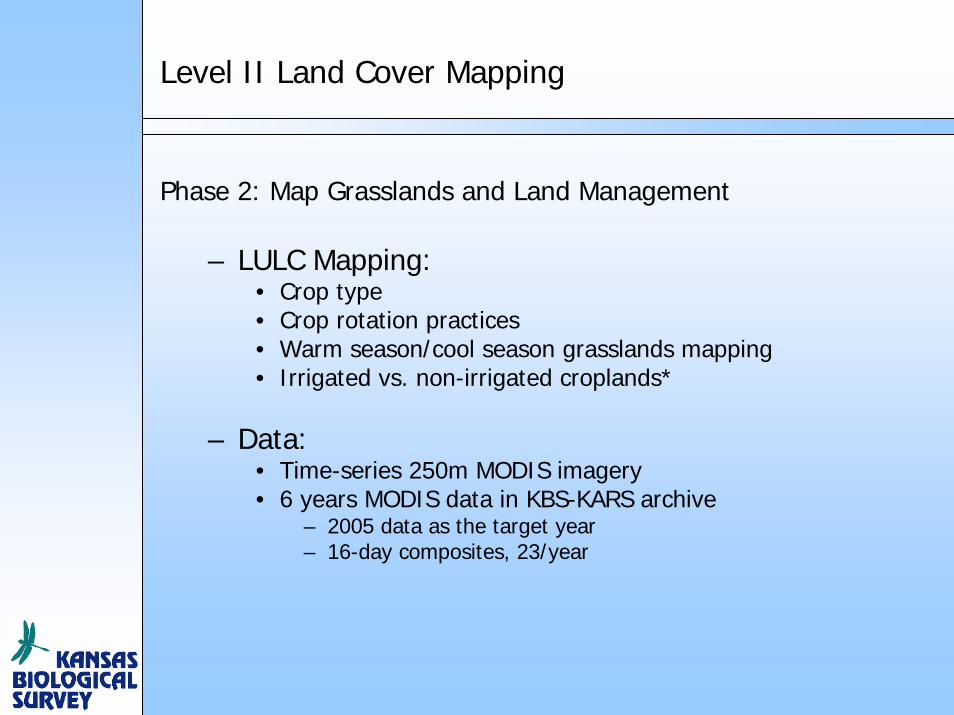
Level II Land Cover Mapping
Phase 2: Map Grasslands and Land Management
– LULC Mapping:• Crop type• Crop rotation practices• Warm season/cool season grasslands mapping• Irrigated vs. non-irrigated croplands*
– Data:• Time-series 250m MODIS imagery• 6 years MODIS data in KBS-KARS archive
– 2005 data as the target year– 16-day composites, 23/year
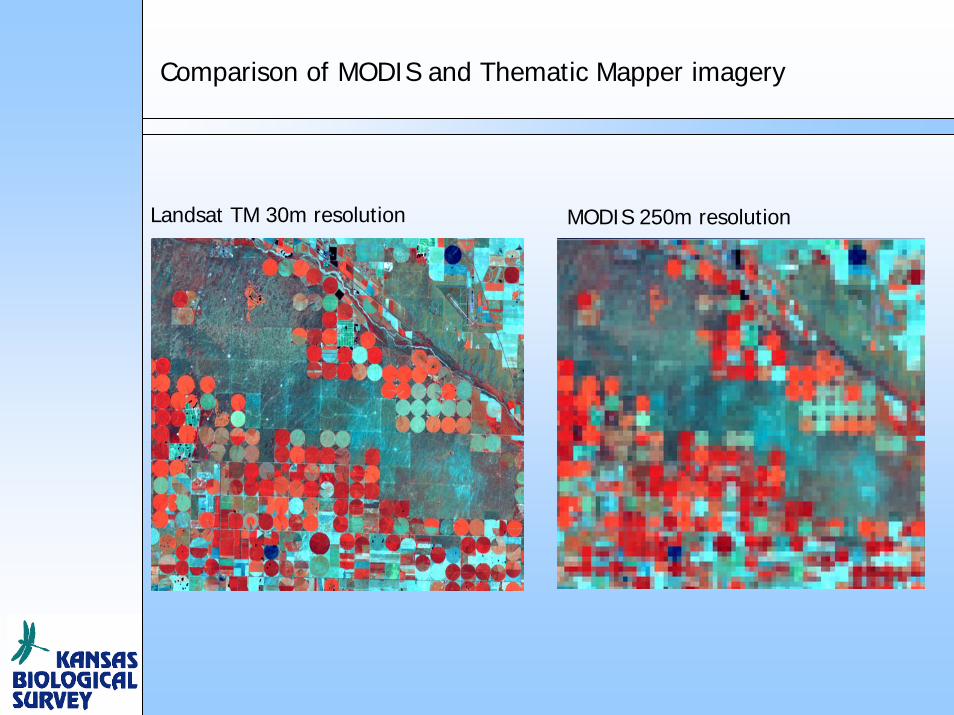
Comparison of MODIS and Thematic Mapper imagery
Landsat TM 30m resolution MODIS 250m resolution
Dense Time-Series Maximum Value Composites
• More is better: multi-date maximum-value image composites.– Select the “best” pixel, i.e., the pixel with the
highest green vegetation response, over a given time period (7, 10, 14, 16 days) – this tends to eliminate pixels contaminated by clouds, noise, etc.
– Create a new image consisting of the maximum values for the given time period.
– Thus, if bi-weekly (14-day) composites are used, you get 26 composite images per year → “dense time series” or “hyper-temporal” imagery.
• How does this look over the course of a year?
0
0.1
0.2
0.3
0.4
0.5
0.6
0.7
0.8
Jan.
1
Jan.
17
Feb.
2
Feb.
18
Mar
ch 6
Mar
ch 2
2
Apr
il 7
Apr
il 23
May
9
May
25
June
10
June
26
July
12
July
28
Aug
ust 1
3
Aug
ust 2
9
Sept
. 14
Sept
. 30
Oct
. 16
Nov
. 1
Nov
. 17
Dec
. 3
Dec
. 19
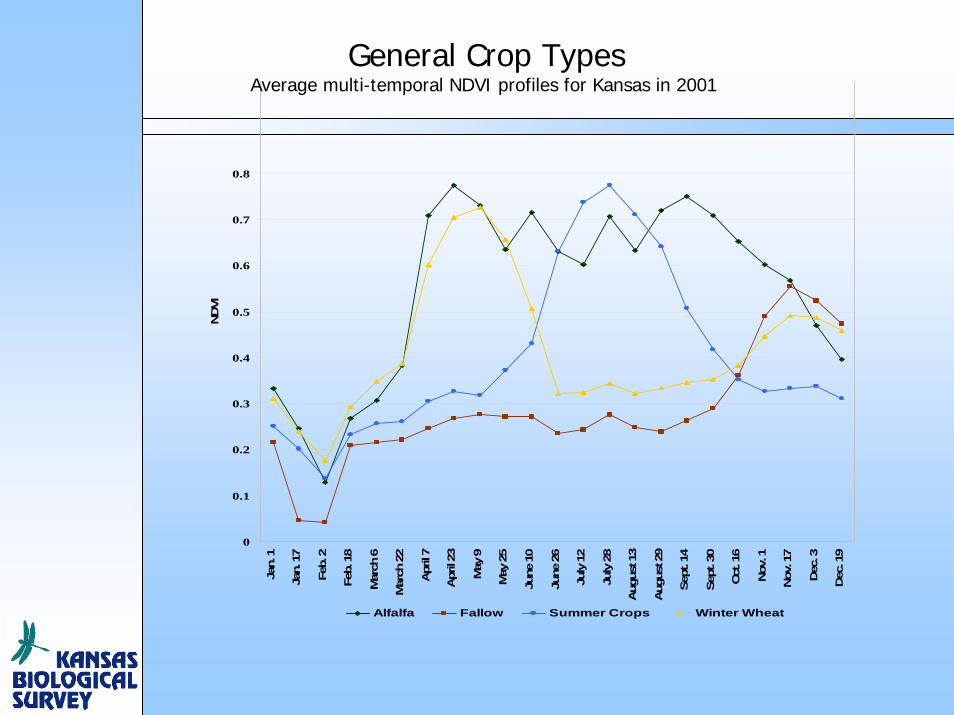
ND
VI
Alfalfa Fallow Summer Crops Winter Wheat
General Crop TypesAverage multi-temporal NDVI profiles for Kansas in 2001
0
0.1
0.2
0.3
0.4
0.5
0.6
0.7
0.8
0.9
Jan.
1
Jan.
17
Feb.
2
Feb.
18
Mar
ch 6
Mar
ch 2
2
Apr
il 7
Apr
il 23
May
9
May
25
June
10
June
26
July
12
July
28
Aug
ust 1
3
Aug
ust 2
9
Sept
. 14
Sept
. 30
Oct
. 16
Nov
. 1
Nov
. 17
Dec
. 3
Dec
. 19
NDVI
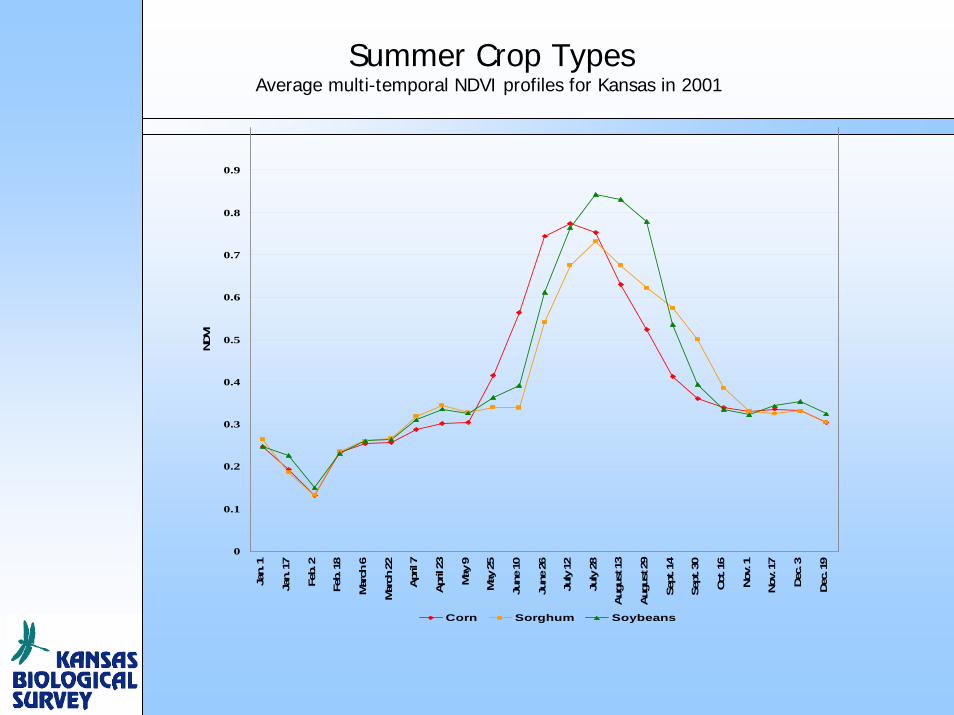
Corn Sorghum Soybeans
Summer Crop TypesAverage multi-temporal NDVI profiles for Kansas in 2001
0
0.1
0.2
0.3
0.4
0.5
0.6
0.7
0.8
0.9
Jan.
1
Jan.
17
Feb.
2
Feb.
18
Mar
ch 6
Mar
ch 2
2
Apr
il 7
Apr
il 23
May
9
May
25
June
10
June
26
July
12
July
28
Aug
ust 1
3
Aug
ust 2
9
Sept
. 14
Sept
. 30
Oct
. 16
Nov
. 1
Nov
. 17
Dec
. 3
Dec
. 19
NDVI
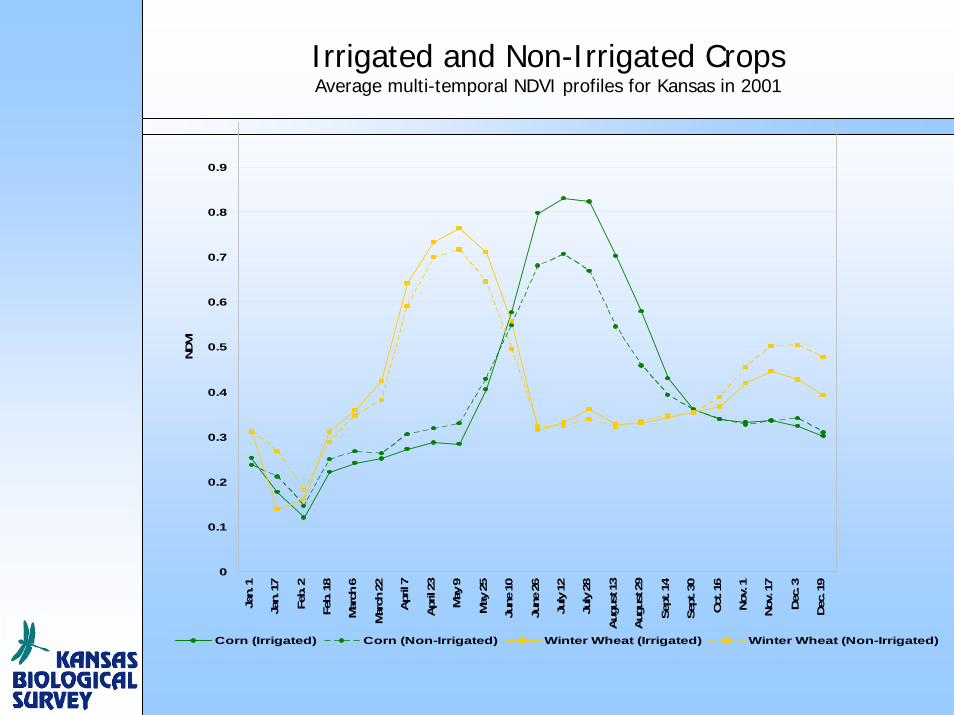
Corn (Irrigated) Corn (Non-Irrigated) Winter Wheat (Irrigated) Winter Wheat (Non-Irrigated)
Irrigated and Non-Irrigated CropsAverage multi-temporal NDVI profiles for Kansas in 2001
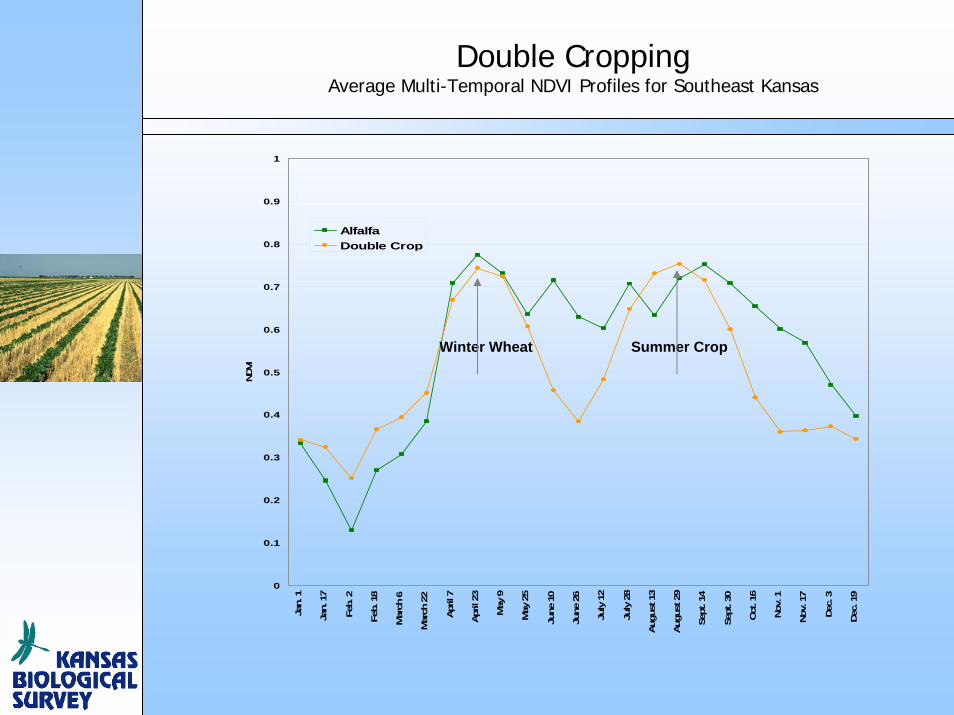
Double CroppingAverage Multi-Temporal NDVI Profiles for Southeast Kansas
0
0.1
0.2
0.3
0.4
0.5
0.6
0.7
0.8
0.9
1
Jan.
1
Jan.
17
Feb.
2
Feb.
18
Mar
ch 6
Mar
ch 2
2
Apr
il 7
Apr
il 23
May
9
May
25
June
10
June
26
July
12
July
28
Aug
ust 1
3
Aug
ust 2
9
Sept
. 14
Sept
. 30
Oct
. 16
Nov
. 1
Nov
. 17
Dec
. 3
Dec
. 19
NDVI
AlfalfaDouble Crop
Winter Wheat Summer Crop
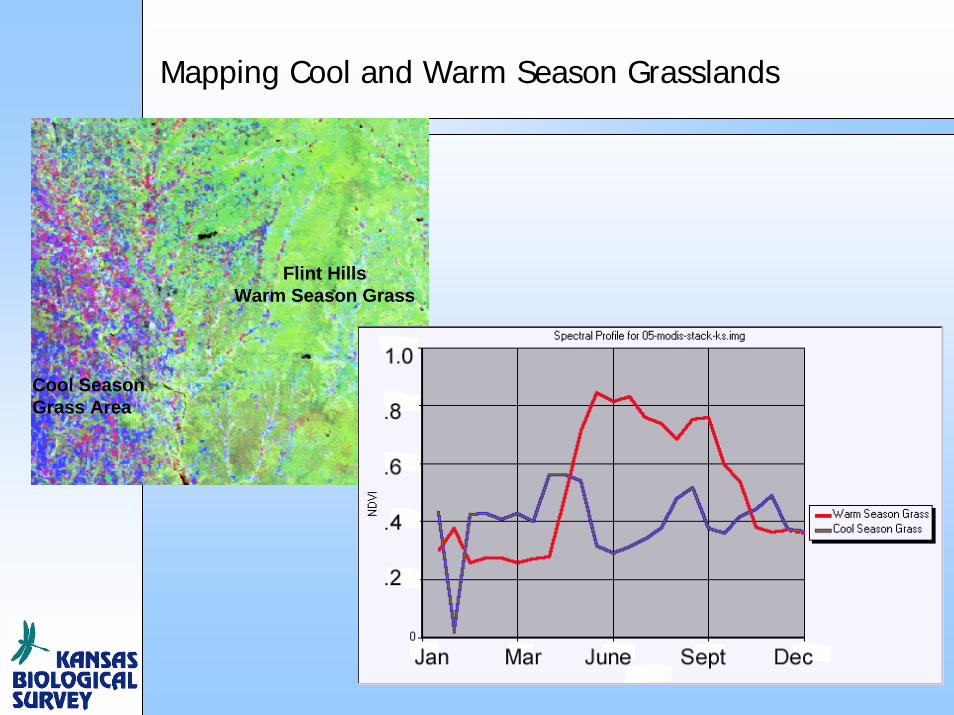
Flint HillsWarm Season Grass
Cool SeasonGrass Area
Mapping Cool and Warm Season Grasslands
Acknowledgments
• Project Personnel– Ed Martinko– Josh Campbell– Kevin Dobbs– Steve Egbert– Mark Jakubauskas– Jude Kastens– John Lomas– Iwake Masialeti– Dana Peterson– Jerry Whistler
• Kansas GIS Policy Board– Funding for Land Cover
Mapping Outside the Kansas River Basin
– 2005 Landsat imagery database
• USGS AmericaView / KansasView Program– Imagery discount and
research support