Kaminsky 2000 (002).pdf
13
Pyrolysis of mixed polyolefins in a fluidised-bed reactor and on a pyro-GC/MS to yield aliphatic waxes M. Predel, W. Kaminsky * Institute of Technical and Macromolecular Chemistry, University of Hamburg, Bundesstrasse 45, D-20146 Hamburg, Germany Received 19 April 2000; accepted 18 May 2000 Abstract Polyolefins (PE, PP and PS) were pyrolysed in a fluidised-bed reactor on kilogram scale at 510 C. Pyrolysis products were ana- lysed with GC, GC/MS and other methods. It was shown that valuable products, mostly aliphatic waxes, are received from poly- olefins. It was also investigated if mixtures of dierent polyolefins (PE, PP, PS) interact with each other in fluidised bed pyrolysis yielding dierent pyrolysis products than received from the pure, individual polyolefins. The same polymer mixtures were also analysed using a pyro-GC/MS-device. # 2000 Elsevier Science Ltd. All rights reserved. Keywords: Pyrolysis; Polyolefins; Polyethylene; Polypropylene; Polystyrene; Fluidised bed reactor; Pyro-GC/MS 1. Introduction In 1997 the total consumption of plastics was 27,281,000 t in the European Union. More than 10 mil- lion t were polyethylenes (HDPE/LDPE/LLDPE) and nearly 6 million t were polypropylene (PP). Polyvinyl chloride (PVC) and polystyrenes (PS/EPS) followed with a consumption of 4.6 million or 2.7 million t respectively. Forty-two per cent of all plastics were used for packaging [1]. A huge amount of plastic waste is collected from ger- man households every year by the DSD (Duales System Deutschland). After sorting out the PVC by specific weight in a water bath a polyolefin mixture remains (polyolefin light fraction). This mixture consists mostly of polyethylene (PE), polypropylene (PP) and poly- styrene (PS). A possible way to recycle these plastics is to pyrolyse them in a fluidised bed reactor (Hamburg Pyrolysis Process). This well established and optimised technical pyrolysis process was developed in the 1970s [2]. At 700 C aromatics and olefinic gases are the main products from polyolefin feedstock [3]. When the flui- dising gas is replaced by steam, olefins are the main products [4,5]. At temperatures of only about 500 C aliphatic waxes are the main products from polyolefin input material. A pyrolysis temperature of 510 C was found to be an optimised temperature for feedstock recycling of mixed polyolefins. The products with a boiling point below 500 C were planned to be used as (co-)feed in a steam- cracker to yield back monomers for polymer produc- tion. The waxes with a boiling range above 500 C were planned to be used in a catalytic cracker (FCC-process) to yield petrochemical products. In previous investiga- tions it remained unclear if the pyrolysis products from mixed plastics pyrolysis in a fluidised bed dier from a simple addition of the decomposition products from the individual plastics [6,7]. The Hamburg pyrolysis process was also applied suc- cessfully to pure polystyrene. More than 60% monomer and 25% of other aromatics were received at a pyrolysis temperature of 515 C [8]. It was reported that the addition of some PS to poly- olefin feedstock (PE, PP) accelerates the pyrolysis and leads to decomposition products with a shorter chain length, e.g. more volatile products. When 20–40 g of a PE/PS mixture were heated in a quartz retort at 48 K min 1 up to 500, 600 or 700 C the formation of low boiling products was favoured. More oil was obtained than expected from addition of both individual polymers [9]. The fixed bed pyrolysis of a mixture (3 g) of PE/PS as well as PP/PS at a heating rate of 25 K min 1 up to 0141-3910/00/$ - see front matter # 2000 Elsevier Science Ltd. All rights reserved. PII: S0141-3910(00)00131-2 Polymer Degradation and Stability 70 (2000) 373–385 www.elsevier.nl/locate/polydegstab * Corresponding author. Tel.: +49-40-428383162; fax: +49-40-42838- 6008. E-mail address: [email protected] (W. Kaminsky).
-
Upload
javiera-aburto-ulloa -
Category
Documents
-
view
236 -
download
1
Transcript of Kaminsky 2000 (002).pdf

Pyrolysis of mixed polyole®ns in a ¯uidised-bed reactor and on apyro-GC/MS to yield aliphatic waxes
M. Predel, W. Kaminsky *
Institute of Technical and Macromolecular Chemistry, University of Hamburg, Bundesstrasse 45, D-20146 Hamburg, Germany
Received 19 April 2000; accepted 18 May 2000
Abstract
Polyole®ns (PE, PP and PS) were pyrolysed in a ¯uidised-bed reactor on kilogram scale at 510�C. Pyrolysis products were ana-lysed with GC, GC/MS and other methods. It was shown that valuable products, mostly aliphatic waxes, are received from poly-ole®ns. It was also investigated if mixtures of di�erent polyole®ns (PE, PP, PS) interact with each other in ¯uidised bed pyrolysis
yielding di�erent pyrolysis products than received from the pure, individual polyole®ns. The same polymer mixtures were alsoanalysed using a pyro-GC/MS-device. # 2000 Elsevier Science Ltd. All rights reserved.
Keywords: Pyrolysis; Polyole®ns; Polyethylene; Polypropylene; Polystyrene; Fluidised bed reactor; Pyro-GC/MS
1. Introduction
In 1997 the total consumption of plastics was27,281,000 t in the European Union. More than 10 mil-lion t were polyethylenes (HDPE/LDPE/LLDPE) andnearly 6 million t were polypropylene (PP). Polyvinylchloride (PVC) and polystyrenes (PS/EPS) followedwith a consumption of 4.6 million or 2.7 million trespectively. Forty-two per cent of all plastics were usedfor packaging [1].A huge amount of plastic waste is collected from ger-
man households every year by the DSD (Duales SystemDeutschland). After sorting out the PVC by speci®cweight in a water bath a polyole®n mixture remains(polyole®n light fraction). This mixture consists mostlyof polyethylene (PE), polypropylene (PP) and poly-styrene (PS). A possible way to recycle these plastics isto pyrolyse them in a ¯uidised bed reactor (HamburgPyrolysis Process). This well established and optimisedtechnical pyrolysis process was developed in the 1970s [2].At 700�C aromatics and ole®nic gases are the main
products from polyole®n feedstock [3]. When the ¯ui-dising gas is replaced by steam, ole®ns are the mainproducts [4,5].
At temperatures of only about 500�C aliphatic waxesare the main products from polyole®n input material. Apyrolysis temperature of 510�C was found to be anoptimised temperature for feedstock recycling of mixedpolyole®ns. The products with a boiling point below500�C were planned to be used as (co-)feed in a steam-cracker to yield back monomers for polymer produc-tion. The waxes with a boiling range above 500�C wereplanned to be used in a catalytic cracker (FCC-process)to yield petrochemical products. In previous investiga-tions it remained unclear if the pyrolysis products frommixed plastics pyrolysis in a ¯uidised bed di�er from asimple addition of the decomposition products from theindividual plastics [6,7].The Hamburg pyrolysis process was also applied suc-
cessfully to pure polystyrene. More than 60% monomerand 25% of other aromatics were received at a pyrolysistemperature of 515�C [8].It was reported that the addition of some PS to poly-
ole®n feedstock (PE, PP) accelerates the pyrolysis andleads to decomposition products with a shorter chainlength, e.g. more volatile products.When 20±40 g of a PE/PS mixture were heated in a
quartz retort at 48 K minÿ1 up to 500, 600 or 700�C theformation of low boiling products was favoured. Moreoil was obtained than expected from addition of bothindividual polymers [9].The ®xed bed pyrolysis of a mixture (3 g) of PE/PS as
well as PP/PS at a heating rate of 25 K minÿ1 up to
0141-3910/00/$ - see front matter # 2000 Elsevier Science Ltd. All rights reserved.
PI I : S0141-3910(00 )00131-2
Polymer Degradation and Stability 70 (2000) 373±385
www.elsevier.nl/locate/polydegstab
* Corresponding author. Tel.: +49-40-428383162; fax: +49-40-42838-
6008.
E-mail address: [email protected] (W. Kaminsky).

700�C resulted in di�erent pyrolysis products thanexpected from the pure polymers, too. The amount ofgases evolved was tripled (PE/PS-mixtures) or doubled(PP/PS-mixture) in comparison to the pure polymers[10,11].Using a cascade of three circulated-spheres-reactors
(330/380/440�C, feed max. 3 kg hÿ1) for stepwise pyro-lysis of mixed, molten plastics, an interaction of PS andPE was discovered. An enhanced amount of ethylben-zene was found in the pyrolysis products of PS. Theformation of ethylbenzene is accompanied by the for-mation of more ole®nic compounds during PE pyro-lysis. This was explained by a hydrogen transfer fromPE to PS. To investigate these interactions furtherexperiments were made under isothermal conditionswith on-line mass spectrometry of blends of PE and PS(30 mg samples). The apparent activation energy for thethermal degradation of PE was found to be decreased inpresence of PS at temperatures from 410 to 480�C. Theproduction of volatile products from PE was acceler-ated, especially during the initial phase of the decom-position. More unsaturated pyrolysis products from PEwere received [12].It was not reported if this accelerating e�ect of mixed
plastics could also be found in ¯uidised bed pyrolysis, inwhich the material to be pyrolysed as well as the degra-dation products are only exposed to cracking tempera-ture for a short time period. The following experimentshave been performed to investigate if this e�ect can alsobe found in ¯uidised bed pyrolysis.
It was also examined how the same samples of mixedpolyole®ns behave in pyrolysis in a Pyro-GC/MS-ana-lyser and if an e�ect on the pyrolysis products by mixingthe polymers can be observed there.
2. Experimental
2.1. Input materials
The polyole®ns used were pellets of about 2±4 mm indiameter. Their labellings were: PE: Ladene high densitypolyethylene, Sabic Marketing Ltd, PP: polypropylene4L609, Shell Chemicals, PS: polystyrene 143 E, Albis-Plastic, Hamburg.
2.2. Pyrolysis plant and experiments
2.2.1. The ¯uidised bed reactorThe pyrolysis experiments were carried out on the
LWS 4 pyrolysis plant at our institute. A general ¯owscheme is shown in Fig. 1.The LWS 4 was designed for a throughput of 1±3
kg hÿ1 of organic material. The reactor consisted of asteel tube (length 1220 mm, 130 mm inner diameter).The gas distributor was a steel plate with 150 tubes(2.5�0.75 mm) which were formed into hooks, thusensuring that no ¯uidising quartz sand (8 kg, 0.3±0.5mm diameter) could fall through the plate. The ¯uidis-ing plate (gas distributor) divided the tube in the gas
Fig. 1. Fluidised bed pyrolysis plant.
374 M. Predel, W. Kaminsky / Polymer Degradation and Stability 70 (2000) 373±385

preheating zone and the ¯uidised bed reactor zone.Above the ¯uidised bed zone another tube (length 500mm, 158 mm inside diameter) was added to reduce thevertical gas velocity inside the reactor. Because onlyvery little carbon black was found on the sand (0.05±0.1wt%) after the experiments, the same sand was used forthe next experiments again.The polymers were mixed in an extruder device (type
Arburg Allrounder 100 UR) connected to the reactor toensure a perfect, homogeneous mixture of the polymermolecules. This way the polymer feed entered the reac-tor at a temperature of about 250�C. The very con-tinuous feed rate enabled constant process conditions.The ¯uidised bed was heated indirectly by electricity.
Before reaching the ¯uidised bed, the ¯uidising gas was
preheated up to 340�C. Prior to the experiments all airwas replaced with inert nitrogen. During the experi-ments it was slowly displaced by pyrolysis gases thenacting as ¯uidising medium. During the whole experi-ment there was a slight pressure above athmosphericpressure so that no oxygen could get into the plant.The product gases left the reactor and passed a com-
bined cooling and separation unit. Carbon black and®ne sand were precipitated in a cyclone. Waxes andliquids were collected in an impact precipitator, coolersand electrostatic precipitators.
Table 1
Process parameters of ¯uidised bed pyrolysis experiments
Experiment #01 #02 #03 #04 #05 #06 #07 #08 #09
Input material % PE ± 100 60 40 90 ± ± 54 100
% PP 100 ± 40 60 ± 100 90 36 ±
% PS ± ± ± ± 10 ± 10 10 ±
Temperature in ¯uidised bed (botton), �C 513�3 512�1 510�2 510�1 512�2 510�3 512 �1 513�1 514�2Temperature in ¯uidised bed (top), �C 516�3 516�1 513�2 516�1 517�2 514�3 514�1 515�1 515�2Freeboard temperature, �C 465�6 447�4 477�3 468�1 445�1 458�2 471�1 470�1 470�1Duration of input, h:min 4:20 5:15 3:45 3:55 3:42 3:48 3:55 3:50 3:52
Troughput of polymer, g/h 826.2 952.4 1066.7 1021.3 973.0 1052.6 1020.4 1043.5 967.7
Gas residence time in the reactor, s 5.6 4.6 4.3 4.1 4.1 4.2 4.0 4.1 3.9
Gas stream (cold, before compressor), m3/h 3.70 4.40 4.80 4.9 4.90 4.85 5.00 4.95 5.10
Product fractions before work-up Gases, g 246.1 127.2 169.5 167.7 72.7 222.0 177.2 103.2 83.6
Oils, g 1054.5 523.4 682.1 708.8 550.3 1224.7 1378.0 892.5 270.2
Waxes, g 2208.3 4331.8 3123.8 3079.5 2959.0 2506.2 2434.8 2939.0 3135.8
Soot, g 9.1 8.5 4.5 7.1 1.3 3.1 3.0 5.6 6.2
Total products, g 3518 4991 3980 3933 3583 3956 3993 3940 3496
Polymer input, g 3500 5000 4000 4000 3600 4000 4000 4000 3500
Loss (ÿ), gain(+), g 18 ÿ9 ÿ20 ÿ37 ÿ17 ÿ44 ÿ7 ÿ60 ÿ4Recovery rate,% 100.5 99.8 99.5 99.1 99.5 98.9 99.8 98.5 99.9
Fig. 2. Part of the gas chromatograms of the light wax fraction Ð
®nding groups to compare.
Table 2
Pyro-GC/MS-experiment parameters
Device Shimadzu QP 5000 GC/MS
and Pyrolyser PYR-4A
Pyrolyser oven temperature 510�CColumn Macherey & Nagel, Optima-1-TG
25 m length, 0.32 mm diameter,
0.1 mm ®lm
Carrier gas Helium 5.0, 60 kPa
Split ratio 1:5
Temperature program 80�C (5 min),
3�C/min±>360�C (30 min)
Input About 50 mgMS-parameters Ionisation method: electron
impact ionisation (EI)
Ionisation voltage: 70 eV
Detector voltage: 1.4 V
Mass range: 30-700 m/z
Scan interval: 1 s
Scanspeed: 1000 amu/sa
a amu: atomar mass unit.
M. Predel, W. Kaminsky / Polymer Degradation and Stability 70 (2000) 373±385 375

The pressure was controlled manually using the com-pressor valves. The compressor pumped the gas, whichwas nearly free of higher hydrocarbons after passing theseparation unit, into the ¯uidised bed again. The excessgas was burned in a ¯are after its volume, pressure andtemperature was measured. Gas samples were taken inregular intervals. Process parameters are shown inTable 1.
2.2.2. Analysis of pyrolysis products:In all experiments gases, yellow oils and solid, yellow-
green waxes, as well as some soot were obtained aspyrolysis products.Pyrolysis gas samples were analysed on di�erent
capillary GC-columns and quanti®ed with TCD- andFID-detectors.
Table 3
Mass balances of experiments at 510�C on PE/PP mixtures (in wt%)
Experiment #02 #09 #03 #04 #01 #06
Input% PE 100 100 60 40 0 0
PP 0 0 40 60 100 100
Hydrogen 0.026 0.022 0.011 0.029 0.015 0.0081
Methane 0.19 0.19 0.33 0.34 0.42 0.34
Ethane 0.34 0.31 0.58 0.67 0.90 0.96
Ethene 0.46 0.44 0.54 0.39 0.31 0.26
Propane 0.44 0.36 0.41 0.45 0.45 0.43
Propene 0.53 0.53 1.8 2.3 3.5 3.8
n-Butane 0.22 0.17 0.12 0.060 0.023 0.021
i-Butane 0.0039 0.0029 0.025 0.064 0.059 0.053
n-Butenes 0.35 0.32 0.26 0.53 0.16 0.10
i-Butene 0.032 0.028 0.42 0.26 1.0 1.0
Butadiene 0.035 0.033 0.037 0.018 0.0081 0.0064
Sum Gases 2.6 2.4 4.5 5.1 6.8 6.9
i-, n-C5 0.65 0.57 1.7 2.3 3.5 3.2
i-, n-C6 1.2 1.2 1.9 2.0 3.0 3.0
i-, n-C7 1.0 1.1 1.0 0.86 1.1 1.1
i-, n-C8 0.67 0.66 0.88 0.77 0.99 0.86
i-, n-C9 0.65 0.70 3.8 5.1 10.0 10.7
==>2,4-Dimethylheptene ± ± 2.6 3.3 7.1 8.9
i-, n-C10 0.84 0.84 1.0 0.91 1.0 1.1
i-, n-C11 0.77 0.82 0.73 0.63 0.63 0.64
i-, n-C12 0.68 0.71 0.94 0.98 1.5 1.6
i-, n-C13 0.63 0.73 0.69 0.71 0.80 0.78
n-C14,15+i-C14,15,16,17 1.5 1.5 2.6 2.6 4.2 4.3
n-C16,17+i-C18,19,20 1.8 1.9 1.7 1.6 1.4 1.4
Sum aliphatics 10.4 10.6 16.8 18.5 28.2 28.6
==>Naphtenes 0.47 0.50 0.65 0.57 0.73 0.72
==>Alkanes 3.0 3.1 3.5 3.9 4.6 4.3
==>Alkenes 6.6 6.8 11.8 13.0 22.0 22.7
==>Dienes 0.78 0.76 1.5 1.6 1.6 1.6
Aromatics 0.0071 0.033 0.018 0.0042 0.021 0.031
Not identi®ed or detected 2.7 3.0 2.6 4.8 8.5 6.8
Sum Oils (bp< 300�C) 13.2 13.7 19.4 23.2 36.7 35.4
Not identi®ed or detected 0.63 0.59 0.73 0.72 1.7 1.1
n-C18,19+i-C21,22,23 2.1 2.5 2.1 2.1 2.2 2.5
n-C20,21+i-C24,25,26 2.3 2.7 2.2 2.0 1.7 1.9
n-C22,23+i-C27,28,29 2.3 2.6 2.2 2.3 2.0 2.0
n-C24,25+i-C30,31,32 2.4 2.8 2.2 2.2 1.9 1.9
n-C26,27+i-C33,34,35 2.5 2.9 2.3 2.2 2.1 2.0
n-C28,29+i-C36,37,38 2.4 2.9 2.3 2.2 2.0 1.8
n-C30,31+i-C39,40,41 2.4 2.9 2.3 2.1 2.0 1.5
n-C32,33+i-C42,43,44 2.4 2.8 2.3 2.2 2.0 1.8
n-C34,35+i-C45,46,47 2.4 2.9 2.3 2.2 2.0 1.8
n-C36,37+i-C48,49,50 2.4 2.9 2.3 2.2 2.0 1.8
Light Waxes (300�C< bp <500�C) 24.0 28.5 23.2 22.4 21.6 20.2
Heavy Waxes (bp > 500C�) 60.0 55.2 52.8 49.1 34.6 37.3
Soot 0.17 0.18 0.11 0.18 0.26 0.078
Total 100.0 100.0 100.0 100.0 100.0 100.0
376 M. Predel, W. Kaminsky / Polymer Degradation and Stability 70 (2000) 373±385

All waxy products received from an experiment werecombined and a homogeneous sample was taken. Thissample was mixed with the oil in the ratio the fractionshad been recovered. This mixture was distilled atreduced pressure to yield an oil fraction, a light waxfraction and a heavy wax fraction.The oils were investigated by GC- and GC/MS-ana-
lysis with a capillary column (Macherey & Nagel, SE 52,50 m, 0.32 mm, 0.5 mm) using internal standardscumene and 1-phenylnaphthalene.The light wax fraction was analysed with a high-
temperature GC-column (Macherey & Nagel, Optima-1-TG, 25 m, 0.32 mm, 0.1 mm) in solution of about 2wt.% in decalin. Every triple of hydrocarbons fromPP with the same carbon number (i-hydrocarbons)enclosed a pair of hydrocarbons from PE-decomposi-tion (n-hydrocarbons). This observation enabled ®nd-ing sensible compound-groups for presenting results(Fig. 2).Samples of the sand in the reactor and the precipitates
from the cyclone were combusted in a furnace at 815�Cto constant weight. The loss in weight was balanced ascarbon-black/soot.All fractions were combined to obtain the total mass
balance. Losses or gains could be attributed to uncer-tainties in the calculation of the gas fraction from thediscontinuous analysis results. Therefore, the di�erenceup to 100% was calculated to the gas fraction.The total mass balances consists of the following
product fractions:
. Gases (up to C4)
. Oils (bp. <300�C, n-C5-17, i-C5-20)
. Light waxes (bp between 300±500�C, n-C18-37 andi-C21-50)
. Heavy waxes (bp > 500�C, >n-C37 and >i-C50)
. Soot, carbon black
2.2.3. The pyro-GC/MS-analyserThe pyro-GC/MS-technique is a fast method to per-
form pyrolysis experiments. The machine used was apyrolyser-device type PYR-4A combined with a QP-5000 GC/MS made by Shimadzu.The polymer sample (about 40 mg) was placed into a
tiny bucket of inert platinum, which was dropped intoan infrared laser heated oven. The pyrolysis productspassed a split of the GC, were separated on the GC-column and ®nally identi®ed and quanti®ed by MS.Process parameters are shown in Table 2.As it is di�cult to mix such tiny amounts of polyole®ns,
the samples had been prepared using the extruder thatwas also used as feeder/mixer in the ¯uidised bed pyro-lysis experiments. From these samples small ®lms werepressed that were ®nally analysed in the pyro-GC/MS.Due to the wide range of pyrolysis products the gases
and oils could not be separated and thus were detectedtogether. Therefore, gases and oils are balanced in only oneproduct fraction.The pyrolysis products were directly analysed and
their quantity was given in TIC% (total ion current),which must not be compared to wt.% (weight%).
3. Results and discussion
3.1. Experiments in the ¯uidised bed reactor
3.1.1. Experiments on PE/PP-mixturesThe mass balances are shown in Table 3. Two experi-
ments (#01, #06 and #02, #09) have been completelyrepeated in order to check reproducibility.Gas and oil production of pure PE-feed is only about
one third of that evolved by PP-feed. It is remarkablethat the trimer of propene (2,4-dimethylheptene) isformed in very high amounts from PP (one quarter of
Fig. 3. Product fractions of PE/PP-pyrolysis in the ¯uidised bed reactor.
M. Predel, W. Kaminsky / Polymer Degradation and Stability 70 (2000) 373±385 377

Table 4
Mass balances of experiments at 510�C on PE/PS mixtures (in wt%)
Experiment #02 #09 #05a #05
Input% PE 100 100 100* 90
PS 0 0 0 10
Hydrogen 0.026 0.022 0.027 0.025
Methane 0.19 0.19 0.22 0.20
Ethane 0.34 0.31 0.37 0.33
Ethene 0.46 0.44 0.54 0.49
Propane 0.44 0.36 0.40 0.36
Propene 0.53 0.53 0.65 0.59
n-Butane 0.22 0.17 0.21 0.19
i-Butane 0.0039 0.0029 0.0027 0.0024
n-Butenes 0.35 0.32 0.41 0.37
i-Butene 0.032 0.028 0.046 0.042
Butadiene 0.035 0.033 0.039 0.035
Sum Gases 2.6 2.4 2.9 2.6
n-C5 0.65 0.57 0.81 0.73
n-C6 1.2 1.2 1.4 1.3
n-C7 1.0 1.1 1.2 1.1
n-C7 0.67 0.66 0.80 0.72
n-C9 0.65 0.70 0.84 0.76
n-C10 0.84 0.84 0.95 0.86
n-C11 0.77 0.82 0.91 0.82
n-C12 0.68 0.71 0.81 0.73
n-C13 0.63 0.73 0.81 0.73
n-C14 0.70 0.77 0.87 0.78
n-C15 0.80 0.73 1.0 0.91
n-C16 0.86 0.90 1.3 1.2
n-C17 0.92 0.97 1.4 1.3
Sum Aliphatics 10.4 10.6 13.2 11.9
==>Naphtenes 0.47 0.50 0.65 0.58
==>Alkanes 3.0 3.1 3.9 3.5
==>Alkenes 6.6 6.8 8.3 7.5
==>Dienes 0.78 0.76 1.0 0.90
Benzene 0.0071 0.0093 ± 0.017
Toluene ± 0.024 ± 1.1
Styrene ± ± ± 5.2
Ethylbenzene ± ± ± 0.36
a-Methylstyrene ± ± ± 0.34
Other Aromatics ± ± ± 0.47
Sum Aromatics 0.0071 0.033 ± 7.5
Not identi®ed or detected 2.7 3.0 ± 2.4
Sum Oils (bp<300�C) 13.2 13.7 13.2 21.8
Not identi®ed or detected 0.63 0.59 0.47 0.43
n-C18,19 2.1 2.5 3.1 2.8
n-C20,21 2.3 2.7 3.2 2.9
n-C22,23 2.3 2.6 3.4 3.1
n-C24,25 2.4 2.8 3.3 3.0
n-C26,27 2.5 2.9 3.4 3.0
n-C28,29 2.4 2.9 3.3 3.0
n-C30,31 2.4 2.9 3.3 3.0
n-C32,33 2.4 2.8 3.3 3.0
n-C34,35 2.4 2.9 3.3 3.0
n-C36,37 2.4 2.9 3.3 3.0
Light Waxes (300�C<bp<500�C) 24.0 28.5 33.6 30.2
Heavy Waxes (bp>500C�) 60.0 55.2 50.4 45.3
Soot 0.17 0.18 0.041 0.037
Total 100.0 100.0 100.0 100.0
a 05*: Results from experiment #05 without PS-pyrolysis products.
378 M. Predel, W. Kaminsky / Polymer Degradation and Stability 70 (2000) 373±385

the oil, 7±9 wt.% total). Branched aliphatic compoundslike that are known to have very high octane numbers[13]. In the oil fraction of the PE-experiments the ratioalkane/alkene/diene is 1 : 2.2 : 0.25. PP-polymer givesmuch more unsaturated products. The ratio is 1:5:0.37.The amount of light waxes decreases slightly when
changing from PE to PP. The amount of heavy waxes isnearly cut down to half.The amount of the di�erent fractions is shown vs.
ratio of both polymers (Fig. 3). Lines are received whichindicate that there is no interaction between the twopolymers PE and PP in ¯uidised bed pyrolysis.
3.1.2. Experiments on PE/PS-mixturesThe mass balances are shown in Table 4. The ®gures
in column #05* were not received experimentally butcalculated from experiment #05 by leaving all PS-pyro-lysis products out.So the experiments #02 and #09 show experiments on
pure PE and the column #05* shows PE-pyrolysis pro-ducts in¯uenced by the presence of PS.A slight shift in the product distribution from the
heavy waxes to the light wax fraction might be assumed,but taking in account the accuracy from the experimentperformed twice, it cannot be proved that there is anymixing e�ect by PS on the PE-pyrolysis products.The ratio alkane/alkene/diene of pyrolysis products
from PE-pyrolysis does not change in the presence ofPS. The peak distribution of the light wax fraction doesnot di�er, whether there was PS present or not (GCsshown in Fig. 4).
3.1.3. Experiments on PP/PS-mixturesTwo pyrolysis experiments on pure PP are compared
to an experiment with a PP/PS-mixture (Table 5). In thecolumn of experiment #07* all pyrolysis productsresulting from PS of experiment #07 are neglected,according to the procedure in column #05*. A smalldi�erence in the amount of pyrolysis products can beobserved, but again it is in the range of inaccuracy ofthe repeated experiment. So an e�ect of PS on PP-pyrolysis cannot be proved with certainty.The ratio alkane/alkene/diene in the oil fraction does
not di�er signi®cantly in the presence of PS. But whencomparing the gas-chromatograms of the distilled lightwax fraction a hint for an interaction was discovered.The peak distribution of the PP-waxes received fromPP/PS-pyrolysis is much simpler than that received frompure PP-pyrolysis. The GCs of the light wax fractionsfrom pure PP and PP with 10% PS are shown in Fig.5(a) and (b). When comparing the intensities of thecompounds in one oligomer-group (especially at > i-C30), it was discovered that the formation of dienes(especially the last isomer) is strongly enhanced whenPS was present during pyrolysis.
3.1.4. Experiments on PE/PP/PS-mixturesFinally a mixture of PE/PP is compared to a mixture
of PE/PP/PS (Table 6).Again the column in the middle (#08*) shows the
pyrolysis products, neglecting PS-decomposition productsfrom experiment #08. Products received from a mixturewith PS are very much the same as without, apart from
Fig. 4. Gas-chromatograms of light wax fractions from PE/PS-experiments (¯uidised bed).
M. Predel, W. Kaminsky / Polymer Degradation and Stability 70 (2000) 373±385 379

Table 5
Mass balances of experiments at 510�C on PP/PS mixtures (in wt%)
Experiment #01 #06 #07a #07
Input% PP 100 100 100* 90
PS 10
Hydrogen 0.015 0.0081 0.0038 0.0034
Methane 0.42 0.34 0.31 0.28
Ethane 0.90 0.96 0.77 0.69
Ethene 0.31 0.26 0.25 0.23
Propane 0.45 0.43 0.31 0.28
Propene 3.5 3.8 3.1 2.8
n-Butane 0.023 0.021 0.019 0.017
i-Butane 0.059 0.053 0.044 0.040
n-Butenes 0.16 0.10 0.11 0.10
i-Butene 1.0 0.99 0.88 0.79
Butadiene 0.0081 0.0064 0.0059 0.0053
Sum Gases 6.8 6.9 5.8 5.2
i-C5 3.5 3.2 3.1 2.8
i-C6 3.0 3.0 2.8 2.5
i-C7 1.1 1.1 1.0 0.92
i-C8 0.99 0.86 0.86 0.77
i-C9 10.0 10.7 10.5 9.4
==>2,4-Dimethylheptene 7.1 8.9 9.3 8.4
i-C10 1.0 1.1 1.0 0.90
i-C11 0.63 0.64 0.61 0.55
i-C12 1.5 1.6 1.5 1.3
i-C13 0.80 0.78 0.81 0.73
i-C14 0.18 0.19 0.20 0.18
i-C15,16,17 4.0 4.1 4.1 3.7
i-C18,19,20 1.4 1.4 1.5 1.4
Sum Aliphatics 28.2 28.6 28.1 25.3
==>Naphtenes 0.73 0.72 0.60 0.54
==>Alkanes 4.6 4.3 4.1 3.7
==> Alkenes 22.0 22.7 22.4 20.2
==>Dienes 1.6 1.6 1.6 1.4
Benzene ± ± ± 0.0074
Toluene ± ± ± 0.38
Styrene ± ± ± 7.1
Ethylbenzene ± ± ± 0.11
a-Methylstyrene ± ± ± 0.29
Other Aromatics 0.021 0.031 ± 0.41
Sum Aromatics 0.021 0.031 ± 8.3
Not identi®ed or detected 8.5 6.8 3.8 5.1
Sum Oils (bp<300�C) 36.7 35.4 31.8 38.7
Not identi®ed or detected 1.7 1.1 1.3 1.1
i-C21,22,23 2.2 2.5 2.7 2.4
i-C24,25,26 1.7 1.9 1.9 1.7
i-C27,28,29 2.0 2.0 2.0 1.8
i-C30,31,32 1.9 1.9 2.3 2.1
i-C33,34,35 2.1 2.0 1.9 1.7
i-C36,37,38 2.0 1.8 1.8 1.7
i-C39,40,41 2.0 1.5 1.9 1.7
i-C42,43,44 2.0 1.8 2.0 1.8
i-C45,46,47 2.0 1.8 2.0 1.8
i-C48,49,50 2.0 1.8 2.0 1.8
Light Waxes (300�C<bp<500�C) 21.6 20.2 21.8 19.6
Heavy Waxes (bp>500C�) 34.6 37.3 40.5 36.4
Soot 0.26 0.078 0.084 0.075
Total 100.0 100.0 100.0 100.0
a 07*: results from experiment #07 without PS-pyrolysis products.
380 M. Predel, W. Kaminsky / Polymer Degradation and Stability 70 (2000) 373±385

additional polystyrene degradation products, leading tothe conclusion that the additional PS does not changeproduct spectra of PE/PP-mixtures.
3.2. Experiments on the Pyro-GC/MS-device
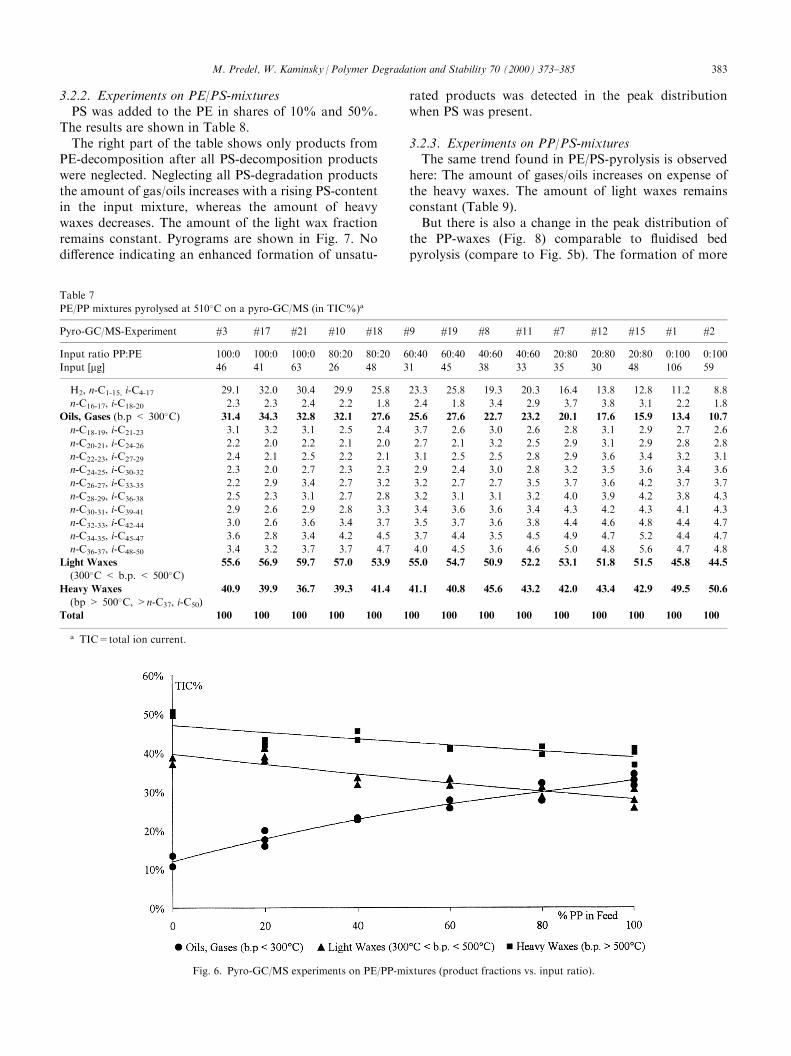
3.2.1. Experiments on PE/PP-mixturesThe experiments have been done with di�erent ratios
of PE and PP. Experiments were repeated to check
reproducibility. The results are shown in Table 7 andFig. 6.By comparing the amounts of the product fractions
no product-changing interaction between PE and PPwas found. The graphically displayed results show thesame trends observed in the ¯uidised bed pyrolysis (ref.Fig. 3), although the results from Pyro-GC/MS aregiven in TIC% (total ion current). PP-pyrolysis yieldsmore gases and oils compared to PE-decomposition.
Fig. 5. (a) Gas-chromatograms of light wax fractions from PP/PS-experiments (¯uidised bed); (b) GCs of light wax fractions from PP/PS-experi-
ments (¯uidised bed) Ð ®ne structure.
M. Predel, W. Kaminsky / Polymer Degradation and Stability 70 (2000) 373±385 381

Table 6
Mass balances of experiments at 510�C on PE/PP/PS mixtures (in wt%)
Experiment #03 #08a #08
Input% PE 60 60* 54
PP 40 40* 36
PS 10
Hydrogen 0.011 0.012 0.011
Methane 0.33 0.32 0.29
Ethane 0.58 0.59 0.53
Ethene 0.54 0.50 0.45
Propane 0.41 0.46 0.41
Propene 1.8 1.8 1.7
n-Butane 0.12 0.13 0.11
i-Butane 0.025 0.027 0.024
n-Butenes 0.26 0.26 0.23
i-Butene 0.42 0.38 0.34
Butadiene 0.037 0.028 0.025
Sum Gases 4.5 4.5 4.1
i-, n-C5 1.7 1.7 1.5
i-, n-C6 1.9 1.8 1.6
i-, n-C7 1.0 0.91 0.82
i-, n-C8 0.88 0.75 0.67
i-, n-C9 3.8 4.0 3.6
==>2,4-Dimethylheptene 2.6 2.7 2.4
i-, n-C10 1.0 0.94 0.85
i-, n-C11 0.73 0.65 0.59
i-, n-C12 0.94 1.0 0.90
i-, n-C13 0.69 0.69 0.62
n-C14,15+i-C14,15,16,17 2.6 2.5 2.3
n-C16,17+i-C18,19,20 1.7 1.8 1.6
Sum Aliphatics 16.8 16.7 15.1
==>Naphtenes 0.65 0.54 0.49
==>Alkanes 3.5 3.7 3.3
==>Alkenes 11.8 11.6 10.5
==>Dienes 1.5 1.4 1.2
Benzene 0.012 ± 0.014
Toluene ± ± 0.50
Styrene ± ± 6.3
Ethylbenzene ± ± 0.15
a-Methylstyrene ± ± 0.29
other aromatics 0.0065 ± 0.47
Sum Aromatics 0.018 ± 7.7
Not identi®ed or detected 2.6 1.5 3.6
Sum Oils (bp< 300�C) 19.4 18.3 26.4
Not identi®ed or detected 0.73 1.1 0.96
n-C18,19+i-C21,22,23 2.1 2.4 2.2
n-C20,21+i-C24,25,26 2.2 2.3 2.0
n-C22,23+i-C27,28,29 2.2 2.3 2.1
n-C24,25+i-C30,31,32 2.2 2.4 2.1
n-C26,27+i-C33,34,35 2.3 2.4 2.1
n-C28,29+i-C36,37,38 2.3 2.3 2.1
n-C30,31+i-C39,40,41 2.3 2.3 2.1
n-C32,33+i-C42,43,44 2.3 2.3 2.1
n-C34,35+i-C45,46,47 2.3 2.3 2.1
n-C36,37+i-C48,49,50 2.3 2.3 2.1
Light Waxes (300�C< bp <500�C) 23.2 24.4 22.0
Heavy Waxes (bp > 500�C) 52.8 52.7 47.4
Soot 0.11 0.16 0.14
Total 100.0 100.0 100.0
a 08*: results from experiment #08 without PS-pyrolysis products.
382 M. Predel, W. Kaminsky / Polymer Degradation and Stability 70 (2000) 373±385
3.2.2. Experiments on PE/PS-mixturesPS was added to the PE in shares of 10% and 50%.
The results are shown in Table 8.The right part of the table shows only products from
PE-decomposition after all PS-decomposition productswere neglected. Neglecting all PS-degradation productsthe amount of gas/oils increases with a rising PS-contentin the input mixture, whereas the amount of heavywaxes decreases. The amount of the light wax fractionremains constant. Pyrograms are shown in Fig. 7. Nodi�erence indicating an enhanced formation of unsatu-
rated products was detected in the peak distributionwhen PS was present.
3.2.3. Experiments on PP/PS-mixturesThe same trend found in PE/PS-pyrolysis is observed
here: The amount of gases/oils increases on expense ofthe heavy waxes. The amount of light waxes remainsconstant (Table 9).But there is also a change in the peak distribution of
the PP-waxes (Fig. 8) comparable to ¯uidised bedpyrolysis (compare to Fig. 5b). The formation of more
Table 7
PE/PP mixtures pyrolysed at 510�C on a pyro-GC/MS (in TIC%)a
Pyro-GC/MS-Experiment #3 #17 #21 #10 #18 #9 #19 #8 #11 #7 #12 #15 #1 #2
Input ratio PP:PE 100:0 100:0 100:0 80:20 80:20 60:40 60:40 40:60 40:60 20:80 20:80 20:80 0:100 0:100
Input [mg] 46 41 63 26 48 31 45 38 33 35 30 48 106 59
H2, n-C1-15, i-C4-17 29.1 32.0 30.4 29.9 25.8 23.3 25.8 19.3 20.3 16.4 13.8 12.8 11.2 8.8
n-C16-17, i-C18-20 2.3 2.3 2.4 2.2 1.8 2.4 1.8 3.4 2.9 3.7 3.8 3.1 2.2 1.8
Oils, Gases (b.p < 300�C) 31.4 34.3 32.8 32.1 27.6 25.6 27.6 22.7 23.2 20.1 17.6 15.9 13.4 10.7
n-C18-19, i-C21-23 3.1 3.2 3.1 2.5 2.4 3.7 2.6 3.0 2.6 2.8 3.1 2.9 2.7 2.6
n-C20-21, i-C24-26 2.2 2.0 2.2 2.1 2.0 2.7 2.1 3.2 2.5 2.9 3.1 2.9 2.8 2.8
n-C22-23, i-C27-29 2.4 2.1 2.5 2.2 2.1 3.1 2.5 2.5 2.8 2.9 3.6 3.4 3.2 3.1
n-C24-25, i-C30-32 2.3 2.0 2.7 2.3 2.3 2.9 2.4 3.0 2.8 3.2 3.5 3.6 3.4 3.6
n-C26-27, i-C33-35 2.2 2.9 3.4 2.7 3.2 3.2 2.7 2.7 3.5 3.7 3.6 4.2 3.7 3.7
n-C28-29, i-C36-38 2.5 2.3 3.1 2.7 2.8 3.2 3.1 3.1 3.2 4.0 3.9 4.2 3.8 4.3
n-C30-31, i-C39-41 2.9 2.6 2.9 2.8 3.3 3.4 3.6 3.6 3.4 4.3 4.2 4.3 4.1 4.3
n-C32-33, i-C42-44 3.0 2.6 3.6 3.4 3.7 3.5 3.7 3.6 3.8 4.4 4.6 4.8 4.4 4.7
n-C34-35, i-C45-47 3.6 2.8 3.4 4.2 4.5 3.7 4.4 3.5 4.5 4.9 4.7 5.2 4.4 4.7
n-C36-37, i-C48-50 3.4 3.2 3.7 3.7 4.7 4.0 4.5 3.6 4.6 5.0 4.8 5.6 4.7 4.8
Light Waxes
(300�C < b.p. < 500�C)55.6 56.9 59.7 57.0 53.9 55.0 54.7 50.9 52.2 53.1 51.8 51.5 45.8 44.5
Heavy Waxes
(bp > 500�C, >n-C37, i-C50)
40.9 39.9 36.7 39.3 41.4 41.1 40.8 45.6 43.2 42.0 43.4 42.9 49.5 50.6
Total 100 100 100 100 100 100 100 100 100 100 100 100 100 100
a TIC=total ion current.
Fig. 6. Pyro-GC/MS experiments on PE/PP-mixtures (product fractions vs. input ratio).
M. Predel, W. Kaminsky / Polymer Degradation and Stability 70 (2000) 373±385 383

Fig. 7. Pyrograms of PE- and PE/PS-pyrolysis.
Fig. 8. Pyrograms of PP- and PP/PS-pyrolysis.
Table 8
Pyro GC/MS-experiments at 510�C on PE/PS-mixtures (results in TIC%)a
Pyro-GC/MS-Experiment #1 #2 #6 #20 #13 #22 #24 #1 #2 #6 #20 #13 #22 #24
Input ratio PE:PS 100:0 100:0 90:10 90:10 50:50 50:50 50:50 100:0 100:0 90:10* 90:10* 50:50* 50:50* 50:50*
Input [mg] 106 59 42 40 40 74 30 106 59 42 40 40 74 30
Ð polystyrene decomposition products not considered Ð
Ð only products due to PE-pyrolysis shown Ð
R PS-Pyrolysis Products ± ± 1.9 2.0 16.9 13.1 15.8 ± ± ± ± ± ± ±
H2, n-C1-15 11.2 8.8 11.5 14.9 24.3 23.4 24.8 11.2 8.8 11.7 15.2 29.3 27.0 29.4
n-C16-17 2.2 1.8 2.2 1.9 2.0 1.5 1.8 2.2 1.8 2.3 2.0 2.4 1.7 2.1
Oils, Gases (bp < 300�C) 13.4 10.7 13.7 16.9 26.3 25.0 26.6 13.4 10.7 14.0 17.2 31.7 28.7 31.5
n-C18-19 2.7 2.6 2.6 2.2 2.0 1.9 1.6 2.7 2.6 2.6 2.3 2.4 2.1 2.0
n-C20-21 2.8 2.8 2.9 2.6 1.9 1.9 2.1 2.8 2.8 2.9 2.6 2.3 2.1 2.5
n-C22-23 3.2 3.1 3.2 2.7 2.3 2.2 2.1 3.2 3.1 3.3 2.8 2.7 2.5 2.5
n-C24-25 3.4 3.6 3.6 3.1 2.6 3.1 2.5 3.4 3.6 3.7 3.2 3.1 3.6 2.9
n-C26-27 3.7 3.7 3.8 3.7 2.7 3.7 2.7 3.7 3.7 3.9 3.7 3.3 4.3 3.3
n-C28-29 3.8 4.3 4.2 4.1 3.0 3.5 2.8 3.8 4.3 4.3 4.2 3.6 4.1 3.4
n-C30-31 4.1 4.3 4.5 4.0 3.2 3.7 3.3 4.1 4.3 4.6 4.1 3.8 4.2 3.9
n-C32-33 4.4 4.7 4.8 4.4 3.3 4.1 3.3 4.4 4.7 4.9 4.5 4.0 4.7 4.0
n-C34-35 4.4 4.7 5.1 4.8 3.7 4.0 3.7 4.4 4.7 5.2 4.9 4.4 4.6 4.4
n-C36-37 4.7 4.8 5.4 4.9 3.7 4.3 4.1 4.7 4.8 5.5 5.0 4.5 5.0 4.8
Light Waxes
(300�C < bp < 500�C)37.1 38.7 40.1 36.4 28.4 32.4 28.3 37.1 38.7 40.9 37.2 34.1 37.2 33.6
Heavy Waxes
(bp > 500�C, > n-C37)
49.5 50.6 44.3 44.7 28.4 29.6 29.4 49.5 50.6 45.2 45.6 34.2 34.1 34.9
Total 100 100 100 100 100 100 100 100 100 100 100 100 100 100
a TIC=total ion current.
384 M. Predel, W. Kaminsky / Polymer Degradation and Stability 70 (2000) 373±385
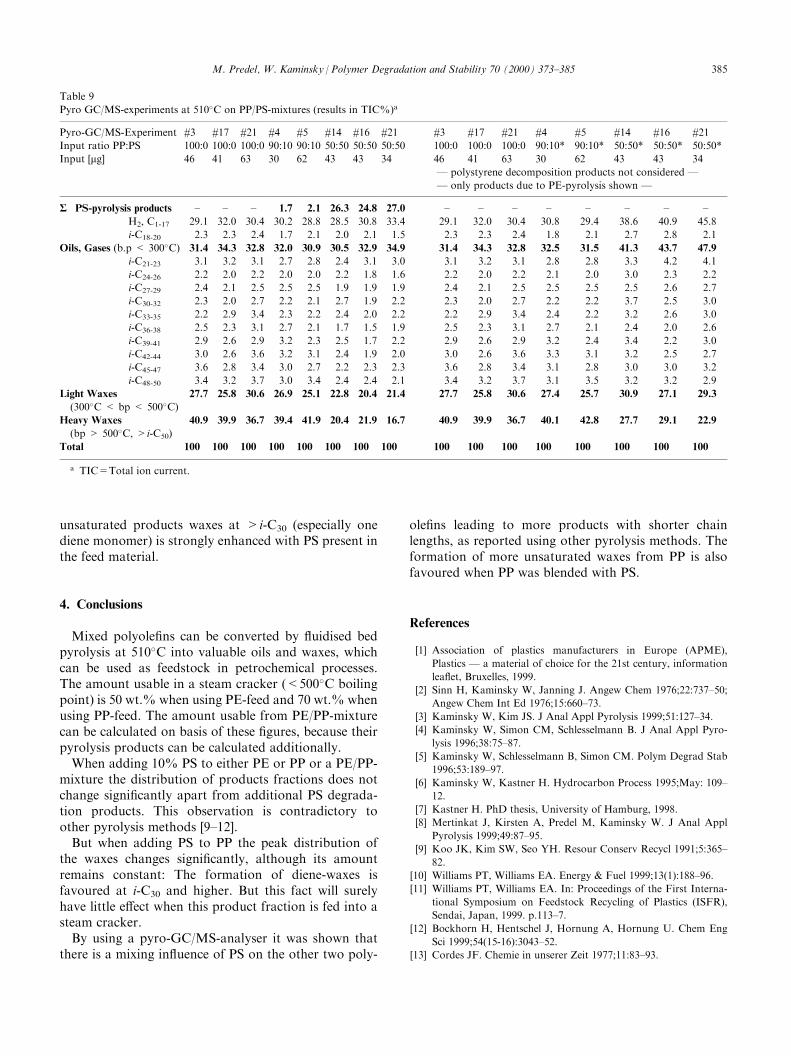
unsaturated products waxes at >i-C30 (especially onediene monomer) is strongly enhanced with PS present inthe feed material.
4. Conclusions
Mixed polyole®ns can be converted by ¯uidised bedpyrolysis at 510�C into valuable oils and waxes, whichcan be used as feedstock in petrochemical processes.The amount usable in a steam cracker (<500�C boilingpoint) is 50 wt.% when using PE-feed and 70 wt.% whenusing PP-feed. The amount usable from PE/PP-mixturecan be calculated on basis of these ®gures, because theirpyrolysis products can be calculated additionally.When adding 10% PS to either PE or PP or a PE/PP-
mixture the distribution of products fractions does notchange signi®cantly apart from additional PS degrada-tion products. This observation is contradictory toother pyrolysis methods [9±12].But when adding PS to PP the peak distribution of
the waxes changes signi®cantly, although its amountremains constant: The formation of diene-waxes isfavoured at i-C30 and higher. But this fact will surelyhave little e�ect when this product fraction is fed into asteam cracker.By using a pyro-GC/MS-analyser it was shown that
there is a mixing in¯uence of PS on the other two poly-
ole®ns leading to more products with shorter chainlengths, as reported using other pyrolysis methods. Theformation of more unsaturated waxes from PP is alsofavoured when PP was blended with PS.
References
[1] Association of plastics manufacturers in Europe (APME),
Plastics Ð a material of choice for the 21st century, information
lea¯et, Bruxelles, 1999.
[2] Sinn H, Kaminsky W, Janning J. Angew Chem 1976;22:737±50;
Angew Chem Int Ed 1976;15:660±73.
[3] Kaminsky W, Kim JS. J Anal Appl Pyrolysis 1999;51:127±34.
[4] Kaminsky W, Simon CM, Schlesselmann B. J Anal Appl Pyro-
lysis 1996;38:75±87.
[5] Kaminsky W, Schlesselmann B, Simon CM. Polym Degrad Stab
1996;53:189±97.
[6] Kaminsky W, Kastner H. Hydrocarbon Process 1995;May: 109±
12.
[7] Kastner H. PhD thesis, University of Hamburg, 1998.
[8] Mertinkat J, Kirsten A, Predel M, Kaminsky W. J Anal Appl
Pyrolysis 1999;49:87±95.
[9] Koo JK, Kim SW, Seo YH. Resour Conserv Recycl 1991;5:365±
82.
[10] Williams PT, Williams EA. Energy & Fuel 1999;13(1):188±96.
[11] Williams PT, Williams EA. In: Proceedings of the First Interna-
tional Symposium on Feedstock Recycling of Plastics (ISFR),
Sendai, Japan, 1999. p.113±7.
[12] Bockhorn H, Hentschel J, Hornung A, Hornung U. Chem Eng
Sci 1999;54(15-16):3043±52.
[13] Cordes JF. Chemie in unserer Zeit 1977;11:83±93.
Table 9
Pyro GC/MS-experiments at 510�C on PP/PS-mixtures (results in TIC%)a
Pyro-GC/MS-Experiment #3 #17 #21 #4 #5 #14 #16 #21 #3 #17 #21 #4 #5 #14 #16 #21
Input ratio PP:PS 100:0 100:0 100:0 90:10 90:10 50:50 50:50 50:50 100:0 100:0 100:0 90:10* 90:10* 50:50* 50:50* 50:50*
Input [mg] 46 41 63 30 62 43 43 34 46 41 63 30 62 43 43 34
Ð polystyrene decomposition products not considered Ð
Ð only products due to PE-pyrolysis shown Ð
R PS-pyrolysis products ± ± ± 1.7 2.1 26.3 24.8 27.0 ± ± ± ± ± ± ± ±
H2, C1-17 29.1 32.0 30.4 30.2 28.8 28.5 30.8 33.4 29.1 32.0 30.4 30.8 29.4 38.6 40.9 45.8
i-C18-20 2.3 2.3 2.4 1.7 2.1 2.0 2.1 1.5 2.3 2.3 2.4 1.8 2.1 2.7 2.8 2.1
Oils, Gases (b.p < 300�C) 31.4 34.3 32.8 32.0 30.9 30.5 32.9 34.9 31.4 34.3 32.8 32.5 31.5 41.3 43.7 47.9
i-C21-23 3.1 3.2 3.1 2.7 2.8 2.4 3.1 3.0 3.1 3.2 3.1 2.8 2.8 3.3 4.2 4.1
i-C24-26 2.2 2.0 2.2 2.0 2.0 2.2 1.8 1.6 2.2 2.0 2.2 2.1 2.0 3.0 2.3 2.2
i-C27-29 2.4 2.1 2.5 2.5 2.5 1.9 1.9 1.9 2.4 2.1 2.5 2.5 2.5 2.5 2.6 2.7
i-C30-32 2.3 2.0 2.7 2.2 2.1 2.7 1.9 2.2 2.3 2.0 2.7 2.2 2.2 3.7 2.5 3.0
i-C33-35 2.2 2.9 3.4 2.3 2.2 2.4 2.0 2.2 2.2 2.9 3.4 2.4 2.2 3.2 2.6 3.0
i-C36-38 2.5 2.3 3.1 2.7 2.1 1.7 1.5 1.9 2.5 2.3 3.1 2.7 2.1 2.4 2.0 2.6
i-C39-41 2.9 2.6 2.9 3.2 2.3 2.5 1.7 2.2 2.9 2.6 2.9 3.2 2.4 3.4 2.2 3.0
i-C42-44 3.0 2.6 3.6 3.2 3.1 2.4 1.9 2.0 3.0 2.6 3.6 3.3 3.1 3.2 2.5 2.7
i-C45-47 3.6 2.8 3.4 3.0 2.7 2.2 2.3 2.3 3.6 2.8 3.4 3.1 2.8 3.0 3.0 3.2
i-C48-50 3.4 3.2 3.7 3.0 3.4 2.4 2.4 2.1 3.4 3.2 3.7 3.1 3.5 3.2 3.2 2.9
Light Waxes
(300�C < bp < 500�C)27.7 25.8 30.6 26.9 25.1 22.8 20.4 21.4 27.7 25.8 30.6 27.4 25.7 30.9 27.1 29.3
Heavy Waxes
(bp > 500�C, >i-C50)
40.9 39.9 36.7 39.4 41.9 20.4 21.9 16.7 40.9 39.9 36.7 40.1 42.8 27.7 29.1 22.9
Total 100 100 100 100 100 100 100 100 100 100 100 100 100 100 100 100
a TIC=Total ion current.
M. Predel, W. Kaminsky / Polymer Degradation and Stability 70 (2000) 373±385 385