Kamehameha · PDF filePlanning Teams affixed their ... Hawaiian ancestry.” Kamehameha...
68
Kamehameha Schools ANNUAL REPORT JULY 1, 1999 – JUNE 30, 2000
Transcript of Kamehameha · PDF filePlanning Teams affixed their ... Hawaiian ancestry.” Kamehameha...

Kamehameha SchoolsA N N U A L R E P O RT
J U LY 1 , 1 9 9 9 – J U N E 3 0 , 2 0 0 0
KS95.1-AnnualReport for Web 5/15/01 2:28 PM Page 2

KS95.1-AnnualReport for Web 5/15/01 2:28 PM Page 3

“Refusing to rule her people,
she did what was better, she served
them, and in no way so grandly
as by her example.”
— Sermon by Rev. J.A. CruzanAt funeral service for Ke Ali’i PauahiFort Street ChurchOctober 1884
Ho‘okahi MakahikiH I S T O R I C A L R E V I E W
KS95.1-AnnualReport for Web 5/15/01 2:28 PM Page 4
2
R E N E W A LKamehameha Schools has emerged from its time of uncertainty as a vital
and expanding 21st century educational system with its focus on renewal
and the collective commitment of our ‘ohana to seek guidance in Ke Ali‘i
Bernice Pauahi Bishop’s Christian and Hawaiian cultural values.
Kamehameha Schools’ arduous journey this past year has enabled
this institution to reconnect to the vision of our beloved Ke Ali‘i Pauahi
and to rededicate its endowment, curricula and staff to ever-greater
service to people of Hawaiian ancestry.
At no other period in our history has so much change occurred in
such a short time; change that both prepared us for our future and
restored the historic values of our mission.
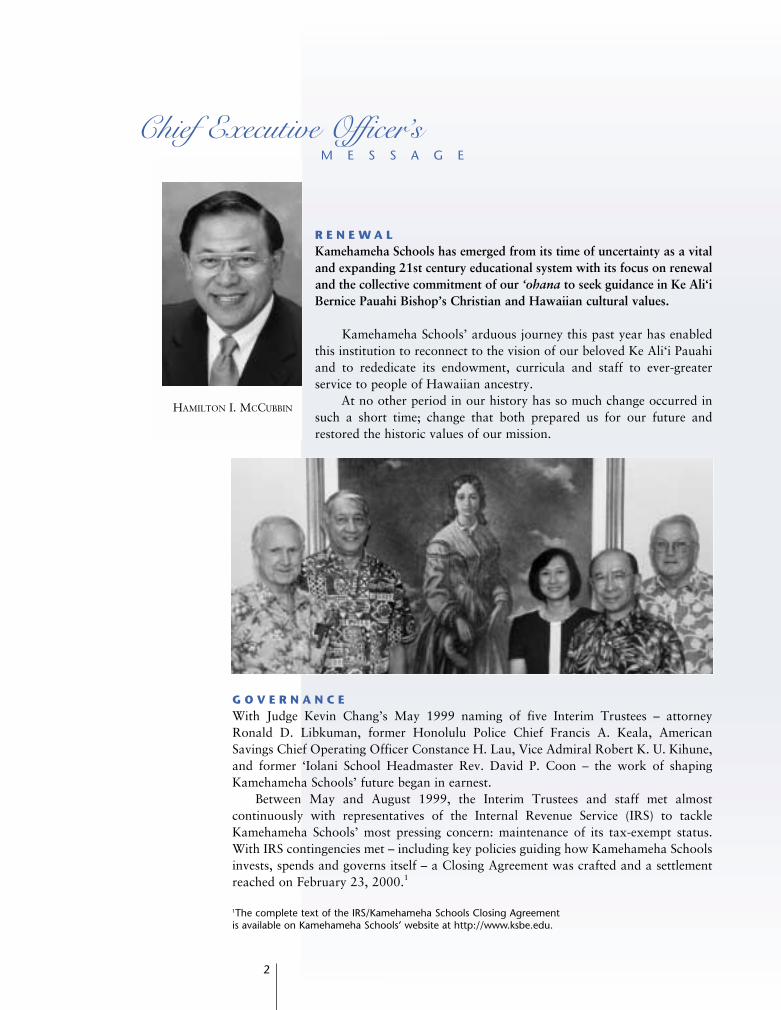
G O V E R N A N C EWith Judge Kevin Chang’s May 1999 naming of five Interim Trustees – attorney
Ronald D. Libkuman, former Honolulu Police Chief Francis A. Keala, American
Savings Chief Operating Officer Constance H. Lau, Vice Admiral Robert K. U. Kihune,
and former ‘Iolani School Headmaster Rev. David P. Coon – the work of shaping
Kamehameha Schools’ future began in earnest.
Between May and August 1999, the Interim Trustees and staff met almost
continuously with representatives of the Internal Revenue Service (IRS) to tackle
Kamehameha Schools’ most pressing concern: maintenance of its tax-exempt status.
With IRS contingencies met – including key policies guiding how Kamehameha Schools
invests, spends and governs itself – a Closing Agreement was crafted and a settlement
reached on February 23, 2000.1
Chief Executive Officer’sM E S S A G E
1The complete text of the IRS/Kamehameha Schools Closing Agreementis available on Kamehameha Schools’ website at http://www.ksbe.edu.
HAMILTON I. MCCUBBIN
KS95.1-AnnualReport for Web 5/15/01 2:28 PM Page 5

3
C E O M A N A G E M E N T S T R U C T U R EIntegral to reaching agreement with the IRS – and assuring Kamehameha Schools’ tax-
exempt status – was the stipulation that a Chief Executive Officer (CEO)-based man-
agement structure be established and implemented.
A CEO-based management structure was first recommended in the 100th Annual
Account for fiscal year 1985 by court appointed Master Michael D. Hong. The
recommendation was reiterated by several subsequent Masters, in Arthur Andersen LLP’s
336-page Kamehameha Schools Bernice Pauahi Bishop Estate Management Audit
Findings of July 1998, and in Master Colbert Matsumoto’s Consolidated Report on the
109th, 110th, and 111th Annual Accounts – for fiscal years 1994, 1995 and 1996
respectively. The recommended CEO structure was finally established as part of a new
institutional Governance Policy adopted by the Interim Board of Trustees in August 1999.
While retaining the oversight and policymaking role of the Board of Trustees, the
CEO management structure created a traditional business configuration at Kamehameha
Schools by allocating authority over day-to-day operational activities to the CEO and an
Executive Management Team (designation later changed to Chief Executives)
representing Kamehameha Schools’ principal groups. The Executive Management Team
– Chief Education Officer, Chief Financial Officer, Chief Investment Officer, Chief Legal
Officer, and Chief Administrative Officer – experts in their respective fields, advise and
report to the CEO on the operations of the organization. In turn, the CEO reports and
is accountable to the Trustees for policy implementation.
Thus, the CEO management structure broadened and balanced the governance of
Kamehameha Schools by formalizing delegated authorities and establishing distinct
lines of responsibility and accountability within its organizational framework.
To further clarify responsibility and lines of authority within Kamehameha’s newly
developed educational system, the Chief Education Officer will oversee the
administration of three K-12 campuses on O‘ahu, Maui and Hawai‘i, extension and
outreach programs, and expanding early childhood programs.
K A M E H A M E H A S C H O O L SEffective January 1, 2000, in a move that reaffirmed the wishes of our founder – that
her schools “… be known as and called the Kamehameha Schools” – Interim Board of
Trustees formally changed the name of our institution from Kamehameha Schools
Bishop Estate to Kamehameha Schools.
T R U S T E E S E L E C T I O NA Trustee Screening Committee appointed
by Judge Kevin Chang announced the
criteria of their search for permanent
trustees for Kamehameha Schools in
January 2000. The Screening Committee
was made up of former court-appointed
Master Colbert Matsumoto, attorney
Melody MacKenzie, Hawai‘i Community
Foundation Executive Kelvin Taketa, business executive Kenneth Brown and Kamehameha
Schools alumni including Alumni Association president Roy Benham, educator Winona
Beamer and Col. Michael Rawlins, Hawai‘i National Guard.
KS95.1-AnnualReport for Web 5/15/01 2:28 PM Page 6
4
The Committee accepted nominations from the community in the search for persons
with backgrounds in education, strategic planning, finance and business. Seeking persons
of integrity and in good standing in the community, they stressed the importance of
Hawaiian values although Hawaiian ancestry was not a selection prerequisite.
This community-based nomination process resulted in seven finalists who were
recommended to the court for final selection.
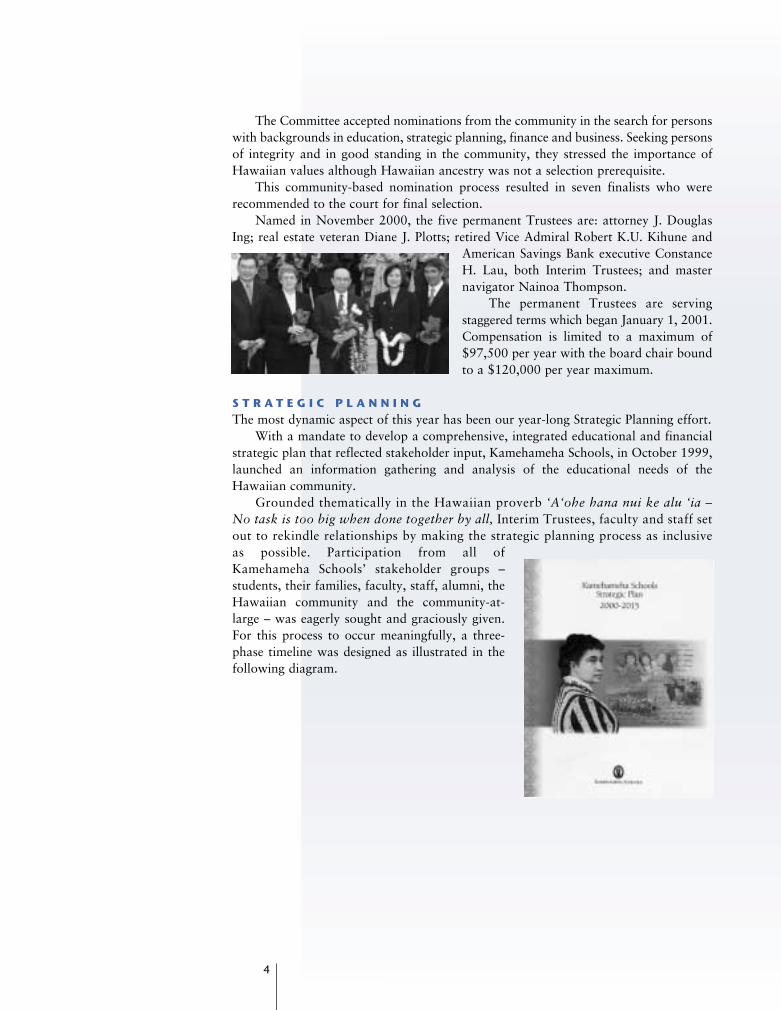
Named in November 2000, the five permanent Trustees are: attorney J. Douglas
Ing; real estate veteran Diane J. Plotts; retired Vice Admiral Robert K.U. Kihune and
American Savings Bank executive Constance
H. Lau, both Interim Trustees; and master
navigator Nainoa Thompson.
The permanent Trustees are serving
staggered terms which began January 1, 2001.
Compensation is limited to a maximum of
$97,500 per year with the board chair bound
to a $120,000 per year maximum.
S T R A T E G I C P L A N N I N GThe most dynamic aspect of this year has been our year-long Strategic Planning effort.
With a mandate to develop a comprehensive, integrated educational and financial
strategic plan that reflected stakeholder input, Kamehameha Schools, in October 1999,
launched an information gathering and analysis of the educational needs of the
Hawaiian community.
Grounded thematically in the Hawaiian proverb ‘A‘ohe hana nui ke alu ‘ia –
No task is too big when done together by all, Interim Trustees, faculty and staff set
out to rekindle relationships by making the strategic planning process as inclusive
as possible. Participation from all of
Kamehameha Schools’ stakeholder groups –
students, their families, faculty, staff, alumni, the
Hawaiian community and the community-at-
large – was eagerly sought and graciously given.
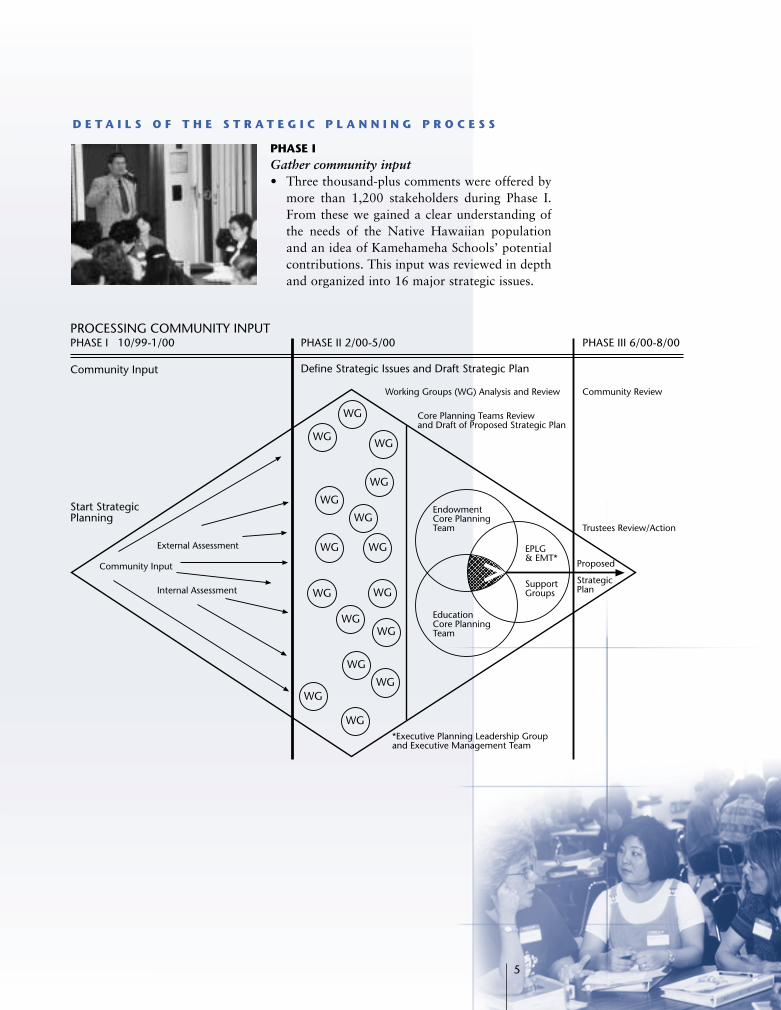
For this process to occur meaningfully, a three-
phase timeline was designed as illustrated in the
following diagram.
KS95.1-AnnualReport for Web 5/15/01 2:28 PM Page 7
5
D E T A I L S O F T H E S T R A T E G I C P L A N N I N G P R O C E S S
PHASE IGather community input
• Three thousand-plus comments were offered by
more than 1,200 stakeholders during Phase I.
From these we gained a clear understanding of
the needs of the Native Hawaiian population
and an idea of Kamehameha Schools’ potential
contributions. This input was reviewed in depth
and organized into 16 major strategic issues.
WG
WG
WG
WG
WG
WG
WGWG
WG
WG
WG
WG
WG
WG
WG
WG
PROCESSING COMMUNITY INPUTPHASE I 10/99-1/00
Community Input
PHASE II 2/00-5/00 PHASE III 6/00-8/00
Define Strategic Issues and Draft Strategic Plan
Working Groups (WG) Analysis and Review Community Review
Core Planning Teams Reviewand Draft of Proposed Strategic Plan
Trustees Review/Action
Start StrategicPlanning
External Assessment
Community Input
Internal Assessment
EndowmentCore PlanningTeam
EducationCore PlanningTeam
EPLG& EMT*
SupportGroups
Proposed
StrategicPlan
*Executive Planning Leadership Groupand Executive Management Team
KS95.1-AnnualReport for Web 5/15/01 2:28 PM Page 8
6
PHASE IIDefine strategic issues and develop a Draft Strategic Plan
• Nearly 400 volunteers from throughout the state, participating in 16 Working
Groups, studied the collected data and framed key issues, options and potential
strategic directions for Kamehameha Schools.
• A statewide telephone survey – sampling more than 2,000 Hawaiian adults –
provided additional perspectives while confirming that the 16 major themes were
consistent with their priorities.
• Finally, all planning groups – including the Executive Management Team and the
Board of Trustees – deliberated the Values, Vision, Mission, Guiding Principles and
Goals the data had revealed. A Draft Strategic Plan – outlining seven specific goals
– issued from their deliberations.
Goal 1: Kamehameha Schools will provide and facilitate a wide range of
integrated, quality educational programs and services to serve more
people of Hawaiian ancestry.
Goal 2: Kamehameha Schools will work with families and communities in their
efforts to meet the educational needs of people of Hawaiian ancestry.
Goal 3: Kamehameha Schools will cultivate, nurture, perpetuate, and
practice ‘Ike Hawai‘i (which includes Hawaiian culture, values,
history, language, oral traditions, literature, and wahi pana –
significant cultural or historical places – etc.).
Goal 4: Kamehameha Schools will foster the development of leaders who
focus on service to others.
Goal 5: Kamehameha Schools will optimize the value and use of current
financial and non-financial resources and actively seek and develop
new resources.
Goal 6: Kamehameha Schools will malama i ka ‘aina: practice ethical, prudent
and culturally appropriate stewardship of lands and resources.
Goal 7: Kamehameha Schools will continue to develop as a dynamic,
nurturing, learning community.
PHASE IIIPresent the Draft Strategic Plan to the community
• The Draft Strategic Plan was shared at more than 30 statewide and mainland meetings
and publicized widely to elicit community feedback that further refined the plan.
• Five initial educational program priorities were identified for Kamehameha Schools
Quality K-12 education
Early education
Literacy
Hawaiian culture and language
Vocational education
• Four initial endowment issues emerged as critical for Kamehameha Schools
Stewardship
Balancing educational and cultural values with economic return
Protecting its land legacy
Resource development
KS95.1-AnnualReport for Web 5/15/01 2:28 PM Page 9

7
PHASE IVFinal Strategic Plan
The Trustees adopted Kamehameha Schools’ final
Strategic Plan in September 2000. In a small
ceremony before the crypt housing the remains of
Ke Ali’i Bernice Pauahi and Charles Reed Bishop at
Mauna‘ala, on September 28, 2000, the document was
formally signed.
Trustees, the Executive Management Team and
members of the Education and Endowment Core
Planning Teams affixed their signatures to the document, vowing to make “every reasonable
effort to support the plan’s implementation for the benefit of Pauahi’s children, the people of
Hawaiian ancestry.”
Kamehameha Schools Strategic Plan 2000-2015 will serve as both foundation and guide
as Kamehameha Schools addresses the educational needs of the Hawaiian community well
into this new century.2
G R O W T H A N D E X P A N S I O NOne of the important goals of our Strategic Plan –
to “provide and facilitate a wide range of integrated,
quality educational programs and services to serve more
people of Hawaiian ancestry” – was in place by summer
1999. At that time, Kamehameha Schools was fully
engaged in its largest construction program in decades.
Major projects undertaken included:
• Kulana ‘Ôiwi, Moloka‘i – completed July 1999
In partnership with ali‘i trusts and other Hawaiian service providers, KS contributed to
construction costs for a facility that houses a new KS Moloka‘i preschool site and the first
permanent multi-purpose service center for Native Hawaiians in the state.
• Kalani‘opu‘u Swimming Complex, O‘ahu Campus – completed August 1999
Newly renovated, the pool is now Olympic-sized, heated, and meets standards for both
international and state aquatic events.
• Maui Campus, Maui – completed August 1999
With the $15,000,000 Phase I construction completed – including classroom and
administration buildings, caretaker residence/service center and entry gate – the Maui
Campus opened to grades K-6 in August 1999, marking the first, permanent presence of
Kamehameha Schools beyond O‘ahu’s shores. Phase II construction – including cafetorium,
band/music room, and gymnasium – was completed in April 2000. In July 2000,
Kamehameha Schools adopted a plan to expand the Maui Campus – in phases – to
eventually serve grades K-12.
2Kamehameha Schools Strategic Plan 2000-2015 is available on Kamehameha Schools’website at http://www.ksbe.edu. For a paper copy, call toll-free to (800) 842-4682,ext. 6348, or write to Kamehameha Schools, Communications Division, 567 S. KingStreet, Suite 301, Honolulu, Hawai‘i 96813.
KS95.1-AnnualReport for Web 5/15/01 2:28 PM Page 10

8
• Waimanalo Preschool, O‘ahu – anticipated completion June 2001
Marking another partnership milestone, Kamehameha Schools is uniting with
the Queen Lili‘uokalani Children’s Center and the Department of Hawaiian
Homelands to develop adjacent parcels to house a multi-purpose service center
for Native Hawaiians. Kamehameha’s $2.6 million Waimanalo Preschool facility,
which will be part of the center, is scheduled for completion in June 2001. It will
accommodate 72 three- and four-year-old Hawaiian youngsters in four classrooms.
• Hawai‘i Campus, Hawai‘i-Phase I – anticipated completion August 2001Once Phase I construction is completed in August 2001, the 300-acre Hawai‘iCampus will become Kamehameha Schools’ third permanent campus site.Originally planned to house grades K-8, it was determined in 2000 thatKamehameha Schools’ Hawai‘i Island student body would best be accommodatedby expanding the Hawai‘i Campus’ original design to serve grades K-12. Thisadditional phased-in construction anticipates completion by 2005.
• Athletic Complex, O‘ahu – anticipated completion September 2001Approved in January 2000, this $15 million project includes Kamehameha Schools’first-ever regulation football field, 400 meter track with all-weather surface,a natural turf field, bleacher seating for 3,000 spectators, a promenade withconcession stand, restrooms, ticket office and a scorer’s booth.
Much has been accomplished. Much remains to be done. Yet, in this year markedby incredible change and systemic transitioning, the hard work on behalf ofKamehameha Schools by a loving community has bequeathed a legacy of its own:an invigorated leadership, an empowered staff and stakeholders, an expandingeducational system, and a return to core values.
At the dawn of the 21st century, Kamehameha Schools stands renewed andprepared for the challenges ahead – proud of its heritage, confident in its future.
Hamilton I. McCubbin, Ph.D.CHIEF EXECUTIVE OFFICERKamehameha Schools
KS95.1-AnnualReport for Web 5/15/01 2:28 PM Page 11

“As the water of Kane refreshes
the land, so will this gift from our
Princess restore life to our people.”
— An “older” HawaiianOpening Day Ceremonies, Kamehameha School for BoysNovember 4, 1887
Ho‘ona‘auaoT O E D U C A T E
KS95.1-AnnualReport for Web 5/15/01 2:28 PM Page 12
10
Driving Kamehameha Schools’ 1999-2000 academic and fiscal year, our
educational mission became central to and inseparable from the strategic
planning process. The Strategic Plan identified education as this
institution’s perpetual singular purpose, identity and unifier. The Plan also
launched proactive development of Kamehameha Schools into a statewide,
multi-campus, multi-program educational system.
B U I L D I N G A S Y S T E MFundamental to achieving a vital educational system will be the completion of our
neighbor island campuses. The three campuses will serve as the foundation from which
to expand the reach and effectiveness of Kamehameha Schools’ mission of increasing
the well-being of Hawaiian people through education.
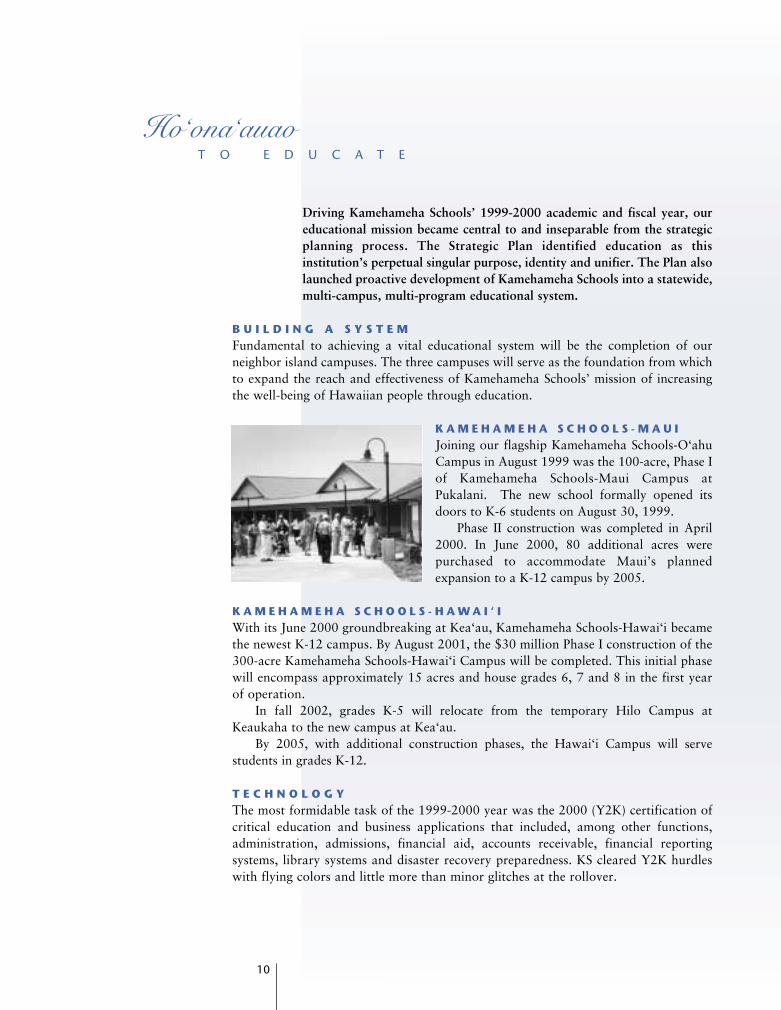
K A M E H A M E H A S C H O O L S - M A U IJoining our flagship Kamehameha Schools-O‘ahu
Campus in August 1999 was the 100-acre, Phase I
of Kamehameha Schools-Maui Campus at
Pukalani. The new school formally opened its
doors to K-6 students on August 30, 1999.
Phase II construction was completed in April
2000. In June 2000, 80 additional acres were
purchased to accommodate Maui’s planned
expansion to a K-12 campus by 2005.
K A M E H A M E H A S C H O O L S - H A W A I ‘ IWith its June 2000 groundbreaking at Kea‘au, Kamehameha Schools-Hawai‘i became
the newest K-12 campus. By August 2001, the $30 million Phase I construction of the
300-acre Kamehameha Schools-Hawai‘i Campus will be completed. This initial phase
will encompass approximately 15 acres and house grades 6, 7 and 8 in the first year
of operation.
In fall 2002, grades K-5 will relocate from the temporary Hilo Campus at
Keaukaha to the new campus at Kea‘au.
By 2005, with additional construction phases, the Hawai‘i Campus will serve
students in grades K-12.
T E C H N O L O G YThe most formidable task of the 1999-2000 year was the 2000 (Y2K) certification of
critical education and business applications that included, among other functions,
administration, admissions, financial aid, accounts receivable, financial reporting
systems, library systems and disaster recovery preparedness. KS cleared Y2K hurdles
with flying colors and little more than minor glitches at the rollover.
Ho‘ona‘auaoT O E D U C A T E
KS95.1-AnnualReport for Web 5/15/01 2:28 PM Page 13

11
This was also a year of growth in numbers of
users and facilities supported by KS’ Information
Systems Division (ISD) and the Education
Information Systems (EIS) department.
Kamehameha’s Maui Campus was outfitted with
the latest in educational technology, and
technology planning began for the new Kea‘au
Campus. A pilot technology program —
Breakthrough to Literacy — was implemented at
several preschools and technology support for
KS’ new K-3 Reading Program was initiated.
Electrical improvements at Kapalama Campus’s 9-12 grade campus finally allowed
installation of teacher workstations in each classroom and a full student workstation
rollout was completed in summer 2000. An institution-wide digital document
management system was implemented with the installation of new digital copiers
throughout Kamehameha Schools’ facilities statewide. Web applications were designed
with user input to automate several tedious manual processes including an online
Technology Service Request and a Facilities Use Request system.
At present, Kamehameha Schools is accelerating the upgrade of data, voice and
video networks statewide to enhance both internal and external communications. One
important outgrowth of this emphasis on technology will be strengthening
Kamehameha’s Distance Learning Program to enhance curriculum across our system
and help to reach more Native Hawaiians.
‘ I K E H A W A I ‘ IKamehameha Schools has long been in the forefront of cultivating and perpetuating
Hawaiian cultural values, traditions and practices and is looked to as a major resource
in Hawaiian culture.
So, when the concept of ‘Ike Hawai‘i was raised by KS staff and stakeholders alike
within the Strategic Planning process, Kamehameha’s commitment to cultural
integration took on renewed emphasis. (‘Ike means to know, feel, recognize, comprehend
and to have insight; and Hawai‘i in this context means the knowledge of Hawaiians,
including ancestral values, practices, traditions, concepts, language and history.)
The Hawaiian Culture and Language Strategic Planning Working Group stated in
their final report that ‘Ike Hawai‘i was conceived to describe the foundation, the way
of thinking, believing and nurturing all aspects of Hawaiian culture. They felt that this
concept could serve as a strong foundation upon which all culturally significant
activities at Kamehameha Schools should be based.
The importance of ‘Ike Hawai‘i to Kamehameha Schools is evident in the
experiences and activities of our ‘ohana throughout the year. In 1999-2000, programs
actively incorporating ‘Ike Hawai‘i concepts included Founder’s Day honoring Ke Ali‘i
Bernice Pauahi Bishop, seasonal concerts (Christmas and Spring), Ho‘olaule‘a,
Kamehameha Day participation, Alumni Week, Commencement Exercises, and Summer
Programs such as Kulia I Ka Pono and Explorations. In addition, Kamehameha students
participated in the Rapa Nui arrival of the voyaging canoe Hokule‘a.
KS95.1-AnnualReport for Web 5/15/01 2:28 PM Page 14
12
Many of Kamehameha’s community activities reflected the importance of ‘Ike
Hawai‘i: Kamehameha Schools’ representation on various island burial councils,
development of appropriate Mauna‘ala protocol and student service learning projects;
partnerships with Bishop Museum, Ka‘upulehu Foundation, charter schools, the Office
of Hawaiian Affairs and other Hawaiian agencies; and finally, the reactivation of the
much-heralded Hawaiian Culture Center Project which will expand our staff and
students’ knowledge of their heritage.
O U T R E A C HEmphasis on reading skills and literacy in early education are among the major outreach
efforts initiated by Kamehameha in the 1999-2000 year.
Beginning in fall 2000, Kamehameha Schools — in partnership with the state
Department of Education (DOE) — launched a Kindergarten to Grade Three (K-3)
Reading Program. This program will focus on enhancing the reading skills of K-3
children in public schools with the largest numbers of Hawaiian students. The three
components of KS’ K-3 Reading Program are instructional support, tutoring support,
and parent education.
A network of preschools, early education programs, vocational and career
development partnerships, Hawaiian cultural education projects and a host of outreach
programs and alliances are currently operational or in the planning stages. These
programs form the cornerstones of our expanding educational system.
By providing programs or partnering with others, Kamehameha Schools will
increasingly leverage its resources, thereby extending the Legacy of Ke Ali‘i Bernice
Pauahi Bishop to ever more Native Hawaiians through a vast array of educational
program opportunities.
KAMEHAMEHA SECONDARY SCHOOL - O‘AHU
The Kamehameha Schools Class of 2000 added 442 new graduates to the 18,062
alumni who earned diplomas between 1891 and 1999.
ENROLLMENT
KAMEHAMEHA SECONDARY SCHOOLOfficial enrollment for the 1999-2000 school year as of September 1, 1999
ENROLLMENTGrade 7 324Grade 8 319Grade 9 462Grade 10 459Grade 11 458Grade 12 452______Division Totals 2,474____________
Source: SASI Secondary School Database 9/1/99
KS95.1-AnnualReport for Web 5/15/01 2:28 PM Page 15
13
Sixty-eight members of the Class of
2000 received Academic Honors
Diplomas by earning an overall GPA
of 3.5 or higher, completing at least
12 honors credits, and enrolling in an
Advanced Placement, fourth-year
language or university course in their
senior year.
More than 98 percent of the Class of
2000 expressed their intent to enroll in
institutions of higher learning in the
fall of 2000. Eighty-two percent planned to attend four-year colleges or universities in
Hawai‘i and on the mainland.
Among these new graduates, four were National Merit Finalists; two were National
Merit Semi-Finalists; and 12 were National Merit Commended Scholars. Two seniors won
the prestigious Gates Millennium Scholarship and five were Sterling Scholarship Finalists.
S E C O N D A R Y S C H O O L F I N A N C I A L A I DKamehameha Schools provided $3,158,165 in financial aid to 1,616 student recipients
serving more than 65 percent of Kamehameha’s Secondary School population.
SECONDARY SCHOOL ADMISSIONS
Admissions figures applicable to the 1999-2000 school year as of May, 1999
BY GRADE LEVEL APPLICATIONS INVITEDGrade 7 1,451 181Grade 9 938 144Grade 10 179 20Grade 11 123 16______ _____Totals 2,691 361______ ___________ _____
TOTALBY DISTRICT GRADE 7 GRADE 9 GRADE 10 GRADE 11 INVITED
O’ahuHonolulu 31 18 1 3 53Windward 35 22 4 6 67Leeward 40 21 5 1 67Central 22 14 3 2 41
Hawai’i 26 37 4 3 70Maui 13 12 1 0 26Kaua’i/Ni’ihau 9 14 1 1 25Moloka’i 3 4 1 0 8Lana’i 0 2 0 0 2Out of State 2 0 0 0 2_____ _____ _____ _____ _____Totals 181 144 20 16 361_____ _____ _____ _____ __________ _____ _____ _____ _____
KS95.1-AnnualReport for Web 5/15/01 2:28 PM Page 16

14
F A C U L T Y A N D S T A F FWith a focus on building and strengthening
communications within the secondary school
structure, Kamehameha Secondary School
administrators, faculty and staff were fully
involved in new initiatives in governance and
inclusive decision-making practices.
Several task forces – including the Instructional
Technology Task Force, the Middle School Task
Force, and the Quality Education Task Force –
were convened to work toward improved
communications both internally and externally.
Adding to our communications capability
was the instructional classroom technology
rollout for grades 9-12 implemented in summer 2000. A joint effort of Kamehameha
Schools’ Educational Information Systems office and secondary school staff, the new
technology will spur innovative learning experiences in the classroom.
Consistent with the Strategic Plan’s goals of establishing proficient measurement
tools, administrators and department heads initiated a new system to evaluate overall
division effectiveness. All teachers and staff were asked to provide feedback that will
be used to evaluate and improve job performance.
KAMEHAMEHA ELEMENTARY SCHOOLS
ELEMENTARY ENROLLMENT — ALL CAMPUSES
KAMEHAMEHA ELEMENTARY SCHOOLS
Official enrollment for the 1999-2000 school year as of September 1, 1999
ENROLLMENT
O‘ahu Campus 752Hawai‘i Campus 152Maui Campus 152______Division Total 1,056____________
Source: Principals’ Reports for the 1999-2000 school year
E L E M E N T A R Y L E V E L F I N A N C I A L A I DKamehameha Schools provided $696,699 in financial aid to 661 student recipients serving
more than 62 percent of Kamehameha’s Elementary School population system-wide.
KS95.1-AnnualReport for Web 5/15/01 2:28 PM Page 17
15
O ‘ A H U C A M P U SKamehameha Elementary School’s (KES) Student Council – 36 students from grades
4-6 – worked to develop student leadership, coordinate school events, and promote
community service activities among fellow students.
Among community service activities performed by KES students was the
continuation of KES’ successful Jump Rope Demonstration Team. Made up of 40
students from grades 3-6, they performed at schools throughout the year to promote
the annual Jump Rope for Heart fundraiser for the American Heart Association. KES
participants, 718 strong, came in first in the nation again, raising more than $46,000
for the cause.
As part of Kamehameha Schools’ Strategic Plan goal to “work with families and
communities in their efforts to meet the educational needs of people of Hawaiian
ancestry,” two family-oriented educational programs were expanded. KES’ popular
Family Science Night extended over two evenings this year attracting more than 400
family members. Kindergarten workshops in math and language arts brought out
nearly all KES families.
O‘AHU CAMPUS ENROLLMENT
KES-O’AHUOfficial enrollment for the 1999-2000 school year as of September 1, 1999
NUMBER OF CLASSCLASSROOMS SIZE TOTAL
Kindergarten 4 20 80Grade 1 4 20 80Grade 2 4 20 80Grade 3 4 20 80Grade 4 6 24 144Grade 5 6 24 144Grade 6 6 24 144_____Total 752__________
Source: Principal’s Report for the 1999-2000 school year
Twenty-four KES sixth graders were awarded the 2000 President’s Award for
Educational Excellence – presented by the U.S. Department of Education to honor
students for their academic effort and success.
Year-long KES student activities included the Kamehameha Schools Children’s
Chorus, made up of approximately 100 students in grades 4-6. The chorus performed
throughout the year, including appearances at the ATP Ho‘olaule‘a, Christmas and
spring concerts, and visits to Kapi‘olani and Maluhia Hospitals. The Children’s Chorus
also traveled to Maui to perform for students, staff and families of the Maui Campus.
KS95.1-AnnualReport for Web 5/15/01 2:28 PM Page 18
O‘AHU CAMPUS ADMISSIONS
Admissions figures for student admissions applicable to the 1999-2000 school year
as of May 1999
KINDERGARTEN ADMISSIONS APPLICATIONS INVITED
Honolulu District 214 15Windward District 239 18Leeward District 292 25Central 154 10Orphan/Indigent 219 12______ _____Total 1,118 80______ ___________ _____
Source: Director of Admissions Report for the 1999-2000 school year
GRADE 4 ADMISSIONS APPLICATIONS INVITED
Honolulu District 179 11Windward District 231 16Leeward District 273 19Central 141 9Orphan/Indigent 152 11______ _____Total 976 66______ ___________ _____
Source: Director of Admissions Report for the 1999-2000 school year
H A W A I ‘ I C A M P U STotal enrollment reached 152 students. In preparation for the inclusion of grade seven
in the 2000-2001 school year, a modular building was placed on the temporary campus
site, while administrators began planning the middle school curriculum and scheduling.
In November 1999, 300 acres in Kea‘au were purchased as the permanent site for
Kamehameha Schools-Hawai‘i. Groundbreaking for the new campus was held in June
2000. The first six classrooms will be available in fall 2001. Taking the lead from
Kamehameha Schools’ Strategic Plan, inclusive decision-making was incorporated
in the creation of a Kamehameha Schools-Hawai‘i advisory board and ad hoc
committees. Comprised of community members, faculty, staff, parents and students,
these committees participated in the planning and design of Phase I of Kamehameha
Schools’ permanent Hawai‘i Campus.
Consistent with the Strategic Plan’s fourth goal — “to foster the development of
leaders who focus on service to others” — a first-ever student council was organized.
Students were elected at each grade level through the democratic process and given
leadership training throughout the year. These student-leaders organized activities each
month and planned and led all school-wide assemblies.
Science received greater impetus this year with the addition of a special science
teacher who coordinated activities with classroom teachers. Students were energized
and participated fully in experiments and hands-on activities that reinforced the
learning of new concepts.
16
KS95.1-AnnualReport for Web 5/15/01 2:28 PM Page 19
17
Musical instruments continued to be added in looking to a future Hawai‘i Campus
music program. This year, the students performed many choral pieces for special
occasions especially the Founder’s Day program and the permanent Kea‘au Campus
groundbreaking ceremony.
HAWAI’I CAMPUS ENROLLMENT
KS-HAWAI’IOfficial enrollment for the 1999-2000 school year as of September 1, 1999
NUMBER OF CLASSCLASSROOMS SIZE TOTAL
Kindergarten 1 20 20Grade 1 1 20 20Grade 2 1 21 21Grade 3 1 20 20Grade 4 1 24 24Grade 5 1 24 24Grade 6 1 23 23_____Total 152__________
Source: Principal’s Report for the 1999-2000 school year
HAWAI’I CAMPUS ADMISSIONS
Admissions figures for student admissions applicable to the 1999-2000 school year
as of May 1999
KINDERGARTEN ADMISSIONS APPLICATIONS INVITED
East Hawai’i 61 16Orphan/Indigent 36 4_____ _____Total 99 20_____ __________ _____
GRADE 4 ADMISSIONS WAITLISTED INVITED
East Hawai’i 25 3_____Total 3__________
Source: Director of Admissions Report for the 1999-2000 school year
KS95.1-AnnualReport for Web 5/15/01 2:28 PM Page 20
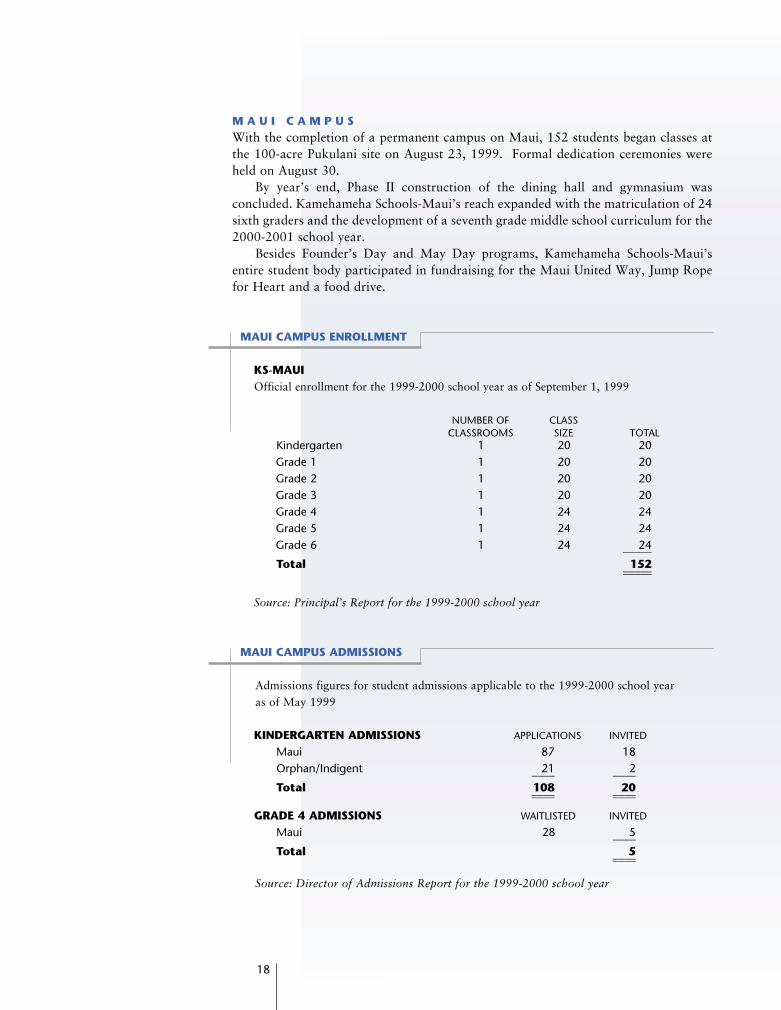
M A U I C A M P U SWith the completion of a permanent campus on Maui, 152 students began classes at
the 100-acre Pukulani site on August 23, 1999. Formal dedication ceremonies were
held on August 30.
By year’s end, Phase II construction of the dining hall and gymnasium was
concluded. Kamehameha Schools-Maui’s reach expanded with the matriculation of 24
sixth graders and the development of a seventh grade middle school curriculum for the
2000-2001 school year.
Besides Founder’s Day and May Day programs, Kamehameha Schools-Maui’s
entire student body participated in fundraising for the Maui United Way, Jump Rope
for Heart and a food drive.
MAUI CAMPUS ENROLLMENT
KS-MAUIOfficial enrollment for the 1999-2000 school year as of September 1, 1999
NUMBER OF CLASS CLASSROOMS SIZE TOTAL
Kindergarten 1 20 20Grade 1 1 20 20Grade 2 1 20 20Grade 3 1 20 20Grade 4 1 24 24Grade 5 1 24 24Grade 6 1 24 24_____Total 152__________
Source: Principal’s Report for the 1999-2000 school year
MAUI CAMPUS ADMISSIONS
Admissions figures for student admissions applicable to the 1999-2000 school year
as of May 1999
KINDERGARTEN ADMISSIONS APPLICATIONS INVITED
Maui 87 18Orphan/Indigent 21 2____ ____Total 108 20____ ________ ____
GRADE 4 ADMISSIONS WAITLISTED INVITED
Maui 28 5____Total 5________
Source: Director of Admissions Report for the 1999-2000 school year
18
KS95.1-AnnualReport for Web 5/15/01 2:28 PM Page 21
19
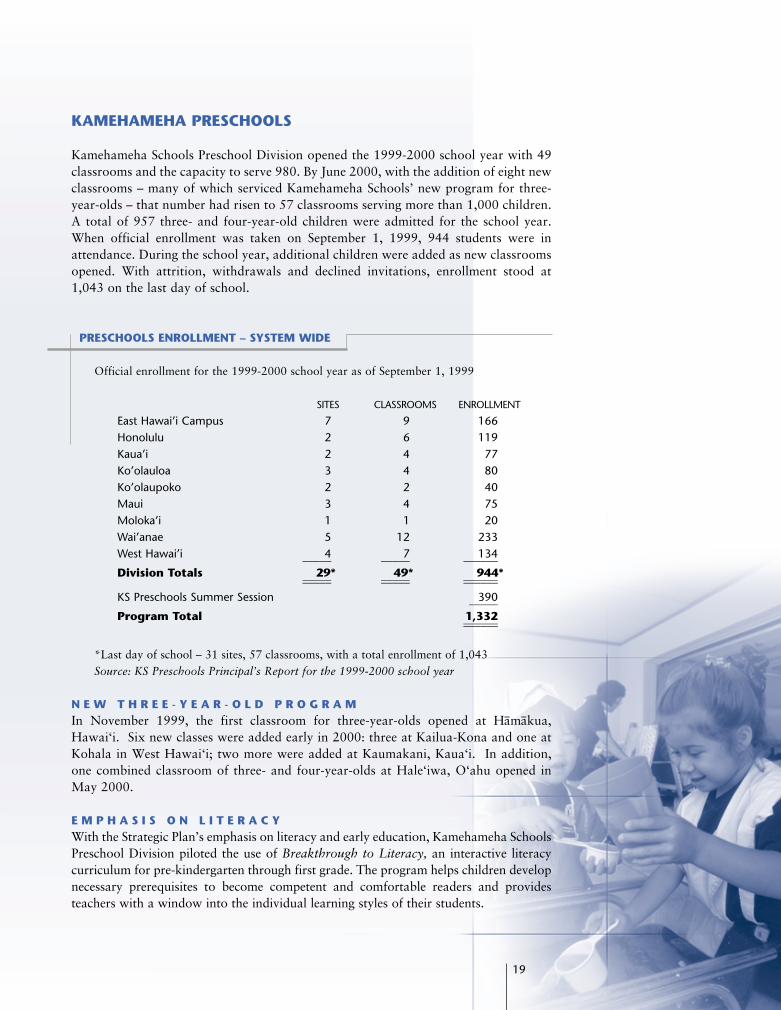
KAMEHAMEHA PRESCHOOLS
Kamehameha Schools Preschool Division opened the 1999-2000 school year with 49
classrooms and the capacity to serve 980. By June 2000, with the addition of eight new
classrooms – many of which serviced Kamehameha Schools’ new program for three-
year-olds – that number had risen to 57 classrooms serving more than 1,000 children.
A total of 957 three- and four-year-old children were admitted for the school year.
When official enrollment was taken on September 1, 1999, 944 students were in
attendance. During the school year, additional children were added as new classrooms
opened. With attrition, withdrawals and declined invitations, enrollment stood at
1,043 on the last day of school.
PRESCHOOLS ENROLLMENT – SYSTEM WIDE
Official enrollment for the 1999-2000 school year as of September 1, 1999
SITES CLASSROOMS ENROLLMENT
East Hawai’i Campus 7 9 166Honolulu 2 6 119Kaua’i 2 4 77Ko’olauloa 3 4 80Ko’olaupoko 2 2 40Maui 3 4 75Moloka’i 1 1 20Wai’anae 5 12 233West Hawai’i 4 7 134_____ _____ ______Division Totals 29* 49* 944*_____ _____ ___________ _____ ______
KS Preschools Summer Session 390_____Program Total 1,332____________
*Last day of school – 31 sites, 57 classrooms, with a total enrollment of 1,043
Source: KS Preschools Principal’s Report for the 1999-2000 school year
N E W T H R E E - Y E A R - O L D P R O G R A MIn November 1999, the first classroom for three-year-olds opened at Hamakua,
Hawai‘i. Six new classes were added early in 2000: three at Kailua-Kona and one at
Kohala in West Hawai‘i; two more were added at Kaumakani, Kaua‘i. In addition,
one combined classroom of three- and four-year-olds at Hale‘iwa, O‘ahu opened in
May 2000.
E M P H A S I S O N L I T E R A C YWith the Strategic Plan’s emphasis on literacy and early education, Kamehameha Schools
Preschool Division piloted the use of Breakthrough to Literacy, an interactive literacy
curriculum for pre-kindergarten through first grade. The program helps children develop
necessary prerequisites to become competent and comfortable readers and provides
teachers with a window into the individual learning styles of their students.
KS95.1-AnnualReport for Web 5/15/01 2:28 PM Page 22
In three pilot Breakthrough East Hawai‘i classrooms alone, children showed gains in
vocabulary tests greater than the overall average for the preschool division; and teacher
training made an observable positive effect on language and literacy classroom instruction.
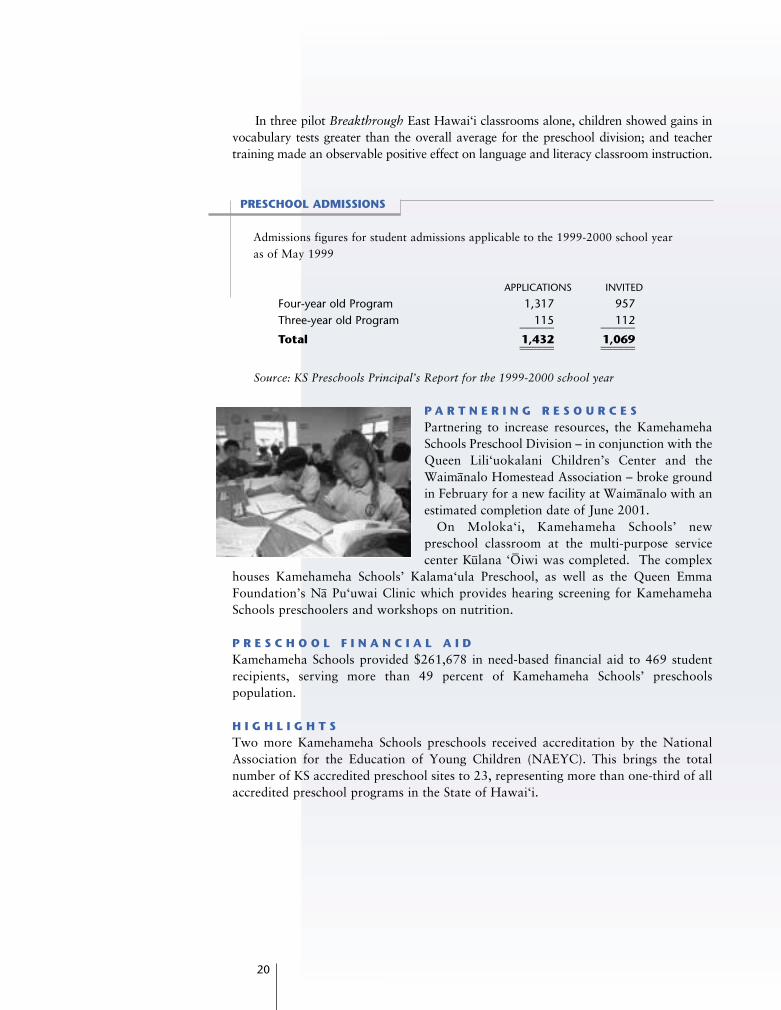
PRESCHOOL ADMISSIONS
Admissions figures for student admissions applicable to the 1999-2000 school year
as of May 1999
APPLICATIONS INVITED
Four-year old Program 1,317 957Three-year old Program 115 112______ ______Total 1,432 1,069______ ____________ ______
Source: KS Preschools Principal’s Report for the 1999-2000 school year
P A R T N E R I N G R E S O U R C E SPartnering to increase resources, the Kamehameha
Schools Preschool Division – in conjunction with the
Queen Lili‘uokalani Children’s Center and the
Waimanalo Homestead Association – broke ground
in February for a new facility at Waimanalo with an
estimated completion date of June 2001.
On Moloka‘i, Kamehameha Schools’ new
preschool classroom at the multi-purpose service
center Kulana ‘Ôiwi was completed. The complex
houses Kamehameha Schools’ Kalama‘ula Preschool, as well as the Queen Emma
Foundation’s Na Pu‘uwai Clinic which provides hearing screening for Kamehameha
Schools preschoolers and workshops on nutrition.
P R E S C H O O L F I N A N C I A L A I DKamehameha Schools provided $261,678 in need-based financial aid to 469 student
recipients, serving more than 49 percent of Kamehameha Schools’ preschools
population.
H I G H L I G H T STwo more Kamehameha Schools preschools received accreditation by the National
Association for the Education of Young Children (NAEYC). This brings the total
number of KS accredited preschool sites to 23, representing more than one-third of all
accredited preschool programs in the State of Hawai‘i.
20
KS95.1-AnnualReport for Web 5/15/01 2:28 PM Page 23
21
EXTENSION EDUCATION
As part of Kamehameha’s reorganization, an Extension Education Division has been
formed within the Education System to incorporate those programs that reach out to serve
external audiences such as Summer Programs, Grants, and our K-3 Reading Program.
Encouraged by the Schools’ commitment to provide more opportunities to the
community, Extension Education investigated feasible ideas to address this goal. New
proposals and budgets were prepared that will allow for the return to partnerships
with the state Department of Education (DOE) as well as with our own Endowment
Group. Together with the Endowment Group, Extension Education is actively
exploring utilization of Kamehameha Schools’ lands for educational programs.
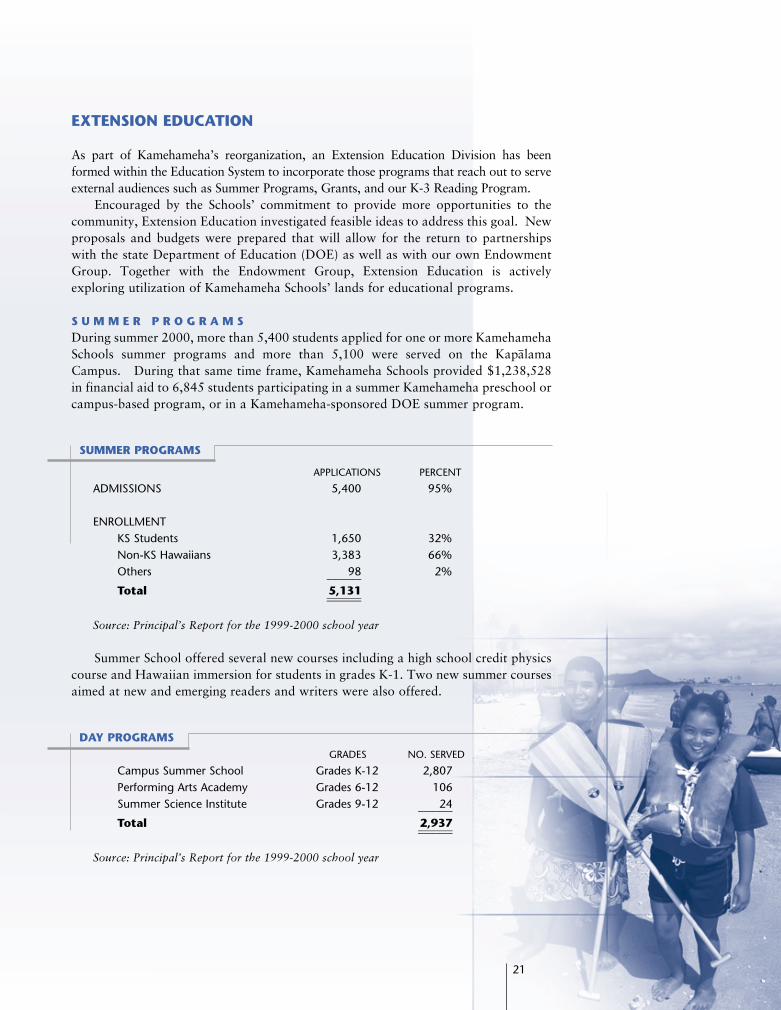
S U M M E R P R O G R A M SDuring summer 2000, more than 5,400 students applied for one or more Kamehameha
Schools summer programs and more than 5,100 were served on the Kapalama
Campus. During that same time frame, Kamehameha Schools provided $1,238,528
in financial aid to 6,845 students participating in a summer Kamehameha preschool or
campus-based program, or in a Kamehameha-sponsored DOE summer program.
SUMMER PROGRAMS
APPLICATIONS PERCENT
ADMISSIONS 5,400 95%
ENROLLMENTKS Students 1,650 32%Non-KS Hawaiians 3,383 66%Others 98 2%______Total 5,131____________
Source: Principal’s Report for the 1999-2000 school year
Summer School offered several new courses including a high school credit physics
course and Hawaiian immersion for students in grades K-1. Two new summer courses
aimed at new and emerging readers and writers were also offered.
DAY PROGRAMSGRADES NO. SERVED
Campus Summer School Grades K-12 2,807Performing Arts Academy Grades 6-12 106Summer Science Institute Grades 9-12 24______Total 2,937____________
Source: Principal’s Report for the 1999-2000 school year
KS95.1-AnnualReport for Web 5/15/01 2:28 PM Page 24
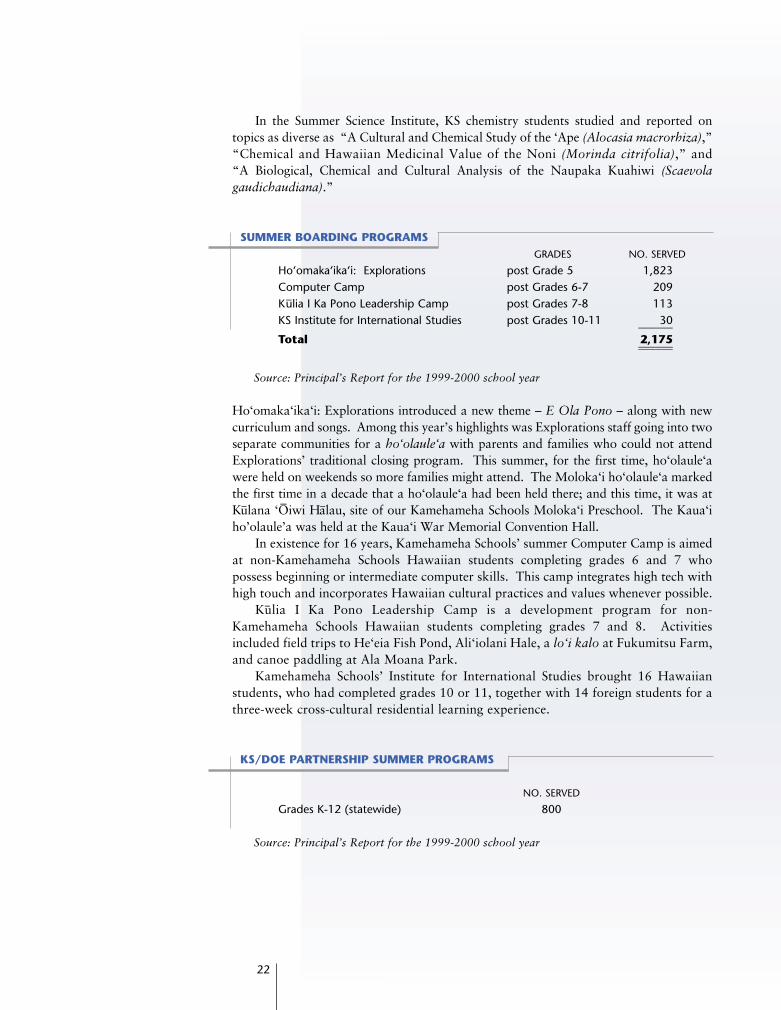
In the Summer Science Institute, KS chemistry students studied and reported on
topics as diverse as “A Cultural and Chemical Study of the ‘Ape (Alocasia macrorhiza),”
“Chemical and Hawaiian Medicinal Value of the Noni (Morinda citrifolia),” and
“A Biological, Chemical and Cultural Analysis of the Naupaka Kuahiwi (Scaevola
gaudichaudiana).”
SUMMER BOARDING PROGRAMSGRADES NO. SERVED
Ho‘omaka‘ika‘i: Explorations post Grade 5 1,823Computer Camp post Grades 6-7 209Kulia I Ka Pono Leadership Camp post Grades 7-8 113KS Institute for International Studies post Grades 10-11 30______Total 2,175____________
Source: Principal’s Report for the 1999-2000 school year
Ho‘omaka‘ika‘i: Explorations introduced a new theme – E Ola Pono – along with new
curriculum and songs. Among this year’s highlights was Explorations staff going into two
separate communities for a ho‘olaule‘a with parents and families who could not attend
Explorations’ traditional closing program. This summer, for the first time, ho‘olaule‘a
were held on weekends so more families might attend. The Moloka‘i ho‘olaule‘a marked
the first time in a decade that a ho‘olaule‘a had been held there; and this time, it was at
Kulana ‘Ôiwi Halau, site of our Kamehameha Schools Moloka‘i Preschool. The Kaua‘i
ho’olaule’a was held at the Kaua‘i War Memorial Convention Hall.
In existence for 16 years, Kamehameha Schools’ summer Computer Camp is aimed
at non-Kamehameha Schools Hawaiian students completing grades 6 and 7 who
possess beginning or intermediate computer skills. This camp integrates high tech with
high touch and incorporates Hawaiian cultural practices and values whenever possible.
Kulia I Ka Pono Leadership Camp is a development program for non-
Kamehameha Schools Hawaiian students completing grades 7 and 8. Activities
included field trips to He‘eia Fish Pond, Ali‘iolani Hale, a lo‘i kalo at Fukumitsu Farm,
and canoe paddling at Ala Moana Park.
Kamehameha Schools’ Institute for International Studies brought 16 Hawaiian
students, who had completed grades 10 or 11, together with 14 foreign students for a
three-week cross-cultural residential learning experience.
KS/DOE PARTNERSHIP SUMMER PROGRAMS
NO. SERVED
Grades K-12 (statewide) 800
Source: Principal’s Report for the 1999-2000 school year
22
KS95.1-AnnualReport for Web 5/15/01 2:28 PM Page 25
23
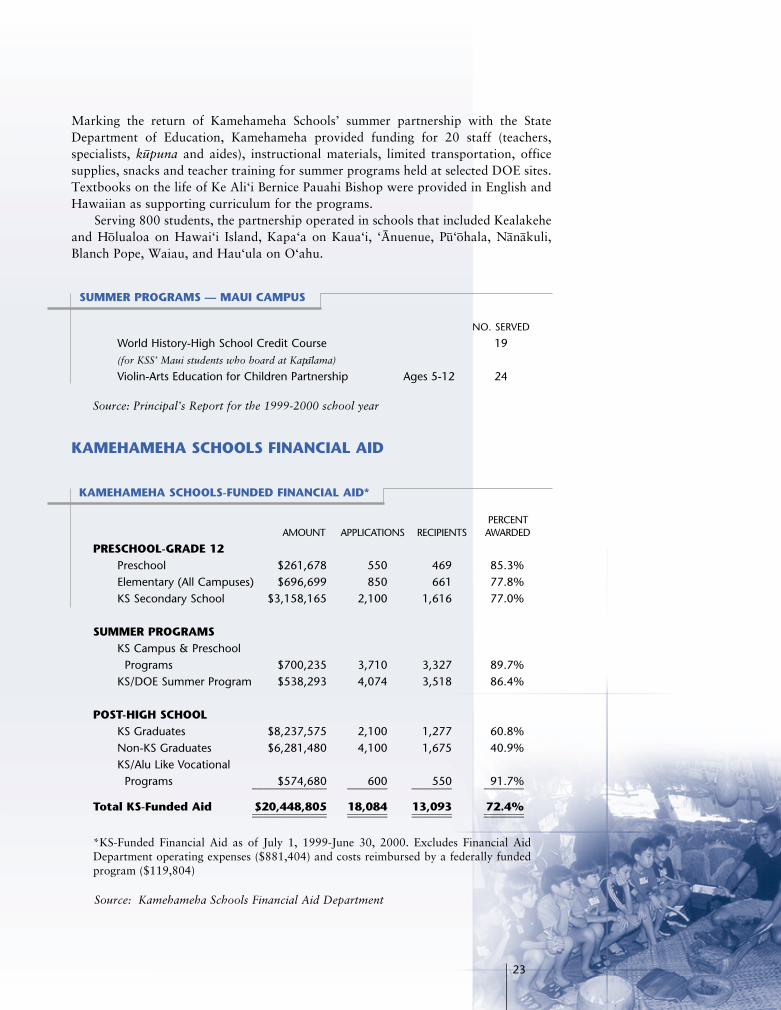
Marking the return of Kamehameha Schools’ summer partnership with the State
Department of Education, Kamehameha provided funding for 20 staff (teachers,
specialists, kupuna and aides), instructional materials, limited transportation, office
supplies, snacks and teacher training for summer programs held at selected DOE sites.
Textbooks on the life of Ke Ali‘i Bernice Pauahi Bishop were provided in English and
Hawaiian as supporting curriculum for the programs.
Serving 800 students, the partnership operated in schools that included Kealakehe
and Holualoa on Hawai‘i Island, Kapa‘a on Kaua‘i, ‘Ânuenue, Pu‘ohala, Nanakuli,
Blanch Pope, Waiau, and Hau‘ula on O‘ahu.
SUMMER PROGRAMS — MAUI CAMPUS
NO. SERVED
World History-High School Credit Course 19(for KSS’ Maui students who board at Kapalama)
Violin-Arts Education for Children Partnership Ages 5-12 24
Source: Principal’s Report for the 1999-2000 school year
KAMEHAMEHA SCHOOLS FINANCIAL AID
KAMEHAMEHA SCHOOLS-FUNDED FINANCIAL AID*
PERCENTAMOUNT APPLICATIONS RECIPIENTS AWARDED
PRESCHOOL-GRADE 12Preschool $261,678 550 469 85.3%Elementary (All Campuses) $696,699 850 661 77.8%KS Secondary School $3,158,165 2,100 1,616 77.0%
SUMMER PROGRAMSKS Campus & Preschool
Programs $700,235 3,710 3,327 89.7%KS/DOE Summer Program $538,293 4,074 3,518 86.4%
POST-HIGH SCHOOLKS Graduates $8,237,575 2,100 1,277 60.8%Non-KS Graduates $6,281,480 4,100 1,675 40.9%KS/Alu Like Vocational
Programs $574,680 600 550 91.7%_____________ _______ _______ _______
Total KS-Funded Aid $20,448,805 18,084 13,093 72.4%_____________ _______ _______ ____________________ _______ _______ _______
*KS-Funded Financial Aid as of July 1, 1999-June 30, 2000. Excludes Financial AidDepartment operating expenses ($881,404) and costs reimbursed by a federally fundedprogram ($119,804)
Source: Kamehameha Schools Financial Aid Department
KS95.1-AnnualReport for Web 5/15/01 2:28 PM Page 26
24
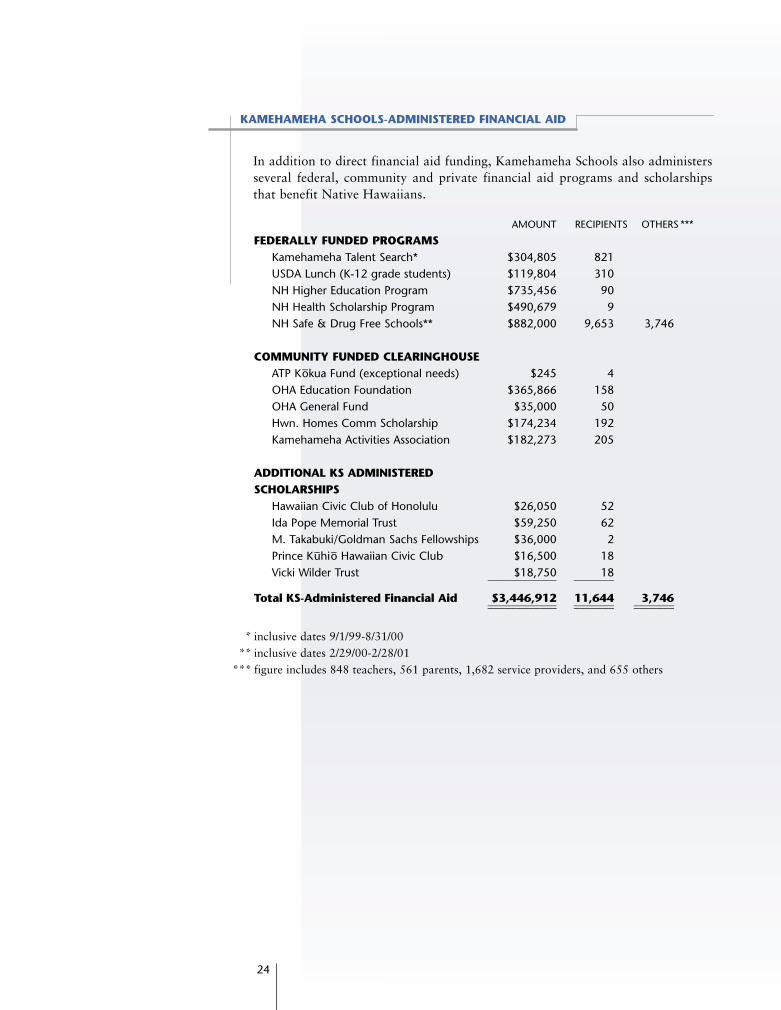
KAMEHAMEHA SCHOOLS-ADMINISTERED FINANCIAL AID
In addition to direct financial aid funding, Kamehameha Schools also administers
several federal, community and private financial aid programs and scholarships
that benefit Native Hawaiians.
AMOUNT RECIPIENTS OTHERS
FEDERALLY FUNDED PROGRAMSKamehameha Talent Search* $304,805 821USDA Lunch (K-12 grade students) $119,804 310NH Higher Education Program $735,456 90NH Health Scholarship Program $490,679 9NH Safe & Drug Free Schools** $882,000 9,653 3,746
COMMUNITY FUNDED CLEARINGHOUSEATP Kokua Fund (exceptional needs) $245 4OHA Education Foundation $365,866 158OHA General Fund $35,000 50Hwn. Homes Comm Scholarship $174,234 192Kamehameha Activities Association $182,273 205
ADDITIONAL KS ADMINISTERED SCHOLARSHIPS
Hawaiian Civic Club of Honolulu $26,050 52Ida Pope Memorial Trust $59,250 62M. Takabuki/Goldman Sachs Fellowships $36,000 2Prince Kuhio Hawaiian Civic Club $16,500 18Vicki Wilder Trust $18,750 18____________ _______
Total KS-Administered Financial Aid $3,446,912 11,644 3,746____________ _______ ___________________ _______ _______
inclusive dates 9/1/99-8/31/00
inclusive dates 2/29/00-2/28/01
figure includes 848 teachers, 561 parents, 1,682 service providers, and 655 others
***
*
**
***
KS95.1-AnnualReport for Web 5/15/01 2:28 PM Page 27

“I‘auhe‘e o Ka‘uiki i ka wai ‘ole
Ka‘uiki was defeated for lack of
water. (Without needed supplies
we cannot win.)”
— ‘O–
lelo No‘eau
Ho‘olakoT O P R O V I D E
KS95.1-AnnualReport for Web 5/15/01 2:28 PM Page 28
E N D O W M E N T O V E R V I E W
The fiscal year ended June 2000 saw many positive changes to the
Kamehameha Schools (KS) endowment. In particular, KS completed its
most recent Investment Policy review that sets a path for supporting
current and future educational spending.
The impetus for reviewing KS’ Investment Policy was related to the
comprehensive strategic planning process. In particular, KS sought to satisfy one of
its stipulations calling for the strategic planning project to involve “…the
development of an educational plan in conjunction with an investment plan…” “The
investment plan should be fashioned to meet projected educational needs.” Further
“the investment plan should take into account diversification (including thoughtful
goal-oriented asset allocation), risk (including income volatility)…”
Critical to developing the Investment Policy, therefore, was the development of
KS’ current asset allocation. The asset allocation decision is one of the key drivers of
successful investment performance. The fundamental asset allocation decision — the
asset classes to include in the portfolio and their normal weights — is one of the most
important decisions in the entire investment process. While active shifting of the asset
weights, the selection of specific securities and the choice of the investment manager
matter, the relative performance of various portfolios is generally governed by their
asset allocation structures.
Kamehameha Schools’ new investment policy breaks endowment assets into two
component parts: core assets, which include all Hawaiian real estate, and non-core
assets, which include all other investments, primarily marketable securities. The
objectives of the core assets are to: (1) produce a sustainable net income stream of at
least 4% that increases at least at the rate of inflation over time and (2) earn an average
annual real total return of at least 5% per year. The objectives of the non-core assets
are to (1) earn a 5% or higher average annual real rate of return, (2) provide adequate
liquidity to meet the school’s spending requirements, and (3) to provide diversification
in case of a decline in Core Asset’s income.
The new targeted asset allocation and actual percentage as of June 30, 2000 for
KS’ non-core assets appear in the table on page 27.
26
Ho‘olakoT O P R O V I D E
KS95.1-AnnualReport for Web 5/15/01 2:28 PM Page 29
27
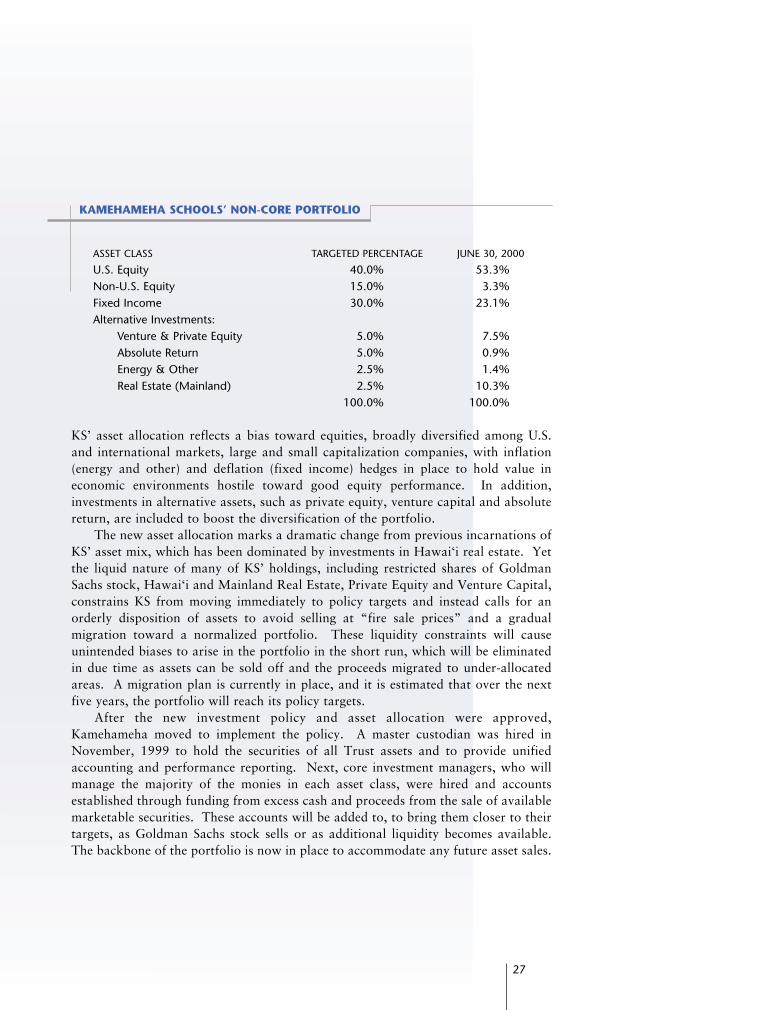
KAMEHAMEHA SCHOOLS’ NON-CORE PORTFOLIO
ASSET CLASS TARGETED PERCENTAGE JUNE 30, 2000
U.S. Equity 40.0% 53.3%Non-U.S. Equity 15.0% 3.3%Fixed Income 30.0% 23.1%Alternative Investments:
Venture & Private Equity 5.0% 7.5% Absolute Return 5.0% 0.9% Energy & Other 2.5% 1.4% Real Estate (Mainland) 2.5% 10.3%
100.0% 100.0%
KS’ asset allocation reflects a bias toward equities, broadly diversified among U.S.
and international markets, large and small capitalization companies, with inflation
(energy and other) and deflation (fixed income) hedges in place to hold value in
economic environments hostile toward good equity performance. In addition,
investments in alternative assets, such as private equity, venture capital and absolute
return, are included to boost the diversification of the portfolio.
The new asset allocation marks a dramatic change from previous incarnations of
KS’ asset mix, which has been dominated by investments in Hawai‘i real estate. Yet
the liquid nature of many of KS’ holdings, including restricted shares of Goldman
Sachs stock, Hawai‘i and Mainland Real Estate, Private Equity and Venture Capital,
constrains KS from moving immediately to policy targets and instead calls for an
orderly disposition of assets to avoid selling at “fire sale prices” and a gradual
migration toward a normalized portfolio. These liquidity constraints will cause
unintended biases to arise in the portfolio in the short run, which will be eliminated
in due time as assets can be sold off and the proceeds migrated to under-allocated
areas. A migration plan is currently in place, and it is estimated that over the next
five years, the portfolio will reach its policy targets.
After the new investment policy and asset allocation were approved,
Kamehameha moved to implement the policy. A master custodian was hired in
November, 1999 to hold the securities of all Trust assets and to provide unified
accounting and performance reporting. Next, core investment managers, who will
manage the majority of the monies in each asset class, were hired and accounts
established through funding from excess cash and proceeds from the sale of available
marketable securities. These accounts will be added to, to bring them closer to their
targets, as Goldman Sachs stock sells or as additional liquidity becomes available.
The backbone of the portfolio is now in place to accommodate any future asset sales.
KS95.1-AnnualReport for Web 5/15/01 2:28 PM Page 30
28
30.00%
25.00%
20.00%
15.00%
10.00%
5.00%
0.00%Hawaii Real
Estate U.S. Equity Non-U.S.Equity Fixed Income Venture &
Private EquityAbsoluteReturn
Energy &Other
Real Estate(Mainland)
TotalEndowment
Actual
Benchmark 1
Benchmark 2
9.03% 26.38% 24.65% 6.02% 23.40% 8.25% 24.76% 6.79% 14.69%
8.90% 9.59% 21.18% 4.56% 14.07% 12.01% 8.90% 14.78% 8.90%
9.48%
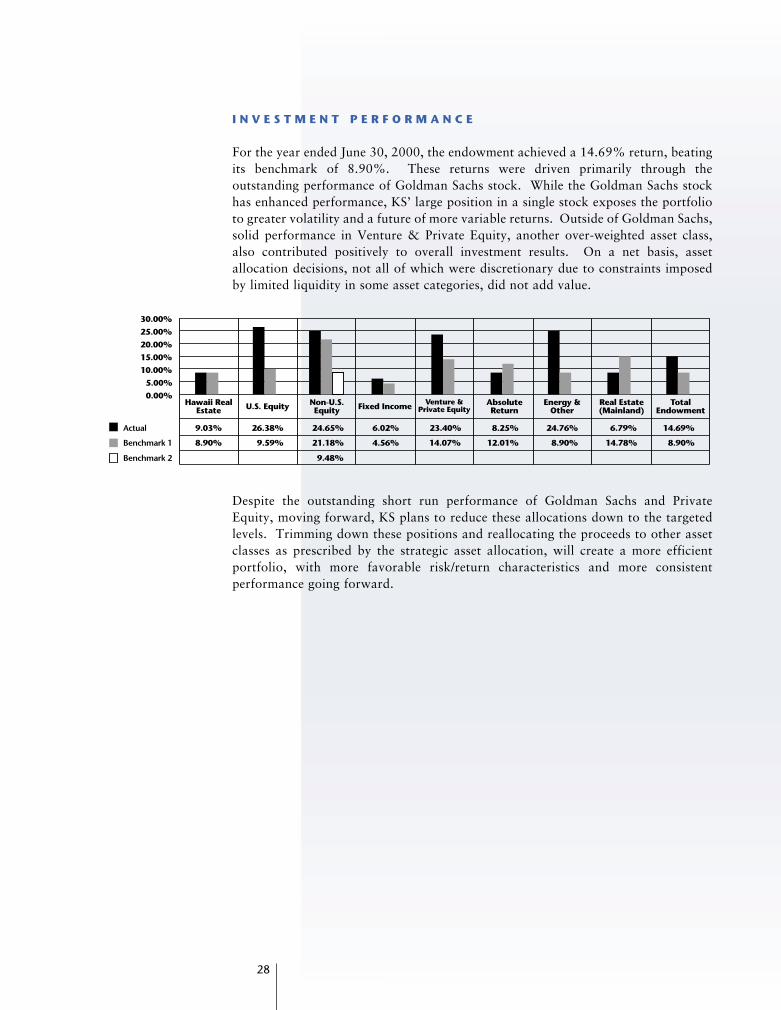
I N V E S T M E N T P E R F O R M A N C E
For the year ended June 30, 2000, the endowment achieved a 14.69% return, beating
its benchmark of 8.90%. These returns were driven primarily through the
outstanding performance of Goldman Sachs stock. While the Goldman Sachs stock
has enhanced performance, KS’ large position in a single stock exposes the portfolio
to greater volatility and a future of more variable returns. Outside of Goldman Sachs,
solid performance in Venture & Private Equity, another over-weighted asset class,
also contributed positively to overall investment results. On a net basis, asset
allocation decisions, not all of which were discretionary due to constraints imposed
by limited liquidity in some asset categories, did not add value.
Despite the outstanding short run performance of Goldman Sachs and Private
Equity, moving forward, KS plans to reduce these allocations down to the targeted
levels. Trimming down these positions and reallocating the proceeds to other asset
classes as prescribed by the strategic asset allocation, will create a more efficient
portfolio, with more favorable risk/return characteristics and more consistent
performance going forward.
KS95.1-AnnualReport for Web 5/15/01 2:28 PM Page 31

Helu WaiwaiI N V E N T O R Y
“I give, devise and bequeath all of the rest, residue
and remainder of my estate real and personal,
wherever situated unto the trustees below named,
their heirs and assigns forever…to erect and maintain
in the Hawaiian Islands two schools…to be known
as…the Kamehameha Schools.”
— Ke Ali‘i Bernice Pauahi BishopExcerpt from The Will andCodicils of Bernice Pauahi BishopOctober 31, 1883
KS95.1-AnnualReport for Web 5/15/01 2:28 PM Page 32
D I S C U S S I O N O F F I N A N C I A L R E S U L T SDuring the 1999-2000 fiscal year, Kamehameha Schools establishedcritical financial policies and processes that will better position theorganization to implement its Strategic Plan. These initiatives — coupledwith solid investment performance — have strengthened Kamehameha’sfinancial position and its ability to further extend the reach of BernicePauahi Bishop’s legacy.
Major financial initiatives for 1999-2000 fiscal year included:
C O M M I T M E N T O F R E S O U R C E S F O R E D U C A T I O N A L P R O G R A M SIn August 1999, the Interim Trustees adopted a Spending Policy mandating the Trust’sannual distributions from the endowment in support of Kamehameha’s educationalpurpose. This policy targets annual distributions at 4% of the average market value ofthe endowment plus the net income generated from agriculture and conservation lands.
The Spending Policy also provides for actual trust distributions to vary annually ina range of 2.5% to 6.0% of the value of the endowment, depending on its market valueat the time. Since this is a newly adopted policy, Kamehameha anticipates that it willtake time to increase trust distributions to the 4% targeted level. Total trust spendingfor the year ended June 30, 2000 — approximately $133 million — represented nearly2.8% of the five-year average market value of the endowment.
Resources during the year were primarily allocated to Kamehameha’s campus-based programs at Kapalama, Maui and East Hawai‘i ($27 million), financial aid andpost-high school scholarships ($21 million) and early education programs ($8 million).Capital and major repair projects, a portion of which relates to the Maui and EastHawai‘i campuses, accounted for approximately $25 million of the resources spent oneducation during the year. Remaining funds were allocated to a variety of programsand functions that support Kamehameha’s overall educational system.
See the “Ho‘ona‘auao — To Educate” section on page 10 for further details on theeducational programs and numbers served in the fiscal year.
B E N C H M A R K E D I N V E S T M E N T P E R F O R M A N C EDuring the year, the Interim Trustees also adopted a new Investment Policy thatestablishes long- and intermediate-term investment objectives, asset allocation targetsand performance measurement guidelines for the endowment. The overall long-terminvestment objective of the endowment is to earn an average annual real return (net ofinflation) of 5%. With the implementation of this new policy and the migration towardthe asset allocation targets, Kamehameha’s investment return was approximately 15%for the year — exceeding established benchmarks.
In accordance with industry standards, Kamehameha is migrating towardimplementing the Association for Investment Management and Research (AIMR)standards of investment reporting. This process is expected to take several years to fullyimplement primarily because Kamehameha’s vast real estate holdings — under thesestandards — will require independent appraisal at least every three years. The process
30
Helu WaiwaiI N V E N T O R Y
KS95.1-AnnualReport for Web 5/15/01 2:28 PM Page 33
31
of appraising Kamehameha’s Hawai‘i real estate holdings, begun this year, anticipatescompliance with AIMR standards by the end of fiscal 2003.
See “Ho‘olako — To Provide” section on page 26 for further details of investmentperformance for the year.
L I Q U I D I T Y A N D C A P I T A L R E S O U R C E SKamehameha believes its ability to generate cash — both internally from its investmentsand operations and externally from debt issues — is adequate to maintain sufficientliquidity to fund operating and capital projects, cover debt, and meet other cashrequirements in the foreseeable future.
To strengthen Kamehameha Schools’ ability to achieve appropriate levels ofliquidity and other related objectives, this institution adopted a debt policy during theyear. This policy establishes guidelines that limit the amount of debt Kamehamehamay carry to 10 — 20% of the fair market value of the endowment. The debt policyalso defines requirements and parameters for the utilization of debt financing andother appropriate considerations. As of June 30, 2000, Kamehameha’s debt and debtrelated guarantees represented only approximately 4.5% of the fair market value ofthe endowment.
Along with the adoption of the debt policy came the requirement to address debtarrangements not currently in compliance with the policy. Management is workingdiligently to restructure and possibly eliminate arrangements that do not meet theobjectives of the new policy.
P R O G R E S S T O W A R D S E S T A B L I S H I N G B A S E L I N E F I N A N C I A L I N F O R M A T I O NThe change in Kamehameha Schools’ governance structure and policy led to a newmanagement team committed to establishing “baseline” financial information to beused in decision making and in the evaluation of program and investmentperformance. This process — involving analysis of financial statements and methodsused to account for the assets and activities of Kamehameha Schools — resulted inseveral prior-period financial statement adjustments totaling approximately $211million. The evaluation determined that certain assets were impaired by approximately$49 million and adjusted the financial statements to reflect these assets at their fairvalue as of June 30, 2000. These adjustments are more fully discussed in Notes 5, 6and 16 to the Consolidated Financial Statements.
With these corrections made, management now has a starting point of baselinefinancial information to further evaluate the performance of the schools’ educationalprograms and investment activities. Management is now engaged in this process.
An institution-wide cost structure evaluation is currently underway that, whencompleted, will benchmark costs with other institutions. Once benchmarked, this coststructure will be overlaid with the goals established in the Strategic Plan to determinehow Kamehameha’s historical allocation of resources aligns with the new goals. Inaddition, management is engaged in evaluating the cost per student for each programso that future resources may be allocated in accordance with the priorities and desiredoutcomes of the Strategic Plan. On the endowment side, management is reportinginvestment performance against defined benchmarks and migrating to full compliancewith AIMR investment reporting standards.
These are exciting times for Kamehameha as the institution looks to expandingeducational opportunities for Native Hawaiians in a prudent manner with definedperformance outcomes and objectives, and Management now has the informationnecessary to move in this direction.
KS95.1-AnnualReport for Web 5/15/01 2:28 PM Page 34
F I N A N C I A L R E S U L T SKamehameha posted solid financial results for the year ended June 30, 2000. Thefollowing is a review of the financial position, statement of activities and cash flows forthe 1999-2000 fiscal year:
• FINANCIAL POSITION During the 1999-2000 fiscal year, net assets increased byapproximately 27% to nearly $3.3 billion. The majority of this increase wasattributable to gains from the investment portfolio primarily relating toKamehameha’s investment in Goldman Sachs. Gains and investment income fromthis investment amounted to approximately $613 million.
Notes payable amounted to $253 million at June 30, 2000, includingapproximately $95 million in commercial paper. Kamehameha Schools’commercial paper has received the highest credit ratings from Standard & Poor’sand Moody’s Investors Service’s as of January 2001.
• STATEMENT OF ACTIVITIES The Statement of Activities, which details the revenuesand expenses during the year, reported an increase in net assets of approximately$715 million and prior period adjustments of approximately $211 million. Aspreviously mentioned, the increase in net assets is primarily attributable to positiveinvestment performance during the year. The Schedule of Total Return (Schedule 2)reported an investment return of approximately 15%, which exceeded theestablished benchmark returns for the year.
This statement also reported total direct Educational Programs Expenses ofapproximately $99 million. Direct expenses, capital expenditures, supportfunction costs and other education-related costs constitute Kamehameha Schools’total spending for educational purposes as approximately $133 million, as reportedon the Schedule of Trust Distributions and Spending (Schedule 1). This representsa trust spending rate of approximately 2.8% of the five-year average market valueof the endowment.
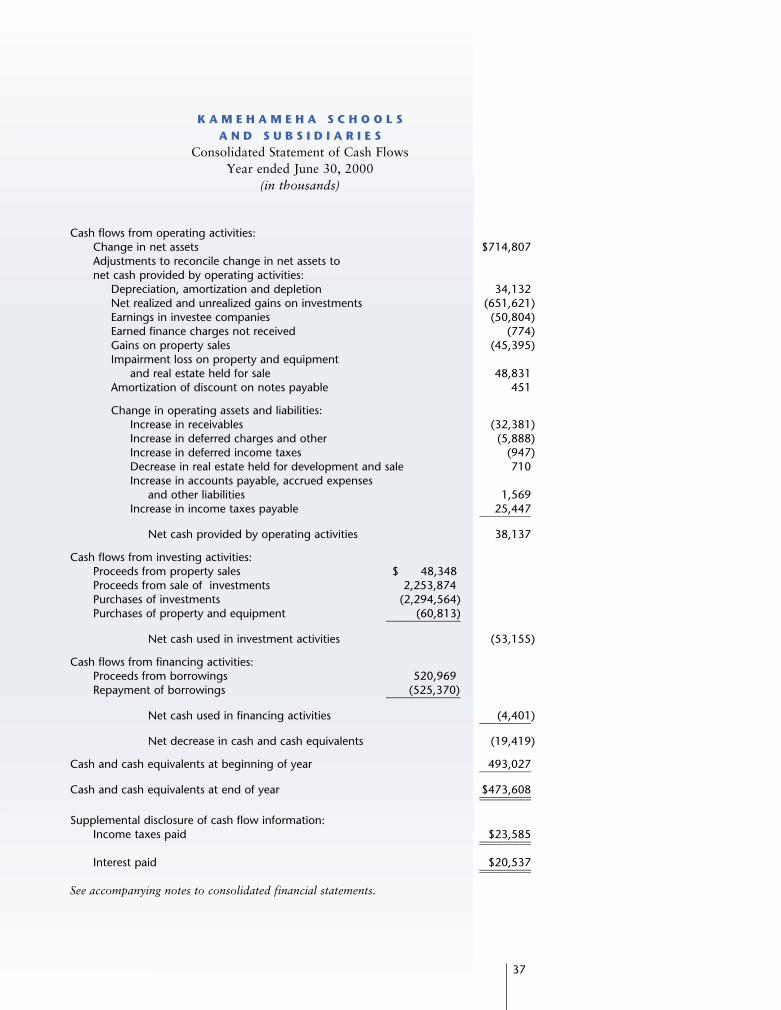
• CASH FLOWS Operating activities provided positive net cash flows ofapproximately $38 million for the year ended June 30, 2000. Kamehameha’sinvestment activities resulted in a net cash outflow of approximately $53 millionprimarily for purchases of investments, property and equipment, which was partlyoffset by proceeds from the sale of investments and property. From a financingstandpoint, there was net cash outflow of approximately $4 million primarily theresult of net paydowns of notes payable.
By any measure, Kamehameha’s financial position was greatly enhanced duringthe 1999-2000 fiscal year. This strong financial position supports Kamehameha’sdesire to expand the reach of Ke Ali‘i Bernice Pauahi Bishop’s legacy as stated inthe Strategic Plan. Kamehameha will continue to build on its financial foundationto meet current needs and, at the same time, protect and increase its resources inorder to enhance its service to future generations of people of Hawaiian ancestrythrough education.
32
KS95.1-AnnualReport for Web 5/15/01 2:28 PM Page 35
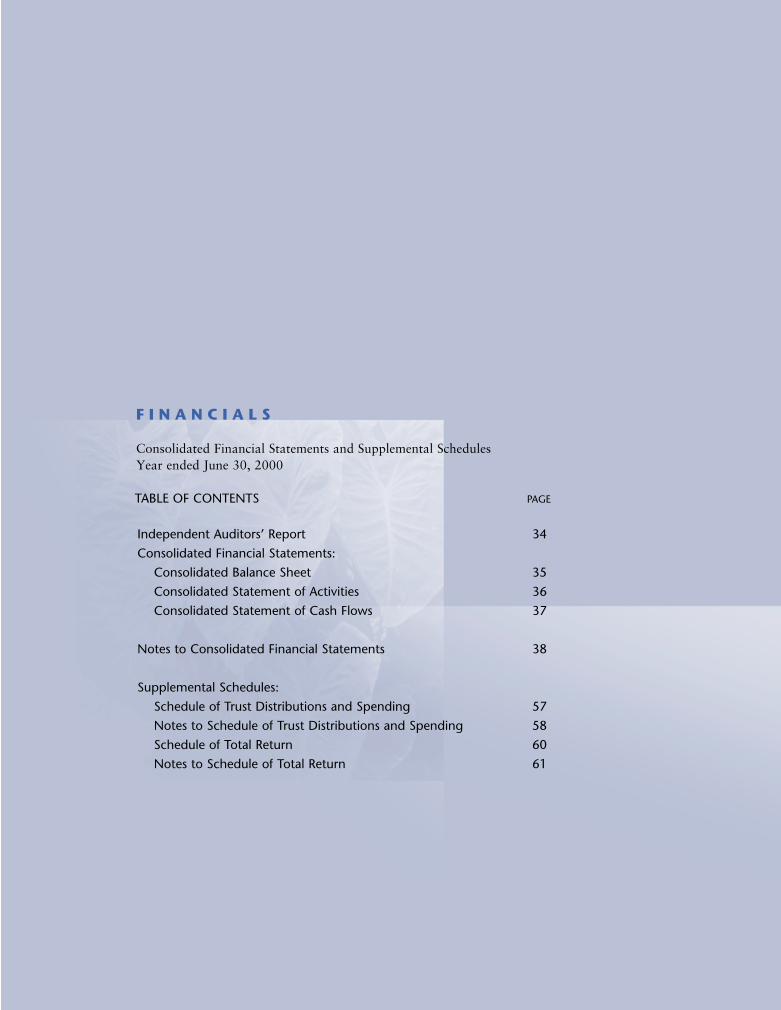
F I N A N C I A L S
Consolidated Financial Statements and Supplemental Schedules
Year ended June 30, 2000
TABLE OF CONTENTS PAGE
Independent Auditors’ Report 34
Consolidated Financial Statements:
Consolidated Balance Sheet 35
Consolidated Statement of Activities 36
Consolidated Statement of Cash Flows 37
Notes to Consolidated Financial Statements 38
Supplemental Schedules:
Schedule of Trust Distributions and Spending 57
Notes to Schedule of Trust Distributions and Spending 58
Schedule of Total Return 60
Notes to Schedule of Total Return 61
KS95.1-AnnualReport for Web 5/15/01 2:28 PM Page 36

34
KS95.1-AnnualReport for Web 5/15/01 2:28 PM Page 37
35
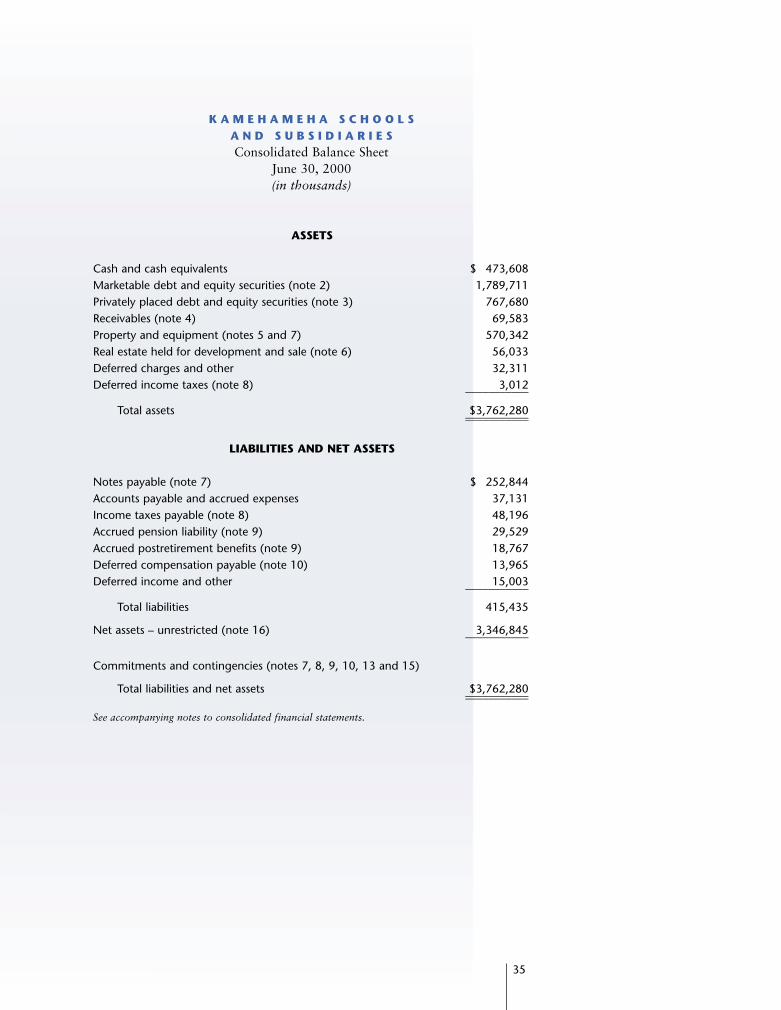
K A M E H A M E H A S C H O O L S A N D S U B S I D I A R I E SConsolidated Balance Sheet
June 30, 2000
(in thousands)
ASSETS
Cash and cash equivalents $ 473,608Marketable debt and equity securities (note 2) 1,789,711Privately placed debt and equity securities (note 3) 767,680Receivables (note 4) 69,583Property and equipment (notes 5 and 7) 570,342Real estate held for development and sale (note 6) 56,033Deferred charges and other 32,311Deferred income taxes (note 8) 3,012___________
Total assets $3,762,280______________________
LIABILITIES AND NET ASSETS
Notes payable (note 7) $ 252,844Accounts payable and accrued expenses 37,131Income taxes payable (note 8) 48,196Accrued pension liability (note 9) 29,529Accrued postretirement benefits (note 9) 18,767Deferred compensation payable (note 10) 13,965Deferred income and other 15,003___________
Total liabilities 415,435
Net assets – unrestricted (note 16) 3,346,845___________
Commitments and contingencies (notes 7, 8, 9, 10, 13 and 15)
Total liabilities and net assets $3,762,280______________________
See accompanying notes to consolidated financial statements.
KS95.1-AnnualReport for Web 5/15/01 2:28 PM Page 38
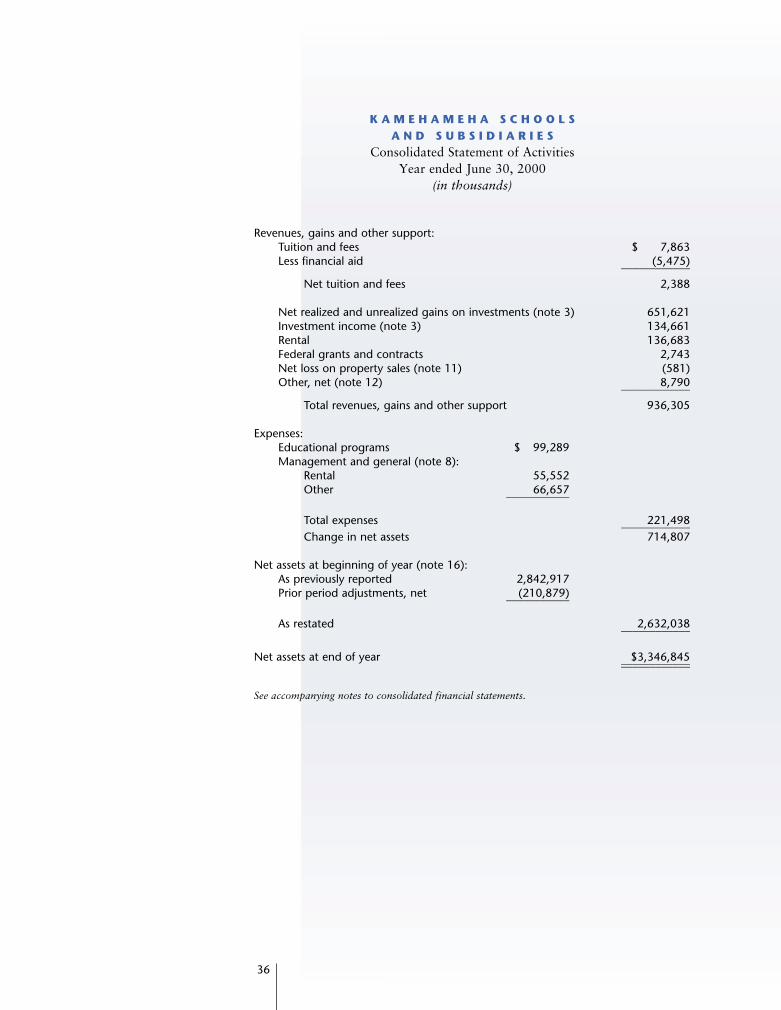
K A M E H A M E H A S C H O O L S A N D S U B S I D I A R I E S
Consolidated Statement of Activities
Year ended June 30, 2000
(in thousands)
Revenues, gains and other support: Tuition and fees $ 7,863Less financial aid (5,475)____________
Net tuition and fees 2,388
Net realized and unrealized gains on investments (note 3) 651,621Investment income (note 3) 134,661Rental 136,683Federal grants and contracts 2,743Net loss on property sales (note 11) (581)Other, net (note 12) 8,790____________
Total revenues, gains and other support 936,305
Expenses:Educational programs $ 99,289Management and general (note 8):
Rental 55,552Other 66,657___________
Total expenses 221,498____________Change in net assets 714,807
Net assets at beginning of year (note 16):As previously reported 2,842,917Prior period adjustments, net (210,879)___________
As restated 2,632,038____________
Net assets at end of year $3,346,845________________________
See accompanying notes to consolidated financial statements.
36
KS95.1-AnnualReport for Web 5/15/01 2:28 PM Page 39
37
K A M E H A M E H A S C H O O L S A N D S U B S I D I A R I E S
Consolidated Statement of Cash Flows
Year ended June 30, 2000
(in thousands)
Cash flows from operating activities:Change in net assets $714,807Adjustments to reconcile change in net assets to net cash provided by operating activities:
Depreciation, amortization and depletion 34,132Net realized and unrealized gains on investments (651,621)Earnings in investee companies (50,804)Earned finance charges not received (774)Gains on property sales (45,395)Impairment loss on property and equipment
and real estate held for sale 48,831Amortization of discount on notes payable 451
Change in operating assets and liabilities:Increase in receivables (32,381)Increase in deferred charges and other (5,888)Increase in deferred income taxes (947)Decrease in real estate held for development and sale 710Increase in accounts payable, accrued expenses
and other liabilities 1,569Increase in income taxes payable 25,447_________
Net cash provided by operating activities 38,137
Cash flows from investing activities:Proceeds from property sales $ 48,348Proceeds from sale of investments 2,253,874Purchases of investments (2,294,564)Purchases of property and equipment (60,813)_____________
Net cash used in investment activities (53,155)
Cash flows from financing activities:Proceeds from borrowings 520,969Repayment of borrowings (525,370)_____________
Net cash used in financing activities (4,401)_________
Net decrease in cash and cash equivalents (19,419)
Cash and cash equivalents at beginning of year 493,027_________
Cash and cash equivalents at end of year $473,608__________________
Supplemental disclosure of cash flow information:Income taxes paid $23,585__________________
Interest paid $20,537__________________
See accompanying notes to consolidated financial statements.
KS95.1-AnnualReport for Web 5/15/01 2:28 PM Page 40
K A M E H A M E H A S C H O O L S A N D S U B S I D I A R I E S
Notes to Consolidated Financial Statements
June 30, 2000
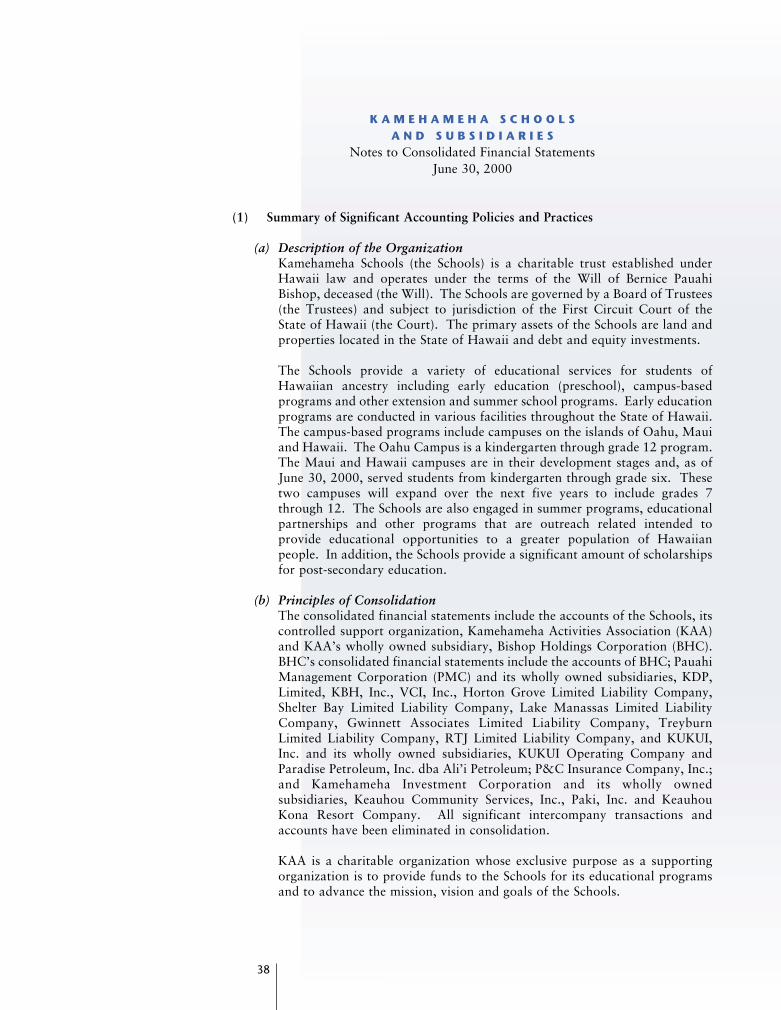
(1) Summary of Significant Accounting Policies and Practices
(a) Description of the OrganizationKamehameha Schools (the Schools) is a charitable trust established underHawaii law and operates under the terms of the Will of Bernice PauahiBishop, deceased (the Will). The Schools are governed by a Board of Trustees(the Trustees) and subject to jurisdiction of the First Circuit Court of theState of Hawaii (the Court). The primary assets of the Schools are land andproperties located in the State of Hawaii and debt and equity investments.
The Schools provide a variety of educational services for students ofHawaiian ancestry including early education (preschool), campus-basedprograms and other extension and summer school programs. Early educationprograms are conducted in various facilities throughout the State of Hawaii.The campus-based programs include campuses on the islands of Oahu, Mauiand Hawaii. The Oahu Campus is a kindergarten through grade 12 program.The Maui and Hawaii campuses are in their development stages and, as ofJune 30, 2000, served students from kindergarten through grade six. Thesetwo campuses will expand over the next five years to include grades 7through 12. The Schools are also engaged in summer programs, educationalpartnerships and other programs that are outreach related intended toprovide educational opportunities to a greater population of Hawaiianpeople. In addition, the Schools provide a significant amount of scholarshipsfor post-secondary education.
(b) Principles of ConsolidationThe consolidated financial statements include the accounts of the Schools, itscontrolled support organization, Kamehameha Activities Association (KAA)and KAA’s wholly owned subsidiary, Bishop Holdings Corporation (BHC).BHC’s consolidated financial statements include the accounts of BHC; PauahiManagement Corporation (PMC) and its wholly owned subsidiaries, KDP,Limited, KBH, Inc., VCI, Inc., Horton Grove Limited Liability Company,Shelter Bay Limited Liability Company, Lake Manassas Limited LiabilityCompany, Gwinnett Associates Limited Liability Company, TreyburnLimited Liability Company, RTJ Limited Liability Company, and KUKUI,Inc. and its wholly owned subsidiaries, KUKUI Operating Company andParadise Petroleum, Inc. dba Ali’i Petroleum; P&C Insurance Company, Inc.;and Kamehameha Investment Corporation and its wholly ownedsubsidiaries, Keauhou Community Services, Inc., Paki, Inc. and KeauhouKona Resort Company. All significant intercompany transactions andaccounts have been eliminated in consolidation.
KAA is a charitable organization whose exclusive purpose as a supportingorganization is to provide funds to the Schools for its educational programsand to advance the mission, vision and goals of the Schools.
38
KS95.1-AnnualReport for Web 5/15/01 2:28 PM Page 41

39
BHC is a taxable holding corporation with subsidiaries involved in propertyinvestment and management. The subsidiaries develop and sell real estate,maintain investments in equity instruments, manage commercial propertieson behalf of the Schools, operate oil and gas properties, and own and operatea hotel. In addition, a subsidiary is a captive insurance company thatprovides property and liability coverage for the Schools and its affiliates.
(c) Basis of Financial Statement PresentationThe Schools’ consolidated financial statements have been prepared on theaccrual basis of accounting, and are presented in conformity with accountingprinciples generally accepted in the United States of America. Net assets,revenues, gains and other support and expenses are classified based on theexistence or absence of donor-imposed restrictions. All net assets of the Schoolsand changes therein are classified and reported as unrestricted net assets.
(d) Cash EquivalentsCash equivalents consist of a liquid asset account offered by an investmentbank and commercial paper with initial terms of less than three months. Forpurposes of the consolidated statement of cash flows, the Schools consider allhighly liquid debt instruments with original maturities of three months or lessto be cash equivalents. The net cash balances maintained in excess ofavailable depository insurance limits amounted to approximately$472,068,000 at June 30, 2000.
(e) InvestmentsMarketable Debt and Equity Securities – The Schools and KAAEquity securities with readily determinable fair values and all investments in debtsecurities are reported at fair value with unrealized gains and losses included inthe consolidated statement of activities. Fair value is based on quoted marketprices and, if applicable, discounted for restrictions on the sale of shares.
Marketable Debt and Equity Securities – BHCDebt and equity securities are classified in one of three categories: trading,available-for-sale, or held-to-maturity. Trading securities are bought andheld principally for the purpose of selling them in the near term. Held-to-maturity securities are those securities in which BHC has the ability andintent to hold the security until maturity. All securities not included intrading or held-to-maturity are classified as available-for-sale.
Trading and available-for-sale securities are recorded at fair value. Held-to-maturity securities are recorded at amortized cost, adjusted for theamortization or accretion of premiums or discounts. Unrealized holdinggains and losses on trading securities are included in earnings. Unrealizedholding gains and losses, net of the related tax effect, on available-for-salesecurities are excluded from earnings and are reported as a separatecomponent of net assets. Realized gains and losses from the sale of available-for-sale securities are determined on a specific identification basis.
At June 30, 2000, debt and equity securities were classified as available-for-sale and were reported at amounts which approximate fair value.
KS95.1-AnnualReport for Web 5/15/01 2:28 PM Page 42
Privately Placed Debt and Equity SecuritiesInvestments in which the Schools own 20% to 50% of the equity interest (5%to 50% for partnership investments) are accounted for primarily on theequity method. Certain limited partnership investments for which theSchools have in excess of 50% interest but do not have control are alsoaccounted for on the equity method. Other investments in which the Schoolshave no significant influence are accounted for at cost.
A decline in the fair value of any available-for-sale, held-to-maturity,privately placed debt or equity securities below cost that is deemed to beother than temporary results in a reduction in carrying amount to fair value.The impairment is charged to earnings and a new cost basis for the securityis established. Premiums and discounts are amortized or accreted over thelife of the related held-to-maturity or available-for-sale security as anadjustment to yield using the effective interest method. Dividend and interestincome are recognized when earned.
(f) Derivative Financial InstrumentsBHC enters into various commodity price hedging contracts with respect toits oil and gas production. While the use of these hedging agreements limitsthe downside risk of adverse price movements, they may also limit futurerevenue from favorable price movements. The use of hedging transactionsalso involves the risk that the counterparties will be unable to meet thefinancial terms of such transactions. The derivative financial instrumentsheld by BHC are principally held for purposes other than trading. Suchcontracts are accounted for as hedges in accordance with Statement ofFinancial Accounting Standards (“SFAS”) No. 80, Accounting for FutureContracts. Gains and losses on these contracts are recognized in revenue inthe period in which the underlying production is delivered. These instrumentsare measured for correlation at both the inception of the contract and on anongoing basis. If these instruments cease to meet the criteria for deferralaccounting, any subsequent gains and losses are recognized in revenue.Neither the hedging contracts nor the unrealized gains or losses on thecontracts are recognized in the consolidated financial statements.
In June 1998, the Financial Accounting Standards Board (FASB) issued SFASNo. 133, Accounting for Derivative Instruments and Hedging Activities. InJune 2000, the FASB issued SFAS No. 138, Accounting for CertainDerivative Instruments and Certain Hedging Activities, an Amendment toSFAS 133. SFAS Nos. 133 and 138 are effective for fiscal years beginningafter June 30, 2000, and establishes accounting and reporting standards forderivative instruments, including certain derivative instruments embedded inother contracts (collectively referred to as derivatives), and for hedgingactivities, and require such derivative instruments be recorded on thebalance sheet date at their respective fair values. BHC plans to adopt thisStatement in fiscal 2001.
(g) ReceivablesNotes receivable consist primarily of receivables from the sale of residentialleasehold lots to lessees under the single-family and multi-family residentialland sales program, mortgage agreements from the sale of real estate to
40
KS95.1-AnnualReport for Web 5/15/01 2:28 PM Page 43
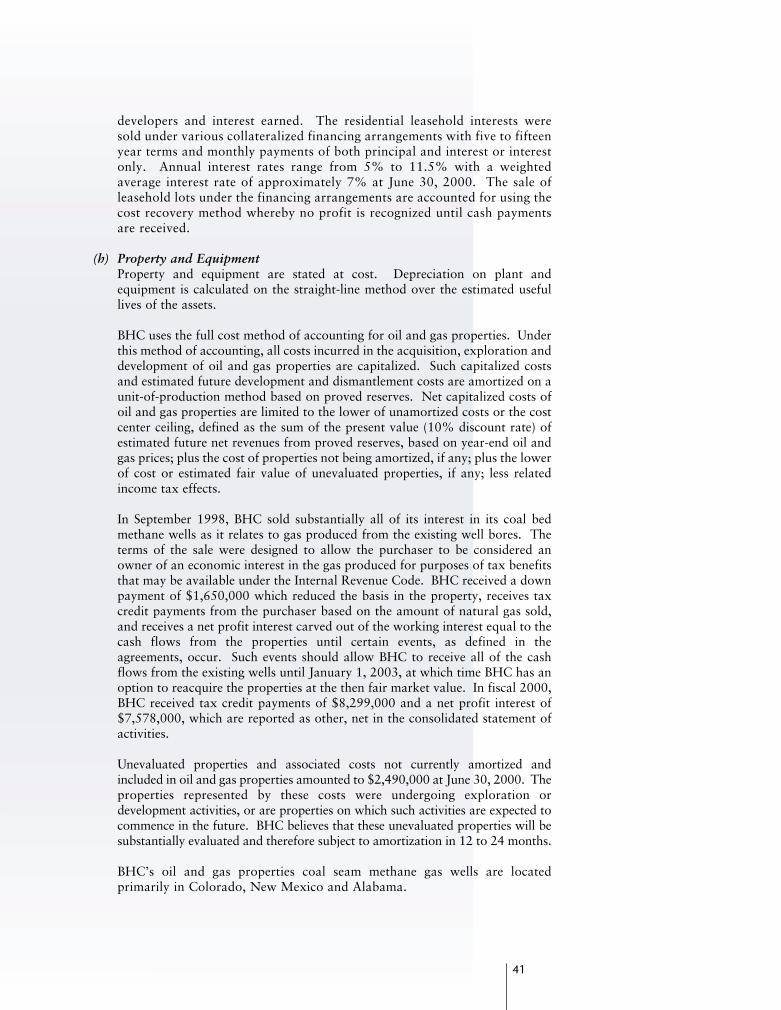
41
developers and interest earned. The residential leasehold interests weresold under various collateralized financing arrangements with five to fifteenyear terms and monthly payments of both principal and interest or interestonly. Annual interest rates range from 5% to 11.5% with a weightedaverage interest rate of approximately 7% at June 30, 2000. The sale ofleasehold lots under the financing arrangements are accounted for using thecost recovery method whereby no profit is recognized until cash paymentsare received.
(h) Property and EquipmentProperty and equipment are stated at cost. Depreciation on plant andequipment is calculated on the straight-line method over the estimated usefullives of the assets.
BHC uses the full cost method of accounting for oil and gas properties. Underthis method of accounting, all costs incurred in the acquisition, exploration anddevelopment of oil and gas properties are capitalized. Such capitalized costsand estimated future development and dismantlement costs are amortized on aunit-of-production method based on proved reserves. Net capitalized costs ofoil and gas properties are limited to the lower of unamortized costs or the costcenter ceiling, defined as the sum of the present value (10% discount rate) ofestimated future net revenues from proved reserves, based on year-end oil andgas prices; plus the cost of properties not being amortized, if any; plus the lowerof cost or estimated fair value of unevaluated properties, if any; less relatedincome tax effects.
In September 1998, BHC sold substantially all of its interest in its coal bedmethane wells as it relates to gas produced from the existing well bores. Theterms of the sale were designed to allow the purchaser to be considered anowner of an economic interest in the gas produced for purposes of tax benefitsthat may be available under the Internal Revenue Code. BHC received a downpayment of $1,650,000 which reduced the basis in the property, receives taxcredit payments from the purchaser based on the amount of natural gas sold,and receives a net profit interest carved out of the working interest equal to thecash flows from the properties until certain events, as defined in theagreements, occur. Such events should allow BHC to receive all of the cashflows from the existing wells until January 1, 2003, at which time BHC has anoption to reacquire the properties at the then fair market value. In fiscal 2000,BHC received tax credit payments of $8,299,000 and a net profit interest of$7,578,000, which are reported as other, net in the consolidated statement ofactivities.
Unevaluated properties and associated costs not currently amortized andincluded in oil and gas properties amounted to $2,490,000 at June 30, 2000. Theproperties represented by these costs were undergoing exploration ordevelopment activities, or are properties on which such activities are expected tocommence in the future. BHC believes that these unevaluated properties will besubstantially evaluated and therefore subject to amortization in 12 to 24 months.
BHC’s oil and gas properties coal seam methane gas wells are locatedprimarily in Colorado, New Mexico and Alabama.
KS95.1-AnnualReport for Web 5/15/01 2:28 PM Page 44

(i) Real Estate Held for Development and SaleBHC’s real estate assets held for development and sale are stated at cost orfair value less costs to sell. Cost includes land acquisition and holding costs,site development, construction and other project related costs. If, in futureperiods, there are changes in the estimates or assumptions, the changes couldresult in an adjustment to the carrying amount of the real estate.
Sales of real estate are recorded and income recognized when the buyer’spayments and underlying commitment are sufficient to provide economicsubstance to recognize the sale. Costs are charged to cost of sales on the basisof the relative sales value of the units sold to the total sales value of all unitsin the project.
(j) VacationProfessional teaching employees are employed under one-year contracts forschool years ending in mid-August. School years comprise a “teachingperiod” from mid-August to mid-June and a “professional improvementperiod” for the balance of the year.
Vacations for these employees are provided during the professionalimprovement period. Substantially all the Schools’ employees, except forprofessional teaching employees, earn vacation benefits and are entitled toreceive payments for unused vacation benefits based upon their regular salaryat the time of their termination of employment.
(k) Employee Benefits and Postretirement PlansThe Schools have a defined benefit pension plan covering substantially all ofits employees, including employees of BHC. The benefits are based on yearsof service and the employee’s compensation. The cost of this program isbeing funded currently.
The Schools also sponsor a defined benefit health care plan for substantiallyall retirees and employees. The Schools measure the costs of its obligationbased on its best estimate. The net periodic costs are recognized as employeesrender the services necessary to earn the postretirement benefits.
The Schools and BHC have employee savings and profit sharing plans underSection 403(b) and Section 401(k), respectively, of the Internal RevenueCode. The plans cover substantially all the Schools’ and BHC employeesafter satisfying service requirements. Under these plans, participatingemployees may defer up to 20% and 15% of their pretax earnings,respectively, for Section 403(b) and Section 401(k). There were no employercontributions for fiscal 2000.
(l) Deferred IncomeDeferred income consists primarily of prepaid lease rents, which are deferredand recognized as income ratably over the fixed term of the leases to whichthey relate.
42
KS95.1-AnnualReport for Web 5/15/01 2:28 PM Page 45
43
(m) Income TaxesIn a ruling dated February 9, 1939, and as reaffirmed in 1969, 1986 and2000, the Internal Revenue Service (IRS) determined that the Schools wereexempt from federal income tax under Section 501(c)(3) of the InternalRevenue Code, as an organization organized and operated for educationalpurposes within the meaning of Section 170(b)(1)(A)(ii) of the InternalRevenue Code. KAA is also exempt from federal income tax under Section501(c)(3) of the Internal Revenue Code. To the extent that the Schools andKAA receive unrelated business income, such earnings are subject tounrelated business income tax.
Income taxes for BHC and KAA are accounted for under the asset andliability method. Deferred tax assets and liabilities are recognized for thefuture tax consequences attributable to differences between the financialstatement carrying amounts of existing assets and liabilities and theirrespective tax bases and operating loss and tax credit carryforwards.Deferred tax assets and liabilities are measured using enacted tax ratesexpected to apply to taxable income in the years in which those temporarydifferences are expected to be recovered or settled. The effect on deferred taxassets and liabilities of a change in tax rates is recognized in income in theperiod that includes the enactment date.
(n) Use of EstimatesManagement has made a number of estimates and assumptions relating to thereporting of assets and liabilities and the disclosure of contingent assets andliabilities to prepare these consolidated financial statements in conformitywith accounting principles generally accepted in the United States of America.Actual results could differ from those estimates.
(o) Impairment of Long Lived Assets and Long Lived Assets to Be Disposed OfSFAS No. 121, Accounting for the Impairment of Long-Lived Assets andLong-Lived Assets to Be Disposed Of, requires that long-lived assets andcertain identifiable intangibles be reviewed for impairment whenever eventsor changes in circumstances indicate that the carrying amount of an assetmay not be recoverable. Recoverability of assets to be held and used ismeasured by a comparison of the carrying amount of an asset to future netcash flows expected to be generated by the asset. If such assets are consideredto be impaired, the impairment to be recognized is measured by the amountby which the carrying amount of the assets exceeds the fair value of theassets. Assets to be disposed of are reported at the lower of the carryingamount or fair value less costs to sell.
(p) Commitments and ContingenciesLiabilities for loss contingencies, including environmental remediation costs,arising from claims, assessments, litigation, fines and penalties and othersources are recorded when it is probable that a liability has been incurred andthe amount of the assessment and/or remediation can be reasonably estimated.
KS95.1-AnnualReport for Web 5/15/01 2:28 PM Page 46
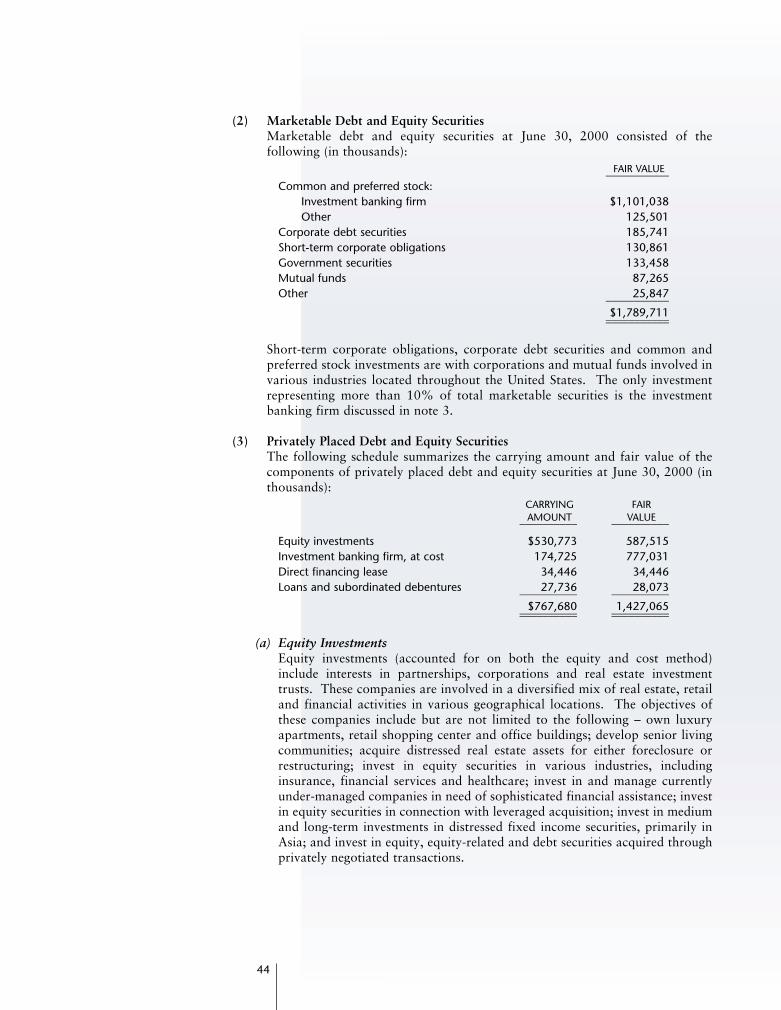
(2) Marketable Debt and Equity SecuritiesMarketable debt and equity securities at June 30, 2000 consisted of thefollowing (in thousands):
FAIR VALUE___________Common and preferred stock:
Investment banking firm $1,101,038Other 125,501
Corporate debt securities 185,741Short-term corporate obligations 130,861Government securities 133,458Mutual funds 87,265Other 25,847___________
$1,789,711______________________
Short-term corporate obligations, corporate debt securities and common andpreferred stock investments are with corporations and mutual funds involved invarious industries located throughout the United States. The only investmentrepresenting more than 10% of total marketable securities is the investmentbanking firm discussed in note 3.
(3) Privately Placed Debt and Equity SecuritiesThe following schedule summarizes the carrying amount and fair value of thecomponents of privately placed debt and equity securities at June 30, 2000 (inthousands):
CARRYING FAIRAMOUNT VALUE__________ __________
Equity investments $530,773 587,515Investment banking firm, at cost 174,725 777,031Direct financing lease 34,446 34,446Loans and subordinated debentures 27,736 28,073__________ __________
$767,680 1,427,065__________ ____________________ __________
(a) Equity InvestmentsEquity investments (accounted for on both the equity and cost method)include interests in partnerships, corporations and real estate investmenttrusts. These companies are involved in a diversified mix of real estate, retailand financial activities in various geographical locations. The objectives ofthese companies include but are not limited to the following – own luxuryapartments, retail shopping center and office buildings; develop senior livingcommunities; acquire distressed real estate assets for either foreclosure orrestructuring; invest in equity securities in various industries, includinginsurance, financial services and healthcare; invest in and manage currentlyunder-managed companies in need of sophisticated financial assistance; investin equity securities in connection with leveraged acquisition; invest in mediumand long-term investments in distressed fixed income securities, primarily inAsia; and invest in equity, equity-related and debt securities acquired throughprivately negotiated transactions.
44
KS95.1-AnnualReport for Web 5/15/01 2:28 PM Page 47
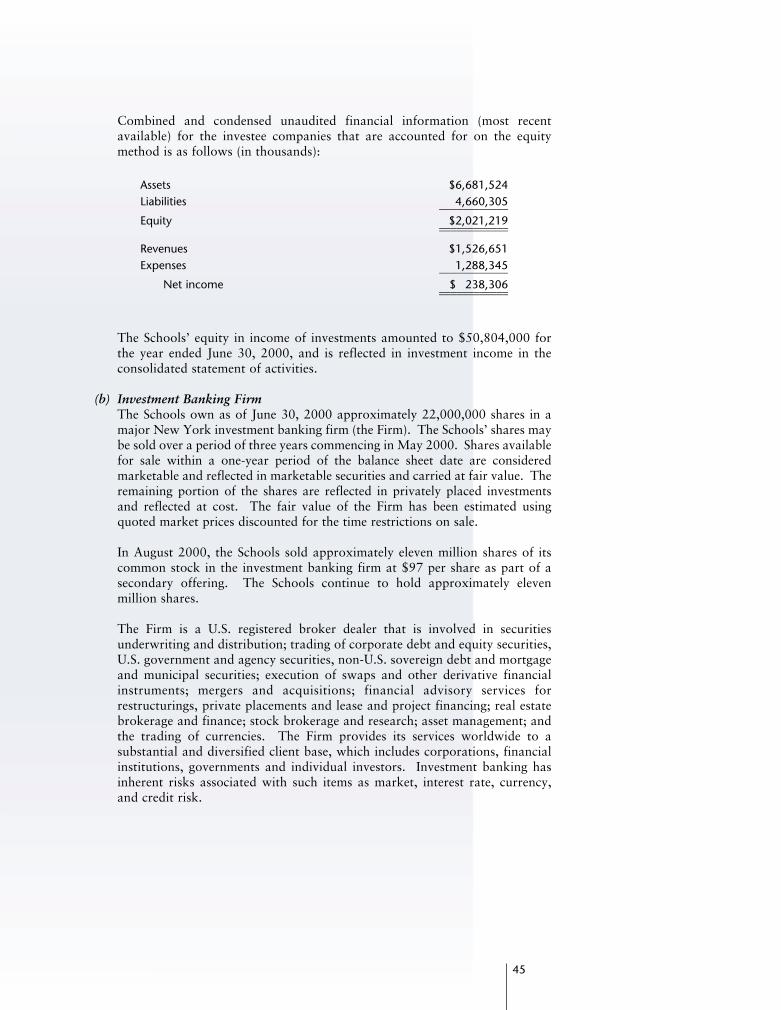
45
Combined and condensed unaudited financial information (most recentavailable) for the investee companies that are accounted for on the equitymethod is as follows (in thousands):
Assets $6,681,524Liabilities 4,660,305____________Equity $2,021,219________________________
Revenues $1,526,651Expenses 1,288,345____________
Net income $ 238,306________________________
The Schools’ equity in income of investments amounted to $50,804,000 forthe year ended June 30, 2000, and is reflected in investment income in theconsolidated statement of activities.
(b) Investment Banking FirmThe Schools own as of June 30, 2000 approximately 22,000,000 shares in amajor New York investment banking firm (the Firm). The Schools’ shares maybe sold over a period of three years commencing in May 2000. Shares availablefor sale within a one-year period of the balance sheet date are consideredmarketable and reflected in marketable securities and carried at fair value. Theremaining portion of the shares are reflected in privately placed investmentsand reflected at cost. The fair value of the Firm has been estimated usingquoted market prices discounted for the time restrictions on sale.
In August 2000, the Schools sold approximately eleven million shares of itscommon stock in the investment banking firm at $97 per share as part of asecondary offering. The Schools continue to hold approximately elevenmillion shares.
The Firm is a U.S. registered broker dealer that is involved in securitiesunderwriting and distribution; trading of corporate debt and equity securities,U.S. government and agency securities, non-U.S. sovereign debt and mortgageand municipal securities; execution of swaps and other derivative financialinstruments; mergers and acquisitions; financial advisory services forrestructurings, private placements and lease and project financing; real estatebrokerage and finance; stock brokerage and research; asset management; andthe trading of currencies. The Firm provides its services worldwide to asubstantial and diversified client base, which includes corporations, financialinstitutions, governments and individual investors. Investment banking hasinherent risks associated with such items as market, interest rate, currency,and credit risk.
KS95.1-AnnualReport for Web 5/15/01 2:28 PM Page 48
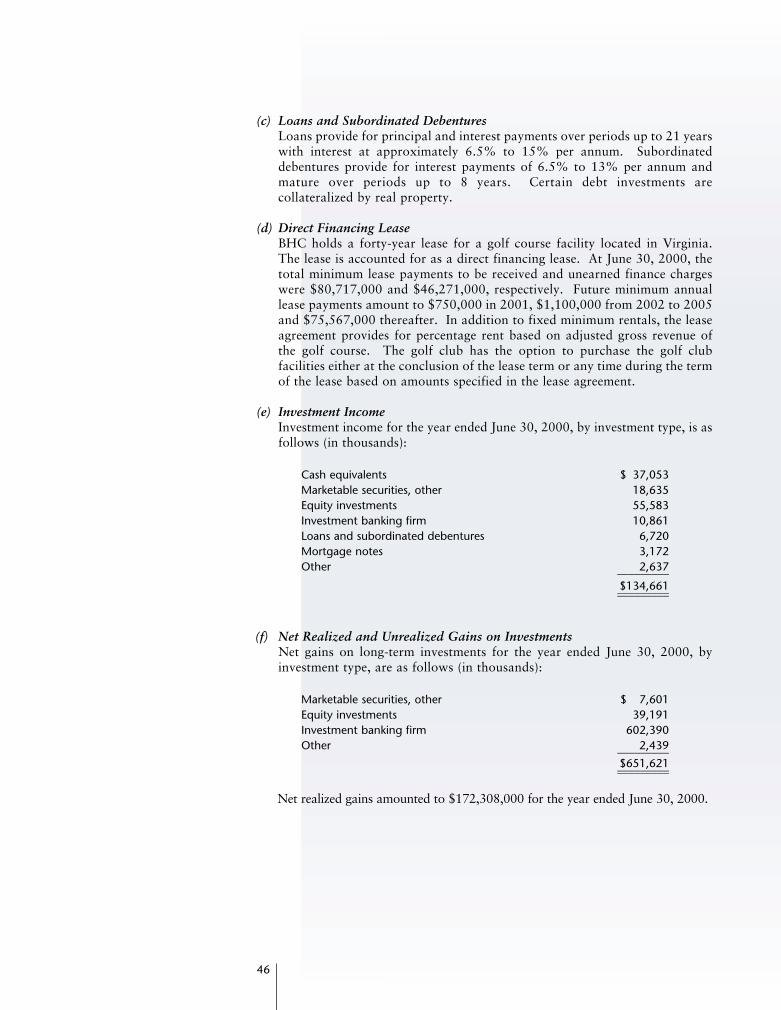
(c) Loans and Subordinated DebenturesLoans provide for principal and interest payments over periods up to 21 yearswith interest at approximately 6.5% to 15% per annum. Subordinateddebentures provide for interest payments of 6.5% to 13% per annum andmature over periods up to 8 years. Certain debt investments arecollateralized by real property.
(d) Direct Financing LeaseBHC holds a forty-year lease for a golf course facility located in Virginia.The lease is accounted for as a direct financing lease. At June 30, 2000, thetotal minimum lease payments to be received and unearned finance chargeswere $80,717,000 and $46,271,000, respectively. Future minimum annuallease payments amount to $750,000 in 2001, $1,100,000 from 2002 to 2005and $75,567,000 thereafter. In addition to fixed minimum rentals, the leaseagreement provides for percentage rent based on adjusted gross revenue ofthe golf course. The golf club has the option to purchase the golf clubfacilities either at the conclusion of the lease term or any time during the termof the lease based on amounts specified in the lease agreement.
(e) Investment IncomeInvestment income for the year ended June 30, 2000, by investment type, is asfollows (in thousands):
Cash equivalents $ 37,053Marketable securities, other 18,635Equity investments 55,583Investment banking firm 10,861Loans and subordinated debentures 6,720Mortgage notes 3,172Other 2,637_________
$134,661__________________
(f) Net Realized and Unrealized Gains on InvestmentsNet gains on long-term investments for the year ended June 30, 2000, byinvestment type, are as follows (in thousands):
Marketable securities, other $ 7,601Equity investments 39,191Investment banking firm 602,390Other 2,439_________
$651,621__________________
Net realized gains amounted to $172,308,000 for the year ended June 30, 2000.
46
KS95.1-AnnualReport for Web 5/15/01 2:28 PM Page 49
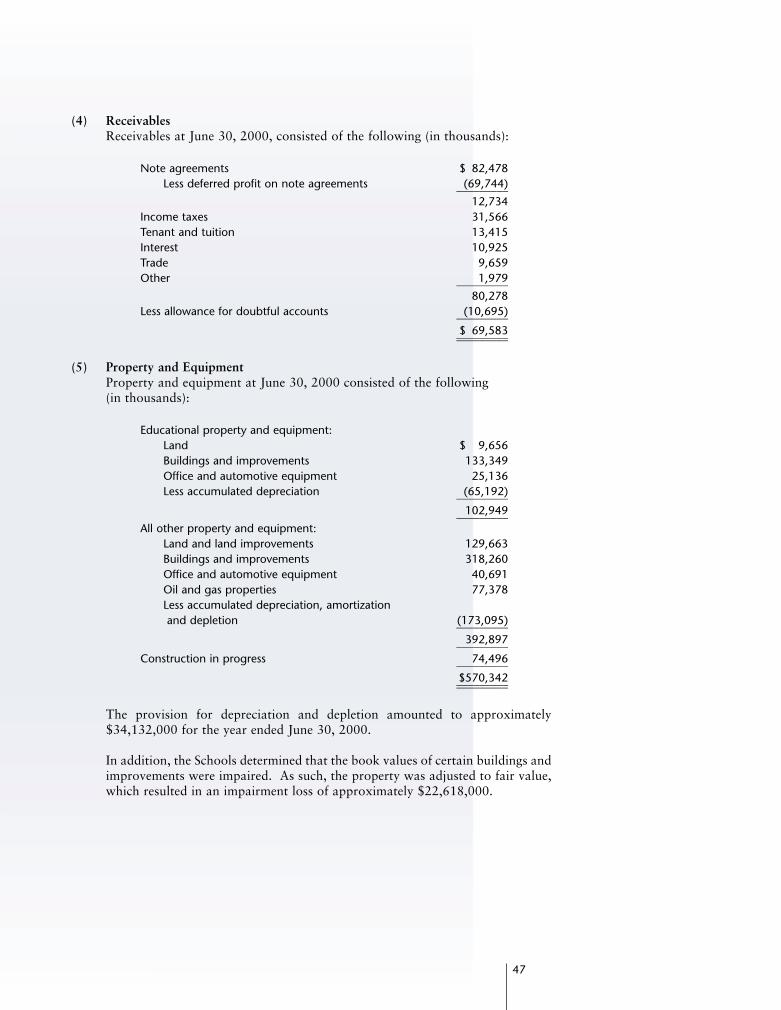
47
(4) ReceivablesReceivables at June 30, 2000, consisted of the following (in thousands):
Note agreements $ 82,478Less deferred profit on note agreements (69,744)_________
12,734Income taxes 31,566Tenant and tuition 13,415Interest 10,925Trade 9,659Other 1,979_________
80,278Less allowance for doubtful accounts (10,695)_________
$ 69,583__________________
(5) Property and EquipmentProperty and equipment at June 30, 2000 consisted of the following (in thousands):
Educational property and equipment:Land $ 9,656Buildings and improvements 133,349Office and automotive equipment 25,136Less accumulated depreciation (65,192)_________
102,949_________All other property and equipment:
Land and land improvements 129,663Buildings and improvements 318,260Office and automotive equipment 40,691Oil and gas properties 77,378Less accumulated depreciation, amortizationand depletion (173,095)_________
392,897_________Construction in progress 74,496_________
$570,342__________________
The provision for depreciation and depletion amounted to approximately$34,132,000 for the year ended June 30, 2000.
In addition, the Schools determined that the book values of certain buildings andimprovements were impaired. As such, the property was adjusted to fair value,which resulted in an impairment loss of approximately $22,618,000.
KS95.1-AnnualReport for Web 5/15/01 2:28 PM Page 50
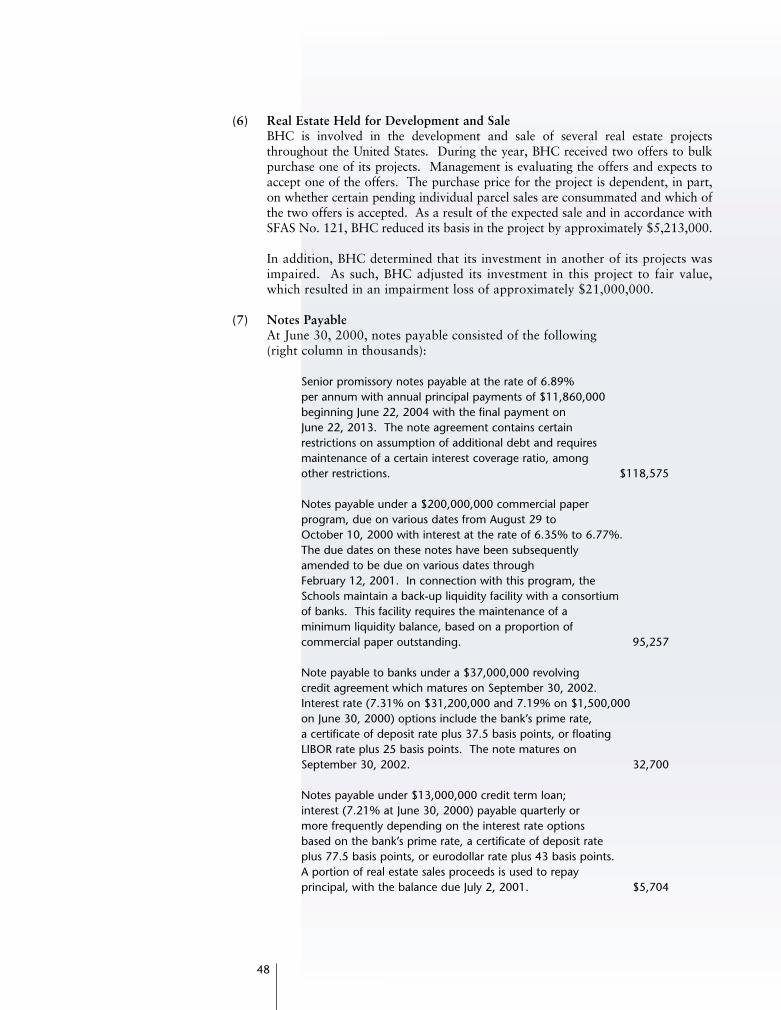
(6) Real Estate Held for Development and SaleBHC is involved in the development and sale of several real estate projectsthroughout the United States. During the year, BHC received two offers to bulkpurchase one of its projects. Management is evaluating the offers and expects toaccept one of the offers. The purchase price for the project is dependent, in part,on whether certain pending individual parcel sales are consummated and which ofthe two offers is accepted. As a result of the expected sale and in accordance withSFAS No. 121, BHC reduced its basis in the project by approximately $5,213,000.
In addition, BHC determined that its investment in another of its projects wasimpaired. As such, BHC adjusted its investment in this project to fair value,which resulted in an impairment loss of approximately $21,000,000.
(7) Notes PayableAt June 30, 2000, notes payable consisted of the following (right column in thousands):
Senior promissory notes payable at the rate of 6.89% per annum with annual principal payments of $11,860,000 beginning June 22, 2004 with the final payment on June 22, 2013. The note agreement contains certain restrictions on assumption of additional debt and requires maintenance of a certain interest coverage ratio, amongother restrictions. $118,575
Notes payable under a $200,000,000 commercial paper program, due on various dates from August 29 to October 10, 2000 with interest at the rate of 6.35% to 6.77%. The due dates on these notes have been subsequently amended to be due on various dates through February 12, 2001. In connection with this program, the Schools maintain a back-up liquidity facility with a consortium of banks. This facility requires the maintenance of a minimum liquidity balance, based on a proportion of commercial paper outstanding. 95,257
Note payable to banks under a $37,000,000 revolving credit agreement which matures on September 30, 2002. Interest rate (7.31% on $31,200,000 and 7.19% on $1,500,000on June 30, 2000) options include the bank’s prime rate, a certificate of deposit rate plus 37.5 basis points, or floating LIBOR rate plus 25 basis points. The note matures on September 30, 2002. 32,700
Notes payable under $13,000,000 credit term loan; interest (7.21% at June 30, 2000) payable quarterly or more frequently depending on the interest rate options based on the bank’s prime rate, a certificate of deposit rate plus 77.5 basis points, or eurodollar rate plus 43 basis points. A portion of real estate sales proceeds is used to repay principal, with the balance due July 2, 2001. $5,704
48
KS95.1-AnnualReport for Web 5/15/01 2:28 PM Page 51
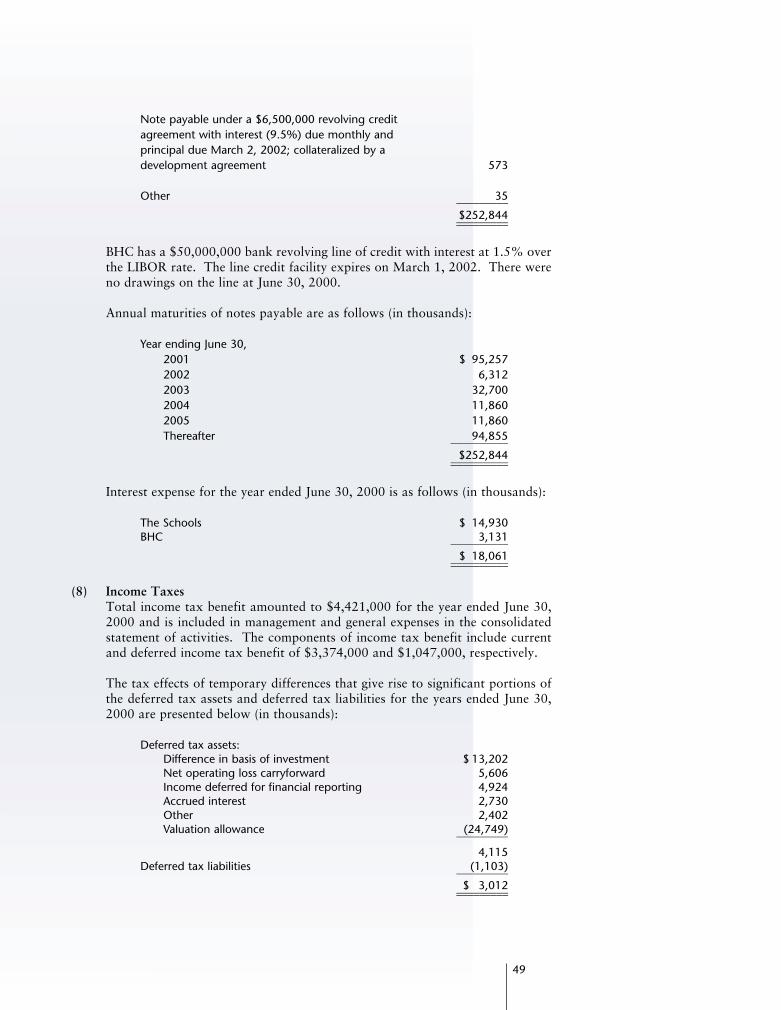
49
Note payable under a $6,500,000 revolving credit agreement with interest (9.5%) due monthly and principal due March 2, 2002; collateralized by a development agreement 573
Other 35_________$252,844__________________
BHC has a $50,000,000 bank revolving line of credit with interest at 1.5% overthe LIBOR rate. The line credit facility expires on March 1, 2002. There wereno drawings on the line at June 30, 2000.
Annual maturities of notes payable are as follows (in thousands):
Year ending June 30,2001 $ 95,2572002 6,3122003 32,7002004 11,8602005 11,860Thereafter 94,855__________
$252,844____________________
Interest expense for the year ended June 30, 2000 is as follows (in thousands):
The Schools $ 14,930BHC 3,131__________
$ 18,061____________________
(8) Income TaxesTotal income tax benefit amounted to $4,421,000 for the year ended June 30,2000 and is included in management and general expenses in the consolidatedstatement of activities. The components of income tax benefit include currentand deferred income tax benefit of $3,374,000 and $1,047,000, respectively.
The tax effects of temporary differences that give rise to significant portions ofthe deferred tax assets and deferred tax liabilities for the years ended June 30,2000 are presented below (in thousands):
Deferred tax assets:Difference in basis of investment $ 13,202Net operating loss carryforward 5,606Income deferred for financial reporting 4,924Accrued interest 2,730Other 2,402Valuation allowance (24,749)_________
4,115Deferred tax liabilities (1,103)_________
$ 3,012__________________
KS95.1-AnnualReport for Web 5/15/01 2:28 PM Page 52
The valuation allowance for deferred tax assets as of July 1, 1999 was$25,509,000. The net change in the total valuation allowance for the year endedJune 30, 2000 was a decrease of $760,000. In assessing the realizability ofdeferred tax assets, management considers whether it is more likely than not thatsome portion or all of the deferred tax assets will not be realized. The ultimaterealization of deferred tax assets is dependent upon the generation of futuretaxable income during the periods in which those temporary differences becomedeductible. Management considers the scheduled reversal of deferred taxliabilities, projected future taxable income, and tax planning strategies inmaking this assessment. Based upon the level of historical taxable income andprojections for future taxable income over the periods which the deferred taxassets are deductible, management believes it is more likely than not that BHCwill realize the benefits of these deductible differences, net of the existingvaluation allowances at June 30, 2000. The amount of the deferred tax assetconsidered realizable, however, could be reduced in the near term if estimates offuture taxable income during the carryforward period are reduced.
Internal Revenue Service AuditIn 1995, the Internal Revenue Service (IRS) began an audit of the Schools andPauahi Holding Company (PHC), the Schools’ former wholly owned taxablesubsidiary for the years ended June 30, 1992, 1993 and 1994. It was laterexpanded to include the years ended June 30, 1995 to 1998. In March 1999,the IRS began an audit of KAA for the years ended June 30, 1997 and 1998.This audit was later expanded to include the year ended June 30, 1999. Thestatus of these audits are as follows:
The Schools: In January 1999, the IRS had proposed revocation of the Schools’tax exempt status. Through settlement negotiations and the execution of aclosing agreement in February 2000, which included removal of the five formerTrustees, a settlement payment (including interest) of $13,992,000 and otherconditions that require special filings to be made to the IRS annually throughFebruary 2005, the Schools was able to preserve its tax exempt status.
PHC: PHC executed a closing agreement with the IRS in December 2000 tosettle tax matters through June 30, 1998. The agreement resulted in a settlementpayment (including interest) of approximately $29,000,000 which has beenaccrued for in the consolidated financial statements.
KAA: The primary focus of this audit is on the nontaxable treatment of areorganization that occurred between KAA and other related entities in July1998. KAA has provided information supporting its position and believes thatthe reorganization was not taxable. At this time, management of KAA is unableto determine the ultimate outcome of this matter. Accordingly, no provision forliabilities, if any, that may result from this audit has been made in theaccompanying consolidated financial statements. An adverse outcome to KAAcould materially impact the financial position of the Schools.
50
KS95.1-AnnualReport for Web 5/15/01 2:28 PM Page 53
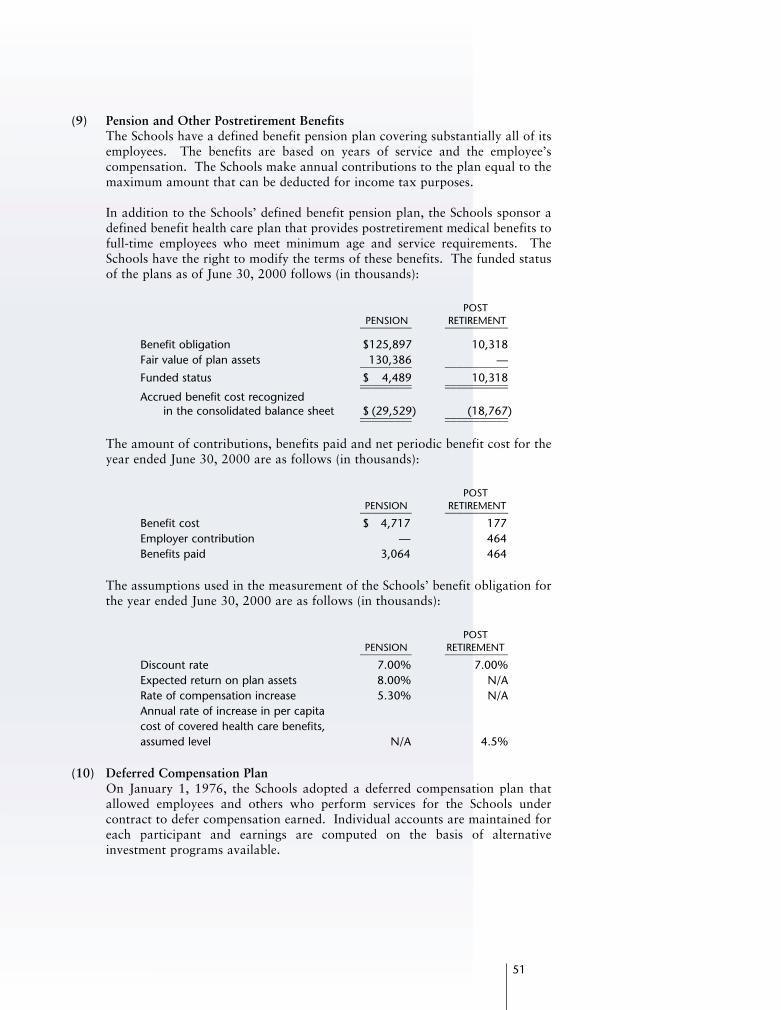
51
(9) Pension and Other Postretirement BenefitsThe Schools have a defined benefit pension plan covering substantially all of itsemployees. The benefits are based on years of service and the employee’scompensation. The Schools make annual contributions to the plan equal to themaximum amount that can be deducted for income tax purposes.
In addition to the Schools’ defined benefit pension plan, the Schools sponsor adefined benefit health care plan that provides postretirement medical benefits tofull-time employees who meet minimum age and service requirements. TheSchools have the right to modify the terms of these benefits. The funded statusof the plans as of June 30, 2000 follows (in thousands):
POSTPENSION RETIREMENT_________ ___________
Benefit obligation $125,897 10,318Fair value of plan assets 130,386 —_________ ___________Funded status $ 4,489 10,318_________ ____________________ ___________Accrued benefit cost recognized
in the consolidated balance sheet $ (29,529) (18,767)_________ ____________________ ___________
The amount of contributions, benefits paid and net periodic benefit cost for theyear ended June 30, 2000 are as follows (in thousands):
POSTPENSION RETIREMENT_________ ___________
Benefit cost $ 4,717 177Employer contribution — 464Benefits paid 3,064 464
The assumptions used in the measurement of the Schools’ benefit obligation forthe year ended June 30, 2000 are as follows (in thousands):
POST PENSION RETIREMENT_________ ___________
Discount rate 7.00% 7.00%Expected return on plan assets 8.00% N/ARate of compensation increase 5.30% N/AAnnual rate of increase in per capita cost of covered health care benefits, assumed level N/A 4.5%
(10) Deferred Compensation PlanOn January 1, 1976, the Schools adopted a deferred compensation plan thatallowed employees and others who perform services for the Schools undercontract to defer compensation earned. Individual accounts are maintained foreach participant and earnings are computed on the basis of alternativeinvestment programs available.
KS95.1-AnnualReport for Web 5/15/01 2:28 PM Page 54
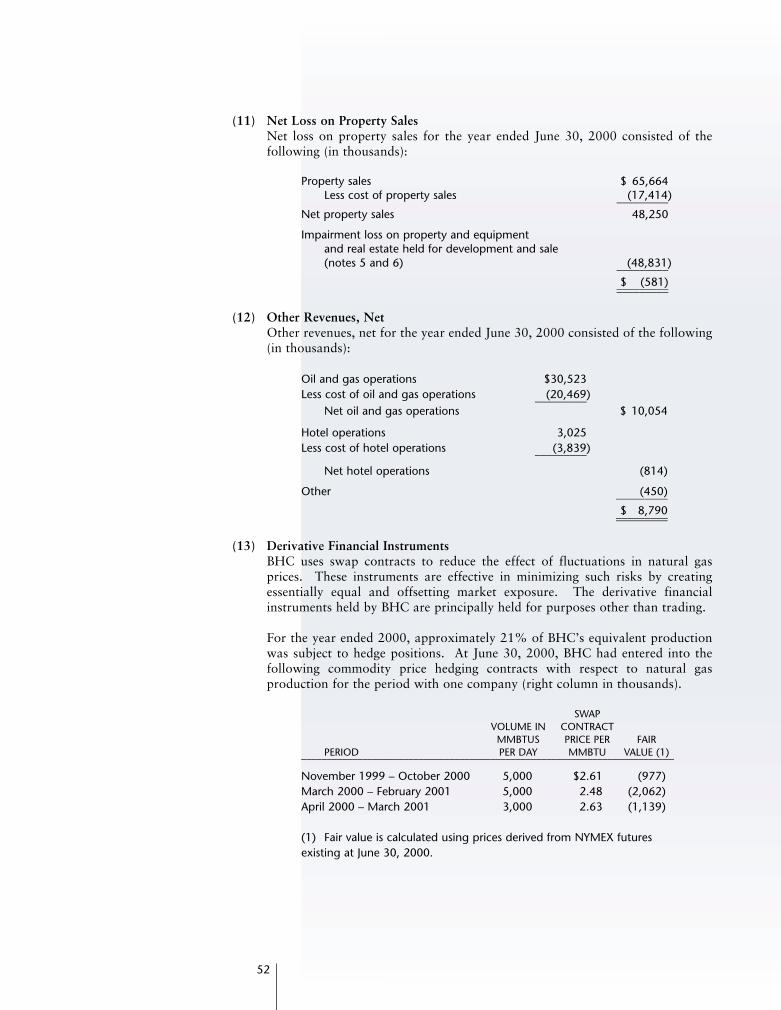
(11) Net Loss on Property SalesNet loss on property sales for the year ended June 30, 2000 consisted of thefollowing (in thousands):
Property sales $ 65,664Less cost of property sales (17,414)_________
Net property sales 48,250
Impairment loss on property and equipment and real estate held for development and sale (notes 5 and 6) (48,831)_________
$ (581)__________________
(12) Other Revenues, NetOther revenues, net for the year ended June 30, 2000 consisted of the following(in thousands):
Oil and gas operations $30,523Less cost of oil and gas operations (20,469)_________
Net oil and gas operations $ 10,054
Hotel operations 3,025Less cost of hotel operations (3,839)_________
Net hotel operations (814)
Other (450)_________$ 8,790__________________
(13) Derivative Financial InstrumentsBHC uses swap contracts to reduce the effect of fluctuations in natural gasprices. These instruments are effective in minimizing such risks by creatingessentially equal and offsetting market exposure. The derivative financialinstruments held by BHC are principally held for purposes other than trading.
For the year ended 2000, approximately 21% of BHC’s equivalent productionwas subject to hedge positions. At June 30, 2000, BHC had entered into thefollowing commodity price hedging contracts with respect to natural gasproduction for the period with one company (right column in thousands).
SWAPVOLUME IN CONTRACT
MMBTUS PRICE PER FAIRPERIOD PER DAY MMBTU VALUE (1)_________________________________________________________________________
November 1999 – October 2000 5,000 $2.61 (977)March 2000 – February 2001 5,000 2.48 (2,062)April 2000 – March 2001 3,000 2.63 (1,139)
(1) Fair value is calculated using prices derived from NYMEX futures existing at June 30, 2000.
52
KS95.1-AnnualReport for Web 5/15/01 2:28 PM Page 55
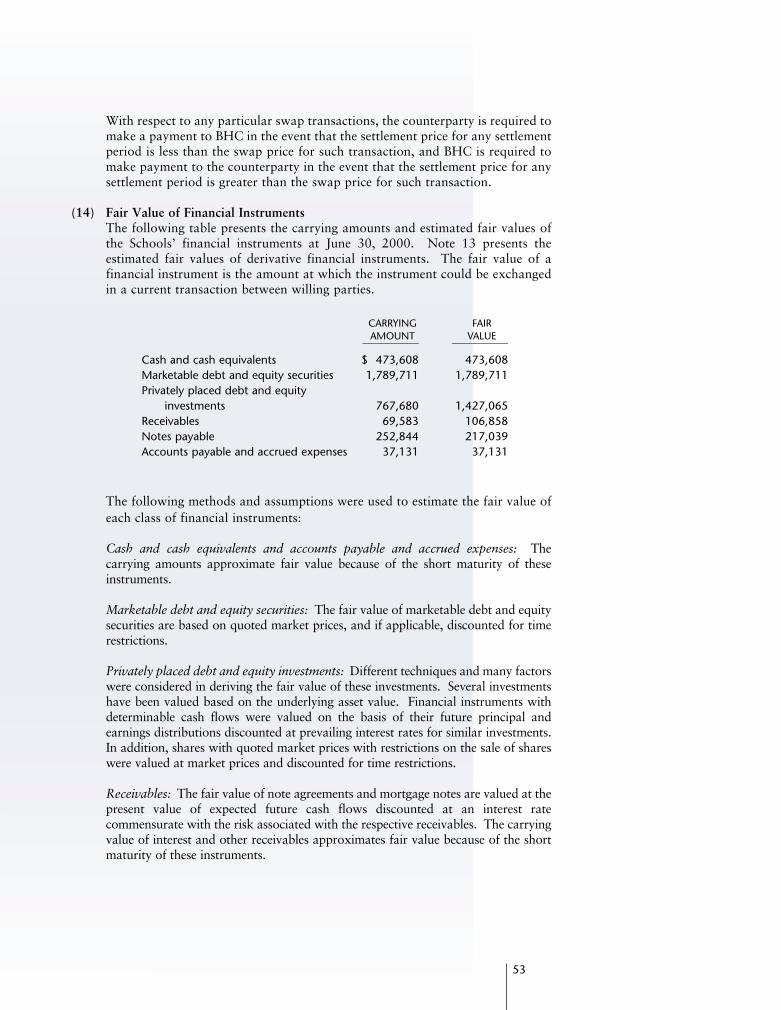
53
With respect to any particular swap transactions, the counterparty is required tomake a payment to BHC in the event that the settlement price for any settlementperiod is less than the swap price for such transaction, and BHC is required tomake payment to the counterparty in the event that the settlement price for anysettlement period is greater than the swap price for such transaction.
(14) Fair Value of Financial InstrumentsThe following table presents the carrying amounts and estimated fair values ofthe Schools’ financial instruments at June 30, 2000. Note 13 presents theestimated fair values of derivative financial instruments. The fair value of afinancial instrument is the amount at which the instrument could be exchangedin a current transaction between willing parties.
CARRYING FAIRAMOUNT VALUE___________ ___________
Cash and cash equivalents $ 473,608 473,608Marketable debt and equity securities 1,789,711 1,789,711Privately placed debt and equity
investments 767,680 1,427,065Receivables 69,583 106,858Notes payable 252,844 217,039Accounts payable and accrued expenses 37,131 37,131
The following methods and assumptions were used to estimate the fair value of
each class of financial instruments:
Cash and cash equivalents and accounts payable and accrued expenses: Thecarrying amounts approximate fair value because of the short maturity of theseinstruments.
Marketable debt and equity securities: The fair value of marketable debt and equitysecurities are based on quoted market prices, and if applicable, discounted for timerestrictions.
Privately placed debt and equity investments: Different techniques and many factorswere considered in deriving the fair value of these investments. Several investmentshave been valued based on the underlying asset value. Financial instruments withdeterminable cash flows were valued on the basis of their future principal andearnings distributions discounted at prevailing interest rates for similar investments.In addition, shares with quoted market prices with restrictions on the sale of shareswere valued at market prices and discounted for time restrictions.
Receivables: The fair value of note agreements and mortgage notes are valued at thepresent value of expected future cash flows discounted at an interest ratecommensurate with the risk associated with the respective receivables. The carryingvalue of interest and other receivables approximates fair value because of the shortmaturity of these instruments.
KS95.1-AnnualReport for Web 5/15/01 2:28 PM Page 56
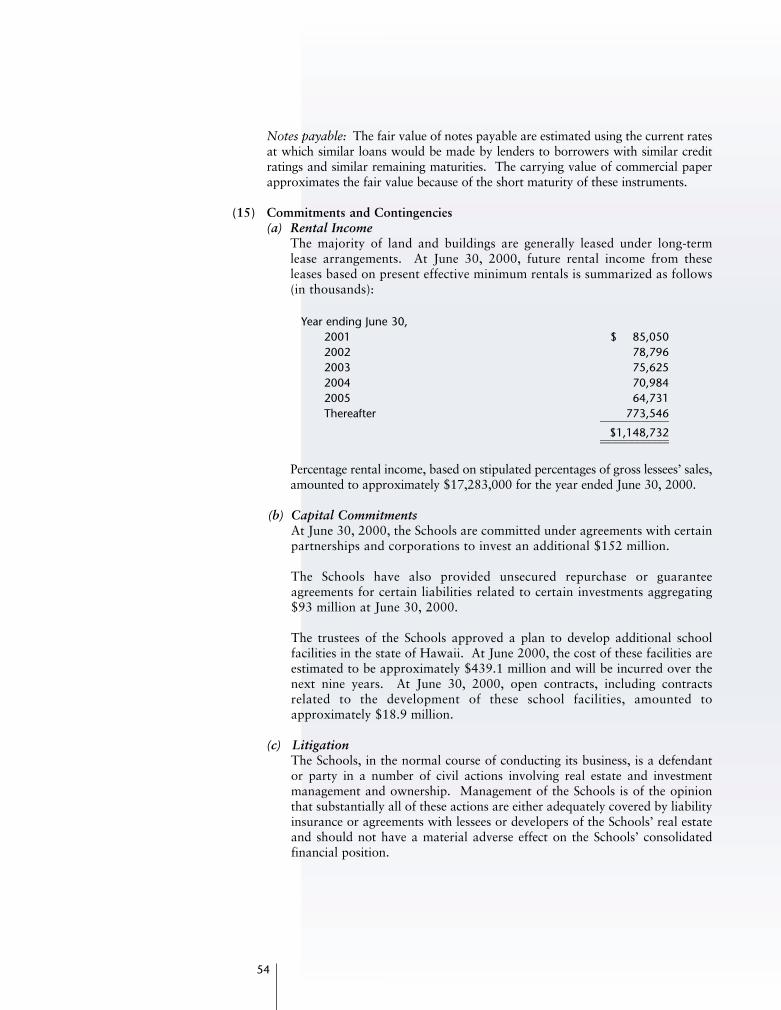
Notes payable: The fair value of notes payable are estimated using the current ratesat which similar loans would be made by lenders to borrowers with similar creditratings and similar remaining maturities. The carrying value of commercial paperapproximates the fair value because of the short maturity of these instruments.
(15) Commitments and Contingencies(a) Rental Income
The majority of land and buildings are generally leased under long-termlease arrangements. At June 30, 2000, future rental income from theseleases based on present effective minimum rentals is summarized as follows(in thousands):
Year ending June 30,2001 $ 85,0502002 78,7962003 75,6252004 70,9842005 64,731Thereafter 773,546____________
$1,148,732________________________
Percentage rental income, based on stipulated percentages of gross lessees’ sales,amounted to approximately $17,283,000 for the year ended June 30, 2000.
(b) Capital CommitmentsAt June 30, 2000, the Schools are committed under agreements with certainpartnerships and corporations to invest an additional $152 million.
The Schools have also provided unsecured repurchase or guaranteeagreements for certain liabilities related to certain investments aggregating$93 million at June 30, 2000.
The trustees of the Schools approved a plan to develop additional schoolfacilities in the state of Hawaii. At June 2000, the cost of these facilities areestimated to be approximately $439.1 million and will be incurred over thenext nine years. At June 30, 2000, open contracts, including contractsrelated to the development of these school facilities, amounted toapproximately $18.9 million.
(c) LitigationThe Schools, in the normal course of conducting its business, is a defendantor party in a number of civil actions involving real estate and investmentmanagement and ownership. Management of the Schools is of the opinionthat substantially all of these actions are either adequately covered by liabilityinsurance or agreements with lessees or developers of the Schools’ real estateand should not have a material adverse effect on the Schools’ consolidatedfinancial position.
54
KS95.1-AnnualReport for Web 5/15/01 2:28 PM Page 57

55
(d) Environmental IssuesBHC is in the process of decontaminating the soil and groundwater locatedat a previously owned property in Ohio. The expected costs ofdecontamination have been accrued in the consolidated financial statementsas of June 30, 2000.
BHC is engaged in the oil and gas production business and may becomesubject to certain liabilities as they relate to environmental clean-up of wellsites or other environmental restoration procedures as they relate to oil andgas operations. In BHC’s acquisition of existing wells, BHC may not beaware of what environmental safeguards were taken at the time the wellswere drilled or during such time the wells were operated. Should it bedetermined that a liability exists with respect to any environmental clean-upor restoration, the liability to cure such violation could fall upon BHC. Atthe present time, management is not aware of any such liabilities.
(e) Trustee MattersIn September 1999, the Court approved monthly compensation of $15,000to each of the Interim Trustees for their services from the date of theirappointment on May 7, 1999. In January 2000, the Court approved aCompensation Committee’s recommendation regarding trusteecompensation. Effective February 1, 2000, Trustees received an annualretainer of $30,000 payable monthly and will receive a meeting fee of$1,500 per meeting, except for the Chairperson who will receive $2,000 permeeting. The meeting fee is subject to a maximum of 45 meetings during atwelve-month period. Total trustee compensation paid during the yearended June 30, 2000 amounted to $764,500.
In November 2000, the Court appointed five permanent Trustees who willserve varying terms from one to five years. Two of the five permanentTrustees served as Interim Trustees while three are newly appointed. Theappointments were effective on January 1, 2001.
(f) Attorney GeneralThe Attorney General of the State of Hawaii filed a petition in 1998 to removeand surcharge the Former Trustees. Various allegations were asserted and theparties entered into a global settlement with the Attorney General inSeptember 2000. The global settlement was approved by the Court inOctober 2000 and resulted in the Schools receiving insurance proceeds ofapproximately $14 million.
KS95.1-AnnualReport for Web 5/15/01 2:28 PM Page 58

(16) Prior Period AdjustmentsThe Schools’ consolidated net assets as of June 30, 1999 have been restated toreflect the following:
1. The reversal of gains on sale of residential leasehold interests recognized inprior periods of approximately $71,616,000 and the correspondingreduction in receivables. The Schools sell residential leasehold interestsunder various collateralized financing arrangements. The terms of themortgages are such that these sales do not qualify for full profit recognitionunder generally accepted accounting principles and thus are accounted forunder the cost recovery method. Using this method, gains on the sale arerecorded when the cash received is greater than the basis of the leaseholdinterests sold.
2. The reversal of gains recognized in prior years of approximately $22,800,000related to nonmonetary assets received in land condemnation actions.
3. The reduction in privately placed debt and equity investments ofapproximately $8,562,000 to record the Schools’ share of prior periodlosses of certain investments. Under the equity method of accounting, theSchools’ share of the underlying investees’ losses should be reflected in theSchools’ consolidated financial statements as of June 30, 1999.
4. To record additional rental income and rent receivables of approximately$17,293,000 as of June 30, 1999 relating to long-term lease arrangementsthat provide for scheduled rent increases. Under generally acceptedaccounting principles, rental income should be recorded on the straight-linebasis over the term of the respective lease arrangements.
5. To adjust land assets to its original basis in order to comply with generallyaccepted accounting principles. This resulted in a reduction of property andequipment of $125,194,000. The Schools previously recorded the assets at1965 tax assessed values pursuant to a Court order.
The effect of recording these prior period adjustments was to decreasepreviously reported net assets at June 30, 1999 by $210,879,000.
56
KS95.1-AnnualReport for Web 5/15/01 2:28 PM Page 59
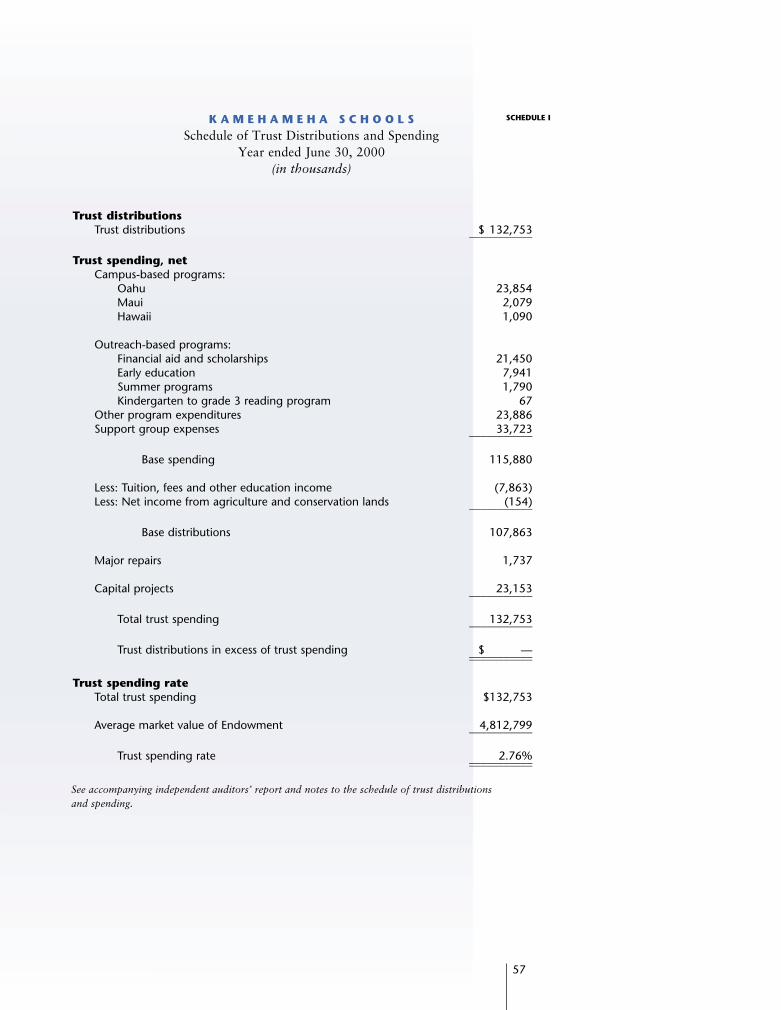
57
K A M E H A M E H A S C H O O L S Schedule of Trust Distributions and Spending
Year ended June 30, 2000
(in thousands)
Trust distributionsTrust distributions $ 132,753___________
Trust spending, netCampus-based programs:
Oahu 23,854Maui 2,079Hawaii 1,090
Outreach-based programs:Financial aid and scholarships 21,450Early education 7,941Summer programs 1,790Kindergarten to grade 3 reading program 67
Other program expenditures 23,886Support group expenses 33,723___________
Base spending 115,880
Less: Tuition, fees and other education income (7,863)Less: Net income from agriculture and conservation lands (154)___________
Base distributions 107,863
Major repairs 1,737
Capital projects 23,153___________
Total trust spending 132,753___________
Trust distributions in excess of trust spending $ —______________________
Trust spending rateTotal trust spending $132,753
Average market value of Endowment 4,812,799___________
Trust spending rate 2.76%______________________
See accompanying independent auditors’ report and notes to the schedule of trust distributions
and spending.
SCHEDULE I
KS95.1-AnnualReport for Web 5/15/01 2:28 PM Page 60
K A M E H A M E H A S C H O O L S Notes to Schedule of Trust Distributions and Spending
June 30, 2000
(1) Background and PurposeIn August 1999, the Schools adopted a spending policy that governs annual trustdistributions from the endowment to support its educational purpose. Thespending policy targets annual trust distributions at 4% of the average marketvalue of the endowment plus the net income (loss) generated from the Schools’agriculture and conservation lands. The spending policy also provides for actualtrust distributions to vary annually in a range of 2.5% to 6%. Since this is anewly adopted policy, management of the Schools anticipates that it will taketime to increase trust distributions to the targeted 4% level.
The purpose of this schedule is to present the total distributions made from theendowment to fund educational programs (trust spending) by major program andactivity. It also presents the trust spending rate for the fiscal year.
(2) Trust DistributionsTrust distributions represent the amount withdrawn from the endowmentduring the fiscal year to fund the Schools’ educational programs and activities.
(3) Trust Spending and Trust Spending RateTrust spending represents the amounts spent during the fiscal year on educationalprograms by major program and activity. The campus-based and outreach-basedprogram costs represent direct costs of providing these programs. Other programexpenditures represent the direct costs related to certain educational services(admissions, religious services, Hawaiian studies, medical services, etc.) thatbenefit the various campus-based and outreach-based programs. Other supportgroup expenses represent the portion of the finance, administration and legalservices cost that are in support of the Schools’ educational programs andpurpose. Major repairs and capital projects cost relate to activities that aredirectly related to education.
For purposes of this schedule, trust spending on educational programs includesmajor repairs and capital projects, as well as an allocation of indirect costs.These costs are not included in educational program expenses on the consolidatedstatement of activities. Other support group expenses represent finance,administration and legal costs allocated to educational programs and activities.These costs are allocated by first determining the amount that is directly relatedto education. The remaining costs are allocated between education and theSchools’ endowment activities based on various methods depending on the typeof cost including headcount, square footage, and proportion in relation to thetotal and other estimates based on management’s best judgment.
The trust spending rate is determined by dividing the total trust spending by theaverage market value of the endowment.
58
KS95.1-AnnualReport for Web 5/15/01 2:28 PM Page 61

59
(4) Endowment and Average Market Value of the EndowmentThe endowment consists of all consolidated investment assets of the Schoolsexcept agriculture and conservation lands and reserve funds (the Endowment) asdefined in the Schools’ investment policy. At June 30, 2000, there were noreserve funds established by the Schools.
The average market value of the Endowment is initially based on the average ofthe five prior fiscal June 30 year-end market values and over time will be basedon the average of the prior 20-quarter market values. Accordingly, the trustspending rate for the year ended June 30, 2000 is based on the estimated averagemarket values for the fiscal years ended June 30, 1995 through June 30, 1999.The market values for these fiscal years were based primarily on tax assessedvalues for the Hawaii real estate assets and the fair value of the other Endowmentassets as reported in the audited financial statements for these fiscal years, net ofany associated debt and prior period adjustments discussed in note 16 to theconsolidated financial statements.
KS95.1-AnnualReport for Web 5/15/01 2:28 PM Page 62
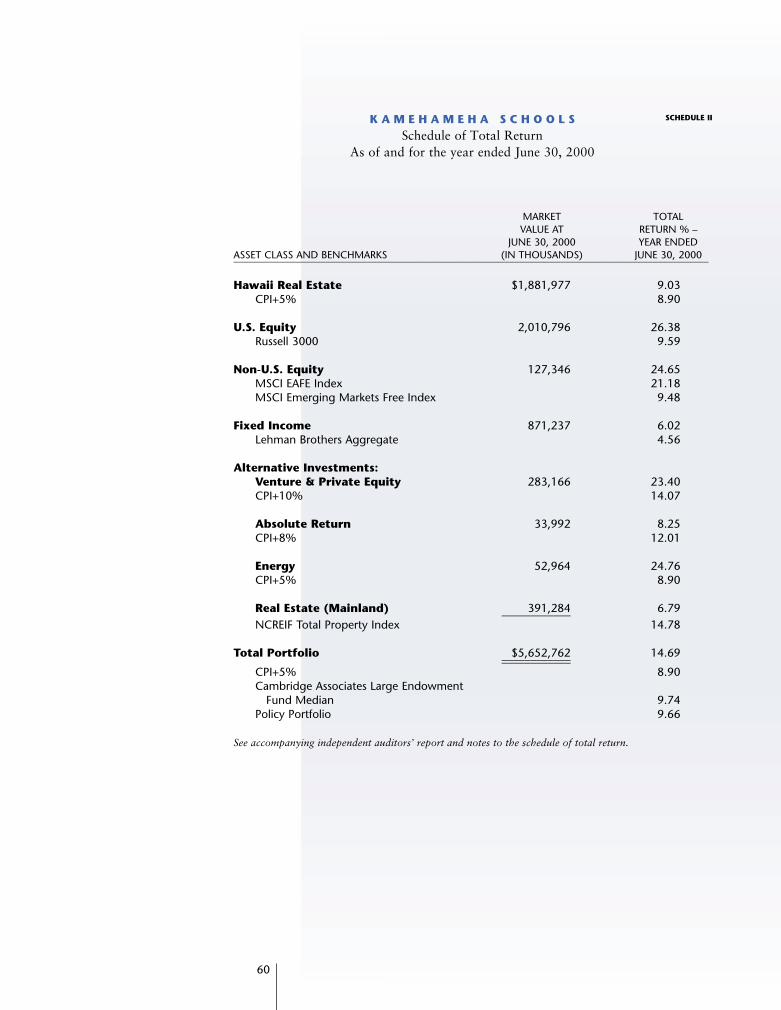
60
K A M E H A M E H A S C H O O L S Schedule of Total Return
As of and for the year ended June 30, 2000
MARKET TOTAL VALUE AT RETURN % –
JUNE 30, 2000 YEAR ENDEDASSET CLASS AND BENCHMARKS (IN THOUSANDS) JUNE 30, 2000_____________________________________________________________________________________________
Hawaii Real Estate $1,881,977 9.03CPI+5% 8.90
U.S. Equity 2,010,796 26.38Russell 3000 9.59
Non-U.S. Equity 127,346 24.65MSCI EAFE Index 21.18MSCI Emerging Markets Free Index 9.48
Fixed Income 871,237 6.02Lehman Brothers Aggregate 4.56
Alternative Investments:Venture & Private Equity 283,166 23.40CPI+10% 14.07
Absolute Return 33,992 8.25CPI+8% 12.01
Energy 52,964 24.76CPI+5% 8.90
Real Estate (Mainland) 391,284 6.79____________NCREIF Total Property Index 14.78
Total Portfolio $5,652,762 14.69________________________CPI+5% 8.90Cambridge Associates Large Endowment
Fund Median 9.74Policy Portfolio 9.66
See accompanying independent auditors’ report and notes to the schedule of total return.
SCHEDULE II
KS95.1-AnnualReport for Web 5/15/01 2:28 PM Page 63
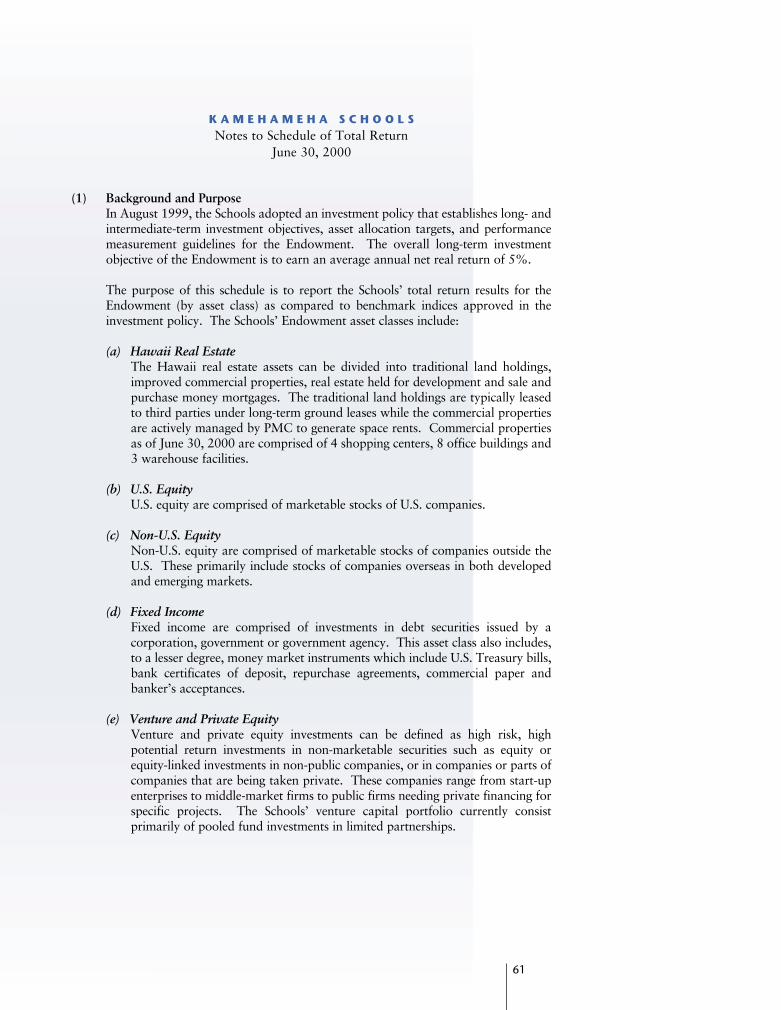
61
K A M E H A M E H A S C H O O L S Notes to Schedule of Total Return
June 30, 2000
(1) Background and PurposeIn August 1999, the Schools adopted an investment policy that establishes long- andintermediate-term investment objectives, asset allocation targets, and performancemeasurement guidelines for the Endowment. The overall long-term investmentobjective of the Endowment is to earn an average annual net real return of 5%.
The purpose of this schedule is to report the Schools’ total return results for theEndowment (by asset class) as compared to benchmark indices approved in theinvestment policy. The Schools’ Endowment asset classes include:
(a) Hawaii Real EstateThe Hawaii real estate assets can be divided into traditional land holdings,improved commercial properties, real estate held for development and sale andpurchase money mortgages. The traditional land holdings are typically leasedto third parties under long-term ground leases while the commercial propertiesare actively managed by PMC to generate space rents. Commercial propertiesas of June 30, 2000 are comprised of 4 shopping centers, 8 office buildings and3 warehouse facilities.
(b) U.S. EquityU.S. equity are comprised of marketable stocks of U.S. companies.
(c) Non-U.S. Equity Non-U.S. equity are comprised of marketable stocks of companies outside theU.S. These primarily include stocks of companies overseas in both developedand emerging markets.
(d) Fixed Income Fixed income are comprised of investments in debt securities issued by acorporation, government or government agency. This asset class also includes,to a lesser degree, money market instruments which include U.S. Treasury bills,bank certificates of deposit, repurchase agreements, commercial paper andbanker’s acceptances.
(e) Venture and Private EquityVenture and private equity investments can be defined as high risk, highpotential return investments in non-marketable securities such as equity orequity-linked investments in non-public companies, or in companies or parts ofcompanies that are being taken private. These companies range from start-upenterprises to middle-market firms to public firms needing private financing forspecific projects. The Schools’ venture capital portfolio currently consistprimarily of pooled fund investments in limited partnerships.
KS95.1-AnnualReport for Web 5/15/01 2:28 PM Page 64
(f) Absolute Return Absolute return investments consist of the Schools’ ownership interest in theGoldman Sachs Asia Opportunities Fund and Goldman Sachs PerformancePartners Investments Fund. These funds’ investment strategies are designed toexploit arbitrage opportunities and pricing inefficiency among related securitieswhile insulating results from broad stock or bond market investments.
(g) Energy Energy is comprised of coal seam methane gas well operations located primarilyin Colorado, New Mexico and Alabama.
(h) Real Estate (Mainland)Real estate assets consist of pooled and direct investments in residential, office,retail, timberland and a variety of other property types.
(2) Market valuesMarket value of an asset is the amount at which the asset could be exchanged in acurrent transaction between willing parties. The following methods andassumptions were used to estimate the market value of each asset class:
(a) Hawaii Real Estate Traditional land holdings are valued by an in-house appraiser by estimating anddiscounting future net cash flows. The valuation procedures are performedperiodically, a majority of them within the last three years. Values are reviewedon a quarterly basis and may be revised under certain circumstances, forexample, revisions to estimated cash flow, third party appraisals, or sales ofsimilar properties.
Commercial properties may be divided into two categories, leased and non-leased. For leased properties, value is based on estimating and discountingfuture net cash flows for ten years. For non-leased properties, the value is basedon a direct sales comparison.
The market value of real estate held for development and sale approximates thetax assessed value.
The market value of purchase money mortgages is the present value of expectedfuture cash flows discounted at an interest rate commensurate with the riskassociated with the respective receivables.
The fair value is reduced by the carrying value of any debt associated withsuch properties.
62
KS95.1-AnnualReport for Web 5/15/01 2:28 PM Page 65

63
(b) U.S. EquityThe market value of marketable equity securities are based on quoted marketprices, and if applicable, discounted for time restrictions.
(c) Non-U.S. Equity The market value of marketable equity securities are based on quoted marketprices, and if applicable, discounted for time restrictions.
(d) Fixed IncomeThe market value of marketable debt securities are based on quoted marketprices.
(e) Venture and Private Equity Different techniques and many factors were considered in deriving the marketvalue of these investments. Several investments have been valued based on theunderlying asset value. In addition, shares with quoted market prices withrestrictions on the sale of shares were valued at market prices and discountedfor time restrictions. In one case, there is an agreement to sell an investment,therefore, the market value is the anticipated selling price, net of selling costs.
(f) Absolute ReturnDifferent techniques and many factors were considered in deriving the marketvalue of these investments. These investments have been valued based on theunderlying asset value.
(g) EnergyThe market value of these assets was deemed to approximate the carrying value.The carrying value is the basis of the assets reduced by the liabilities of KUKUIOperating Company.
(h) Real Estate (Mainland)Several pooled investments with determinable cash flows were valued on thebasis of their future principal and earnings distributions discounted at prevailinginterest rates for similar investments. Others were valued using the netoperating income multiplied by a capitalization rate.
Different techniques were considered in deriving the market value of directinvestments. Fair value was based on independent appraisals dated at variouspoints in time since 1993, in-house valuations, carrying value of a directfinancing lease and carrying value as impairment was recorded during year.
The market value is reduced by the carrying value of any debt associated withsuch properties.
(3) Total ReturnTotal return is calculated using the Modified BAI Method, a time-weighted rateof return.
KS95.1-AnnualReport for Web 5/15/01 2:28 PM Page 66
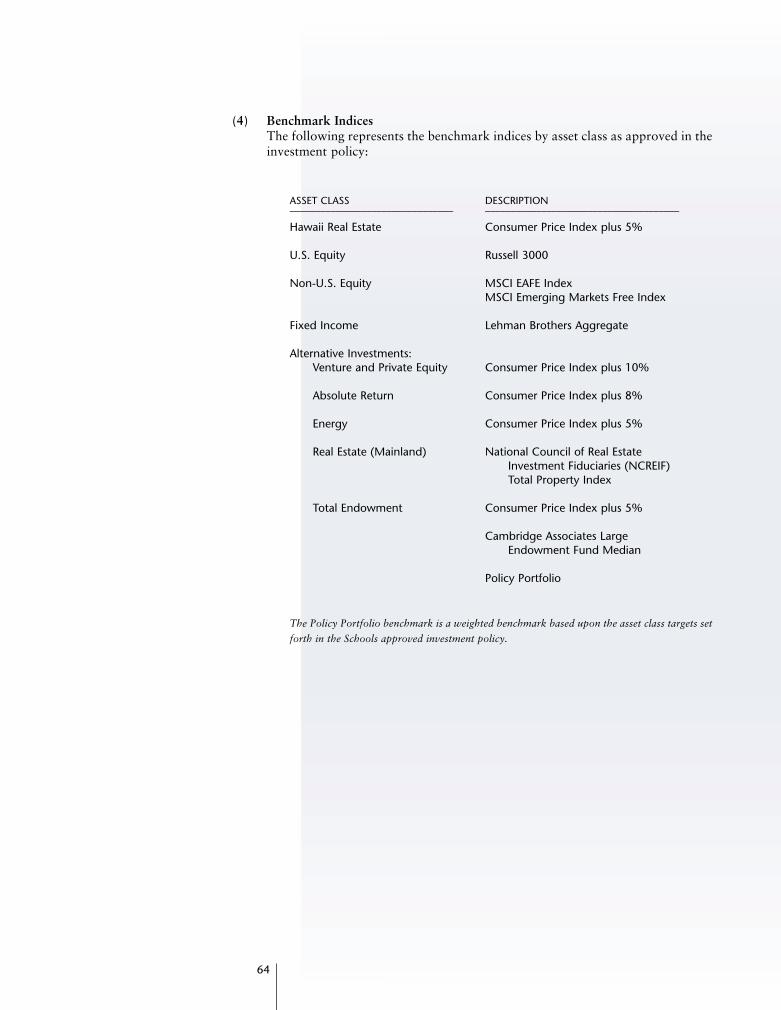
(4) Benchmark IndicesThe following represents the benchmark indices by asset class as approved in theinvestment policy:
ASSET CLASS DESCRIPTION________________________________ ______________________________________
Hawaii Real Estate Consumer Price Index plus 5%
U.S. Equity Russell 3000
Non-U.S. Equity MSCI EAFE IndexMSCI Emerging Markets Free Index
Fixed Income Lehman Brothers Aggregate
Alternative Investments:Venture and Private Equity Consumer Price Index plus 10%
Absolute Return Consumer Price Index plus 8%
Energy Consumer Price Index plus 5%
Real Estate (Mainland) National Council of Real Estate Investment Fiduciaries (NCREIF) Total Property Index
Total Endowment Consumer Price Index plus 5%
Cambridge Associates Large Endowment Fund Median
Policy Portfolio
The Policy Portfolio benchmark is a weighted benchmark based upon the asset class targets set
forth in the Schools approved investment policy.
64
KS95.1-AnnualReport for Web 5/15/01 2:28 PM Page 67

BOARD OF TRUSTEES
Robert K.U. Kihune, ChairJ. Douglas IngConstance H. LauDiane J. PlottsNainoa Thompson
CHIEF EXECUTIVE OFFICER
Hamilton I. McCubbin, Ph.D.
CHIEF EXECUTIVES
Wendell F. Brooks, Jr., Chief Investment Officer
Michael J. Chun, Ph.D., Acting Chief Education Officer
Dwight Kealoha, Acting Chief Administrative Officer
Colleen I. Wong, Chief Legal Officer
Eric K. Yeaman, Chief Financial Officer
Kamehameha Schools student admissions policy is to givepreference to Hawaiians and part-Hawaiians to the extentpermitted by law. The Internal Revenue Service has ruled thatthis policy is non-discriminatory.
KS95.1-AnnualReport for Web 5/15/01 2:28 PM Page 68

Nonprofit OrganizationU.S. Postage
PAIDPermit No. 419
Honolulu, HI
567 South King Street, Suite 301Honolulu, Hawai‘i 96813
KAMEHAMEHA SCHOOLS
KS95.1-AnnualReport for Web 5/15/01 2:28 PM Page 1