
Kalyan's ...... [email protected] The Directive Principles laid down in the Constitution aim at...
182
www.OnlineIAS.com [email protected] www.OnlineIAS.com Indian Economy: www.OnlineIAS.com PLANNING IN INDIA WHAT IS PLANNING? Planning is a process which Involves taking stock of resources, formulation of objectives and priorities, fixation of specific targets, mobilization of resources. establishment of implementation machinery wherever necessary, achieving objectives, and evaluating the performance of planning. Concepts: Planning is distinguished on the basis of time: like short term planning, medium term planning and long-term planning. Physical Planning: Plans are outlined In terms of various physical output targets. Financial Planning: It is planning In terms of allocating the financial resources amongst the various investment avenues. Indicative planning involves influencing investment decisions through fiscal and monetary policies. Fixed Plan: In a fixed five year plan, we have a fixed five year perspective with the first annual plan forming the base for the entire plan period. Rolling Plan: In a five year rolling plan, every year there will be a five year perspective while introducing an annual plan. Kalyan's www.OnlineIAS.com Kalyan's www.OnlineIAS.com 1
Transcript of Kalyan's ...... [email protected] The Directive Principles laid down in the Constitution aim at...
www.OnlineIAS.com [email protected]
www.OnlineIAS.com
Indian Economy:
www.OnlineIAS.com
PLANNING IN INDIA
WHAT IS PLANNING?
Planning is a process which Involves taking stock of resources, formulation of
objectives and priorities, fixation of specific targets, mobilization of resources.
establishment of implementation machinery wherever necessary, achieving
objectives, and evaluating the performance of planning.
Concepts:
Planning is distinguished on the basis of time: like short term planning, medium
term planning and long-term planning.
Physical Planning:
Plans are outlined In terms of various physical output targets.
Financial Planning:
It is planning In terms of allocating the financial resources amongst the various
investment avenues. Indicative planning involves influencing investment
decisions through fiscal and monetary policies.
Fixed Plan:
In a fixed five year plan, we have a fixed five year perspective with the first annual
plan forming the base for the entire plan period.
Rolling Plan:
In a five year rolling plan, every year there will be a five year perspective while
introducing an annual plan.
Kalyan's www.OnlineIAS.com
Kalyan's www.OnlineIAS.com 1

www.OnlineIAS.com [email protected]
www.OnlineIAS.com
Centralised Planning:
Refers to planning from above Here the plan perspective encompasses the
economy as a whole.
Decentralised Planning: Refers to planning from below.
How did planning as a system emerge?
Planning as an economic institution emerged due to the extreme inadequacies of
free enterprise policy with respect to optimal allocation of resources and
maximising social benefit.
Evolution of Indian Planning:
During the Great Depression (1930s) the whole world was caught in a phase of
declining income, output and employment, wilt) the exception of the USSR It
was this success exhibited by the planned economy of Soviet Union, that brought
planning concept to the forefront. India was greatly influenced by this planning
wave. The evolution of Indian planning is briefly outlined below:
1934 : Planned Economy for India, the first systematic work contemplating a
planned economy for India, was written by Visvesvraya.
1938 : Indian National Congress established the National Planning Committee.
However, its work was interrupted by the world war-II and the Quit India
Movement.
1943 : Bombay Plan was presented by a few Bombay industrialists which
emphasised on industrial development with high priority for basic industries like
steel and cement. -
1944 : The British Indian Government set up the Department of Planning and
Economic Development, headed by A.D. Dalal. Its aim was to restore economic
normalcy and also economic development.
1946 : The Planning Advisory Board was constituted to collect relevant matter
for planning In India, by the Interim Government.
Kalyan's www.OnlineIAS.com
Kalyan's www.OnlineIAS.com 2

www.OnlineIAS.com [email protected]
www.OnlineIAS.com
The Directive Principles laid down in the Constitution aim at creating a society
in which all have equal opportunity, right to work and where disparities In income
and wealth have been reduced to the minimum. To translate these ideas into
reality economic planning is a necessity. India suffered from low per capita
income, large population, inefficient production and inequality distribution. To
overcome these problems and to get maximum benefit of scarce resources,
planning was taken up.
Objectives of planning:
The objectives of planning differ from country to country. The major objectives
of planning In India have been
1. Achieving full employment
2. Maximising national per capita income
3. Rapid Industrialisation
4. Self sufficiency in food
5. Reduction of inequalities
1950 : The Planning Commission was established through a Cabinet resolution.
It is not a Constitutional body like the Finance Commission.
1952 : National Development council (NDC) was constituted on the advice of the
Planning Corn- mission through an executive order to serve as the highest
reviewing and advisory body On planning;
FORMATIVE PHASE: Draft Plans: Bombay Plan: A plan was formulated by a
few big industrialists who aimed at doubling per capita income in a period of
fifteen years. The Plan laid emphasis on strengthening the basic industries.
People’s Plan (M.N.Roy): The laid emphasis on agriculture and the consumer
goods industry.
Gandhlan Plan (SM. Agarwal) : The Plan Stressed decentralised economic
system. Agriculture and the allied activities were outlined for development
Mentioned only Draft
Kalyan's www.OnlineIAS.com
Kalyan's www.OnlineIAS.com 3

www.OnlineIAS.com [email protected]
www.OnlineIAS.com
Note: The above mentioned plans were only Draft plans and never implemented
Basic Features of Indian planning:
1. Comprehensive democratic planning
2. Mixed Economy: Coexistence of both the public sector and private sector. But
greater role of the public sector is a dominant feature
3. Balanced Growth Strategy Both the .agricultural and Industrial infrastructure
are to be strengthened.
4. Minimizing foreign assistance, both in terms of aid and transfer of technology
FIRST FIVE YEAR FLAN (1st April, 1951 - 31st March, 1956)
OBJECTIVES:
1. Rehabilitation of Indian economy affected by partition and Second World War,
2. Solving the food crisis,
3. Easing the raw material position particularly in jute and cotton,
4. Checking the inflationary tendencies,
5. Building economic overheads like roads, railways, irrigation and hydro-electric
works,
6. Building administrative organizations needed for carrying out the programmes
of development in India, and
7. Initiating balanced all round development.
OUTLAY:
Public Sector: Rs 1,960 Crores.
PRIORITIES:
Agriculture and allied sectors with 31% of outlay got the first priority,
Transport and communications with 27% outlay and Social Services with 23%
outlay got the second and third priorities respectively.
Industry, with a meagre 4% of the outlay, was neglected.
Kalyan's www.OnlineIAS.com
Kalyan's www.OnlineIAS.com 4

www.OnlineIAS.com [email protected]
www.OnlineIAS.com
PERFORMANCE:
Target
(% growth per
annum)
Achievement
National Income
Per Capita Income
Industrial Production
Agricultural Production
2.1
0.9
7.0
-
3.4
1.2
7.3
4.1
The first Five Year Plan was a grand success as the achievement exceeded the
targets.
- Production of food grains increased by and cotton by 45%.
- Irrigation facilities were provided to 16 million acres of land; over 6 million
acres were benefitted through major irrigation works and 10 million acres through
minor and medium irrigation.
- Shortages in the economy were eliminated.
- The pace level fell by 30% and food prices also declined.
• The Locomotive factory at Chittaranjan Fertilizer factory at Sindri, and I.T.I.
(Indian Telephone Industry) at Bangalore were established.
• Community Development Programme was launched on October 2nd 1952 to
bring about allround development of rural areas with special emphasis on
agriculture.
- Co-op greater attention to agriculture and neglected large scale industries.
Scant attention has been paid to social objectives.
SECOND FIVE YEAR PLAN (1st April, 1956 to 31st March, 1961)
Circumstances under which the plan was launched:
The Five Year Plan was launched In context at the success of the First Five Year
Plan
Kalyan's www.OnlineIAS.com
Kalyan's www.OnlineIAS.com 5
www.OnlineIAS.com [email protected]
www.OnlineIAS.com
Where in the per1orme of agriculture was very good 6nd inflationary tendency
were reversed.
As agriculture did very well during the First Five Year Plan, our planners felt the
time had come for laying emphasis on industry.
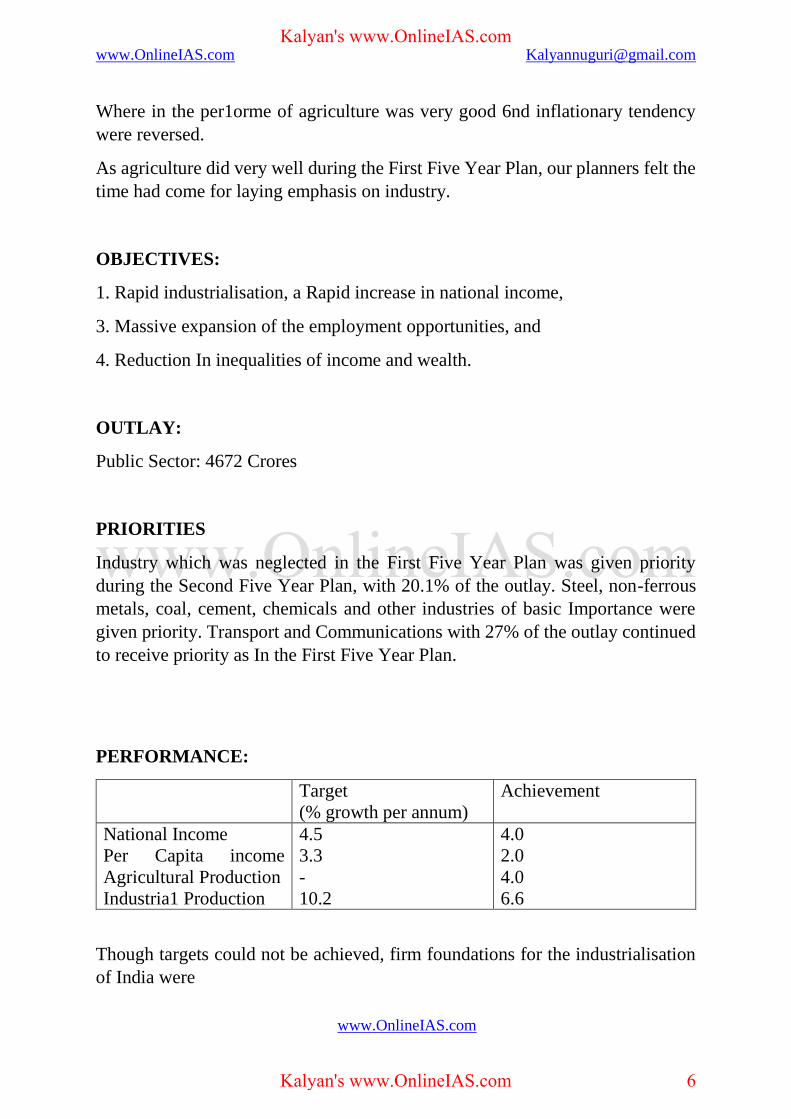
OBJECTIVES:
1. Rapid industrialisation, a Rapid increase in national income,
3. Massive expansion of the employment opportunities, and
4. Reduction In inequalities of income and wealth.
OUTLAY:
Public Sector: 4672 Crores
PRIORITIES
Industry which was neglected in the First Five Year Plan was given priority
during the Second Five Year Plan, with 20.1% of the outlay. Steel, non-ferrous
metals, coal, cement, chemicals and other industries of basic Importance were
given priority. Transport and Communications with 27% of the outlay continued
to receive priority as In the First Five Year Plan.
PERFORMANCE:
Target
(% growth per annum)
Achievement
National Income
Per Capita income
Agricultural Production
Industria1 Production
4.5
3.3
-
10.2
4.0
2.0
4.0
6.6
Though targets could not be achieved, firm foundations for the industrialisation
of India were
Kalyan's www.OnlineIAS.com
Kalyan's www.OnlineIAS.com 6

www.OnlineIAS.com [email protected]
www.OnlineIAS.com
laid with launching of the steel plants at Bhilai (M.P), Rourkela (Orissa), and
Durgapur (West Bengal), heavy engineering plant at Ranchi (Bihar) Lignite
Corporation at Neyveli (Tamil Nadu), and Integral Coach Factory at Perumbur
(Tamil Nadu).
Except in sugar and tea, targets could not be achieved in the production of food
grains, jute, and cotton and oil seeds. Unfavorable monsoons in 1957-58 and
1959-60, in addition to the slow progress in the programme of multiplication of
improved seeds, use of fertilizers and irrigation contributed to this fall in
agricultural production:
Prices of food grains increased all over the country. Prices of imported
machinery also went up. And this was further aggravated by the Suez Crisis as it
affected international supplies to India for a short period. As a result, prices Went
up further.
Foreign exchange balance dwindled from Rs. 700 Crores in 1955-56 to Rs. 100
Crores at the end of the Plan.
CRITICISM:
The Plan gave too much priority to heavy industries neglecting production of food
and consumer goods. This led to balance of payments problem and inflationary
pressures.
THIRD FIVE YEAR PLAN (1st April 1961 to 31st March 1966)
OBJECTIVES:
1. Self-sufficiency in food grains, and increase in agricultural production to meet
the requirements of industry and exports,
2. Expansion of basic industries like steel, chemical industries, fuel and power,
and establishment of machine building capacity
3. Substantial expansion in employment opportunities,
4. Increase in National income of over 5.6 per cent per annum, and
5. Creation of equality of opportunities, and reduction in disparities in income
and wealth.
Kalyan's www.OnlineIAS.com
Kalyan's www.OnlineIAS.com 7

www.OnlineIAS.com [email protected]
www.OnlineIAS.com
OUTLAY :
Public Sector :Rs. 8,577 Crores.
PRIORITIES:
Agriculture, Industry, Transport and Communication were given priority.
PERFORMANCE :
Performance of the Third Five Year Plan was very poor. Achievement was much
below the targets.
The performance in agriculture in particular was very bad. Prices of food and
other essential commodities rose. Causes for the poor performance of this plan
were: 1962 Chinese aggression, 1965 Indo- Pak war, and failure of monsoons,
particularly in 65-66. Except in 1964-65 in all other years of the plan monsoons
failed in some region or the other.
THREE ANNUAL PLANS
1st April 1966 to 31st March 1967
1st April 1967 to 31st March 1968
1st April 1968 to 31st March 1969
As the planning process got seriously affected because of wars and drought
during the 3rd Five Year Plan, Five Year Planning was given up till economic
Target
(Per annum)
Achievement
National income
Per Capita Income
Agricultural production
Industrial Production
5.6
3.2
6.0
10.7
2.2
0.2
-1.4
9.0
Kalyan's www.OnlineIAS.com
Kalyan's www.OnlineIAS.com 8

www.OnlineIAS.com [email protected]
www.OnlineIAS.com
normalcy was restored. Instead, Annual Plans were launched for three years. This
period is also known as Plan Holiday.
During 1966-67, the economy did not do well because of drought. Performance
of both agriculture and industry was bad. Only 76 million tons of food was
produced, which was substantially lower than 89 rnillion tonnes of 1964-65 To
meet the shortage, 8.7 million tonne of food were imported.
The economy started recovering during 1967-68 and continued during 1968-69.
Food production
during 67-68 was good partly because of new agricultural strategy based on High
Yielding Seeds and partly because of good monsoons. This increased production
was maintained during 1968. 69. Prices of food grains started falling because of
improved supply position. Thu, economic stability was restored.
FOURTH FIVE YEAR PLAN (1st April, 1969 to 31st March, 1974)
OBJECTIVES:
1. Growth with stability in terms of prices,
2. Achievement of 5.5% Annual growth of national income,
3. Achievement of self-reliance by doing away with PL-48O, imports of food
grains and reducing foreign aid by about half by the end of 4th plan,
4. Achieving social justice and equality through greater creation of diffusion of
ownership of means of production1 and employment
5. Correcting imbalance in development among different States and regions in
the country.
OUTLAY:
Public Sector :. Rs. 15, 779 Crores
PRIORITIES:
Agriculture and allied sectors were given the highest priority by allocating 23.3%
of the outlay. The allocation to industry was only 18.2%. Trans. port and
Communications with 19.5% outlay was given relatively lesser percentage
compared to the earlier plans. Family Planning was given considerable
Importance with Rs. 278 Crores of allocation.
Kalyan's www.OnlineIAS.com
Kalyan's www.OnlineIAS.com 9

www.OnlineIAS.com [email protected]
www.OnlineIAS.com
PERFORMANCE:
The Fourth plan was also not a success as the achievements fell short of the targets
substantially.
Though high yielding seeds brought considerable Improvement in wheat
production, their success was marginal in the case of rice, jute, cotton, and pulses
continued to be problem areas.
Performance of the industrial sector was bad because of low output in steel,
metals and metal products, non-electrical machinery, textile, sugar etc. This was
mainly because of power shortage.
Summing up:
The Fourth Plan turned out to be a Plan with shortfalls all along:
10.8% Food
10% Oil seeds
15% Sugar
18% Cotton and Jute
16.7% Cement
8.2% Irrigation
17.3% Power
All these shortages indicate a poor performance Absence of general price
stability. Developments in Bangladesh and consequent Indo-Pak war in 1971 and
Target
(Per annum)
Achievement
National income
Per Capita Income
Agricultural production
Industrial Production
5.7
-
5.0
8.1
3.3
0.6
2.9
4.7
Kalyan's www.OnlineIAS.com
Kalyan's www.OnlineIAS.com 10

www.OnlineIAS.com [email protected]
www.OnlineIAS.com
drought in 1972 virtually robbed the Fourth Plan of the boost that it was to give
to the economy
FIFTH FIVE YEAR PLAN (1st Apr11, 1974 - 31st March, 1979)
This Fifth Five Year plan was terminated one year
aheadofthescheduleOn3lstMarch,1978as the Janatha Party Government wanted
to introduce Rolling Plan in place of Five Year Plans.
The Fifth Year Plan under went many changes because of changes in the
leadership of the Planning Commission. An approach to the Fifth Plan was
prepared by the Planning Commission when Mr. C. Subrahmanyam was the
Planning Minister. Later Mr. D.P. Dhar replaced him as Planning Minister. He
got prepared an another approach to the Fifth Plan. This approach document was
further revised and a new draft Fifth Five Year Plan was prepared. Later Mr. D.P.
Dhar passed away. Mr. P.N. Haksar became Deputy Chairman of the Planning
Commission. As a result, the Fifth Five Year plan was again revised.
OBJECTIVES :
1. Removal of poverty, and
2. Attainment of self-reliance were the two major objectives of the Fifth Five
Year Plan which called for higher growth, better distribution of income, and
radical increase in domestic rate of saving.
3. 5.5% growth of GDP.
4. An adequate public procurement and distribution system for assured supply of
essential consumption goods, at least to the poorer sections at reasonably stable
prices.
5. A National Programme for Minimum Needs covering elementary education,
drinking water, medical care in rural areas, nutrition, house sites for the landless
labourers, rural roads, rural electrification and slum improvement
6. Vigorous export promotion and imports substitution. And
7. Expansion of productive employment opportunities.
OUTLAY:
Kalyan's www.OnlineIAS.com
Kalyan's www.OnlineIAS.com 11
www.OnlineIAS.com [email protected]
www.OnlineIAS.com
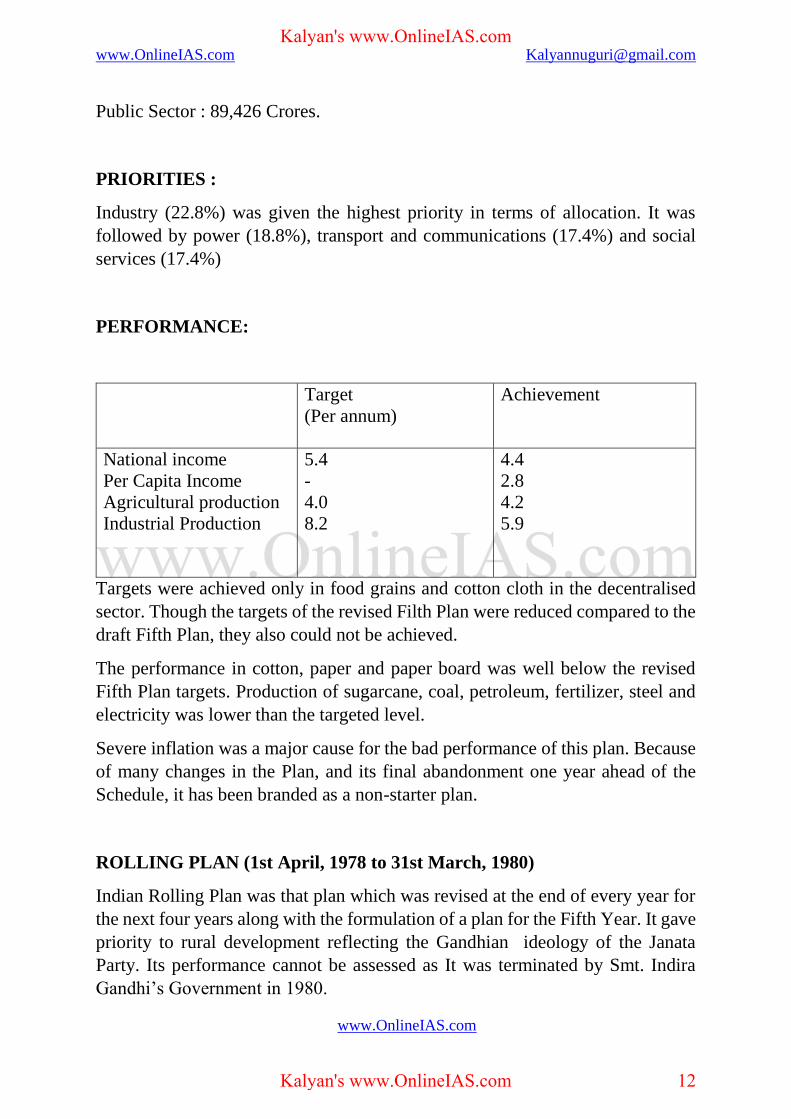
Public Sector : 89,426 Crores.
PRIORITIES :
Industry (22.8%) was given the highest priority in terms of allocation. It was
followed by power (18.8%), transport and communications (17.4%) and social
services (17.4%)
PERFORMANCE:
Targets were achieved only in food grains and cotton cloth in the decentralised
sector. Though the targets of the revised Filth Plan were reduced compared to the
draft Fifth Plan, they also could not be achieved.
The performance in cotton, paper and paper board was well below the revised
Fifth Plan targets. Production of sugarcane, coal, petroleum, fertilizer, steel and
electricity was lower than the targeted level.
Severe inflation was a major cause for the bad performance of this plan. Because
of many changes in the Plan, and its final abandonment one year ahead of the
Schedule, it has been branded as a non-starter plan.
ROLLING PLAN (1st April, 1978 to 31st March, 1980)
Indian Rolling Plan was that plan which was revised at the end of every year for
the next four years along with the formulation of a plan for the Fifth Year. It gave
priority to rural development reflecting the Gandhian ideology of the Janata
Party. Its performance cannot be assessed as It was terminated by Smt. Indira
Gandhi’s Government in 1980.
Target
(Per annum)
Achievement
National income
Per Capita Income
Agricultural production
Industrial Production
5.4
-
4.0
8.2
4.4
2.8
4.2
5.9
Kalyan's www.OnlineIAS.com
Kalyan's www.OnlineIAS.com 12

www.OnlineIAS.com [email protected]
www.OnlineIAS.com
SIXTH FIVE YEAR PLAN (1st April, 1980 to 31st March, 1985)
OBJECTIVES :
1. Speedy development of indigenous sources of energy with proper emphasis on
conservation and efficiency r energy use.
2.Strengthening the process of modernisation for the achievement of economic
and technological self-reliance.
3. Protection and improvement of ecological and environmental assets.
4. Controlling the population growth through voluntary acceptance of small
family norm.
5. progressive reduction in the incidence of poverty and unemployment
6. improving the quality of life of people in general with special reference to the
socially and economically handicapped population through a Minimum Needs
Programme.
7. progressive reduction in regional inequalities, and
8. Significant step-up in the growth of the economy.
OUTLAY:
Public Sector (Proposed) 97,500 Crores Actual : 1,1000O Crores
Regarding the moblisation of resources, 94.3% of the total investment came from
domestic resources.
PRIORITIES :
1. Energy was given the highest priority with 27.9% allocation of the public sector
outlay.
2. Agriculture and allied sectors with 23.9% of the public sector outlay got second
priority.
STRATEGY:
Kalyan's www.OnlineIAS.com
Kalyan's www.OnlineIAS.com 13

www.OnlineIAS.com [email protected]
www.OnlineIAS.com
Strategy of the Plan involves simultaneously strengthening the Infrastructure for
the agriculture and industry, and providing employment opportunities
particularly in the rural areas through special programmes .
PERFORMANCE:
ACHIEVEMENTS :
The growth rate target of 5.2% has been achived
Agriculture :
Foodgrains production target has also been achieved.
The performance in irrigation is impressible though targets could not be achieved.
Infrastructure :
Crude Oil production target has been exceeded with 29.43 million tonnes of
production in 1984-85.
The performance in power production is also impressive though it tell short of
targets both n addition of installed capacity and generation.
The Government of India claimed that the percentage of the people below poverty
line has been brought down from 48.8% in 1960 to 37% by the end of the Plan,
which meant a decrease in the number of people below poverty line from 335
million to 273 million. Price rise was not high.
Target
(Per annum)
Achievement
National income
Per Capita Income
Agricultural production
Industrial Production
5.2
3.5
3.8
6.9
5.2
2.7
4.3
3.7
Kalyan's www.OnlineIAS.com
Kalyan's www.OnlineIAS.com 14

www.OnlineIAS.com [email protected]
www.OnlineIAS.com
SHORTCOMINGS :
Agriculture:
Shortages in oil seeds and sugarcane have cropped up.
Infrastructure:
Performance of railways and coal was not upto the mark. Power production
targets were not achieved.
Industry:
Production of fertilizers, steel, power equipment, etc., were short of expectations.
Export performance also fell short of the targets.
GENERAL COMMENTS :
The positive performance in the oil sector and foodgrains production has greatly
contributed to the success of 6th Plan. The achievement of 5.2% growth target is
not significant, if the fact of the poor performance to the base year (1979-80) is
taken into account.
SEVENTH FIVE YEAR PLAN (1st April, 1985 to 31st March 1990)
OBJECTIVES :
1. Improved efficiency
2. Growth rate of 5% in G.D.P.
3. Social justice, and
4.Self-reliance
OUTLAY :
Public Sector : 180,000 crores
Kalyan's www.OnlineIAS.com
Kalyan's www.OnlineIAS.com 15

www.OnlineIAS.com [email protected]
www.OnlineIAS.com
Professed Priorities :
1. Food
2. Work, and
3. Productivity
Priorities In terms of allocation :
Energy was given the highest priority with 30.5% of the public sector outlay.
Agriculture got the second priority with 22% of the public sector outlay. Social
service got the third priority with 17.2 percent of the public sector outlay.
PERFORMANCE OF THE 7th FIVE YEAR PLAN
The 7th Five Year Plan was a success as it exceeded the targeted growth of 5.0%
by achieving 5.5% growth rate. The economy for the first time exhibited
resilience as it withstood the shock of severe drought in the 3rd year of the Plan.
The Growth rate was achieved in spite of drought, because of accelerated growth
in industrial sector.
Agriculture: Record level of Food Production of 172 million tonnes was
achieved during this Plan. Oil Seeds production has gone upto 15 million tonnes.
Industry: 8.5% average growth rate in spite of drought is- significant except in
the last year.
Infrastructure: Coal, Power, Railways and Ports have also done well.
Exports: Performance of exports was exceedingly good.
Negative features of 7th Five Year Plan.
Balance of payments position was bad.
Deficit of Rs.29,000 crores was more than double the target of Rs.14,000 crores.
Financing of the Plan through inflationary methods of borrowing and deficit
financing was also bad.
Pulses production continued to be an area of concern.
Kalyan's www.OnlineIAS.com
Kalyan's www.OnlineIAS.com 16

www.OnlineIAS.com [email protected]
www.OnlineIAS.com
Industrial sickness particularly in small sector.
Power shortage continued to persist.
The growth rate of the employment generation was stagnant. Crude Oil
production was also almost stagnant.
EIGHTH PLAN (1992-97)
Objectives :
The Eighth Five Year Plan (1992-97) , launched on 1st April 1992, aimed at 5.6%
growth rate.
i. Generation of adequate employment to achieve near full employment level by
the turn of the century;
ii. Containment of population growth through people’s active cooperation and an
effective scheme of incentives and disincentives.
iii. Universalisation of elementary education and complete eradication of
illiteracy among the people In the age group of 15 to 35 years;
iv. provision of safe drinking water and primary health facilities, including
immunisation, accessible to all villages and the entire population, and complete
elimination of scavenging;
v. Growth and diversification of agriculture to achieve self sufficiency in food
and generation of surplus for exports.
vi. Strengthening the infrastructure (energy, transport, communication, irrigation)
in order to support the growth process on sustainable basis.
PRIORITY AREAS:
The priority of the 8th Plan was Human Development. To ensure this, generation
of employment opportunities, population control universal elementary education
& eradication of illiteracy, provision of health care facilities including safe
Kalyan's www.OnlineIAS.com
Kalyan's www.OnlineIAS.com 17

www.OnlineIAS.com [email protected]
www.OnlineIAS.com
drinking water and elimination of scavenging were given major emphasis by the
Government.
As Human Development is not possible without economic growth, strengthening
of infrastructural facilities like energy, transport and communications were given
priority. Growth and diversification of agriculture would be given the emphasis
to not only achieve sell sufficiency in food but also generate surplus for exports.
For better implementation of the. Plan, it aimed at involving Panchayati Raj
bodies, Nagar Pahkas, NGOs, etc. in the formulation and implementation of the
Plan.
PLAN OUTLAY:
The total investment of the Plan was fixed at Rs. 7.98,000 crores. 55% of this
amount was shared by the private sector and the remaining 45% of the investment
provided by the Public Sector. The outlay of Public Sector was fixed at Rs.
4,34,100 crores.
Out of this the Central Plan would be Rs. 2,47,865Crores while the plan of the
states and Union Territories would be Rs. i86 235 crores. The budgetary support
to the Plan f9nding would b Rs. 1.88,475 crores.
The Planning Process:
Planning and market mechanism should be so dovetailised that one is
complementary to the other. Market mechanism must serve as an efficiency
promoting devise’. whale planning will be the larger guiding force, keeping the
long term social goals in the perspective
Performance of the Eighth Plan:
Kalyan's www.OnlineIAS.com
Kalyan's www.OnlineIAS.com 18

www.OnlineIAS.com [email protected]
www.OnlineIAS.com
NINTH FIVE YEAR PLAN
On January 9, 1999. the Union Cabinet of the BJP led coalition Government off
acted certain changes in the Draft of the 9th Five Year Plan approved by the
United Front Government1 as the growth rates in GDP in the first two years of
9th Five Year Plan were only 5% in 1997-98 and 5.8% in 1998-99, against the
average 9th Plan target of 7%, and also due to the inadequate availability of funds.
Revised Targets of the 9th Five Year Plan
REVISED ORGINAL
1) Growth Rate 6.5% 7%
2)Agriculture and allied Sectors 3.9% 4.5%
3)Industry (Manufacturing only) 8.2% 9.7%
Objectives:
The objectives of the Ninth Five Year Plan are:
i. accelerating agriculture and rural development with a view to generating
adequate productive employment and eradication of poverty.
ii. achieving 6.5% growth rate of the economy with stable prices.
iiii. ensuring food and nutritional security for all, particularly the vulnerable
sections of society.
iv. providing the basic minimum services of safe drinking water, primary health
care facilities, universal primary education, shelter, and connectivity to all in a
time bound manner.
v. containing the growth rate of population.
vi. Ensuring environmental sustainability of the development process through
social mobilisation and Participation of people at all levels.
Target
(Per annum)
Achievement
National income
Agricultural production
Industrial Production
5.6%
3.1%
7.5%
6.54%
4.72%
7.29%
Kalyan's www.OnlineIAS.com
Kalyan's www.OnlineIAS.com 19

www.OnlineIAS.com [email protected]
www.OnlineIAS.com
vii. empowerment of women and socially disadvantage groups such as scheduled
Castes, Scheduled Tribes and Other Backward Classes and Minorities as agents
of socio-economic changes and development,
viii. promoting and developing people’s participatory institutions like Panchayati
Raj cooperatives and self-help groups, and
ix. strengthening efforts to build set-reliance
Priorities:
Among the objectives of Ninth Five Year Plan, priority is given to agriculture and
rural development which have immense employment potential, accelerated
economic growth rate, and containing population growth.
Outlay:
The Planning Commission estimated a total plan outlay of Rs.20,00,000 crores
which is a 20 percent step up in real terms over the projected Eighth Plan
allocations.
The State Plans are to account for 45 percent of the Public Sector outlay of
Rs.8,59,000 crores.
Suggestions for mobilisation of resources:
The Planning Commission called for
Augmentation of non-tax revenues through revision of user charges for
power and irrigation and royalties on minerals.
introduction of expenditure based Presumptive income Tax,
tapping unaccounted money, rationalizing and widening the base of tax
structure, and
Increasing savings in all sectors: domestic, corporate and even
government savings also.
The planning commission suggested that subsidies should not exceed R.72,800
Crores in the ninth plan period. This can be done only by linking administered
prices with the increase in their costs.
The Prime Minister said that to achieve an economic growth of 6.5 percent the
country has to take some difficult decisions like containing fiscal deficit,
Kalyan's www.OnlineIAS.com
Kalyan's www.OnlineIAS.com 20

www.OnlineIAS.com [email protected]
www.OnlineIAS.com
rationalization of User changes for power and irrigation disinvestment of public
sector enterprises and focused subsidies.
Elaborating on the broad theme approach to the Ninth Plan, the Prime Minister
said that no significant dent could be made on poverty and unemployment without
rapid and sustained growth. Equitable growth, he said, requires a special focus on
agriculture and rural non-farm activities as a dynamic rural sector was both an
enabling condition for industrialization and an end in itself He mentioned poor
state of infrastructure as the most pressing constraint for growth.
Performance of the Ninth Plan:
Target Achievement
GDP Growth Rate 6.5% 5.52%
Agriculture 3.9% 2.44%
Industry 8.2% 4.29%
Services 8.5% 7.82%
TENTH FIVE YEAR PLAN 2002-07
Highlights:
Objectives and Targets:
• achieving an 8% economic growth rate during 2002-2007,
- generating 50 million new jobs in the next five years,
- reducing poverty levels from the present 26 per cent to 21 per cent of the
population by 2007,
- reducing the decadal population growth rate between 2001 & 2011 to 16.2%
from 21.3% registered during 1991-2001,
- increasing literacy levels up to 75 per cent of the population, taking appropriate
measures to enroll all children in schools by 2003, so that they complete five
years of primary education by 2007,
• providing clean drinking water facility to all the villages in the country,
- cleaning all the major polluted rivers,
- increasing the forest cover to 25 per cent,
Kalyan's www.OnlineIAS.com
Kalyan's www.OnlineIAS.com 21

www.OnlineIAS.com [email protected]
www.OnlineIAS.com
Mobilisation of Resources :
- Rs. 15,92,300 crores of Public Sector resources of the Centre, States and UT’s
• raising FDI inflows to the extent of $7.5 billion per annum during 2002-2007,
• gathering Rs. 78,000 crores through disinvestment In PSUs,
- increasing Investment rate up to 28.4% of the G.D.P.,
• increasing Tax-GOP ratio to 10.3 per cent,
• widening the tax base and increasing the collections,
- introducing an integrated central and state VAT,
- cutting subsidies and administrative overhead costs to prune expenditure,
• establishing major airports in partnership with the private sector, and
• dismantling barriers to inter-state trade, are the highlights of the 10th Five Year
Plan for the period 2002-2007 approved by the Planning Commission under the
Chairmanship of Prime Minister Atal Bihari Vajpayee in New Delhi, on October
5, 2002.
Details :
The Planning Commission, stressed the need to achieve an eight per cent
economic growth rate over the next five years and advocated stringent measures
like accelerating tax reforms, moving towards an integrated central and state
Value Added Tax (VAT) for goods and services, striving for fiscal prudence at
both the center and state levels, improving the capital output ratio, and removing
bottlenecks in energy, transport and water infrastructure to reach the targets set
by the draft 10th Five Year Plan.
The plan proposed to carry forward key reforms. particularly in agriculture, td
generate 50 million jobs in the next five years besides raising FDI flow to $7.5
billion annually and gather Rs. 78,000 crore through disinvestment
It noted that the key to achieving the growth target would be to shift capital to
those areas where the returns are high So that additional demand Is created
through employment which Will increase the purchasing power of the People.
The eight per cent growth rate would require an Investment of 28.4 per cent of
the GDP which would be met from domestic savings of 26.8 per cent of GDP and
external Savings of 1.6 per cent. The public sector outlay has been pegged at
Kalyan's www.OnlineIAS.com
Kalyan's www.OnlineIAS.com 22

www.OnlineIAS.com [email protected]
www.OnlineIAS.com
Rs.15,92,300 crore which includes Rs. 9,21,291 crore as central outlay and Rs.
6,71 ,009 crore as states’ plan outlay.
Acknowledging the role of good governance in enhancing efficiency, the plan
underlined the need to strengthen Panchayati Raj institutions and urban local
bodies to increase people’s participation in development process.
It also emphasised undertaking revenue and judicial reforms, right sizing the
government, improving transparency and accountability, using it for good e-
governance, enactment of right to information act and involvement of civil
society as partners in development.
Agriculture:
The tenth plan identified an eight point key reform agenda in agriculture. The key
reforms proposed include elimination of inter-state barriers to trade, amendment
to Essential Commodities Act and Agricultural Marketing Act, liberalizing agri-
exports, encouraging contract farming and consolidating various acts dealing
with food sector into a comprehensive food law. The agenda also proposes futures
trading in all commodities and removal of restrictions on financing of stocking
and trading.
Industry:
A six point agenda on industrial reforms was envisaged to improve efficiency,
neurial energy and promote rapid and sustainable growth. They include enacting
labour reforms, proposed repeal of Sick Industrial Companies Act (SICA),
strengthening bankruptcy and fore closure Laws to facilitate transfer of assets,
early enactrnent of Electricity Bill, Coal Nationalization Bill and Communication
Convergence Bill.
The plan also seeks to abolish restrictions an encourage decontrol of private road
transport., passenger services and private sector participation in road
maintenance. It proposed to expedite the formulation of civil aviation policy and
development of major airports with active private participation.
Balanced Regional Development:
The plan aims at promoting balanced and equitable regional development and for
the first time it has devoted a separate chapter to state-wise breaks up of targets
Kalyan's www.OnlineIAS.com
Kalyan's www.OnlineIAS.com 23

www.OnlineIAS.com [email protected]
www.OnlineIAS.com
in order to provide the requisite focus. Proposing a plan strategy for states, the
document envisages resource mapping at the block level. Special focus has been
laid on the North Eastern States. 100 most backward districts would be given
special assistance by way of Rashtriya Sam Vikas Yojana.
Approval by the Cabinet and NDC :
The plan was approved by the Union Cabinet on October 29, 2002, and by the
National Development Council (NDC) on December 21, 2002. Macro-
Parameters for the Tenth Plan
(2002-07)
IX Plan X Plan
1. Domestic Savings Rate (% of
GDPmp)
2. Current Account Deficit (% of
GDPmP)
3. Investment Rate (% of the GDPmp)
(1+2)
4. ICOR
5. GOP Growth Rate (% per annum)
(3/4)
6. Export Growth Rate (% per annum)
7. import Growth (% per annum)
23.31
0.90
24.23
4 53
5.35
6.91
9.80
26.84
1.57
28.41
3.58
7.93
12.38
17.13
Note: GDPmp implies Gross Domestic Product at market Prices
Source Planning Commission, Tenth Five Year Plan (2002-2007)
Sectoral Allocations of public Sector Resources for the Ninth And Tenth Plan
Ninth
Plan
Tenth
Plan
%
Amount % Amount % Increase
(1) (2) (3) (4)
Kalyan's www.OnlineIAS.com
Kalyan's www.OnlineIAS.com 24

www.OnlineIAS.com [email protected]
www.OnlineIAS.com
1. Agriculture & Allied Activities
2. Rural Development
3. Special Area Programmes
4. Irrigation & Flood Control
5. Energy
6. Industry and Minerals
7. Transport
8. Communications
9. Science, Technology &
Environment
10. General Economic Services
11. Social Services
12. General Services
Total
37,239
88,965
5,408
69,830
2,19,243
44,695
1,43,249
92,836
15,667
13,734
1,94,529
15,646
9,41,041
3.9
9.5
0.5
7.4
23.2
4.7
15.2
9.9
1.7
1.5
20.7
1.7
100.0
58,933
1,21,928
20,879
1,03,315
4,03,927
58,939
2,25,977
98,968
30,424
38,630
3,47,391
16,328
15,25,639
3.9
8.0
1.3
6.8
26.5
3.9
14.8
6.5
2.0
2.5
22.8
1.0
100.0
58.3
37.1
286.1
48.0
84.2
31.9
57.8
6.6
94.2
181.3
78.6
4.4
62.1
Source: Planning Commission . Tenth Five Plan(2002-07)
Final Performance of 10th Plan
Target Achievement
GDP Growth (%)
Agriculture (%)
Industry
Services
Domestic Savings Rate %of GOP at Market
Prices
Investment Rate % of GDP at Market Prices
8
4
8.9
9.3
26.84
28.41
7.76
2.30
9.17
9.30
30.9
32.4
ELEVENTH FIVE YEAR PLAN (2007-2012)
Highlights:
On December 19, 2007, the National Development Council approved the 11,’
Five Year Plan that aims at sustaining
Kalyan's www.OnlineIAS.com
Kalyan's www.OnlineIAS.com 25

www.OnlineIAS.com [email protected]
www.OnlineIAS.com
- 8.1per cent overall growth in G.D.P, Contributed by 4 per cent agricultural
growth, 10 to 11 per cent industrial growth, and 9 to 11 per cent growth in
services.
Attaching highest priority to education; rural development, agriculture, irrigation
and health, the Plan earmarks more than half of the budgetary support toward
these areas. The total outlay for the plan is Rs.36,44,718 crore, of which
budgetary support would be Rs.10,96,860 crore. Education Outlay Increased to
19 per cent : The Plan outlay for the education sector has been raised from 7.68
per cent of the Centre’s Gross Budgetary Support (GBS) in the 10 Plan to 19 per
cent In the 11th Plan. Education is best hope for achieving inclusiveness and for
spreading development to backward regions and marginalized groups.
Apart from strengthening the Sarva Shiksha Abhiyan (SSA) programme,
government plans to establish 6,000 model schools in all blocks, 30 new central
universities, and 370 new colleges in educationally backward districts in the 11’
Plan period
Also, to give a push to professional education In the country, the government
plans to setup 8 HITs and 7IIMs by 2011-12.
Additionally, with a view to provide vocational training to more than 1 crore
students, the government also plans to set up 1,600 new Industrial Training
Institutes (IITs) and polytechnics, 10000 new vocational schools and 50.000 new
skill development centers.
Monitor able Targets of the 11th Five Year Plan:
The Commission also listed the socioeconomic targets that will require
monitoring throughout the Plan period to ensure that the growth process is
beneficial to the masses. Some of the important targets are :
• doubling per capita income by 2016-17,
- creating 7 crore new jobs.
• reducing educated unemployment rate to below 5 per cent,
- reducing dropout rate of school children to 20 per cent from 52 per cent,
- Increasing literacy rate to 80 per cent.
- reducing infant mortality rate to 28 per 1000 births and maternal mortality rate
to 1 per 1,000 births,
Kalyan's www.OnlineIAS.com
Kalyan's www.OnlineIAS.com 26

www.OnlineIAS.com [email protected]
www.OnlineIAS.com
- providing clean drinking water to all by 2009,
- improving sex ratio t 935 by 2011-12 and 950 by 2016.17,
• Access to electricity to all by 2009,
• Tele-connectivity to every village by November 2007,
• Broadband connectivity to all villages by 2011-12,
- Road to all villages with 1,000 populations by 2009,
- Increasing forest cover and tree cover by 5 percent,
- achieving WHO standard air quality in major cities by 2011-12,
- treating all urban waste water by 2011-12 to clear rivers.
Thrust Areas of the Eleventh Plan
Sectors Thrust Areas
Education
Health, Nutrition, Drinking
Water, and Sanitation
Agriculture and Irrigation
Rural Development, Land
Resources and Panchayati Raj
Quality Upgradation in Primary
Education, Expansion of
Secondary Education, major
emphasis on Upgradation of
Higher Education including
Technical Education, ICT
throughout education system.
Major Upgradation of rural
health infrastructure, Medical
education,
Nutritional Support to children
and pregnant and lactating
women through ICDS, health
insurance based urban health
facilities, Health care for elderly,
achieving sustainability,
improvement in service levels
and moving towards universal
access to safe and clean drinking
water.
Ensuring Food Security,
Supporting State-specific
agriculture strategy and
programmes, Better seed
Kalyan's www.OnlineIAS.com
Kalyan's www.OnlineIAS.com 27

www.OnlineIAS.com [email protected]
www.OnlineIAS.com
Social Justice and Empowerment
Physical Infrastructure
Energy
Scientific Departments
production, Focused agricultural
research, Extension,
Development of modem
markets.
Universalization and
improvement in pro me delivery
of NREGP, Integrated
Watershed management
including management of
underground water level.
Special attention to the needs of
SCs, STs and minorities and
other excluded groups through
pre and post-metric scholarship,
Hostels for boys/girls, Income
and employment generation
opportunities, Multi-sectoral
development programmes for
minorities in minority
concentration districts.
Emphasis on the public—private
partnership in investment,
policies to ensure time bound
creation of world-class
infrastructure, especially in
remote and inaccessible rural
areas and NE, Hinterland
connectivity through improved
rail and road Infrastructure.
Electrification of all villages and
extending free household
connections to all 2.3 crore BPL
households through RGGVY,
Nuclear power development.
Development of satellite launch
capabilities; GSLV-Mk-lll,
Development of new energy
systems, viz, advance heavy
water reactor and
nanotechnology.
Kalyan's www.OnlineIAS.com
Kalyan's www.OnlineIAS.com 28
www.OnlineIAS.com [email protected]
www.OnlineIAS.com
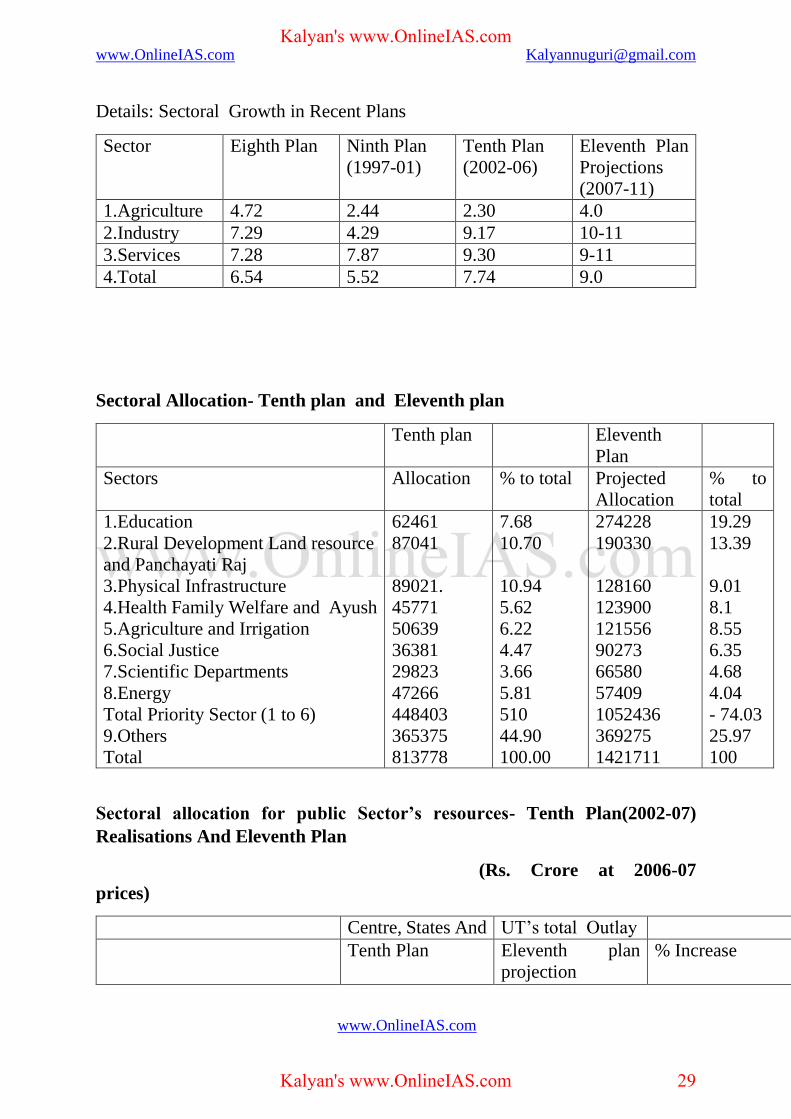
Details: Sectoral Growth in Recent Plans
Sector Eighth Plan Ninth Plan
(1997-01)
Tenth Plan
(2002-06)
Eleventh Plan
Projections
(2007-11)
1.Agriculture 4.72 2.44 2.30 4.0
2.Industry 7.29 4.29 9.17 10-11
3.Services 7.28 7.87 9.30 9-11
4.Total 6.54 5.52 7.74 9.0
Sectoral Allocation- Tenth plan and Eleventh plan
Tenth plan Eleventh
Plan
Sectors Allocation % to total Projected
Allocation
% to
total
1.Education
2.Rural Development Land resource
and Panchayati Raj
3.Physical Infrastructure
4.Health Family Welfare and Ayush
5.Agriculture and Irrigation
6.Social Justice
7.Scientific Departments
8.Energy
Total Priority Sector (1 to 6)
9.Others
Total
62461
87041
89021.
45771
50639
36381
29823
47266
448403
365375
813778
7.68
10.70
10.94
5.62
6.22
4.47
3.66
5.81
510
44.90
100.00
274228
190330
128160
123900
121556
90273
66580
57409
1052436
369275
1421711
19.29
13.39
9.01
8.1
8.55
6.35
4.68
4.04
- 74.03
25.97
100
Sectoral allocation for public Sector’s resources- Tenth Plan(2002-07)
Realisations And Eleventh Plan
(Rs. Crore at 2006-07
prices)
Centre, States And UT’s total Outlay
Tenth Plan Eleventh plan
projection
% Increase
Kalyan's www.OnlineIAS.com
Kalyan's www.OnlineIAS.com 29

www.OnlineIAS.com [email protected]
www.OnlineIAS.com
1. Agriculture and Allied
Activities
2. Rural Development
3. Special Area Programmes
4. irrigation & Flood Control
5, Energy
6. Industry & Minerals
7. Transport
8. Communications
9. Science, Technology &
Environment
10. General Economic
Services
11 Social Services
12.General Services
Total
60702
137710
16423
112415
363635
64655
263934
82945
28673
30349
436529
20489
1618460
136381
301069
26329
210326
854123
153600
572443
95380
87933
62523
1102327
42283
3644718
124:7
118.6
60.3
87.1
134.9
137.6
116.9
15
206.7
106.0
152.5
106.4
125.2
Note: Based on the sectoral outlay reported by the states. Totals may tally due to
rounding errors.
Macro economic Parameters
Tenth plan Eleventh
plan
1. Invisible Rate (% of GDPmp)
2. Domestic Savings Rate (% of GDPmp)
3. Current Account Deficit (% of GDPmp)
4. ICOR
5. GDP Growth Rate (% per annum)
32.4
30.9
1.5
4.3
7.5
36.7
34.8
1.9
4.1
9.0
Note: GDPmp=GDP at market prices.
Public sector allocations for Eleventh Plan
(Rs crore at 2006-07 prices)
Centre
Kalyan's www.OnlineIAS.com
Kalyan's www.OnlineIAS.com 30

www.OnlineIAS.com [email protected]
www.OnlineIAS.com
Sources of funding Allocation
1. Budgetary Support
2. IEBR (Internal and Extra Budgetary Resources)
3. Total Centre(1+2)
1 096860
1059711
2156571
States and UTs
Sources of funding Allocation
4, State Own Resources
5. Central assistance to State/UT Plan
8. Total States & UTs (4+5)
1163296
324851
1488147
Total public Sector Outlay
7.Grand total (3+6) 3644718
Source: Planning Commission
PLANNING COMMISSION’S INDIA VISION 2020’ DOCUMENT
On January 23, 2003, Planning Commission released ‘India : Vision 2020’
document.
Highlights:
• achieving 100 per cent literacy,
• eradicating unemployment and poverty,
• quadrupling per capita income,
• attaining 9 per cent GDP growth rate per annum by year 2020,
• checking contagious diseases completely,
100 per cent school enrolment in the age group of 6 to 14, and keeping urban air
pollution under control by strict enforcement of motor vehicle emission standards
and widespread use of ethanol- blended motor fuels are the highlights of the
document.
The document is a futuristic report prepared by a committee headed by SP. Gupta,
Member, Planning Commission.
TWELFTH FIVE YEAR PLAN (2012-17) TARGETS 8 CENT GROWTH
Kalyan's www.OnlineIAS.com
Kalyan's www.OnlineIAS.com 31

www.OnlineIAS.com [email protected]
www.OnlineIAS.com
The Twelfth Five Year Plan (2012-17) which focuses on ‘Faster. More inclusive
and Sustainable Growth has set a target of 8.2 per cent during the plan period.
The total outlay of the Twelfth Plan is estimated at Rs. 00,50,123 crores of which
the centres share is Rs. 43,33,739 crores end states share is Rs. 37,18,385 crores.
The Plan Identified 25 rnonitorable targets which are to be achieved by the end
of plan period i.e 2012-17.
Economic Growth:
1. GDP Growth Rate of 8.2 per cent,
2. Agriculture Growth Rate Of 4.0 per cent,
3. Manufacturing Growth Rate of 10,0 per cent,
4. Growth rate of very state In the Twelfth Plan preferably higher than that
achieved In the ‘Eleventh Plan,
Poverty and Employment:
5. reducing headcount ratio of consumption poverty by 10 percentage points over
the preceding estimates by the end of Twelfth Five Year Plan,
6. generating 50 million new work opportunities In the non-farm sector and
providing skill certification to equivalent numbers,
Education :
7.increasing mean years of schooling to seven years,
8. enhancing access to higher education by creating two million additional seats
lot each age group aligned to the skill needs of the economy,
9.Eliminating and social gap In school enrolment (that Is. between girls and boys,
and between SC., ST Muslims and the rest of the populations
Health:
Kalyan's www.OnlineIAS.com
Kalyan's www.OnlineIAS.com 32

www.OnlineIAS.com [email protected]
www.OnlineIAS.com
10.. reducing Infant Mortality Rate (IMR) to 25 and Maternal Mortality Rate
(MMR) to 1 per 1,000 live births, and improving Child Sex Ratio (0-6 years) to
950.
11. reducing Total Fertility Rate 2.1.
12. reducing under-nutrition among children aged 0-3 years to half of the National
Family Health Survey -3 (NFHS-3) levels,
Infrastructure, Including Rural infrastructure
13. Increasing investment in Infrastructure, as a percentage of GDP to 9 per cent.
14. increasing the Gross Irrigated Area tram 90 million hectares to 103 million
hectares,
15. Providing electricity to all villages and reducing Aggregate Technical and
Commercial (AT8C) losses to 20 per cent,
16. Connecting all, villages with all-weather roads
17. Upgrading national and state highways to the minimum two-lane standard,
18. Completing Eastern and Western dedicated Freight Corridors,
19. Increasing rural tale-density to 70 per cent,
20. Ensuring 50 per cent of rural population has access to 40 liter per capita per
day piped drinking water supply, and 50 pr cent gram Panchayats achieve Nirrnal
Gram Status
Environment and Sustainability:
21. Increasing green cover (as measured by satellite Imagery) by I million hectare
every year during the Twelfth Five Year Plan,
22. Adding 30,000 MW of renewable energy capacity
23. Reducing emissions in line with the target of
20 per cent to 25 per cent reduction over 2005 levels by 2020, Service Delivery
24. Providing access to banking services to 90 per cent Indian households, and
Kalyan's www.OnlineIAS.com
Kalyan's www.OnlineIAS.com 33

www.OnlineIAS.com [email protected]
www.OnlineIAS.com
25. Shifting. Major subsidies and welfare related beneficiary payments to a direct
cash transfer mode by the end of the Twelfth Plan, Using the Aadhar platform
with linked bank accounts
Allocation of center’s Gross Budgetary Support (GBS) by Major Sectors-
Eleventh plan Realization and Twelfth plan Projection
(Rs Crore in Current Prices)
Eleventh
plan
Twelfth Plan %
increase
over
Major Sectors Allocation % Share Projected
Allocation
% Share Eleventh
plan
1 Agriculture and
Water Resources
2 Rural Development
& Panchayati Raj
3 Scientific
Departments
4 Transport and Energy
5 Education
6 Health and Child
Development
7 Urban Development
8 Others
Total Plan Allocation
1,16554
3,97524
58,690
2,04,076
1,77,538
1,12,646
63.465
4,58,849
1589,342
7.33
25.01
3.69
12.84
11.17
7.09
3,99
28.87
100.00
2,84.030
6,73,034
1,42,167
4,48,736
4,53,728
4,08,521
1,64,078
9,94,333
35,68,626
7,96
18.86
3.98
12.57
12.71
11.45
4.60
27.86
100.00
143.69
69.31
142.23
119.89
155.57
262.66
158.53
116.70
124.53
National Institution for Transforming India Aayog
National Institution for Transforming India Aayog (Hindi: Policy Commission)
is a Government of India policy think-tank established by Prime
Minister Narendra Modi after his having dissolved the Planning Commission.
Pronounced nithi, meaning "policy" in Hindi, the acronym stands for National
Institution for Transforming India. "Aayog'" is the Hindi word for "commission".
The stated aim of NITI Aayog's creation is to foster involvement and participation
in the economic policy-making process by state governments of India, a "bottom-
up" approach in contrast to the Planning Commission's tradition of "top-down"
decision-making. The Prime Minister heads the Aayog as its chairperson. Thus,
while the Planning Commission had no representation for state and Union
Territories, the NITI Aayog has.
Kalyan's www.OnlineIAS.com
Kalyan's www.OnlineIAS.com 34

www.OnlineIAS.com [email protected]
www.OnlineIAS.com
The Union Government of India announced formation of NITI Aayog on 1
January 2015, and the first meeting of NITI Aayog was held on 8 February
2015. "NITI Blogs", which provide public access to articles, field reports and
work in progress as well as the published opinions of NITI officials, are available
to the public on the Aayog website.
There are a couple of things to be considered here. NITI Aayog would therefore
mean:
• A group of people with authority entrusted by the government to
formulate/regulate policies concerning transforming India.
• It is a commission to help government in social and economic issues.
• Also it's an Institute of think tank with experts in it.
India's Finance Minister Arun Jaitley made the following observation on the
necessity of creating NITI Ayog: “The 65-year-old Planning Commission had
become a redundant organization. It was relevant in a command economy
structure, but not any longer. India is a diversified country and its states are in
various phases of economic development along with their own strengths and
weaknesses. In this context, a ‘one size fits all’ approach to economic planning is
obsolete. It cannot make India competitive in today’s global economy”
Renaming of Planning Commission
May 29, 2014 -> According to the first IEO (Independent Evaluation Office )
assessment report which was submitted to Prime Minister Modi on May 29,
Planning Commission to be replaced by "control commission"
15th -17th Aug. 2014 –> Govt. of India officials viewed Planning
Commission to be replaced with a diluted version of the National
Development and Reform Commission (NDRC) of China "
1st January 2015 –> Cabinet resolution to replace Planning Commission by
NITI Aayog (National Institution for Transforming India) "
February 8, 2015: The first meeting of NITI Aayog was chaired by Narendra
Modi.
Origin and formation
1950 : Planning commission was established
May 29, 2014 : The first IEO(Independent Evaluation Office ) assessment
report was submitted to Prime Minister Modi on May 29, three days after he
was sworn in. According to Ajay Chibber, who heads the IEO, views in the
report are based on the views of stakeholders and some Planning Commission
members themselves. Planning Commission to be replaced by "control
commission"
Kalyan's www.OnlineIAS.com
Kalyan's www.OnlineIAS.com 35

www.OnlineIAS.com [email protected]
www.OnlineIAS.com
August 13, 2014 : Cabinet of Modi govt. scrapped the Planning Commission
Aug. 15 2014 : Modi mentioned to replace Planning Commission by National
Development and Reform Commission (NDRC) on the line of China
Members
The NITI Aayog comprises the following:
1. Prime Minister of India as the Chairperson
2. Governing Council comprising the Chief Ministers of all the States and
Union territories with Legislatures and lieutenant governors of other
Union Territories.
3. Regional Councils will be formed to address specific issues and
contingencies impacting more than one state or a region. These will be
formed for a specified tenure. The Regional Councils will be convened by
the Prime Minister and will comprise of the Chief Ministers of States and
Lt. Governors of Union Territories in the region. These will be chaired by
the Chairperson of the NITI Aayog or his nominee
4. Experts, specialists and practitioners with relevant domain knowledge as
special invitees nominated by the Prime Minister
5. Full-time organizational framework (in addition to Prime Minister as the
Chairperson) comprising
1. Vice-Chairperson: Arvind Panagariya
2. Members: Three (3) Full-time: economist Bibek Debroy, former
DRDO chief V.K. Saraswat and Agriculture Expert Professor
Ramesh Chand
3. Part-time members: Maximum of two from leading universities
research organizations and other relevant institutions in an ex-
officio capacity. Part-time members will be on a rotational basis
4. Ex Officio members: Maximum of four members of the Union
Council of Ministers to be nominated by the Prime Minister
5. Chief Executive Officer: To be appointed by the Prime Minister for
a fixed tenure, in the rank of Secretary to the Government of India.
Sindhushree Khullar appointed as the Chief Executive Officer.
6. Secretariat as deemed necessary
Present Members
The various members of NITI Aayog are:
1. Chairperson: Prime Minister Narendra Modi
2. 1stCEO: Sindhushree Khullar IAS,present CEO:Amitabkanth
3. Vice Chairperson: Arvind Panagariya
Kalyan's www.OnlineIAS.com
Kalyan's www.OnlineIAS.com 36

www.OnlineIAS.com [email protected]
www.OnlineIAS.com
4. Ex-Officio Members: Rajnath Singh, Arun Jaitley, Suresh
Prabhu and Radha Mohan Singh
5. Special Invitees: Nitin Gadkari, Prakash javadekar and Thawar Chand
Gehlot
6. Full-time Members: Bibek Debroy, V. K. Saraswat and Ramesh chand
7. Governing Council: All Chief Ministers and Lieutenant Governors of
States and Union Territories
Difference between NITI Aayog and Planning Commission
Financial clout
NITI Aayog – To be an advisory body, or a think-tank. The powers to allocate
fund vested in the finance ministry.
Planning Commission – Enjoyed the powers to allocate funds to ministries and
state governments
Full-time members
NITI Aayog – Two full-time members.
Planning Commission – had eight full-time members
States' role
NITI Aayog – Includes the Chief Ministers of all States and the Lieutenant
Governors of all Union territories in its Governing Council, devolving more
power to the States of the Union.
Planning Commission – States' role was limited to the National Development
Council and annual interaction during Plan meetings
Member secretary
NITI Aayog – To be known as the CEO and to be appointed by the prime minister
Planning Commission – Secretaries or member secretaries were appointed
through the usual process
Part-time members
Kalyan's www.OnlineIAS.com
Kalyan's www.OnlineIAS.com 37

www.OnlineIAS.com [email protected]
www.OnlineIAS.com
NITI Aayog – To have a number of part-time members, depending on the need
from time to time
Planning Commission – Full Planning Commission had no provision for part-
time members
Constitution
Niti Aayog – Governing Council has state chief ministers and lieutenant
governors.
Planning Commission- The commission reported to National Development
Council that had state chief ministers and lieutenant governors.
Organization
Niti Aayog – New posts of CEO, of secretary rank, and Vice-Chairperson. Will
also have two full-time members and part-time members as per need. Four cabinet
ministers will serve as ex-officio members.
Planning Commission – Had deputy chairperson, a member secretary and full-
time members.
Participation
Niti Aayog- Consulting states while making policy and deciding on funds
allocation. Final policy would be a result of that.
Planning Commission- Policy was formed by the commission and states were
then consulted about allocation of funds.
Allocation
Niti Aayog- No power to allocate funds
Kalyan's www.OnlineIAS.com
Kalyan's www.OnlineIAS.com 38

www.OnlineIAS.com [email protected]
www.OnlineIAS.com
Planning Commission- Had power to decide allocation of government funds for
various programs at national and state levels.
Nature
Niti Aayog- NITI is a think-tank and does not have the power to impose policies.
Planning Commission- Imposed policies on states and tied allocation of funds
with projects it approved.
Aims and Objectives of NITI Ayog
NITI Aayog will seek to provide a critical directional and strategic input into the
development process.
The centre-to-state one-way flow of policy, that was the hallmark of the Planning
Commission era, is now sought to be replaced by a genuine and continuing
partnership of states.
NITI Aayog will emerge as a "think-tank" that will provide Governments at the
central and state levels with relevant strategic and technical advice across the
spectrum of key elements of policy.
The NITI Aayog will also seek to put an end to slow and tardy implementation
of policy, by fostering better Inter-Ministry coordination and better Centre-State
coordination. It will help evolve a shared vision of national development
priorities, and foster cooperative federalism, recognizing that strong states make
a strong nation.
The NITI Aayog will develop mechanisms to formulate credible plans to the
village level and aggregate these progressively at higher levels of government. It
will ensure special attention to the sections of society that may be at risk of not
benefitting adequately from economic progress.
The NITI Aayog will create a knowledge, innovation and entrepreneurial support
system through a collaborative community of national and international experts,
practitioners and partners. It will offer a platform for resolution of inter-sectoral
and inter-departmental issues in order to accelerate the implementation of the
development agenda.
In addition, the NITI Aayog will monitor and evaluate the implementation of
programmes, and focus on technology upgradation and capacity building.
Kalyan's www.OnlineIAS.com
Kalyan's www.OnlineIAS.com 39

www.OnlineIAS.com [email protected]
www.OnlineIAS.com
Through the above, the NITI Aayog will aim to accomplish the following
objectives and opportunities:
An administration paradigm in which the Government is an "enabler" rather
than a "provider of first and last resort."
Progress from "food security" to focus on a mix of agricultural production, as
well as actual returns that farmers get from their produce.
Ensure that India is an active player in the debates and deliberations on the
global commons.
Ensure that the economically vibrant middle-class remains engaged, and its
potential is fully realized.
Leverage India's pool of entrepreneurial, scientific and intellectual human
capital.
Incorporate the significant geo-economic and geo-political strength of the
Non-Resident Indian Community.
Use urbanization as an opportunity to create a wholesome and secure habitat
through the use of modern technology.
Use technology to reduce opacity and potential for misadventures in
governance.
The NITI Aayog aims to enable India to better face complex challenges, through
the following:
Leveraging of India's demographic dividend, and realization of the potential
of youth, men and women, through education, skill development, elimination
of gender bias, and employment
Elimination of poverty, and the chance for every Indian to live a life of dignity
and self-respect
Redressal of inequalities based on gender bias, caste and economic disparities
Integrate villages institutionally into the development process
Policy support to more than 50 million small businesses, which are a major
source of employment creation
Safeguarding of our environmental and ecological assets.
Major Highlights
1. The new National Institution for Transforming India (NITI) will act more like
a think tank or forum and execute programs by taking the States along with them.
This is in sharp contrast with the defunct Planning Commission which imposed
five-year-plans and allocated resources while running roughshod over the
requests of the various States.
Kalyan's www.OnlineIAS.com
Kalyan's www.OnlineIAS.com 40

www.OnlineIAS.com [email protected]
www.OnlineIAS.com
2. NITI will include leaders of India's 29 states and seven union territories. But
its full-time staff – a deputy chairman, Chief Executive Officer and experts – will
answer directly to the Prime Minister of India, who will be chairman.
3. The opposition Congress IS mocked the launch as a cosmetic relabelling
exercise – the new body's acronym-based name means 'Policy Commission' in
Hindi, suggesting a less bold departure than the English version does. Several
believe that is consistent with the negativism that has become the hallmark of the
Congress.
4. Despite being blamed by critics for the slow growth that long plagued India,
the Commission survived the market reforms of the early 1990s, riling Mr Modi
with its interventions when he was Chief minister of industry and investor
friendly Gujarat.
5. Mr Modi, elected by a landslide last year on a promise to revive flagging
growth and create jobs, had vowed to do away with the Planning Commission
that was set up in 1950 by Congressman and Prime Minister Jawaharlal Nehru.
6. But his plans been derided by the Congress party, which wants to defend the
Nehru legacy and describes Mr Modi's vision of "cooperative federalism" as
cover for a veiled power grab.
7. India's first Prime Minister Jawaharlal Nehru, a socialist who admired Joseph
Stalin's drive to industrialize the Soviet Union, set up and chaired the Commission
to map out a development path for India's agrarian economy.
8. In 2012, the Planning Commission was pilloried for spending some Rs. 35 lakh
to renovate two office toilets, and then it was lampooned for suggesting that
citizens who spent Rs. 27 or more a day were not poor.
9. The commission had remained powerful over the decades because it had
emerged as a sort of parallel cabinet with the Prime Minister as its head.
10. The Commission's power in allocating central funds to states and sanctioning
capital spending of the central government was deeply resented by states and
various government departments.
11. The NITI Aayog will also seek to put an end to slow and tardy implementation
of policy, by fostering better Inter-Ministry coordination and better Centre-State
coordination. It will help evolve a shared vision of national development
priorities, and foster cooperative federalism, recognizing that strong states make
a strong Nation.
Kalyan's www.OnlineIAS.com
Kalyan's www.OnlineIAS.com 41

www.OnlineIAS.com [email protected]
www.OnlineIAS.com
Criticisms of NITI Aayog
The government's move to replace the Planning Commission with a new
institution called 'NITI Aayog’ was criticized by opposition parties of India. The
Congress sought to know whether the reform introduced by the BJP-led
government was premised on any meaningful programme or if the move was
simply born out of political opposition to the party that ran the Planning
Commission for over 60 years. "The real issue is do you (the government) have
a substantive meaningful Programme to reform the Planning Commission?"
Congress spokesperson Abhishek Manu Singhvi said. "If you (the BJP
government) simply want to abolish it (the commission), because it is something
which (Jawaharlal) Nehru created for this country and you don't like Nehru or
simply because it was run by the Congress for 60 years and you don't like the
Congress, that is pitiable," he said.
The Communist Party of India-Marxist said a mere change in the name would not
yield the desired results. "Mere changing this nomenclature, and this sort of
gimmickry is not going to serve the purpose. Let us wait and see what the
government is eventually planning," CPI-M leader Sitaram Yechury said.
The Planning Commission used to plan policy. I don't know what is the
government trying to do by merely changing the nomenclature from Planning
Commission to Niti Ayog," said Congress spokesman Manish Tewari.
However, Commerce and Industry Minister Nirmala Sitharaman of BJP accused
the critics of being “ignorant of facts”.
“With the new set of changes, the state governments no longer need to have a
begging attitude and instead take independent steps for development,” said
Sitharaman. With this the NDA government is fulfilling one more of its key
promises of robust federalism.
"The idea to create an institution where states' leaders will be part and parcel of
the collective thinking with the Centre and other stakeholders in formulating a
vision for the development of the country is right on as compared with the
previous structure, where a handful of people formulated the vision and then
presented it to the National Development Council (NDC). This was not entirely
absorbed and adopted by the latter," said former Planning Commission member
Arun Maira.
Kalyan's www.OnlineIAS.com
Kalyan's www.OnlineIAS.com 42

www.OnlineIAS.com [email protected]
www.OnlineIAS.com
In fact, a recent survey of expert opinions in the magazine "Business World"
shows that either a very clear distinction of roles of NDC, Governing Council and
Inter State Council or a merger of one or two with a vibrant and functional ISC
can serve the two key goals of such forums: policy development and conflict
resolution.
Economic growth and Development
Economic growth is the increase in the inflation-adjusted market value of the
goods and services produced by an economy over time. It is conventionally
measured as the percent rate of increase in real gross domestic product, or real
GDP. Of more importance is the growth of the ratio of GDP to population
(GDP per capita, which is also called per capita income). An increase in growth
caused by more efficient use of inputs (such as physical capital, population, or
territory) is referred to as intensive growth. GDP growth caused only by increases
in the amount of inputs available for use is called extensive growth.
In economics, "economic growth" or "economic growth theory" typically refers
to growth of potential output, i.e., production at "full employment". As an area of
study, economic growth is generally distinguished from development economics.
The former is primarily the study of how countries can advance their economies.
The latter is the study of the economic development process particularly in low-
income countries.
Growth is usually calculated in real terms – i.e., inflation-adjusted terms – to
eliminate the distorting effect of inflation on the price of goods produced.
Kalyan's www.OnlineIAS.com
Kalyan's www.OnlineIAS.com 43

www.OnlineIAS.com [email protected]
www.OnlineIAS.com
Measurement of economic growth uses national income accounting. Since
economic growth is measured as the annual percent change of gross domestic
product (GDP), it has all the advantages and drawbacks of that measure.
Measuring economic growth
Economic growth is generally calculated from data on GDP and population
provided by countries' statistical agencies, although independent scholarly
estimates are also available.
Importance of long-run growth
Over long periods of time, even small rates of growth, such as a 2% annual
increase, have large effects. For example, the United Kingdom experienced a
1.97% average annual increase in its inflation-adjusted GDP between 1830 and
2008. In 1830, the GDP was 41,373 million pounds. It grew to 1,330,088 million
pounds by 2008. A growth rate that averaged 1.97% over 178 years resulted in a
32-fold increase in GDP by 2008.
For example, a growth rate of 2.5% per annum leads to a doubling of the GDP
within 28.8 years, whilst a growth rate of 8% per year leads to a doubling of GDP
within 9 years. Thus, a small difference in economic growth rates between
countries can result in very different standards of living for their populations if
this small difference continues for many years.
Quality of life
Happiness has been shown to increase with a higher GDP per capita, at least up
to a level of $15,000 per person. Economic growth has the indirect potential to
alleviate poverty, as a result of a simultaneous increase in employment
opportunities and increased labour productivity. A study by researchers at
the Overseas Development Institute (ODI) of 24 countries that experienced
growth found that in 18 cases, poverty was alleviated. However, employment is
no guarantee of escaping poverty; the International Labour Organization(ILO)
estimates that as many as 40% of workers are poor, not earning enough to keep
their families above the $2 a day poverty line. For instance, in India most of the
chronically poor are wage earners in formal employment, because their jobs are
Kalyan's www.OnlineIAS.com
Kalyan's www.OnlineIAS.com 44

www.OnlineIAS.com [email protected]
www.OnlineIAS.com
insecure and low paid and offer no chance to accumulate wealth to avoid risks;
other countries found bigger benefits from focusing more on productivity
improvement than on low-skilled work.
Increases in employment without increases in productivity lead to a rise in the
number of working poor, which is why some experts are now promoting the
creation of "quality" and not "quantity" in labour market policies. This approach
does highlight how higher productivity has helped reduce poverty in East Asia,
but the negative impact is beginning to show. In Vietnam, for example,
employment growth has slowed while productivity growth has continued.
Furthermore, productivity increases do not always lead to increased wages, as can
be seen in the United States, where the gap between productivity and wages has
been rising since the 1980s. The ODI study showed that other sectors were just
as important in reducing unemployment, as manufacturing.
The services sector is most effective at translating productivity growth into
employment growth. Agriculture provides a safety net for jobs and an economic
buffer when other sectors are struggling. This study suggests a more nuanced
understanding of economic growth and quality of life and poverty alleviation.
Economic Growth and Development
Def-1 Economic Growth
• It is a quantitative aspect, which generally refers to a long-term tendency
reflected by an increase in the flow of goods and services produced by the
economy.
• Economic growth is conventionally measured as a percentage increase in GDP
or GNP or per capita NDP during 1 year. Per capita NDP is the most appropriate
measure of economic growth.
Economic Growth Rate = NNP2 - NNP1
NNP1
Where,
NNP2= Net national product of current year
Kalyan's www.OnlineIAS.com
Kalyan's www.OnlineIAS.com 45

www.OnlineIAS.com [email protected]
www.OnlineIAS.com
NNP1 — Net national product of last year
Def-2 Economic Development
• It is a qualitative aspect, unlike economic growth which is a quantitative
aspect. It means growth accompanied by welfare or equity.
Difference between Economic Development and Economic Growth
Economic Development Economic Growth
Concept Broader and normative
concept.
Narrower concept than
economic development.
Scope Concerned with
structural changes in the
economy.
Growth is concerned
with
increases in the
economy’s output.
Growth Development relates to
growth of human capital
indices, a decrease in
inequality figures and
structural changes that
improve the general
population’s quality of
life.
Growth relates to a
gradual increase is one
of the
components of Gross
Domestic Product:
consumption,
government spending,
investment, net exports.
Implication It implies changes in
income, saving an
investment along with
progressive changes in
socio-economic
structure
of country (institutional
and Technological
changes).
It refers to an increase in
the real output of goods
and services in the
country like
increase in income, in
savings, in investment
etc.
Measurement Qualitative (Human
Development Index)
HDI.
Quantitative increase in
real
GDP shown by PPP.
Kalyan's www.OnlineIAS.com
Kalyan's www.OnlineIAS.com 46

www.OnlineIAS.com [email protected]
www.OnlineIAS.com
Gender- Related Index
(GRI). Human Poverty
Index (HPI), infant
mortality literacy rate
etc.
Effect Bring qualitative and
qualitative change in the
Economic
Bring quantitative
changes in the economy.
Measurement of Economic Development
There are various models to measure economic development and comparative
situation of different countries.
• Purchasing power parity method
• Human development index
• Green GNP • Net economic welfare
• Poverty Index • Basic necessities
• Physical quality of life index
• National prosperity index
• Gender based development index
Least Developed Countries (LDCs)
• These are countries, which exhibit the lowest levels of socio-economic
indicators. According to United Nations, to be classified as an LDC, a country
should meet the following criteria
• Low Income Last 3 years, average GDP per capita should be less than US $
905, which should exceed US $ 1086 to leave the list.
• Human Resource Weakness It is based on indicators of nutrition, health,
education and adult literacy.
• Economic Venerability It is based on instability of agricultural production,
instability of exports of goods and services and the percentage of population
displaced by natural disasters.
National Income
Kalyan's www.OnlineIAS.com
Kalyan's www.OnlineIAS.com 47

www.OnlineIAS.com [email protected]
www.OnlineIAS.com
• it measures the net value of goods and services produced in a country during a
year and it also includes net factor income from abroad. i.e., National Income
measures the productive power of an economy In a given period to turn out goods
and services for final consumption. In India, National Income estimates are
related with the financial year (1 St April to 31st March).
• National Income can be measured by GND, GDP, GNI, NNP, NNI and per
capita income. GNP and per capita income, though considered as the most
standard measure of economic development have some limitation1 since they
exclude poverty, literacy, public health, gender equity and other measures of
human prosperity.
Estimates of National Income in India
In 1863, the first attempt was made by Dadabhai Naoroji in his book ‘Poverty
and UN-British Rule in India’. He estimated the per capita annual income to be
20.
The first scientific attempt to measure national income in India was made by
Professor VKRV Rao in 1931-32. He divided the Indian economy into 13 sectors.
In 1949, National Income Committee under the Chairmanship of Professor PC
Mahalanobis was constituted the other members being professor VKRV Rao and
Professor DR Gadgil.
National Statistical Commission (NSO) was set-up on 1st June, 2005, for
promoting statistical network in the country it was then headed by Professor SD
Tendulkar.
Estimation of National Income at Current and Constant Price
National Income at Current Prices When goods and services produced by
normal residents of a country in a given year are estimated at current prices, it is
called national income at current prices. Current prices refer to the prices
prevailing during the year for which estimates are made. Thus, it is estimation of
goods and services produced during a year on the basis of the prices of the same
year.
Kalyan's www.OnlineIAS.com
Kalyan's www.OnlineIAS.com 48
www.OnlineIAS.com [email protected]
www.OnlineIAS.com
National Income at Constant Prices When goods and services produce by
normal residents of a country during a year are valued at fixed prices, i.e., prices
of the base year, it is called notional income at constant prices.
Other Concepts of National Income
Other concepts of national income are as follows
Gross Domestic Product (GDP)
It is the money value of all final goods and services produced in the domestic
territory of a country during the given time (a year). In GDP, income generated
by foreigners in a country is included, but income generated by nationals of a
country, outside the Country is not included.
GDP= C+I+G+(X-M)
Where. :
C = Total Consumption Expenditure
I = Total Investment Expenditure
G = Total Government Expenditure
X = Export
M = Import
In GDP, income generated by foreigners in country is included, but income
generated by nationals of a country outside the Country is not included. Net
Domestic Product (NDP) it is the value of GDP after deduction of depredation of
plants and machinery from GDP
NDP = GDP - Depreciation
Gross National Product (GNP)
It is the monetary value of all final goods and services produced by the residents
of a country in a year.
Net National Product (NNP)
It is the value of GNP after deducting depreciation of plant and machinery.
NNP = GNP – Depreciation
National Income (NI)
Kalyan's www.OnlineIAS.com
Kalyan's www.OnlineIAS.com 49

www.OnlineIAS.com [email protected]
www.OnlineIAS.com
In India, Net National Income at factor cost is called National Income.
NI = NNP — Indirect taxes + Subsidies
Disposable Personal Income (DPI)
The persons will have to pay the personal tax on personal income. Any income
remaining out of personal income after the payment of personal tax and some
other fines is termed as disposable personal income.
DPI = Personal income — Personal tax (Income tax)
Non-tax payments (Fines)
Real National Income (RNI)
It is the actual quantity of goods and services produced. The standard of living
depends very much of the qualities of goods and services produced.
NNP = GNP- Consumption of capital stock
• Personal Income (P1)
It is the part of National Income, which is received by the persons including
households. Therefore, to calculate personal income, some adjustments are to be
made for those incomes, which are included in the national income but not
actually received by the persons and there may be some income which is not
included in national income but they are actually received by the persons.
P1 = NNPFC — Undistributed profits— Corporate tax—Net interest payments
made by households+ Transfer payments to the households from the government
and firms
Market Price and Factor Cost
Market Price It refers to the actual transacted price and it includes indirect, direct
taxes such as excise duty VAT, Service 1x, Custom duty etc., built excludes
government subsidies.
Factor Cost It means the total cost of all factors of production consumed or used
it producing a goods or services. It includes government grants and subsidies but
it excludes indirect tax.
Difference between GDP and GNP
In GDP, goods and services produced in a country is added, whether it is produced
by residents of the country or foreigners whereas the GNP is the monetary value
Kalyan's www.OnlineIAS.com
Kalyan's www.OnlineIAS.com 50

www.OnlineIAS.com [email protected]
www.OnlineIAS.com
of all financial goods and services produced by the residents only of a country in
a financial year.
Methods of Measuring National Income
National income can be calculated by three methods are as follows
Production Method
In this method, net value of final goods and services produced in a country
during a year is obtained, which is called total final product. This represents
Gross Domestic Product (GDP). Net income earned in foreign boundaries by
nationals is added and depreciation is subtracted from GDP.
Income Method
In this method, a total of net income earned by working people in different sectors
and commercial enterprises is obtained Incomes of both categories of people —
paying taxes and not paying taxes and added to obtain national income. By
income method, National Income is obtained by adding receipts as total rent, total
wages, total interest and total profit.
Consumption Method
It is also called expenditure method. Income is either spent on consumption or
saved. Hence, National Income is the addition of total consumption and total
savings. In India, a combination of production method and income method is used
for estimating National Income.
Purchasing Power Parity (PPP)
It refers to the adjustment to be made in the value of money in a country so that
identical goods cost identical money in a particular currency across all countries.
Per capita income should be measured in PPP terms to reflect the actual standard
of living in a country.
Organisation Engaged in Measuring National Income in India
the two wings of National Statistical Organisation (NSO) is responsible for
maintaining the books of National Accounts in India.
National Statistics Office (NSO)
It came into being in March, 1947. However, official statistical had been
compiled and published for a long time before.
Central Statistical Organization (CSO)
For co—ordination of statistical activities of the different Central Ministries and
the State Governments and for promotion of statistical standards, the Central
Kalyan's www.OnlineIAS.com
Kalyan's www.OnlineIAS.com 51

www.OnlineIAS.com [email protected]
www.OnlineIAS.com
Statistical Organization (CSO) was created In May 1951. CSO prepares national
accounts, compiles and publishes industrial statisl.ics and conducts economic
census and surveys. The Computer Centre (CC) was set-up in 1967 as an
attached office of the Department of Statistics to cater to the data processing
needs of the Department and other Departments of the Union Government.
National Sample Survey Organization (NSSO)
It was set-up in 1950 as a permanent survey organization to conduct national
sample surveys to assist in socio-economic planning and policy-making. The
first round of NSS, covering rural India was conducted during 1950-1951.
Since, then NSSO has been conducting sample surveys on a variety of subjects
and the data have been widely used by the government, social scientists and other
users. The work of NSSO has won international acclaim and stimulated the
creation of similar organizations in other developing countries. Sometimes two
more sectors-quaternary and Quinary can also be considered as part of the
services sector itself.
Popular Measures of Economic Development and Social Welfare
Following are the indicators to measure the economic development and social
welfare
1. Human Development Index (H DI)
The United Nations Development Programme (UNDP) introduced the HDI in its
first Human Development Report (HDR) prepared under the stewardship of
Mahbub-ul-Haq in 1990. It is a standard means of measuring wellbeing. HDI
measures the average achievements in a country in three basic dimensions of the
human developments, a long and healthy life, access to knowledge and a decent
standard of living. HDI tanks countries in relation to each other on a scale of 0 to
1. The Human Development Index is based on these three indices and that are as
follows
Life Expectancy Index (LET)
Because infant mortality is not entering this index as a separate indicator, so here
refers to life expectancy at birth, not at age one.
Educational Attainment Index (EAI)
Kalyan's www.OnlineIAS.com
Kalyan's www.OnlineIAS.com 52

www.OnlineIAS.com [email protected]
www.OnlineIAS.com
It is a combination of adult literacy rate an combined enrolment ratio. The weight
assigned to Adult Literacy Rate (ALR) is two third while that for Combined
Enrolment Ratio (CER) is one third; therefore, educational attainment index may
be given as
EAI=2 ALR +1 CER
3 3
Standard of Living Index (SLI)
It is represented here by a transformation of per capita income. Per capita
income are converted into Purchasing Powered Parity (PPP) is dollars.
Thus, HDI= 1 (LEI + EAI + SLI)
3
2. Physical Quality of Life Index (PQLI)
These indicators reflected that economically less developed countries are simply
underdeveloped versions of industrialised countries. Morris David constructed a
composite in 1979.
Three component indicators of PQLI are as follows
Life expectancy
Infant mortality rate and
Basic literacy
3. Gross National Happiness (GNH)
It attempts to measure quality of life in a more holistic manner than just an
economic indicator like GDP. The four pillars of GNH are promotion of
sustainable development, preservation and promotion of cultural values,
conservation of natural environments and establishments of good governance.
The term GNH was coined in 1972, by Bhutan’s then king Jigme Singya
Wangchuck. GNH value is proposed to be an index function of the total average
per capita of the following measures
Economic Wellness
Environmental Wellness
Physical Wellness
Workplace Wellness
Political Wellness
Mental Wellness
Kalyan's www.OnlineIAS.com
Kalyan's www.OnlineIAS.com 53
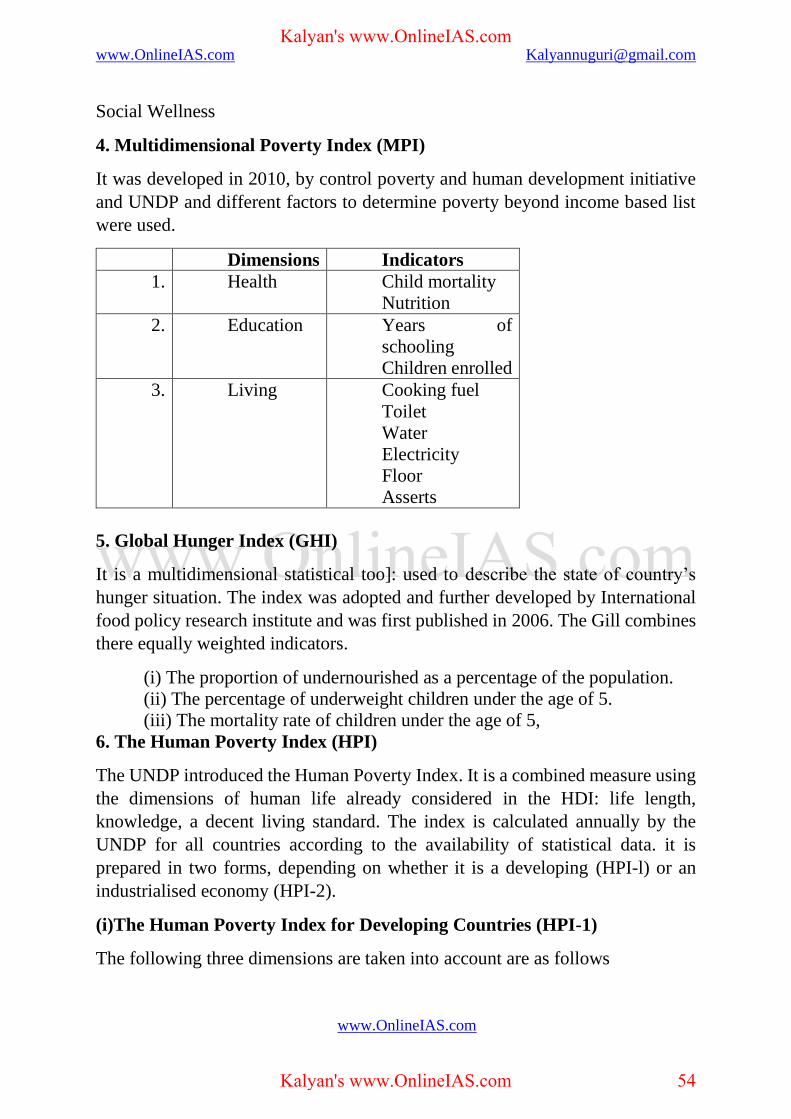
www.OnlineIAS.com [email protected]
www.OnlineIAS.com
Social Wellness
4. Multidimensional Poverty Index (MPI)
It was developed in 2010, by control poverty and human development initiative
and UNDP and different factors to determine poverty beyond income based list
were used.
Dimensions Indicators
1. Health Child mortality
Nutrition
2. Education Years of
schooling
Children enrolled
3. Living Cooking fuel
Toilet
Water
Electricity
Floor
Asserts
5. Global Hunger Index (GHI)
It is a multidimensional statistical too]: used to describe the state of country’s
hunger situation. The index was adopted and further developed by International
food policy research institute and was first published in 2006. The Gill combines
there equally weighted indicators.
(i) The proportion of undernourished as a percentage of the population.
(ii) The percentage of underweight children under the age of 5.
(iii) The mortality rate of children under the age of 5,
6. The Human Poverty Index (HPI)
The UNDP introduced the Human Poverty Index. It is a combined measure using
the dimensions of human life already considered in the HDI: life length,
knowledge, a decent living standard. The index is calculated annually by the
UNDP for all countries according to the availability of statistical data. it is
prepared in two forms, depending on whether it is a developing (HPI-l) or an
industrialised economy (HPI-2).
(i)The Human Poverty Index for Developing Countries (HPI-1)
The following three dimensions are taken into account are as follows
Kalyan's www.OnlineIAS.com
Kalyan's www.OnlineIAS.com 54

www.OnlineIAS.com [email protected]
www.OnlineIAS.com
1. Deprivation of longevity; measured as a percentage of the individuals with a
life expectancy lower than 40 years.
2. Deprivation of knowledge, expressed as a percentage of illiterate adults.
3. Deprivation of decent living standards.
This last indicator Is made- up by the simple average of three basic
variables the percentage of the population without access to drinking water,
the percentage of population without access to health services (Pa) and
lastly,
the percentage of underweight children aged less than 5.
(ii)The Human Poverty Index for Industrialised Countries (HPI-2)
The human poverty index for industrialised Countries uses the same dimensions
of the previous index, but the variables and reference values are different
1. Deprivation of longevity is measured by the percentage of individuals whose
life expectancy is below 60 years of age.
2. Deprivation of knowledge is based on the percentage of adults functionally
illiterate according to the OECD definition.
3.Deprivation of decent life standards (P3) is the percentage of the population
living below the poverty level, as defined according to the criteria of the
International Standard of Poverty Line, thus being equal to 50% of the per capita
average national income.
7. Gender Development Index (GDI)
It was introduced in 1995 in the Human Development Report written by the
united. The Gender Development Index (GDL) is a composite indicator that
measures the development of states according to the standard of living in a
country
It is used as one of the five indicators by the United Nations Development
Programme in their annual Human Development Report. It highlights
inequalities in the areas of long and healthy life, knowledge and a decent
standard of living between men and women.
8. National Prosperity Index (NPI)
The Prosperity Index goes beyond GDP to measure countries’ success against a
broad set of metrics covering areas such as health, education, opportunity social
capital, personal freedom and more.
Hence, we have evolved what is called a National Prosperity Index (NPI) which
is a summation of
Kalyan's www.OnlineIAS.com
Kalyan's www.OnlineIAS.com 55

www.OnlineIAS.com [email protected]
www.OnlineIAS.com
Annual growth rate of GDP;
Improvement in quality of life of the people, particularly those living below the
poverty line;
The adoption of a value system derived from out civilizational heritage in every
walk of life which of unique to India.
The NPI is a summation of GDP growth, improvement is quality of life of people
living below the poverty line and adoption of value system derived from our
civilizational heritage in every walk of life.
The prosperity index is the only global index that measures national prosperity
based on both wealth and wellbeing. The index seeks to redefine the concept of
national prosperity to include, as a matter of fundamental importance, factors
such as democratic governance, entrepreneurial opportunity and social cohesion.
Money
Money
It is any object or record that is generally accepted as payment for goods and
services and repayment of debts in a given socio-economic context of country.
Any kind of object or secure variable record that fulfills these functions can be
considered as money.
Credit Money
Any future monetary claim against an individual that can be used to buy goods
and services.\
Legal Money
It is a type of payment that can lawfully be used to meet financial obligations.
Money, as legal tender, Is a commodity or asset or an officially issued currency
or coin that can be legally exchanged for something of equal value such as a good
or service, or that can be used in payment of a debt.
Adjacent Money
It is not exact money, but near to money. Because it’s nature of liquidity is more
in comparison to others like bond, government debenture etc.
Different Types of Money
Now, we will discuss the different types of money. Broadly speaking, there exist
three main types (forms) of money in a modem economy: metallic money paper
money and credit money. Economists, however, further classify money into many
other forms.
Kalyan's www.OnlineIAS.com
Kalyan's www.OnlineIAS.com 56

www.OnlineIAS.com [email protected]
www.OnlineIAS.com
The important types of money are explained below
1. Metallic Money
Money made-up of any metal is called metallic money. it refers to coins that are
made-up of various metals like gold, silver, nickel, copper etc. The right of
minting coins, is the monopoly of the state.
Money and Money Market
Metallic money is further class into
• Standard Money Standard money or full bodied money who& face value
(value as is equal to the Intrinsic value (value as Standard money/coins are
generally up of gold and silver.
• Token Money Token money is that money whose Face value (value as money)
is greater than its value (value as commodity). Token money/coins are generally
made up of cheaper metals like copper, nickel etc (Indian Rs. 1 coin is token
money).
2. Paper Money
Money made-up of paper is called paper money. Paper money consists of
currency notes issued by the government or the Central Bank of a country Paper
money is of following types
• Representative Paper Money The paper money which is fully backed by gold
and silver reserves is called representative paper money
• Convertible Paper Money it is that paper money which is convertible into
standard coins.
• Inconvertible Paper Money It is that paper money which is not convertible
into standard coins or valuable metals.
• Fiat Money Paper money which circulates on the authority (Le., fiat) of the
government Is flat money.
Fiat money is created and Issued by the state. It Is only a variety of inconvertible
paper money
3. Acceptable Money
On the basis of general acceptability, money can be categorized into legal tender
money and non-legal tender money (optional money).
Kalyan's www.OnlineIAS.com
Kalyan's www.OnlineIAS.com 57

www.OnlineIAS.com [email protected]
www.OnlineIAS.com
(a) Legal Tender Money It refers to that money which the state and the people
accept as the means of payment in discharge of debts. Legal tender money is
enforced by law. No one can refuse to accept it as a means of payment.
Legal tender money may be of two types
(i) Limited legal tender
(ii) Unlimited legal tender
Limited Legal Tender Money at accepted only upto a certain limit. e.g., in India,
the small coins of 50 paise is legal ten money only upto a sum of Rs.10.
Unlimited Legal Tender Money It Is that money which has to be accepted as a
medium of payment upto any amount. In India, 50 paisa coins, I coins and
currency notes of all denominations are unlimited legal tender money
(b) Non-Legal Tender Money It is also known as optional money. It refers to
that money which may or may not be accepted as a means of payment. Optional
money has no legal sanction. No one can be forced to accept optional money
Different credit instruments like cheques, bank drafts, bill of exchange, treasury
bills, insurance policies, bonds etc are examples of optional money.
Functions of Money
The functions of money can be divided into three main categories
1. Primary Functions
Two primary functions of money are as follows
Medium of Exchange Money serves as a medium of exchange. it is used to make
payments for goods and services. Different goods can be sold in terms of money
and this money can be used to purchase other goods. So, it acts as a medium of
exchange between the buyers and the sellers.
Measure of Value Money is used to measure the value. As we can measure
weight in kg and distance in km. It acts as a standard of value. Goods and services
are priced and valued in terms of money
2. Secondary Functions
• Monetary and Fiscal Management
• Income and Consumption
• Deferred Payments/Future Payments
• Parameter of Market Structure
3. Contingent Functions
Kalyan's www.OnlineIAS.com
Kalyan's www.OnlineIAS.com 58

www.OnlineIAS.com [email protected]
www.OnlineIAS.com
• Distribution of National Income
• Basis of Credit System
• Liquidity cit Wealth
• Relative comparison of National Income
Measures of Money Supply in India
Money supply is the stock of liquid assets held by the public, which can be freely
exchanged for goods and services. RBI calculates four concepts of money supply.
These are known as measures of monetary aggregates or money stock measures.
M1= Currency with the public + Demand deposits with the banking system +
Other deposits with the RBI
M2 =M1 + saving deposits with post other savings of public
M3=M1 + Time deposit of public with banking system
M4 = M3 + All deposits with post office saving banks (excluding national
certificates)
RBI Working group on Money Supply headed by YV Reddy recommended for
dropping of post office saving deposits. Accordingly, there are now only 3
monetary aggregates, M1, M2 and M3.
Liquidity Aggregates
L1=M2 + All deposits with the post office savings banks (excluding national
savings certificates)
L2 =L1 + Term deposits with term lending Institutions and re-Financing
Institutions (FIs) + Term borrowing by Fls + Certificates of deposit issued by Fls
L3=L2 + Public deposits of non-banking financial companies
Devaluating Money
It is decided by the government issuing the currency and unlike depreciation, is
not the result of non-governmental activities. One reason a country may devaluate
its currency is, to combat trade imbalances. Devaluation causes a country’s
exports to become less expensive, making them more competitive on the global
market. This in turn, means that imports are more expensive, making domestic
consumers less likely to purchase them.
Kalyan's www.OnlineIAS.com
Kalyan's www.OnlineIAS.com 59
www.OnlineIAS.com [email protected]
www.OnlineIAS.com
Value of Money
Money is a medium o exchange that facilitates trade in goods and services. Where
people progressed beyond simple barter, they began to use their most marketable
goods as medium to
exchange In primitive societies, they used : or measures at pan. salt, or fish. In
early
civilizations where the division of labour extended to larger areas. gold or silver
emerged as the most marketable good and finally as the
Monetary Standards It refers to the commodity that fixes (he value of the standard money used in a
country Monetary standard, on the other hand, relates to the commodity by which
the standard money unit is determined.
A sound monetary standard aims at the following
(i) Stability In the internal value of currency through internal price stability.
(ii) Stability of the external value of the currency through exchange rate stability.
Monetary Standards in India These are as follows
Gold Exchange Standard
In year 1898. Fowler Committee 1898 was appointed and on their
recommendations gold standard was established in India at that time, 15 Indian
rupee were rural to 1 British sovereign. Gold standard was there 1914- 15, as after
First World War was ended.
Paper Currency in India
Reserve Bank of India was established n 1935 as Central Bank of India and
controller of credit. British Government had given right of issuing of currency
notes to Bank of Bengal but from 1st April, 1935, the only rights of issuing
currency was given to India
Money Market
The duster of financial tflSt1tutton that deal in Short term securities and loans
gold and foreign exchange are termed as money market. money has a time value
and therefore, the use of it. is bought and sold against payment of interest. Short-
term money is bought and sold in the money market and long-term money in the
capital market.
Kalyan's www.OnlineIAS.com
Kalyan's www.OnlineIAS.com 60

www.OnlineIAS.com [email protected]
www.OnlineIAS.com
Neither the money market nor the capital market exists in one physical location.
The money market is a key component of the financial system, as it Is the function
of monetary operations conducted by the Central Bank in its pursuit of Monetary
policy objectives. It is a market for short-term funds
with maturity ranging from overnight to one year and includes financial
instruments that
are deemed to be close substitutes of money.
Functions of Money Market
The money market performs three broad functions which are as follows
1. It provides an equilibrating mechanism for demand arid supply of short-term
funds.
2. It enables borrowers and lenders of short-term funds to fulfill their borrowing
and investment requirements at an efficient market clearing price.
3. It provides an avenue for Central Bank intervention in Influencing both
quantum and cost of liquidity in the financial system, thereby transmitting
Monetary Policy impulses to the real economy.
Efficient functioning of the money market Is Important for the effectiveness of
Monetary Policy. The Reserve Bank carries out regulation and development of
money Market Instruments such as call/notice/term money market, repo market,
certificate of deposit Commercial paper and Collateralized Borrowing and
Lending Obligations (CBLO). The call/notice/term money market Operations are
transacted/reported on the Negotiated Dealing System Call (NDS Call) platform.
Important Terms
Money Market It refers to the market for short-term required and deployment
of funds.
Call Money Money lent for 1 day.
Notice money Money sent for a period exceeding 1 day.
Term Money Money lent or 15 days or more in inter-bank market.
Held Tin Maturity Securities. which We are meant for sale and shall be kept t
maturity
Yield to Maturity Expected rate of return on an existing Security purchased
from the market
Kalyan's www.OnlineIAS.com
Kalyan's www.OnlineIAS.com 61

www.OnlineIAS.com [email protected]
www.OnlineIAS.com
Coupon Rate Specified interest rate on a fixed maturity Security bed at the time
of issue
Treasury Operations: Trading in government securities in the market. An
investor bank can purchase these securities ii the primary market. Trading tales
piece in the secondary market.
Types of Money Market
In Indian money market, Reserve Bank of India plays the central role, as it
regulates and controls the money market.
Indian money market is mainly divided into two parts
1. Organised Sector
It comprises of all the public sector banks and foreign exchange banks except
Reserve Bank of India.
2. Unorganized Sector
It comprises of domestic bankers moneylenders.
They don’t have been given any financial validity or certification by any financial
Institution. They are commonly found in underdeveloped areas.
Securities related to Money Market
Certificate of Deposit (CD)
A savings certificate entitling the bearer to receive interest. A CI) bears a maturity
date, a specified flied Interest rate and can be issued In any denomination, CDs
are generally Issued by commercial banks and are Insured by the Federal Deposit
Insurance Corporation (FDIC). The term ala CD generally ranges from 1 month
to 5 years.
Treasury Bill
These bills are money market instruments to the short-term requirements of the
Government of India. These are discounted Securities and thus are issued at a
d1sot to Face value. The return to the investor is the difference between the
maturity value and issue price. The market that deals with treasury bills is called
treasury bill market. Treasury bills are issued by the Central Government to
secure short-term loans. These bills are sold by the Reserve Bank on behalf of the
government. These are bought by the Reserve Bank, commercial banks, non-
banking finania1 intermediaries. LIC, UTI and GIC. Treasury bills are most
liquid, because Reserve Bank is always ready to buy and discount them.
Kalyan's www.OnlineIAS.com
Kalyan's www.OnlineIAS.com 62

www.OnlineIAS.com [email protected]
www.OnlineIAS.com
Commercial Bill
This bill is a short-term, negotiable and self-liquidating instrument with low risk.
It enhances the liability to make payment in a fixed date, when goods are bought
on credit. The banks discount this bill by keeping a certain margin and credits the
proceeds. Banks when in need of money, can also get such bills rediscounted by
financial institutions such as UC, UTI, GIC, ICICI and IRBI. The maturity period
of the bills varies from 30 days, 60 days or 90 days, depending on the credit
extended in the industry.
Soliciting Funds
Those funds which are used to meet temporary cash demands. They are repayable
on demand
and their maturity period ranges from I to 15 days.
Capital Market in India
Meaning and Work of Capital Market
Capital market is one of the most important segments of the Indian financial
system. It is the market available to the companies for meeting their requirements
of the long-term funds. It refers to all the facilities and the institutional
arrangements for borrowing and lending funds. In other words, it is concerned
with the raising of money capital for purposes of making long-term investments.
The market consists of a number of individuals and institutions (including the
government) that canalize the supply and demand for long-term capital and
claims on it. The demand for long-term capital comes predominantly from private
sector manufacturing industries, agriculture sector, trade and the government
agencies, while the supply of funds for the capital market comes largely from
individual and corporate savings, banks, insurance companies, specialised
financing agencies and the surplus of governments.
The Indian capital market is broadly divided into the following
• Gilt-edged market
• The Industrial Securities Market
Components of Indian Financial Market
These are as follows
Money Market It is used by a wide array of participants from a company raising
money by selling commercial paper into the market to an investor purchasing
CDs as a safe place to park money In the short-term.
Kalyan's www.OnlineIAS.com
Kalyan's www.OnlineIAS.com 63

www.OnlineIAS.com [email protected]
www.OnlineIAS.com
Capital Market Markets for buying and selling equity and debt instruments.
Capital markets channel savings and investment between suppliers of capital such
as retail investors and institutional investors and users of capital like businesses,
government and individuals.
Commodity Market it is a market that trades in primary rather than
manufactured products. Soft commodities are agricultural products such as
wheat, coffee, cocoa and sugar. Hard commodities are mined such as gold, rubber
and oil.
Derivates Market It is the financial market for derivatives, financial Instruments
like future or options, which are derived from forms of assets.
Insurance Market The equitable transfer of the risk of a loss from one entity to
another, In
exchange for payment in Insurance market It Is a form of risk management
primarily used to hedge against the risk of a contingent, uncertain loss
Foreign Exchange Market The Foreign Exchange Market (Forex, FX or
currency market) Is a global decentralised market for the trading of currencies.
The main participants in this market
are the larger international banks.
Securities Exchange Board of India (SEBI)
It is the regulatory authority established under the SEBI Act. 1992 In order to
protect the interests of the investors in securities as well as promote the
development of the capital market. It involves regulating the business in stock
exchanges supervising the working of stock brokers, share transfer agents
merchant bankers, underwriter’s etc as well as prohibiting unfair trade practices
in the securities market.
The main functions of SEBI are as follows
1. To regulate the business of the stock market and other securities market.
2. To promote and regulate the self-regulatory organizations,
3. To prohibit fraudulent and unfair trade practices in securities market.
4. To promote awareness among investors and training of intermediaries about
safety of market.
5. To prohibit insider trading in securities market.
6. To regulate huge acquisition of shares and takeover of companies.
SEBI’s Guidelines in 1999
Kalyan's www.OnlineIAS.com
Kalyan's www.OnlineIAS.com 64

www.OnlineIAS.com [email protected]
www.OnlineIAS.com
The SEBI, had issued guidelines in 1999 (referred to as ESOP Guidelines) to
provide a regulatory
Framework for the listed companies to implement security based compensation
schemes.
Indian Capital Market The capital market In India is a market for securities. Where companies and
government can raise long-term funds. It is a market designed for the selling and
buying d stocks and bonds.
Chronology of the Indian Capital Market
1830 Trading of corporate shares and stocks in bank and cotton presses in
Bombay.
1850 Sharp increase in the capital market brokers Owing to the rapid
development & commercial
1880-61 outbreak o4 the American Civil War and ‘Share Mania’ in India
1894 Formation of Vie Hamada shares and Stock Brokers Association.
1908 Formation of Vie Calcutta Stock Exchange Association
Indian or Industrial Securities Market
This market refers to the market which deals in equines and debentures of the
corporate.
It is further divided into two parts
1. Primary Market
Primary market (new issues market) deals with new securities’, i.e., securities
which were not previously available and are offered to the investing public for
the first time. It is the market for raising fresh capital in the form of shares and
debentures. It provides the Issuing Company with additional funds for starting a
new enterprise or for either expansion or diversification of an existing one and
thus, Its contribution to company financing Is direct. The new offerings by the
companies are made either as an Initial Public Offering (IPO) or rights issue.
2. Secondary Market
Secondary market/Stock market (old issues market or stock exchange) is the
market for buying and selling securities of the existing companies. Under this,
securities are traded after being initially offered to the public In the primary
market and/or Listed on the stock exchange The stock exchanges are the
exclusive Centers for trading of securities, It Is A sensitive barometer and reflects
The trends in the economy through In the prices of various Securities Security
market Is an economic Institute within which takes place the sale and purchase
transactions of securities between subjects of the economy on the basis of demand
Kalyan's www.OnlineIAS.com
Kalyan's www.OnlineIAS.com 65

www.OnlineIAS.com [email protected]
www.OnlineIAS.com
and supply. Also, we can say that securities market Is a system of interconnection
between all participants (professional and non-professional).
It provides effective conditions
• To buy and sell securities and also to attract new capital by means of issuance
new security (securitization of debt).
• To transfer real asset into financial asset.
• To invest money for short or long-term periods with the aim of deriving
profitability.
• Commercial function (to derive profit from operation on this market).
• Price determination (demand and supply balancing, the continuous process of
prices movements guarantees to state correct price for each security, so the market
corrects mispriced securities).
• Informative function (market provides all participants with market information
about participants and traded instruments).
• Regulation function (securities market creates the rules of trade contention
regulation, priorities determination).
Money Capital Markets
Duration It is for short- term funds(1
year or less)
It is for long-term (more
than 1 year)
Nature of funds Supplies funds for working
capital requirements
Supplies funds for fixed
capital requirement.
Instruments Instruments are T-bill
commercial papers,
certificates of deposit etc.
Instruments are shares,
debentures bonds etc.
Amount of Instrument Each single instrument is
of large amount
Each single instrument is
of small amount.
Institutions Central Banks, commercial
banks, acceptance houses,
non- banking financial
institutions, bill brokers
etc.
Stock exchanges,
Commercial Banks and
Non-Banking institutions
such as insurance
companies, mortgage
banks,
Building societies etc.
Risk Less due to smaller
maturity.
In Short-term, probability
of default is less.
Risk is higher.
Transactions Transactions are on over
phone and no formal place.
Transactions are at formal
place. E.g stock market.
Kalyan's www.OnlineIAS.com
Kalyan's www.OnlineIAS.com 66

www.OnlineIAS.com [email protected]
www.OnlineIAS.com
Broker Transaction without the
help of broker.
Transaction have to be
conducted with the help of
broker.
Basic Role Liquidity adjustment. Putting capital to work,
preferably to long- term
secure and productive
employment.
Relation with Central Bank Closely and directly linked
with Central Bank of the
country.
The capital market feels
Central Bank’s influence.
But mainly indirectly and
through the money market.
Market Regulation Commercial banks are
closely regulated.
The institutions are not
much regulated.
Major Capital Markets
Bond market
It is defined as the environment in which the issuance and trading of debt
securities occurs. The bond market primarily Includes government issued
securities and corporate debt securities and facilitates the transfer of capital from
servers the issuers or organisations requiring capital for government projects,
business expansions and ongoing operations.
Capital Market in India
Types of Bond Markets
The Securities Industry and Financial Markets Association (SIFMA) classified
the broad bond market into five specified bond markets.
They are
Corporate
Government and agency
Municipal
Mortgage backed
Fund
Bond Market Participants
These participants are similar to participants in most financial markets as follows
institutional investors
Governments
Traders
Individuals
Stock Market
Kalyan's www.OnlineIAS.com
Kalyan's www.OnlineIAS.com 67
www.OnlineIAS.com [email protected]
www.OnlineIAS.com
An equity market or stock market is the aggregation of buyers and sellers (a loose
network of economic transactions, not a physical facility or discrete entity) of
stocks (share), these are securities listed on stock exchange as well as those only
traded privately.
Initial Public Offering (IPO)
Initial Public Offering (IPO) or Stock Market Launch Is a type of public offering
where shares of stock in a company are sold to the general public, on a securities
exchange for the first time. Through this process, a private company transforms
into a public company.
Share Market
A share is one unit into which the total share Capital is divided Share capital of
the company can be explained as a fund or sum with which a Company is formed
to carry on the business and which is raised by the issue of shares.
Shares are the marketable instruments issued by the companies in order to raise
the required capital.
These are very popular investments which are traded every day in the stock
market and the value of the share at the end of the day decides the value of the
firm.
D-Mat Account
In India, Shares and securities are held electronically in a Dematerialized account
(D-mat account) instead of the Investor taking physical possession of certificates.
A dematerialized account is opened by the investor while registering with an
investment broker (or sub-broker). The Dematerialized account number is quoted
for all transactions to enable electronic settlements of trades to take place. Every
share holder will have a Dematerialized account for the purpose of transacting
shares.
Types of Shares
The shares which are issued by companies are of two types
Equity Shares These shares are issued and are traded everyday in the stock
market. Equity shareholders only get dividend after preference shareholders and
debenture holders. The returns on the equity shares are not at all fixed.
It depends on the amount of profits made by the company. The Board of Directors
decides on how much of the dividends will be given to equity shareholders.
Shareholders can accept to it reject the offer during the annual general meeting.
Equity shareholders have the right to vote on any resolution placed before the
company.
Kalyan's www.OnlineIAS.com
Kalyan's www.OnlineIAS.com 68

www.OnlineIAS.com [email protected]
www.OnlineIAS.com
Preference Shares These are other type of shares. The preference shares are
market instrument issued by the companies to raise the capital Preference shares
have the characteristics of both equity shares and debentures. Fixed rate of
dividends are paid to the preference shareholder as in case of debentures,
irrespective of the profits earned company is liable to pay interest to preference
shareholders.
Types of Preference Shares
Preference shares are divided into four parts
1. Cumulative and non-cumulative shares
2. Redeemable and non-redeemable shares
3. Convertible and non-convertible shares
4. Participating and nonparticipating shares
Difference between equity Shares and Preference Shares
Equity Shares
Preference shares
Nominal value Is lower
Nominal value is higher.
Dividend varies according to
profit.
Rate dividend is fixed.
No right for arrears of dividend.
Cumulative preference
shares get arrears
No priority in dividend and
repayment of capital
Priority in dividend and
repayment of capital.
Cannot be redeemed
Can be redeemed.
There is more risk.
The risk is lower.
Wide voting right. Limited voting right.
Control over management.
No control over
Management.
Highly speculative.
Less speculative.
Ready to take risk and to get
greater dividend prefer this
Kalyan's www.OnlineIAS.com
Kalyan's www.OnlineIAS.com 69

www.OnlineIAS.com [email protected]
www.OnlineIAS.com
Not ready to take risk and expect
steady
Income prefers this.
Debentures
Debentures are creditor ship securities representing long-term indebtedness of a
company. A debenture is an instrument executed by the company under its
common seal acknowledging indebtedness to some person or persons to secure
the sum in advanced; It is thus, a security issued by a company against the debt.
Debentures, like shares are equal parts of loan raised by a company. Debentures
are usually secured by the company by a fixed or floating debenture at periodical
intervals, generally 6 months and the company agrees o pay the principal amount
at the expiry of the stipulated period according to their terms of issue. Like shares,
they are issued to the public at part, at a premium or at a discount.
Debenture holders are creditors of the company. They have no voting rights, but
their claims rank prior to preference shareholders and equity shareholders. Their
exact rights depend upon the nature of debentures they hold.
Advantages of Debentures
It involves less cost to the firm than the equity financing because
• Investors consider debentures as a relatively less risky investment alternative
and therefore, require a lower rate of return.
• Interest payments are tax deductible.
• The floatation costs on debentures is usually lower than floatation costs on
common shares.
• Debenture holders do not have voting rights and therefore, debenture issue does
not cause dilution ownership.
• Debenture holders do not participate in extraordinary earnings of the company.
Thus, their payments are limited to interest.
• During periods of high inflation, debenture issue benefits the company. Its
obligations of paying interest and principal. which remain fixed, decline in terms.
Types of Debentures
The major types of debentures are as follows
On the Basis of Record Point of View
Registered Debentures These are the debentures that are registered with the
company. The amount of such debentures is payable only to those debenture
holders, whose name appears In the register of the company.
Kalyan's www.OnlineIAS.com
Kalyan's www.OnlineIAS.com 70

www.OnlineIAS.com [email protected]
www.OnlineIAS.com
Barer Debentures These are the debentures which are not recorded in a register
of the company Such debentures are transferable merely by delivery Holder of
bearer debentures Is entitled to get the interest.
On the Basis of Security
Secured or Mortgage Debentures These are the debentures that are secured by
a charge on the assets of the company. These are also called mortgage debentures.
The holders of secured debentures have the right to recover their principal amount
with the unpaid amount of Interest on such debenture out of the assets mortgaged
by the company.
Unsecured Debentures Debentures which do not carry any security with regard
to the principal amount unpaid Interest are unsecured debentures. These are also
called simple debentures.
Capital Market In India
On the Basis of Redemption
Redeemable Debentures These are the debentures which are issued for a fixed
period. The principal amount of such debentures is paid off to the holders on the
expiry of such period. These debentures can be redeemed by annual drawings or
by purchasing from the open market.
Nonredeemable Debentures These are the debentures which are not redeemed
in the life time of the company. Such debentures are paid back only when the
company goes to liquidation.
On the Basis of Convertibility
Convertible Debentures These are the debentures that can be converted into
shares of the company on the expiry of pre-decided period. The terms and
conditions of conversion are generally announced at the time of issue of
debentures.
Non-Convertible Debentures The holders of such debentures cannot convert
their debentures into the shares of the company.
On the Basis of Priority
First Debentures These debentures are redeemed before other debentures.
Second Debentures These debentures are redeemed after the redemption of first
debentures.
Stock Exchanges in India
Kalyan's www.OnlineIAS.com
Kalyan's www.OnlineIAS.com 71

www.OnlineIAS.com [email protected]
www.OnlineIAS.com
Bombay Stock Exchange (BSE), the oldest stock exchange in Asia, was
established in 1875. It is synonymous with Dalal Street.
BSE was corporatized and renamed BSE Limited 2005. In 1894, the Ahmadabad
Stock Exchange was started to facilitate dealing in the shares of textile mills. In
1908, Calcutta Stock Exchange was started to facilitate market for shares of
plantations and Jute mills. At present there are 21 stock exchanges in the country
Two types of transaction take place on stock exchanges.
These are as follows
Investment Transaction
Sale/Purchase of securities undertaken with the long-term prospect relating to
their yield and price.
Speculative Transaction Sale/Purchase of securities undertaken with short-term
gain from differences in yield and price. in this. delivery of securities or the
payment of full price is rare.
Speculative transaction are of different types
Spot Transaction it involves delivery of and payment for securities on the same
day.
Cash Transaction These are ready delivery transaction, wherein delivery of and
payment for securities is completed within a period of 1 to 7 days.
Forward Transaction it involves delivery of and payment for securities will be
made on certain fixed settlement days, coming once in 15 or 30 days. On the
recommendation of the Narsimham Committee, SEBI was given the power to
control and regulate the new issues market as well as stock exchange through
Amendment of the Capital Issues Control Act, 1947.
List of Approved Stock Exchanges in India Approved stock exchanges in India are as follows
UP Stock Exchange, Kanpur
Vadodara Stock Exchange, Vadodara
Coimbatore Stock Exchange, Coimbatore
United Stock Exchange of India Limited
Bombay Stock Exchange, Mumbai
Over The Counter Exchange of India, Mumbai
National Stock Exchange, Mumbai
Ahmadabad Stock Exchange, Ahmadabad
Bangalore Stock Exchange, Bangalore
Bhubaneswar Stock Exchange, Bhubaneswar
Calcutta Stock Exchange, Kolkata
Cochin Stock Exchange, Cochin
Kalyan's www.OnlineIAS.com
Kalyan's www.OnlineIAS.com 72

www.OnlineIAS.com [email protected]
www.OnlineIAS.com
Delhi Stock Exchange, Delhi
Guwahati Stock Exchange, Guwahati
Hyderabad Stock Exchange, Hyderabad
Jaipur Stock Exchange, Jaipur
Ludhiana Stock Exchange, Ludhiana
Chennai Stock Exchange, Chennai
Madhya Pradesh Stock Exchange, Indore
Rune Stock Exchange, Pune
Interconnected Stock Exchange of India Limited
National Stock Exchange (NSE)
NSE was promoted by leading financial institutions at the behest of the
Government of India and was incorporated in November, 1992 as a tax-paying
company unlike other stock exchanges in the country.
On the basis of the recommendations of high powered Pherwani Committee, the
National Stock Exchange was incorporated in November, 1992.
Trading at NSE can be classified under two broad categories
1. Wholesale debt categories
2. Capital market
Wholesale debt market operations are similar to money market operations, where
institutions and corporate bodies enter into high value transactions in financial
instruments such as government securities, treasury bills, public sector unit
bonds, commercial paper, certificate of deposit etc.
Indices of NSE
S and PCNX Nifty
(NSE - 50, renamed on July, 1998)
CNX Nifty Junior
CNX 100
S and P CNX 500 (Crisil 500 renamed on July, 1998)
CNX Midcap
Nifty Midcap 50
S and P CNX Defty
S and P CNX Nifty Dividend
India VIX
Bombay Stock Exchange (BSE)
It was established In 1875, BSE Limited (formerly
known as Bombay Stock Exchange Limited), is Asia’s
first stock exchange and one of India’s leading
Kalyan's www.OnlineIAS.com
Kalyan's www.OnlineIAS.com 73

www.OnlineIAS.com [email protected]
www.OnlineIAS.com
exchange groups. Over the pa8t 137 years, BSE
facilitated the growth of the Indian corporate sector
by providing it an efficient capital raising platform
Indices of BSE
• Sensex • Midcap
• SMLCAP • BSE-100
• BSE-200 • BSE-500
• Around 5000 companies are listed on BSE, making it world’s No. I exchange
in terms of listed members. BSE Limited is world’s 5th most active exchange in
terms of number of transactions handled through its electronic trading system. It
is also one of the world’s leading exchange (5th largest in May, 2012) for index
options trading (Source-World Federation of Exchanges).
• BSE is the first exchange in India and second in the world to obtain an ISO
9001:2000 certification.
• It is also the first exchange in the country and second in the world to receive
Information Security Management System Standard BS 7799-2-2002
certification for its On-Line Trading System (BOLT).
• BSE’s popular equity index, the sensex is India’s most widely tracked stock
market benchmark index. It is traded internationally on the Eurex as well as
leading exchanges of the BRCS nations (Brazil, Russia, China and South Africa).
• The Bombay Stock Exchange launched BSE Carbonex, the first carbon based
thematic index in the country, which takes a strategic view of organizational
commitment to climate change mitigation. This index has been launched with the
aim of creating a benchmark and increasing awareness about the risks posed by
climate change.
• It will enable investors to track performance of the constituent companies of
BSE- 100 index regarding their commitment to greenhouse gases emission
reduction.
Capital Market in India
Over the Counter Exchange of India (OTCEI)
Kalyan's www.OnlineIAS.com
Kalyan's www.OnlineIAS.com 74

www.OnlineIAS.com [email protected]
www.OnlineIAS.com
Traditionally, trading in stock exchanges in India Followed a conventional style,
where people used to gather at the exchange offices and bids and offers were
made by open outcry. This old-age trading mechanism In the Indian stock markets
used to create many functional in efficiencies.
Lack of Liquidity and transparency, long settlement periods and ben ami
transactions are a few examples that adversely affected investors. In order to
overcome these inefficiencies, OTCEI was incorporated in 1990, under the
Companies Act, 1956.
OTCEI is the first screen based nationwide stock exchange in India created by
Unit Trust of India (UTI), Industrial Credit and Investment Corporation of India
(ICICI), Industrial Development Bank of India (IDBI), SBI capital markets,
Industrial Finance Corporation of India (IFCI), General Insurance Corporation
(GIC) and its subsidiaries and bank financial services.
Residex
Keeping the view, the prominence of housing and real estate as a major area for
creation of both physical and financial assets and its contribution in overall
national wealth, a need was felt for setting up of a mechanism which could track
the movement of prices in the residential housing segment Regular monitoring of
the house prices can be useful inputs for the different Interest groups.
MCX Stock Exchange (MCX-SX)
It is a private stock exchange headquartered In Mumbai, which was founded in
2008. Now, it is a MCX-SX full-fledged stock exchange. Securities and
Exchange Board of India (SEBI) on 10th July 2012 granted permission to MCX
Stock Exchange (MCXISX) to operate as full-fledged stock exchange. MCX-SX
would be able to offer additional asset classes such as equity and equity F and 0
(Futures and Options) interest rate futures and wholesale debt segments SEBI has
not allowed the exchange to operate In segments other than currency derivatives.
This move SEBI will bring more competition in the market
Commodity Exchange
• Multi Commodity Exchange India Limited
• National Commodity and Derivatives Exchange Limited (NCDEX)
Kalyan's www.OnlineIAS.com
Kalyan's www.OnlineIAS.com 75

www.OnlineIAS.com [email protected]
www.OnlineIAS.com
• Indian National Multi-Commodity Exchange (NMCE)
• Commodity Exchange Limited ICEX
• MCX Stock Exchange (MCX-SX)
Stock Indexes List of major Stock Exchanges
Amsterdam Stock Exchange Index
Argentina Stock Exchange Index
Brazilian Stock Exchange Index
Stock Exchange Index
China Stock Market Index
Deutch Stock Market Index
French Stock Market Index
Hong Kong Stock Market Index
Indian Bombay Stock Exchange Index
Indian National Stock Exchange Index
Jakarta Stock Exchange Index
Japan Stock Market Index
London Stock Exchange Index
Mexican Stock Exchange Index
New Zealand Stock Exchange
Singapore Stock Market Index
Taiwan Stock Exchange Index
United States Stock Market Index
United States Stock Market Index
United States Stock Market Index
Aex
Merval
Bovespa
Tsx
Shanghai
Dax
CAC 4O
Hang Seng
Sensex
Nifty
Jakarta
Nikkei
FTSE 100
IPC
Index NZX SO
STRAITS
TSEC
DOW
NASDAQ
S & P 500
Reference Rates: MIBID, MIBOR
A reference rate is an accurate measure of the market price. In the fixed
income market, it is an interest rate that the market respects and closely
watches. It plays a useful role in a variety of situations.
NSE had developed MIBID(Mumbai Inter-Bank Bid Rate) and MIBOR
(Mumbai Inter_ Bank Offer Rate) for the overnight market. This was
launched sometime in 1998. They was launched the 14 days
MIBID/MIBOR and then the 1 month and the 4 categories of MIBOR and
MIBID are now available.
Kalyan's www.OnlineIAS.com
Kalyan's www.OnlineIAS.com 76

www.OnlineIAS.com [email protected]
www.OnlineIAS.com
It is the simple average of the quotes by the various participates in the
market banks, PDs, institutions polled on a daily basis.
LIBOR(London Inter-Bank Offered Rate) It is the average of interest rates
provided by leading banks in London that they would be charged if
borrowing from other banks. It is used as a global benchmark interest rate
by many banks around the world.
International Cultivar Registration Authorities (ICRA)
It is an Indian independent and professional investment information and credit
rating agency It was established in 1991 and was originally named Investment
Information and Credit Rating Agency of India Limited (IICRA, India). It is
second largest Indian rating company in terms of customer base.
It was a joint-venture between Moody’s and various Indian commercial banks
and financial services companies. The company changed its name to ICRA
Limited and went public on 13th April, 1997 with a listing on the Bombay Stock
Exchange and the National Stock Exchange.
Credit Rating Agency
It is a company that assigns credit ratings to institutions that issue debt obligations
i.e., assets backed by receivables on loans, such as mortgage backed securities.
These institutions can be companies, cities, non-profit organisations or national
governments and the securities they issue can be traded on a secondary market.
At present, there are four credit rating agencies in the country
They are
• Credit Rating Information Services of India (CRISIL)
• Investment information and Credit Rating Agencies of India (CRAI)
• Credit Analysis and Research (CART)
• Duff Falps Credit Rating India Private Limited (DCR India)
• Cruist is the first credit rating agency of the country started in its functionary,
since 1988.
Moody’s Rating
AAA shows that the bond possess least Investment risk.
Kalyan's www.OnlineIAS.com
Kalyan's www.OnlineIAS.com 77

www.OnlineIAS.com [email protected]
www.OnlineIAS.com
AA shows high grade words.
BAA shows mid grade bonds, neither low grade nor high grade safely.
BA shows bords covered with speculative bords.
Credit Rating Information Services of India Limited (CRISIL)
It is a global analytical company providing ratings, research, risk and policy
advisory services.
CRISIL’s majority shareholder is Stan4ard and Poors, a division of McGraw Hill
financial and provider of financial market intelligence.
CRISIL’s businesses can be divided into three broad categories: Ratings,
Research and Advisory CRISIL ratings has rated/assessed over 61000 entities in
India. Its rating capabilities span the entire range of debt instruments and it has
worked across the corporate strata, from large corporates in the country to the
SMEs.
Future Trading of Foreign Currency
It is exchange where people can trade standardised future contract. That is a
contract to buy specific quantities of a commodity at specified price with delivery
set at a specified time In future.
Capital Market in India
India has four national commodity exchange. Namely
1. Multi Commodity Exchange (MCX)
2. National Commodity and Derivative Exchange (NCDEX)
3. National Multi Commodity Exchange (NMCE)
4. India Commodity Exchange (ICE)
Apart from this, India has (ICE) regional exchanges. All these commodity
exchange are overseen by Forward Market Commission (FMC), which was set-
up in 1953.
Insurance
Kalyan's www.OnlineIAS.com
Kalyan's www.OnlineIAS.com 78

www.OnlineIAS.com [email protected]
www.OnlineIAS.com
Insurance industry includes two sectors : Life insurance and General insurance
Life insurance in India was introduced by Britishers. A British firm in 1818,
established the Oriental Life Insurance Company at Calcutta, now Kolkata. Since
the opening up, the number of participants in the insurance industry has gone up
from 7 insurers (including UC, four public sector general insurers, one specialised
insurer and the GIG as the national re-insurer) in 2000 to 49 insurers as on 30th
September, 2011.
Insurance Regulatory and Development Authority (IRDA)
This was established in the year 1999 by the Indian Government, for two
significant reasons to safeguard the interest of the policy holders and for the
Upgradation of the entire insurance sector, right from the approach adopted by
the existing insurance companies towards their shareholders to the eradication of
the shortcomings of the industry. The organisation was set-up under the
guidelines of the Insurance Regulatory and Development Authority Act, 1999.
Scope of Insurance Regulatory and Development Authority
IRDA has been authorized to register the new insurance companies in India. The
list of new Insurance companies also includes the collaborations of the renowned
Insurance companies overseas with the existing Indian companies.
The insurance companies in India are required to approach the Insurance
Regulatory and Development Authority for the purpose of renewal of the
registration. The Insurance Regulatory and Development Authority is allowed to
withdraw registration of the companies and even cancel the registration of a
company If required. It is also authorized to modify the registration procedure for
a company.
Functions of Insurance Regulatory and Development Authority
IRDA ensures and safeguards the interests of policy holders through various ways
such as
• Nomination by policy holders.
• Settlement of Insurance claim.
• Practical training for insurance agents and other intermediaries.
Kalyan's www.OnlineIAS.com
Kalyan's www.OnlineIAS.com 79

www.OnlineIAS.com [email protected]
www.OnlineIAS.com
• Insurable interest.
• surrender value of policy holders.
• Code of conduct of insurance intermediaries.
• guaranteed success package General Studies paper.
• assistance in gaining correct information about policies.
• creation of management information system.
• promotion of self-regulation within the insurance sector.
Life Insurance Corporation of India (LIC)
LIC was established on 1st September, 1956 which set the pace of nationailsation
of the insurance sector under the stewardship of CD Deshmukh. It has head office
at Mumbai and 8 zonal offices, the most recent being at Patna. LIC Is also
operating internationally through branch offices in Fiji, Mauritius and UK and
through joint venture insurance companies in Bahrain, Nepal, Sri Lanka, Kenya
and Saudi Arabia.
General Insurance Corporation (GIC)
GIC was esatablished on 1st January, 1973 with its four Subsidiaries, viz,
1. National Insurance Company Limited, Kolkata
2. The New India Insurance Company Limited, Mumbai
3. The Oriental Fire and General Insurance Company Limited, New Delhi
4. United India General Insurance Company Limited, Chennai
GIC Reinsurer (Re) has branch offices in Dubai and London and a representative
office in Moscow.
General Insurance Corporation of India
The entire general insurance business in India was nationalized by General
Insurance Business Nationalization Act, 1972 (GIBNA). The Government of
India (GoI), through nationalization took over the shares of 55 Indian insurance
Kalyan's www.OnlineIAS.com
Kalyan's www.OnlineIAS.com 80
www.OnlineIAS.com [email protected]
www.OnlineIAS.com
companies and the undertakings of 52_insurers carrying on general insurance
business.
Insurance and Banking’s
The insurance companies in India are constantly collaborating with the banking
institutions on the pattern of foreign countries to impart more efficiency in the
entire venture insurance sector.
More and more insurance companies are signing MoUs with the Indian banks in
order to carry on their marketing activities through the branches of the banks, the
prominent Indian banks that have already signed such MoUs include the vysya
Bank the State Bank of India and the Jammu and Kashmir Bank.
In 2008, its wholly owned subsidiary was opened in Singapore. it also extends
assistance for development of infrastructure facilities like housing, rural
electrification, water supply, sewerage etc. In addition, it extends resource
support to other ‘financial institutions through subscription to their shares and
bonds’ etc. In making investments, the major consideration is the protection of
the interests of policy holders and the aim is to secure the highest possible yield
consistent with the safety of capital. It is the single largest investor in the country
it subscribes to and underwrites the shares, bonds and debentures of various
financial corporations and companies and provides term loans.
Mutual Funds
It is a body corporate registered with SEBI (Securities Exchange Board of India)
that pools money from individuals/ corporate investors and invests the same in a
variety different financial instruments or securities such as equity shares,
government securities, bonds, debentures etc. Mutual funds can thus be
considered as financial intermediaries in the investment business that collect
funds from the public and invest on behalf of the investors.
Mutual funds issue units to the investors. The appreciation of the portfolio or
securities in which the mutual fund has invested the money leads to an
appreciation in the value of the units held by investors. The investment objectives
outlined by a mutual fund in its prospectus are binding on the Mutual Fund
Scheme. The investment objectives specify the class of securities. A mutual fund
can invest in various asset classes like equity bonds, debentures, basics of
financial markets.
Kalyan's www.OnlineIAS.com
Kalyan's www.OnlineIAS.com 81

www.OnlineIAS.com [email protected]
www.OnlineIAS.com
Types of Mutual Fund
According to the time of closure, schemes are classified as follows
• Open-ended schemes
• Close-ended schemes
Open-ended Schemes These are allowed to issue and redeem units any time
during the life of the scheme, but close-ended funds cannot issue new units except
in case of bonus or rights issue. Therefore, unit capital of open-ended funds can
fluctuate on daily basis (as new investors may purchase fresh units).
Close-ended Schemes New investors can join the scheme by directly applying
to the mutual fund at applicable net asset value related prices in case of open-
ended schemes, but not in case of close-ended schemes. In case of close-ended
scheme, new investors can buy the units only from secondary markets.
Mutual Funds in India
The first mutual fund was set-up in 1963. when the Government of India created
the Unit Trust of India (UTI). until 1987, UTI enjoyed a monopoly in the Indian
mutual fund market and sold a range of mutual funds through a network of
financial intermediates At the end of 1988, UTI had Rs. 6700 crore of assets
under management, in 1993, with the creation of SEBI and better regulation,
transparency and liberalisation of capital markets (which included the creation of
the NSE and the NSDL), the private sector was allowed to enter the mutual fund
industry.
Mutual Fund Regulations
The erstwhile Unit Trust of India (UTI) was set-up by the Reserve Bank of India
in 1963 and functioned under its regulatory and administrative control in 1978,
the Industrial Development Bank of India (IDBI) took over regulatory and
administrative control of the UTI.
Kalyan's www.OnlineIAS.com
Kalyan's www.OnlineIAS.com 82

www.OnlineIAS.com [email protected]
www.OnlineIAS.com
The Government of India enacted the Securities and Exchange Board of India
Act, 1992 on 4th April, 1992 which created the Securities and Exchange Board
of India (SEBI). SEBI issued a comprehensive set of regulations in 1993 and
revised them again in 1996.
Net Asset Value (NAV)
It is the value of an entity’s assets less the value of its liabilities, often in relation
to open-end or mutual funds, since shares of such funds registered with the US
Securities and Exchange Commission are redeemed at their net asset value. Net
asset value may represent the value of the total equity or it may be divided by the
number of shares outstanding held by investors and thereby, represent the net
asset value per share.
Depository System
“A depository is a file or a set of flies in which data is stored for the purpose Of
safe keeping or identity authentication”, defined by Germany Depository.
In India, the Depositories Act, 1996 defines a depository to mean “A company
formed and registered under the Companies Act, 1956 and which has been
granted a certificate of registration under sub-Section (1A) of Section 12 of the
Securities and Exchanges Board of India Act, 1992”.
Depository System in India
A vibrant ant and efficient capital market, which ensures an orderly, development
and contains measures for protection of the ‘investor’s interest, is the most
important parameter for evaluating health of any economy. The practice of
physical trading’ imposed limits on trading volumes and hence, the speed with
which new information was incorporated into prices system. Presently, there are
two depositories working in India.
National Securities Depository limited (NSDI.) It was registered by the SEBI
on 7th June, 1996 as India’s first depository to facilitate trading and settlement of
securities in the demat form. It is promoted by IDBI, UTI NSE.
Kalyan's www.OnlineIAS.com
Kalyan's www.OnlineIAS.com 83

www.OnlineIAS.com [email protected]
www.OnlineIAS.com
Central Depository Services (India) Limited (CSDL) It commenced its
operations during February, 1999 and was promoted by Stock Exchange Mumbai
in association with Bank of Baroda, Bank of India, SBI and HDFC Bank.
Types of Depository System
The two types are as follows
Securities Immoblisation System of Depository The placement of certificates
or other documents of title evidencing ownership of financial instruments in a
central securities depository to reduce the movement of physical securities in the
market place and to facilitate book entry transfers. The next logical step after
immobilisation is dematerialisation.
Securities Dematerialization System of Depository Dematerialisation is the
process by which a client can get physical certificates converted into electronic
balances. An investor intending to dematerialize its securities needs to have an
account with a DR The client has to deface and surrender the certificates
registered in its name to the DP After intimating NSDL electronically, the DP
sends the securities to the concerned Issuer/ R&T agent.
Kalyan's www.OnlineIAS.com
Kalyan's www.OnlineIAS.com 84

www.OnlineIAS.com [email protected]
www.OnlineIAS.com
MONEY AND BANKING
Adoption of tight monetary policy by RBI in the face of persistent inflationary
pressures as well as Increasing risks to growth from external and domestic
Sources contributed to a sharp slowdown of the economy during 2011-12. This
prompted a shift in the policy stance of RBI in 2012-13 which led to redirection
of repo rates in April 2012 January 2013 and again in March 2013 bringing down
the repo rate to 7.25 per cent and reverse repo rate to 6.25 per cent. Since the mid-
Quarter review of Monetary Policy September 2013, the outlook for. global
growth has improved modestly, with fiscal concerns abating in the US and lea&
indicators of activity firming up in the Euro area and the UK. Thereafter the R8i
Kalyan's www.OnlineIAS.com
Kalyan's www.OnlineIAS.com 85

www.OnlineIAS.com [email protected]
www.OnlineIAS.com
increased the policy repo rate under the Liquidity adjustment facility (LAF) by
75 basis points from 7.25 per cent to 8 per cent with unmediated effect in -
January 2014. Consequently, the reverse repo rate under the LAF stands adjusted
to 7 per cent and the Bank Rate stands at 9 per cent with immediate effect. The
RBI had earlier reduced the Statutory Liquidity Ratio (SLR) to 23 per cent in
August 2012 and the Cash Reserve Ratio to 4 per cent in February 2013. These
The RBI continued with its liberal monetary policy for most part of the year 2013
to improve the investor perception and create a favourable environment for
investment, while keeping the policy rates static (except for Repo and Reverse
Repo). This was done by simultaneously releasing liquidity with the banking
system through purchase of targeted amount of government securities. .
Liquidity conditions eased gradually during the first half of 2012-13. The
turnaround In liquidity. conditions was due to a decline in government’s cash
balance, injection of liquidity of about Rs. 860 billion by way of CMOs purchases
of securities and increased use of the export credit refinance facility .by banks.
Reduction in SIR by one percentage point also improved the access of banks to
potential liquidity.
The liquidity conditions remained above the Reserve Bank’s comfort zone during
most of the third quarter of 2012-13. Consistent with the stance of monetary
policy based on the current assessment of prevailing and evolving liquidity
conditions, the Reserve Bank resumed Open Market Operations (purchase of
government securities) in December, 2012.
Measures of Money Supply and Liquidity Aggregates
Reserve Money (M0) Currency in Circulation. Banker& deposits with the RBI +
Other deposits with the RBI.
Narrow Money (Mi) = Currency with the Public - Demand Deposits with the
Banking System + Other Deposits with the RBI.
M2 =M1 + Savings Deposits of Post Office Savings Banks.
Broad Money (M3) = M1 + Time Deposits with the Banking System.
M4=M3+ All deposits with Post Office Savings Banks (excluding National
Savings certificates).
While measures M0,M1and M3 are widely used In India M2 and M4 are rarely
used. The RBI initiated publication of a new set of monetary and liquidity
aggregates as per the recommendations of the Working Group on Money Supply,
Kalyan's www.OnlineIAS.com
Kalyan's www.OnlineIAS.com 86

www.OnlineIAS.com [email protected]
www.OnlineIAS.com
Analytics and Methodology of Compilation’. Following the submission of its
report In June 1998, while no changes were made in the definitions of M0 and
M1,new monetary aggregates t NM2 and NM3 as well as liquidity aggregates L1,
L2 and L3 have been introduced., the components of which are elaborated as
follows:
NM1 = Currency with the Public + Demand Deposits with the Banking System
+ Other Deposits with the RBI. .
NM2 = NM1 + Short Term Time Deposits of Residents (including. and, upto the
contractual maturity of one year). .
NM3 = NM2 + Long-term Time Deposits of Residents + Call/Term Funding from
Financial Institutions. .
RESERVE BANK OF INDIA (RBI)
The RBI was established under the Reserve Bank of India Act. 1934 on 1st April
1935. it was nationalized on 1st January. 1949 as per RBI Nationalisation Act
(1949) RB1 Is the Central Bank of the country and performs all those functions
which Central banks of other countries perform.
The monetary functions of the RBI Include control and regulation of money and
credit, control of foreign exchange operations, acting as banker to the
Governments bankers’ bank, and tender of the last resort.
The non- rnonetary functions of the RBI are related to the promotion of a sound
banking system under which it is instrumental in supervising branch expansion,
management and methods of working and regulation, and control of the banking
system as a whole.
The monetary policy of the RBI has a very important role to play in pushing up
growth as this policy determines the amount of money and credit that will become
available to various sectors of the economy. While adopting this policy, it has
also to keep in mind that money supply does not exceed genuine demands of
various sectors and lead to Inflation. To strike a balance between the two
objectives of pushing growth on the one hand, and containing inflation on the
other, the RBI has all along followed a policy of Control Expansion’ which
Implies that money supply Is expanded to meet only the genuine requirements of
various sectors, taking a caution that it does not spill over to cause inflation. This
principle has also guided its policy of exercising control over the creation of credit
Kalyan's www.OnlineIAS.com
Kalyan's www.OnlineIAS.com 87

www.OnlineIAS.com [email protected]
www.OnlineIAS.com
by commercial banks. The RBI, like any other Central Bank Uses the following
two principal measures of credit control:
(1) Quantitative Credit Control. Measures
(2) Qualitative or Selective Credit Control Measures
Quantitative Controls: These are controls designed to regulate the overall
volume of credit created i.e. loans given by banks. The principal instruments’
used under these controls are as follows
(1) Bank Rate: It Is that rate of interest at which the RBI provides refinancing
facilities to commercial banks by rediscounting’ their bills of exchange or other
commercial papers. In other words Bank Rate is the rate at which the RBI extends
credit to commercial banks. The Bank Rate was 9 per cent in February 2014.
(ii) Cash Reserve Ratio: The RBI Act, 1934 stipulates that a commercial bank is
required to keep a certain percentage of its total deposits with the RBI in cash.
The RBI can vary this percentage. As such, this is also called Variable Reserve
Ratio. This ratio was brought down from 6 per cent to 4.75 per cent In March,
2012 and further to 4 per cent in February, 2013. Generally, the RBI permits
Banks to maintain minimum daily average holding of 70 per cent of the mandated
4 per cent CRR. However, it tightened this requirement w.e.f. July. 2013 by
raising the minimum daily average holding from 70 per cent to 99 per cent. This.
measure aims at squeezing liquidity from the system.
(iii) Statutory Liquidity Ratio: It is that ratio/percentage of its total deposits
which a commercial bank has to maintain with itself at any given point of time
in the form of liquid assets like cash In hand, current balances with other banks
and first class securities (generally government securities). This ratio was 23 per
cent in November, 2013. The Banking Regulation Act. 1949 has been amended
to ernpower the RBI to Lower it ‘as and when it deems necessary.
(iv) Open Market Operations: These are operations which involve the sad
purchase of government securities by the RBI vis-a-vis the banking system. These
operations not only help in stabilizing the prices of government securities but
more importantly , controlling the inflationary pressures from time to time as well
as increasing/decreasing the Supply of money. The RBI uses this tool on a regular
basis to adjust liquidity.
Kalyan's www.OnlineIAS.com
Kalyan's www.OnlineIAS.com 88

www.OnlineIAS.com [email protected]
www.OnlineIAS.com
Qualitative or Selective Credit Controls are control designed to regulate both
the volume of loan and the purpose for which loans are given by commercial
banks. The techniques of Selective Credit Controls are minimum margins for
lending against specific Securities, ceiling on the amount of credit for specific
purposes (called rationing of credit) and discriminatory rates of interest charged
on certain types of advances. Through selective credit controls, the RBI tries to
maintain sectoral and regional balance. Selective controls also include exercising
its moral suasion by the RBI over banks and, as a last resort. taking direct action
by way of punitive measures. Selective controls have Special Importance in India
to check speculation and hoarding by traders on the basis of loans taken from
banks.
Repo and Reverse Repo
The term REPO moans repurchase options exercised by the RBI in respect of
government securities sold by the RBI to commercial banks with a promise
repurchase them at a certain price Repo transactions imply Liquidity Adjustment
Facility of the RBI whereby it injects and absorbs liquidity vis-e-vis the banking
system to even out short term fluctuations in the money market. The RUI has
switched over to the international usage of the terms ‘repo’ and ‘reverse repo’
effective from October 29, 2004. As per the international usage1 absorption
liquidity by the RB! is termed as ‘reverse repo’ and injection as ‘repo’. (Prior to
October 29. 2004 absorption of liquidity was termed as ‘repo’ and Injection as
‘reverse repo). The repo and reverse repo rates were 7.25 per cent and 6.25 per
cent respectively in March 2013. Thereafter RBI hiked the repo and reverse repo
rates by 50 basis points each to 7.75 per cent and 6.75 per cent respectively in
November, 20i. Again in January. 2014 the repo and reverse repo rates were hiked
by 25 basis points each to 8 percent and 7 percent. respectively. The Repo Rate
Is not interest rate but a discount rate on the government securities which are
pledged by a bank/financial institution to brow for short term from the RBI. As
such, when these banks/financial institutions pay back this loan to the RBI and
get their securities released, the value of the securities is lost by the amount of the
prevailing repo rate.
Marginal Standing Facility (MSF).
In May 2011, the RBI introduced a new ‘instrument’ called the Marginal
Standing. Facility under which all Scheduled Commercial banks can avail from
Kalyan's www.OnlineIAS.com
Kalyan's www.OnlineIAS.com 89

www.OnlineIAS.com [email protected]
www.OnlineIAS.com
the RBI overnight funds up to one per cent of their net demand and time liabilities.
The facility can be availed at an interest rate which Would be one per cent above
the prevailing repo rate or as decided by the RBI from time to tune. In February,
2012 the RBI also took a decision to align the Bank Rate with the MSF rate.
Hence forth, whenever there is an adjustment of the MSF rate (based on the
prevailing repo rate) the RBI will consider and align the Bank Rate with the
revised MSF rate. In order to contain inflation, the RBI tightened liquidity in July,
2013-by announcing that banks can avail MSF from the RBI upto 0.5 per cent of
their deposits as against one per cent earlier.. Bank Rate also acts as the penal rate
charged by the RBI from banks for their reserve requireme5 viz., CRR and SLR.
It also acts as the for shortfall Priority Sector lending by Commercial banks. The
MSF rate in November 2013 was 8.75 Percent which was hiked in January 2014
to 9 percent.
The Base Rate regime
Was Introduced w.e.f. 1st July. 2010 replacing the age-old PLR arid the
Benchmark PLR The base rate- the floor below which a bank cannot lend Even
to its top most client - is arrived at after factoring in a bank’s cost of funds and
other ,perat1n expenses.. It replaces the much-abused benchmark Prime Lending
Rate (PLR). Credit will henceforth revolve around the base rate as it will be the
reference rate over which all loans will be priced and it will succeed in monetary
transmission.
A Central Bank Panel recommended the new system after finding that
banks, mostly private sector ones, Were not passing on the reduction in policy
rates to customers while they were quick to act whenever rates climbed. That
blunted monetary policy actions. The lack of transparency in lending also led to
accusations that small companies and retail customers were subsiding the so-
called AAA customers.
Prime lending rates continued to be rigid and inflexible in relation to the
overall direction of interest rates in the economy. An issue often raised is the
asymmetric downward stickiness of BPLRs. This not only raises an Issue of
equity, but also results in poor transmission of monetary policy in credit markets.
Although customers are expected to benefit from the new regime, they may not
move in hordes seeking lower rates as many factors such as customer service,
branch proximity and comfort levels play a significant role in choosing a bank.
Kalyan's www.OnlineIAS.com
Kalyan's www.OnlineIAS.com 90

www.OnlineIAS.com [email protected]
www.OnlineIAS.com
Base rate will be determined on the basis of banks costs of funds which
include cost of deposits. Profit margins operating expenses, administrative
expenses and statutory expenses. Base rate will not apply to concessional loans
for agriculture, exports and other specified sectors. This regime implies that small
cust9mers will no longer subsidies the bigger ones. it will ensure that rate hikes
or cuts are informally passed On to all borrowers.
Treasury Bills
Treasury Bills (TBs) are a short-term liability of the Government of India. Except
the RBI, there are no major holders of TBs. Non-bank financial intermediaries,
corporate firms. etc., do not hold TBs. Treasury bills are basically of two types:
ad hoc and regular Ad hoc means ‘for the particular end or case in hand’. The
issue of ad hoc treasury bifl5 had begun to represent automatic monetization of
the government’s budget deficit Therefore, as a measure to contain this trend, the
system of ad hoc treasury bills Was discontinued from 1997-98. (The Ways and
Means Advances replaced the ad hoc bills (or financing governments temporary
deficits.) Treasury bills are of various maturities:
91-Day Treasury Bills: The 91-day treasury bills have been the traditional
instrument in the money market through which the government raises funds for
short periods and commercial banks invest their short term funds. Also, there are
182-day Treasury Bills. .
364-Day Treasury Bills: The, 364-day treasury bills being long-dated and
relatively risk-free, attract investments from banks arid financial Institutions.
These can be easily liquidated in times of need and are superior other investments.
The 364-day treasury bills have become an important instrument of Government
borrowing from the market. These buts are entirety held by the market and the
RBI does not subscribe to them.
MONEY MARKET
The term money market’ means market for borrowing. and lending of
short-term funds as distinct from ‘capital market’ which deals In long-term funds.
When banks and financial institutions deal in short term funds they are called
constituents of the money market and when they deal in long-term funds they are
Kalyan's www.OnlineIAS.com
Kalyan's www.OnlineIAS.com 91

www.OnlineIAS.com [email protected]
www.OnlineIAS.com
constituents of the capital market. However, this distinction is fast eroding as the
concept of universal banking is now becoming a reality which implies ‘One Stop
Banking’ i.e., dealing in both short-term and long-term borrowing / lending by
banks under one roof. For example, housing loan is a long-term loan while
consumer loan is short-term.
Indian money market has two segments viz., the Organised money market
which consists of all commercial banks, co-operative banks and regional rural
banks and the Unorganised money market which consists of indigenous bankers,
money lenders. Shroffs, Mahajans. Bniyas etc. who lie outside the purview of the
RBI.
Call Money Market means Inter-bank transactions on a day-to-day basis. It is also
as money at call and short notice’ which implies that. on a day-to-day basis. banks
which have surplus funds lend to those which are short of funds. The rate of
interest at which those day to day transactions between banks take place is known
as the ‘Call Money Rate’. This is the most sensitive segment of the money market.
A high money rate would mean scarcity of funds and tight money market while
a low call rate would mean easy availability of funds. Mumbai being India’s
financial hub, the call money rate in the Indian money market is determined on
the basis of MIBOR (Mumbai interbank Offered Rate) - a term coined on the
lines of LIBOR - the London Interbank Offered Rate.
LIBOR
LIBOR stands for London Inter Bank Offered Rate which) is the day-today
rate of interest on inter-bank loans in the London Money Market. This rate serves
as a benchmark rate for various transactions at the global level, it is published
every day by the British Bankers Association based on a survey of what Banks in
London report as the rate at which they borrow/Lend in the interbank market.
There is also the –EURIBOR which is the European Union Inter Bank Rate.
Commercial Banks: The most important constituent of the organised money
market in India are the commercial banks, both in the public as well as the private
sector inducing foreign banks. At present, there are 27 commercial banks In India
in the public sector consisting of 19 nationalized banks,. The State Bank of India
five subsidiary banks of the SBI the IDBI and the Bhartiya Mahila Bank set up in
November, 2013.
Kalyan's www.OnlineIAS.com
Kalyan's www.OnlineIAS.com 92

www.OnlineIAS.com [email protected]
www.OnlineIAS.com
A commercial bank can be a Scheduled bank or a non-scheduled bank A
Scheduled. Commercial bank is a bank which ha a paid-up capital of Rs.5 lakhs
and above and which is listed in the Second Schedule of the RBI Act, 1934. Such
a bank must carry out its activities in the interest of the depositors and as such it
is eligible for RBI patronage.
A non-scheduled bank, on the other hand, is one which Is not included in
the Second Schedule of the RBI Act, 1934. Such banks do not enjoy the patronage
of the RBI and thus cannot enjoy refinancing facilities of the RBI.
The first purely Indian commercial bank set up in India was the Punjab
National Bank n 1894. However, the Oudh Commercial Bank set up-in 188.1
with limited Indian equity was the oldest commercial bank set up in India. The
State Bank of India is the largest public sector bank in the country. It was set up
in 1921 by amalgamating the Presidency banks of Bengal, Bombay and Madras
and was then known as the Imperial Bank of India. It was nationalized In 1955
and named as State Bank of India. It works a an agent of the RBI wherever RBI
does not have a branch.
Nationailsation of Banks - 4n July 1969, the Government of India passed
the ordinance for nationailsation of such of the 14 mayor commercial banks in
India which had total deposits of Rs. 50 crore and above. Six more banks were
subsequently nationalized in 1980. Thee were banks having total deposits of Rs.
200 crore and above.
Nationalization of the banking industry was carried out to achieve a large number
of objectives as follows:
(i) to prevent concentration of economic power, as banks in the private sector
mostly provided credit to a small class of high Profile customers and those
industries in which banks’ shareholders had their Interests;
(ii) to spread banking across the length and breadth of the country and correct the
urban bias;
(iii) to cater to the requirements of the agricultural sector and reduce the
stranglehold of the money lenders;
(iv) to make banking industry serve social purposes as against profit
maxirnisation;
(v) to develop a pool of professional bankers;
Kalyan's www.OnlineIAS.com
Kalyan's www.OnlineIAS.com 93

www.OnlineIAS.com [email protected]
www.OnlineIAS.com
(vi) to mobilise savings of a large mass of population, as nationailsation would
instil confidence among the people.
A large number of benefits have accrued to the economy since the
nationalisat ion of banks. There has been massive spread of bank branches, sharp
rise in mobilisation of deposits and credit disbursement to priority sector like
agriculture. small-scale industries, sick units, social orientation of banking
industry in terms of financing
Poverty alleviation and employment generation programmes, diversification of
banking
operations by way of merchant banking, housing finance, leasing, offshore
financing etc.
The banking industry has been transformed from ‘class banking’ to ‘mass
banking’ arid
has resulted in fast spread of banking habits.
However, nationailsation. of the banking industry also brought With it,
over the years, a large number of problems which eroded the financial base and
credit of the ‘‘ entire banking industry. Problems like uneconomic branch
expansion, directed credit programmes. Violation of prudential norms of banking,
lack of transparency in preparing balance sheets over-staffing, declining
customers service, rampant political Interference in Their day to day functioning,
loan melas. loan waivers etc. brought the banking industry to a Situation when as
many as 14 out of 20 nationalised banks were repot tea sick in 1991. Priority
sector lending along with stipulations of maintaining high CRR and SLR Imposed
by the RBI dealt final blows leading to mounting losses and high non-p
performing assets of the banking sector. Reforms in the banking industry became
inevitable at this point of time. Hence, with the’ announcement of the New
Economic policy in 1991, reforms of the banking sector were initiated by setting
up the Narsimhan Committee on Financial Sector Reforms in 1991.
Banking Reforms
Narsimhan Committee Recommendations: The Committee on Financial Sector
Reforms headed by Mr. M. Narsimham (1991) recommended a large number of
Kalyan's www.OnlineIAS.com
Kalyan's www.OnlineIAS.com 94

www.OnlineIAS.com [email protected]
www.OnlineIAS.com
measures to reform the banking and financial sector. Major recommendations of
the Committee were as follows:
(i) There should be no bar to new banks being set up in. the private sector,
provided they conformed to the start-up capital and other requirements prescribed
by the Reserve Bank of India.
(ii) The Government should indicate that there, would be no further
nationailsation of banks and there should not. be any difference in treatment
between public sector banks and private sector banks.
(iii) The banking system should evolve towards a broad’ pattern consisting ‘of
three or four large banks, including the State Bank of India which could become
international in character; eight td ten national banks with a network of branches
throughout the country engaged 1n universal ban king; local banks whose
operation would be generally confined to a specified region and lastly, rural banks
to cater to rural areas.
(iv) There should be an Assets Reconstruction Fund (ARE) which could take over
from the Banks and Financial Institutions (Fls) a portion of their bad and doubtful
debts at a discount, the level of discount being determined by independent
auditors on the basis of clearly defined guidelines. The ARF according to the
Committee, should be provided with special powers for recovery, somewhat
broader than those contained in sections 29 to 32 of the State Financial
Corporation Act, 1951. The capital of the ARF Should be subscribed by the public
sector banks and the financial institutions
(v)The banks and the nanc1a1 institutions should be authorised to recover DRTs
bad debts through the special tribunals and ‘based on the valuation given in
respect of each asset b a panel of at least two independent auditors.
(vi) The public sector banks with profitable operations should be allowed to tap
the capital market for enhancement of their share capital. Subscribers to such
issues could be mutual funds, profitable public sector undertakings and the
employees of the institutions besides the general public.
(vii) Branch licensing should be abolished and the option of opening branches or
closing of branches other than rural branches for the present, be left to the
commercial judgment of the individual banks. Further, the internal organisation
of banks Is best left to judgment of the management of the individual banks.
(viii) There-should e phased reduction of CRR and SLR.
Kalyan's www.OnlineIAS.com
Kalyan's www.OnlineIAS.com 95

www.OnlineIAS.com [email protected]
www.OnlineIAS.com
(ix) A Board for Financial Supervision should be set up to oversee the operations
of the banks.
(x) Banks should economy o prudential income recognition norms of
provisioning against bad and doubtful debts and ensure(e transparency in
maintaining. balance sheet,
(xi) There should be speedy computerization of the banking industry.
(xii)There should be no further branch expansion.
(xiii)Banks should enjoy the freedom to close a branch, except those in rural
areas.
The Committee also recommended that foreign banks should be subjected to the
same requirements as are applicable to the Indian Banks and RBI policies should
be more liberal in respect of allowing the foreign banks to open branches or
subsidiaries. Joint ventures between foreign banks and Indian banks should also
be permitted particularly in regard to merchant banking, investment banking,
leasing and other newer forms of financial services. Priority sector lending by
banks should be reduced from 40 per cent to 10 per cent of their total credit.
The Committee recommended phasing out of concessional interest rates.
The Committee
was of the view that the present structure of administered Interest rates was
‘highly complex and rigid’ and proposed that interest rates be further deregulated
so as To reflect emerging market conditions Premature moves to market
determined interest rates could, as experience has Shown pose the danger of
excessive bank lending at highly nominal rates o borrowers 0f.db credit
worthiness, the committees observed
Most of the of the Committee have since been implemented. Mean while,
keeping in view the changing global scenario after the selling up of the WTO and
the need for more efficient, competitive and broad-based banking sector, the
Government set up another Committee on Banking Sector Reforms, under the
Chairmanship of Narsimhan.
Kalyan's www.OnlineIAS.com
Kalyan's www.OnlineIAS.com 96

www.OnlineIAS.com [email protected]
www.OnlineIAS.com
Narsimhan Committee -II Recommendations
The Narsimhan committee banking sector reforms submitted its report in
April 1998 and made a series of sweeping recommendation The report covers an
entire gamut of issues ranging from bank mergers and the creation of globalised
banks to bank closures, recasting bank boards and revamping banking
legislations. The Committee makes a case for a stronger banking system in the
country. especially, in the context of Capital Account Convertibility Major
recommendations of the Committee were as follows:
1. Merger of strong banks which have a multiplier. effort in Industry, it Cautioned
against merger strong banks with weak baiks1 as this will adversely affect the
ass& quality of strong banks.
2. Concept of narrow banking should be tiled out to rehabilitate Weak banks. If
these was not successful, the Issue of closure should be examined . Narrow
banking according to the Committee, implied that weak banks should not be
permitted to invest their funds anywhere except in government securities as these
were absolutely Sate and risk free.
3.Two or three target Indian banks should be given international character.
4 Small local banks should be confined to States or duster of districts in order to
serve local trade: small industry and agriculture.
5.The Committee also commented on the Government’s rote In public sector
banks by observing that Government ownership has become an Instrument of
management. Such micro-management of banks is not conductive to
enhancement of autonomy and flexibility. —
6. Functions of boards of management need to be reviewed so boards remain
responsible for enhancing shareholder value formulation of corporate strategy.
7. Need to review minimum prescriptions for capital adequacy. In this regard the
Committee recommended that CAR be raised to 10 per cent by 2002.
8. The RBI Act, Bank Nationailsation Act, Banking Regulation Act and State
Bank of India Act were in urgent need of review.
9. Legal framework of loan recovery should be strengthened.
10. Integration of NBFC’s lending activities into the financial system.
11. Need for public sector banks to speed up computerization and focus on
relationship banking:
Kalyan's www.OnlineIAS.com
Kalyan's www.OnlineIAS.com 97

www.OnlineIAS.com [email protected]
www.OnlineIAS.com
12. Review of recruitment procedures. training and remuneration policies in
public sector banks.
13. Setting up of a Board for Financial Supervision for banks, . financial
Institutions and NBFCs.
14. Need for professionalizing and depoliticizing of bank boards.
15. The Banking Service Recru4tnient Board should be abolished.
16. The RBI should act only as a regulator and not both regulator and owner.
The recommendations of the Committee Continue to be implemented in a
phased manner. For example, Capital Adequacy requirements of banks have been
stepped up and prudential norms have been made more and more stringent. All
the major banking legislations Viz., the RBI Act (1934), the Ranking Regulation
Act (1949), Bank
Nationalisation Act (1970) have been reviewed and gradually diluted in
accordance with changing requirements. More flexibility is being provided to
banks by greater autonomy to bank boards. On-line banking has become the key
word and consolidation of the banking industry (rather than branch expansion) is
being encouraged by permitting mergers and acquisitions within the existing legal
framework. Asset Reconstruction Funds/Companies have been set up for bad
debts and the limit in private banks has been raised to 74 per cent. Most
importantly a securitization legislation has been put in place for recovery of bad
debts, This is known as SARFAESI viz.. Securitisation and Reconstruction of
Financial Asserts Enforcement of Security Interests. In October, 2011 the Union
Cabinet approved the introduction of a new bill In Parliament to amend
SARFAESI (2002) and Recovery of Debts Due to Banks and Financial
Institutions (1993) to enable banks to improve their operational efficiency, deploy
more funds for Credit disbursement Investors, home loan borrowers and
corporate without worrying over the recovery process. Thus, the amendments
would strengthen the ability of banks to recover dues from borrowers and reduce
the level of their NPAs.
Reforms in the banking sector have led to considerable Improvement in
their Profitability. With liberalisation on and growing integration of the Indian
financial sector with The international rnarket, the supervisory and regulatory
role of RBI bas become critical for the maintenance of financial stability. RBI
Kalyan's www.OnlineIAS.com
Kalyan's www.OnlineIAS.com 98

www.OnlineIAS.com [email protected]
www.OnlineIAS.com
has been continuously fine-tuning its regulatory and supervisory mechanism in
recent years to match international standards. migration to flew Capital adequacy
framework (Base-II) based on a three-pillar approach, namely, capital
‘requirements, supervisory review, and market discipline. Involves
implementation challenges for both RBI and banks. RBI has taken a number of
initiatives to make migration to- Basal ii smoother. Indian banks having presence
outside India and foreign banks operating within India are to migrate to Basel II
w.e.f. March 31. 2008 while all other scheduled commercial banks w.e.f. March
31, 2009. Though the minimum CAR aider BASEL II 8 per..cent, the RBI has
made it .9 per cent in India. The number of bank branches providing ‘Core
Banking Solutions (CBS) in recent years is increasing rapidly Under CBS, a
number of services are being provided such as ‘anywhere banking’. ‘everywhere
access’, and ‘quick transfer of funds in an efficient manner and at reasonable cost.
This implies that banking sector In India Is adapting itself to rapid innovations in
technology.
The RBI has emphasised transparency, diversification of ownership,
and strong corporate governance practices to mitigate the prospects of systemic
risks in the banking sector: The RBI has. issued detailed draft guidelines on the
sale/purchase of non-performing assets where securitization companies and
reconstruction companies are not involved.
The draft guidelines cover:
(i) procedure for purchase/sale of non-performing financial assets by banks.
including valuation and pricing aspects;
(ii) prudential norms relating to asset classification. provisioning, accounting of
recoveries, capital adequacy and exposure norms and disclosure requirements.
The guidelines, among other things, provide that a NPA in the books Of a
bank shall be eligible for sale to other banks, only If it has remained as NPA for
at least two years In the books of the selling bank and sum selling should be only
on Cash basis; a NPA should be held by the purchasing bank in its books at least
for a period of 15 months before It is sold to other banks: banks should ensure
that subsequent to the sale of a NPA to other banks, they should tot have any
Involvement with reference to the assets sold and do not assume operational, legal
or any other type of risks relating to the financial assets sold.
Kalyan's www.OnlineIAS.com
Kalyan's www.OnlineIAS.com 99

www.OnlineIAS.com [email protected]
www.OnlineIAS.com
Banking industry is poised for a phase of consolidation and expansion.
The, former Implies. Strengthening the banking sector by way of amalgamation
and mergers of non-viable branches as well as by way of tightening capital
adequacy norms. On the other hand, expansion of the banking sector is envisaged
by issuing fresh banking licenses to Private Sector players’ to achieve the goal of
financial inclusion. The RBI issued guidelines for fresh banking ’Licenses which,
inter alia, require a minimum capital of Rs. 500 crore and at least 25 per cent of
the branches to be set up In rural areas.
A Committee has been set up under the Chairmanship of former Governor of RBI
Bimal Jalan to screen the applications received for fresh banking license and to
make necessary recommendations in this regard.
The gross NPAs of all public sector banks for the period ending 2012-13
stood close to 1.9 lakh crores out of which nearly 20 per cent were due to money
locked up with willful defaulters i.e. borrowers who have not repaid their dues
despite having the capacity to do so. The RBI has taken a serious note of NPAs
of PSU banks and directed them to adopt following measures:
(i) Focus on recovery
(ii) Follow a stringent credit appraisal procedure
(iii) Be cautious in the wake of a higher than expected rate hike that could have
an impact on the asset quality
(iv) Monitor asset quality on a regular basis
A working group set up by the RBI on Restructuring of Bad Debts’
submitted its recommendations according to which banks will have to increase
provisioning requirements on existing standard restructured loans from the
present 2 per cent to 5 per cent in a phased manner over a period of two years.
The government has also set up a panel headed by the former Chairman of Dena
Bank to suggest measures to ensure faster recovery of bad loans. Over the last
two Years the government. has Infused Rs. 32.000 crore k state-owned banks to
help grow business,
Establishment of Central Registry:
The Government of India has notified the establishment of the Central
Registry those objective is to prevent frauds in loan cases involving rnultiple
Kalyan's www.OnlineIAS.com
Kalyan's www.OnlineIAS.com 100

www.OnlineIAS.com [email protected]
www.OnlineIAS.com
lending from different banks on the Same immovable property The Central
Registry of Securitization asset Reconstruction end security interest of India
(CERSAI) a government company sensed under Section 25 the Company Act1
1956 has been incorporated for the purpose of Operating and maintaining
Central Reis under the provisions of the securitization and Reconstruction of
Financial Assets and En1occemen of Security interest act,2002 (SARFAESI
Act).
Damodaran Committee on Reform. in Banking Custom Services
The Committee submitted its report to the RBI in September, 2011. The
Committee has recommended wide ranging reforms kiC1udig those related to
banking services in rural areas timing of opening and close up branches services
to senior citizen etc. Some of the major recommendations are as follows:
(1) Thee should be no restriction of maintaining minimum balance in the account
for obtaining facilities of cheque book and ATM card.
(2) Fixed Deposit should not automatically be renewed without written
Permission/request of the depositor.
(3) The present limit of insurance cover 01 Rs. 1 lakh or deposits in savings
account should be raised to Rs. 5 lakh.
(4) Home loan customers should not be penalized on Closing their account before
maturity period if they succeed in getting home loan at a lower interest rate from
some other bank or financial institution.
(5) All documents kept against granting home loans should be returned to the
customer within 15 days from the date 01 hit payment of loan.
(6) A common free call centre number should be made for the complaints against
all banks from where the phone can be diverted to concerned bank.
(7) Each branch of a bank should have a separate: Counter earmarked attending
to senior citizens/physically challenged customers, who should be given priority
over other customers at that special counter.
(8) Senior citizens are at present offered an additional Interest of Up to 1% on all
fixed deposits: The same benefit ‘of additional Interest should be offered to them
on their savings deposits also.
(9) The penalty, if levied on withdrawal of: deposits before maturity, should not
be applied to senior citizens/physically challenged customers, who should be
Kalyan's www.OnlineIAS.com
Kalyan's www.OnlineIAS.com 101

www.OnlineIAS.com [email protected]
www.OnlineIAS.com
given the normal rate of Interest applicable for the period for which the deposit
has run, without any deductions.
BASEL-l
Basel accord refers to a set of agreements set up by Basel Committee on Bank
Supervision (BCBS). which provides recommendations on banking, regu1atons
in regards to capital risk, market risk and operational risk. The purpose of. the
accord is to ensure that financial Institutions have enough capital on account to
meet obligations and absorb unexpected losses.
The Basel Committee is named after the Swiss town o Base I. The Basel
Committee on Banking Supervision operates under it- auspices of the Bank of
International Settlements (BIS) located in Basel , Switzerland.
Basel-l is the round of deliberations by central bankers from around the
world, and in 1988. the BCBS published a set of rninimal capital requirements
for banks. This is also known as the 1988 Basel Accord, and was enforced by law
in the G-1O countries in
1992. with Japanese banks permitted an extended transition period.
Basel-l primarily focuses on credit risk. Assets 01 banks are classified and
grouped in live categories according to credit risk, Carrying risk weights of zero
(for example home Country sovereign debt), ten, twenty, fifty, and up to one
hundred per cent (this category has, as an example most corporate debt). Banks
with international presence are required to hold capital equal to 8 per’ cent Of the
risk-weighted assets.
Major criticisms against Basel I are:
(a) the norms treated all borrowers alike
(b) no weight age was given to availability of security for a credit facility and
(c) It treated loans of varying maturity In the same manner.
BASEL-II
Basel-l is now widely viewed outdated and a more comprehensive set of
guidelines known as Basel-II are being implemented In several countries. Basel-
II attempts to Integrate Base(.l capital standards with national regulations by
Kalyan's www.OnlineIAS.com
Kalyan's www.OnlineIAS.com 102

www.OnlineIAS.com [email protected]
www.OnlineIAS.com
setting the minimum capital requirements of financial institutions with the goal
of ensuring liquidity.
It aims at securing International convergence on regulations governing the capital
adequacy ratio (CAR). Capital adequacy is a measure of bank’ capital and is,
expressed as a percentage of banks risk weighted assets. Objective of Basel-Il is
to develop a framework that would strengthen the soundness and stability of the
International banking system.
The Basel II accord consists of three pillars, viz., minimum capital
requirement, supervisory review and market discipline. The first pillar Is . on
capital requirement. where in, it identified three different types of risk: credit risk,
operational risk and market risk. Supervisory review process focuses on the
bank’s internal processes and Systems.
Market discipline focuses on market disclosures being made by the bank. The
other two Pillars have been added in Basel II as reinforcement to the ‘first pillar.
Supervisory review is to ensure that the banks Implementing Basel I accords have
proper processes In place for assessing their capital adequacy. The purpose of
pillar 3 (market discipline) is to encourage market discipline by developing a set
of disclosure requirements which will allow market participants to assess key
pieces of information on the scope of application, capital, risk exposures risk
assessment processes, and hence the capital adequacy of the Institution.
Capital Adequacy Ratio is defined as the proportion of a bank’s total assets
that is held in the form of shareholders’ equity and certain other defined classes
of capital. It a measure of the bank’s ability to meet the needs of its depositors
and other creditors. In short, CAR is a measure of bank’s capital and it is express
d as a percentage of a bank’s weighted credit exposures. It is also known as
capital-to-risk weighted assets ratio (CRAR).
The equation for calculating CAR is given as follows:
CAR =Tier-I Capital + Tier II Capital
Risk Weighted Assets
Capital Adequacy Ratio ensures that a bank is strong enough to absorb a
reasonable degree of losses. A CAR of 10. for example, would mean that if the
total loans and investments of a bank amount to Rs.100. it must maintain
Unencumbered and free capital of Rs.10
Kalyan's www.OnlineIAS.com
Kalyan's www.OnlineIAS.com 103

www.OnlineIAS.com [email protected]
www.OnlineIAS.com
BASEL- III
In the backdrop of the global financial meltdown, the Basel Committee on
Banking Supervision has decided.. ( Introduce Basel-Ill norms to strengthen
existing capital requirements and introduce a global liquidity standard to enable
banks to weather financial storms. Basel-III mandates banks to increase the loss-
absorbing capital from 2 per cent to 4.5 per cent of risk-weighted assets by
January, 2015. In addition, banks will be required to hold a capital conservation
buffer of 2.5 percent to withstand future periods of stress, bringing the total loss-
absorbing capital to 7 percent
Capital conservation buffer of 2.5 per cent is to be maintained by March 2018
consisting of common equity to protect the banking sector from periods of excess
aggregate credit growth. These capital requirements are to be supplemented with
a non risk based leverage ratio that will serve to back stop the risk based majors
and higher capital norms. Basel-III will thus triple the quantum of capital. which
banks will be required to maintain. Indian banks would need Rs. 3.9 to 5 lakh
crone capital over the next five years to meet BASEL III norms.
Basel- III represents an effort to fix the yaps and lacunae in Basel II that
came to light during the financial meltdown. While Basel ill does not jettison
Basel-II: it actually builds on the essence of Basel II - the link between the risk
profiles and capital requirements of individual banks.
The enhancements of Basel III over Basel II come primarily in four areas:
(i) augmentation in the level and quality of capital;
(ii) Introduction of liquidity standards;
(iii)modifications in provisioning norms; and better and more comprehensive
disclosures.
The minimum total capital remains unchanged at 8percent of risk weighted Assets
Howe. Basel-III introduces a capital conservation buffer of 2.5 per cent of RWA
and above the minimum capital requirement raising total capital need to 10.5 Per
cent as against 8.0 per cent under Basel II. This is to ensure banks absorb losses
And not breach minimum capital need.
Revised Guidelines on Priority Sector Loans:
Kalyan's www.OnlineIAS.com
Kalyan's www.OnlineIAS.com 104

www.OnlineIAS.com [email protected]
www.OnlineIAS.com
The revised guidelines are based on the MV Nair Committee recommendations
to recast priority sector lending. RBI has retained the overall target under priority
sector at 40 per cent as suggested by the Nr Committee and the targets under both
direct and indirect tending in agriculture at 13.5 per cent and 4.5 per cent
respectively while refocusing the direct agricultural lending to individuals self-
help groups and joint liability groups directly by banks.
Most foreign banks operating in India with less than 20 branches will
continue to lend 32 per cent of their credit to the priority sector instead of 40 per
cent for larger banks and will also not be asked to adhere to further sub-
classification. For other banks RBI has brought In educational loans up to Rs. 10
lakh and housing loans up to Rs. 25 lakh in big cities under priority sector lending.
This can reduce the rate of Interest on these loans making life easier for a
lot of people. In addition, it has allowed individuals to take overdrafts of up to
Rs.50,000 from their no-frills account. The, changes aim to make banks more
competitive against the non-banking finance companies and housing finance
companies.
In addition more activities including loans to micro units and to food and
agro processing Units will also figure in the lending to the priority sector.
Bank loans to primary agricultural credit societies, farmers’ service
societies and large adivasi multi-purpose cooperative societies ceded to or
managed /controlled by banks for on lending 10 farmers for agricultural and allied
activities are included under direct agriculture as part of the new norms.
The guidelines have a big plus for foreign banks with less than twenty
branches. For others, Caps on indirect advances, low thresholds and -interest rate
caps will continue to pose Challenges. The following provisions In the guidelines
will further financial Inclusion:
(i) Loans to micro and small service enterprises UP to Rs.1 acre and all loans to
micro and small manufacturing enterprises.
(ii) Loans up to Ps. 25 Lakh for housing In metros of population above 10 lakh
and 15 lakh at other centers.
(iii) Overdrafts up to Rs. 50.000 In no-frills account.
(iv) Loan to distressed farmers indebted to non-Institutional lenders.
(v) Loans to state-sponsored organisations for scheduled castes and tribes.
Kalyan's www.OnlineIAS.com
Kalyan's www.OnlineIAS.com 105

www.OnlineIAS.com [email protected]
www.OnlineIAS.com
Initiatives to Increase Efficiency in PSBs
Government has been entering into Memorandum of Understandings (MOUS)
with the PSBs whereby capital Infusion will be linked to achieving the targets by
PSBs or various key parameters on productivity, including Return on Assets, Net
Profit Per employee and Cost to income Ratio. MOUs spanning over a period of
four years, 2011- 12 to 2014-15, have since been finalised with all the PSBs
excluding SBI Associate Banks. SBI will be entering into MOU with its Associate
Banks on similar parameters. Government has put in place a mechanism of
Statement of Intent on Annual Goals (SOI) to monitor the performance of the
PSBs on various performance parameters.
Financial Inclusion
The objective of Financial Inclusion i to extend financial services to the large
hitherto unserved population of the country to unlock its growth potential. In
addition, it strives towards a more inclusive growth by making financing
available to the poor in particular Government of India has been actively pursuing
the agenda of Financial Inclusion, with key interventions in four groups, viz,
expanding banking infrastructure, offering appropriate financial products,
making extensive and intensive use of technology and through advocacy and
stakeholder participation.
Detailed Strategy and Guidelines on Financial Inclusion, were issued by
the Government to banks in October 2011 which inter-alia provide emphasis on:
(i) setting up more brick and mortar branches with the objective to have a bank
branch within a radial distance of 5 km; (ii) to open bank branches by Sept. 2012
in all habitations of 100 or more population in under banks districts and 10.000
or more population in other
Districts; (iii) to provide a Business Correspondent within a radial distance of 2
km; (iv) to
Villages of 1,000 and more population In 10 smaller States/UTs by September
2012(v) to consider Gram Panchayati as a unit for allocation of area under Service
Area approach to bank branch and BC etc.
Banks have also been advised to transfer subsidies through Electronic
Benefit Transfer (EBT) under 32 schemes, which are in operation and, funded by
the governrnent of India, so that benefit gets credited directly to the account of
the beneficiaries.
Kalyan's www.OnlineIAS.com
Kalyan's www.OnlineIAS.com 106

www.OnlineIAS.com [email protected]
www.OnlineIAS.com
A flagship programme to achieve financial inclusion has been the
‘Swabhiman Scheme launched In ‘early 2011 under which banks have to reach
the beneficiary rather than the beneficiary travelling to the bank. Under the
Swabhiman financial inclusion campaign. over 74.000 habitations with.
population in excess of 2.000 had been provided banking facilities by March,
2012 using various models and technologies including branchless banking
through business correspondents. Sivabhiman would be extended to habitations
with population more than 1.000 In the north-eastern and hilly states and
population more than 1,600 In the plains areas as per census200l.
The RBI’s guidelines for new bank licenses have also been issued to further
the cause of financial inclusion. These guidelines stipulate that corporate and
public sector entities with sound credentials and a minimum track record of 10
years can enter the banking business. Promoters cannot directly set up a bank
‘and win have to first float 100 per cent holding company which will hold the
bank. At least 25 per cent branches must be in rural unbanked areas.
Before granting licenses, the RBI would also seek feedback bout applicants
from other regulators, enforcement and investigative agencies such as the IT
department, CBI and the Enforcement Directorate. Those seeking to set up a bank
would have to submit applications by July 1st 2013. The last time new banks were
allowed was In 2002-03 when two Licenses were issued. Only 35 per cent of
India’s adult Population has accounts with banks and other financial institutions
against global average of 50 per cent.
A Committee headed by Nachiket Mor was set up in 2013 to recommend
measures for furthering financial Inclusion. The Committee submitted its report
in early January 2014.
Non-Banking Financial Companies
Non-Banking Financial Companies (NBFCS) broadly fall into three categories.
viz.’
(i) NBFCs accepting deposits from the public;
(ii) NBFCS not accepting/holding public deposits: and
(iii) Core investment companies (i.e., those acquiring shares / securities of their
Group/ holding/ subsidiary companies to the extent of not less .than 90 Per cent
of total assets and which do not accept public deposit).
Kalyan's www.OnlineIAS.com
Kalyan's www.OnlineIAS.com 107

www.OnlineIAS.com [email protected]
www.OnlineIAS.com
Until some years back, the prudential norms applicable to banking and non-
banking financial companies were not uniform. Moreover, within the NBFC
group, the prudential norms applicable to deposit taking NBFCs (NBFCs-ND)
were more stringent than those for non-deposit taking NBFCs (NBFCs-ND).
Since the NBFCs-ND were not subjected .to any exposure norms, they could take
large exposures. The absence of capital adequacy requirements resulted in high
leverage. by the NBFCs. Therefore, since 2000, the Reserve Bank has initiated
measures to reduce the scope of “regulatory arbitrage” between banks, N8fCsD
and NBFCs- ND.
Borrowings by NBFCs are mainly from banks and financial institutions
and by way of bonds and debentures and other sources (which include
miscellaneous sources Including money borrowed . from other companies,
unsecured loans from directors/promoters, commercial paper, borrowings from
mutual Funds and any other type of funds which are not treated as public
deposits). Financial performance at NBFCs has improved in recent years due to
increases in fund-based arid fee-based incomes. Gross Non Performing Assets
(NPAs) as well as net NPAs (as percentage of gross advances and net advances,
respectively) of reporting NBFCs also declined in recent years. .
Capital to risk-weighted assets ratio (CRAR) norms have been made
applicable
in terms of which, every deposit taking NBFC is required to maintain a minimum
capital, consisting of Tier-I and Tier-II capital, of not less than 12 per cent (15
per cent in the case of unrated deposit-taking loan/investment companies) of its
aggregate risk-weighted assets and of risk-adjusted value of off-balance sheet
items. It is noteworthy that the NBFC sector is witnessing a consolidation process
in the last few years, wherein the weaker NBFCs are gradually exiting, paving
the way for a stronger NBFC sector.
With a view to protecting the interests of depositors, regulatory attention
was mostly focused on NBFCs accepting public deposits (NBFCs) until recently.
Over the last few years however this regulatory tram work has undergone a
significant change. with increasingly more attention now being paid to non-
deposit taking NBFCs (NBFCs-ND) as well This change was necessitated mainly
on account of a significant Increase in both the number and balance sheet size of
NBFCs-ND segment Which gave rise to systemic concerns. To address this issue.
NBFCS-ND with asset size of Rs. 100 crore and above were classified as
systemically important NBFCS (NBFCS-NDSI) and were subjected to ” Limited
Kalyan's www.OnlineIAS.com
Kalyan's www.OnlineIAS.com 108

www.OnlineIAS.com [email protected]
www.OnlineIAS.com
regulations”. The NBFCs-ND are now subject to CRAR and exposure norms
prescribed by the Reserve Bank. The CRAR prescription for such companies has
been raised to 15 per cent.
Taking into consideration the need for enhanced funds for increasing
business and meeting regulatory requirements, NBFCs-NDSI were permitted to
augment their capital funds by issue of Perpetual: Debt Instruments (PDI). PDIs
could be issued in Indian rupees only and the aggregate amount to be raised by
issue of such instruments has to be within the overall limits of Tier 1 and Tier II
capital. Further as a temporary measure, NBFCs- NDSI have been permitted to
raise short-term foreign currency borrowings under the approval route, subject to
certain conditions like eligibility of borrowers and lenders, end-use of funds,
maturity, etc. The maximum amount should not exceed 50 per cent of the net-
owned funds or US$ 10 million (or its equivalent). Whichever is higher. .
The regulatory and supervisory framework of NBFCs continued to focus
on prudential regulation with specific attention to the systemically important non-
deposit taking companies called NBFC-NDSI.
RBI lightens Norms for Gold Loan Firms.
The Reserve Bank of India has tightened rules for lending against gold as
the accelerated growth in such loans in the past few years has led to an increase
in risks to the system.
Gold loan companies will have to maintain core capital. tier-1 capital of
12%. Currently, non-banking finance companies (NBFCs) have to maintain
capital adequacy of 15%. Also1 the companies cannot lend more than 75 percent
of the value of gold.
The RBI has mandated that non-banking finance companies, which have
more than 50% of their financial assets coming from loans against gold, should
maintain tier-I capital at 12%.
Non-banking finance companies will also ha to discloses the Percentage of
gold loans to total loans in their balance sheets. Further, gold loan companies will
not be allowed to lend against primary gold and gold coins.
The RBI has expressed concern over the risks involved in lending against
gold due to the nature of the business. model and the exposure to adverse
movement of gold prices given the growth in business and dependence on public
funds.
Kalyan's www.OnlineIAS.com
Kalyan's www.OnlineIAS.com 109

www.OnlineIAS.com [email protected]
www.OnlineIAS.com
Infrastructure Debt Funds (IDFs)
Broad guidelines have been issued vide a press release dated 23 September
2011for setting up of IDFs to facilitate flow of funds Into infrastructure projects.
The IDF will be set up either as a trust or as a company. A trust-based IDF would
normally be a mutual fund (MP), while company-based IDF would normally be
an NBFC. An IDF-NBFC would raise resources through Issue of either rupee or
dollar-denominated bonds of minimum five-year maturity. The investors would
be primarily domestic and off-shore institutional Investors, especially insurance
and pension funds which would have long-term resources. An IOF-MF would be
regulated by the Securities and Exchange Board of India (SEBI) while an 1DF-
NBFC would be regulated by the RBI. Detailed guidelines were issued on 21st
November. 2011 prescribing the regulatory framework for NBFCS to sponsor
1DFs which are to be set up as Mutual Funds (MFs) and NBFCs. Such entities
would be designated infrastructure Debt Fund Mutual Funds (IDF-MF) and
infrastructure Debit Fund - Non Banking Financial Company (IDF-NBFC). All
NBFCs, including Infrastructure Finance Companies (IFCs) registered with the
rank may sponsor IDFs to be set up as MFs. However, only IFCs can sponsor
IDF-NBFCs. Eligibility parameters for NBFCs as sponsors of IDF-MFs include
a minimum NOF of Rs. 300 crore, CRAR 0115 per cent, net NPAs less than 3
per cent; the NBFC to
have been in existence for at least five years and earning profits for the last three
years in addition to those prescribed by SEBI.
Only NBFC-IFCs can sponsor IDF-NBFCs with prior approval of the RBI and
subject to the following, conditions; the sponsor IFC would be allow to contribute
a maximum of 40 per cent to the equity of the IDF-NBFC with a minimum equity
holding of 30 per cent of the equity f IDF-NBFC, post investment, in the IDF-
NBFC: the sponsor NBFC-IFC must maintain minimum CRAR and NOF
prescribed for IFCs: there are no supervisory concerns with respect to the IFC.
The TOF is granted relaxation in credit concentration norms and in risk weights.
Industrial Policy
Introduction
Kalyan's www.OnlineIAS.com
Kalyan's www.OnlineIAS.com 110

www.OnlineIAS.com [email protected]
www.OnlineIAS.com
At the time of independence, India had an extremely underdeveloped and
unbalanced industrial structure. Industries contributed less than one sixth part of
national income. The country did have some industries like cotton textiles, jute
and sugar, but there were virtually no basic, heavy and capital goods industries
on which programmes of future industrialisation could be based. Whatever major
industries were there, they were largely concentrated in a few areas such as
Bombay. Surat, Ahmedabad. Jameshedpur, Calcutta, Delhi etc. while the rest of
the country remained industrially neglected. Thus after independence, the
government of India had to undertake effective measures to increase the tempo
of industrialization to correct regional imbalances in industrial development and
rectify the distorted industrial structure through rapid development of capital
goods industries.
Meaning:
Industrial policy is a statement which defines the role of government in industrial
development the place of the public and private sectors in industrialisation of the
country. The relative role of large and small industries. The role of foreign capital
etc. In brief, it is a statement of objectives to be achieved in the area of industrial
development and the measures to be adopted towards achieving these objectives.
The industrial policy thus formally indicates the spheres of activity of the public
and the private sectors. It lays down rules and procedures that would govern the
growth and pattern of industrial activity. The industrial policy is neither fixed nor
inflexible. It is amended, modified and redrafted according to the changed
situations, requirements and perspectives of developments.
Objectives: The major objectives of industrial policy are:
(i) Rapid Industrial Development:
The industrial policy of the Government of India is aimed at increasing the tempo
of industrial development. It seeks to create a favourable investment climate for
the private sector as well as mobilise resources for the investment in public sector.
In its way the government seeks to promote rapid industrial development in the
country.
(ii) Balanced industrial Structure:
Kalyan's www.OnlineIAS.com
Kalyan's www.OnlineIAS.com 111
www.OnlineIAS.com [email protected]
www.OnlineIAS.com
The industrial policy is designed to correct the prevailing lopsided industrial
structure. Thus, for example, before independence, India had some fairly
developed consumer goods industries. But the capital goods sector was not
developed at all and basic and heavy industries were by and large absent. So the
industrial policy had to be framed in such a manner that these imbalances in the
industrial structure are corrected. Thus by laying emphasis on heavy industries
and development of capital goods sector, industrial policy seeks to bring a balance
in industrial structure.
(iii) Prevention of Concentration of Economic Power:
The industrial policy seeks to provide a framework of rules, regulations and
reservation of spheres of activity for the public and the private sectors. This is
aimed at reducing the monopolistic tendencies and preventing concentration of
economic power in the hands of a few big industrial houses.
(iv) Balanced Regional Growth:
Industrial policy also aims at correcting regional imbalances in industrial
development. It is quite well-known that some regions in the country are
industrially quite advanced e.g., Maharashtra and Gujarat while others are
industrially backward, like Bihar, Orissa. It is the task of industrial policy to work
out programmes and policies which lead to industrial development or industrial
growth.
The Industrial policy of 1948, which was the first industrial policy statement of
the Government of India, was changed in 1956 in a public sector dominated
industrial development policy that remained in force till 1991 with some minor
modifications and amendments in 1977 and 1980. In 1991, far reaching changes
were made in the 1956 industrial policy. The new Industrial Policy of July 1991
heralded the framework for industrial development at present.
Industrial Policy Resolution (IPR)-1948
After gaining independence on August 15, 1947 it was necessary to give new
policy for industrial development, decide priority areas and clear doubts in the
minds of private entrepreneurs regarding nationalization of existing industries.
The Government of India announced its Industrial Policy Resolution (IPR) on
April 6, 1948 whereby both public and private sectors were involved towards
industrial development. Accordingly, the industries were divided into four broad
categories:
Kalyan's www.OnlineIAS.com
Kalyan's www.OnlineIAS.com 112

www.OnlineIAS.com [email protected]
www.OnlineIAS.com
(a) Exclusive State Monopoly-This includes the manufacture of arms and
ammunition, production and control of atomic energy and the ownership and
management of railway transport. These industries were the exclusive monopoly
of the Central Government.
(b) State Monopoly for New Units-This category included coal, iron and steel,
aircraft manufacture, ship building, manufacture of telephone, telegraphs and
wireless (apparatus (excluding radio receiving sets) and mineral oils. New
undertakings in this category could henceforth be undertaken only by the State.
(c) State Regulation-This category included industries of such basic importance
like machine tools, chemicals, fertilizers, non-ferrous metals, rubber
manufactures, cement, paper, newsprint, automobiles, electric engineering etc.
which the Central Government would feel necessary to plan and regulate.
(d) Unregulated private enterprise-the industries in this category were left open
to the private sector, individual as well as cooperative.
Industrial Policy Resolution of 1956 (IPR 1956)
It is the resolution adopted by the Indian Parliament in April 1956. It was first
comprehensive statement on industrial development of India. It laid down three
categories of industries which were clearly defined. The 1956 policy continued
to constitute the basic economic policy for a long time. This fact has been
confirmed in all the Five-Year Plans of India. According to this Resolution the
objective of the social and economic policy in India was the establishment of a
socialistic pattern of society. It provided more powers to the governmental
machinery. It laid down three categories of industries which were more sharply
defined. These categories were:
(a) Schedule A-those industries which were to be an exclusive responsibility of
the state.
(b) Schedule B-those which were to be progressively state-owned and in which
the state would generally set up new enterprises, but in which private enterprise
would be expected only to supplement the effort of the state; and
(c) Schedule C-all the remaining industries and their future development would,
in general be left to the initiative and enterprise of the private sector.
Although there was a category of industries left to the Private sector (Schedule C
above) the sector was kept under a state control through a system of licenses. In
Kalyan's www.OnlineIAS.com
Kalyan's www.OnlineIAS.com 113

www.OnlineIAS.com [email protected]
www.OnlineIAS.com
order to open new industry or to expand production, obtaining a license from
government was prerequisite. Opening new industries in economically backward
areas was incentivized through easy licensing and subsidization of critical inputs
like electricity and water. This was done to counter regional disparities that
existed in the country. Even the license to increase the production was issued only
if the government was convinced that the economy required more of the goods.
Fair and non-discriminatory treatment for the private sector, encouragement to
village and small- scale enterprises, removing regional disparities, and the need
for the provision of amenities for labour, and attitude to foreign capital were other
salient features of the IPR 1956.
The Industrial Policy of year 1956 is known as ECONOMIC CONSTITUTION
of the country
Industrial Policy-1991
A major shift in the industrial policy was made by the Congress (I) Government
led by Mr. P.V. Narasimha Rao on July 24, 1991.
The main aim of this policy was to unshackle the country's industrial economy
from the cobwebs of unnecessary bureaucratic control, introduce liberalisation
with a view to integrate the Indian economy with the world economy, to remove
restrictions on direct foreign investment and also to free the domestic entrepre-
neur from the restrictions of MRTP Act. Besides, the policy aims to shed the load
of the public enterprises which have shown a very low rate of return or are
incurring losses over the years. The salient features of this policy are as follows:
1. Except some specified industries (security and strategic concerns, social
reasons, environmental issues, hazardous projects and articles of elitist
consumption) industrial licensing would be abolished.
2. Foreign investment would be encouraged in high priority areas up to a limit of
51 per cent equity.
3. Government will encourage foreign trading companies to assist Indian
exporters in export activities.
4. With a view to injecting the desired level of technological dynamism in Indian
industry, the government will provide automatic approval for technology
agreements related to high priority industries.
Kalyan's www.OnlineIAS.com
Kalyan's www.OnlineIAS.com 114
www.OnlineIAS.com [email protected]
www.OnlineIAS.com
5. Relaxation of MRTP Act (Monopolies and Restrictive Practices Act) which
has almost been rendered non-functional.
6. Dilution of foreign exchange regulation act (FERA) making rupee fully
convertible on trade account.
7. Disinvestment of Public Sector Units' shares.
8. Closing of such public sector units which are incurring heavy losses.
9. Abolition of C.C.I, and wealth tax on shares.
10. General reduction in customs duties.
11. Provide strength to those public sector enterprises which fall in reserved areas
of operation or in high priority areas.
12. Constitution of special boards to negotiate with foreign firms for large
investments in the development of industries and import of technology-
Critique of the New Industrial Policy
The keynote of the new industrial policy includes liberalization and globalization
of the economy. Liberalization means deregularisation of the industrial sector by
cutting down to the minimum administrative interference in its operation so as to
allow free competition between market forces. Similarly globalization means
making the Indian economy an integral part of the world economy by breaking
down to the maximum feasible the barriers to movement of goods, services,
capital and technology between India and the rest of the world.
The new Industrial Policy fulfils a long-felt demand of the industry to remove
licensing for all industries except 18 industries (coal, petroleum, sugar, motor
cars, cigarettes, hazardous chemicals, pharmaceuticals and luxury items).
It proposes to remove the limit of assets fixed for MRTP Companies and
dominant undertakings. Hence business houses intending to float new companies
or undertake expansion will not be required to seek clearance from the MRTP
Commission. This step will enable MRTP Companies to establish new
undertakings, and effect plans of expansions, mergers, amalgamations and
takeovers without prior government approval. They shall have the right to ap-
pointment of directors.
The new Industrial Policy goes all out to woo foreign capital. It provides 51%
foreign equity in high priority industries and may raise the limit to 100% in case
the entire output is exported.
Kalyan's www.OnlineIAS.com
Kalyan's www.OnlineIAS.com 115

www.OnlineIAS.com [email protected]
www.OnlineIAS.com
This runs counter to the Nehruvian Model. Experts fear that this over-enthusiasm
to welcome foreign capital and to give free hand to multinationals will be
detrimental for indigenous industries more so house-hold and small scale
industries. This may lead to economic and political crisis in future. It is also
alleged that the Policy has been framed at the instance of the IMF and is going to
protect the interests of developed Western countries at the cost of national
interests. Critics also argue that once foreign capital is permitted free entry the
distinction between high and low priority industries will disappear and all lines
of production will have to be opened to facilitate foreign investment. This may
create Brazil or Mexico like economic crisis.
By opening the gates of the Indian economy wide to the multinationals, the self-
reliance aspect has been completely ignored. These multinationals with slightest
of inconvenience may shift their operations elsewhere leaving the economy in the
lurch.
Since multinational and private entrepreneurs would prefer most favourable
locations for their industries it would further intensify spatial disparity in
economic development. This fact has been well collaborated by the letters of
intent so far approved.
While selling out public sector shares and companies to private investors the
Government is not only ignoring the interests of the employees but is transferring
the assets at throw away prices. These public sector companies could have been
handed over to the working class or autonomous organisations to manage their
affairs independently.
In the absence of MRTP safeguard private companies may develop monopolistic
outlook and may indulge in unfair trade practices.
There is also a risk of growing consumerism rather than strengthening the sinews
of the economy. Foreign investors may prefer to invest in low priority consumer
sector instead of going for high priority sector.
With the state yielding to the private enterprise the social objectives of equity
with growth and protecting the interests of the down trodden and semi-skilled
labourers would be thrown to the winds. This will be against the cherished goals
of our Constitution and may create socio-economic disparity and tension.
Industrial Financial Institutions:
Kalyan's www.OnlineIAS.com
Kalyan's www.OnlineIAS.com 116
www.OnlineIAS.com [email protected]
www.OnlineIAS.com
Industrial Financial Institutions provide medium and long- term finance to
industries. These are given below:
EXIM BANK
Export-Import Bank of India is the premier export finance institution in
India, established in 1982 under the Export-Import Bank of India Act 1981. Since
its inception, Exim Bank of India has been both a catalyst and a key player in the
promotion of cross border trade and investment. Commencing operations as a
purveyor of export credit, like other Export Credit Agencies in the world, Exim
Bank of India has, over the period, evolved into an institution that plays a major
role in partnering Indian industries, particularly the Small and Medium
Enterprises, in their globalisation efforts, through a wide range of products and
services offered at all stages of the business cycle, starting from import
of technology and export product development to export production, export
marketing, pre-shipment and post-shipment and overseas investment.
Organization
Exim Bank is managed by a Board of Directors, which has representatives from
the Government, Reserve Bank of India, Export Credit Guarantee Corporation of
India, a financial institution, public sector banks, and the business community.
The Bank's functions are segmented into several operating groups including:
Corporate Banking Group which handles a variety of financing programmes
for Export Oriented Units (EOUs), Importers, and overseas investment by
Indian companies.
Project Finance / Trade Finance Group handles the entire range of export
credit services such as supplier's credit, pre-shipment Agriculture Business
Group, to spearhead the initiative to promote and support Agricultural
exports. The Group handles projects and export transactions in the agricultural
sector for financing.
Small and Medium Enterprise: The group handles credit proposals from
SMEs under various lending programmes of the Bank.
Export Services Group offers variety of advisory and value-added information
services aimed at investment promotion.
Export Marketing Services Bank offers assistance to Indian companies, to
enable them establish their products in overseas markets. The idea behind this
service is to promote Indian export. Export Marketing Services covers wide
range of export oriented companies and organizations. EMS group also covers
Project exports and Export of Services.
Besides these, the Support Services groups, which include: Research &
Planning, Treasury and Accounts, Loan Administration, Internal Audit,
Kalyan's www.OnlineIAS.com
Kalyan's www.OnlineIAS.com 117

www.OnlineIAS.com [email protected]
www.OnlineIAS.com
Management Information Services, Information Technology, Legal, Human
Resources Management and Corporate Communications.
Small Industries Development Bank of India (SIDBI) SIDBI purpose is to provide refinance facilities and short term lending to
industries.
Headquarters is in Lucknow.
Chairman and Managing Director is Dr. Kshatrapati Shivaji
It is an independent financial institution aimed to aid the growth and
development of micro, small and medium-scale enterprises (MSME)
in India. Set up on April 2, 1990 through an act of parliament, it was
incorporated initially as a wholly owned subsidiary of Industrial
Development Bank of India.
Currently the ownership is held by 33 Government of India owned /
controlled institutions. Beginning as a refinancing agency to banks and
state level financial institutions for their credit to small industries.
It has expanded its activities, including direct credit to the SME through
100 branches in all major industrial clusters in India. Besides, it has been
playing the development role in several ways such as support to micro-
finance institutions for capacity building and on lending. Recently it has
opened seven branches christened as Micro Finance branches, aimed
especially at dispensing loans up to ₹5 lakh.
It is the Principal Financial Institution for the Promotion, Financing and
Development of the Micro, Small and Medium Enterprise (MSME) sector
and for Co-ordination of the functions of the institutions engaged in similar
activities.
SIDBI has also floated several other entities for related activities.
Credit Guarantee Fund Trust for Micro and Small
Enterprises provides guarantees to banks for collateral-free loans
extended to SME.
SIDBI Venture Capital Ltd. is a venture capital company focussed at
SME.
SME Rating Agency of India Ltd. (SMERA -) provides composite ratings
to SME.
ISARC - India SME Asset Reconstruction Company in 2009, as
specialized entities for NPA resolution for SME.
History
Kalyan's www.OnlineIAS.com
Kalyan's www.OnlineIAS.com 118

www.OnlineIAS.com [email protected]
www.OnlineIAS.com
The Charter establishing it, The Small Industries Development Bank of India Act,
1989 envisaged SIDBI to be "the principal financial institution for the promotion,
financing and development of industry in the small scale sector and to co-ordinate
the functions of the institutions engaged in the promotion and financing or
developing industry in the small scale sector and for matters connected therewith
or incidental thereto.
Achievements
SIDBI retained its position in the top 30 Development Banks of the World in the
latest ranking of The Banker, London. As per the May 2001 issue of The Banker,
London, SIDBI ranked 25th both in terms of Capital and Assets.
Business Domain of SIDBI
The business domain of SIDBI consists of Micro, Small and Medium Enterprises
(MSMEs), which contribute significantly to the national economy in terms of
production, employment and exports. MSME sector is an important pillar of
Indian economy as it contributes greatly to the growth of Indian economy with a
vast network of around 3 crore units, creating employment of about 7 crore,
manufacturing more than 6,000 products, contributing about 45% to
manufacturing output and about 40% of exports, directly and indirectly. In
addition, SIDBI's assistance also flows to the service sector including transport,
health care, tourism sectors etc.
In its endeavour towards holistic development of the MSME sector, SIDBI adopts
a ‘Credit Plus’ approach wherein, besides credit, the Bank also provides grant
support for the Promotion and Development (P&D) of the sector to make it
strong, vibrant and competitive. The P&D activities of the bank include Micro
Enterprise Promotion, Entrepreneurship Development, Cluster Development,
Capacity Building of the MSME Sector, promoting Responsible Finance among
Micro Finance Institutions, Sustainable Finance to MSMEs including Energy
Efficiency, Environment Protection, etc.
Cumulative disbursements as at end March 2014 have crossed ` 3260 trillion (€
40.75 trillion) benefiting more than 32 million persons in the MSME sector. The
total outstanding portfolio as at end March 2014 aggregated ` 612.71 billion
(€7.66 billion).
Kalyan's www.OnlineIAS.com
Kalyan's www.OnlineIAS.com 119

www.OnlineIAS.com [email protected]
www.OnlineIAS.com
SIDBI also functions as a Nodal/ Implementing Agency to various ministries of
Government of India viz., Ministry of MSME, Ministry of Textiles, Ministry of
Commerce and Industry, Ministry of Food Processing and Industry, etc.
Industrial Development Bank of India
The IDBI was established to provide credit for major financial facilities to assist
with the industrial development of India. It was established in 1964 by RBI, and
was transferred to the government of India in 1976. IDBI finances new projects/
expansions/ diversification/ modernizations of projects. It provides refinance
facility to the primary lending institutions i.e. SFC/SIDC/Commercial Banks etc.
The government holdings in IDBI, after the IPO, is 51.4%. By the end of
September 2004, the IDBI asset base was Rs. 36850 crore.
Functions
Direct assistance: helps the industrial sector by granting project loans,
underwriting of and direct subscription to the industrial securities (shares and
debentures), soft loans, and technical development funds.
Coordinating functions: coordinates the functions of financial institutions
such as ICICI, IFCI, LIC and GIC, with respect to industrial development.
Indirect assistance to small and medium enterprises by granting loans. It also
refinances industrial loans of the SFC's, SIDCs, commercial banks and RRBs,
along with the billing related to the sale of the indigenous machinery.
Raising funds from the international money markets.
Diversification of Activities of IDBI
Since 1990, IDBI has set up number of institutes, including:
Small Industries Development Bank of India SIDBI)in 1990.[5]
IDBI Investment Management Company (IIMCO)in 1994.[6]
IDBI Capital Market Services Ltd. (ICMS)[7] in 1995.
IDBI bank Ltd.
State Industrial Development Corporations
In 1960, the first State Industrial Development Corporations (SIDC) was
established in Bihar. These mainly autonomous bodies are controlled by the State
Kalyan's www.OnlineIAS.com
Kalyan's www.OnlineIAS.com 120
www.OnlineIAS.com [email protected]
www.OnlineIAS.com
government, who may own a stake in the corporation. There are approximately
29 SIDCs in India.
Their main functions include the promotion of rapid industrialization in India.
They mainly work at the grass roots level, providing development in the
backward and less frequented parts of India. They offer financial leases and offer
guarantees. They also administer the schemes of the central and state
governments. The projects and surveys of the industrial potential ares are
conducted by them, as well as the evaluation of SEZs.
Mutual Funds
The first Mutual funds in India were created in 1964 by the UTI or The Unit Trust
of India. In 1987, the leading public sector banks of the country, such as SBI and
Canara Bank, set up their mutual funds. It became popular after the 1991
liberalization of the Indian Economy.
Industrial Finance Corporation of India
The Industrial Finance Corporation of India (IFCI) was established on July 1,
1948, as the first Development Financial Institution in the country to cater to the
long-term finance needs of the industrial sector. The newly-established DFI was
provided access to low-cost funds through the central bank's Statutory Liquidity
Ratio or SLR which in turn enabled it to provide loans and advances to corporate
borrowers at concessional rates.
IFCI has fulfilled its original mandate as a DFI by providing long-term financial
support to all segments of Indian Industry. It has also been chiefly instrumental
in translating the Government's development priorities into reality. Until the
establishment of ICICI in 1956 and IDBI in 1964, IFCI remained solely
responsible for implementation of the government's industrial policy initiatives.
Its contribution to the modernization of Indian industry, export promotion, import
substitution, entrepreneurship development, pollution control, energy
conservation and generation of both direct and indirect employment is
noteworthy.
ICICI Bank
Kalyan's www.OnlineIAS.com
Kalyan's www.OnlineIAS.com 121

www.OnlineIAS.com [email protected]
www.OnlineIAS.com
ICICI Bank was originally promoted in 1994 by ICICI Limited, an Indian
financial institution, and was its wholly-owned subsidiary.
ICICI Bank is India's second-largest bank. ICICI Bank offers a wide range of
banking products and financial services to corporate and retail customers through
a variety of delivery channels and through its specialised subsidiaries and
affiliates in the areas of investment banking, life and non-life insurance, venture
capital, asset management and information technology.
Foreign Direct Investment (FDI)
A foreign direct investment (FDI) is a controlling ownership in a business
enterprise in one country by an entity based in another country.
Foreign direct investment is distinguished from portfolio foreign investment, a
passive investment in the securities of another country such as
public stocks and bonds, by the element of "control". According to the Financial
Times, "Standard definitions of control use the internationally agreed 10 percent
threshold of voting shares, but this is a grey area as often a smaller block of shares
will give control in widely held companies. Moreover, control of technology,
management, even crucial inputs can confer de facto control."
The origin of the investment does not impact the definition as an FDI, i.e., the
investment may be made either "inorganically" by buying a company in the target
country or "organically" by expanding operations of an existing business in that
country.
Definitions
Broadly, foreign direct investment includes "mergers and acquisitions, building
new facilities, reinvesting profits earned from overseas operations and intra
company loans". In a narrow sense, foreign direct investment refers just to
building new facilities. The numerical FDI figures based on varied definitions are
not easily comparable. As a part of the national accounts of a country, and in
regard to the GDP equation Y=C+I+G+(X-M)[Consumption + gross Investment
+ Government spending +(exports - imports)], where I is domestic investment
plus foreign investment, FDI is defined as the net inflows of investment (inflow
minus outflow) to acquire a lasting management interest (10 percent or more of
voting stock) in an enterprise operating in an economy other than that of the
investor.[2] FDI is the sum of equity capital, other long-term capital, and short-
term capital as shown the balance of payments. FDI usually involves participation
Kalyan's www.OnlineIAS.com
Kalyan's www.OnlineIAS.com 122

www.OnlineIAS.com [email protected]
www.OnlineIAS.com
in management, joint-venture, transfer of technology and expertise. Stock of FDI
is the net (i.e., inward FDI minus outward FDI) cumulative FDI for any given
period. Direct investment excludes investment through purchase of shares. FDI
is one example of international factor movements . A foreign direct investment
(FDI) is a controlling ownership in a business enterprise in one country by an
entity based in another country. Foreign direct investment is distinguished from
portfolio foreign investment, a passive investment in the securities of another
country such as public stocks and bonds, by the element of "control". According
to the Financial Times, "Standard definitions of control use the internationally
agreed 10 percent threshold of voting shares, but this is a grey area as often a
smaller block of shares will give control in widely held companies. Moreover,
control of technology, management, even crucial inputs can confer de facto
control." yes that is fact.
Types of FDI’s
1. Horizontal FDI arises when a firm duplicates its home country-based
activities at the same value chain stage in a host country through FDI.
2. Platform FDI Foreign direct investment from a source country into a
destination country for the purpose of exporting to a third country.
3. Vertical FDI takes place when a firm through FDI moves upstream or
downstream in different value chains i.e., when firms perform value-
adding activities stage by stage in a vertical fashion in a host country.[6]
Methods
The foreign direct investor may acquire voting power of an enterprise in an
economy through any of the following methods:
by incorporating a wholly owned subsidiary or company anywhere
by acquiring shares in an associated enterprise
through a merger or an acquisition of an unrelated enterprise
participating in an equity joint venture with another investor or enterprise[7]
Forms of FDI incentives
Foreign direct investment incentives may take the following forms:
low corporate tax and individual income tax rates
tax holidays
other types of tax concessions
preferential tariffs
special economic zones
EPZ – Export Processing Zones
Bonded warehouses
Kalyan's www.OnlineIAS.com
Kalyan's www.OnlineIAS.com 123

www.OnlineIAS.com [email protected]
www.OnlineIAS.com
investment financial subsidies
free land or land subsidies
relocation & expatriation
infrastructure subsidies
R&D support
derogation from regulations (usually for very large projects)
Importance of FDI
An increase in FDI may be associated with improved economic growth due
to the influx of capital and increased tax revenues for the host country.
Host countries often try to channel FDI investment into new infrastructure
and other projects to boost development.
Greater competition from new companies can lead to productivity gains
and greater efficiency in the host country and it has been suggested that the
application of a foreign entity’s policies to a domestic subsidiary may and India
improve corporate governance standards.
Furthermore, foreign investment can result in the transfer of soft skills
through training and job creation, the availability of more advanced technology
for the domestic market and access to research and development resources.
The local population may benefit from the employment opportunities
created by new businesses.
FDI’s in China
FDI in China, also known as RFDI (renminbi foreign direct investment),
has increased considerably in the last decade, reaching $59.1 billion in the
first six months of 2012, making China the largest recipient of foreign
direct investment and topping the United States which had $57.4 billion of
FDI. In 2013 the FDI flow into China was $64.1 billion, resulting in a
34.7% market share of FDI into the Asia-Pacific region. By contrast, FDI
out of China in 2013 was $18.97 billion, 10.7% of the Asia-Pacific share.
During the global financial crisis FDI fell by over one-third in 2009 but
rebounded in 2010.
Foreign investment was introduced in 1991 under Foreign Exchange
Management Act (FEMA), driven by then finance minister Manmohan
Singh. As Singh subsequently became the prime minister, this has been one
of his top political problems, even in the current times. India disallowed
overseas corporate bodies (OCB) to invest in India. India imposes cap on
equity holding by foreign investors in various sectors, current FDI
in aviation and insurance sectors is limited to a maximum of 49%.
Kalyan's www.OnlineIAS.com
Kalyan's www.OnlineIAS.com 124
www.OnlineIAS.com [email protected]
www.OnlineIAS.com
PUBLIC FINANCE AND
GOVERNMENT BUDGETING
Public Finance is a study of revenue and expenditure profile of the government.
It is also known as government budgeting or fiscal policy of the Government.
Fiscal Policy, also called Budgetary policy, comprises of governments revenue,
expenditure and borrowing Policy winch Is prepared on an annual bases through
the Union Budget. Major objectives of fiscal policy in India are broadly as
follows:-
(i) To promote and to ac1erate the growth of productive Investments In the
economy, both in the public as well as private sector.
(ii) To mobilise the maximum volume of real and financial resources for the
investment Plan of the public sector, keeping In view the expanding demand for
real and financial resources of the private sector, and n this way, to promote the
growth of marginal and average rate of savings In the economy.
(iii) To promote the maintenance of a reasonable measure of economic stability
in keeping with the optimum rate of growth of the economy. This complies
maintaining price stability also.
(iv) To redistribute the growing national output to lesser; income inequalities
Fiscal policy along with Monetary policy are the two strongest pillars of a
Country’s economic policy.
The Annual Budget at the Central Government (as also the budgets of the State
Governments) is a Comprehensive Statement of Projections concerning the since
and uses of Governments total receipts tom the forthcoming financial year (April-
March). The Budget of the Central Government is vided into t parts: revenue
budget and capital budget. Revenue budget covers those items which are of a
recurring nature Capital budget covers those items which are concerned with
acquiring and disposal of capital assets. Each account has, of course, a receipts
and an expenditure side. Revenue receipts, comprising those items that have no
repayment liability. are di1ided into two groups - tax revenue and non-tax
Kalyan's www.OnlineIAS.com
Kalyan's www.OnlineIAS.com 125

www.OnlineIAS.com [email protected]
www.OnlineIAS.com
revenue. Tax revenue consists of receipts from a Variety of direct and indirect
taxes while non-tax revenue consists if items such as government’s interest
Income from the loans made to States and Union Territories, Departmental
Undertakings such as Railways. Past and Telegraphs and others, dividend income
from its ownership of public enterprises fees and user charges for public. services
and a few other minor items. Receipts in the capital budget or the Capital receipts
Consist largely, though not entirely, of internal borrowings Comprising market
loans i.e. loans raised against the issue of Government securities excluding
treasury bills, small savings such as post office savings and other small Savings
instrument public and State provident funds: railway reserve funds etc. (net of
repayment and external borrowings from foreign governments and international
financial institutions). They also include recovery of loans and advances and
some other receipts on capital account, such as by sale of assets, divestment of
shares of public enterprises. Thus capital receipts by and large consist of receipts
which have repayment liabilities. On the expenditure side, the current expenditure
(i.e. expenditure on revenue account) is
divided Into two categories: development expenditure and. non-development
expenditure. Development expenditure Is the expenditure incurred in order to
provide those economic and social services which the country requires to
maintain and enhance. social productivity. it comprises expenditure on social and
community services such as education and health and on economic services such
as irrigation, research and development, agricultural programmes, export
promotion, services industry, transport and communications’ etc. On the other
hand; non-development expenditure on the current account is a sort of necessary
evil (as albeit it must be incurred), as it does little or nothing by way of helping
to increase production directly. Among the items included in non-development
expenditure arc law and order and defense expenditures. General administrative
expenditure, subsidies, Interest on national debt, welfare payments and
pensions. Thus, broadly speaking, revenue expenditure is expenditure on
maintenance of existing level of ser4ces. On the other hand, capital expenditure
is expenditure Incurred for acquiring capital assets and infrastructural
development which helps in further production. Expenditure on capital account
is predominantly development expenditure designed to increase the stock of
machinery, equipment and infrastructure but it also Includes non-development
expenditure which consists of investment in defense and weapons, investments
designed to enhance the efficiency of administration etc., and retirement of
existing government debt.
Kalyan's www.OnlineIAS.com
Kalyan's www.OnlineIAS.com 126

www.OnlineIAS.com [email protected]
www.OnlineIAS.com
Union Budget of a year contains three sets of data:
(I) actual figures for the preceding year
(Ii) Budget and revised figures for the current year; and
(ii) Budget estimates for the following year.
Fiscal policy is the building block for an enabling macro-environment,
which not only provides stability and predictability to the policy regime, but
through its tax transfer mechanism, also ensures that national resources are
allocated in terms of its defined priorities. Unproductive expenditure, tax
distortions and high deficits are considered to have constrained the economy from
realizing its lull growth potential. The medium-term fiscal policy stance of
Government therefore has been to reduce deficits; priorities expenditure and
ensure that these results in Intended outcomes; and augment resources by
widening the tax base and improving: the compliance while maintaining
moderate rates.
For medium-term management of the fiscal deficit, and to provide the
support of a strong institutional mechanism the Fiscal Responsibly and Budget
Management Act (FRBMA) was enacted in 2003. The Act and the rules laid down
under the Act were notified to come into effect from 2004. FRBMA is an
important Institutional express on to ensure fiscal prudence and support for
macro-economic balance. With the enactment of the FRBM.A. the traditional
annual budgeting, moved to a more meaningful medium-term planning
framework. .
The budget for20l2-13 introduced amendments to FRBM Act as part of the
finance Bill. These amendments contained two important features of expenditure
reforms. First is the introduction of the concept of effective revenue .deficit,
which excludes from the conventional revenue deficit, grants for the creator of
capital assets, This is an important development for the reason that while the
revenue deficit of the consolidated general government fully reflects total capital
expenditure Incurred in the accounts of the centre, these transfers are shown as
revenue expenditure.: Therefore the mandate of eliminating the conventional
revenue deficit of the centre becomes problematic. With this amendment, the
Endeavour of the government under the FRBM Act would be to eliminate the
effective revenue deficit. Similarly, at state level also, some of the capital
transfers to local bodies or parastatals could get reflected as revenue expenditure.
By understating capital expenditure, this might lead to a divergence between the
Kalyan's www.OnlineIAS.com
Kalyan's www.OnlineIAS.com 127

www.OnlineIAS.com [email protected]
www.OnlineIAS.com
national accounts data on capital formation on the government accounts and the
conventional public finance data that is gleaned front the Budgets.
The second important feature is the introduction of the provision for
Medium term Expenditure Framework Statement’ in the FRBM Act. This
medium-term framework provides for rolling targets for expenditure, imparting
greater certainty, and encourages prioritization of expenditure. Together With the
measures proposed to raise the tax-GDP ratio, the Expenditure reforms are
expected to yield better fiscal marksmanship, thereby mitigating key fiscal risks.
Fiscal Marksmanship and Fiscal Consolidation:
This term implies the decree of precision Or accuracy of targets. estimates
and forecasts laid down in respect of fiscal parameters like revenue deficit, fiscal
deficit, government borrowing, tax-GOP ratio etc. In the budget and other fiscal
documents released by the government from time to time. Government fiscal
policy is evaluation not only on overall fiscal marksmanship In terms of fiscal
end revenue deficits which are in effect derived indicators, but also on
marksmanship in terms of key revenue and expenditure targets.
Following the recommendations of the Kelkar Task Force in 2012 to
prepare a roadmap for fiscal consolidation, the government unveiled a revised
fiscal Consolidation roadmap in September, 2012. This roadmap lays down a
fiscal deficit target of 4.8 per cent for 2013-14 and through a correction of 0.6 per
cent each year thereafter, a fiscal deficit target of 3 percent In 2016-17. The
Kelkar task force was alarmed by a massive 26 per cent hike In plan expenditure
In Budget 2012-13 and advised the government to roll it back for achieving fiscal
consolidation.
Tax buoyancy is important to achieve fiscal consolidation. In the post
FRBM period, both direct and Indirect taxes remained buoyant except m the crisis
years of 2008-09, 09-10 and 11-12, Tax buoyancy Is a measure of the
responsiveness of tax receipts with respect to GOP or National Income. A tax Is
buoyant when revenues increase by more than 1 per cent for a 1 per cent increase
In GDP.
Fiscal consolidation tools aim at boosting . revenue, reducing unproductive
expenditure and streamlining administrative machinery. These tool, Include tax
Kalyan's www.OnlineIAS.com
Kalyan's www.OnlineIAS.com 128
www.OnlineIAS.com [email protected]
www.OnlineIAS.com
reforms, disinvestments of PSUs, ways and means advances, reducing and better
targeting of subsidies, zero—based budgeting and performance budgeting,
expenditure reforms, reducing interest burden on government borrowing,
reducing non-plan expenditure. raising non-tax revenues. like proceeds from
2G13G auctions, scrapping schemes which may have outlived their utility.
CONCEPT OF DEFICITS
A budget can be a balance budget, surplus budget or a deficit budget on
revenue account. The Union Budget every year projects four deficits viz., revenue
deficit, fiscal deficit primary deficit and monetized deficit me Concept Of
budgetary deficit was abandoned from April, 1997 and replaced by Ways and
means and advances Budget deficit was a misleading concept as it showed a
deficit after taking into aunt government’s borrowing. Government Would plug
the deficit by borrowing from the RBI at a very low rate of interest 01 4.6 per
cent by pledging its securities and ask the RBI to print currency to bridge this..
Deficit This cheap borrowing In disciplined Government finances as the
government would often resort to deficit by printing Fresh currency. As such, this
was replaced by W&M advanc8s under which by way of a mutual agreement with
the RBI, the government resorts to from RBI only to meet its temporary mismatch
between revenue and expenditure. .This borrowing has to be on a quarterly bas4s
so that unless at least 75 per cent of borrowing repaid. The RBI may not lend to
the government for the next quarter. Besides. his borrowing is at a mutually
agreed rate of Interest which may be close to Bank rate /market rate.
Various deficits that figure in Union Budget are defined as follows:
Revenue Deficit = Revenue Receipt-Revenue Expenditure.
This deficit implies what the government-spends on a day to day basis (i,e..
on revenue account) and what the government earns on a day-to-day basis. The
day-to-day expenditure of the government on revenue account invariably has
been in excess of its day-to-day receipts causing a serious problem of high
revenue deficit year after year. This deficit is in effect deficit on account Of last
rising non-plan and consumption expenditure of the government for which
government resorts to market borrowing which results in high fiscal deficit.
Kalyan's www.OnlineIAS.com
Kalyan's www.OnlineIAS.com 129

www.OnlineIAS.com [email protected]
www.OnlineIAS.com
Borrowing per se is not bad but borrowing to meet consumption expenditure
rather than production expenditure tantamount to the
government living beyond its means. Hence, the key to reduce fiscal deficit is to
reduce revenue deficit first.
Effective Revenue Deficit:
This concept was introduced in the Union Budget 2012-13. Effective Revenue
Deficit = Revenue ‘Deficit — Grants given to States for creation of capital assets.
These grants are show, In the revenue expenditure of the government.
Budgetary Deficit = Total Receipts-Total Expenditure (Budget documents
define budgetary deficit as the sum of net increase in the floating debt of the
Government and the net Withdrawal of their cash balances. Floating debt
comprises treasury bills of the Central Government and the RBI. Ways and Means
advance& and overdrafts to State (governments)
Fiscal Deficit = Revenue Receipts + nonfinancial liability of non-debt Imposing
capital receipts (grants recoveries of past loans, proceeds of sales of assets.
Divestment proceeds)-Total Expenditure.
The concept of fiscal deficit assumes great significance as it indicates the
level of overall borrowings of the government. Fiscal deficit was alarmingly high
at 8.2 per cent of the GDP in 1991. II was close to 6% In 201112 and is targeted
at 4.8 per Cent in 2013-14.
Primary Deficit =Fiscal Deficit - Interest Payments
Primary deficit shows what government’s fiscal deficit would have been if
there was no burden of interest payments on past loans.
If this deficit is negative, it means that the entire fiscal deficit is on account
of Interest payments on past loans.
Kalyan's www.OnlineIAS.com
Kalyan's www.OnlineIAS.com 130

www.OnlineIAS.com [email protected]
www.OnlineIAS.com
Monetized Deficit = Net increase in the RBI credit to the government which is
financed by printing fresh currency. This implies deficit which may be plugged
by borrowing from the RBI and not from banks. In this case. RBI prints fresh
currency to finance borrowings of the government
Perils of High Fiscal Deficit: There are three ways in which a high fiscal deficit
can be plugged and financed viz, borrowing from RBI, borrowing from
Commercial Banks and borrowing from external sources. Each of these three
modes of financing has its own problems for the economy. For example, if the
deficit is financed from the RBI, it may lead to excess money supply in the
economy which is a potential source of inflation.
High Inflation makes exports non-competitive and encourages imports.
Thus a high fiscal deficit can spill over into a high current account deficit which
puts downward pressure on the exchange rate. High inflation ion is one of the
reasons of high CAD (Current Account Deficit) in recent years. On the other
hand, too much borrowing from non-RBI domestic sources, such as banks, other
financial institutions and individuals, is likely to drive up interest rates. Excessive
government borrowing from non-RBI domestic sources is likely to soak up
investible funds which would have otherwise finance production and investment
In industry Agriculture, infrastructure etc. This in fact “crowds-out” private
investment and thus lowers the growth of output and employment Similarly
excessive foreign borrowings to finance high fiscal deficits can create external
payment problems and problems of Servicing of the external debt.
Fiscal Consolidation is necessary for containing inflation, reducing interest
rates. Promoting Investment and growth, and fostering reasonable stability in the
financial system and the foreign exchange market. More than the fiscal deficit. It
is the quality of fiscal deficit and government expenditure and the nature of the
tax system underpinning the fiscal system which is important. If the fiscal deficit
Is on account of more and more capital expenditure, then one may not worry too
much because this capital expenditure in due course would start generating
economic returns to cover up this deficit. However, if the fiscal deficit is largely
on account of low priority revenue expenditure, as is the case in India. then the
fiscal situation realty becomes unsustainable. These low priority expenditures and
non-targeted subsidies lead to a high revenue deficit and need to be
Identified and eliminated. Fiscal sustainability calls for reforming the tax system
to augment revenue mobilisation and containing expenditure by downsizing, the
government and by reducing a large amount of wasteful expenditure. The fiscal
Kalyan's www.OnlineIAS.com
Kalyan's www.OnlineIAS.com 131

www.OnlineIAS.com [email protected]
www.OnlineIAS.com
situation in India causes concern from time, to time due to the inability of the
government to check its wasteful expenditure particularly non-plan expenditure.
There are many dimensions on which quality of fiscal deficit can be assessed.
One is the lag between fiscal action and increase in effective demand.
Another is the degree to which the medium term productivity of the economy is
increased. Expenditure such as debt relief, which has short lags. may have little
or no effect on productivity, while productive infrastructure expenditure takes
much longer to translate into effective demand.
The most worrisome aspect of the Centers fiscal deficit Is that year1y three
fourth of the borrowings are used for financing unproductive revenue
expenditure. This adds to. the already high interest burden of the government and
threatens a situation of debt trap.
In order to bring about fiscal consolidation and restore the fiscal health of
the economy, some significant measures have been taken n the last few years.
These include reduction of food and fertilizer subsidy, reduction of interest rates
on provident fund and small savings including those of Post Offices,
downsizing/right sizing the government introduction of Zero Based Budgeting
limiting fresh government recruitment to minimum essential needs, review of the
entire subsidy regime with a view to bringing in more and more of cost-based
user charges, acceleration of the privatization Process. implementation of the
recommendations of the Expenditure Reforms Commission In respect of
abolition of the identified surplus manpower. Limiting fresh recruitment to 10 per
cent ‘of the total civilian staff strength and offering VRS package, apart from
other recommendations. most importantly, the government sought to discipline
itself by enacting FRBM Act in 2003 arid follow the rules laid down Under the
Act. These rules are:
1. Reduction of revenue deficit by an amount equivalent of 0.5 per cent or more
of the GDP at the end of each financial year, beginning with 2004 -2005.
2., Reduction of fiscal deficit by an amount equivalent of 0.3 per cent or more of
the GDP at the end of each financial year; beginning with 2004-2005.
3. No assumption of additional liabilities (including external debt at current
exchange rate) In excess of 9 per cent of GOP for the financial year 2004-2005
and progressive reduction of this limit by at least one percentage point of GDP In
each subsequent year.
4. No guarantees In excess of 0.5 per cent of GDP in any financial year, beginning
with 2004-2005.
Kalyan's www.OnlineIAS.com
Kalyan's www.OnlineIAS.com 132
www.OnlineIAS.com [email protected]
www.OnlineIAS.com
5. Specifies four fiscal indicators to be projected in the medium term fiscal policy
statement, which are,
• Revenue deficit as a percentage of GDP.
• Fiscal deficit as a percentage of GDP.
• Tax revenue as a percentage of GDP, and
• Total outstanding liabilities as a percentage of GDP.
6. For greater transparency In the budgetary process rules mandate the Central
Government to disclose changes, if any, in accounting standards. policies and
practices that have a bearing on the fiscal indicators. The Government is also
mandated to submit statements of receivables and guarantees and a statement of
assets, at the time of presenting the annual financial statement.
7. The rules prescribe the form for the quarterly review at the trends al receipts
and expenditures. The rules mandate the Central Government to take appropriate
corrective action in case of revenue and fiscal deficits exceeding 45 per cent of
the. budget estimates, or total no debt receipts failing short of 40 per cent of the
budget estimates at the end of first half of the financial year.
The FRBM Act has been amended in 2012-13 s mentioned in the preceding
section
Task Force on implementation of FRBM Act
Following the enactment of FRBM Act. Government constituted a Task Force
headed by Dr. Vijay Kelkar for drawing up the medium term framework for fiscal
policies to achieve the FRBM targets. The Task Force was also asked to formulate
annual targets indicating the path of adjustment and required policy measures.
The Task Force submitted its report in July, 2004. The Task Force recommended
a path of fiscal adjustment that is front loaded and mainly revenue4ed, with,
complementary reform efforts on revenue expenditure and enhanced capital
expenditure to counteract the possible contractionary effects of fiscal correction.
The Task Force inter alia proposed The introduction of an All-India good
and services tax (GST), on the basis of a ‘grand bargain’ with States, whereby
States will have the concurrent powers to tax services, subject to certain principles
that will help foster a national Common market. Lt also proposed changes in
Kalyan's www.OnlineIAS.com
Kalyan's www.OnlineIAS.com 133

www.OnlineIAS.com [email protected]
www.OnlineIAS.com
Income tax, corporate tax, excise duty and custom duty structure. Some of these
changes have since been incorporated.
India’s Tax Structure
The salient features of India’s tax structure are as follows:-
(i) Progressive, which means that as income goes up the rare of tax goes up so
that the rich are taxed at a higher rate than the poor so as to reduce inequalities.
(ii) Prone to evasion which implies that there are too many loopholes and
Exemptions/ rebates which leave enough scope for evasion and avoidance of
taxes.
(iii) Complex structure implying that not only tax rates may be high but also with
many slabs giving room for evasion.
(iv) Excludes tax on Agriculture.
Tax reforms introduced since 1991 have induced structural shift in the
composition of tax revenue, marked by a progressive increase in the share of
direct taxes in total taxation revenue and a corresponding decline in the share of
indirect taxes.
The Share of direct taxes in the gross tax revenue has progressively increased
from 19.1 per Cent In 1990-91 to 53 per cent in 2012-13.
The direct tax revenue as a percentage of GDP increased from 1.9 per cent
1990-91 to 5.6 per cent in 2012-13. On the other hand, the share of indirect taxes
has declined from 7.9 per cent in 1990.91 to 5 per cent in 2012-13. A significant
structural shift has been that Corporate income t in 2012-13 occupied first place
in the overall tax revenue, Central excise duty occupied second position Personal
income tax Occupied third place while Custom duties has been relegated to fourth
potion. The gross tax-GDP ratio of the Centre generally remained in the range of
8 per cent to 9 per cent for some years as the growth In direct tax-GDP ratio could
not fully offset the decline in the indirect tax-GDP ratio. However, there has been
some recovery in the last few years in the Tax GDP ratio which was 10.7 per cent
in 2012-13. The Central Government levies five major taxes viz, personal income
tax, Corporate tax, custom duties, union excise duties and service tax, while the
principal tax revenue sources of the State Governments are the share of the States
in total tax revenue collected by the Centre. commercial taxes like sales tax,
turnover tax (now called State Level VAT), land revenue, stamp duty and State
Kalyan's www.OnlineIAS.com
Kalyan's www.OnlineIAS.com 134

www.OnlineIAS.com [email protected]
www.OnlineIAS.com
excise duties on alcohol and other narcotics, etc. The present position of live main
taxes imposed by the Centre is as follows:
1. Central Excise Duties:
These duties are levied by the Centre on commodities which are produced within
the country. These duties accounted for .18 per cent of gross ax revenue in 2012-
13 and 1.9 per cent of GDP. Major items on which central excise duties are
imposed include sugar, cotton, mill cloth, tobacco, motor spirit, matches, cement
etc. Commodities on which the State Government Impose excise duties (like
liquor and drugs) are exempted from central excise duties have been extended to
a large number of goods..
In recent years, central excise duties have been extended to a large number of
goods. In recent years, central excise duties have been lowered/exempted on a
number of items pertaining to agricultural implements tractors, health care, hand
tools, meal and poultry products, processed food etc. On the Other hand, excise
duties have been raised On items like Contact lenses, Playing cards, vacuum
flasks, scented supari, imitation jewellery, etc. The Excise Duty regime, popularly
known
as CENVAT, has been rationalized from time to time with Sectoral and structural
changes taking place in the economy and in accordance With general lowering of
custom duties after the setting up of the WTO. In order to provide Stimulus to the
economy the government reduced the CENVAT rate, across the board, by 6 per
cent towards the end of 2008-09 so as to revive the economy. However, in the
budget 2012-13. excise duty on most items was raised to 12 per cent. Thus the
rate at present is 12per cent, The merit rate was also raised from 5 to 6 percent
and lower merit rate from 1 to 2 per cent.
2.Customs duties
These comprise of duties levied on imports and exports. These duties accounted
for 17.3 per Cent of gross tax revenue and 1.9 per cent of GDP in 2012-2013. As
export duties reduce the competitive strength of Indian goods In International
markets, the government abolished export dies. However, in recent years. It has
imposed export duties in order to conserve mineral resources. import duties
perform the following three major functions: -
(i) Raise revenue needed by the Government.
Kalyan's www.OnlineIAS.com
Kalyan's www.OnlineIAS.com 135

www.OnlineIAS.com [email protected]
www.OnlineIAS.com
(ii) Regulate foreign trade of the country, particularity the imports.
(iii) Offer protection to local industries by imposing tariffs.
As part of structural reforms, the Government has been reforming the structure
of customs duties with a view to reduce the role of quantitative restrictions on
imports and place Increasing reliance on tariffs to regulate imports and reduce
rates to ASEAN levels, in order to Induce competition and efficiency in the
framework of a liberalizing economy and to maximize the positive effects of
foreign direct investment, the tariffs themselves have been reduce, and peak
customs duty has been bought down to 10 percent on non-agricultural goods. The
rationale is that if protection levels are high and ii there are trade restrictions.
Foreign investments may become a means of taking advantage of such high tariffs
to generate ugh domestic profits and it may worsen the balance of
Payments, if it results In large imports of components, raw materials and capital
equipment from parent company without adequate exports. Although the
reduction of custom tariff rates has unfavorably affected the proportion of
customs revenue gross tax revenue, it has imparted underlying strength to the
economy by imparting competition arid inducing cost-reducing measures- The
government has also imposed CVD (Countervailing Duty) of 4 per cent on all
Imports.
3. Corporate Tax
This is levied on the incomes of registered companies and corporations. The
rationale for the corporate lax Is that a joint stock company has a separate entity
and thus a separate tax different from personal income tax has to be levied on it’s
income. From the Governments point of view, corporate tax is necessary as
excess profits can be taxed and even foreign firms operating in India can be taxed.
corporate tax. It directed, can help promoting investments and thus forcing the
corporations to reinvest thaw profits. And if removed. Provide a windfall gain to
corporate groups. Moreover, corporate taxes are progressive and cannot be
evaded easily. Corporate tax rate on domestic companies is 30 per cent. The
Union Budget 2013-14 has raised surcharge on domestic companies from 5 per
cent to 10 per cent which will be imposed on companies which has been
taxable income exceeds-Rs. 10 crores. Corporate tax rate on foreign Companies
is 40 per cent. In addition there is a surcharge of 2 per cent which has been raised
to 5 per cent in 2013-14 budget for those companies whose taxable income
Kalyan's www.OnlineIAS.com
Kalyan's www.OnlineIAS.com 136

www.OnlineIAS.com [email protected]
www.OnlineIAS.com
exceeds 10 crores. Corporate tax accounted for 34.6 per cent of gross lax revenue
and 3.7 per cent of GDP In 2012-13.
4. Personal Income tax
This is levied on the incomes of individuals. Hindu Undivided Families (HUFS),
unregistered firms and other associations of people. Taxation is progressive (i.e.
with increase income. Tax liability not only increases in absolute terms, but also
as a proportion of income) d, for taxation purposes. income from all sources s
added. The Personal Income Tax accounts for 17.6 per cent of Gross Tax Revenue
and 1.9 per cent of GDP In 2012-2013. The personal Income tax rakes
are as follows
Slab Rate of Income tax
Upto Rs.2.0 lakh Nil
Rs. 2.0 lakh to 5.0 lakh 10 per cent
Rs. 5.0 lakh to 10.0 lakh 20 per cent
Rs. 10.0 lakh ad above 30 per cent
In the case of senior citizens the exemption emit is Rs. 2.5 lakh. A surcharge of
10 per cent has been Imposed on taxable incomes above Rs. 1 crore in the Union
Budget 2013-14. Also, a tax credit of Rs. 2000 has been provided to every person
with total income upto Rs. 5 lakhs In the tax bracket of Rs. 2.5 lakhs.
5.Service Tax
The indirect tax structure has been broadened in recent years largely by extending
the tax net to the fastest growing services sector which accounts for over 55 per
cent of the GDP. All services except those In the negative list are covered now
under the service tax net. This tax is a central levy and the fastest growing tax and
accounts for 8.8 per cent of gross tax revenue and 0.9 per cent
of GDP. The centre has decided to share its proceeds with States for certain
services. The rate of service tax at present is 12 per cent. Union Budget 2013-14
has proposed service tax on all air conditioned restaurants.
Kalyan's www.OnlineIAS.com
Kalyan's www.OnlineIAS.com 137

www.OnlineIAS.com [email protected]
www.OnlineIAS.com
India’s tax structure is characterized by the absence of a tax on income from
agriculture. which accounts for nearly 20 per cent of India’s GOP. Besides,
India’s tax structure is such that it encourages evasion due to a large number of
rebates and exemptions, thus making it a complex structure. Some of the other
features of ‘the tax structure viz., narrow tax base and pre-dominance of Indirect
taxes have been largely. addressed by Way of tax reforms carried out since 1991
on the recommendations of Chelliah Committee and subsequently on
recommendations of the Kelkar task force.
The government has been Implementing these reforms in phases. The focus of
Direct Tax reforms has been on lowering of tax-rates, removing/reducing,
exemptions and rebates, simplification of tax structure, widening the tax base and
providing stability in basic tax rates, white the thrust of Indirect Tax reforms has
been rationalization of excise/custom duties, simplification broadening of
indirect tax base (by introducing service tax and VAT), aligning the tax structure
to global requirements and Preventing/minimizing evasion.
PRESUMPTIVE TAXATION: An important aspect of reforms of direct
taxation since 1991 has been the concept of Presumptive taxation which has been
introduced to broaden the direct tax base. A presumptive tax is a tax
imposed/sought to be imposed on the presumption that an individual company
earns enough to pay tax and yet the tax is evaded avoided. The following
presumptive taxes have been introduced:
(i) Minimum Alternate Tax (MAT) which is applicable on companies whose
book profits are high enough to qualify for tax and yet they use several
rebate/reductions under the Income Tax Act to avoid paying tax and thus end up
as zero tax companies. In such cases MAT is imposed. The rate of MAT at present
is18,5 percent. The Budget 2012.13 extended provision of MAT to all non-
company assesses also.
(ii)Tonnage tax under which the notional income arising from the operation of
ship is determined on the basis of the tonnage carried by the ship, The national
income is taxed at the normal corporate tax rate applicable for the year. Tax is
payable even ii there is a loss in a year. Imposition of Tonnage tax on Indian
shipping companies meets their longstanding demand for Such a regime, as
similar practice exists in most nations. This Is expected to attract FDI In the
Kalyan's www.OnlineIAS.com
Kalyan's www.OnlineIAS.com 138

www.OnlineIAS.com [email protected]
www.OnlineIAS.com
industry as well as make Indian Shipping Industry more competitive, as the
effective tax rate is likely to come down substantially.
(iii) Securities Transaction Tax (STT): This tax, also caned turnover tax,
introduced In 2004 at the rate of 0.015 per cent on the total value of delivery
based equity transactions in the stock market. This means that for every
transaction involving se/purchase of shares, say, worth Rs. 1,000, the buyer and
seller will have to pay 75 paisa each. STT is applicable at different rates
depending upon the security (whether equity or derivative) and the transaction
(whether purchase or sell). Service Tax, Surcharge and Education Cesses are not
applicable on STI. Summary of the STT rates is given in the table below:
Product Transaction
STT rate
Charged on
Equity-Delivery
Equity-Intraday
Future
Option
Purchase
Sell
Purchase
Sell
Purchase
Sell
Purchase
Sell
0.10%
0.10%
-
0.025%
-
0.010%
0.125%
0.017%
Turnover
Turnover
Turnover
Turnover
Settlernent price,
on exercise
Premium
Value Added Tax (VAT)
In general all the goods including declared goods will be covered under VAT and
Will get the benefit of Input tax credit. Goods which lie outside VAT are liquor,
lottery Tickets, petrol. diesel, aviation turbine fuel and other motor 5 their prices
are not Fully market determined. These will continue to be taxed under the Sales
Tax Act or any Other State Act or even by making special Pr visions in the VAT
Act itself, and with uniform floor rates decided by. the Empowered Committee.
Introduction of State Level VAT is the most significant tax reform at State
level. The state Level VAT replaced the existing State Sales Tax. Since Sales
Tax/VAT is a state subject, the Central Government has played the role of a
facilitator. Technical and financial support has also been provided to the States
for VAT computerization. Publicity and awareness and other related aspects.
Kalyan's www.OnlineIAS.com
Kalyan's www.OnlineIAS.com 139

www.OnlineIAS.com [email protected]
www.OnlineIAS.com
The Empowered Committee, though. Its deliberations over the years,
finalised a Design of VAT to be adopted by the States, which seeks to retain the
essential features of VAT, while at the-same time, providing a measure of
flexibility to the States, to enable Them to meet their local requirements. VAT
has been successfully introduced by all the States. The introduction of VAT has
led to an increase in States’ tax revenues in the last few years. Under the specific
scheme evolved for the purposes to fadltá1e- introduction of VAT, the Central
Government promised compensation for the revenue losses at the rate of 100 per
cent of revenue loss during 2005-06, 75 per cent during 2006-07 and 50 per cent
during 2007-08.
Central Sales Tax
Central Sales Tax is levied by the Centre on Inter State sale of goods @ 2 per
cent. Central Government in consultation with the Empowered Committee of
State Finance Ministers (Empowered Committee of State Finance Minister)
chalked out the roadmap for phasing out Central Sales Tax (CST) to coincide
with the Introduction of the proposed GST including the critical component of
compensating the States for resultant revenue losses. The scheme finalized in
consultation with the Empowered Committee of States Provides for new revenue
generating measures for States as the primary source Of composition. It also
provides for meting 100 per Cent of the residuary losses to a Slate, f any,
thereafter, through the budgetary resources of the Centre.
An agreement was reached at the Empowered Group of State Finance Minister
meeting in January, 2013 to compensate states to the tune of Rs. 34.000 crores
due to
abolition of CST, whenever, it lakes place.
All-India Goods & Services Tax
An All-India Goods and Services Tax (GST ) was recommended by Kelkar
Task
Force on implementation of FR8M Act, 2004, as a tax that would subsume all
indirect taxes, including custom duties, at the centre and state levels into one
uniform Indirect tax for the entire country and would satisfy the ideal conditions
of one-country-one-tax. The task force envisaged that such a tax will not only
reduce the cascading burden of a large number of indirect taxes on the final
Kalyan's www.OnlineIAS.com
Kalyan's www.OnlineIAS.com 140

www.OnlineIAS.com [email protected]
www.OnlineIAS.com
consumer but would also benefit the producer by way of cost reduction,.
Increased productivity and increase in overall demand for the goods. As a results
it would lead to an increase In GDP, tax GDP ratio, eliminate revenue deficit to
result in a. Revenue surplus and thus emerge as the most revolutionary reform of
indirect tax structure since Independence.
The government took up the task of Implementing GST by floating a
discussion paper on the subject. Also, an empowered committee of state finance
ministers headed by West Bengal finance Minister Asim Des Gupta was set up to
bring about a consensus between the centre and states (The Committee is now
headed by Sushit Modi).
The proposed GST pattern that has emerged would subsume the following
indirect taxes/duties:
Central taxes: (a) Central Excise (CENVAT); (b) Additional/excise Duties: (C)
Service Tax; (d) Additional and Special Additional Custom duties (e) Central
Surcharges; and (f) Central Cesses.
State Taxes: (a) VAT/Sales Tax: (b) Entertainment Tax (unless levied by Local
Bodies); (c) Luxury ‘Tax; (d) Taxes on lottery, betting and gambling; (e) State
Cesses and Surcharges; and (I) Entry Tax not in lieu of octroi.
The rate structure proposed for the three rates viz, standard rate for most
Items: merit rate (i.e., lower rate) for goods of basic importance and essential
items and special rate for precious metals/ ornaments. In addition there would be
a list of items exempted from GST:
A higher rate above the standard fate may also be proposed for luxury items
and those of conspicuous consumption.
Most importantly, the GSY be In the of VAT with Input tax credit
Available on Inputs as well as previous purchases, at each stage up to the final
Consumer. As such, GST would be k4e nature of VAT on final consumption so
that the burden of GST would tall on the final consumer. It would therefore, be a
tax on final consumption called Consumption based tax. Since India is a federal
state, the GST will be in the nature of a dual GST and, according to the. proposed
structure. revenue from GST will be shared equally between the centre and states.
Kalyan's www.OnlineIAS.com
Kalyan's www.OnlineIAS.com 141

www.OnlineIAS.com [email protected]
www.OnlineIAS.com
Merits of GST
1. It will reduce the cascading burden of a large number of Indirect taxes at the
centre and state levels.
2. It is expected to moderate prices and boost demand and consumption.
3. It will bring uniformity by way of one country one tax. :
4. It will rationalize and simplify indirect lax structure.
5. It is expected to increase GDP, TAX GDP ratio and 6ring a revenue surplus
and thus reduce fiscal deficit.
6. It will integrate Indian economy with the rest of the world as most countries
have GST in place.
7. It will build India as a common market.
8. It will raise productivity, reduce distortions and increase e rate of GOP growth.
Problems associated with GST: -
1. Its proposed structure is flawed by international standards because it excludes
petroleum and alcohol products which account for 40-50 percent of revenue from
indirect taxes. Excluding them means no information on them, while in the rest
of the world they are Included- in GST and at best they use additional selective
excises on them to gather more revenue.
2. Good and services should not be listed separately as it defeats the whole
Purpose of creating a seamless treatment between them. The legal complexity of
defining them should go away.
3. A well-developed system of clearing house is required for inter-state trade tor
which India’s IT system Is not ready. This can create Insurmountable problems
of high GST evasion as It happened in 1986 with the introduction of, MODVAT.
It lock years for the European Union to implement GST which could be foolproof.
Likewise. New Zealand and Canada have managed transition to GST largely
through strong political leadership as well a meticulous planning &
implementation.
4. The proposed late of 16 percent may be high as compared to the present VAT
rates t 12.5 percent. CENVAT 10 per cent and service tax l0 per cent. This rate
Kalyan's www.OnlineIAS.com
Kalyan's www.OnlineIAS.com 142

www.OnlineIAS.com [email protected]
www.OnlineIAS.com
of 16 percent may be unsustainable and could defeat the purpose of GST. The
13th Finance Commission has proposed a 12 per cent GST rate which appears
more rational
5. States have expressed their discontent as they would get 8 percent out of 16
percent while at present they get 12.5 percent by way of state VAT.
6. Implementation of GST is pre-conditioned by two major constitutional
amendments - one to permit the central to tax sales and the other to permit states
to tax services. These may not come easily.
7. Its successful implementation requires a strong technological back bone to
track transactions at each stage otherwise there are fears of loss of revenue to
states. The centre has entrusted this task to a panel headed by Nandan Nilekani
8. The Issue of compensation to be given to states in the event of toss of revenue
for which the centre has committed to compensate stales.
9. Basic Import duties have been kept out of GST, which is in contrast to what
Kelkar Task Force recommended. The empowered committee has been having a
constant dialogue with states to iron out difference and strike a consensus. Many
states1 particularly those not under the ruling party regime have expressed serious
reservations on GST.
10. States apprehend loss of autonomy under GST both In respect of rate
determination as well as dispute settlement.
It has been clarified ii the GST framework that
(a) Exports of goods and services shall be zero-rated which means that GST paid
by exporters shall be refunded.
(b) There will be a list or goods and services exempt from GST.
(c) There will be separate Central and Stale GST so that taxes paid ag.kst the
Central GST shall be allowed to be taken as input tax credit for the Central GST
and could be set off only against the payment of central GST. The same principle
shall apply for State GST.
(d) Cross utilization of input tax credit between central and state GST shall not
be permitted except in the case of inter-state Supply of goods and services under
the IGST.
The empowered committee has been trying to build a consensus among
state governments and the Centre to ensure smooth implementation of GST, as
state governments are divided over the Issue. Particularity. state governments
Kalyan's www.OnlineIAS.com
Kalyan's www.OnlineIAS.com 143

www.OnlineIAS.com [email protected]
www.OnlineIAS.com
have sought a high compensation in lieu of Central Sales Ta if lids tax is
abolished. The government has set up a panel headed by Export Commissioner.
Mumbai to prepare a model GST for the Centre which can also be replicated by
slate governments.
Also, the government has appointed Navin Kumar former Chief Secretary
of Bihar) as the Chairperson of the proposed Goods and Services Tax Network
(GSTN) special purpose vehicle.
Direct Taxes Code (DTC)
While GST is viewed as the ultimate reform of indirect tax structure in
India the Direct Taxes Code is seen as the ultimate reform of direct tax structure.
The government prepared a draft direct taxes code in the year 2009-10.
The Code seeks to consolidate and amend the laws relating to all direct
taxes, so as to establish an economically efficient, effective and equitable direct
lax system which Will facilitate voluntary compliance and help increase the tax-
GDP ratio. All the direct taxes are sought to be brought under a single code and
compliance procedures unified, which will eventually pave the way (or single
unified tax payer reporting system. The need for the Code arose from concerns
about the complex structure of the Income Tax Act, numerous amendments
making it incomprehensible to the average tax payer and frequent policy changes
due to changing economic environment.
The DTC states that marginal tax rates have been steadily lowered and the
rate structure rationalized to reflect best international practices and any further
rationalization of the tax rates may not be feasible without corresponding increase
in the tax base to enhance revenue productivity Of the tax system and improve its
horizontal. A threefold strategy lot broadening the base has been articulated in
the Code:
(i) The first element of the strategy is to minimize exemptions that have eroded
the tax base. The removal of these exemptions would result in a higher tax. GDP
ratio: enhance GOP growth, improve equity (both horizontal and vertical); reduce
compliance costs; lower administrative burdens; and discourage corruption.
(ii) The second element of the strategy seeks to address (he problem of ambiguity
in the law which facilitates tax avoidance.
(iii) The third element of the strategy relates to checking of erosion of the tax base
through tax evasion.
Kalyan's www.OnlineIAS.com
Kalyan's www.OnlineIAS.com 144
www.OnlineIAS.com [email protected]
www.OnlineIAS.com
DTC bill was tabled, in Parliament in August. 2010. The revised Code placed in
the Parliament was a highly watered down document.
Salient Features and Highlights of the revised DTC are as follows:
1. DTC removes most of the categories of exempted income. Unit Linked Plans
(ULIPs). Equity Linked Mutual Funds (ELSS). Term deposits, NSCs (National
Savings certificates). Long term infrastructures bonds, house loan principal
repayment, stamp duty and registration tees on purchase of house properly will
lose tax benefits.
2. Tax saving based investment. limit remains 1 lakh but another 50.000 has been
added for pure life insurance (Sum insured is at least 20 times the premium paid),
health insurance, med claim policies and tuition fees of children. But the one lakh
Investment can only be done in provident fund, superannuation fund, gratuity
fund and new pension fund.
3. The tax rates and slabs have been modified. The proposed rates and slabs for
annual income are as follows:
Upto Rs 200,000 (for senior citizens Rs. 250,000) Nil
Between Rs. 200.000 to 500,00 10 %
Between Rs. 500.000 to 1.000,000 20 %
Above Rs. 1,000.000 30%
Men and Women are treated alike for purpose of taxation.
4. Exemption wilt remain the same at 1.5 lakh per year for interest on housing
loan for Self-occupied properly. -
5. Only half of Short - term capital gains will be taxed e.g. one gains 50.000, only
25,000 Will be taxed. long term capital gains (From equities and equity mutual
funds on which Sri has been paid) are still exempted from income tax,
6. Tax exemption at all three stages (EEE) - savings, accretions and withdrawals
– to be allowed for provident funds (GPF. EPF, d PPF). NPS (new pension
scheme administered by PFRDA), Retirement benefits (gratuity, leave
encashment etc), pure life Insurance products & annuity schemes. Earlier DTC
wanted to tax withdrawals:
7. Surcharge and education cess are to be abolished.
8. - Tax exemption on LTA (Leave travel allowance) Is abolished.
Kalyan's www.OnlineIAS.com
Kalyan's www.OnlineIAS.com 145

www.OnlineIAS.com [email protected]
www.OnlineIAS.com
9. Tax exemption on Education loan to continue.
10. Corporate tax reduced from 34% to 30% including education cess and
surcharge.
11. For taxation of Capital gains from property sale within one year. gain is to be
added to taxable salary. For long term gain (after one year of purchase), instead
of flat rate of 20% of gain after indexation benefit, new concept has been
introduced. Now gain after Indexation will be added to taxable Income and taxed
as per the tax slab. Base date for cost of acquisition has been changed to 1st April,
2000 instead of earlier 1st April, 1981. 12, Maximum limit for medical
reimbursements has been increased to Rs. 50,000 per year from current Rs.
15,000 limit.
13. Dividends will attract 5% tax.
14. As per the current laws, a NR! is liable to pay tax on global income if he is in
India for a period of more than 182 days in a financial year. But In the new bill,
this duration has been changed to just 60 days.
15. It consolidates and integrates all direct tax laws and replaces both the income
Tax Act 1961 and the Wealth Tax Act 1957 with a single legislation.
16. It simplifies the language of the legislation. The use of direct, active Speech
expressing only a single point through one sub - section and rearranging the
provisions into a rational structure will assist a lay person to understand the
provisions of the DTC.
17. It indicates stability in direct tax rates. Currently, the rates of tax a particular
year e stipulated In the Finance Act for that relevant Year, Therefore, even if there
is no change proposed in the rates of tax, the Finance Bill has still to be passed
indicating the same rates of tax. Under the
Code, all rates of taxes are proposed to be prescribed in Schedules to the Code,
thereby obviating the need for an annual finance bill, if no change in the tax rate
is proposed. ..
18. It strengthens taxation provisions for international transaction. In the context
of a globalized economy., It has become necessary to provide a stable framework
for taxation of international transactions and global capital.
19. General Anti Avoidance Rule to curb Aggressive Tax Planning - Direct tax
rates have been moderated over the last decade and are in line with international
norms. A general anti-avoidance rule - assists the tax administration in deferring
aggressive, tax avoidance in a globalized economy. Such general anti- avoidance
Kalyan's www.OnlineIAS.com
Kalyan's www.OnlineIAS.com 146

www.OnlineIAS.com [email protected]
www.OnlineIAS.com
rules already form a part of the tax legislation in a number of G- 20 countries.
These will also apply to investments under DTAAs.
The Parliamentary Standing Committee headed by Yashwant Sinha
submitted its report on DTC recommending, inter ala. the following changes:
(i) A massive increase in personal income tax exemption; -
(ii) Tax on wealth above Rs. 5 crore at the income tax rate applicable in that slab;
(iii) Abolition of STT;
(iv)Retaining corporate tax rate at 30 per cent; and
(v) Granting area based tax exemptions on investments. in view of these
recommendations the DTC is expected to be reviewed by the government.
GENERAL ANTI AVOIDANCE RULES (GAAR)
GAAR is Incorporated In Direct Tax Code as a very Important provision of direct
tax policy.
Objective of GAAR: its objective Is to prevent misuse and abuse of tax policy
and counter aggressive tax avoidance schemes while ensuring that it issued only
In ,appropriate CBSOS by enabling a review GAAR. it aims at preventing deals
and comes that are structure only to avoid paying tax. The global practice on anti-
avoidance rules is that most countries have codified ‘substance over form’
doctrine in the form of GAAR, s many as 30 countries have such rules, including
many of the G-20 countries. There are also retrospective tax provisions in these
rules in many countries.
GAAR has generated a serious debate in India not only due to Its retro tax
provisions but also for having created uncertainty In tax policy. These rules along
with
DTC were referred to a Parliamentary Standing Committee In March, 2012 which
observed as follows:
1. GAAR gives arbitrary powers to taxmen to challenge complex deals. Such
powers are prone to misuse.
Kalyan's www.OnlineIAS.com
Kalyan's www.OnlineIAS.com 147

www.OnlineIAS.com [email protected]
www.OnlineIAS.com
2. Onus lies on the tax payer to prove that a transaction is genuine.
3. The paper cannot seek an advance ruling on whether a transaction would be
covered by GAAR.
4. It has created uncertainty-and ambiguity among investors.
The Standing Committee has recommended following amendments:
1. Removing discretionary powers taxmen;
2. Evolving proper guidelines;
3. Having a threshold above which tax .should be imposed; and
4. Tax payer should enjoy the option of advance ruling.
Based on these recommendations, a review o GAAR is being carried out on the
following lines:
(a) Fixing a monetary threshold;
(b) Onus to lie with the tax authorities;
(c) Laying down appropriate guidelines;
(d) Orders of the Commissioner Involving GAAR should be subject to approval
of Dispute Resolution Panel which would be a collegiums of three
Commissioners of Income tax:
(e) Provision for advance ruling:
(f) There should be a time limit within which Commissioner will have to decide
whether to impose GAAR or not:
(g) An appropriate panel will have to decide on GAAR cases:
(h) Retro tax provisions shall apply;
(I) short term capital. Gains made in investments through shell entities like tax
heavens shall be subjected to tax; -
(J) Investments in the nature of round tripping shag attract GMR and
(k) P-Notes shall not be subjected to GAAR.
The Government set up Parathasarthy Shome Committee to review
GAAR. The
Committee gave Its interim report on 1St September 2O 2 recommending as
follows:
Kalyan's www.OnlineIAS.com
Kalyan's www.OnlineIAS.com 148
www.OnlineIAS.com [email protected]
www.OnlineIAS.com
(i) GAAR should be deterred till 2016-17.
(ii) GAAR should not have retrospective effect and should apply only to taxes of
more than Rs. 3 crore.
(iii) GAAR should not be Imposed for Singapore and Mauritius.
(iv) There should be no short-term Capital gains tax on investments in stock
markets Including those on Flls and non-residents.
(v) Government should specify illustrative negative list for tax mitigation.
(vi) GAAR should not be imposed on intra-group transactions.
(vii) Grandfather all existing investments involving a question of taxation of
overseas entities.
(viii) Rate of STT should because to make up for loss in not imposing Capital
gains tax.
A bill to implement Direct Tax Code has been pending k the Lok Sabha since
August 2011. Meanwhile some Provisions of the DTC have been introduce in
Union Budget like raising IT exemption limit to Rs. two lakh with In slabs.
OUTCOME BUDGET
A system or performance budgeting by Ministries handling development
programmes was introduced, in 1969 following the recommendations of the
Administrative Reforms Commission. FCC long, a need has been felt to address
certain weaknesses that have crept to the performance budgeting framework such
as lack of dear one-to-one relationship between the financial and the performance
budgets and inadequate target setting in physical terms for the ensuing year.
Besides, there is a growing concern to track not just the more readily measurable
intermediate physical
“outputs” but the “Outcomes” which are the end objectives :f state Intervention.
A beginning ‘Outcome Budget’ was made in 2005-2006 with a conceptual
framework and a broad roadmap of future reforms.
The process of conversion of outlays into outcomes is a long one- with
several intermediate stages and complementary resources required in achieving
intended impact. The cause and effect chain is not always direct, and several
environmental factors influence the actual impact and outcomes.
Kalyan's www.OnlineIAS.com
Kalyan's www.OnlineIAS.com 149

www.OnlineIAS.com [email protected]
www.OnlineIAS.com
Outlays are financial resources deployed for achieving certain outcomes.
Part of the money may be directly from the budget and part from other
stakeholders such as State Governments, public sector undertakings (PSUs) or
even private parties in the growing areas of PPP. Inputs are physical resources
subsumed under outlays:
Outputs are a measure of the physical quantity of the goods or services
produced through a government. Scheme or programme. They are usually an
intermediate stage between ‘outlays’ and ‘outcomes’. For example construction
of a school building is the’ ‘output’, while increase in the Literacy rate is the ‘final
outcome’ or impact.
Outcomes or impact are the end results of. various Government initiatives
and interventions. Going beyond mere ‘outputs’, they cover the quality, and
effectiveness of the goods or services produced as a consequence of an
intervention. in poverty monitoring, impact is placed at a higher level than
outcomes. Overall well-being or living Standards of the poor is treated as a higher
level impact with outcome defined as Poor’s access to and use of goods and
services.
Thus, goals, indicators and targets have been drawn up for various schemes
and Programmes, The Ministries/Departments engage independent evaluators
and assessment agencies for scrutiny/evaluation of the achievements against
physical output and final outcomes of major flagship schemes. Guidelines for
preparation of the Outcome budget by various Ministries have been issued.
GENDER BUDGETING
Introduced first of all in Australia In 1984. the concept implies that the
budget data should be presented in a manner so that the gender sensitivities of the
budgetary allocations are clearly highlighted. Gender budgeting was introduced
in India in 2005-2006. The main objective is to main-stream gender perspective
in all sectoral Policies and programmes and to work towards the ultimate goal of
eliminating gender discrimination and creating enabling environment for gender
justice and empowerment of women.
REVENUE FOREGONEITAX EXPENDITURE
Tax Expenditure means the difference between statutory tax rates notified
in the schedules of taxation and the Act for effective tax rates (i.e., rates after
Kalyan's www.OnlineIAS.com
Kalyan's www.OnlineIAS.com 150

www.OnlineIAS.com [email protected]
www.OnlineIAS.com
taking into account various rebates and concessions). Thus, there Is enormous
loss of revenue due to various concessions and rebates. For example. in the
Budget for 2012-13, tax foregone or revenue foregone under corporate tax on
account of rebates and concessions was estimated at Rs. 51,000 crores for the
year 2011-12. Similarly, it was over .Rs. 35,000 crores for income tax nearly
2.12,000 for excise duties and nearly 2,76,000 crores for customs duties.
The exemptions and incentives in the tax laws, which result in tax
expenditures. distort resource allocation by impinging upon the efficiency of the
market. Further, they complicate the tax laws, increase litigation and raise the
compliance cost for the taxpayers and the tax administration. Tax incentive. and
exemptions are being continuously reviewed so as to eliminate or provide a sunset
cause to those that have outlived their rationale. A tax expenditure statement
enables a more informed public debate on the efficacy of exemptions and
discourages entrenched groups from demanding incentives in perpetuity. The
Government has been estimating tax
expenditure by preparing what called the statement on Revenue forgone. in its
quest for improving the fiscal health of the ‘economy. the government has also
prepared a “Statement of Revenue Foregone’ (Tax Expenditure Statement) to
track the impact of exemptions and rebates on the tax revenues collected by the
government. It has been estimated that the revenue foregone is over 50 per cent
of gross tax Collections.
GOVERNMENT EXPENDITIJRE
Government Expenditure is the other Important component of fiscal policy which
involves a detailed Study. The budgeted expenditure during a year can be split In
two Parts, viz. (a) plan expenditure, and (b) non-plan expenditure. Plan
expenditure consists Of budget provisions for those schemes .or programmes that
have been included in the five Year Plan In a Five Year Plan, the financial
allocations between different heads are made for a period of live years. Within
these broad parameters annual allocations are made in the budget. Non-Plan
expenditure is a generic term. it Includes both developmental and on
developmental expenditure. Part. of the expenditure is obligatory in nature, e.g.
interest payments; charges and statut9Y transfers to States. part of the expenditure
Is an essential obligation of the State e.g. defence and internal security. More
importantly, expenditure on maintaining those assets created in previous plans is
also treated as non-plan expenditure. Similarly, expenditure on continuing
services and activities at levels already reached In the plan period is shifted to
Kalyan's www.OnlineIAS.com
Kalyan's www.OnlineIAS.com 151

www.OnlineIAS.com [email protected]
www.OnlineIAS.com
non-plan in the next plan e.g. educational and health facilities, continuing
research projects and operating expenses of power stations. Thus, as more plans
are completed, a large amount of expenditure on operation and maintenance of
facilities and services created gets added to non-plan expenditure besides the
interest on government borrowings to finance the plan. Thus, as our plan size
grows, expenditure under the -non-plan category grows larger.
Non-Plan expenditure has been the focus of considerable .criticism from
many quarters. Though much of the criticism and mainly on the premise that we
have to learn to manage within our. plan expenses, a more detailed study’ of non-
plan expenditure shows that many of the constituent items, though not directly
productive In the short run, are vital for the long-term developmental and social
goals of the economy. For example, expenditure on the maintenance of assets,
though not reckoned as plan expenditure. is as crucial to the success of a plan as
the expenditure on the plan schemes themselves. Sometin.es this is overlooked
with the result that while new roads are constructed, new schools opened and new
irrigation projects set up out of the plan funds, these roads are not maintained. the
schools are neglected. and the irrigation projects are not properly in the absence
of maintenance grants for recurring expenditure, thus defeating the very purpose
for which the plan expenditure was originally incurred. In recent years. the
distinction between plan and non-plan expenditure has become an issue of serious
debate and the government has been thinking in terms of doing away with this
distinction as there Is no such distinction laid
down in the Constitution. it is felt that removal of this distinction would provide
the much ; needed flexibility use of funds.
Over the years, the growth in non-plan expenditure has been much higher
compared to plan expenditure. But, this growth in non-plan expenditure has been
mainly on account unprecedented increase in such unproductive items of non-
plan expenditure as Interest payments, subsidies, defence and civil administration
The composition of central government expenditure has become highly
rigid and prone to large, pre-committed Increases. interest payments. defence,
internal security, major subsidies, salaries., allowances and pension and non-plan
grants to Stales account for about 95 per cent of the non-plan expenditure and
about 70 per cent of the total expenditure.
Rise In overall expenditure of the government both plan and non-plan, Is
no doubt a logical corollary of the rise commitments of a modern welfare State.
But the rate at which particularly the non-plan expenditure has been rising and
the composition of this expenditure has now started sending alarm signals by way
Kalyan's www.OnlineIAS.com
Kalyan's www.OnlineIAS.com 152

www.OnlineIAS.com [email protected]
www.OnlineIAS.com
of a high fiscal deficit and rising interest burden of the government As a
proportion of GDP. Total expenditure of the central government was 14.1 per
cent of GDP in 2010-2011.
POLICY ON EXPENDITURE MANAGEMENT
Public expenditure management is an integral part of fiscal reforms. The
Government has taken a series of Initiatives in this regard, like avoiding rush of
expenditure though releases in a time sliced manner; simplification of procedures:
special drive to bring down outstanding ‘unspent balances’ and ‘utilization
certificates’ from Stales and other implementing agencies: instructions that
prohibit relaxation of conditionality attached to transfer of funds under Plan
schemes: revision of General Financial Rules to ensure transparency,
competition,- fairness and objectivity in the
Procurement/bidding processes in the Government.
The Government has targeted to raise the level of public spending in
education to at least 6 per cent of GDP and on health to at least 2-3 per cent of
GDP in a phased manner. It attaches high priority to the development and
expansion of physical infrastructure like roads, highways, ports, power, railways,
water supply, sewage treatment and sanitation through higher public investment,
even as-the role of the private sector is expanded. This has to be accomplished in
an overarching framework of fiscal consolidation.
An Important Objective of the FRBMA is that public expenditure must be
oriented for creation of productive assets .Given the existing classification
expenditure. plan expenditure and capital expenditure is arguably the closest
approximation to expenditure for creation of produce assets.
As a proportion of GDP, plan revenue expenditure has remained In the
range of 2 to 3 percent.
Non-plan revenue expenditure mainly comprises of Interest payments,
defence expenditure subsidies, wages and salaries pensions, transfers and other
consumption expenditure of the Government which has traditionally appropriated
bulk of the revenue receipts.
The Finance Ministry issued directives to a ministries, instructing them to
send monthly expenditure Plans and quarterly expenditure allocations for all
demand for grants to the cash management cell. Government has taken steps
Kalyan's www.OnlineIAS.com
Kalyan's www.OnlineIAS.com 153

www.OnlineIAS.com [email protected]
www.OnlineIAS.com
including 10 per cent mandatory cut on non plan expenditure and measures like
rationalization of expenditure and optimization of available resource.
Subsidies
Three major subsidies of the Centre are food, fertilizers and petroleum.
Food subsidy as a fiscal policy tool seeks to serve two separate and potentially
conflicting objectives of protecting producers’ interest through payment of
‘remunerative’ prices and also keeping prices stable/low for consumers. With the
inefficiencies and rent seeking associated with the public provision of goods and
services, the Income transfer to poor Consumers through a unit ’increase in
subsidy goes down. A recent study’. “Performance Evaluation of the Targeted
Public Distribution Systems by the Programme Evaluation Organisation,
Planning Commission has estimated that to transfer Re. 1 to the poor.
Government spends Rs. 3.65 In the form of food subsidy, indicating that cash or
near
Cash transfer could lead to large welfare gains for the poor. With the
unprecedented rise In the international prices of petroleum, given the sizeable
production through high cost feedstock in urea units, fertilizer subsidy has also
riser, sharply.
A paper prepared by the National institute of Public Finance and Policy
estimates the quantum of total subsidies (recovered costs in the provision of. non-
public goods). are analyses three major explicit subsidies provided by the
Government. viz., subsidies on food, fertilizers and petroleum products (LPG for
domestic use and kerosene for PDS)
The Union Budget 2012-13 ha proposed the following in respect governments
fiscal policy:
1. Amendments to the FRBM Act.
2. Central subsidies to be kept under 2 per cent of GOP and to be down further to
175 per cent over the next three years
3. New concepts of Effective Revenue Deficit and Medium Term Expenditure
Framework introduced.
The government has been struggling to contain monetary subsidy burden
particularly subsidy on diesel and LPG as these are contributing to high fiscal
deficit.
Kalyan's www.OnlineIAS.com
Kalyan's www.OnlineIAS.com 154

www.OnlineIAS.com [email protected]
www.OnlineIAS.com
Effective revenue deficit is the difference between revenue deficit and
creation of capital assets. This will help in reducing the consumptive component
of revenue deficit and create space for increased capital expenditure.
Medium term expenditure framework statement will set forth a three-year
rolling target for expenditure indicators. It will help undertaking a de-novo
exercise for allocating resources for prioritized schemes and weeding out others
that have outlived their Utility. It will also encourage efficient expenditure
management.
Cash Subsidy Model
The government, has prepared a cash subsidy model under which
recipients of subsidized cooking gas, fertilizer and kerosene w get direct cash
transfers while Stale governrnent will work out a policy for providing cash
subsidy for ke4sene. These are the key recommendations of the task force chaired
by UIDAI chairman Nandan Nilekani to Suggest ways to plug leakages In the
current subsidy framework (or kerosene, LPG and fertilizer.
Listing out the benefits of a direct subsidy regime, the task force debates
that a direct subsidy transfer framework facilitates monitoring the subsidy
transactions carried out at different levels and provides a powerful reconciliation
and social audit mechanism.
The government spends over Rs 70,000 crore a year on providing kerosene.
fertilizer and cooking gas at below market rates The purpose of direct subsidy is
to ensure that it reaches the targeted beneficiaries.
The task force has charted out a three-step plan to switch to direct subsidies
which can be transferred through banks, ATMs, post offices or mobile banking.
An IT platform or Aadhar or unique identity Cards will lo it backbone o the direct
subsidy
regime .It has suggested setting up an IT d*n Core Subsidy Management Platform
that would automate al business processes and maintain bookkeeping information
on entitlement and Subsidies for all beneficiaries
In the first phase, the task force has Suggest taking up the Petroleum
Ministry’s recommendation to unit the numbers of subsidy LPG cylinders that
are given to beneficiary’s the second phase, it has called for cash transfer of
Subsidies to bank account, while in the final stage, has suggested segmentation
and getting of intended beneficiaries.
Kalyan's www.OnlineIAS.com
Kalyan's www.OnlineIAS.com 155

www.OnlineIAS.com [email protected]
www.OnlineIAS.com
similarly In the case of fertilizer, the par has recommended improving
transparency across the supply chain by provide information on the manufacturer.
Distributer and retailer. In the second phase, the government can directly transfer
cash subsidy to the retailer’s bank account, and in the third phase it can transfer
It to the famer’s bank account. —
The task form feels that the system of Subsidies is more complicated in the
case Kerosene due to its distribution channel, and calls for wider consultation
with states and reforms In the public distribution system. It has recommended
direct transfer of subsidy through State m Phase-i and to .the beneficiary’s
account in Phase-II. The task force has recommended pilot projects In Seven
States - Tamil Nadu, Assam, Maharashtra, and Haryana. Delhi, Rajasthan and
Orissa be carried out over the next six months.
CONDITIONAL Cash Transfers (CCTs) are a new buzzword in policy
circles. The idea is to give poor people dash conditional on good behaviour such
as sending children to school. This helps to score the goals in one shot: poor
people get some income support, and at the same time, they take steps to lift
themselves out of poverty.
CCT enthusiasm, however, is often based on a superficial reading of the
Latin American experience. In Brazil, Mexico and Other pioneers of this
approach, CCTs were Used to bring into the fold of health and education services
a fringe of marginalised households. in a situation where a large majority of the
population was already covered by extensive social insurance systems. CCT
basically an incentive and, predictably enough. it often works: if you pay people
to do something that benefits them anyway. They tend to do it. It is the same
principle as scholarships for disadvantage children. incidentally, there is no
evidence that scholarships - that is. conditional cash transfers - Work better than
“conditional kind transfers” like school meals or free bicycles for girls
Who complete class 8.
What is remarkably dangerous. however. is the illusion that CCTs can
replace Public Services by enabling recipients to buy health end education
services from Private. Providers. This Is not how CCTs work in. say. Brazil or
Mexico. In Latin America, CCTs are usually seen as a complement. not a
substitute, for public provision of health. education and other basic services. The
incentives -k because the services are there
in the first place.
Kalyan's www.OnlineIAS.com
Kalyan's www.OnlineIAS.com 156

www.OnlineIAS.com [email protected]
www.OnlineIAS.com
In India. these basic services are still missing to a large extent, and CCTs
ale no Substitute.
Consider, for Instance, healthcare, in Brazil. basic health service such as
immunisation. antenatal care, and skilled attendance at birth are virtually
universal. The state has don. Its homework - almost half of al health expenditure
in Brazil Is public expenditure, compared with barely one quarter (of a much
lower total) in India. In this situation, providing incentives to complete the
Universalization of healthcare seems quite sensible. In India. however, public
health services are virtually non - existent, and it would be very unwise to think
that CCT- type programmes like the Rashtriya Swasthya Bima Yoiana (RSBY)
can fill the gap.
Another contextual difference, mentioned earlier, is that Latin American
countries tend to have highly developed social insurance systems, with wide
coverage. ‘Targeting CCTs to marginalised groups In such a situation makes
some sense, because the bulk of the population is already covered and the rest is
(relatively) easy to identify. In India, however, large sections of the population
are In dire need of social support, and the experience with, targeting Is quite
sobering. Indeed, every known method of Identifying (Below Poverty line)
households Involves large exclusion errors. This Is an unresolved Issue for any
targeted CCT initiative in India.
In short, a nuanced approach is required for designing of social security
transfers. CCTs are useful in some circumstance: scholarships are one example.
In others situation, like pension for windows and the elderly, there is a case for
unconditional cash transfers. Conditional transfers in kind, such as midday meals
in primary schools. also have a role Finely, there Is a place for unconditional
transfers in kind, such as the Public Distribution System (PDS).
A wholesale transition from the PDS to cash transfers bi rural India would
be misguided and at the very least premature. For poor people, food entitlements
have several advantages over cash transfers. First, they. are inflation-proof unlike
cash transfers that can be eroded by local price increases, even if they are indexed
to the general price level Second, food tends to be consumed wisely and
sparingly: cash on the other hand. Can easily be misused Third, food is shared
equitably with the family while cash can easily be Cornered by selfish
individuals. Fourth. the POS network has a much wider reach than the banking
system. In remote areas. where the for social assistance is the greatest, banking
facilities are simply not ready for a system of cash transfers (as it is.. they are
unable to cope With NREGAS wage payments). Last but not least, cash transfers
Kalyan's www.OnlineIAS.com
Kalyan's www.OnlineIAS.com 157

www.OnlineIAS.com [email protected]
www.OnlineIAS.com
are likely to bring In their trail predatory commercial interests and exploitative
elements, eager to sell alcohol, branded products. fake insurance policies or other
items that would contribute very little to people’s nutrition or wellbeing.
Of course, cash transfers have their advantages too: they have lower
transaction Costs are (Potentially) more convenient for migrant labourers, and
may be easier to monitor. Sometime in the future. when the banking system has
a wider reach and the food security problem has been resolved, a cautious
transition to Cash transfers may be advisable. For Kerosene, cash transfers can
bring to an end the Kerosene mafia and cartel. For fertilizers, cash subsidies
would mean that only the farmer benefits and not the industry also as at Present.
Besides, cash can be used by the former to buy best quality fertilizer.
The most common argument for cash transfers is that cash makes it
possible to satisfy variety of needs (not just food), and that people are best judges
of their own priorities.
Direct Benefit Transfer (DBT)
The DBT plan was introduced on 1 January 2013 with seven’ schemes m
20 districts. 1nia has embarked on a OBT. scheme in selected districts where in
it has been. envisaged that benefits such as scholarships, pensions, and
MGNREGA (Mahatma Gandhi National Rural Employment Guarantee Act)
wages will be directly credited 10 the bank or post office accounts of identified
beneficiaries. The DBT scheme will not substitute entirely for delivery of public
services for now. It will replace neither food and kerosene subsidies under the
TPOS nor fertilizer subsidies. The OST is designed to improve targeting, reduce
corruption, eliminate waste. control expenditure, and facilitate reforms Electronic
transfer of benefits is a simple design change and transfers that are
already taking place through paper and cash mode wilt 110W be electronic
transfers. This has been enabled by rapid roll out of Aadhar (Unique Identity)
now Covering 200 million people and rapidly growing to cover 600 million
(nearly half of our Population), With the National Population Register covering
the other half of the Populace The DBT in tandem with such unique identification
will ensure that the benefits reach the target groups faster and minimize Inclusion
and exclusion errors as Well a Corruption that are associated with manual
processes.
Accrual Accounting In Government
Kalyan's www.OnlineIAS.com
Kalyan's www.OnlineIAS.com 158

www.OnlineIAS.com [email protected]
www.OnlineIAS.com
Traditionally; India has followed a cash-based system for accounting and
financial reporting. A cash-based system Is simple, and recognizes a transaction
When Cash is paid or received. This system at accounting. however, is not the
most informative way of presenting government accounts. It Is limited In scope
because it lacks an adequate framework for accounting of assets and liabilities,
depicting consumption of resources and full picture of government’s financial
position at any point of time. Importantly, capital expenditure under the cash
system is brought to account only In the ={year In Which a purchase or disposal
of an asset Is made. An asset once acquired is.; expensed In the same ye& and
only progressive figure of expenditure remains in the book of accounts. The
present system also fails to reflect accrued liabilities. Because of these
weaknesses, the .exlstu4 accounting system does not capture the long-term
Impact of the decisions taken and promotes a bias In favour of short-term policies.
As such, the government, on the advice of CAG, has decided to switch over from
cash-based accounting to accrual based accounting to bring about transparency
and user friendliness.
14th Finance Commission
The 14th Finance Commission was constituted on 2nd January 2013 under
the
Chairmanship of Dr. Y. V. Reddy, former RBI Governor. Other members at the
commission are (i) Professor Abhijit Sen (ii) Ms. Suhma Nath (iii) Dr. M.
Govinda Rao
(iv) Dr. Sudipto. Mundle.
The following are the broad Terms of Reference and the matters to be taken
into consideration by the 14th Finance Commission in making the
recommendations:
(i) the distribution between the union and states of the net proceeds of axes which
are to be, or may be, divided between them under Chapter 1, Part XII of the Cons
tuition and the allocation between the states of the respective shares of such
proceeds
(ii) the principles which should govern the grants-hi-aid of the revenues 01 the
states out of the Consolidated Fund of India and the 5ijm3 to be paid to states
which are in need of assistance by way of grants-In-aid of the revenues under
article 275 of the Constitution for purposes other than
Kalyan's www.OnlineIAS.com
Kalyan's www.OnlineIAS.com 159
www.OnlineIAS.com [email protected]
www.OnlineIAS.com
Specified in the provisos to clause (1) of that article; and
(iii) measures needed to augment the Consolidated Fund of a state supplement
the resources of the Panchayati and municipalities in the state on the basis of the
recommendations made by the Finance Commission of the state.
The Commission has been mandated to review the state of finances, deficit,
and Debit levels of the union and states and suggest measures for maintaining a
stable and sustainable fiscal environment consistent with equitable growth
Including Suggestions to amend the FRBMAs currently in force the commission
has been asked to consider and recommend Incentives and disincentives for states
for observing the obligations laid down in the FRBMAS in making its
recommendations the Commission inter alia is required to consider
(a) The resources of the central government and the demands on the resources of
the central government;
(b) The resources of the state governments and demands on such resources under
different heads, including the impact of debt levels on resource availability In
debt-stressed states;
(C) the objective of not only balancing the receipts and expenditure on revenue
account of all the states and the union but also generating surpluses for capital
Investment;
(d) the taxation efforts of the central government and each state government and
the potential for additional resource mobilization;
(e) the level of subsidies required for sustainable and inclusive growth and
equitable sharing of subsidies between the central and state governments;
(f) the expenditure the non-salary component of maintenance and upkeep of
capital assets and the non-wage-related maintenance expenditure on Plan
schemes to be completed by 31 March 2015 and the norms on the base of which
specific amounts are re for the maintenance of capital assets and the manner of
monitoring such expenditure –
(g) the need for Insulating the pricing of public utility services like drinking water.
irrigation Power and public transport from policy fluctuations through Statutory
Provision;
(h) the need for making public-sector enterprises competitive and market
Oriented;
(I) listing and disinvestment; relinquishing of non-priority enterprises
Kalyan's www.OnlineIAS.com
Kalyan's www.OnlineIAS.com 160

www.OnlineIAS.com [email protected]
www.OnlineIAS.com
(j) the need to balance management of ecology, environment, and climate change
Consistent with sustainable economic development and
(k) the impact of the proposed goods and services tax on the finances of the centre
and states and the mechanism for compensation In case of any revenue loss.
The Commission is required to generally take the base of population
figures as of 1971 In all cases where population is a factor for determination of
devolution of taxes and duties and grants-in-aid; however, the Commission may
also take into account the demographic changes that have taken place subsequent
to 1971. It is to review, the present public expenditure management systems in
place including budgeting and accounting standards and practices; the existing
system of classification of receipts and expenditure; linking outlays to outputs
and outcomes; best practices within the country and Internationally and to make
appropriate recommendations thereon.
It is also to review the present arrangements as regards financing of Disaster
Management with reference to the-funds constituted under the Disaster
Management Act 2005 and make appropriate recommendations thereon
It has to indicate the basis on which it has arrived at its findings and make
available-the state-wise estimates of receipts and expenditure.
An Introduction
Economy is a framework, within which economic activities are carried out, which
could be investment, production and consumption etc. The economy of India is
the 10th largest in the world by nominal GDP and the 3rd largest by Purchasing
Power Parity (PPP). On a per capita income basis, India ranked 140th by nominal
GDP and 133rd by GDP (PPP) in 2013, according to the IMF. India is the 17th
largest exporter and the 10th largest importer in the world.
Definition of Economy
Kalyan's www.OnlineIAS.com
Kalyan's www.OnlineIAS.com 161

www.OnlineIAS.com [email protected]
www.OnlineIAS.com
An economy consists of the production, trade of distribution and consumption of
limited goods and services by different agents in a given geographical location.
The economic agents can be individual, businesses, organisations or
governments.
Types of Economy
Following are the types of economy
Traditional Economy In this type of economy, there is very little government
involvement. Allocation of resources here is based on rituals, habits or customs.
Free Market Economy This type of economy also has very little governmental
interference or control. Economic decisions here are made based on market
principles.
Capital Economy In this type of economy, the central problems of economy i.e.,
there is no interference by the government and price mechanism operate through
the forces of demand and supply. In the United States of America, the role of the
government is minimal and thus, it is the best example of market economy.
Socialist Economy All important decisions regarding production, exchange and
consumption of goods and services are made by the government. The closest
example of a centrally planned economy is the Soviet Union for the major part of
the 20th century.
Mixed Economy This type of economy consists of a combination of public sector
and private sector units, It basically incorporate governmental involvement in
market based economy.
Welfare Economy
Kalyan's www.OnlineIAS.com
Kalyan's www.OnlineIAS.com 162

www.OnlineIAS.com [email protected]
www.OnlineIAS.com
Welfare economic analysis the total good or welfare i.e., achieve at a current state
as well as how it is distributed. Amartya Sen received the Nobel Prize in
economic science for his work in welfare economics.
Green Economy
It is one that results in improved human well-being and social equity, while
significantly reducing environmental risks and ecological scarcities. Green
economy is an economy or economic development model based on sustainable
development and a knowledge of ecological economics.
Sectors of Economy
Traditionally, economies are divided into the following three sectors
Primary Sector
This sector is involved in the extraction or harvesting of products from the Earth.
It includes the production of raw materials and basic foods.
Some of the activities included in this sector are as follows
• Agriculture • Mining
• Forestry • Fishing etc
Secondary Sector
The secondary sector of the economy is involved in the production of finished
goods. All manufacturing processing and construction activities lie in this sector.
Some of the activities in this sector are as follows
• Manufacturing e.g., building
• Production e.g., cloth and bread
• Electricity, gas and water etc related works.
Tertiary Sector –
The tertiary sector of the economy is also called as the service sector.
Kalyan's www.OnlineIAS.com
Kalyan's www.OnlineIAS.com 163

www.OnlineIAS.com [email protected]
www.OnlineIAS.com
Some of the activities, which are part of this sector are as follows
• Retail • Transport and communication
• Banking • Entertainment
Tourism • Trade etc
Core Sector
The core sector consists of eight core industries in the Economy having a weight
age of 37.90% in the Index of Industrial Production (IIP). These eight sectors are
coal, crude oil, natural gas, petroleum refinery products, fertilizers, steel, cement
and electricity.
NATONAL INCOME
According to Marshall—”The labour and Capital of a country acting on its
national resources produce annually a certain net aggregate of commodities,
material and immaterial including services of all kinds. This is the true net annual
income or revenue of the country or national dividend . In this definition, the
word ‘net’ refers to deductions from the gross national income in respect of
depreciation and wearing out of machines. And to this must be added income
from abroad.
Fisher made a significant departure and adopted the flow of satisfaction instead
of flow of goods as the index of measurement. According to Fisher, “The national
income consists safely of services as received by ultimate consumers, whether
from their material or from their human environments. Thus, a piano, or an
overcoat made for me this year is not a part of this year’s income, but an addition
to the capital. Only the services rendered to me during this year by these things
are income.”
These definitions bring out the following features about national income:
(1) National income refers to the income of a country.
(2) Its measurement refers to a specified period of time.
(3) It includes all types of goods and services.
Kalyan's www.OnlineIAS.com
Kalyan's www.OnlineIAS.com 164

www.OnlineIAS.com [email protected]
www.OnlineIAS.com
(4) It is expressed in monetary terms. It adds together the value of all final goods
and services produced in a country during a year.
(5) National income reflects the value of final goods and services.
(6) National income measures the values of currently produced goods and
services. It - exclude ‘pure exchange’ transactions such as sale and purchase of
second hand goods or used goods, purchase and sale of securities and transfer
payments.
Keynes Approach to National Income
Keynes suggested three approaches to national income.
(a) Aggregate Expenditure Approach-.- Income is the result of expenditure
Unless somebody spends, nobody will earn any
Income can be measured by taking into account all final expenditures in the
economy. These expenditures are classified into following types.
(i) private consumption expenditure (C), (ii) investment expenditure (I), and (iii)
government purchases of goods and services (G).
(b) Factor Income Approach—factors of production, called inputs, earn income
when a good is produced. These are called Land, Labour Capital and
Entrepreneur. Each type of factor income has a different name — wages, salaries
for labour, rent for land, interest as return on capital By aggregating these factors
income we can find national income.
(c) Sales Minus Cost Approach—Keynes, third approach to national income is
based o aggregate sales minus cost. He states that national income lies between
the ON? and NNP.
Circular Flow of Income
Circular flow of Income and expenditure refers to the process whereby the
national income and expenditure of an economy flow in a circular manner
continuously through time. The various components of national income and
expenditure such as saving, investment, taxation, government expenditure,
exports and imports are shown in form of currents and cross currents in such a
manner that national income equals national expenditure. The structure of macro
economy is given by circular flows of income and output. In fact national income
accounting has its foundation in the model of circular flows which can be depicted
in two sector, three sector, and four sector economy.
Circular Flow of Income in two Sector Economy
Kalyan's www.OnlineIAS.com
Kalyan's www.OnlineIAS.com 165

www.OnlineIAS.com [email protected]
www.OnlineIAS.com
In a simple model involving two sectors namely, household and firm sector
assuming there is no government sector. The economy is a closed one having no
exports or imports and there is no saving by the household, who spend all what
they earn and no investments by firms. Under these presumptions the firm Sector
hires from house hold, the services of factors of production for producing goods
and services and pays them reward in the form of money for rendering the
productive services. For the factors of production these are fader income known
as rent, wages Interest and profit which have been generated in production
process. Thus money income flows from firm sector to the households. The firms,
in turn sell goods and services thus produced to the household sector for its
consumption. Therefore, whatever the firms produce is consumed by the
household.
Now we can derive the following conclusions in the case of Iwo sector economy:
1. Total production of goods and services by firm’s Total consumption of goods
and services by household sector.
2. Factor payments by firms = factor incomes of household Sector.
3. Consumption expenditure of household sector = Income of household sector.
4. Real flows of production and consumption of firms and households = Money
flows of income and expenditure of firms and households.
Introduction of Capital Market (Financial System)_
Financial institutions are intermediaries between savers and investors. All
lending and borrowings are channelled through capital market. Whatever is
earned by the households is not spent on Consumption goods. A part of earning
is saved and deposited in the capital market. Leading to money flow from
household to the capital market. A firm also saves with the aim of meeting cost
Kalyan's www.OnlineIAS.com
Kalyan's www.OnlineIAS.com 166

www.OnlineIAS.com [email protected]
www.OnlineIAS.com
of depreciation and expanding in production capacity.
Thus savings of firms going to the capital market and borrowing by the firms
from the latter also create money flows. It should be kept in mind that savings by
households and firms Constitute a leakages from the circular flow of income
whereas borrowings by the firms for investment purpose become injection.
Introduction of Government Sector: (Circular Flows of Income in a Three
Sector Economy)
We move further by introducing government sector which purchase goods from
firms and factor services from households. Between households and the
government money flows from government to the household when the
government makes transfer payments. Like old age pension, scholarship and
factor payments to the households. Money flows back to the government when
it collects direct (axes from the households. Similarly, there are flows of money
between the government sector and the firm sector when government realizes
corporate taxes from the firms, grants them the subsidies and makes payment
Kalyan's www.OnlineIAS.com
Kalyan's www.OnlineIAS.com 167

www.OnlineIAS.com [email protected]
www.OnlineIAS.com
for the goods purchased by it.
Introduction of External Sector: (Circular Flow of Income in a Four Sector
Economy)
Our model will remain incomplete without converting the closed economy into
an open economy where imports and exports are made. One country exports are
other country’s imports. In case of a country’s imports money flows to the rest of
the world. Whereas in case of exports money flow in from rest of the world. There
is a trade surplus for an economy when it exports exceed imports but the economy
suffers trade deficit when imports exceed exports imports are leakages and
Kalyan's www.OnlineIAS.com
Kalyan's www.OnlineIAS.com 168

www.OnlineIAS.com [email protected]
www.OnlineIAS.com
exports are injections into the Circular flow of income in an economy..
Related Aggregates of National Income
We study below the important concepts of national income viz., the Gross
National Product, Net National Product, National Income, Personal Income,
Disposable Income etc.
1. GROSS NATIONAL PRODUCT (GNP)
Gross National Product is defined as the total market value of all final goods and
services produced in a year including net income from abroad. GNP includes four
types of final goods and services;
(1) Consumer’s goods and services to satisfy the immediate wants of the people.
Kalyan's www.OnlineIAS.com
Kalyan's www.OnlineIAS.com 169

www.OnlineIAS.com [email protected]
www.OnlineIAS.com
(2) Gross private domestic investment in capital goods consisting of fixed capital
formation, residential construction and inventories of finished and unfinished
goods.
(3) Goods and services produced by the Government and
4) Net exports of goods and services, i.e. the difference between value of export
and imports of goods and services known as net export from abroad.
GNP at Market Prices—when we multiply the total output produced in one year
by their market price prevalent during that Year in a country, we get the Gross
National product market price. Thus GNP at market prices means the Gross Value
of final Goods and Services produced annually in a country plus net income from
abroad.
GNP at Factor Cost —GNP at factor cost is the sum of the money value of the
income produced by and accruing to the various factors of production in one year
in a country.
GNP at Factor Cost = GNP at Market Prices Indirect Taxes + Subsidies
2. Net National Product (NNP)
The difference between Gross National Product and depreciation is called NNP.
NNP at Market Prices—it is the net production of goods and services in an
economy during the year. It is the GNP minus the value of capital consumed or
depreciated during the year.
NNP at Market Prices = GNP at market prices— Depreciation.
NNP at Factor Cost—Net National Product at factor cost is the net output
evaluated at factor prices. It includes income earned by factors of production
through participation in the production process, such as wages and salaries, rents,
profits etc. It is also called National Income. This measure differs from NNP at
market prices in that indirect taxes are deducted and subsidies are added to NNP
at market prices in order to arrive at NNP at factor cost.
Thus NNP at factor cost = NNP at market prices — Indirect Taxes + subsidies =
National Income.
Normally, NNP at market prices is higher than NNP at factor cost.
Kalyan's www.OnlineIAS.com
Kalyan's www.OnlineIAS.com 170

www.OnlineIAS.com [email protected]
www.OnlineIAS.com
3. Domestic Income or Product
Income generated or earned by the factors of production within the country from
its Own resources is called domestic income or domestic product. It is defined as
the value of all final goods and services produced by all the enterprises located
within the territory of a country.
Domestic income includes
(I) Wages and salaries
(II) Rents, including imputed house rents
(III) Interest
(IV) Dividends
(V) Undistributed corporate profits including surplus of public sector
undertakings
(VI) Mixed incomes consisting of profits of incorporated forms, self-employed
persons etc. and direct tax.
Since domestic income does not include income earned from abroad, it can also
be shown
Domestic Income = National Income — Net income earned from abroad.
GDP at Market Prices—Goss domestic product at market prices is the value of
all final goods and services at prices prevailing in the market produced in the
domestic territory of a country during a given year. Being gross, it is inclusive of
depreciation. It can be obtained by deducting net factor income from abroad from
GNP at market prices. Thus, GDPMP = GNPMP — Net Factor Income from
Abroad.
GDP at Factor Cost—Gross domestic product at factor cost is the sum total of
earnings received by various factors of production in terms of wages, interest,
rent, profits, etc. within the domestic territory of a country during a year. If we
deduct net indirect taxes from gross domestic product at market prices, we get
gross domestic product at factor cost. Thus,
GDPFC = GDPMP — Net Indirect Taxes
4. Net Domestic Product (NDP)
GDP does not makes allowances of depreciation in the estimation of domestic
product. But the net domestic product makes allowances of depreciation.
Kalyan's www.OnlineIAS.com
Kalyan's www.OnlineIAS.com 171

www.OnlineIAS.com [email protected]
www.OnlineIAS.com
NDP = GDP — Depreciation
NDP at Market Prices (NDPMP)—Net domestic product at market prices is the
value of all final goods and services at prices prevailing in the market produced
in the domestic territory of a Country during a given year after making allowances
for depreciation.
NDPMP = GDPMP - Depreciation
NDP at Factor Cost (NDFC) — Net domestic product at factor cost is the estimate
of the domestic product interms of earnings of factors of production within the
domestic territory of a Country in a year.
NDPFC= GDPFC — Depreciation
5. National Income or Product
National Product or Income refers to the amount of final goods and services
produced by. the nationals of a country. While the concept of domestic product
is geographical in character, the concept of national product relates to nationals
or Citizens of a country. The difference between the factor income received from
abroad and the factor income accruing to foreigners is the net factor income from
abroad. Thus,
National Product = Domestic Product + Net Factor Income from Abroad.
Real Income—Real income is national income expressed in terms of a general
level of prices of a particular year taken as base.
Real NNP= Current year NNP X 100
Current year Index
Per Capita Income—The average income of the people of a country in a
particular year is called per capita income for that year. So, it is national income
divided by population i.e. per capita income for the year 2012
=
National Income of 2012
Population in 2012
Though per capita income is more reliable than GNP for many practical purposes,
this also does not reveal the existence of income inequalities like GNP.
6. National Disposable Income (NDI)
Kalyan's www.OnlineIAS.com
Kalyan's www.OnlineIAS.com 172

www.OnlineIAS.com [email protected]
www.OnlineIAS.com
It is the income from all sources to the residents of a nation for spending on
consumption as well as saving during a year.
NDI = NNPMP + other current transfers from the rest of the world.
Current transfers from the rest of the world may include gifts, cash, consumer
goods and even military equipment.
National disposable income for a country is what the personal disposable income
is for an individual.
7. Private Income (PI)
Private income refers to the current income received from all sources of private
sector consisting of private enterprises and factor owners. It is the total of factor
income (including retained profits of the corporations) from all sources and
current transfers from the government and rest of the world accruing to the private
nsector.
P1 = National Income — Income of Government companies — Savings of Non-
Departmental enterprises + Interest on national debt + Net current
transfers from Govt. + Net current transfers from abroad.
8. Personal Income
Personal income is defined as the sum total of all current incomes received by
persons or households from all sources. It is the income actually received by
persons from all sources in the form of factor incomes and current transfer
payments. Thus,
Personal income = Private income — Undistributed profits of enterprises —
Corporate profits tax — Retained earnings of foreign
companies.
Personal Disposable Income (PDI) —
Personal disposable income is that part of personal income which is available to
the individuals to be used the way they like. In other words, it is the income which
the households can spend on consumption or can save as they desire.
PDI = Personal income — Personal income taxes— Miscellaneous Receipts of
the Government administrative departments.
9. National Income at Current Prices and at Constant Prices
Kalyan's www.OnlineIAS.com
Kalyan's www.OnlineIAS.com 173

www.OnlineIAS.com [email protected]
www.OnlineIAS.com
National income at current prices is the money value of all final goods and
services produced in a country during a particular year expressed at market prices
prevailing in that year.
National income at constant prices, on the other hand, measures the final goods
and set-vices constituting the national Income at the market prices prevailing in
a particular year, which becomes the base year.
Important National income
Aggregates: Summary
GNPMP = Value of all final goods and services produced in the economy + Net
factor income from abroad.
NNPMP = GNPMP — Depreciation.
GNPMP = GNPMP — Net factor income from abroad.
NDPMP= GDPMP — Depreciation = NNPMP – Net factor income from abroad.
GNPMP = GNPMP - Net indirect taxes.
NNPFC = GNPFC - Depreciation = NNPMP — Net indirect taxes = National
income.
GDPFC = GDPMP - Net indirect taxes.
NDPFC = GDPFC — Depreciation.
The Methods of Measuring National Product
The three methods of measuring national product are:
(1) Product method, (2) Income method, (3) Expenditure method
(1) Product Method
In this method two approaches-final product approach and value added approach
are adopted.
Final Product Approach—It is expressed as GDP. According to final product
approach, sum total of market value of all final goods and services produced by
all productive units in the domestic economy in an accounting year is estimated
by multiplying the gross product with market prices.
Kalyan's www.OnlineIAS.com
Kalyan's www.OnlineIAS.com 174

www.OnlineIAS.com [email protected]
www.OnlineIAS.com
Being gross it includes depreciation, being at market price, it includes net indirect
taxes and being domestic; it includes production by all production units within
domestic territory of a country. It includes value of only final goods and Services
Value Added Approach—This method measures contribution of each
producuh1 enterprise to production in the domestic territory of a Country in an
accounting year. According to this method net value added at factor cost by all
the producing units during an accounting year within the domestic territory is
summed UP. This gives us value of net domestic product at factor cost or
domestic income.
Steps Involved
(1) Identifying all the P1Oducing Units in the Domestic economy and classifying
them into the industrial sectors such as primary, Secondary tertiary sector on the
basis of similarity of activities.
(2) Estimating net value added at factor cost by each producing unit deducting
intermediate consumption, depreciation and net indirect taxes from value of
output.
(3) Estimating net value added of each Industrial sector by summing up net value
added at FC of all producing units falling in each industrial sector
(4) Computing domestic income by adding up NVA at FC of all industrial sector.
(5) Estimating net factor income from abroad which is added to domestic income
for deriving national income.
Precautions
(1) Imputed rent of owner occupied houses are included.
(2) Imputed value of goods and services produced for self consumption are
included.
(3) Value of own account production of fixed assets by enterprises, government
and the households.
Thus according to value added method,
GNP= (value of output in primary sector — intermediate consumption) + (Value
of output in secondary sector — intermediate consumption) + (Value of output in
tertiary sector — intermediate consumption) + Net factor income from abroad.
(2) Income Method
Kalyan's www.OnlineIAS.com
Kalyan's www.OnlineIAS.com 175

www.OnlineIAS.com [email protected]
www.OnlineIAS.com
Income Method measures national income from the side of payments made to the
primary factors of production for their productive services In an accounting year.
Thus according to income method, national income is calculated by summing up
of factor incomes of all the normal residents of a Country earned within and
outside the country during a period of one year and income generated is nothing
but the net value added at FC by factors of production which is distributed in the
form of money income among them. Thus if factor income of all the producing
units generated Within the domestic economy are added up, the resulting total
will be domestic income or net domestic product at factor cost (NDPFC)by
adding net factor income from abroad to domestic income we get NNPFC.
GNP is the addition of all factor incomes generated in production of goods and
services. While measuring GDP we must include only those income flows that
originate with the production of the goods and services within the particular time
period. The components of factor income are: (i) Employees’ Compensation, (ii)
Profits, (iii) Rent (iv) Interest, (v) Mixed Income, and (vi) Royalty Profit, rent,
interest and other mixed income are jointly known as operating surplus. Thus,
national income = compensation of employees + operating surplus.
Steps Involved
(I) Identifying enterprises which employ factors of production (labour, capital
and entrepreneur)
(2) Classifying various types of factor payments like rent, interest, profit and
mixed income.
(3) Estimating amount of factor payments made by each enterprise.
(4) Summing up of all factors payments within domestic territory to get domestic
income.
(5) Estimating net factor income from abroad which is added to the domestic
income to derive national income.
Precautions
(1) Sale and purchase of second hand goods are excluded.
(2) Imputed rent of owner occupied houses and production for self-consumption
are included.
(3) Incomes from illegal activities are not included
(4) Direct taxes such as Income tax are paid by employees from their salaries are
included.
Kalyan's www.OnlineIAS.com
Kalyan's www.OnlineIAS.com 176

www.OnlineIAS.com [email protected]
www.OnlineIAS.com
(3) Expenditure Method
GDP can be measured by taking into account all final expenditures in the
economy. There are three distinct types of expenditures as they are committed by
households, firms and Government respectively. These expenditures are
classified into following types ahead:
-
(i) Private consumption expenditure (C)
(ii) Government expenditure (Government purchases of goods and se1ces) (E)
(iii) Investment expenditure (I)
(iv) Net exports (X-M)
Thus, GDP=C+I+G+(X-M)
Steps Involved
(1) Identification of economic units incurring final expenditure
(2) Classification of final expenditure into following components:
(a)’ Private final consumption expenditure
(b) Government final consumption expenditure
(c) Gross final capital formation
(d) Change in stocks
(e) Net exports.
(3) Measurement of final expenditure on the above components.
(4) Estimation of net factor income from abroad which is added to NDPFC.
Precautions
(1) Avoid double counting of goods.
(2) Expenditure on purchase of second hand goods is excluded.
(3) Expenditure on purchase of old share is excluded.
(4) Government expenditure on all transfer payment is excluded.
Difficulties in the Measurement of National Income
Kalyan's www.OnlineIAS.com
Kalyan's www.OnlineIAS.com 177

www.OnlineIAS.com [email protected]
www.OnlineIAS.com
There are various difficulties on estimating national income. The important
difficulties are:
Conceptual Difficulties
(1) Ignoring goods and services not amenable to much measurement.
(2) Ignoring income from illegal activities.
(3) The existence of a large non-monetary sector in the Indian economy makes it
difficult to measure the value of a large part of the national product. A consider
able volume of Output in this country does not at all enter into the market and is
not exchanged for money. It is either consumed by the producers or bartered for
other commodities. These difficulties under-estimate national income
Statistical Difficulties
(1) Non-availability of statistics or inaccurate data overestimates national income
(2) Absence of standard method to calculate capital consumption.
(3) Many .enterprises are engaged in more than one functional enterprise.
(4) Listing final goods and services to avoid double counting. In order to avoid
the double counting, the value of raw materials and half-finished goods produced
and used up in production during the year has to be omitted from production.
Sometimes, the same commodity is partly used as raw material and partly as final
product.
(5) Problems posed by transfer payments like unemployment allowances and
interest on public borrowings.
Significance of National Income in Modern Economic Analysis
(1) Measurement of Inflationary and Deflationary Gap—The Inflationary and
deflationary gap are the results of inconsistencies in certain subtotals relating to
the national product and expenditure aggregates.
(2) Economic Forecasting—the aggregates of income and product are of
strategic significance in forecasting the general level of business activity, the
anticipation regarding government expenditure, fiscal and monetary policies.
(3) Importance in International Field — National Income data is useful in the
international field also for the allocation of quota towards international monetary
institution like IMF and
IBRD.
Kalyan's www.OnlineIAS.com
Kalyan's www.OnlineIAS.com 178

www.OnlineIAS.com [email protected]
www.OnlineIAS.com
(4) Measure of Material Welfare—the data of national income are used as
principal measure of economic growth and development. High level of national
income is considered as the high level of welfare.
(5) Promotion of Research—the analysis of national income focuses attention
on inter industry relationship in the economy and the computation of national
income and output is made through th aggregation of output in all industries.
Outline of the Methodology of National Income Estimation India
Sector Nature of Availability
Data
Description of the
Estimation
Category A—
Agriculture,
Forestry and Logging,
Fishing,
Mining and Quarrying.
Registered
Manufacturing, and
Construction (urban)
CategoryB —
Electricity,
Railways, Air
Transport,
Organized Road
and Water,
Transport,
Annual figures of
commodity- wise
output and prices
and value of
different types of
inputs or input-
output proportion
The actual figures
of all types of
factor earnings
reported in the
annual accounts
of different
companies or
undertakings
Product Approach —
Aggregation of
commodity wise price-
output multip1ications
yield gross value of
output from which
total value of input is
deducted to arrive at
the estimates of value-
added.
Income Approach—
The
employee
compensation,
Kalyan's www.OnlineIAS.com
Kalyan's www.OnlineIAS.com 179
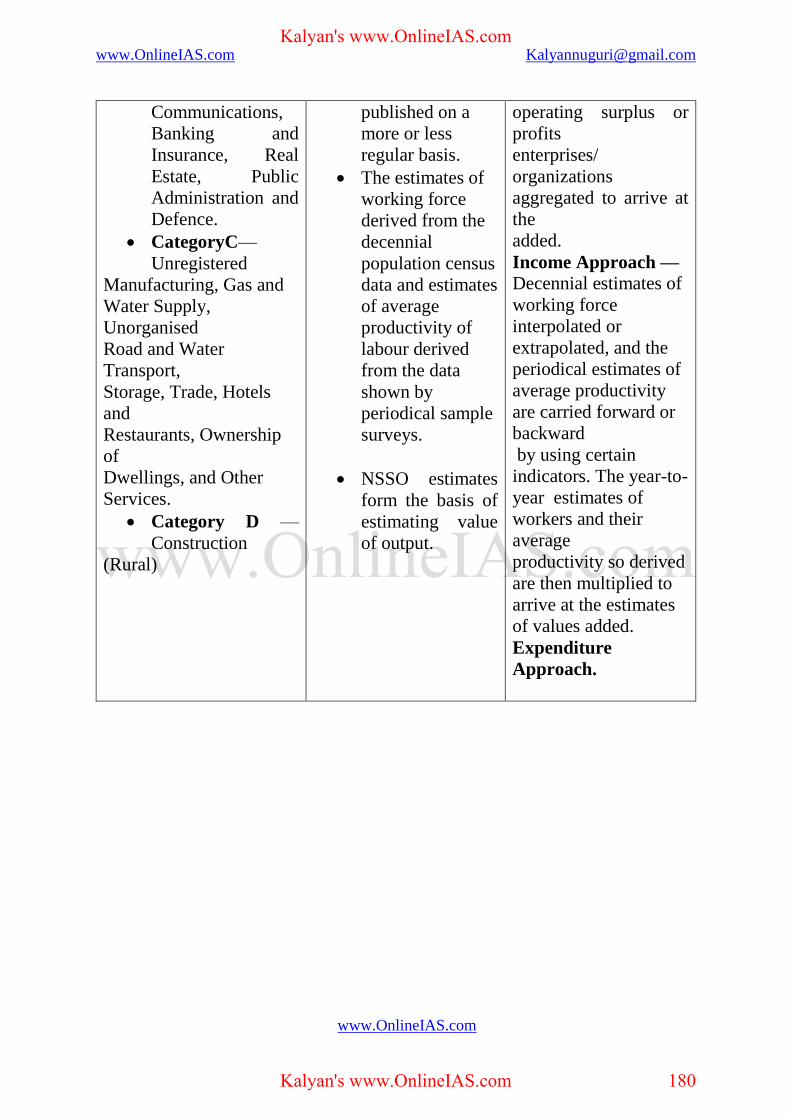
www.OnlineIAS.com [email protected]
www.OnlineIAS.com
Communications,
Banking and
Insurance, Real
Estate, Public
Administration and
Defence.
CategoryC—
Unregistered
Manufacturing, Gas and
Water Supply,
Unorganised
Road and Water
Transport,
Storage, Trade, Hotels
and
Restaurants, Ownership
of
Dwellings, and Other
Services.
Category D —
Construction
(Rural)
published on a
more or less
regular basis.
The estimates of
working force
derived from the
decennial
population census
data and estimates
of average
productivity of
labour derived
from the data
shown by
periodical sample
surveys.
NSSO estimates
form the basis of
estimating value
of output.
operating surplus or
profits
enterprises/
organizations
aggregated to arrive at
the
added.
Income Approach — Decennial estimates of
working force
interpolated or
extrapolated, and the
periodical estimates of
average productivity
are carried forward or
backward
by using certain
indicators. The year-to-
year estimates of
workers and their
average
productivity so derived
are then multiplied to
arrive at the estimates
of values added.
Expenditure
Approach.
Kalyan's www.OnlineIAS.com
Kalyan's www.OnlineIAS.com 180

www.OnlineIAS.com [email protected]
www.OnlineIAS.com
Kalyan's www.OnlineIAS.com
Kalyan's www.OnlineIAS.com 181

www.OnlineIAS.com [email protected]
www.OnlineIAS.com
Kalyan's www.OnlineIAS.com
Kalyan's www.OnlineIAS.com 182