KALUM TIMBER SUPPLY AREA - gov.bc.ca
46
KALUM TIMBER SUPPLY AREA Vegetation Resources Inventory Strategic Inventory Plan PREPARED BY: LM FOREST RESOURCE SOLUTIONS APRIL 20, 2004
Transcript of KALUM TIMBER SUPPLY AREA - gov.bc.ca

KALUM TIMBER SUPPLY AREA
Vegetation Resources Inventory Strategic Inventory Plan
PREPARED BY:
LM FOREST RESOURCE SOLUTIONS
APRIL 20, 2004

VSIP Kalum TSA Page i
March 31, 2004
ACKNOWLEDGEMENTS
Many people contributed to this Kalum TSA Vegetation Resources Inventory Strategic Inventory Plan. Stakeholders who spent the time and effort to guide this plan and share their considerable experience in the Kalum Forest District included: Rick Brouwer, New Skeena Forest Products Inc. Chris Fletcher, MoF Forest Analysis Branch Damian Keating and Steve Vinneage, West Fraser Mills Ltd. Jacques Corstanje, Bell Pole Co. Kevin Kilpatrick, MoF Kalum Forest District Matt Makar, Dick Nakatsu, Sam Otokul, Will Smith, and Keith Tudor of MSRM Del Meidinger, MoF Research Branch, and Dan Bernier, Timberline Forest Inventory Consultants also provided technical guidance on Predictive Ecosystem Mapping. Gordon Nigh, MoF Research Branch, shared his knowledge of growth intercept modeling and stem analysis. Ann Morrison, MoF Resource Information Branch, helped fill in some inventory history gaps. John Wakelin, MSRM Resource Information Branch, and Ken White, Northern Interior Forest Region, provided information on funding direction. Thanks to the many others who contributed to this plan, and the Kalum Forest District for funding the development of this plan.

VSIP Kalum TSA Page ii
March 31, 2004
EXECUTIVE SUMMARY
This draft Vegetation Resource Inventory (VRI) Strategic Inventory Plan (VSIP) for the Kalum Timber Supply Area (TSA) was prepared in consultation with stakeholders in the Kalum TSA. The purpose of the plan is to outline the VRI activities and products needed to address forest management issues identified by the stakeholders. This document may be used by the District Land Base Investment Rationale (LBIR) working group to assist in long term inventory planning. It is recommended that this group review this document prior to the development of a VRI Project Implementation Plan (VPIP) to ensure it meets their business needs. The priority forest management issue identified by stakeholders was to obtain more information on standing volume, particularly decay, in the Kalum Timber Supply Area. This issue was also identified by the chief forester in the 1999 Kalum Timber Supply Review. It was noted in this document that the short and mid term timber supply in the Kalum TSA is very sensitive to uncertainty in existing stand volume estimates. The chief forester recommended that information be gathered that could be used to reflect appropriate timber supply assumptions in the next analysis for existing stand volumes, in particular the amount of decay. The recommended target population for VRI ground sampling is composed of stands over 120 years old within the operable landbase of the Kalum TSA, exclusive of large, contiguous tracts of non-productive (NP) area, such as alpine types. Similarly, the target population for new VRI photo-interpretation includes all stands within the operable landbase, exclusive of large, contiguous tracts of NP. Sample polygons should be selected over the entire target population using probability proportional to size with replacement (PPSWR) sampling. Net Volume Adjustment Factor (NVAF) sampling is recommended for implementation in association with VRI ground sampling. A PEM validation is recommended for implementation in parallel with VRI ground sampling. Other activities that might be considered to address the stakeholders’ business needs are: an inventory attribute adjustment, a re-analysis of a 1988-89 loss factor study, and a breakage factor study. A VRI Project Implementation Plan (VPIP) will be completed following discussion and approval of this VSIP. The VPIP will provide the details for the implementation of VRI ground sampling in terms of geographic areas, scheduling, priorities, plot location coordination, estimated inventory costs by year, and roles and responsibilities.

VSIP Kalum TSA Page iii
March 31, 2004
TABLE OF CONTENTS ACKNOWLEDGEMENTS ............................................................................................................................. I EXECUTIVE SUMMARY.............................................................................................................................. II 1. INTRODUCTION ................................................................................................................................. 1 1.1 Scope and Objectives ................................................................................................................... 1 1.2 Vegetation Resources Inventory Overview................................................................................. 1 1.3 VRI Overriding Principles ............................................................................................................. 2 1.4 VRI Planning................................................................................................................................... 2 1.5 Funding........................................................................................................................................... 3 2. BUSINESS CONSIDERATIONS ......................................................................................................... 5 2.1 Landbase ........................................................................................................................................ 5 2.2 Inventory History ........................................................................................................................... 7 2.3 Inventory Audit............................................................................................................................... 7 2.4 Forest Management Issues .......................................................................................................... 8 2.5 VRI Activities and Products........................................................................................................ 13
2.5.1 Parallel Activities and Products............................................................................................. 17 2.5.2 Other Activities and Products................................................................................................ 19
3. INVENTORY PLAN ........................................................................................................................... 22 3.1 Overview....................................................................................................................................... 22 3.2 Phase I Photo Interpretation....................................................................................................... 23
3.2.1 Objectives ............................................................................................................................. 23 3.2.2 Target Area ........................................................................................................................... 23 3.2.3 Target Attributes.................................................................................................................... 23 3.2.4 Methods ................................................................................................................................ 23
3.3 Phase II VRI Timber Emphasis Plots ......................................................................................... 23 3.3.1 Inventory Objectives.............................................................................................................. 23 3.3.2 Target Population.................................................................................................................. 24 3.3.3 Sample Size .......................................................................................................................... 24 3.3.4 Sample Selection .................................................................................................................. 24 3.3.5 Sampling Approach............................................................................................................... 24 3.3.6 Net Volume Adjustment Factor Sampling............................................................................. 24 3.3.7 Within Polygon Variation Sampling ....................................................................................... 25 3.3.8 Implementation ..................................................................................................................... 25
3.4 Project Implementation Plan ...................................................................................................... 26 3.5 Roles and Responsibilities ......................................................................................................... 26 3.6 Costs............................................................................................................................................. 27 BIBLIOGRAPHY ........................................................................................................................................ 29 APPENDIX I – STAKEHOLDERS.............................................................................................................. 31 APPENDIX II – GLOSSARY OF TERMS................................................................................................... 32 APPENDIX III – APPROVAL/SIGNING...................................................................................................... 36 APPENDIX IV – VEGETATION RESOURCES INVENTORY (VRI) UPDATE 2002.................................. 37
LIST OF FIGURES
Figure 1 Kalum Forest District .......................................................................................................................5
LIST OF TABLES Table 1 Kalum TSA landbase........................................................................................................................6 Table 2 Kalum TSA Timber Harvesting Land Base by Dominant Species....................................................7 Table 3 Forest Management Issues for the Kalum TSA as they relate to VRI. .............................................9 Table 4 Estimated sample sizes and costs for VRI activities in the Kalum TSA .........................................27 Table 5 Estimated costs for parallel activities and other activities in the Kalum TSA..................................28

VSIP Kalum TSA Page 1
March 31, 2004
1. INTRODUCTION
1.1 Scope and Objectives
This Vegetation Resources Inventory (VRI) Strategic Inventory Plan (VSIP) outlines VRI activities and products needed to address forest management and inventory issues in the Kalum Timber Supply Area (TSA), as identified by stakeholders at a meeting on March 5, 2004. The VSIP provides strategies for photo interpretation, timber emphasis ground sampling, monitoring, and associated research projects in the TSA. Once the VSIP is approved, the next step is to prepare and implement a project implementation plan (VPIP) LM Forest Resource Solutions prepared this report in consultation with the Kalum TSA stakeholders. These stakeholders included:
o Ministry of Forests (MOF) o Ministry of Sustainable Resource Management (MSRM) o Bell Pole Co. o New Skeena Forest Products Inc. o West Fraser Mills Ltd.
This draft VSIP will be reviewed by stakeholders and discussion and comments will be incorporated into the final VSIP.
1.2 Vegetation Resources Inventory Overview
The Vegetation Resources Inventory is designed to answer two questions: 1. Where is the resource located? 2. How much of a given vegetation resource (for example, timber or coarse woody debris) is within an inventory unit? The Vegetation Resources Inventory is carried out in two phases. Phase I (Photo Interpretation) involves estimating vegetation polygon characteristics, from existing information, aerial photography, and other sources. No statistical based ground sampling is done in Phase I. Phase II (Ground Sampling) provides the information necessary to determine how much of a given characteristic is within the inventory area.

VSIP Kalum TSA Page 2
March 31, 2004
Ground samples alone cannot be collected in sufficient numbers to provide the specific locations of the vegetation characteristics being inventoried. Ground measurements are used to estimate population attributes. The relationship between the attributes from the photo estimates and ground samples is used to adjust the Phase I, photo-interpreted polygon estimate. Population attributes are used to adjust the description for each polygon.
1.3 VRI Overriding Principles
VRI procedures are being implemented throughout the province. Implementation is guided by the following principles:
o The need to satisfy business needs as defined in the VSIP and VRI Project Implementation Plan (VPIP) documents. The VPIP identifies priorities and spatial location of VRI activities.
o The need to develop spatial VRI products using a structured methodology (e.g., implement photo interpretation activities by groups such as mapsheets or watersheds, and estimate all attributes listed in the photo interpretation manual).
As a result of funding changes, the original plan to implement the District based Provincial VRI has not been realized. Instead of a co-coordinated, systematic approach to completing the Provincial VRI, the program has largely been unfolding on a business needs basis within specific management units or sub-units. This latter approach provides a cost effective option in addressing key local planning business issues. It will not, however, provide timely and accurate information for provincial reporting. For more information on the progress of the implementation of the VRI program, see Appendix 8. VRI standards will be used when implementing inventories in accordance with the Forest Resources Commission 1991 report The Future of Our Forests. Issues noted in the Commission report included inadequate provincial forest inventories, a lack of precision statements for these inventories, inadequate non-timber information, and a narrow focus on commercial timber volume and the operable landbase.
1.4 VRI Planning
MSRM’s Resource Inventory Branch has developed a business planning process for VRI photo interpretation and ground sampling projects. The VRI planning process involves developing VSIPs and VPIPs that identify specific management issues, desired inventory products and activities, and

VSIP Kalum TSA Page 3
March 31, 2004
relative priorities. A VSIP broadly outlines the VRI activities and products needed to address the identified forest management issues. The VPIP identifies operational details of the project. VRI activities fall under the realm of government’s defined forest area management (DFAM) initiative. Under DFAM, the responsibility to conduct timber supply analysis within TSAs will become the collective responsibility of BC Timber Sales (BCTS) managers and the holders of replaceable forest licenses (the DFAM group) within a TSA. The Chief Forester will continue to be responsible for determining AACs for TSAs (and TFLs) in accordance with Section 8 of the Forest Act. DFAM groups will be responsible for preparing a data package, timber supply analysis, and key information that is considered by the chief forester in the AAC determination. Government will continue to set and enforce the standards. The DFAM group is responsible for developing all phases of the VRI planning process (VSIPs and VPIPS). MSRM is responsible for developing minimum standards for the planning of VRI projects, data capture, and audit. In addition, MSRM is responsible for reviewing VPIPS to ensure the information is being collected to known standards, while the MOF is responsible for reviewing the plan to ensure that their business needs have been addressed. These plans must be signed off by both MSRM and MOF. The VPIP more specifically identifies the needs for VRI management inventories, and provides the details for implementation of the VRI in terms of geographic areas, scheduling, priorities, plot location coordination, estimated inventory costs by year, and roles and responsibilities. For more information on Vegetation Resources Inventory planning, visit the VRI Planning page at http://srmwww.gov.bc.ca/tib/vri/vri/lifecycle/plan.html.
1.5 Funding
Funding for VRI activities under DFAM is a licensee responsibility that, in the Kalum TSA, is addressed by a Land Base Investment Rationale (LBIR) working group. The licensee driven group addresses priorities as identified in the Land Based Investment rationale (LBIR) through Forest Investment Account (FIA) funding. Funding for activities previously the responsibility of government will be provided through the FIA Land Base Investment program (LBIP) during an indefinite transition period. FIA allocations for 2004 have been reduced from 2003, although VRI has been recognized as a priority activity for the fiscal year. Ultimately, licensees will be expected to undertake co-operative investment planning

VSIP Kalum TSA Page 4
March 31, 2004
and execute cost-effective activities related to forest productivity, resource information and natural resource sustainability. It is government’s intention that businesses invest in the necessary information, infrastructure, and human capital to run their business effectively. Given the two year time frame of activities set in this plan, any start later than 2004-2005 could jeopardize key outcomes of the plan, particularly in providing the Chief Forester with the best available information prior to the next AAC determination (set for November 2007). The FIA Forest Science Program (FSP) (previously known as the Forestry Innovation Investment) is another potential funding source for the activities outlined in this VSIP. VRI, particularly the aspects of research into existing stand volumes and decay, may be eligible for funding under the FSP. Research in the area of existing stand volumes, particularly decay, could result in the establishment of more effective policies, regulations and guidelines and enhance the quality of decision making through an improved knowledge base. Other funding options may be available through alternative provincial, federal, or other agencies. Under DFAM, there are no specified requirements for completing new inventories for the timber supply review. As in the past, the review will reflect the best available information. The activities outlined in this VSIP, therefore, represent an investment opportunity for DFAM groups. Significant outcomes resulting from the completion of these activities include:
o Better information on standing volume, particularly decay, in the Kalum TSA that could impact the next AAC determination in 2007.
o New loss factor information that could be presented to the Revenue Branch to encourage stumpage rates that better reflect the unrecoverable decay in trees.
o Better information for planning. In the absence of outside agency funding, the DFAM groups are encouraged to enter into partnerships to minimize the costs associated with the implementation of the activities outlines in this plan.

VSIP Kalum TSA Page 5
March 31, 2004
2. BUSINESS CONSIDERATIONS
2.1 Landbase
Figure 1 Kalum Forest District
The Kalum TSA lies within the Northern Interior Forest Region and is administered from the Kalum Forest District office in Terrace. The Kalum TSA comprises a total of 539 319 hectares centred on the community of Terrace. The TSA is bordered by the Nass, Kispiox, North Coast and Bulkley TSAs, as well as two Tree Farm Licenses (TFL 1 and TFL 41). Adjacent to the TSA are several parks, including the Nisga’a Memorial Lava Bed Provincial Park, the Lakelse Lake Provincial Park, the Exchamsiks River Provincial Park and the Gitnadoix River Recreation Area (See Figure 1).
VSIP Kalum TSA Page 6
March 31, 2004
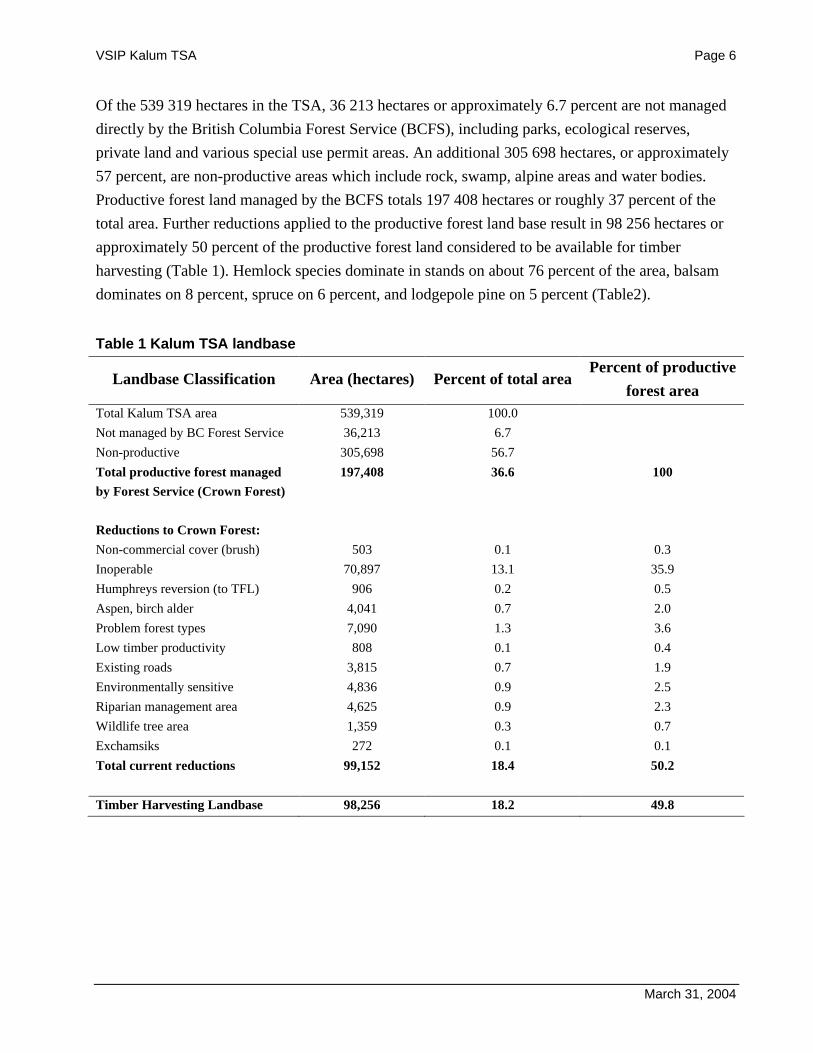
Of the 539 319 hectares in the TSA, 36 213 hectares or approximately 6.7 percent are not managed directly by the British Columbia Forest Service (BCFS), including parks, ecological reserves, private land and various special use permit areas. An additional 305 698 hectares, or approximately 57 percent, are non-productive areas which include rock, swamp, alpine areas and water bodies. Productive forest land managed by the BCFS totals 197 408 hectares or roughly 37 percent of the total area. Further reductions applied to the productive forest land base result in 98 256 hectares or approximately 50 percent of the productive forest land considered to be available for timber harvesting (Table 1). Hemlock species dominate in stands on about 76 percent of the area, balsam dominates on 8 percent, spruce on 6 percent, and lodgepole pine on 5 percent (Table2).
Table 1 Kalum TSA landbase
Landbase Classification Area (hectares) Percent of total area Percent of productive
forest area Total Kalum TSA area 539,319 100.0 Not managed by BC Forest Service 36,213 6.7 Non-productive 305,698 56.7 Total productive forest managed by Forest Service (Crown Forest)
197,408 36.6 100
Reductions to Crown Forest: Non-commercial cover (brush) 503 0.1 0.3 Inoperable 70,897 13.1 35.9 Humphreys reversion (to TFL) 906 0.2 0.5 Aspen, birch alder 4,041 0.7 2.0 Problem forest types 7,090 1.3 3.6 Low timber productivity 808 0.1 0.4 Existing roads 3,815 0.7 1.9 Environmentally sensitive 4,836 0.9 2.5 Riparian management area 4,625 0.9 2.3 Wildlife tree area 1,359 0.3 0.7 Exchamsiks 272 0.1 0.1 Total current reductions 99,152 18.4 50.2 Timber Harvesting Landbase 98,256 18.2 49.8

VSIP Kalum TSA Page 7
March 31, 2004
Table 2 Kalum TSA Timber Harvesting Land Base by Dominant Species
Dominant Species Area (ha) % Hemlock 74,871 76 Abies 8,155 8 Spruce 5,404 6 Pine 4,618 5 Cedar 983 1 Deciduous 4,225 4
Total 98,256 100
The May 2000 Nisga’a final agreement identifies a total of 32,286 ha in the Kalum Forest District. Approximately 4,700 ha are in the timber harvesting landbase. The largest reduction in area was to TFL 1 and the reduction to the Kalum TSA was minimal. This area has not been netted out of the THLB as defined in Table 1. The exact area impact on the Kalum TSA will be calculated in the VRI Project Implementation Plan (VPIP).
2.2 Inventory History
A forest inventory was completed in 1989 for all of the Kalum TSA except for the Kitimat Valley portion, which dates back to 1976. These inventories were projected to 1997 to account for growth and updated for disturbances such as harvesting and fire, and silviculture treatments. All mapsheets in the Kalum TSA have been shifted from NAD 27 to NAD 83 since the last timber supply analysis. VRI Phase I has been completed in a portion of the TSA south of Terrace (portions of 11 mapsheets), which includes the area not inventoried in 1989. VRI Phase II was also completed for immature stands in TFL 1 in 1998-99, and there may be some overlap with the Kalum TSA. The entire TSA was flown from 2001 to 2003 and 1:30,000 black and white aerial photography is available.
2.3 Inventory Audit
An inventory audit was performed in the Kalum TSA in 1997. The inventory audit tests three components of the current inventory. The first component is the accuracy of timber volumes in mature forested areas (forest stands older than 60 years). The second component is the accuracy of the site growth potential (site index) of immature stands (younger than 60 years of age but older than free growing age). The third component tested is the area classified as non-forest in the inventory, which includes areas such as lakes, gravel pits, and alpine meadows. The audit tests the accuracy of the photo-interpreted classification for this component.

VSIP Kalum TSA Page 8
March 31, 2004
With respect to the first component, mature timber volumes, results of the audit showed no significant difference between audit and inventory standing volumes (509m3/ha in the audit vs. 496m3/ha in the inventory data base (a 3% gain)) for the mature forested land base (60 yrs+). A paired sample t-test determined that this difference was not statistically significant 19 times out of 20 at a probability level of 0.05. Only 31 of the 50 audit samples, however, were in the operable landbase, and audit volumes for the operable area were predicted to be 2% less than inventory values. The difference between these two estimates (9m3/ha) was also not statistically significant. No meaningful comparisons could be made of the nineteen samples located in inoperable forested areas due to the small sample size. Conclusions were highly variable and restrictive in interpretation. With respect to the second component, immature stands, the inventory correctly identified site index within ±5m of the audit site index for only 8 of 20 stands; the inventory site index was more than 5m lower than the audit site index for 12 of 20 stands. This issue was identified by the chief forester in the 1999 Rationale for Allowable Annual Cut Determination. With respect to the third component, non-forest stands, thirty stands classified as non-forest were assessed for photo interpretation accuracy. The resulting score was 82%, which does not meet the provincial minimum standard of 85%. In terms of vegetative cover, therefore, the existing inventory is not as accurate as desired for non-forested polygons. The audit also revealed that, for the entire forested land base, the yield model (VDYP) is underestimating volume by 9% on average. If the loss factors were, alternatively, overestimating the volumes, the results of the audit could have been significantly different (Keith Tudor 2004). Height, a key driver of yield, was indicated to be overestimated by 7% in the inventory database. The audit also showed that 60% of the growth type groups were accurately predicted in the inventory database (this is considered to be an acceptable amount of error (Keith Tudor 2004)). At the stand level, the correlation between the inventory and audit was weak, which may be attributed to the heterogeneity in stands in the Kalum TSA. Homogenous stands, such as lodgepole pine stands found in the interior of BC, tend to have a stronger correlation.
2.4 Forest Management Issues
Significant forest management issues in the Kalum TSA were highlighted in the timber supply review data package. These issues were reviewed in the 1999 Kalum Forest District Forest

VSIP Kalum TSA Page 9
March 31, 2004
Management Issues Discussion Paper. An addendum to the discussion paper was produced prior to the meeting on March 5, 2004 and circulated to stakeholders. Table 3 outlines the issues in the original data package and remarks reflect feedback generated during discussion of the issues. New issues were also raised in the process. A rating of high, moderate, low or not applicable (N/A) has been applied to VRI Phase I (photo-interpreted estimates) and Phase II (ground sampling) activities to describe how effective each activity would be in resolving each forest management issue.
Table 3 Forest Management Issues for the Kalum TSA as they relate to VRI.
Effectiveness
Issue
Photo-Interpreted Estimates
Ground
Sampling
Remarks
1. Errors in attributes quantified in inventory audit.
Moderate Moderate Photo-Interpreted Estimates and Ground Sampling may improve individual polygon values and reduce errors found in inventory audit. Further analysis by age and species could also identify trends within the inventory.
2. Decay, waste, and breakage
Low High Ground Sampling data will provide information on decay and waste. MSRM no longer supports the development of DW factors although they are built into the VDYP yield models. VRI Ground Sampling (NF/NVAF) data could be used to provide information to verify the current loss factors and adjust the photo-estimated inventory. Breakage, while likely underpredicted in the Kalum TSA, is not part of the VRI system.
3.
Site productivity: The paired-plot study on hemlock stands and the 2003 PEM.
Low Moderate Problems with height and age estimates can arise from the utilization of air photos to estimate site index. In recognition of this, the CF, in the 1999 TSR, notes that the BCFS had to review the site productivity of coastal western hemlock sites. Results of the analysis showed that, on average, the site productivity of areas currently growing western hemlock over 140 years old in the Coastal Western Hemlock biogeoclimatic zone was significantly underestimated (by 10 meters at 50 years of age, or 74%). Those results have already been incorporated in the base case timber supply analysis. However, nothing similar has been done for other species or other age classes for hemlock.
A PEM was also completed for the Kalum District in

VSIP Kalum TSA Page 10
March 31, 2004
Effectiveness
Issue
Photo-Interpreted Estimates
Ground
Sampling
Remarks
early 2003, although it has not been validated. The PEM validation could be a source for spatial site index correlations.
4. Minimum harvestable ages: round wood requirements of local timber processing facilities.
Low Low More accurate information on height and diameter would help mills match logging with mill requirements. The decision on what is allowed to be logged, however, is a policy decision, not a data decision. In the 1999 TSR, for example, the CF notes that assigning minimum harvestable ages based on the age of maximum timber productivity, rather than the mix of volume, tree height and diameter used in the base case, resulted in an average increase in harvested ages of 16 years over the long term. A technical rotation is already being used in TSR.
5. Poor sites, height class 3: industry performance on poor quality sites and height class 3 stands.
Moderate Moderate Monitoring of industry performance in height class 3 stands in not a VRI related activity. Targeted ground sampling in problem forest types, however, could result in the re-classification of a portion of the 7,090 ha currently deducted from the THLB in this category
6. Regeneration delay: options for further reductions in actual regeneration delay periods.
N/A N/A In the 1999 TSR a regen delay of 3 years or 6 years was used. These values may not reflect the true values of regen delay in the Kalum TSA but VRI is not the best way to approach this issue.
7. Temporary deferral of four planning areas representing 15% of the available mature volume.
N/A N/A This issue is not one of VRI. Potential implications with VRI include only ensuring that these areas are removed from the THLB and therefore the target population.
8. Silviculture systems – (visually sensitive areas).
N/A N/A With regard to partial cut systems in visually sensitive areas, the group acknowledged that VRI could be utilized to provide basal area information and the resulting impact on yield, but concluded that mechanisms other than VRI to address this issue were more appropriate
9. Inoperable areas: Moderate Moderate Targeted ground sampling could augment data for these

VSIP Kalum TSA Page 11
March 31, 2004
Effectiveness
Issue
Photo-Interpreted Estimates
Ground
Sampling
Remarks
Moving harvest operations into areas historically considered inoperable will boost timber supply.
types of areas
10. Regeneration: information on timing stand establishment to avoid vole damage on young seedlings is needed.
N/A N/A This information is unrelated to VRI
11. Information on the extent to which wildlife buffer zone areas impact timber supply is needed.
Moderate Moderate This information can be produced using existing inventory data, GIS tools, and habitat and timber supply modeling. Better inventory data obtained through VRI could result in more accurate impact estimates.
12. Information on the extent to which wildlife tree patches (WTPs) impact timber supply is needed.
Moderate Moderate WTPs were accounted for in the 1999 TSR. Better inventory data obtained through VRI could result in more accurate impact estimates.
13. Information on the extent to which visual quality objectives impact timber supply is needed.
Moderate Moderate Better inventory data obtained through VRI could result in more accurate impact estimates
14. Information on the extent to which riparian areas impact timber supply is needed.
Moderate Moderate Photo-Interpreted Estimates could provide information on soil moisture and nutrient regimes to enhance the interpretation of riparian areas.
Perhaps a better source would be PEM data.
15. Validation of the 2003 PEM is required
Low Moderate PEM has many uses in planning, habitat analysis, and timber supply analysis. Although knowledge tables are calibrated against field data used to design them, this is not a measure of statistical reliability. Validation work is still required before the PEM completed in 2003 can be used.

VSIP Kalum TSA Page 12
March 31, 2004
Effectiveness
Issue
Photo-Interpreted Estimates
Ground
Sampling
Remarks
16. Determine if the operational adjustment factors used in the 1999 TSR are appropriate (OAF 1 of 15% and OAF 2 of 5%). These have a large impact on timber supply on regenerated lands and there is considerable evidence in other areas that they are too high.
Low Low It is possible that this could be addressed through targeted VRI sampling, however, a procedure was established in the Bulkley, Lakes, and Morice District to determine appropriate values that did not involve VRI, and which can be used in conjunction with PEM to provide more accurate, spatial OAF1 factors.
17. Site productivity estimates for stands aged 20 to 60 years may be inaccurate due to errors in attributes.
Low Moderate The CF identified this as an area requiring more information. Analyses of this issue revealed that increases in as little as 3 metres to existing site indexes in this age range resulted in significant increases to timber supply in the mid and long term. A targeted Phase II VRI in TFL 1 on stands aged 10 to 110 was completed in 1999. Options for applying the results of this study to the Kalum TSA should be explored.
18. Yield curves for amabilis fir (secondary species) may not be appropriate.
Moderate Moderate There may be inaccuracies based on the inventory file assignment of balsam (B) genus and species. Inventory files should be reviewed to ensure correct genus/species identification. As well, yield curves for balsam produced by VDYP may not be appropriate based on the current Forest Inventory Zone (FIZ) designations. In particular, Ba in an interior FIZ produces unreasonable volumes that are more representative of the coast. This could be remedied with new FIZ designations. Alternatively, photo-interpretation and ground sampling with NVAF would provide basal area information (not available in previous inventories), which could then be used in VDYP7 to obtain more accurate volume estimates for individual polygons.
19. Information required on the actual contribution of problem forest types to timber supply
Moderate Moderate Targeted photo interpretation and ground sampling could provide better estimates of volume and productivity for these types of areas.

VSIP Kalum TSA Page 13
March 31, 2004
To summarize, there is a great deal of information that could be gained from the application of VRI and VRI related activities. This information includes, but is not limited to:
o Possible improvement in the accuracy of polygon attributes (although improvements in attribute accuracy are not always realized).
o Improved accuracy of decay estimations in existing stand volumes through verification of existing loss factors associated with decay and waste. The VRI could validate the theory that the existing loss factors may be contributing to an overestimation of volume in the inventory. These results could potentially be used to derive factors to adjust the inventory volumes for the target population and that would impact the next TSR.
o Re-classification of stands deemed inoperable (70,897 ha) or classified as problem forest types (7,090 ha) in the last TSR.
o Information on the extent to which wildlife buffer zones, wildlife tree patches, visual quality objectives, and riparian areas impact timber supply.
o Improved growth and yield estimates for stands 20 to 60 years old. o Better information for yield curves for secondary species in TSA (amabilis fir).
2.5 VRI Activities and Products
Discussions with stakeholders and the Chief Forester’s latest timber supply review indicate that decay; particularly in hemlock (leading in ~76% of stands in the TSA) is an issue. It is also an appraisal issue, as decay information is used in the cruise compilation and appraisal allowance and it has been reported that scale volumes in the Kalum are sometimes as much as 20 to 30 % lower than cruise volumes for the same area. Some important considerations relating to the decay issue are:
o The loss factors (both zonal and local) used in VDYP and in the cruise as part of the
appraisal analysis were produced in 1976 with the best science of the day. The data supporting the development of these factors, however, was subsequently lost in a fire and it has been difficult to pinpoint the source of inconsistencies between the loss factors and VDYP.
o A comprehensive loss factor study was undertaken in the Kalum Forest District in
1988/89. Results of the study indicated that taper equations were overestimating volume by 5 to 9%. The study population included 1169 trees from 60 locations (some of which were in Cutting Permits). Although the majority of sample trees

VSIP Kalum TSA Page 14
March 31, 2004
came from TFL's 1 and 41, approximately 228 were located in the Kalum TSA. The study did not indicate a significant difference in decay between the TFL’s and the Kalum TSA. The study did, however, find differences between the north and south portions of the TSA. (Losses were higher north of Kitimat relative to those south of Kitimat). An opportunity for re-analysis of this study is outlined in section 2.5.2.
The study results revealed that local loss factors produced in the study were lower than any of the existing zonal or local loss factors. In other words, there was less loss than what was already being allowed for in appraisal analysis or the cruise program. This information was not used in the last TSR.
o Historically, net volumes recovered have been lower than those predicted from cruise or inventory information. This is an issue given that licensees pay stumpage based on scale volumes, but the rate for stumpage is set based on cruise volumes in the appraisal. Although the stumpage appraisal system may contain allowances for extra handling based on loss factors, the set rates may be too high if the unrecoverable fibre is greater than the loss factors would imply. The unrecoverable fibre may also lead to difficulties in planning due to the increased volumes required (to make up for unrecoverable fibre that was thought to be recoverable) to achieve production targets.
Both an overestimate of volume by the taper function in the cruise compilation and an overestimate of waste2 in the cruise compilation may be contributing factors. For example, a cruise may indicate that there are a large number of suspect or dead potential trees in a Cutting Permit. In the cruise compilation these trees could count as recoverable fibre if decay volume did not exceed 50% of the total. If the trees were, in fact, to contain greater than 50% decay, the sound fibre portion would be classified as waste2 and deemed unrecoverable. Scale volumes would thus be lower than the cruise information indicated. This problem is likely not confined to the Kalum but is an issue in all forests with a high degree of decadence.
o The MoF Revenue Branch has revealed that it could adopt net factoring information for coastal appraisals by 2004. The Kalum TSA, however, falls under the interior appraisal system and such changes could be significantly later in coming. The provision of net factoring information to the MoF Revenue Branch could hasten the process in the interior.

VSIP Kalum TSA Page 15
March 31, 2004
The following VRI activities and products are needed to address the forest management issues in the Kalum TSA. These recommendations are based on the issues identified in Section 2.4, and address the above decay specific considerations:
1) Apply a new VRI Phase I photo-interpretation to the operable stands of the Kalum TSA, excluding large tracts of contiguous NP such as alpine (and excluding the area south of Terrace that already has a completed VRI Phase I). A new inventory would entail new polygon delineation and new stand attributes. Alternatively, a retrofit would entail applying updated and new attributes to existing linework. However, applying a retrofit can be problematic with inventories that have been shifted from a NAD 27 base to a NAD 83, such as the Kalum TSA. In these cases, new linework is often necessary and the cost difference between the two options is minimal.
A new VRI Phase I photo interpretation is slightly more expensive than a retrofit. New Phase I costs are estimated at $1.00 to $1.50/ha, while retrofit Phase I costs are estimated at $1.00/ha.The result of a new VRI Phase I photo-interpretation would be a new photo-interpreted attribute database. Updated timber attributes include age, height, basal area, density, and species composition for both primary and secondary species. Phase I photo-interpretation would: o Reduce errors in database quantified in the inventory audit by improving the accuracy of
polygon attribute values. o Improve the quality of information available for inoperable stands in that they may be
reassessed in terms of accessibility and merchantability prior to the next TSR. o Provide base information for determining the extent to which wildlife buffer zones,
wildlife tree patches, visual quality objectives, and riparian areas impact timber supply by updating existing polygon attribute values.
o Provide new attributes such as height and age on secondary species, in addition to basal area and density for all species. This information will be used in VDYP7and should improve estimates of existing and projected stand volumes (Keith Tudor 2004).
o Provide better estimates on the volume and productivity of problem forest types in the Kalum TSA.

VSIP Kalum TSA Page 16
March 31, 2004
It should be noted that certain attributes, such as those on secondary species, may be difficult to interpret from the new 1:30,000 black and white aerial photography. Ideally, aerial photography for Phase I VRI would be colour at a scale of 1:15,000 to 1:20,000.
2) Conduct timber emphasis Phase II ground sampling in operable stands greater than 120 years
old in the Kalum TSA, exclusive of large tracts of contiguous NP such as alpine, to provide statistically valid timber volumes and polygon-specific tree attributes. Sample polygons should be selected over the entire target population using stratified probability proportional to size with replacement (PPSWR) sampling. This data will support the next timber supply review (TSR) in the Kalum TSA expected prior to November 2007. The ground sampling will include Net Volume Adjustment Factor (NVAF) sampling, which will be used to adjust the 1976 loss factors used in the compilation program.. NVAF will not produce new loss factors, but factors could be derived from the information to adjust existing loss factors. The MoF would need to approve any adjustment to the 1976 decay and waste loss factors used for stumpage appraisal.
Ground sampling and NVAF would: o Reduce errors in the database quantified in the inventory audit by providing a means to
adjust the attribute values determined in Phase I.
o Provide information on actual decay and waste through net factoring and net volume adjustment factor (NVAF) sampling. Breakage will also be affected by decay level, but NVAF sampling will not produce new factors for breakage. It should be noted that NVAF sampling quantifies the actual amount of decay and not the amount of economically available wood. In general terms, in good markets, there's more wood recovery than in bad markets (Will Smith 2004).
o Provide a basis for developing more accurate taper equations or adjustments to taper.
o Provide better information on site productivity if a validation of the 2003 PEM is conducted in conjunction with ground sampling. This feasibility of such an option is discussed in detail in the next section.
o Improve the quality of information available for inoperable stands in that they may be reassessed in terms of accessibility and merchantability prior to the next TSR.
o Allow ground truthing of secondary species attributes derived in Phase I. o Provide better estimates on the volume and productivity of problem forest types in the
Kalum TSA.

VSIP Kalum TSA Page 17
March 31, 2004
In addition, ground sampling and NVAF could be used to determine the amount of dead potential volume in the inventory. Volumes from dead potential are not currently considered in the AAC determination. The volumes are, however, added to cut control. Forestry proponents in the Kingcome TSA are undertaking a pilot project utilizing enhanced VRI ground sampling/NVAF to see if volumes from dead potential cedar could be considered in the timber supply review. Although there is, as of yet, no confirmation that the sampling methodology will provide the MoF with enough detail to influence policy, the addition of dead potential volumes to the AAC determination could be a major policy shift. It should be noted that Phase II ground sampling activities are not dependent on the outcomes of Phase I photo-interpretation products. It may be advantageous in the Kalum TSA to implement ground sampling prior to any photo interpretation, due to the amount of information that can be derived from ground sampling and applied to resolving the business issue of decay.
2.5.1 Parallel Activities and Products PEM Validation
An accuracy assessment is required for the PEM completed for the Kalum District in early 2003. Direct combination of the PEM validation with Phase II ground sampling is possible, although the resultant logistical constraints reduce the appeal of such an option. Quality issues, access and crew logistics, and differences in the target population and sampling methodology make such a combination difficult. It is feasible, however, to validate a PEM in parallel with Phase II ground sampling to realize efficiencies in access and sample design. There are some key considerations in considering a PEM accuracy assessment in parallel with the Phase II ground sampling:
o The PEM validation would include stands less than 120 years old, and therefore additional sample points would need to be selected. Sample selection must be consistent with the VRI sample design.
o PEM polygon clustering around VRI sample points may be an option to reduce the number of additional sample points required.
o Due to the differences in the polygon delineation between the PEM and the existing inventory, polygons should be overlaid to ensure adequate polygon representation in the PEM accuracy assessment.

VSIP Kalum TSA Page 18
March 31, 2004
o If field work for both activities is performed at the same time with one crew, the crew should be of adequate size to ensure only one visit to each sample point (especially for helicopter access points).
It should be noted that PEM validation is not required for the entire landbase mapped with PEM. As such, a validation may be targeted to a specific portion of the landbase to best suit the stakeholders’ business needs Because PEM provides spatially explicit information on site series, and a correlation has already been established between site series and site index, PEM could provide the information necessary to adjust site index values in the inventory database across the entire landbase. To date, however, RIB has not adjusted a VRI database using PEM although PEM results have been used in the base case in timber supply analysis. PEM is also useful in predicting habitat capability because habitat is highly correlated with site series. A validated PEM product would provide resolution to a number of forest management issues including:
o More accurate information on site productivity for 20 to 60 year old stands. o Spatial habitat capability information used to determine the extent to which wildlife
buffer zones, wildlife tree patches, and riparian areas impact timber supply. o Establishment of appropriate operational adjustment factors (OAF1) used in TASS to
model yield in managed stands. Although PEM will not provide OAF1 values, a ground sampling procedure has been established to determine OAF1 values by site series and PEM can be utilized in conjunction with this process to provide a more accurate determination of OAF1.
PEM is also effective for use in strategic Sustainable Forest Management (SFM) Planning as well as in guiding operational planning. Note, however, that where Predictive Ecosystem Maps are being used as part of an ecologically-based yield analysis for a base case timber supply review, an independent accuracy assessment must be conducted following the Protocol for Quality Assurance and Accuracy Assessment of Ecosystem Maps. The accuracy assessment results need to meet the following criteria:
a. Predicted site series must not be significantly different than measured site series using the chi-squared test (using alpha = 0.05).
b. The ‘percent dominant correct’ and ‘percent overlap’ scores must be greater than 65% (confidence level 80%, maximum error 7%).

VSIP Kalum TSA Page 19
March 31, 2004
Where an accuracy assessment is not conducted using the protocol or the resulting statistics do not meet the levels indicated in item 1, then the PEM will only be accepted as part of a sensitivity analysis in timber supply review. The PEM would still be required to pass the quality assurance requirements and only then if the minimum value for ‘percent dominant correct’ and ‘percent overlap’ scores is 50%.
To meet the criteria for PEM information to be considered in a TSR, it must meet minimum Level 4 accuracy assessment requirements. Those requirements are:
o All sample polygons must be assessed by ground checks. o Ground checks will require either traversing polygon and mapping simple map entities
at large scale (e.g., 1:5000) or randomly/systematically locating 3 – 5 sample plots in the polygon.
A minimum of 104 polygons are required for map assessment, given the diversity of variants in the Kalum Forest District (There must be at least twice as many sample polygons as there are forested site series in the sample), although it may be possible to validate the map with as few as 86 plots. Sample points must be randomly selected within these polygons. Del Meidinger, MoF Research Scientist, Forest Ecology, should be consulted prior to implementation of this plan to ensure it has met the requirements for a Level 4 accuracy assessment.
2.5.2 Other Activities and Products Inventory Attribute Adjustment Conduct an inventory attribute adjustment to obtain more accurate estimates of growth and yield for 20 to 60 year old stands. In the Kalum TSA AAC Rationale the Chief Forester cited the inventory audit, which revealed inventory inaccuracies that could lead to an underestimation of site index in stands aged 20 to 60 years by up to 3 metres. A sensitivity analysis to determine the impact of increasing the site index for these stands by 3 metres was performed. The analysis indicated a significant increase in the mid-term AAC of 12.5%, and in the long-term of 4.4%. Due to the small sample of immature stands in the audit, the chief forester could view the indicated site index error, based on inaccurate height an age attributes, only as a general indication of a trend, rather than as a precise result.

VSIP Kalum TSA Page 20
March 31, 2004
An inventory attribute adjustment for stands 10 to 110 was performed in TFL 1 utilizing VRI ground sampling. It is possible that results from the study could be applied to the Kalum TSA given the similarity in geography and ecosystems of the two areas. If the data from the TFL 1 study cannot be applied to the Kalum TSA, another option would be to target 20 to 60 year old stands for VRI ground sampling and NVAF to adjust the incorrect attributes. The process would be similar to that carried out in TFL 1 to adjust stand ages, heights, site index, and volumes in the inventory data. An estimated 30 samples would likely be statistically reliable, at a cost of approximately $60,000. Another option would be to ground truth stands that are likely in error. This option may not produce results with enough validity to be considered in the TSR. The costs would be approximately $40,000 to $50,000. Analysis of the Loss Factor Study Another potential project is to undertake further analysis on the 1988/89 loss factor study in the Kalum Forest District. The analysis would require an assessment of the sample selection for biases, recalculating of sample tree weights (selection probabilities), calculating adjustments to the taper and loss factors, recompiling the inventory audit with the new loss and taper adjustments, and comparing results with original audit results. Reasonable approximations of sample tree weights, however, may be difficult to achieve given the bias in sample selection (operational stands were targeted, and trees were selected based on risk group and dbh from polygons with “large” hemlock).
Assuming that reasonable approximations of sample tree weights can be made, this analysis could provide the following information (Will Smith 2004):
o More accurate estimates of standing volumes of hemlock. o Net factoring volume adjustments for cutting permit volume estimation purposes
(subject to approval from the MoF Revenue Branch). Limitations to this analysis include (Will Smith 2004):
o The volume of the non-hemlock component of the inventory remains unadjusted and of unknown accuracy.
o Inventory files remain unadjusted. o The bias to the sample selection could render the findings inaccurate.

VSIP Kalum TSA Page 21
March 31, 2004
This analysis could reduce the need for VRI ground sampling/NVAF data, however, due to the potential inaccuracies due to bias and the possibility that the analysis may not produce the expected results, both the analysis and VRI ground sampling/NVAF activities have a higher priority for implementation.
Breakage Study Data from the Kalum TSA DWB surveys over the last ten years could be assessed to determine if it is possible to obtain a more accurate breakage factor for the TSA. Breakage is an appraisal issue, however, and is believed to be underestimated in the Kalum TSA using the 1976 factors. VRI activities cannot address the issue of breakage.
Forestry proponents in TFL 37 have developed new breakage factors through a similar process. Information on the process utilized to determine these new factors was not available at the time of completion of this plan. The LBIR working group should review the process completed in TFL 37 to determine if it may suit their business needs.
Existing inventory data and information from TFLs 1 and 41 should also be considered for applicability and statistical rigor. Utilization of existing data could eliminate duplication and reduce costs. This process will require collaboration from all stakeholders in the TSA.

VSIP Kalum TSA Page 22
March 31, 2004
3. INVENTORY PLAN
3.1 Overview
This section outlines a preliminary strategic inventory plan to develop specific VRI products discussed in Section 2.5. These products are best suited to address the forest management issues as defined by the stakeholders, and they will be discussed further in the VPIP. The VRI products include:
o A Phase I new spatial vegetation resource inventory for the operational portion of the Kalum TSA, excluding large tracts of contiguous NP such as alpine. This baseline information would be useful for mapping timber attributes, timber development planning, wildlife habitat mapping, ecosystem mapping, and riparian mapping.
o A Phase II timber emphasis inventory for stands greater than 120 years old in the operational portion of the Kalum TSA, excluding large tracts of contiguous NP such as alpine.
These products can be obtained through completion of VRI photo interpretation, ground sampling and statistical adjustment. Documents on standards and procedures for VRI activities are available at: http://srmwww.gov.bc.ca/tib/vir/vir/standards/index.html#photo.
Parallel VRI products include:
o A validated PEM that has met the Level 4 accuracy assessment requirements Other products include:
o A inventory attribute adjustment to determine more accurate estimates of growth and yield for 20 to 60 year old stands.
o A re-analysis of 1988/89 loss factors in the Kalum District o New breakage factors.
These other products may be tied to, but are not dependent on, the completion of VRI activities.

VSIP Kalum TSA Page 23
March 31, 2004
3.2 Phase I Photo Interpretation
3.2.1 Objectives The target population should be updated through a Phase I new VRI. The objective is to delineate new polygons with new attributes in the Kalum TSA- especially in areas where specific management issues occur - using photo interpretation. This includes new interpretation of conventional attributes such as; species, age, and height, and additional attributes, such as: basal area, soil moisture and nutrient classification. The VRI Phase I product is a spatial database consisting of unadjusted photo-interpreted estimates. Ground sampling, used to check and adjust the photo-interpreted estimates, is discussed as a separate process (Section 3.3).
3.2.2 Target Area The operational portion of the Kalum TSA, excluding large tracts of contiguous NP such as alpine. is the target area for a Phase I new VRI.
3.2.3 Target Attributes All attributes listed on the VRI photo interpretation attribute form should be targeted. These attributes should be interpreted to the VRI photo-interpretation standards found at: http://srmwww.gov.bc.ca/risc/pubs/teveg/vri-photointerp2k2/photo_interp2k2.pdf
3.2.4 Methods The Phase I information will be obtained through a new VRI using scanned 1:30,000 scale black and white aerial photography (from 2001-2003) in softcopy format. Other resources such as digital orthophotos or scanned imagery may be utilized for any gaps that may exist in the aerial photography. A portion of the Kalum TSA has previously undergone a VRI Phase I. This area lies in the south of the TSA and it should be excluded from Phase I photo-interpretation.
3.3 Phase II VRI Timber Emphasis Plots
3.3.1 Inventory Objectives The objective of the timber emphasis inventory is to attain statistically valid timber volumes, including more accurate decay information, and polygon-specific tree attributes.

VSIP Kalum TSA Page 24
March 31, 2004
3.3.2 Target Population The target population is operable stands greater than 120 years old in the Kalum TSA, exclusive of large tracts of contiguous NP such as alpine.
3.3.3 Sample Size An estimated minimum of 50 sample clusters (35 Hw / 15 Other) should be installed in the operational portion of the Kalum TSA, excluding large tracts of contiguous NP such as alpine. This sample size is a conservative estimate based on the formula t2 x CV2 / SE2. The proposed minimum sample size would provide a statistically reliable adjustment to the timber inventory in the target
population to achieve a sampling error of approximately ±15% (95% probability) for overall net timber volume in the VT area, assuming an estimated coefficient of variation (CV) of approximately 48%. The actual CV of the Kalum was determined to be 37% using data from the inventory audit. Due to the differences in sample design between the inventory audit and VRI ground sampling, the CV was arbitrarily inflated to 48% to determine sample sizes. To ensure statistical reliability in the sample size, the sample clusters could be established over two years. In the first year, half of the sample clusters could be established and a more accurate figure for the required number of samples could be established. It is absolutely necessary to ensure that funding and scheduling allow for the completion of planned VRI activities in a given year. Failure to complete sampling activities could result in rendering the data useless.
3.3.4 Sample Selection Sample polygons will be selected using the current sample selection methods (Probability proportional to size with replacement PPSWR). Random sample points will be selected with replacement over the target population.
3.3.5 Sampling Approach VRI Timber Emphasis Plots (TEPs) will be used to gather data as per the guidelines within the VRI Ground Sampling Procedures Manual available at: http://srmwww.gov.bc.ca/risc/pubs/teveg/vri_ground_sampling2k3/vri_ground2k3.pdf
3.3.6 Net Volume Adjustment Factor Sampling NVAF sampling involves detailed stem analysis of sample trees, calculation of actual net volume, and calculation of the ratio between actual net volume and estimated net volume (where estimated net volume is obtained from net factoring and taper equations). NVAF data is used to adjust the

VSIP Kalum TSA Page 25
March 31, 2004
estimated net tree volume to account for hidden decay and taper equation bias (e.g. in hemlock stands). Eighty-five (Hw 45 / Other 30 – DP 10), selected at random from the Phase II sample clusters, should be destructively sampled for NVAF. NVAF should be performed in conjunction with timber emphasis plots. Tree volume for the Vegetation Resources Inventory (VRI) is estimated by using the taper equation for gross volume, a net factoring deduction for net volume (from ground sampling), and a net volume adjustment derived from Net Volume Adjustment Factor (NVAF) sampling. The application of NVAF produces statistically valid VRI ground sample volumes, and it is a mandatory activity of a VRI ground sample inventory. Net factoring provides an initial sound wood percentage of each log of a tree for trees in ground samples after a cruiser applies, either individually or in combination, a set of estimation and measurement rules to individual trees with visible decay. NVAF sampling provides an actual net merchantable volume based on felled tree stem analysis measurements. The NVAF represents an adjustment calculated from the ratio of actual to estimated net merchantable tree volume. The NVAF adjustment will be used to statistically adjust the estimate of net merchantable volume of VRI ground samples. The NVAF adjustment corrects for possible taper equation error, net factor rule error, hidden decay in trees with no loss indicators or with no visible decay, and hidden loss indicators.
3.3.7 Within Polygon Variation Sampling WPV sampling provides information to estimate individual polygon error, assessed as the difference between adjusted polygon value and “true” value for that polygon based on intensive sampling of sample polygons. Typically, 10-20 polygons selected from a target population are intensively cruised using a combination of 20-50 full measure and count plots per sample polygon. The application of WPV sampling would provide the data to better quantify differences between ground and inventory samples (as indicated by the inventory audit) at the stand level. It is, however, expensive and is not planned for implementation at this time.
3.3.8 Implementation The timber inventory may be coordinated in isolation of the photo-interpretation work and be implemented in one or two years. If funding is not stable, a one year time frame is recommended to ensure the data is not rendered useless. If funding is stable, scheduling over two years is as follows:
VSIP Kalum TSA Page 26
March 31, 2004
Year 1- approximately half of the TEPs (e.g. 25 ) should be installed over the target population in the first field season (or first half of field season). Re-calculate the sample size based on new CV estimates. Year 2- install remaining TEPs in the second field season (or the second half of a field season), if required. A VPIP for ground sampling will be developed following MSRM guidelines in Vegetation Resources Inventory Guidelines for Preparing a Project Implementation Plan for Ground Sampling.
3.4 Project Implementation Plan
Stakeholders will construct a Project Implementation Plan following the approval of this Strategic Inventory Plan. The implementation of activities outlined in the PIP will likely be controlled by funding sources and amounts.
3.5 Roles and Responsibilities
The following are specific organizational roles and responsibilities in the development of a VRI: Licensees:
o Initiate inventory projects through FIA (or other agency) funding process o Submit plans to PwC for funding approval o Submit strategic/operational plans to (a) MSRM for standards review, and to (b) MoF for
business review o Complete the inventory activities to standards o Submit data to MSRM
MSRM
o Set standards o Store the data o Provide advice/mentoring o Audit o Coordinate plan review for adherence to standards/business
MoF
o Review plans to ensure the products will meet the MoF business needs

VSIP Kalum TSA Page 27
March 31, 2004
3.6 Costs
Estimated sample sizes and preliminary costs for the Kalum TSA VRI activities are listed in Table 4. More accurate and detailed costs for VRI activities will be included in the VPIPs once stakeholder feedback is received.
Table 4 Estimated sample sizes and costs for VRI activities in the Kalum TSA
VRI Activity Sample Size Unit Cost Total Cost($)
PHOTO INTERPRETATION/ RETROFIT
Option 1
Photo retrofit (keep existing linework, updated/new attributes)
197,408 ha $1.00 197,408
Quality Assurance (5% of cost) 9,870
Total Phase I Option 1 207,278
Option 2
New VRI photo interpretation (new linework and attributes)
197,408 ha $1.50 296,112
Quality Assurance (5% of cost) 14,805
Total Phase I Option 2 310,917
GROUND SAMPLING Contract administration 10,000
TEPs ($1,500 per crew day) 50 1,500 75,000
NVAF ($600 per tree) 85 600 51,000
Helicopter access 55,500
Mentoring (crew training) 4,000
Quality Assurance 10,000
Final Compilation/analysis and inventory file adjustment
15,000
Total Phase II 220,500
Preliminary costs for other activities in the Kalum TSA are listed in Table 5. The finer details of these other activities will not be drawn out in the VPIP. Only the VRI activities described above will be outlined in the VPIP, as they are best suited to address the forest management issues as defined by the stakeholders.

VSIP Kalum TSA Page 28
March 31, 2004
Table 5 Estimated costs for parallel activities and other activities in the Kalum TSA
Activity Total Cost ($) PEM Validation
Accuracy assessment (design, sampling, analysis) 60,500
Helicopter 51,000
Total 111,500
Inventory Attribute Adjustment
Option 1 Targeted VRI ground sampling 60,000
Total Option 1 60,000
Option 2 Ground Truthing 45,000
Total Option 2 45,000
Re-analysis of 1988-89 loss factor study
Recalculate weights, calculate adjustments, analysis 10,000
Total 10,000
Establishing new breakage factors
As per process used in TFL 37 20,000
Total 20,000
The costs outlined in this VSIP are conservative estimates and as such are only a guide. Activities outlined in the VPIP will include more detailed cost estimates.

VSIP Kalum TSA Page 29
March 31, 2004
BIBLIOGRAPHY
British Columbia Forest Productivity Council. Minimum Standards and Stem Analysis Procedures for Site Index Research. Revised November 1998. Victoria, B.C. British Columbia Ministry of Forests. March 1999. Kalum Timber Supply Area Analysis Report. Victoria, B.C. British Columbia Ministry of Forests Resources Inventory Branch. October 1998. Kalum Forest District - Vegetation Resources Inventory Forest Management Issues Discussion Paper (Draft for discussion), Victoria, B.C. British Columbia Ministry of Forests - Resources Inventory Branch. October 1997. Kalum Timber Supply Area Inventory Audits. Victoria, B.C. British Columbia Ministry of Forests - Resources Inventory Branch. January 2001. Timber Emphasis VRI Ground Sampling Procedures. Victoria, B.C. British Columbia Ministry of Forests. January 2000. Kalum Timber Supply Area – Rationale for Allowable Annual Cut (AAC) Determination. Victoria, B.C. British Columbia Ministry of Forests Resources Inventory Branch. December 2000. Mackenzie Forest District - Vegetation Resources Inventory Strategic Inventory Plan (Draft for discussion) British Columbia Ministry of Forests Resources Inventory Branch. January 2000. Prince George Forest District - Vegetation Resources Inventory Strategic Inventory Plan Nigh, G.D. and B.A. Love. 1997. Site index adjustment for old-growth coastal western hemlock stands in the Kalum Forest District. B.C. Min. For. Res. Br., Victoria, B.C., Work.Pap.27 Nigh, G.D. 1998. Site index adjustment for old-growth stands based on veteran trees. B.C. Min. For. Res. Br., Victoria, B.C., Work.Pap.36.

VSIP Kalum TSA Page 30
March 31, 2004
Resources Information Standards Committee – Ministry of Sustainable Resource Management Terrestrial Information Branch. March 2003. VRI Ground Sampling Procedures. Version 4.4. Victoria, B.C. Resources Inventory Committee. October 1999. VRI Localization Procedures. Victoria, B.C. Terrestrial Ecosystem Task Force – Resources Information Standards Committee. December 2002. VRI Sample Selection Procedures for Ground Sampling. Version 3.3. Victoria B.C.

VSIP Kalum TSA Page 31
March 31, 2004
APPENDIX I – STAKEHOLDERS
Table 9. List of stakeholders in the Kalum TSA
Agency Participant MoF Kalum Forest District Kevin Kilpatrick MoF Northern Interior Forest Region Matt Makar, Dick Nakatsu MSRM Resource Information Branch Keith Tudor, Will Smith, Sam Otukul MoF Forest Analysis Branch Chris Fletcher West Fraser Mills Ltd. Damian Keating, Steve Vinneage Bell Pole Co. Jacques Corstanje New Skeena Forest Products Inc. Rick Brouwer

VSIP Kalum TSA Page 32
March 31, 2004
APPENDIX II – GLOSSARY OF TERMS
Ground Sampling Ground sampling is the field measurement of timber, ecology, range, and/or coarse woody debris values at one or more locations within each sample polygon. Sample polygons are selected using the probability proportional to size with replacement (PPSWR) method. To accommodate a wide variety of resources, various types and sizes of sampling units (e.g., fixed and variable plots, transects) are used to make the measurements. Inventory Unit An inventory unit is the target population from which the samples are chosen. The inventory unit could be a specific a geographic area (e.g. TFL or TSA) where a specific set of attributes is needed. The size of the inventory unit depends upon the sampling objectives. Landcover Classification The BC Land Cover Classification Scheme (BCLCS) was designed specifically to meet VRI requirements, in addition to providing general information useful for “global vegetation accounting” and “integrated resource management.” The BCLCS is hierarchical and reflects the current state of the landcover (e.g., presence or absence of vegetation, type and density of vegetation) and such fixed characteristics as landscape position (i.e., wetland, upland, alpine). There are two main classes of polygons: Vegetated and Non-Vegetated. Management VRI Management VRI are specialized inventories that provide detailed information required for specific resource management, i.e., day-to-day forest management. One or more VRI sampling procedures may be used for management inventories. Management inventories may focus on specific resource types (e.g., timber, range, ecology), geographic areas (e.g., landscape unit, TFL), attribute sets (e.g., Douglas-fir leading stands, age class 4+). They may use one or more of the following tools (e.g., photo-interpretation, ground sampling, NVAF sampling). National Forest Inventory (NFI) The NFI provides information on Canada’s resources across all provinces and allows the Federal Government a consistent framework for reporting on Canada's inventory, including reporting on the Criteria and Indicators and the Kyoto protocols. The inventory unit for the NFI is the entire country,

VSIP Kalum TSA Page 33
March 31, 2004
although it is implemented province-by-province. BC’s provincial CMI system will provide the data needed for the NFI as well as provincial reporting. Net Volume Adjustment Factor (NVAF) Sampling NVAF sampling provides factors to adjust net tree volume estimated from net factoring and taper equations. The adjustment accounts for hidden decay and possible taper equation bias. NVAF sampling involves detailed stem analysis of sample trees, calculation of actual net volume, and calculation of the ratio between actual net volume and estimated net volume (where estimated net volume is obtained from net factoring and taper equations). The NVAF (and VRI net factoring) replaces the existing loss factors for inventory applications. It does not, however, replace the loss factors for revenue applications. Photo-Interpretation Photo-interpretation involves subjective delineation of polygons and photo estimation of attributes for all polygons in an inventory unit. Medium scale aerial photographs (1:15,000) are most often used in photo-interpretation. However, if existing photo-based inventory is acceptable, the database can be translated into VRI format and upgraded to include the additional VRI attributes. Post-Stratification Post-stratification involves dividing inventory unit into mutually exclusive sub-populations (strata) after ground sampling has been completed. Samples that fall in each post-stratum are analyzed separately and the results are applied to the corresponding population post-strata to improve the precision of the inventory’s overall averages and totals. Pre-Stratification Pre-stratification divides an inventory unit into mutually exclusive sub-populations (strata)before ground sampling to provide estimates for specific areas, or to increase the confidence in the overall estimates by considering special characteristics of each stratum. PPSWR Sampling design where the probability of selection is proportional to size (polygon area) with replacement of samples back into the sampling frame, allowing for the possibility of one sample being selected more than once.

VSIP Kalum TSA Page 34
March 31, 2004
Retrofit Retrofitting is the process of translating and upgrading an existing photo-based inventory to VRI Phase I standards. If the polygon linework and attributes are of acceptable quality, the existing FIP (Forest Inventory Planning) databases are translated to VIF (Vegetation Inventory Files) databases and the additional attributes required by the VRI are re-estimated from aerial photographs. Sample Size The sample size for an inventory is the minimum number of ground samples to be established in an inventory unit to meet the target precision. Statistical Analysis Statistical analysis or adjustment is the process of adjusting the values of the photo-interpretation variables using ground sampling observations. Ground observations are compared to photo estimated values to develop adjustment factors by species groups. These factors are then applied to the polygons in the photo interpretation database to produce the final adjusted database. Sub-unit Sub-unit describes the inventory unit within an Inventory Unit. For example, if the inventory unit is defined as the Vegetated Treed area in a Forest District, then a sub-unit may be defined by a specific geographic area (e.g., operable landbase) or stand type (e.g., problem forest types) within the Vegetated Treed area in the Forest District. Target Precision Target precision expresses the amount of variation in key attributes (e.g., timber volume) desired in the final results. Target precision, usually expressed as the sampling error (SE), at the 95% level of probability, is used to determine the level of risk associated with the estimate of volume. The current recommended target precision for overall timber volume within a management unit is +10% ( 95% probability); however stakeholders define the final level of risk.. Vegetation Resources Inventory (VRI) VRI is an improved vegetation inventory process for assessing quantity and quality of BC’s vegetation resources. The VRI process is designed to include a flexible set of sampling procedures for collecting vegetation resource information. The VRI is essentially a toolbox of procedures, which include:
o Photo-interpretation: the delineation of polygons from aerial photography and the estimation of resource attributes.

VSIP Kalum TSA Page 35
March 31, 2004
o Ground sampling: the establishment of plot clusters in selected polygons to measure timber, ecological, and/or range attributes.
o NVAF Sampling: stem analysis sampling of individual trees for net volume adjustment. o WPV Sampling: intensive sampling of selected polygons to determine the error between the
estimated attribute values and the “true” attribute values. o Statistical Adjustment : the adjustment of the photo-interpreted estimates for all polygons in
an inventory unit or management unit using the values measured during ground sampling.
The VRI can be deployed over the entire province measuring timber and non-timber resources, or over a large management unit (management VRI) measuring selected resources in specific portions of the landbase. The VRI sampling process produces spatial and non-spatial databases that can be used in multiple resource management applications including timber, ecosystem, and wildlife habitat management. Waste2 Waste2 is the soundwood portion of a tree or log, which has more than 50% decay. Considered to be non-recoverable under current utilization standards. Within Polygon Variation Sampling WPV sampling provides information for expressing the true individual polygon error, assessed as the difference between the adjusted polygon value and the “true” value for that polygon. The “true” value for the polygon is an estimate derived from a small sample of polygons that are intensively sampled on the ground.

VSIP Kalum TSA Page 36
March 31, 2004
APPENDIX III – APPROVAL/SIGNING
I have read and concur with the Kalum Timber Supply Area Strategic Inventory Plan, dated April 20, 2004. It is understood that this is an agreement-in-principle and does not commit the signatories to completing the inventory activities outlined within the plan. Modifications to this plan or more detailed plans need to be reviewed and approved by the signatories. Ministry of Forests Forest Analysis Branch Director Ministry of Sustainable Resource Management, Resource Information Branch West Fraser Mills Ltd. New Skeena Forest Products Inc. Bell Pole Co.

VSIP Kalum TSA Page 37
March 31, 2004
APPENDIX IV – VEGETATION RESOURCES INVENTORY (VRI) UPDATE 2002
INTRODUCTION
The purpose of the “VRI Implementation Update 2002” is to report on the status of the implementation of the Vegetation Resources Inventory (VRI) program and its relationship to other ongoing forest inventory initiatives such as Provincial Change Monitoring Inventory. This document also provides a summary (appendix A) of key business issues and recommendations of best practices associated with implementing and analysing a VRI. It has been developed in conjunction with the recently completed VRI manuals available at http://www.for.gov.bc.ca/resinv/Veginv/Publications.htm and is intended for stakeholders or people interested in the VRI, who wish to know more about how the program is being implemented throughout British Columbia.
Since the VRI program was initiated (circa 1996), several reports have been developed that describe the intended implementation of the VRI (VRI Implementation Plans 1997 and 1998). http://www.for.gov.bc.ca/resinv/Veginv/Project/Implementation/00-Contents.htm This plan, VRI Implementation Update 2002, describes the current status of the VRI implementation and provides references where more detailed information can be accessed. This plan also assumes that the reader is somewhat familiar with the VRI program and procedures. For more information on the VRI, please refer to http://www.for.gov.bc.ca/resinv/Veginv/home.htm. The VRI is a toolbox consisting of procedures and standards for the following: photo interpretation, ground sampling (including net volume adjustment factor and within polygon variation), statistical adjustment and Provincial Change Monitoring Inventory. Depending on the need for information, as defined by the stakeholder, data can be collected using one or more of the VRI processes. The VRI ground-sampling component can be implemented at several levels depending on the particular business needs. It can be deployed over the entire province, measuring all the timber and non-timber resources. It can also be deployed over a Management Unit (e.g. Tree Farm Licence [TFL] or Timber Supply Area [TSA]) or a small watershed within a TFL or TSA, measuring selected resources in specific portions of the land base. The VRI photo-interpretation component can also be deployed to meet specific spatial business needs, however, it is most commonly being implemented within complete management units such as Timber Supply Areas (TSAs), Forest Districts, Tree Farm Licenses (TFLs), Innovative Forest Practices Agreements (IFPAs), etc.

VSIP Kalum TSA Page 38
March 31, 2004
HISTORY / BACKGROUND
The original plan for VRI Implementation as envisaged in 1995 was to deploy the VRI over the entire province in a period of seven to ten years. The “Provincial VRI”, as it was called, would be implemented by different stakeholder groups within implementation units such as a Forest District, TSA, TFL or a sub-unit (e.g. problem forest type). New photo estimation, if required, and/or ground sampling activities combined with statistical adjustment would make up the vegetation inventory. Inventory information from all the implementation units in a district would then be rolled up for all districts to report a provincial total.
As a result of funding changes, the original plan to implement the District based Provincial VRI has not been realised. Instead of a co-ordinated, systematic approach to completing the Provincial VRI, the program has largely been unfolding on a business needs basis within specific management units or sub-units. The Ministry of Sustainable Resource Management (MSRM), Terrestrial Information Branch (TIB) recognise, however, that this latter approach, although providing information for key local planning business issues, will not provide timely and accurate information for provincial reporting.
CURRENT PLAN
The current VRI Implementation consists of: 1.1 Management unit and sub-unit standards and procedures, and, 2.1 Consideration for the Integration of monitoring standards and procedures.
Each program is designed for specific inventory needs. The following sections outline each program and describes how they are currently being implemented.
1.1 Management Unit or Sub-unit Standards and procedures
The current approach for VRI Implementation is to develop management unit inventories to meet key business needs. VRI Management Unit Inventories include inventories conducted in a variety of management units (e.g. Districts) and in sub-units (portions of management units, e.g. problem forest types), to fulfil specific forest management or business needs.
1.1.1 VRI Planning The stakeholder(s) (e.g. TFL holders and licensees) are responsible for the planning and implementation of these management unit inventories. Generally, the activities required for a Management Unit Inventory are defined in a VRI Strategic Implementation Plan (VSIP). A) VRI Strategic Inventory Plan (VSIP)
A VSIP outlines VRI activities and products needed to address forest management business and inventory issues in a given management unit. Plan development is co-ordinated by licensees. The plan not only provides a summary of technical issues and solutions associated with implementing a VRI, but it may also be used to secure local funding

VSIP Kalum TSA Page 39
March 31, 2004
support. For more information on the objectives of a VSIP, please refer to: http://www.for.gov.bc.ca/resinv/veginv/project/implementation/ground%5Fsampling%5F1999/02%2Dplan.htm For an example of recently prepared VSIP please refer to: (link to be established after posting of Mackenzie VSIP on website). Although the existing plans may not be totally current to present day business needs, and may be difficult to implement if funding availability changes, they can provide valuable strategic information. During the past several years, the TIB, MSRM has been developing VSIPs in consultation with local clients to fulfil specific forest management or business needs. Sampling error and sampling intensity were controlled for specific vegetation attributes (e.g., timber volume) to achieve specific inventory objectives. A variety of VSIPs were developed across several types of Implementation Units in the province such as TSAs, TFLs, and other areas (parks, private lands, and other public lands). Within (or across) these Implementation Units there may be Management Unit Inventories completed to address specific issues such as problem forest types, or other strata in a TSA (or groups of TSAs). B) VRI Project Implementation Plan (VPIP)
The second phase of implementing either a photo-interpreted or ground sampling VRI inventory is the development of a Project Implementation Plan (VPIP). The VPIPs are working documents that detail the specific operational activities associated with implementing and documenting the inventory activities identified in the VSIP. A VPIP defines the inventory needs, the information needed to meet those needs, and the methods for collecting the information. It also defines the operational responsibilities and quality assurance protocols necessary to ensure a successful project. For more information on preparing a VPIP, please refer to the Prince George District VPIP and guidelines posted at: http://www.for.gov.bc.ca/resinv/Veginv/Project/Implementation/Ground_Sampling_1999/00-TOC.htm
1.1.2 VRI Standards Resource Inventory Committee (RIC) Standards Approved standards for inventory data collection are required for all levels of inventory in British Columbia. For the VRI ground or photo-interpreted inventory, data collected must be consistent with the Resources Information Standards Committee (RISC) standards. For more information about RISC approved VRI standards, please refer to: http://www.for.gov.bc.ca/RIC/Pubs/teVeg/index.htm. Changes to the VRI standards can be requested through the Vegetation Inventory Co-ordinator, care of the Terrestrial Information Branch or through the VRI Change Management website at: http://www.for.gov.bc.ca/resinv/Veginv/ChangeMgmt01/change01.htm. Requests will be addressed through a Change Management Process carried out annually.
MONITORING INITIATIVES
1.2 CONSIDERATION FOR TRACKING CHANGE OVER TIME WAS NOT PART OF THE ORIGINAL VRI DESIGN. WITH THE RECENT INTEREST IN CHANGE DETECTION FOR THE ASSESSMENT OF SUSTAINABILITY, MONITORING PROTOCOLS ARE BEING DEVELOPED TO COLLECT DATA THAT WILL BE USED TO ASSESS SUSTAINABILITY AND OTHER EMERGING ISSUES. THIS IS AN EVOLVING PROCESS AND AS NEW PROTOCOLS ARE DEVELOPED, THEY WILL BE MADE AVAILABLE WITH

VSIP Kalum TSA Page 40
March 31, 2004
APPROPRIATE DOCUMENTATION AND FIELD PROCEDURES. AT PRESENT, ONLY THE PROVINCIAL CHANGE MONITORING PROTOCOL HAS BEEN ESTABLISHED AS A RIC STANDARD. WORK ON MONITORING COMMENCED IN THE MID-1990’S AND THE ON-GOING WORK AND PROGRESS IS DOCUMENTED AT: HTTP://WWW.FOR.GOV.BC.CA/RESINV/G&Y/PROJECTS.HTM.
The development of larger, multi-agency monitoring needs will be assessed in 2002 through the development of a high-level strategy to direct and support the design and implementation of an integrated, province-wide, environmental framework in the context of allied inventory, assessment and reporting activities. A second phase will develop a provincial strategy and begin with the implementation through clearly defined projects in fiscal 2002-03 (R. Keith Jones & Associates, January 2002). Results from this work will have a major impact on the current design and implementation of the VRI and other resource inventories.
2.1.1 Change Monitoring
Change monitoring is the independent check on the projected change or growth in a management unit. Related to this is change inventory which is the process of observing changes and trends over time in the level of the forest resource and change in the land cover classification between two or more time points. (J.S. Thrower and Associates, March 31, 2000) available as a March 2000 report at the following web site: http://www.for.gov.bc.ca/resinv/g&Y/Projects.htm
Change monitoring can be implemented at any level of spatial resolution, however, current MSRM efforts are directed at the provincial level (see section below on Provincial Change Monitoring Inventory (PCMI) Program.

VSIP Kalum TSA Page 41
March 31, 2004
2.1.2 Growth and Yield Monitoring
Growth and Yield Monitoring is a specific application of change monitoring information. It is the process of comparing estimated growth and yield data with statistically sampled ground sample data. More simply stated, it is a statistical check on an estimate that has usually been derived from a model. A number of proponent initiated management unit level monitoring pilots are currently underway. Sampling is most often directed at selected stands in second-growth forests. A stripped-down version of the PCMI Program plot has been adapted for this work. During the fall of 2002, TIB will establish minimum standards for these pilots to ensure the data meet provincial corporate needs. Although these plots are intended to check growth trends over time, they will also provide a change monitoring function.
2.1.3 Provincial Change Monitoring Inventory (PCMI) Program/National Forest Inventory
In order to provide timely and accurate “provincial” inventory information, TIB has developed ground sampling and photo-estimation procedures linked directly to the National Forest Inventory (NFI) initiative developed in co-operation with the Canadian Forestry Service (CFS). Information about this initiative is available at: http://www.pfc.cfs.nrcan.gc.ca/monitoring/inventory/canfi/cnfi%5Fe.html
The PCMI Program is the ground sampling component of British Columbia’s contribution to the NFI. The Canadian Council of Forest Ministers (CCFM) obliges the provinces to participate in a new national forest inventory that would provide data of consistent standards for national level reporting. These data are known as “indicators” and respond to over 40 criteria established by the CCFM and the Montreal Process. British Columbia has responded by establishing a network of 2,400 2km x 2km photo estimation plots on a 20 km grid. Information for these plots is “drilled” from existing forest inventory Geographic Information System (GIS) files. Within a subset of these samples, 314 fixed-area 0.04 ha. ground samples are being established. The plots will be remeasured in panels every five years. The PCMI Program is a stand-alone program; no other plots from other monitoring initiatives are to be included. TIB intends to drive provincial-level reporting from the two data sources. Field procedures are available at: http://www.for.gov.bc.ca/RIC/PUBS/TEVEG/cmi/index.htm For more information on the National Forest Inventory refer to: http://www.pfc.cfs.nrcan.gc.ca/monitoring/inventory/canfi/cnfi%5Fe.html.
The MSRM TIB, along with the CFS, is responsible for the implementation of the NFI. Data from the NFI will provide information for provincial reporting of vegetation resources status and change. The NFI standards and procedures are similar to the Provincial Change Monitoring Inventory Standards and Procedures. They are currently being field tested. For more information, please refer to http://www.for.gov.bc.ca/resinv/standard/fri_man.htm or contact the TIB MSRM.
2.1.4 Integration and Implementation of Management Unit Level Monitoring within the VRI
Inventory monitoring projects can be implemented on any spatial area but most commonly they have been on larger units such as TSAs, TFLs or Forest districts. TIB is currently assessing changes to VRI ground sampling procedures to ensure that adequate monitoring information to assess sustainability will be collected. As is the case for regular

VSIP Kalum TSA Page 42
March 31, 2004
inventory work, projects are driven by the needs of the stakeholder(s). The stakeholders (e.g. TFL holders, licensees or the MOF Regions/Districts) will be responsible for the planning and implementation of the monitoring component. Until provincial standards are in place for management units (scheduled for fall 2002), agencies wishing to develop monitoring projects should contact this branch. For more information, please refer to: http://www.for.gov.bc.ca/resinv/standard/fri_man.htm or contact the TIB MSRM.
CONCLUSION
The implementation models presented above, are supported by the agencies responsible for implementation and funding within British Columbia (e.g. MoF, MSRM, Forest Investment Vote(FIV)). The current Implementation Plan has changed in response to client needs and funding realities. The information supplied is current as of March 2002 and is subject to change.
Further Information
For more information regarding the VRI standards and best practice requirements for Forest Investment Account funding eligibility please see the following web site: http://www.for.gov.bc.ca/resinv/fia/vri.htm.
References: J.S. Thrower and Associates, March 31, 2000, Graphical and Statistical Analysis for Monitoring Estimates of Change at the Management Unit Level, Prepared for J. Vivian, Resources Inventory Branch, Ministry of Forests.