Kakadu National Park - Department of the Environment · 5.3.3 Changes to Fire Regimes 162 5.4...
268
Kakadu National Park Ecological Character Description Ramsar Site Image credits: M. McAulay & DEWHA; J. Baker; S. Stuart-Smith; M. McAulay & DEWHA; B. Furby
-
Upload
hoangkhanh -
Category
Documents
-
view
215 -
download
0
Transcript of Kakadu National Park - Department of the Environment · 5.3.3 Changes to Fire Regimes 162 5.4...
Kakadu National Park
Ecological Character Description
Ramsar Site
Image credits: M. McAulay & DEWHA; J. Baker; S. Stuart-Smith; M. McAulay & DEWHA; B. Furby
CONTENTS
I
CONTENTS
Contents i
List of Figures iv
List of Tables vii
Acknowledgments ix
List of Abbreviations xi
Executive Summary xiii
1 INTRODUCTION 1
1.1 Background 1
1.2 Scope and Purpose of this Study 2
1.3 Relevant Treaties, Legislation and Regulations 5
1.3.1 Australian Government Legislation or Policy Instruments 5
1.3.2 Northern Territory Legislation or Policy Instruments 9
1.4 Key Terminology and Concepts 10
1.4.1 Wetland Processes 10
1.4.2 Wetland Components 10
1.4.3 Wetland Services/Benefits 11
1.4.4 Interaction of Wetland Elements 11
1.4.5 Bioregionalisation Scheme 12
2 DESCRIPTION OF THE SITE 16
2.1 Details of the Site- Summary 16
2.2 Location and Brief Description 16
2.3 Land Use and Tenure 21
2.3.1 Tenure and Land Use within the Site 21
2.3.2 Tenure and Land Use Adjacent to the Site 22
2.4 Description of Wetland Types 23
2.4.1 Marine/Coastal Wetland Types Present 27
2.4.2 Inland Wetland Types Present 34
2.4.3 Discrepancies with the 1998 RISs 41
2.5 Nomination Criteria Met by the Site 42
2.5.1 Criteria Under which the Site was Designated 42
2.5.2 Assessment Based on Current Information and Ramsar Criteria 45
CONTENTS
II
2.5.3 Criterion 1 46
2.5.4 Criterion 2 48
2.5.5 Criterion 3 51
2.5.6 Criterion 4 53
2.5.7 Criterion 5 55
2.5.8 Criterion 6 56
2.5.9 Criterion 7 57
2.5.10 Criterion 8 58
2.5.11 Criterion 9 59
3 CRITICAL COMPONENTS, PROCESSES AND SERVICES/BENEFITS 61
3.1 Study Approach 61
3.1.1 Background 61
3.1.2 Environmental Values Identified by the Fox Review 61
3.2 Overview of Critical Services, Components and Processes 63
3.3 Critical Components 66
3.3.1 C1 – Mangroves 66
3.3.2 C2 - Melaleuca Forests 69
3.3.3 C3 – Palustrine Wetlands and Billabongs 72
3.3.4 C4 – Waterfalls, Seeps and Waterholes 74
3.3.5 C5 - Populations of Migratory and Resident Waterbirds 74
3.3.6 C6 – Populations of Freshwater Fish 77
3.3.7 C7 – Populations of Freshwater and Saltwater Crocodiles 81
3.3.8 C8 – Populations of Threatened Sharks 85
3.3.9 C9 - Yellow Chat Populations 86
3.3.10 C10 - Pig-nosed Turtle Populations 89
3.3.11 C11 – Locally Endemic Invertebrate Species 91
3.4 Supporting Components 92
3.4.1 Seagrass 92
3.4.2 Monsoon Rainforests and Riparian Vegetation 92
3.4.3 Other Wetland Habitats 93
3.4.4 Terrestrial Habitats 93
3.4.5 Aquatic Invertebrates 94
3.4.6 Regionally Endemic Species 94
3.5 Critical Processes 95
3.5.1 P1 – Fluvial Hydrology 95
3.5.2 P2 - Fire Regimes 98

CONTENTS
III
3.5.3 P3 – Breeding of Waterbirds 99
3.5.4 P4 – Flatback Turtle Nesting 101
3.6 Supporting Processes 103
3.6.1 Climate 103
3.6.1.1 Seasonal Cycles 103
3.6.1.2 Long-term Cycles 105
3.6.1.3 Extreme Climatic Events 106
3.6.2 Geology and Geomorphology 106
3.6.2.1 Geology 106
3.6.2.2 Geomorphology 107
3.6.3 Tidal Hydraulics 110
3.6.4 Water Quality 110
3.6.5 Groundwater 114
3.6.6 General Ecosystem/Biological Processes 117
3.6.6.1 Nutrient Cycling 117
3.6.6.2 Aquatic Foodwebs 117
3.7 Critical Services/Benefits 118
3.7.1 S1 – Maintenance of Global Biodiversity 118
3.7.2 S2 – Fisheries Resource Values 121
3.7.2.1 Habitats 121
3.7.2.2 Barramundi Abundance 123
3.7.3 S3 – Contemporary Living Culture 124
3.8 Supporting Services/Benefits 127
3.8.1 Recreation and Tourism 127
3.8.2 Scientific Research and Education 130
3.8.3 Historical Cultural Heritage 132
3.8.4 Biological Products 133
3.8.5 Sites and Items of Cultural Significance 134
3.9 Conceptual Models 136
4 LIMITS OF ACCEPTABLE CHANGE 145
4.1 Background 145
4.2 Derivation of Limits of Acceptable Change 146
4.2.1 Natural Variability and Probability Based LACs 146
4.3 Summary of Limits of Acceptable Change 149
5 OVERVIEW OF CURRENT AND FUTURE THREATS 158
5.1 Exotic Flora 159

LIST OF FIGURES
IV
5.2 Exotic Fauna 160
5.3 Climate Change 161
5.3.1 Saltwater Intrusion into Freshwater Areas 161
5.3.2 Mangrove Expansion 162
5.3.3 Changes to Fire Regimes 162
5.4 Tourism and Recreational Activities 162
5.5 Mining Activities 163
5.6 Public Safety and Crocodiles 163
5.7 Damage to Archaeological Resources and Rock Art 164
5.8 Living Resource Extraction 164
6 CHANGES TO ECOLOGICAL CHARACTER 165
6.1 Ecological Character Change Methods 165
6.1.1 Assessment of Listing Criteria 165
6.1.2 Potential Changes to Ecological Character Since Listing 165
6.1.3 Assessment of Ecological Character Changes Against LACs 172
7 INFORMATION GAPS, MONITORING AND EDUCATION 177
7.1 Information Gaps 177
7.2 Monitoring Needs 179
7.3 Communication, Education, Participation and Awareness 180
8 REFERENCES 182
9 GLOSSARY 203
APPENDIX A: PROJECT COMMITTEES 206
APPENDIX B: DETAILED METHODS 209
APPENDIX C: FAUNA SPECIES LISTS 215
APPENDIX D: ENDEMIC SPECIES DISTRIBUTIONS 232
APPENDIX E: CURRICULUM VITAE OF PRIMARY AUTHORS 237
LIST OF FIGURES
LIST OF FIGURES
V
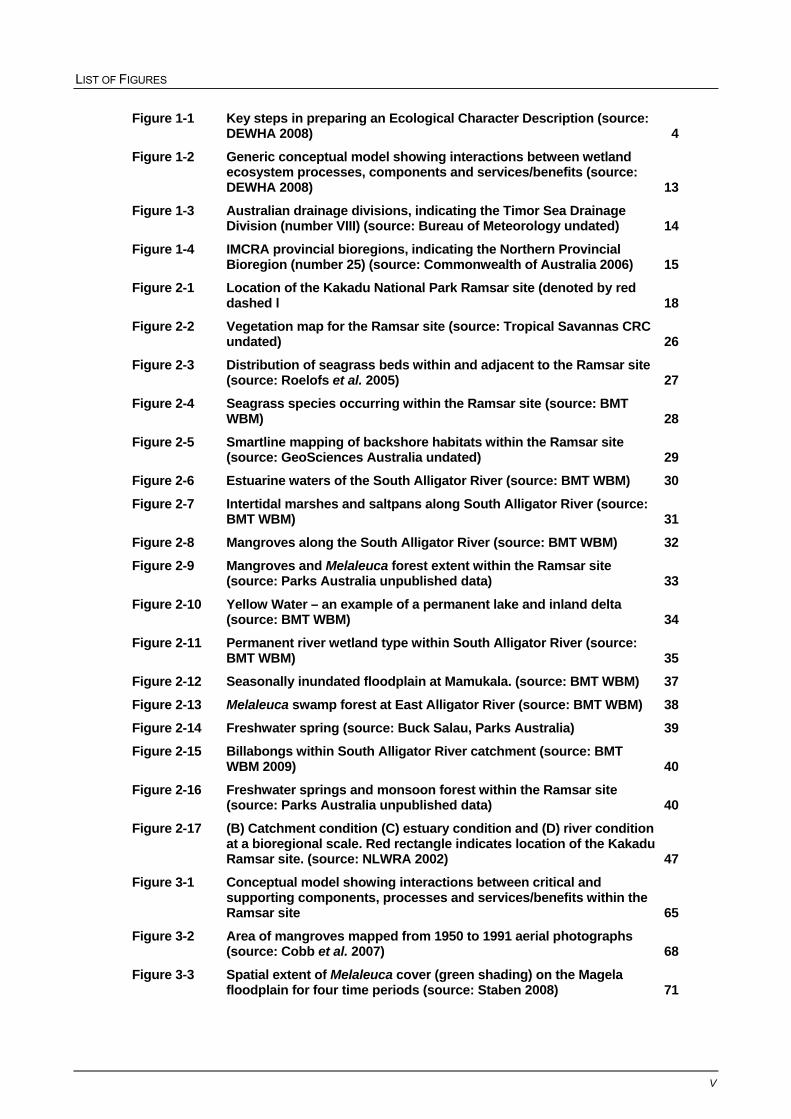
Figure 1-1 Key steps in preparing an Ecological Character Description (source: DEWHA 2008) 4
Figure 1-2 Generic conceptual model showing interactions between wetland ecosystem processes, components and services/benefits (source: DEWHA 2008) 13
Figure 1-3 Australian drainage divisions, indicating the Timor Sea Drainage Division (number VIII) (source: Bureau of Meteorology undated) 14
Figure 1-4 IMCRA provincial bioregions, indicating the Northern Provincial Bioregion (number 25) (source: Commonwealth of Australia 2006) 15
Figure 2-1 Location of the Kakadu National Park Ramsar site (denoted by red dashed l 18
Figure 2-2 Vegetation map for the Ramsar site (source: Tropical Savannas CRC undated) 26
Figure 2-3 Distribution of seagrass beds within and adjacent to the Ramsar site (source: Roelofs et al. 2005) 27
Figure 2-4 Seagrass species occurring within the Ramsar site (source: BMT WBM) 28
Figure 2-5 Smartline mapping of backshore habitats within the Ramsar site (source: GeoSciences Australia undated) 29
Figure 2-6 Estuarine waters of the South Alligator River (source: BMT WBM) 30
Figure 2-7 Intertidal marshes and saltpans along South Alligator River (source: BMT WBM) 31
Figure 2-8 Mangroves along the South Alligator River (source: BMT WBM) 32
Figure 2-9 Mangroves and Melaleuca forest extent within the Ramsar site (source: Parks Australia unpublished data) 33
Figure 2-10 Yellow Water – an example of a permanent lake and inland delta (source: BMT WBM) 34
Figure 2-11 Permanent river wetland type within South Alligator River (source: BMT WBM) 35
Figure 2-12 Seasonally inundated floodplain at Mamukala. (source: BMT WBM) 37
Figure 2-13 Melaleuca swamp forest at East Alligator River (source: BMT WBM) 38
Figure 2-14 Freshwater spring (source: Buck Salau, Parks Australia) 39
Figure 2-15 Billabongs within South Alligator River catchment (source: BMT WBM 2009) 40
Figure 2-16 Freshwater springs and monsoon forest within the Ramsar site (source: Parks Australia unpublished data) 40
Figure 2-17 (B) Catchment condition (C) estuary condition and (D) river condition at a bioregional scale. Red rectangle indicates location of the Kakadu Ramsar site. (source: NLWRA 2002) 47
Figure 3-1 Conceptual model showing interactions between critical and supporting components, processes and services/benefits within the Ramsar site 65
Figure 3-2 Area of mangroves mapped from 1950 to 1991 aerial photographs (source: Cobb et al. 2007) 68
Figure 3-3 Spatial extent of Melaleuca cover (green shading) on the Magela floodplain for four time periods (source: Staben 2008) 71
LIST OF FIGURES
VI
Figure 3-4 Generalised vegetation class changes on the Magela floodplain between 1983 and 2003 (source: Boyden et al. 2008) 73
Figure 3-5 Changes in non-hatchling densities of saltwater crocodiles for all four major rivers surveyed in Kakadu National Park – combined data (source: Britton 2009) 83
Figure 3-6 Changes in non-hatchling densities of saltwater crocodiles for Wildman River (WLDM), West Alligator River (WAR), South Alligator River (SAR) and East Alligator River (EAR) (source: Britton 2009) 84
Figure 3-7 Total freshwater crocodile sightings over time at each location (source: Kakadu National Park, unpublished data) 85
Figure 3-8 Yellow chat records for Kakadu National Park (source: Parks Australia unpublished and Armstrong 2004) 88
Figure 3-9 Map of know dry season distribution of pig-nosed turtle in the Ramsar site (source: Georges and Kennett 1989) 90
Figure 3-10 Changes in area of monsoon rainforest within Kakadu National Park (source: Banfai and Bowman 2006) 93
Figure 3-11 Monthly flow at three representative gauging stations in KNP (source: Australian Natural Resources Atlas website, data from 1958 to 1999) 97
Figure 3-12 Areas burnt per year for Kakadu National Park (a) and various landscape types (b to d) (source: Gill et al. 2000) 99
Figure 3-13 Mean (error bars = SD) and maximum number of nesting attempts per night, and numbers of nesting individuals per survey night recorded at Field Island (1990-2001) (source: Schäuble et al. 2006) 102
Figure 3-14 Mean maximum and minimum temperature at Jabiru Airport between 1971 and 2009. Upper and lower error bars denote the 90th and 10th percentiles (source: Bureau of Meteorology unpublished data) 104
Figure 3-15 Mean monthly rainfall and mean number of rain days at Jabiru Airport between 1971 and 2009. Upper and lower error bars denote the 90th and 10th percentiles (source: Bureau of Meteorology unpublished data) 104
Figure 3-16 Cusum plots (cumulative sum of mean deviations) of magpie goose numbers (white symbols) in the Northern Territory and Katherine River flow (black symbols) Figure reproduced from Bayliss et al. (2008) 105
Figure 3-17 Total number of tropical cyclones in the Northern Territory between 1963 and 2006 by category, where C5 is the most destructive category (source: Bureau of Meteorology) 106
Figure 3-18 Typical cross section of (top) upper estuary and (bottom) lower estuary 109
Figure 3-19 Water quality gauging stations in Kakadu National Park 113
Figure 3-20 Seasonal pattern of conductivity and nutrient concentrations (total nitrogen and ammonia) at gauging station G8210017 114
Figure 3-21 Groundwater within Kakadu National Park (source: Ticknell 2008) 116
Figure 3-22 Main reasons for visiting Kakadu National Park (source: Tremblay 2007) 128
Figure 3-23 Total international visitors numbers for Kakadu National Park (1998-2003 combined) (source: Morse et al. 2005) 129
LIST OF TABLES
VII
Figure 3-24 Annual visitor numbers to Kakadu National Park in the 1980s (source: Commonwealth of Australia 1988) 130
Figure 3-25 Ramsar signage at Mamukala wetlands (source: BMT WBM) 132
Figure 3-26 Overview of wetland conceptual models 138
Figure 3-27 Shoreline and island conceptual model 141
Figure 3-28 River floodplains and billabongs (dry season) conceptual mode 142
Figure 3-29 River floodplains and billabongs (wet season) conceptual model 143
Figure 3-30 Upper catchment, escarpment and stone country conceptual model 144
LIST OF TABLES
Table 2-1 Site details and location description for the Kakadu National Park Ramsar site, both historically (pre-merger) and current (merged sites) 17
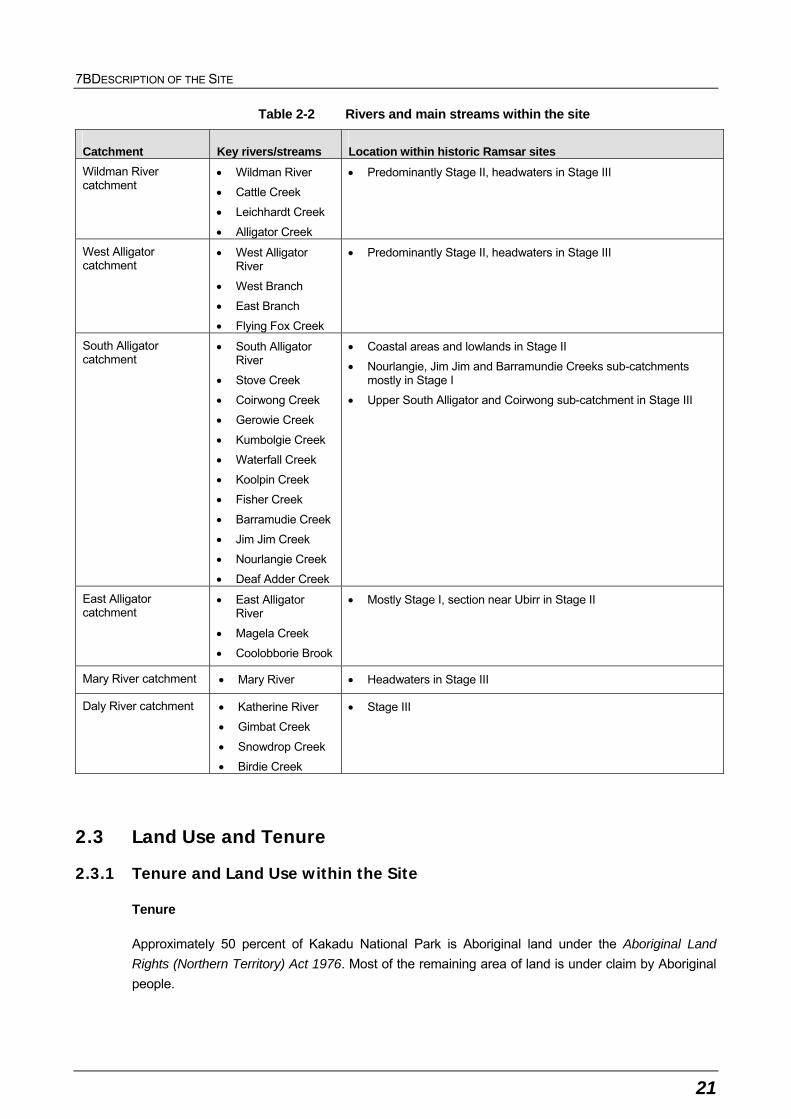
Table 2-2 Rivers and main streams within the site 21
Table 2-3 Coastal wetland types and representative examples within Kakadu National Park Ramsar site 24
Table 2-4 Inland wetland types and representative examples within Kakadu National Park Ramsar site 25
Table 2-5 Criteria for identifying Wetlands of International Importance as at listing, as documented in 1989 and 1995 RISs 42
Table 2-6 Summary of nomination criteria met by the two historic Kakadu National Park Ramsar sites as outlined in the 1998 RIS, and the current Kakadu National Park ECD 43
Table 2-7 Justification for criterion 1 48
Table 2-8 Threatened wetland-dependent species 50
Table 2-9 Ramsar nomination criterion 3 52
Table 3-1 Summary of critical and supporting components, processes and services/benefits 64
Table 3-2 Mangrove area and canopy height mapped from 1990 aerial photography (source: Mitchell et al. 2007) 67
Table 3-3 Number of Melaleuca trees on the Magela Floodplain (source: Riley and Lowry 2002) 70
Table 3-4 Mean abundance (number fish per 50 metres) of fish species from Mudginberri and Sandy billabongs for the period 1994 to 2005 (source: Humphrey et al. 2005) 80
Table 3-5 Saltwater crocodile densities prior to site listing in 1980 (Stage I) or 1989 (Stage II) (source: Britton 2009) 83
Table 3-6 Flow statistics for three representative gauging stations in KNP (source: Australian Natural Resources Atlas website, data from 1958 to 1999) 97
Table 3-7 Water quality data (80th percentiles; 20th and 80th percentiles for dissolved oxygen and pH) from gauging stations in the Kakadu National Park catchment and comparison to ANZECC guideline values. Values in red denote exceedance of guideline limits. (source: NRETAS unpublished data) 112
LIST OF TABLES
VIII
Table 3-8 Threatened wetland species that have critical habitats within the Ramsar site 120
Table 3-9 Key catchment, estuary and flow descriptors for each catchment within Kakadu National Park 122
Table 3-10 Native animal and plant species in the Aboriginal diet (source: Lucas and Russell-Smith 1993) 134
Table 4-1 Statistical measures describing LACs 148
Table 4-2 Critical components, processes and services/benefits, and relevant LAC indicators 150
Table 4-3 Limits of acceptable change (LAC) 151
Table 5-1 Summary of major threats to the Kakadu National Park Ramsar site 158
Table 5-2 Threat Consequence Categories 159
Table 5-3 Summary of Aerial Feral Animal Management Program 2008-2009 160
Table 6-1 A summary of ecological and management issues associated with feral fauna species. (after Bradshaw et al. 2007) 170
Table 6-2 Assessment of ecological character changes against LAC 174
Table 7-1 Summary of information/knowledge gaps 177
ACKNOWLEDGMENTS
IX
ACKNOWLEDGMENTS
This report was prepared by BMT WBM Pty Ltd with expert input from Austecology Pty Ltd and
Melaleuca Enterprises under contract to the Department of Sustainability, Environment, Water,
Population and Communities.
The consultant project team wish to express their thanks to the members of the Inter-Governmental
Steering Group and Knowledge Management Committee formed for the project for their assistance
and guidance.
Photos that appear in the report are supplied by BMT WBM or other organisations where noted.
Figures that have been reproduced (without modification) from other sources have been referenced
accordingly.
Disclaimer: In undertaking this work the authors have made every effort to ensure the accuracy of
the information used. Any conclusions drawn or recommendations made in the report are done in
good faith and BMT WBM take no responsibility for how this information and report are used
subsequently by others.
The views and opinions expressed in this publication are those of the authors and do not necessarily
reflect those of the Australian Government or the Minister for Sustainability, Environment, Water,
Population and Communities or the Administrative Authority for Ramsar in Australia.
While reasonable efforts have been made to ensure the contents of this publication are factually
correct, the Australian Government does not accept responsibility for the accuracy or completeness
of the contents, and shall not be liable for any loss or damage that may be occasioned directly or
indirectly through the use of, or reliance on, the contents of this publication. Guidance on the
development of Ecological Character Descriptions, including Limits of Acceptable change, are areas
of active policy development. Accordingly there may be differences in the type of information
contained in this Ecological Character Description, to those of other Ramsar wetlands.
This information does not create a policy position to be applied in statutory decision making. Further it
does not provide assessment of any particular action within the meaning of the EPBC Act, nor
replace the role of the Minister or his delegate in making an informed decision on any action.
This report is not a substitute for professional advice rather it is intended to inform professional
opinion by providing the authors' assessment of available evidence on change in ecological
character. This information is provided without prejudice to any final decision by the Administrative
Authority for Ramsar in Australia on change in ecological character in accordance with the
requirements of Article 3.2 of the Ramsar Convention. Users should obtain any appropriate
professional advice relevant to their particular circumstances.
Use of terms and information sources: All definitions and terms used in this draft report were
correct at the time of production in June 2010. Refer to the References (Section 8) for works cited
and Glossary (Section 8) for a list of key terms and terminology used.

ACKNOWLEDGMENTS
X
Citation: This report can be cited as follows:
BMT WBM (2010) Ecological Character Description for Kakadu National Park Ramsar Site. Prepared
for the Australian Government Department of Sustainability, Environment, Water, Population and
Communities.
LIST OF ABBREVIATIONS
XI
LIST OF ABBREVIATIONS
ANZECC/ARMCANZ: Australian and New Zealand Environment and Conservation Council and
Agriculture and Resource Management Council of Australia and New
Zealand
ARRTC: Alligator Rivers Region Technical Committee
ARR: Alligator Rivers Region
BTEC: Brucellosis and Tuberculosis Eradication Campaign
CAMBA: China-Australia Migratory Bird Agreement
CDU: Charles Darwin University
CEPA: Communication, education, participation and awareness
CMS: Convention on the Conservation of Migratory Species
CPUE: Catch Per Unit Effort
CRC: Cooperative Research Centre (for Tropical Savannas Management)
CSIRO: Commonwealth Scientific and Industrial Research Organisation
DSEWPAC: Department of Sustainability, Environment, Water, Population and
Communities
ECD: Ecological Character Description
EPBC: Commonwealth Environment Protection and Biodiversity Conservation Act
1999 and regulations under that Act
eriss: Environmental Research Institute of the Supervising Scientist
HAT: Highest Astronomical Tide
IMCRA: Integrated Marine and Coastal Regionalisation of Australia
IUCN: International Union for Conservation of Nature
JAMBA: Japan-Australia Migratory Bird Agreement
KMC: Knowledge Management Committee
KRA: Key Result Area
KRAC: Kakadu Research Advisory Committee
LIST OF ABBREVIATIONS
XII
LAC: Limit(s) of Acceptable Change
MA: Millennium Ecosystem Assessment
LAT: Lowest Astronomical Tide
NES: (matter of) National Environmental Significance
NLC: Northern Land Council
NRM: Natural Resource Management
NRETAS: Northern Territory Department of Natural Resources, Environment, the Arts
and Sport (previously NRETA)
NT: Northern Territory
OSS: Office of the Supervising Scientist
RIS: Ramsar Information Sheet
ROKAMBA: Republic of Korea- Australia Migratory Bird Agreement
sp.: Species (singular)
spp.: Species (plural)
TRaCK: Tropical Rivers and Coastal Knowledge
TSSC: Threatened Species Scientific Committee
EXECUTIVE SUMMARY
XIII
EXECUTIVE SUMMARY
The Kakadu National Park Ramsar site is listed as a Wetland of International Importance under the
“Convention on Wetlands of International Importance especially as Waterfowl Habitat” or, as it is
more commonly referred to, the Ramsar Convention (the Convention).
This report provides the Ecological Character Description (ECD) for the Kakadu National Park
Ramsar site, and has been prepared in accordance with the National Framework and Guidance for
Describing the Ecological Character of Australia’s Ramsar Wetlands (DEWHA 2008). This is the first
ECD prepared for the site. In parallel with the preparation of the ECD, the Ramsar Information Sheet
(RIS) for the site has been updated for submission to the Australian Government and Ramsar
Secretariat.
The Kakadu National Park Ramsar site is located approximately 200 kilometres east of Darwin in the
Northern Territory. The Kakadu National Park Ramsar site was historically two separate Ramsar sites
within Kakadu National Park. These were Kakadu National Park (Stage I including wetland
components of Stage III) and Kakadu National Park (Stage II). Kakadu National Park Stage I was
originally listed as a Ramsar site in 1980 and expanded in 1995 to include wetland components of
Stage III, while Stage II was listed in 1989 as a separate Ramsar site. The separate listing under the
Stages reflected the historical listing of the area as a World Heritage site and a national park.
The Kakadu National Park (Stage I including wetland components of Stage III) Ramsar site
comprised of all lands and waters in the eastern portion of the Kakadu National Park, following the
eastern boundary of the Park along the East Alligator River and including the Nourlangie, Jim Jim and
Barramundi Creeks. In 1995, the boundaries of site number two were extended to include only the
wetland habitats within the eastern and southern areas of Kakadu National Park (Stage III).
Kakadu National Park (Stage II) Ramsar site encompassed all lands and waters situated in the
northern and western part of the National Park, including the Wildman, West Alligator and South
Alligator River systems and their floodplains, following the western Kakadu National Park boundary.
The Stage II area also included both Field Island and Barron Island within Van Diemen Gulf to the low
water mark.
In April 2010, the two Ramsar sites were merged together to form a single Ramsar site, called
Kakadu National Park. In addition, the site was extended by approximately 600 000 hectares to
include all remaining areas of Stage III. The merger and extension bought the Ramsar boundary in
line with the existing boundary of the national park.
Ecological Character Descriptions describe the ecological character of a wetland at the time of its
listing as a Wetland of International Importance. Although Kakadu National Park is now a single
Ramsar site, it is important to report baseline data that reflects the different listing dates of the three
Stages.
The Ramsar site is bounded by the following geographic features:
Van Diemen Gulf and the Timor Sea in the north
the East Alligator River and Arnhem Land in the east
EXECUTIVE SUMMARY
XIV
Wildman and Mary River catchments in the west, and
Arnhem Land plateau to the south.
Approximately 50 percent of Kakadu National Park is Aboriginal land under the Aboriginal Land
Rights (Northern Territory) Act 1976. Most of the remaining area of land is under claim by Aboriginal
people. Title to Aboriginal land in the Park is held by Aboriginal Land Trusts that have leased their
land to the Director of National Parks (under the Environment Protection and Biodiversity
Conservation Act 1999) for the purpose of being managed as a Commonwealth Reserve. Land in the
Park that is not Aboriginal land is vested in the Director.
The Kakadu National Park Ramsar site is composed of a diversity of coastal and inland wetland
types. Wetland types present range from intertidal forested wetlands and mudflats, to seasonal
freshwater marshes and permanent freshwater pools. Using the Ramsar typology, there are five
coastal types and eight inland types within the Stage I and Stage III area. Within the Stage II area,
there are nine coastal types and seven inland types.
The ECD has reviewed the Ramsar Nomination Criteria under which the two original Ramsar sites
were listed as Wetlands of International Importance, and examined the applicability of the revised and
new Criteria under the Convention that have been added since the sites were originally listed in 1980
and 1989. In this context, Kakadu National Park is now seen as meeting all nine Nomination Criteria
of the Convention, recognising the representative wetland habitats of the site at a bioregional level,
support of populations of vulnerable wetland species, its characteristics as a centre of endemism and
high biodiversity including its diversity of habitats, support for key life-cycle functions such as
waterbird breeding and refugia values, its importance for supporting substantial populations of
waterbirds and fish diversity and fish nursery and spawning habitats and its support of at least one
percent of the national population of several non-avian wetland species.
Critical components of the Ramsar site include key wetland habitats and populations of waterbirds,
freshwater fish, aquatic invertebrates, turtle and crocodiles. The critical ecosystem processes that
underpin the habitats of the Kakadu National Park Ramsar site include hydrology, fire regimes and
notable biological processes, with supporting processes including climate, tidal hydraulics,
groundwater, water quality, geology and geomorphology.
The wetland components and processes of the site support a broad range of ecosystem
services/benefits including support of threatened fauna, support of endemic species, fisheries
resource values and contemporary living culture. Additionally, cultural and socio-economic services
are equally diverse, noting the particular importance of the wetlands of the site to the traditional
owners and caretakers of Kakadu National Park (the ‘Bininj’), as well as tourism and recreational
values.
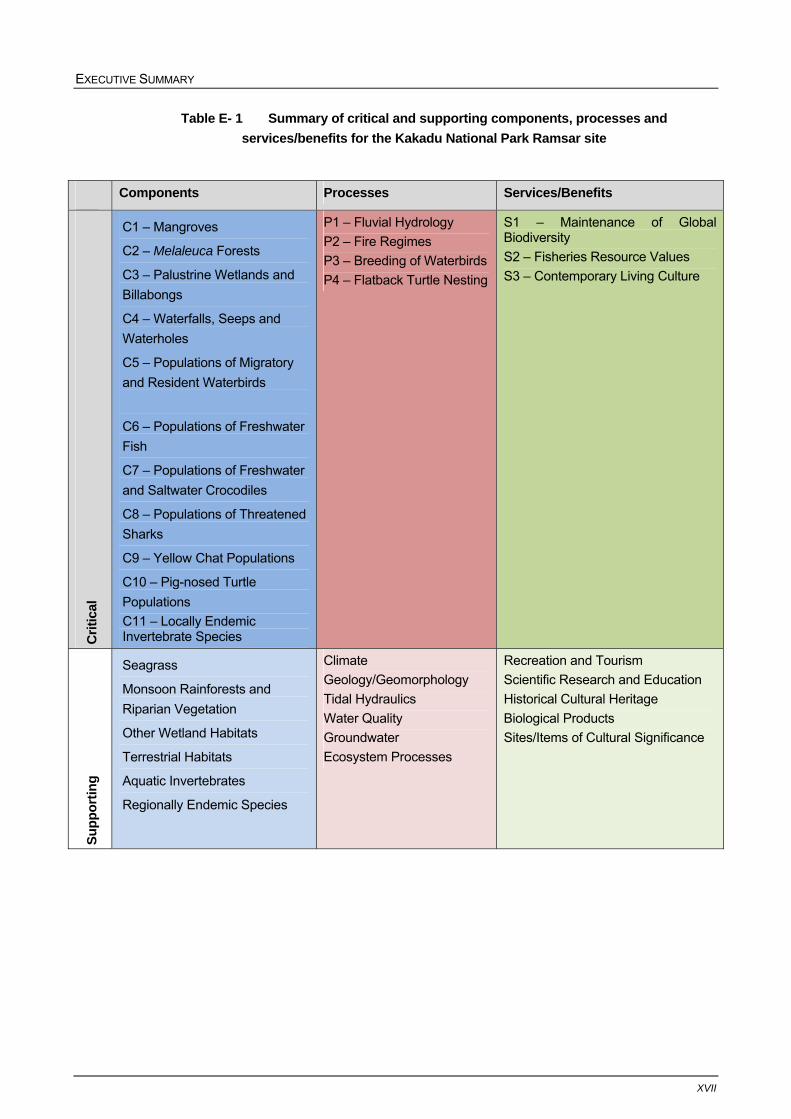
A summary of the critical services/benefits provided by the Kakadu National Park Ramsar site and
the underlying critical ecosystem components and processes nominated by this ECD is given in
Table E-1. The critical wetland services/benefits nominated were based on the attributes of the site
described in the Ramsar Nomination Criteria as well as identifying critical ‘cultural’ services/benefits
provided by the site in terms of human use. The critical wetland components and processes have
been selected based on the particular characteristics of Kakadu National Park and on the basis that
they underpin the critical services/benefits, but may also be critical in their own right.
EXECUTIVE SUMMARY
XV
As required by the National Framework document, the study has:
sought to define the natural variability and limits of acceptable change (LACs) for the critical
components, processes and services/benefits identified
examined ecological character changes that have been observed or documented since listing of
the sites in 1980 and 1989 (including assessment against relevant LACs), and
investigated current and future threats to ecological character.
While the level of quantitative information and data needed to provide a more definitive assessment
of ecological character change (and to set more definitive LACs as sought by the National
Framework) are not available, it would appear unlikely that any of the LACs presented in the ECD
have been meaningfully exceeded. It is noted however that saltwater intrusion processes have
possibly degraded freshwater billabongs and other palustrine wetlands and Melaleuca communities.
The effect of saltwater intrusion in the floodplain areas of the Park has had the effect of changing the
spatial characteristics and distribution of tidal creeks and associated mangrove environments over a
long time period, often at the expense of predominantly freshwater systems. This includes the loss of
several freshwater billabong environments located proximal to the tidal channels and at the fresh-salt
interface areas of the major river systems, noting that these features have both ecological and
cultural significance in terms of traditional food sources and traditional customary usage. However,
the extent to which saltwater intrusion represents an ecological character change is difficult to assess
noting that saltwater intrusion into Kakadu National Park’s freshwater wetlands is a continuous
natural process. A key factor to be considered is whether the environmental change or the rate of
change can be perceived as having an anthropogenic source.
Recent or continuing threats that are notable in the context of the site that may affect future ecological
character include:
introduction and/or proliferation of exotic flora and fauna
climate change
tourism and recreational activities (including boating)
mining activities
damage to archaeological resources and rock art, and
living resource extraction.
Of these threats, future impacts from climate change in terms of increased saltwater intrusion and
impacts from the continuing persistence and spread of cane toads are seen as the most likely and
potentially severe.
Information gaps, monitoring needs and recommendations in relation to communication, education,
participation and awareness messages are also identified in the ECD. Key information gaps in the
context of this ECD require:
additional research and monitoring to establish an ecological character baseline for the key
habitats

EXECUTIVE SUMMARY
XVI
better information and data sets about the presence and natural history of critical wetland species
and their habitats including for example, surveys of threatened plant species, aquatic fauna
species such as the river shark species and more systematic surveys of important avifauna and
fish species and populations
better information and understanding about the natural variability of wetland fauna populations
and key attributes and controls on those populations
additional investigation of the ecological character thresholds of particular habitats and
communities to changes in key attributes/controls such as hydrology. The LACs stated in the
ECD should be reviewed and revised as improved information becomes available, and
more specific assessment of the vulnerability of the site to the impacts of climate change, and
adaptation options that could be explored to reduce the future impacts.
In accordance with the above, monitoring needs and recommendations presented in this ECD relate
broadly to obtaining data to assess future changes to ecological character as defined by the critical
components, processes and services/benefits associated LACs for the site. Since the monitoring
needs are quite extensive, a broad scale ecosystem health-based monitoring program may be most
appropriate for the Ramsar site using lessons learned from similar approaches elsewhere. Emphasis
should be placed on the collection of data and information about critical and supporting process
indicators, such as water quality and biotic indicators of ecosystem health.
A combined set of communication, education, participation and awareness messages relevant to the
ECD have been presented and can be used to communicate the importance of the site, why it was
listed, possible changes to ecological character, the threats to the site and future actions required.
These messages also serve as a summary of the key findings and conclusions of the ECD study.
EXECUTIVE SUMMARY
XVII
Table E- 1 Summary of critical and supporting components, processes and
services/benefits for the Kakadu National Park Ramsar site
Components Processes Services/Benefits
Cri
tica
l
C1 – Mangroves
C2 – Melaleuca Forests
C3 – Palustrine Wetlands and
Billabongs
C4 – Waterfalls, Seeps and
Waterholes
C5 – Populations of Migratory
and Resident Waterbirds
C6 – Populations of Freshwater
Fish
C7 – Populations of Freshwater
and Saltwater Crocodiles
C8 – Populations of Threatened
Sharks
C9 – Yellow Chat Populations
C10 – Pig-nosed Turtle
Populations
C11 – Locally Endemic Invertebrate Species
P1 – Fluvial Hydrology
P2 – Fire Regimes
P3 – Breeding of Waterbirds
P4 – Flatback Turtle Nesting
S1 – Maintenance of Global Biodiversity
S2 – Fisheries Resource Values
S3 – Contemporary Living Culture
Su
pp
ort
ing
Seagrass
Monsoon Rainforests and
Riparian Vegetation
Other Wetland Habitats
Terrestrial Habitats
Aquatic Invertebrates
Regionally Endemic Species
Climate
Geology/Geomorphology
Tidal Hydraulics
Water Quality
Groundwater
Ecosystem Processes
Recreation and Tourism
Scientific Research and Education
Historical Cultural Heritage
Biological Products
Sites/Items of Cultural Significance
6BINTRODUCTION
1
1 INTRODUCTION
This Section provides general information about the Ecological Character Description (ECD) process
and the Kakadu National Park Ramsar site.
1.1 Background
The Kakadu National Park Ramsar site was historically two separate Ramsar sites within Kakadu
National Park. These were Kakadu National Park (Stage I including wetland components of Stage III)
and Kakadu National Park (Stage II). Kakadu National Park Stage I was originally listed as a Ramsar
site in 1980 and expanded in 1995 to include wetland components of Stage III, while Stage II was
listed in 1989 as a separate Ramsar site. The separate listing under the Stages reflected the
historical listing of the area as a World Heritage site and a national park.
The Kakadu National Park (Stage I including wetland components of Stage III) Ramsar site
comprised of all lands and waters in the eastern portion of the Kakadu National Park, following the
eastern boundary of the Park along the East Alligator River and including the Nourlangie, Jim Jim and
Barramundi Creeks. In 1995, the boundaries of site number two were extended to include only the
wetland habitats within the eastern and southern areas of Kakadu National Park (Stage III).
Specifically, the Stage III area encompasses the in-stream waters, waterholes and associated
tributaries of the South Alligator River commencing at the western border of Kakadu National Park
Stage I and following the river corridors southwards to the headwaters, and including the wetlands
located on the Marrawal Plateau.
Kakadu National Park (Stage II) encompassed all lands and waters situated in the northern and
Western part of the National Park, including the Wildman, West Alligator and South Alligator River
systems and their floodplains, following the western Kakadu National Park boundary. The Stage II
area also includes both Field Island and Barron Island within Van Diemen Gulf to the low water mark.
In April 2010, the two Ramsar sites were merged together to form a single Ramsar site, called
Kakadu National Park. In addition, the site was extended by approximately 600 000 hectares to
include all remaining areas of Stage III. The merger and extension bought the Ramsar boundary in
line with the existing boundary of the national park.
Kakadu National Park is co-managed by Indigenous owners and the Director of National Parks
through a joint management board. Three excisions from the National Park and Ramsar site
encompass mining lease areas (Uranium) and freehold land.
The Ramsar Convention sets out the need for contracting parties to conserve and promote wise use
of wetland resources. In this context, an assessment of ecological character of each listed wetland is
a key concept under the Ramsar Convention.
Under Resolution IX.1 Annex A: 2005, the ecological character of a wetland is defined as:
The combination of the ecosystem components, processes and benefits/services that characterise
the wetland at a given point in time.

6BINTRODUCTION
2
The definition indicates that ecological character has a temporal component, generally using the date
of listing under the Convention as the point for measuring ecological change over time. As such, the
description of ecological character should identify a wetland’s key attributes and provide an
assessment point for the monitoring and evaluation of the site as well as guide policy and
management, acknowledging the inherent dynamic nature of wetland systems over time.
This is the first ECD document prepared for the site and although the document has been prepared
for the whole of Kakadu National Park, it needs to draw on and identify baseline data from the
different listing dates of the three Stages to provide appropriate assessment points for the monitoring
and evaluation of the site. Although additional areas of Stage III were added to the Ramsar site in
2010, it is worth noting that the ‘wetland components’ of Stage III were already included in the
Ramsar site in 1995. The 2010 extension of the site adds all other areas of Stage III into the Ramsar
site consistent with the national park and World Heritage listing. Whilst ECDs describe the ecological
character of a Ramsar site, they predominantly focus on the wetland values and characteristics that
contributed to the site being listed as a Wetland of International Importance. As such, the ECD will
retain a focus on the listing dates 1980, 1989 and 1995. Hereafter, the combination of all three
Stages is referred to as the ‘Ramsar site’ or ‘Kakadu National Park’, with attention drawn to individual
Stages as necessary.
The report has been prepared in accordance with the requirements of the National Framework and
Guidance for Describing the Ecological Character of Australia’s Ramsar Wetlands (DEWHA 2008)
(hereafter referred to as the National Framework). Further information about the requirements of the
Framework is discussed in Section 1.2.
Note: Throughout this document, the term ‘Bininj’ is used to refer to traditional owners of Aboriginal
land and traditional owners of other land in the Park, and other Aboriginals entitled to enter upon or
use or occupy the Park in accordance with Aboriginal tradition governing the rights of that Aboriginal
or group of Aboriginals with respect to the Park.
Bininj is a Kunwinjku and Gundjeihmi word, pronounced 'binn-ing'. This word is similar to the
English word 'man' and can mean man, male, person or Aboriginal people, depending on the
context. The word for woman in these languages is Daluk. Other languages in Kakadu National
Park have other words with these meanings, for example the Jawoyn word for man is Mungguy
and for woman is Alumka, and the Limilngan word for man is Murlugan and Ugin-j for woman. The
authors have decided to use the term Bininj for the purposes of this Ecological Character
Description.
1.2 Scope and Purpose of this Study
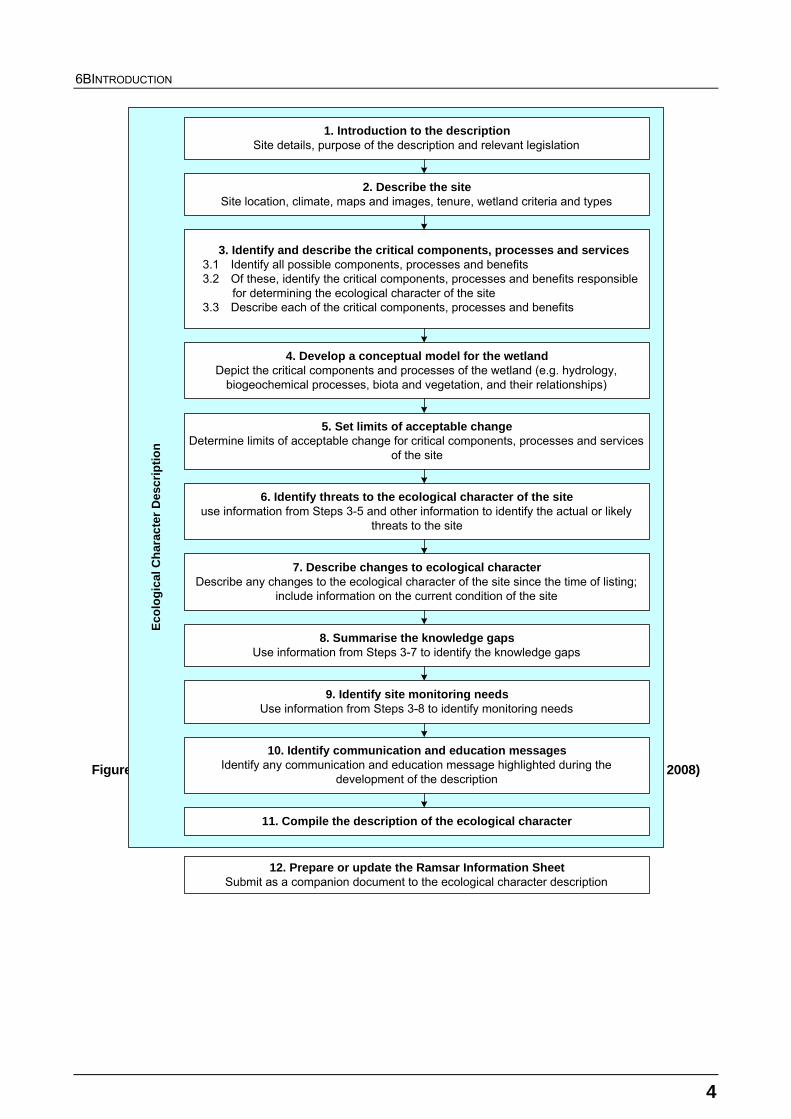
Figure 1-1 shows the key steps of the ECD preparation process from the National Framework
document which forms the basis for ECD reporting. Based on the National Framework document
(DEWHA 2008), the key purposes of undertaking an ECD are as follows:
1. To assist in implementing Australia’s obligations under the Ramsar Convention, as stated in
Schedule 6 (Managing wetlands of international importance) of the Environment Protection and
Biodiversity Conservation Regulations 2000 (Commonwealth):
a) To describe and maintain the ecological character of declared Ramsar wetlands in Australia
6BINTRODUCTION
3
b) To formulate and implement planning that promotes:
i) Conservation of the wetland
ii) Wise and sustainable use of the wetland for the benefit of humanity in a way that is
compatible with maintenance of the natural properties of the ecosystem.
2. To assist in fulfilling Australia’s obligation under the Ramsar Convention, to arrange to be informed
at the earliest possible time if the ecological character of any wetland in its territory and included in
the Ramsar List has changed, is changing or is likely to change as the result of technological
developments, pollution or other human interference.
3. To supplement the description of the ecological character contained in the Ramsar Information
Sheet submitted under the Ramsar Convention for each listed wetland and, collectively, to form an
official record of the ecological character of the site.
4. To assist the administration of the Commonwealth Environment Protection and Biodiversity
Conservation Act 1999 (EPBC Act), particularly:
a) to determine whether an action has, will have or is likely to have a significant impact on a
declared Ramsar wetland in contravention of sections 16 and 17B of the EPBC Act, or
b) to assess the impacts that actions referred to the Minister under Part 7 of the EPBC Act have
had, will have or are likely to have on a declared Ramsar wetland.
5. To assist any person considering taking an action that may impact on a declared Ramsar wetland
whether to refer the action to the Minister under Part 7 of the EPBC Act for assessment and approval.
6. To inform members of the public who are interested generally in declared Ramsar wetlands to
understand and value the wetlands.
The key audiences for this document are expected to be:
The Kakadu National Park Board of Management, the Director of National Parks and Parks
Australia as the principal managers of Kakadu National Park.
Bininj, as traditional owners and custodians of Kakadu National Park and its wetlands.
The Northern Territory Government, the Natural Resource Management Board (Northern
Territory) and local governments that make decisions that could affect the ecological character of
the site.
The Office of the Supervising Scientist (OSS) as the lead agency for science and research
associated with uranium operations within and adjacent to the National Park and more generally
in terms of tropical wetlands.
DSEWPAC as the Administrative Authority for the Ramsar Convention in Australia.
Other sectors of the community with a scientific or general interest in the Kakadu National Park
Ramsar site.
6BINTRODUCTION
4
Figure 1-1 Key steps in preparing an Ecological Character Description (source: DEWHA 2008)
1. Introduction to the description
Site details, purpose of the description and relevant legislation
5. Set limits of acceptable changeDetermine limits of acceptable change for critical components, processes and services
of the site
4. Develop a conceptual model for the wetlandDepict the critical components and processes of the wetland (e.g. hydrology,
biogeochemical processes, biota and vegetation, and their relationships)
3. Identify and describe the critical components, processes and services3.1 Identify all possible components, processes and benefits3.2 Of these, identify the critical components, processes and benefits responsible for determining the ecological character of the site3.3 Describe each of the critical components, processes and benefits
2. Describe the siteSite location, climate, maps and images, tenure, wetland criteria and types
6. Identify threats to the ecological character of the siteuse information from Steps 3-5 and other information to identify the actual or likely
threats to the site
8. Summarise the knowledge gapsUse information from Steps 3-7 to identify the knowledge gaps
7. Describe changes to ecological characterDescribe any changes to the ecological character of the site since the time of listing;
include information on the current condition of the site
9. Identify site monitoring needsUse information from Steps 3-8 to identify monitoring needs
10. Identify communication and education messagesIdentify any communication and education message highlighted during the
development of the description
11. Compile the description of the ecological character
12. Prepare or update the Ramsar Information SheetSubmit as a companion document to the ecological character description
Eco
log
ical
Ch
arac
ter
Des
crip
tio
n
6BINTRODUCTION
5
1.3 Relevant Treaties, Legislation and Regulations
This section provides an overview of the treaties, legislation and regulations at various levels of
government relevant to the Kakadu National Park Ramsar site.
1.3.1 Australian Government Legislation or Policy Instruments
EPBC Act
Australia’s obligations to protect and maintain the ecological character of its Ramsar site is
recognised in Commonwealth legislation through the EPBC Act. The EPBC Act sets out standards for
managing Ramsar wetlands through the Australian Ramsar Management Principles (established
within regulations under the Act) and through the referral and assessment of activities that may have
an impact on Ramsar site and other matters of National Environmental Significance (NES).
Several of the matters of NES under the Act are directly relevant to the Kakadu National Park
Ramsar site and are discussed in the sections below. These include:
Wetlands of International Importance (Ramsar wetlands)
Nationally threatened species and ecological communities
World Heritage and National Heritage sites, and
Commonwealth Reserves.
EPBC Act and Ramsar wetlands
As outlined in EPBC Act Policy Statement 1.1 (refer DEWHA 2009a), in the context of assessing
significant impacts on the ecological character of Ramsar wetlands, actions that are considered to
have an effect or potential effect on wetland ecological character involve the following:
areas of the wetland being destroyed or substantially modified
a substantial and measurable change in the hydrological regime of the wetland - for example, a
substantial change to the volume, timing, duration and frequency of ground and surface water
flows to and within the wetland
the habitat or lifecycle of native species dependent upon the wetland being seriously affected
a substantial and measurable change in the physico-chemical status of the wetland - for
example, a substantial change in the level of salinity, pollutants, or nutrients in the wetland, or
water temperature which may adversely impact on biodiversity, ecological integrity, social
amenity or human health, and
an invasive species that is harmful to the ecological character of the wetland being established in
the wetland.
The Australian Government Minister for the Environment decides whether the action will, or is likely
to, have a significant impact on the ecological character of the Ramsar wetland and whether the
6BINTRODUCTION
6
action will require approval under the EPBC Act. If approval under the EPBC Act is required, then an
environmental assessment of the action must be carried out. The Minister decides whether to
approve the action, and what conditions (if any) to impose, after considering the environmental
assessment.
EPBC Act and protection of species listed under international conventions
Any action or potential action that may affect protected species or communities that are listed as
threatened is also a matter of NES and must be referred to the Australian Government Minister for
the Environment for assessment. The key international conventions on migratory species are briefly
discussed below.
The Convention on the Conservation of Migratory Species of Wild Animals (also known as CMS or
Bonn Convention) was adopted in 1979 and aims to conserve terrestrial, marine and avian migratory
species throughout their range. It is an intergovernmental treaty under the United Nations
Environment Program, concerned with the conservation of wildlife and habitats on a global scale.
The Japan-Australia Migratory Birds Agreement (JAMBA) and China-Australia Migratory Birds
Agreement (CAMBA) are bilateral agreements between the governments of Japan and Australia and
China and Australia, which seek to protect migratory birds in the East Asian - Australasian Flyway.
The two agreements list terrestrial, water and shorebird species that migrate between Australia and
the respective countries. In both cases the majority of listed species are shorebirds. Both agreements
require the parties to protect migratory birds from take or trade except under limited circumstances,
protect and conserve habitats, exchange information, and build cooperative relationships. The
JAMBA agreement also includes specific provisions for cooperation on conservation of threatened
birds.
In April 2002, Australia and the Republic of Korea also agreed to develop a bilateral migratory bird
agreement similar to the JAMBA and CAMBA. The Republic of Korea-Australia Migratory Birds
Agreement (ROKAMBA) agreement obliges its Parties to protect bird species which regularly migrate
between Australia and the Republic of Korea, and their environment. The Annex to the ROKAMBA
contains the list of species or subspecies of birds for which there is reliable evidence of migration
between the two countries.
EPBC Act and Heritage
The Kakadu National Park was inscribed onto the World Heritage List in 1981 under both the cultural
and natural criteria of the Convention. The specific Nomination Criteria under the World Heritage
Convention that are also relevant to the site’s Ramsar listings include:
Criterion (ii) - Outstanding example representing significant ongoing geological processes,
biological evolution and man's interaction with his natural environment.
Criterion (iii) - Contain unique, rare or superlative natural phenomena, formations or features or
areas of exceptional natural beauty.
Criterion (iv) - Contain the most important and significant habitats where threatened species of
plants and animals of outstanding universal value from the point of view of science and
conservation still survive.
6BINTRODUCTION
7
Kakadu National Park was also included on the National Heritage List in 2007 for its natural and
cultural values.
EPBC Act and Management of Commonwealth Reserves
The Kakadu National Park is a Commonwealth Reserve under the EPBC Act declared for the
purposes of:
the preservation of the area in its natural condition, and
the encouragement and regulation of appropriate use.
The EPBC Act sets out the following matters relevant to management of the reserve:
establishment of the roles and responsibilities of the Director of National Parks (s514A)
establishment of the roles and responsibilities of the Kakadu National Park Board of Management
(s376)
management planning (s367 – plans must be prepared under the Act and provide for the
protection and conservation of the reserve), and
control of actions in Commonwealth Reserves (s354 – through the prohibition and control of
natural and cultural resources of the reserve).
Under the Act, the Director of National Parks generally has power to do all things necessary or
convenient for performing the Director’s functions which relate to administration, management and
control of the Park. The Board of Management’s functions under the Act are to make decisions
relating to the management of the Park that are consistent with the Management Plan in operation for
the park and, in conjunction with the Director, to prepare management plans for the Park, monitor the
management of the Park and advise the Minister on all aspects of the future development of the Park
(Director of National Parks 2007).
The EPBC Regulations provide for the controlling of activities within a Commonwealth Reserve,
providing that it should take into account whether a proposed activity may interfere with the protection
or conservation of biodiversity or heritage or with the continuing cultural use of the reserve by the
traditional owners of the land (r12.03 EPBC Act). Certain prohibited actions must not be undertaken
within Kakadu National Park except in accordance with the Management Plan (s354 EPBC Act). This
includes killing, injuring or trading a member of a native species, damaging heritage, erecting a
building or other structure, carrying out works, or taking an action for commercial purposes.
Kakadu National Park Management Plan 2007 – 2014
The Kakadu National Park Management Plan (Director of National Parks 2007) is the key document
for on-ground management and planning in the Park and the conservation of its values. The
Management Plan is set out under six key result areas (KRAs) that reflect the Parks Australia
Strategic Planning and Performance Assessment Framework:
KRA 1: Natural heritage management
6BINTRODUCTION
8
KRA 2: Cultural heritage management
KRA 3: Joint management
KRA 4: Visitor management and park use
KRA 5: Stakeholders and partnerships, and
KRA 6: Business management.
Aims, policies and actions (including annual programs of works at a district level within the Park) set
the direction for management carried out to meet these KRAs. Annual reporting to the Australian
Parliament is required on the outcomes of the KRAs in the Director of National Parks’ Annual Report.
The Management Plan also outlines a specific process for assessment of proposals within Kakadu
National Park. The process of assessment is based on three pre-determined categories of actions
according to the degree of potential impact of the activity. Tables from the Management Plan outline
the categories, impact assessment requirements, and matters for assessment, summarised as
follows:
Category 1 (least impact) proposals do not require assessment.
Category 2 proposals require assessment by Park staff, the proponent or independent experts,
following a procedure which outlines the values that are to be considered in the impact
assessment.
Category 3 (likely to have a significant impact) proposals are considered to possibly require
referral and assessment pursuant to the EPBC Act.
National Parks and Wildlife Conservation Act
The National Parks and Wildlife Conservation Act 1975 provided for the original declaration of the
Kakadu National Park progressively between 1979 and 1991. The Act also established the Board of
Management for the Park.
This Act was repealed and replaced by the EPBC Act in 2000 noting the roles and responsibilities of
the Director of National Parks, the Kakadu National Park Board of Management, management
planning and control of actions in the Park have been retained and are now administered under the
provisions of the EPBC Act as outlined above.
Aboriginal Land Rights (Northern Territory) Act
As outlined in the Management Plan, approximately 50 percent of Kakadu National Park is Aboriginal
land under the Aboriginal Land Rights (Northern Territory) Act 1976. Most of the remaining area of
land is under claim by Aboriginal people.
Title to Aboriginal land in the Park is held by Aboriginal Land Trusts that have leased their land to the
Director of National Parks for the purpose of being managed as a Commonwealth Reserve. Land in
the Park that is not Aboriginal land is vested in the Director.
6BINTRODUCTION
9
1.3.2 Northern Territory Legislation or Policy Instruments
In general, Northern Territory laws apply within the Kakadu National Park to the extent that those
laws can operate concurrently with the EPBC Act and Regulations (Director National Parks 2007).
While the Northern Territory Planning Scheme (under the Northern Territory Planning Act 1999)
applies generally to Kakadu National Park, the area is within an unzoned area under the Scheme,
and as such the general performance criteria relating to development (such as building setback
requirements in flood prone areas, vegetation clearance provisions, etc.) do not apply to development
within Kakadu National Park.
Other Northern Territory legislation (for example, Waste Management and Pollution Control Act,
Water Act, Weed Management Act) also applies generally to land and water management activities
undertaken in Kakadu National Park and provides for protection of wetland and coastal environments
from threatening activities and processes (ALGA 2006). However, integration between these pieces
of legislation is regarded as weak in places (NTG, LCNT and NHT 2005).
Where practicable, the Management Plan provides guidance to ensure consistency with particular
Northern Territory laws and policies, such as, for instance, setting bag limits for barramundi and other
fish species consistent with Northern Territory bag limits.
In terms of infrastructure provision and management, the Northern Territory Government funds the
management and maintenance of major roads into and out of the Park and Gunlom Road and also
plays a role in implementing road safety measures (in consultation with the Director of National
Parks). Jabiru is the largest settlement within the boundaries of the Ramsar site and the Jabiru Town
Development Act (Northern Territory) establishes the Jabiru Town Development Authority which
develops, maintains and manages the township.
Protection of wetland values through controls on development activities are also implemented within
the West Arnhem Shire, which is approximately 49 236 square kilometres and covers the Kakadu
National Park area. Although relatively few local government services are delivered by the local
government within the Park, values within the area are recognised through a framework set up under
the Local Government Regional Management Plan – Northern Region (Department of Local
Government and Housing 2008), a statutory instrument under part 3.1 of the Local Government Act
2008.
The provision of services are noted within the Regional Management Plan to be subject to the rights
and interests of Indigenous traditional owners (under the Aboriginal Land Rights (NT) Act 1976 and
the Native Title Act 1993), and a range of Northern Territory legislation (for example, Control of
Roads Act, Disasters Act and Weeds Management Act) but it remains that Commonwealth legislation
(EPBC Act) ultimately provides protection to both the cultural and natural values of the Park in
delivery of the services.
Specific Northern Territory legislation that is potentially relevant includes the following:
Fisheries Act
Territory Parks and Wildlife Conservation Act
6BINTRODUCTION
10
Local Government Act
Mining Management Act
Weeds Management Act
Waste Management and Pollution Control Act, and
Water Act.
1.4 Key Terminology and Concepts
The Millennium Ecosystem Assessment (2003) provides definitions and descriptions of the
characteristics of ecosystems and ecosystem services that should be used in the wise use of Ramsar
wetlands. These definitions and concepts have been adopted by the National Framework (DEWHA
2008).
Within the Millennium Ecosystem Assessment (MEA), ecosystems are described as the complex of
living communities (including human communities) and non-living environment (ecosystem
components) interacting (through ecological processes) as a functional unit which provides a variety
of benefits to people (ecosystem services). The sections below discuss key terms and concepts from
the MEA and the National Framework used throughout the report. Specific definitions of these and
other commonly used terms are contained in the Glossary in Section 7.
1.4.1 Wetland Processes
Wetland ecosystem processes are defined as the dynamic forces within the ecosystem between
organisms, populations and the non-living environment. Interactions can be physical, chemical or
biological. Examples include:
climate – rainfall, temperature and evaporation
hydrology – water balance, flooding and inundation regime
geomorphology and physical processes – topography, soils, sedimentation processes and
erosion
energy and nutrient dynamics – primary production, decomposition and carbon cycle, and
biological processes such as:
(a) Biological maintenance – reproduction, migration, dispersal and pollination
(b) Species interactions – competition, predation, succession, disease and infestation.
1.4.2 Wetland Components
Wetland ecosystem components are the physical, chemical and biological parts or features of a
wetland. Examples include:
physical form – wetland type, and geomorphology
6BINTRODUCTION
11
wetland soils – profiles, permeability and physico-chemical properties
water quality – physico-chemical properties such as salinity or pH, and
biota – flora, fauna and habitats.
It is noted in the National Framework that some components may be viewed as both wetland
components and wetland processes (for example, geomorphology, water quality).
1.4.3 Wetland Services/Benefits
The terms ‘benefits’ and ‘services’ are defined within the National Framework in the context of the
‘benefits that people receive from ecosystems’. The Millennium Ecosystem Assessment (2003)
defines services as ‘provisioning, regulating, and cultural services that directly affect people, and
supporting services which are needed to maintain these other services.’
The Millennium Ecosystem Assessment (2003) identifies four types of services:
provisioning services (products obtained from ecosystems) such as food and water
regulating services (benefits obtained from the regulation of ecosystem processes) such as
regulation of floods, drought, land degradation, and disease
cultural services (non-material benefits through spiritual enrichment, cognitive development,
reflection, recreation and aesthetic experiences) such as recreational, spiritual, religious and
other non-material benefits, and
supporting services (those necessary for the production of all other services) such as soil
formation, nutrient cycling and primary production.
Supporting services differ from provisioning, regulating, and cultural services in that their impacts on
people are either indirect or occur over a very long time (Millennium Ecosystem Assessment 2003).
In the context of this ECD, ecological values (attributes relating to biological diversity) represent
supporting services. The ecological values of wetlands are of indirect benefit to people in maintaining
biodiversity.
The National Framework notes that wetland ecosystem services and benefits are based on or
underpinned by wetland components and processes and can be both of direct benefit to humans (for
example, food for humans or livestock) or of indirect benefit (for example, wetland provides habitat for
biota which contribute to biodiversity).
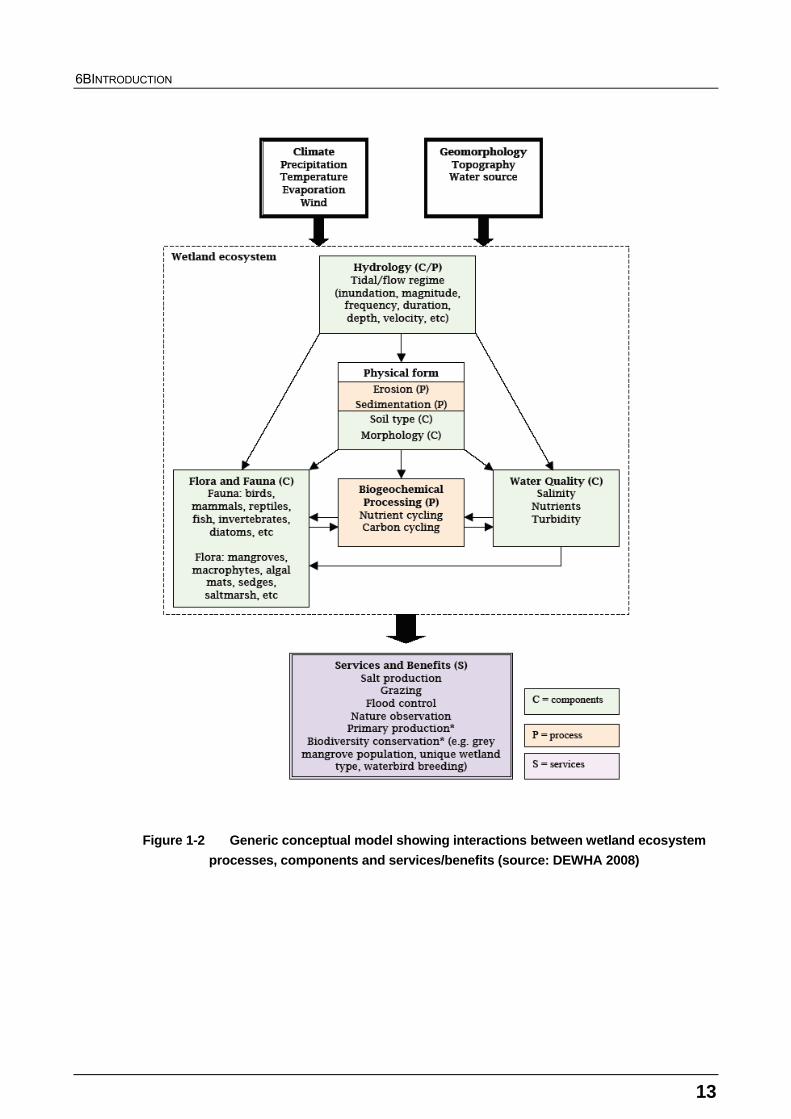
1.4.4 Interaction of Wetland Elements
Figure 1-2 from the National Framework document shows a generic conceptual model of the
interaction between ecosystem processes, components and services/benefits for a wetland. In
general terms, the model shows how wetland ecosystem processes interact with wetland
components to generate a range of wetland services/benefits. These services/benefits can be broadly
applicable to all wetlands ecosystems (such as primary productivity) or specific to a given site (for
example, breeding habitat for an important bird species or population).

6BINTRODUCTION
12
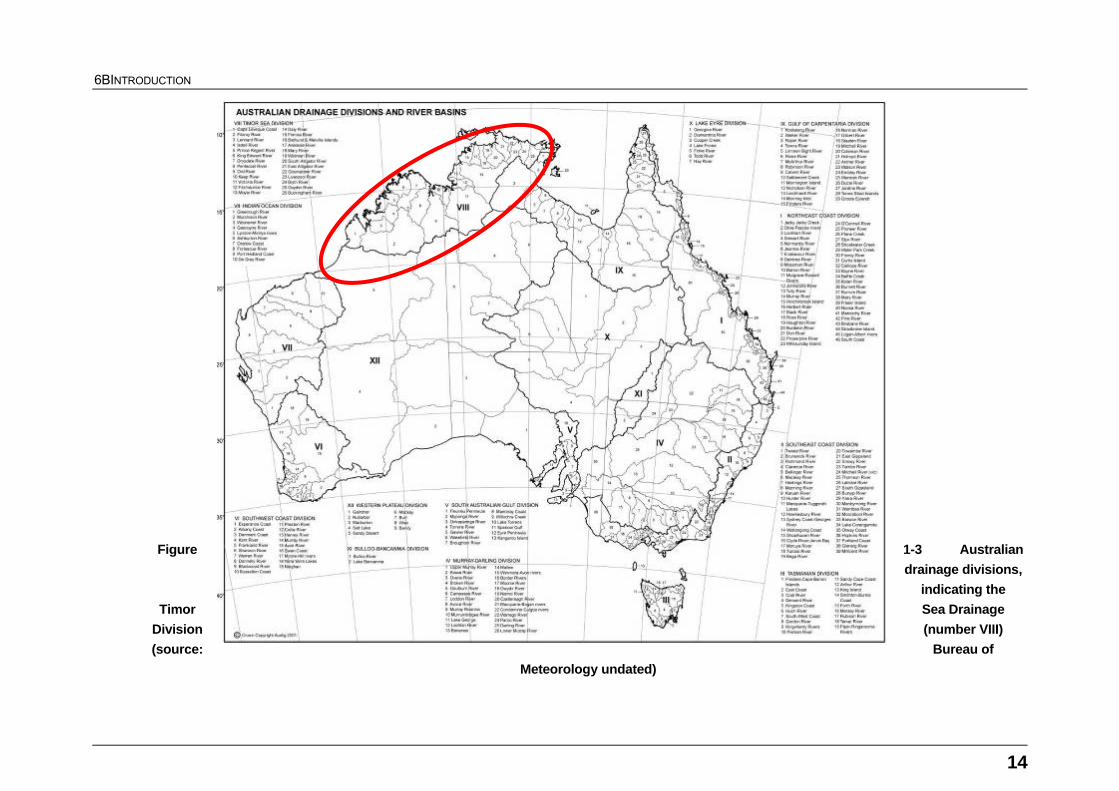
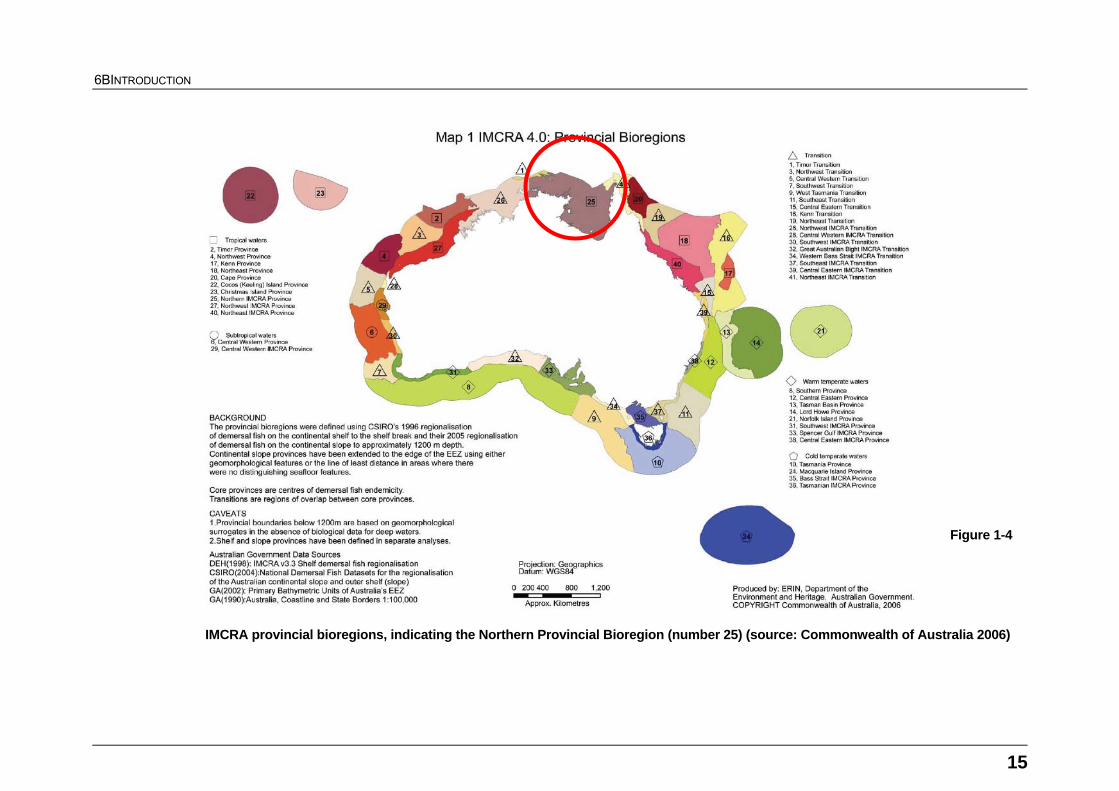
1.4.5 Bioregionalisation Scheme
Guidelines under the Ramsar Convention favour the use of international or national biogeographic
regions in the context of interpretation of Ramsar Nomination Criteria and other aspects of the
Convention. Different biogeographic schemes apply to the site, depending on whether marine,
terrestrial or freshwater environments are considered.
In this context, Kakadu National Park occurs within the following ‘biogeographic’ regions:
Division VIII - Timor Sea Drainage Division (Wildman, South Alligator; East Alligator basins) (refer
Figure 1-3), and
Northern IMCRA Provincial Bioregion (IMCRA version 4, refer Figure 1-4).
6BINTRODUCTION
13
Figure 1-2 Generic conceptual model showing interactions between wetland ecosystem
processes, components and services/benefits (source: DEWHA 2008)
6BINTRODUCTION
14
Figure 1-3 Australian
drainage divisions,
indicating the
Timor Sea Drainage
Division (number VIII)
(source: Bureau of
Meteorology undated)
6BINTRODUCTION
15
Figure 1-4
IMCRA provincial bioregions, indicating the Northern Provincial Bioregion (number 25) (source: Commonwealth of Australia 2006)
7BDESCRIPTION OF THE SITE
16
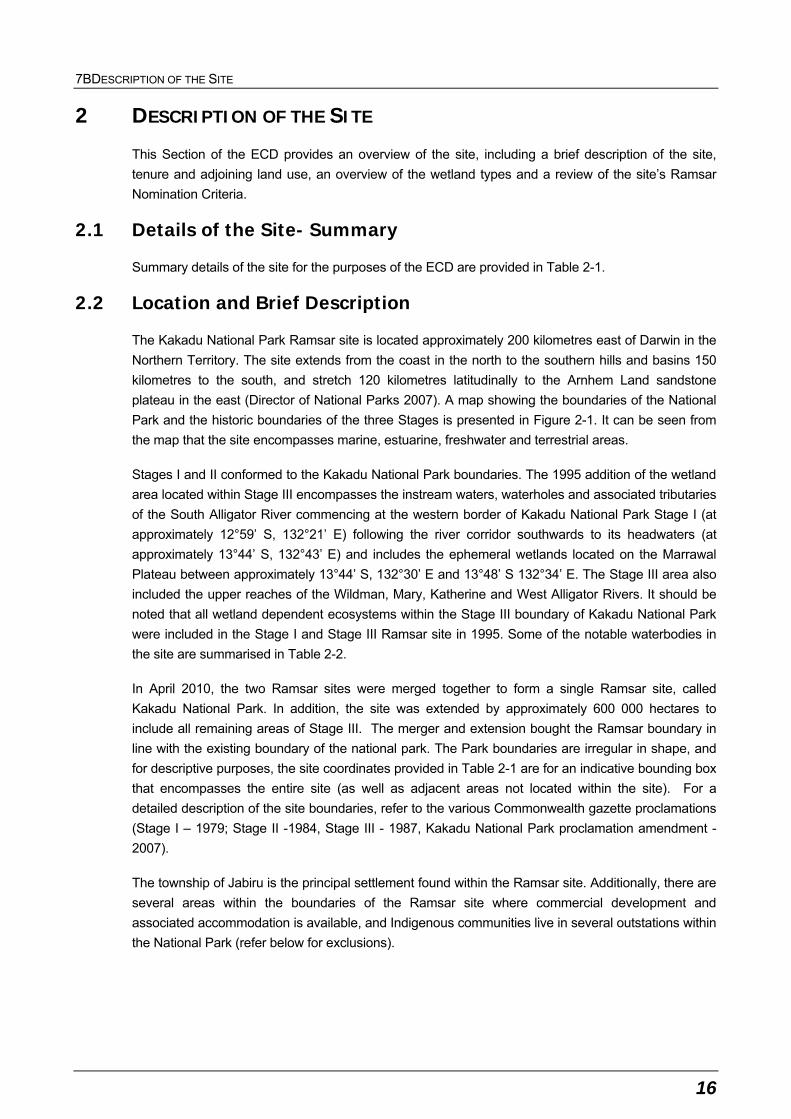
2 DESCRIPTION OF THE SITE
This Section of the ECD provides an overview of the site, including a brief description of the site,
tenure and adjoining land use, an overview of the wetland types and a review of the site’s Ramsar
Nomination Criteria.
2.1 Details of the Site- Summary
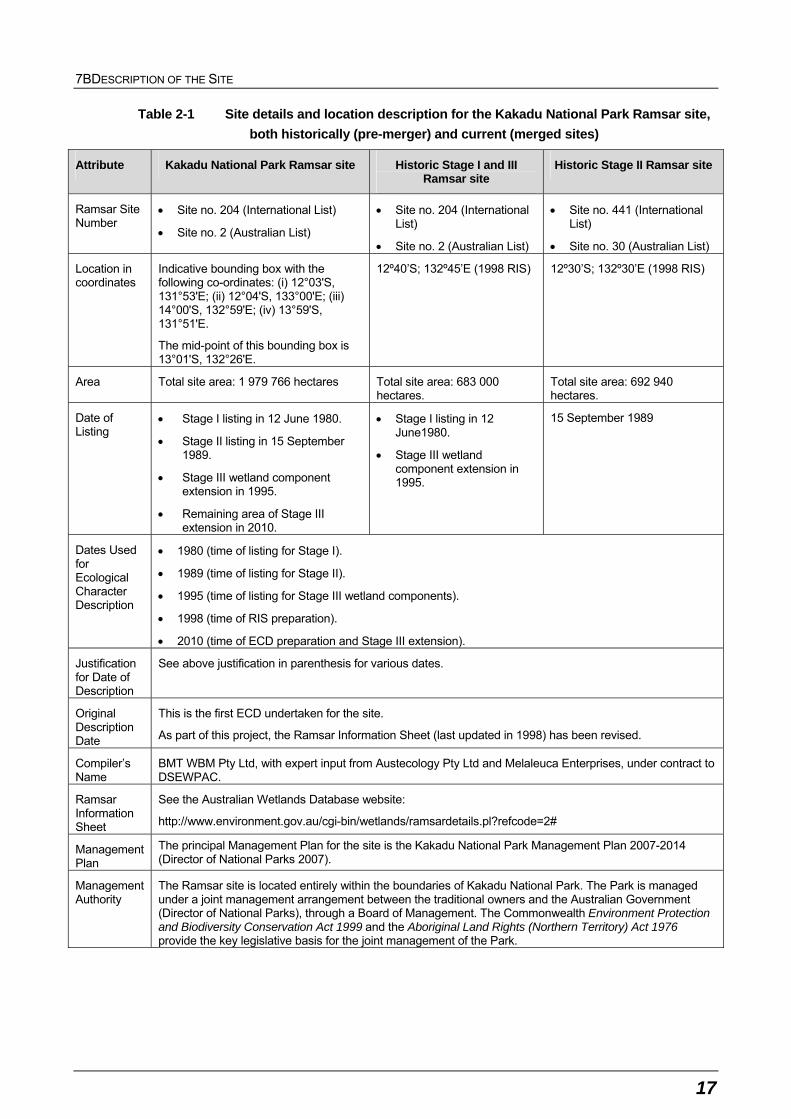
Summary details of the site for the purposes of the ECD are provided in Table 2-1.
2.2 Location and Brief Description
The Kakadu National Park Ramsar site is located approximately 200 kilometres east of Darwin in the
Northern Territory. The site extends from the coast in the north to the southern hills and basins 150
kilometres to the south, and stretch 120 kilometres latitudinally to the Arnhem Land sandstone
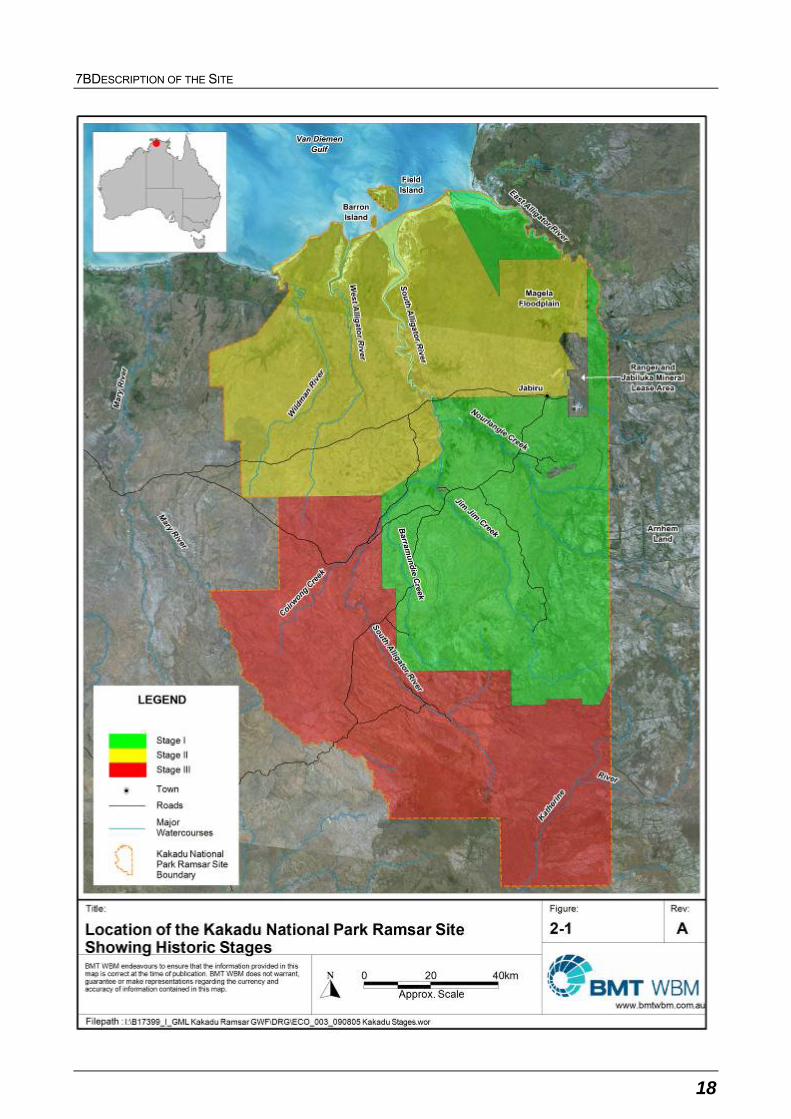
plateau in the east (Director of National Parks 2007). A map showing the boundaries of the National
Park and the historic boundaries of the three Stages is presented in Figure 2-1. It can be seen from
the map that the site encompasses marine, estuarine, freshwater and terrestrial areas.
Stages I and II conformed to the Kakadu National Park boundaries. The 1995 addition of the wetland
area located within Stage III encompasses the instream waters, waterholes and associated tributaries
of the South Alligator River commencing at the western border of Kakadu National Park Stage I (at
approximately 12°59’ S, 132°21’ E) following the river corridor southwards to its headwaters (at
approximately 13°44’ S, 132°43’ E) and includes the ephemeral wetlands located on the Marrawal
Plateau between approximately 13°44’ S, 132°30’ E and 13°48’ S 132°34’ E. The Stage III area also
included the upper reaches of the Wildman, Mary, Katherine and West Alligator Rivers. It should be
noted that all wetland dependent ecosystems within the Stage III boundary of Kakadu National Park
were included in the Stage I and Stage III Ramsar site in 1995. Some of the notable waterbodies in
the site are summarised in Table 2-2.
In April 2010, the two Ramsar sites were merged together to form a single Ramsar site, called
Kakadu National Park. In addition, the site was extended by approximately 600 000 hectares to
include all remaining areas of Stage III. The merger and extension bought the Ramsar boundary in
line with the existing boundary of the national park. The Park boundaries are irregular in shape, and
for descriptive purposes, the site coordinates provided in Table 2-1 are for an indicative bounding box
that encompasses the entire site (as well as adjacent areas not located within the site). For a
detailed description of the site boundaries, refer to the various Commonwealth gazette proclamations
(Stage I – 1979; Stage II -1984, Stage III - 1987, Kakadu National Park proclamation amendment -
2007).
The township of Jabiru is the principal settlement found within the Ramsar site. Additionally, there are
several areas within the boundaries of the Ramsar site where commercial development and
associated accommodation is available, and Indigenous communities live in several outstations within
the National Park (refer below for exclusions).
7BDESCRIPTION OF THE SITE
17
Table 2-1 Site details and location description for the Kakadu National Park Ramsar site,
both historically (pre-merger) and current (merged sites)
Attribute Kakadu National Park Ramsar site Historic Stage I and III Ramsar site
Historic Stage II Ramsar site
Ramsar Site Number
Site no. 204 (International List)
Site no. 2 (Australian List)
Site no. 204 (International List)
Site no. 2 (Australian List)
Site no. 441 (International List)
Site no. 30 (Australian List)
Location in coordinates
Indicative bounding box with the following co-ordinates: (i) 12°03'S, 131°53'E; (ii) 12°04'S, 133°00'E; (iii) 14°00'S, 132°59'E; (iv) 13°59'S, 131°51'E.
The mid-point of this bounding box is 13°01'S, 132°26'E.
12º40’S; 132º45’E (1998 RIS) 12º30’S; 132º30’E (1998 RIS)
Area Total site area: 1 979 766 hectares Total site area: 683 000 hectares.
Total site area: 692 940 hectares.
Date of Listing
Stage I listing in 12 June 1980.
Stage II listing in 15 September 1989.
Stage III wetland component extension in 1995.
Remaining area of Stage III extension in 2010.
Stage I listing in 12 June1980.
Stage III wetland component extension in 1995.
15 September 1989
Dates Used for Ecological Character Description
1980 (time of listing for Stage I).
1989 (time of listing for Stage II).
1995 (time of listing for Stage III wetland components).
1998 (time of RIS preparation).
2010 (time of ECD preparation and Stage III extension).
Justification for Date of Description
See above justification in parenthesis for various dates.
Original Description Date
This is the first ECD undertaken for the site.
As part of this project, the Ramsar Information Sheet (last updated in 1998) has been revised.
Compiler’s Name
BMT WBM Pty Ltd, with expert input from Austecology Pty Ltd and Melaleuca Enterprises, under contract to DSEWPAC.
Ramsar Information Sheet
See the Australian Wetlands Database website:
http://www.environment.gov.au/cgi-bin/wetlands/ramsardetails.pl?refcode=2#
Management Plan
The principal Management Plan for the site is the Kakadu National Park Management Plan 2007-2014 (Director of National Parks 2007).
Management Authority
The Ramsar site is located entirely within the boundaries of Kakadu National Park. The Park is managed under a joint management arrangement between the traditional owners and the Australian Government (Director of National Parks), through a Board of Management. The Commonwealth Environment Protection and Biodiversity Conservation Act 1999 and the Aboriginal Land Rights (Northern Territory) Act 1976 provide the key legislative basis for the joint management of the Park.
7BDESCRIPTION OF THE SITE
18
I:\B17399_I_GML Kakadu Ramsar GWF\DRG\ECO_003_090805 Kakadu Stages.wor
Figure 2-1 Location of the Kakadu National Park Ramsar site (denoted by red dashed l
7BDESCRIPTION OF THE SITE
19
The climatic zone within which the site is located is defined as the hot humid summer climatic zone
(Stern et al. 2003). Whilst large expanses of the Ramsar site are Eucalypt-dominated woodlands, this
ECD focuses specifically on the wetland habitats. The range of the environmental gradients and
contiguous, diverse landscapes, have contributed to a variety of wetland habitat types that support
high levels of biodiversity.
The Ramsar site is bounded by the following geographic features:
Van Diemen Gulf and the Timor Sea in the north
the East Alligator River and Arnhem Land in the east
Mary River in the west, and
Arnhem Land plateau to the south.
The site incorporates six catchments: Wildman River (most of catchment), West Alligator River (entire
area), South Alligator River (entire area), East Alligator River (partial coverage) and the headwaters
of Mary River (Mary River catchment) and Katherine River (Daly River catchment). Several drainages
occur on Field Island; however, these appear to be mostly tidal drainage channels. Table 2-2 outlines
the separation of the catchments between the three Stages.
Five major landscape types contain the diversity of wetland habitat types described in this document:
Stone country – The sandstone escarpment area of Kakadu contains creeks, seeps and pools.
Lowlands – The Eucalypt open woodlands and scrublands of the lowlands contains creeks.
Southern hills and basins – the southern hills and basins contain creeks.
Floodplains – The floodplains contain extensive freshwater wetlands including marshes, creeks
and billabongs.
Estuaries and tidal flats – The coastal habitats include intertidal mudflats, mangroves, saltmarsh,
sandy shores and estuarine waters.
These landscape types contain a range of wetland ecosystem types that can be categorised into the
following groups:
Terrestrial Ecosystems: This includes both wetland areas, as well as extensive woodlands which
occur throughout the site.
Floodplain Ecosystems. Specifically, the vast tracts of palustrine wetlands that comprise the
seasonally inundated floodplains, and the areas of Melaleuca swamp forest. Floodplain
ecosystems support high numbers of flora and fauna populations/species that underlie a diversity
of services.
River Channel. River channels and the associated riparian vegetation support a diversity of
fauna and flora species including threatened species, endemic species, waterbirds, fish and
traditional foods. Furthermore, river channels provide opportunities for recreational/tourism
activities.
Springs. A number of groundwater fed springs occur in the site, with particularly notable
examples occurring in the stone country and adjacent lowland areas.
7BDESCRIPTION OF THE SITE
20
Billabongs. Billabongs are a particularly important feature of the floodplains. Specifically,
billabongs provide areas of deep water habitat for aquatic flora and fauna, as well as dry season
refuge for many of the aquatic fauna species that inhabit the floodplains. These fauna species
include a diversity of freshwater fish, a large number of waterbirds, certain threatened species
(for example, pig-nosed turtles) and a number of traditional food species (for example, file
snakes and freshwater turtles). Furthermore, many traditional dietary staple plant species are
associated with billabongs (for example, water lilies). Billabongs such as Yellow Water are also
of value due to their tourism and recreational significance.
Coastal/Marine Ecosystems. Specifically, intertidal mudflats, saltmarsh, mangroves and
seagrass. Intertidal mudflats are notable as they support large aggregations of shorebirds.
Further discussion on these elements is provided throughout the report.
The Kakadu National Park Ramsar site displays significant cultural characteristics, having been
continuously inhabited for at least 50 000 years (Roberts et al. 1993). An ongoing ‘living culture’ is
maintained by the Bininj of Kakadu National Park today, with an evident fundamental connection
between Bininj and wetlands within the landscape of the Ramsar site.
7BDESCRIPTION OF THE SITE
21
Table 2-2 Rivers and main streams within the site
Catchment Key rivers/streams Location within historic Ramsar sites
Wildman River catchment
Wildman River
Cattle Creek
Leichhardt Creek
Alligator Creek
Predominantly Stage II, headwaters in Stage III
West Alligator catchment
West Alligator River
West Branch
East Branch
Flying Fox Creek
Predominantly Stage II, headwaters in Stage III
South Alligator catchment
South Alligator River
Stove Creek
Coirwong Creek
Gerowie Creek
Kumbolgie Creek
Waterfall Creek
Koolpin Creek
Fisher Creek
Barramudie Creek
Jim Jim Creek
Nourlangie Creek
Deaf Adder Creek
Coastal areas and lowlands in Stage II
Nourlangie, Jim Jim and Barramundie Creeks sub-catchments mostly in Stage I
Upper South Alligator and Coirwong sub-catchment in Stage III
East Alligator catchment
East Alligator River
Magela Creek
Coolobborie Brook
Mostly Stage I, section near Ubirr in Stage II
Mary River catchment Mary River Headwaters in Stage III
Daly River catchment Katherine River
Gimbat Creek
Snowdrop Creek
Birdie Creek
Stage III
2.3 Land Use and Tenure
2.3.1 Tenure and Land Use within the Site
Tenure
Approximately 50 percent of Kakadu National Park is Aboriginal land under the Aboriginal Land
Rights (Northern Territory) Act 1976. Most of the remaining area of land is under claim by Aboriginal
people.
7BDESCRIPTION OF THE SITE
22
Title to Aboriginal land in the Park is held by Aboriginal Land Trusts that have leased their land to the
Director of National Parks (established under section 514A of the EPBC Act) for the purpose of being
managed as a Commonwealth Reserve. Land in the Park that is not Aboriginal land is vested in the
Director.
Stage I of Kakadu National Park was gazetted in April 1979 under the provisions of the National
Parks and Wildlife Conservation Act 1975. Traditional owners leased Stage I lands to Director of
National Parks and Wildlife Service for a period of 99 years.
Stage II of Kakadu National Park was gazetted in February 1984 under the provisions of the National
Parks and Wildlife Conservation Act 1975, and amalgamated with Stage I to create a single Kakadu
National Park in December 1985. The Director of National Parks has ownership over 93 percent of
the land, whereas the remaining seven percent is vested with Jabiluka Aboriginal Lands Trust. In May
1991 an agreement was formalised to lease Aboriginal lands to the Director for the purposes of a
national park.
Stage III of Kakadu National Park was proclaimed 1987, with later proclamations in 1989 and 1991 to
increase the size the park, under the provisions of the National Parks and Wildlife Conservation Act
1975.
Land Use
Given that the Ramsar site is located entirely within the boundaries of the gazetted Kakadu National
Park, the principal land uses are conservation management, tourism and education and low levels of
hunting and gathering by traditional owners living within and around the Park.
2.3.2 Tenure and Land Use Adjacent to the Site
Tenure
The Ramsar site is bound by Arnhem Land to the east, most of which is held as the Arnhem Land
Aboriginal Reserve. Van Diemen Gulf is situated to the north of the site and is Territory Waters
(Crown land). Conservation reserves (declared under Northern Territory legislation), predominantly
inactive pastoral leases and the Department of Defence Mount Bundey Training Area are situated to
the west of the Ramsar site. Lands to the south of the Ramsar site include Nitmiluk National Park and
Jawoyn Indigenous lands.
The Ranger uranium mine and Ranger and Jabiluka mineral leases are excluded from the
boundaries of the National Park and the relevant Ramsar boundaries. Mining leases that historically
allowed for mining in the southern area of the Park (South Alligator River Catchment) have not been
active for some time.
Land Use
Key land use activities in the surrounding areas to the Kakadu National Park include:
conservation management, tourism and education (within Northern Territory conservation
reserves)
7BDESCRIPTION OF THE SITE
23
uranium mining (undertaken at the Ranger uranium mine near the East Alligator River in the
mineral lease area)
historical mineral exploration (in the South Alligator River region), which has now been
suspended
commercial barramundi fishing in marine waters adjacent to the site
grazing, and
defence force training.
2.4 Description of Wetland Types
The Kakadu National Park Ramsar site is composed of a diversity of coastal and inland wetland
types. Wetland types present range from intertidal forested wetlands and mudflats, to seasonal
freshwater marshes and permanent freshwater pools. For this report, the Ramsar Classification
System for Wetland Types (approved by Recommendation 4.7 and amended by Resolutions VI.5 and
VII.11 of the Conference of the Contracting Parties) has been adopted.
There is generally a lack of detailed habitat and vegetation community mapping and spatially-
referenced ecological data available for the Ramsar site. To date, no mapping according to Ramsar
wetland typology has been undertaken for Kakadu National Park. Relevant mapping data at a whole-
of-site scale includes:
broad-scale (1:1 000 000) vegetation mapping (Wilson et al. 1990)
more detailed (1:100 000) mapping for mangroves (provided by Parks Australia) and Melaleuca
forest (Brocklehurst and van Kerckhof 1994)
mapping of billabongs (digitised for part of the area by BMT WBM 2010 from 1:250 000
topographical mapping, aerial photography and a Digital Elevation Model), and
seagrass mapping undertaken by Roelofs et al. (2005).
Numerous other mapping studies provide partial coverage of the site, such as mapping of vegetation
communities in the Magela Creek sub-catchment (for example, Finlayson et al. 1989).
These data sources, together with other information describing the habitats and communities of the
site (for example, Finlayson et al. 1988, Finlayson and Woodroffe 1996, Cowie et al. 2000, Finlayson
2005), have been considered for this report in order to determine Ramsar wetland types present
within the site. Further details and descriptions of these wetland types are provided below and
summarised in Table 2-3 and Table 2-4.
Note that there are some uncertainties regarding the extent and distribution of most wetland types
due to the lack of a consistent, systematic mapping of Ramsar wetland habitat types within the site.
Where such uncertainties exist, these have been identified in the following sections, including a
discussion on discrepancies between wetland types identified as present in the 1998 RISs and those
identified by this study. Further, note that this section serves to provide a description of wetland types,
while particular values of the wetlands have been highlighted elsewhere in the document where
relevant (for example, justification for Nomination Criteria in Section 2.5, descriptions of critical
components, processes and services/benefits in Section 3).
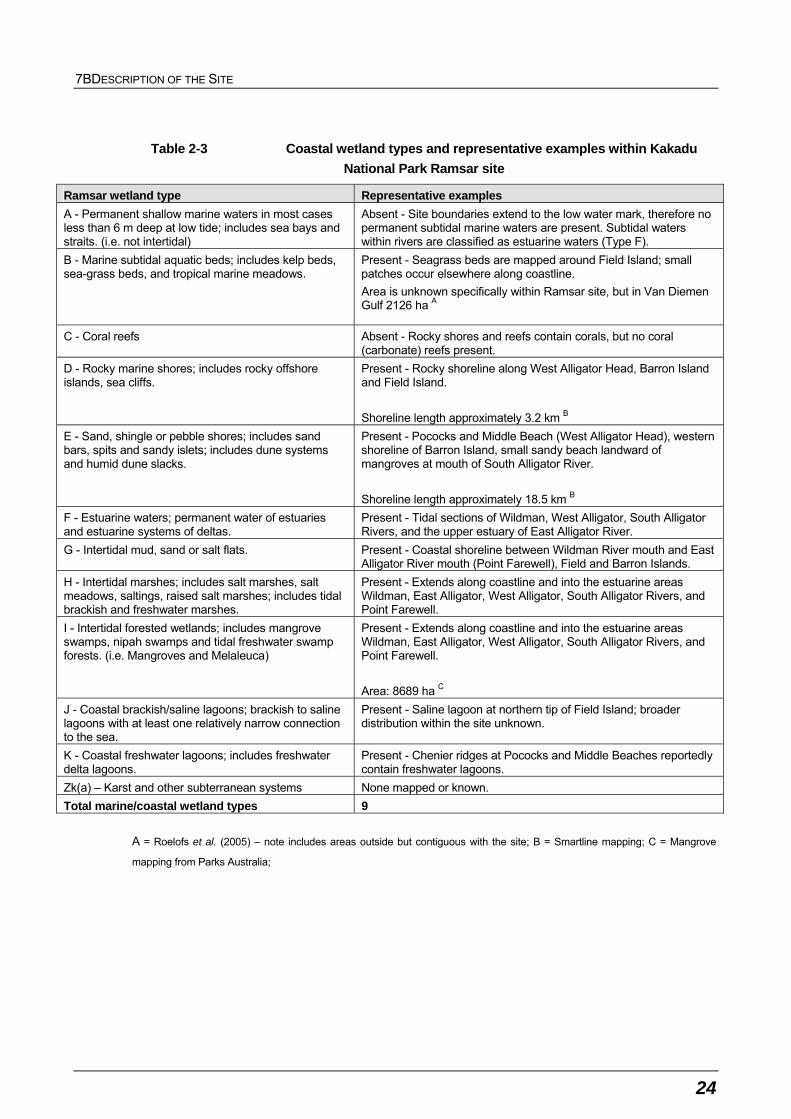
7BDESCRIPTION OF THE SITE
24
Table 2-3 Coastal wetland types and representative examples within Kakadu
National Park Ramsar site
Ramsar wetland type Representative examples
A - Permanent shallow marine waters in most cases less than 6 m deep at low tide; includes sea bays and straits. (i.e. not intertidal)
Absent - Site boundaries extend to the low water mark, therefore no permanent subtidal marine waters are present. Subtidal waters within rivers are classified as estuarine waters (Type F).
B - Marine subtidal aquatic beds; includes kelp beds, sea-grass beds, and tropical marine meadows.
Present - Seagrass beds are mapped around Field Island; small patches occur elsewhere along coastline.
Area is unknown specifically within Ramsar site, but in Van Diemen Gulf 2126 ha A
C - Coral reefs Absent - Rocky shores and reefs contain corals, but no coral (carbonate) reefs present.
D - Rocky marine shores; includes rocky offshore islands, sea cliffs.
Present - Rocky shoreline along West Alligator Head, Barron Island and Field Island.
Shoreline length approximately 3.2 km B
E - Sand, shingle or pebble shores; includes sand bars, spits and sandy islets; includes dune systems and humid dune slacks.
Present - Pococks and Middle Beach (West Alligator Head), western shoreline of Barron Island, small sandy beach landward of mangroves at mouth of South Alligator River.
Shoreline length approximately 18.5 km B F - Estuarine waters; permanent water of estuaries and estuarine systems of deltas.
Present - Tidal sections of Wildman, West Alligator, South Alligator Rivers, and the upper estuary of East Alligator River.
G - Intertidal mud, sand or salt flats. Present - Coastal shoreline between Wildman River mouth and East Alligator River mouth (Point Farewell), Field and Barron Islands.
H - Intertidal marshes; includes salt marshes, salt meadows, saltings, raised salt marshes; includes tidal brackish and freshwater marshes.
Present - Extends along coastline and into the estuarine areas Wildman, East Alligator, West Alligator, South Alligator Rivers, and Point Farewell.
I - Intertidal forested wetlands; includes mangrove swamps, nipah swamps and tidal freshwater swamp forests. (i.e. Mangroves and Melaleuca)
Present - Extends along coastline and into the estuarine areas Wildman, East Alligator, West Alligator, South Alligator Rivers, and Point Farewell.
Area: 8689 ha C J - Coastal brackish/saline lagoons; brackish to saline lagoons with at least one relatively narrow connection to the sea.
Present - Saline lagoon at northern tip of Field Island; broader distribution within the site unknown.
K - Coastal freshwater lagoons; includes freshwater delta lagoons.
Present - Chenier ridges at Pococks and Middle Beaches reportedly contain freshwater lagoons.
Zk(a) – Karst and other subterranean systems None mapped or known.
Total marine/coastal wetland types 9
A = Roelofs et al. (2005) – note includes areas outside but contiguous with the site; B = Smartline mapping; C = Mangrove
mapping from Parks Australia;
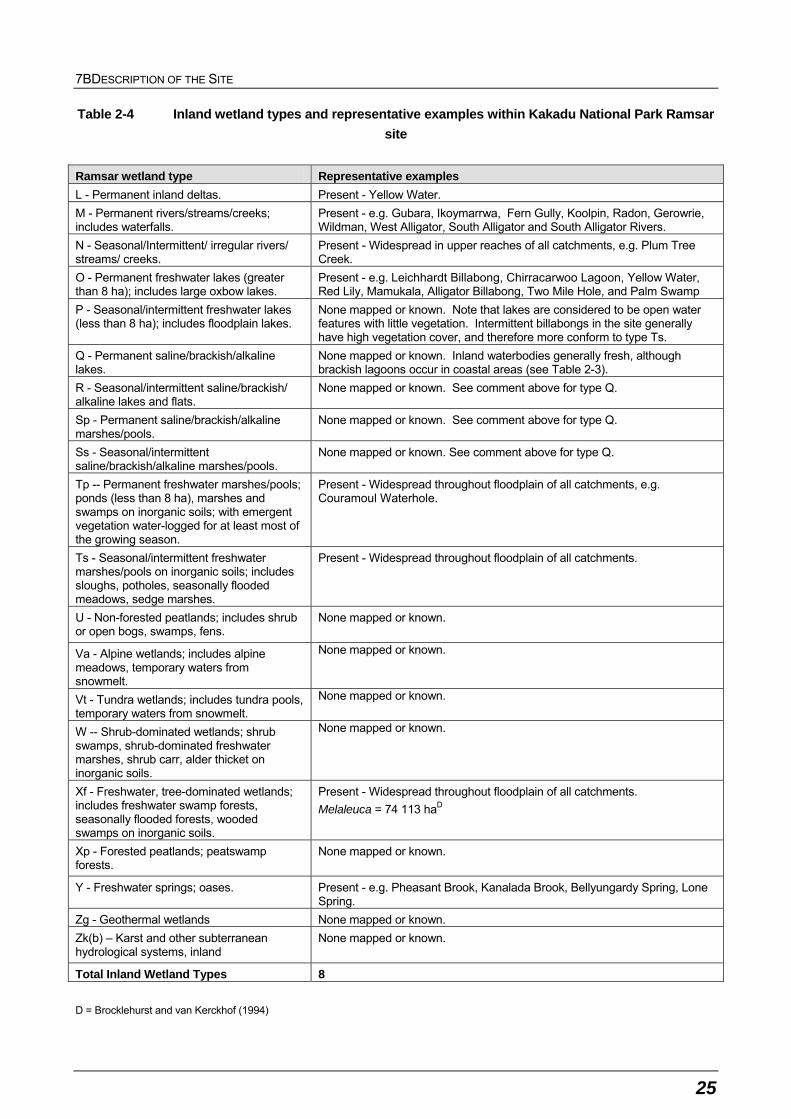
7BDESCRIPTION OF THE SITE
25
Table 2-4 Inland wetland types and representative examples within Kakadu National Park Ramsar
site
Ramsar wetland type Representative examples
L - Permanent inland deltas. Present - Yellow Water.
M - Permanent rivers/streams/creeks; includes waterfalls.
Present - e.g. Gubara, Ikoymarrwa, Fern Gully, Koolpin, Radon, Gerowrie, Wildman, West Alligator, South Alligator and South Alligator Rivers.
N - Seasonal/Intermittent/ irregular rivers/ streams/ creeks.
Present - Widespread in upper reaches of all catchments, e.g. Plum Tree Creek.
O - Permanent freshwater lakes (greater than 8 ha); includes large oxbow lakes.
Present - e.g. Leichhardt Billabong, Chirracarwoo Lagoon, Yellow Water, Red Lily, Mamukala, Alligator Billabong, Two Mile Hole, and Palm Swamp
P - Seasonal/intermittent freshwater lakes (less than 8 ha); includes floodplain lakes.
None mapped or known. Note that lakes are considered to be open water features with little vegetation. Intermittent billabongs in the site generally have high vegetation cover, and therefore more conform to type Ts.
Q - Permanent saline/brackish/alkaline lakes.
None mapped or known. Inland waterbodies generally fresh, although brackish lagoons occur in coastal areas (see Table 2-3).
R - Seasonal/intermittent saline/brackish/ alkaline lakes and flats.
None mapped or known. See comment above for type Q.
Sp - Permanent saline/brackish/alkaline marshes/pools.
None mapped or known. See comment above for type Q.
Ss - Seasonal/intermittent saline/brackish/alkaline marshes/pools.
None mapped or known. See comment above for type Q.
Tp -- Permanent freshwater marshes/pools; ponds (less than 8 ha), marshes and swamps on inorganic soils; with emergent vegetation water-logged for at least most of the growing season.
Present - Widespread throughout floodplain of all catchments, e.g. Couramoul Waterhole.
Ts - Seasonal/intermittent freshwater marshes/pools on inorganic soils; includes sloughs, potholes, seasonally flooded meadows, sedge marshes.
Present - Widespread throughout floodplain of all catchments.
U - Non-forested peatlands; includes shrub or open bogs, swamps, fens.
None mapped or known.
Va - Alpine wetlands; includes alpine meadows, temporary waters from snowmelt.
None mapped or known.
Vt - Tundra wetlands; includes tundra pools, temporary waters from snowmelt.
None mapped or known.
W -- Shrub-dominated wetlands; shrub swamps, shrub-dominated freshwater marshes, shrub carr, alder thicket on inorganic soils.
None mapped or known.
Xf - Freshwater, tree-dominated wetlands; includes freshwater swamp forests, seasonally flooded forests, wooded swamps on inorganic soils.
Present - Widespread throughout floodplain of all catchments.
Melaleuca = 74 113 haD
Xp - Forested peatlands; peatswamp forests.
None mapped or known.
Y - Freshwater springs; oases. Present - e.g. Pheasant Brook, Kanalada Brook, Bellyungardy Spring, Lone Spring.
Zg - Geothermal wetlands None mapped or known.
Zk(b) – Karst and other subterranean hydrological systems, inland
None mapped or known.
Total Inland Wetland Types 8
D = Brocklehurst and van Kerckhof (1994)
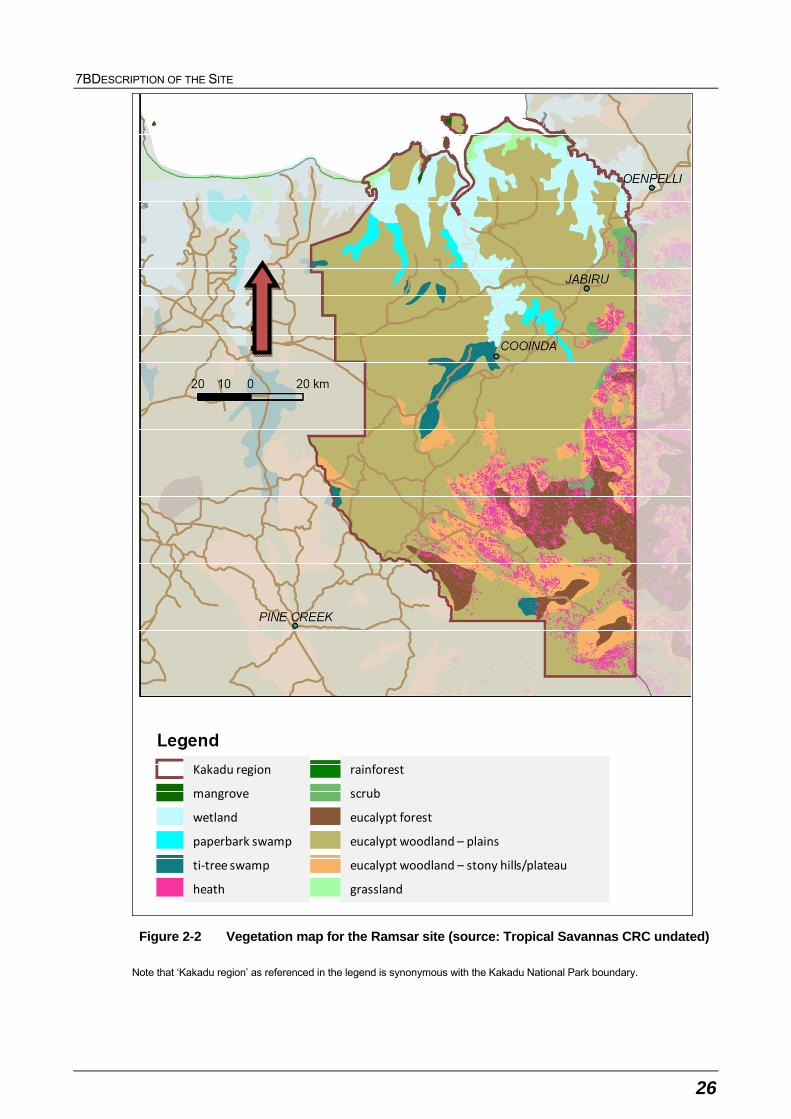
7BDESCRIPTION OF THE SITE
26
Kakadu region
mangrove
wetland
paperbark swamp
ti‐tree swamp
heath
rainforest
scrub
eucalypt forest
eucalypt woodland – plains
eucalypt woodland – stony hills/plateau
grassland
Figure 2-2 Vegetation map for the Ramsar site (source: Tropical Savannas CRC undated)
Note that ‘Kakadu region’ as referenced in the legend is synonymous with the Kakadu National Park boundary.
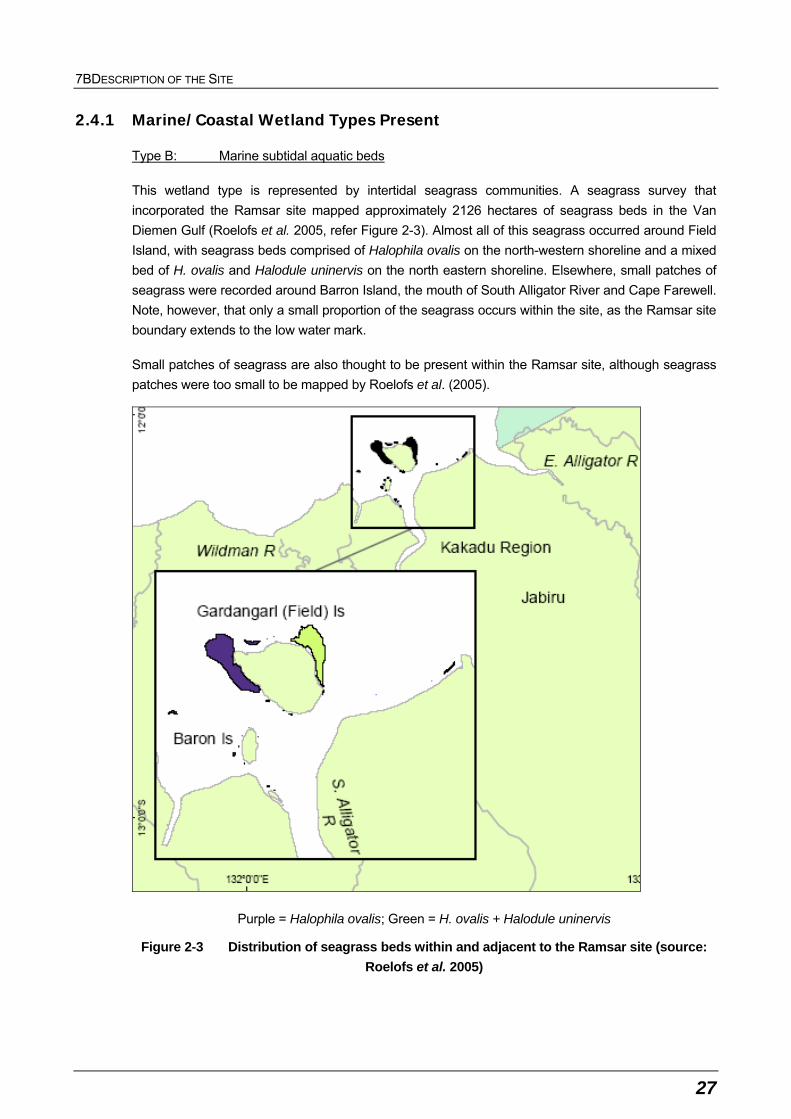
7BDESCRIPTION OF THE SITE
27
2.4.1 Marine/Coastal Wetland Types Present
Type B: Marine subtidal aquatic beds
This wetland type is represented by intertidal seagrass communities. A seagrass survey that
incorporated the Ramsar site mapped approximately 2126 hectares of seagrass beds in the Van
Diemen Gulf (Roelofs et al. 2005, refer Figure 2-3). Almost all of this seagrass occurred around Field
Island, with seagrass beds comprised of Halophila ovalis on the north-western shoreline and a mixed
bed of H. ovalis and Halodule uninervis on the north eastern shoreline. Elsewhere, small patches of
seagrass were recorded around Barron Island, the mouth of South Alligator River and Cape Farewell.
Note, however, that only a small proportion of the seagrass occurs within the site, as the Ramsar site
boundary extends to the low water mark.
Small patches of seagrass are also thought to be present within the Ramsar site, although seagrass
patches were too small to be mapped by Roelofs et al. (2005).
Purple = Halophila ovalis; Green = H. ovalis + Halodule uninervis
Figure 2-3 Distribution of seagrass beds within and adjacent to the Ramsar site (source:
Roelofs et al. 2005)
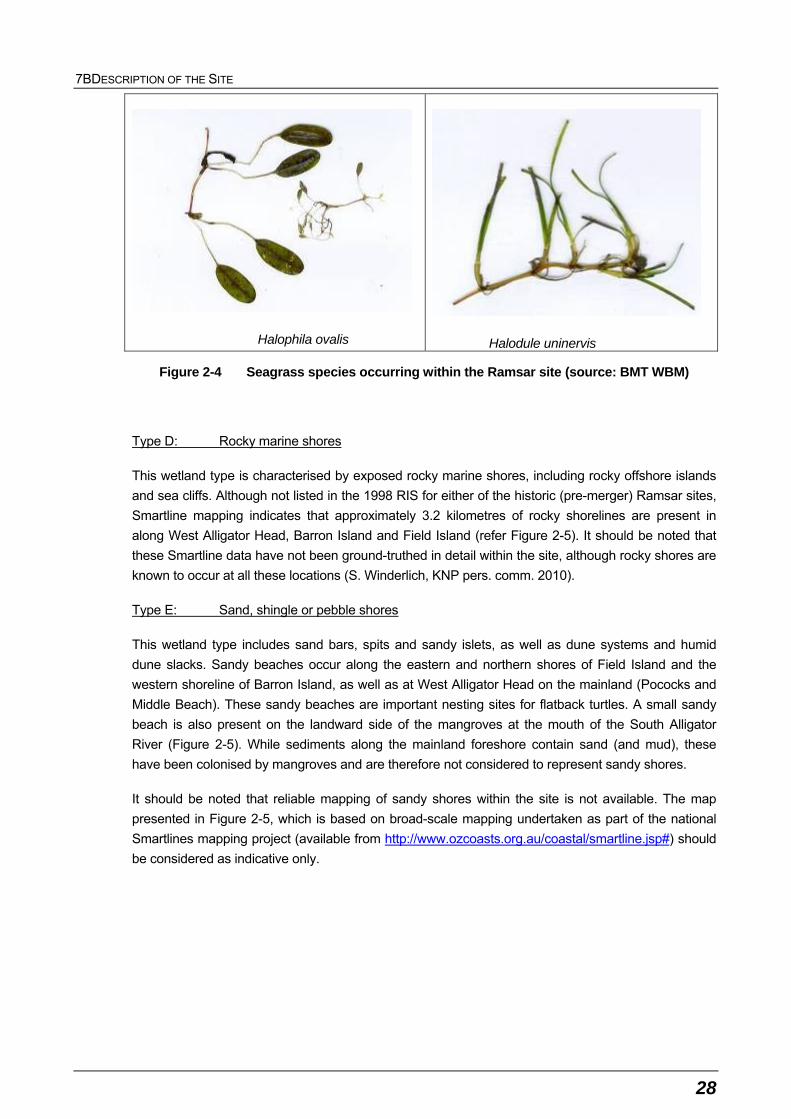
7BDESCRIPTION OF THE SITE
28
Halophila ovalis
Halodule uninervis
Figure 2-4 Seagrass species occurring within the Ramsar site (source: BMT WBM)
Type D: Rocky marine shores
This wetland type is characterised by exposed rocky marine shores, including rocky offshore islands
and sea cliffs. Although not listed in the 1998 RIS for either of the historic (pre-merger) Ramsar sites,
Smartline mapping indicates that approximately 3.2 kilometres of rocky shorelines are present in
along West Alligator Head, Barron Island and Field Island (refer Figure 2-5). It should be noted that
these Smartline data have not been ground-truthed in detail within the site, although rocky shores are
known to occur at all these locations (S. Winderlich, KNP pers. comm. 2010).
Type E: Sand, shingle or pebble shores
This wetland type includes sand bars, spits and sandy islets, as well as dune systems and humid
dune slacks. Sandy beaches occur along the eastern and northern shores of Field Island and the
western shoreline of Barron Island, as well as at West Alligator Head on the mainland (Pococks and
Middle Beach). These sandy beaches are important nesting sites for flatback turtles. A small sandy
beach is also present on the landward side of the mangroves at the mouth of the South Alligator
River (Figure 2-5). While sediments along the mainland foreshore contain sand (and mud), these
have been colonised by mangroves and are therefore not considered to represent sandy shores.
It should be noted that reliable mapping of sandy shores within the site is not available. The map
presented in Figure 2-5, which is based on broad-scale mapping undertaken as part of the national
Smartlines mapping project (available from http://www.ozcoasts.org.au/coastal/smartline.jsp#) should
be considered as indicative only.
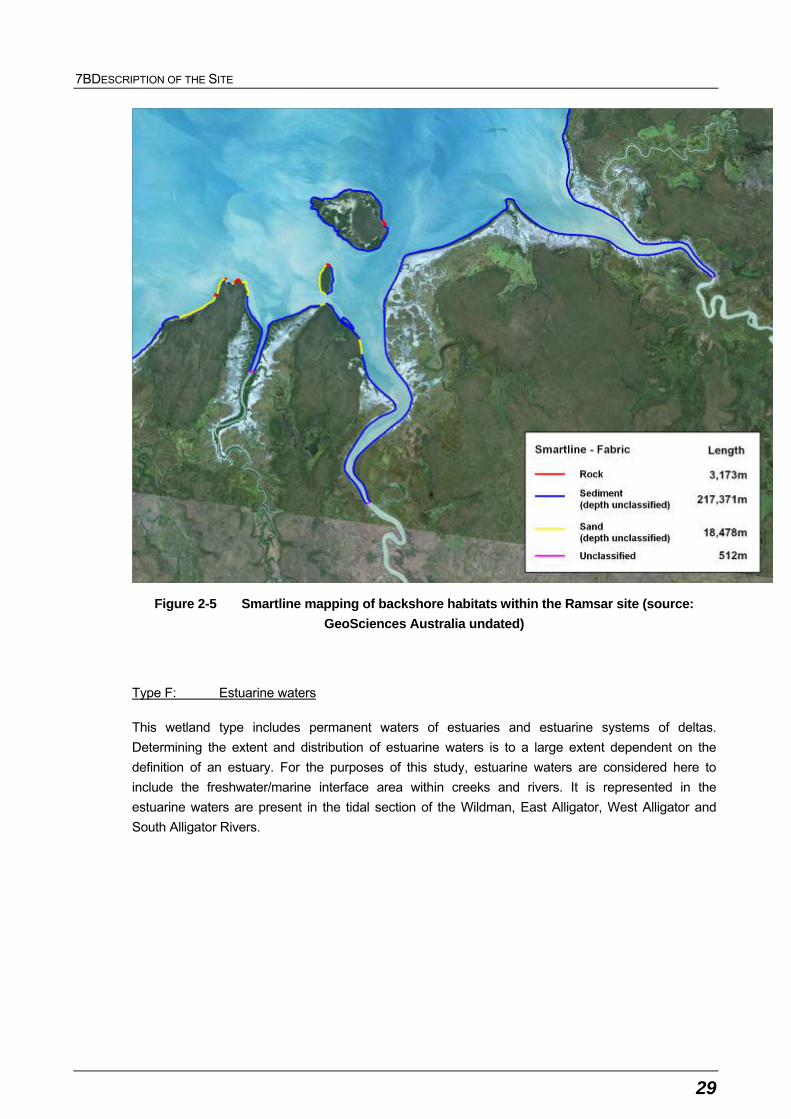
7BDESCRIPTION OF THE SITE
29
Figure 2-5 Smartline mapping of backshore habitats within the Ramsar site (source:
GeoSciences Australia undated)
Type F: Estuarine waters
This wetland type includes permanent waters of estuaries and estuarine systems of deltas.
Determining the extent and distribution of estuarine waters is to a large extent dependent on the
definition of an estuary. For the purposes of this study, estuarine waters are considered here to
include the freshwater/marine interface area within creeks and rivers. It is represented in the
estuarine waters are present in the tidal section of the Wildman, East Alligator, West Alligator and
South Alligator Rivers.
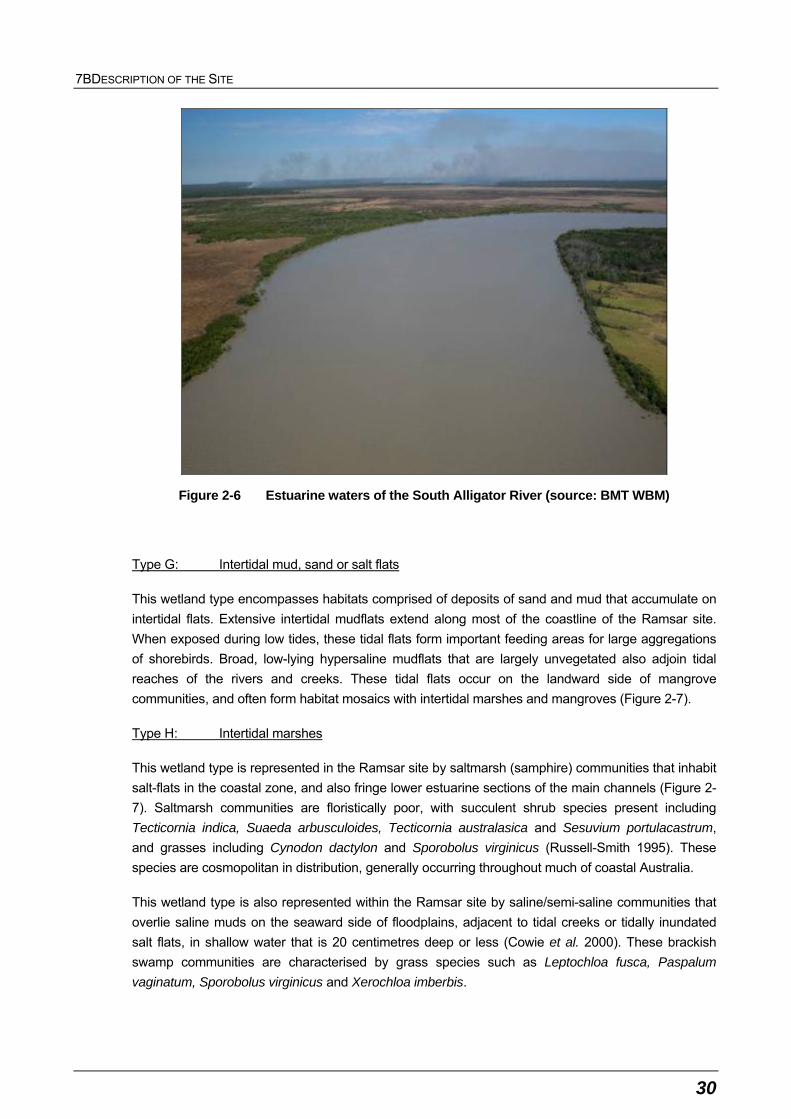
7BDESCRIPTION OF THE SITE
30
Figure 2-6 Estuarine waters of the South Alligator River (source: BMT WBM)
Type G: Intertidal mud, sand or salt flats
This wetland type encompasses habitats comprised of deposits of sand and mud that accumulate on
intertidal flats. Extensive intertidal mudflats extend along most of the coastline of the Ramsar site.
When exposed during low tides, these tidal flats form important feeding areas for large aggregations
of shorebirds. Broad, low-lying hypersaline mudflats that are largely unvegetated also adjoin tidal
reaches of the rivers and creeks. These tidal flats occur on the landward side of mangrove
communities, and often form habitat mosaics with intertidal marshes and mangroves (Figure 2-7).
Type H: Intertidal marshes
This wetland type is represented in the Ramsar site by saltmarsh (samphire) communities that inhabit
salt-flats in the coastal zone, and also fringe lower estuarine sections of the main channels (Figure 2-
7). Saltmarsh communities are floristically poor, with succulent shrub species present including
Tecticornia indica, Suaeda arbusculoides, Tecticornia australasica and Sesuvium portulacastrum,
and grasses including Cynodon dactylon and Sporobolus virginicus (Russell-Smith 1995). These
species are cosmopolitan in distribution, generally occurring throughout much of coastal Australia.
This wetland type is also represented within the Ramsar site by saline/semi-saline communities that
overlie saline muds on the seaward side of floodplains, adjacent to tidal creeks or tidally inundated
salt flats, in shallow water that is 20 centimetres deep or less (Cowie et al. 2000). These brackish
swamp communities are characterised by grass species such as Leptochloa fusca, Paspalum
vaginatum, Sporobolus virginicus and Xerochloa imberbis.
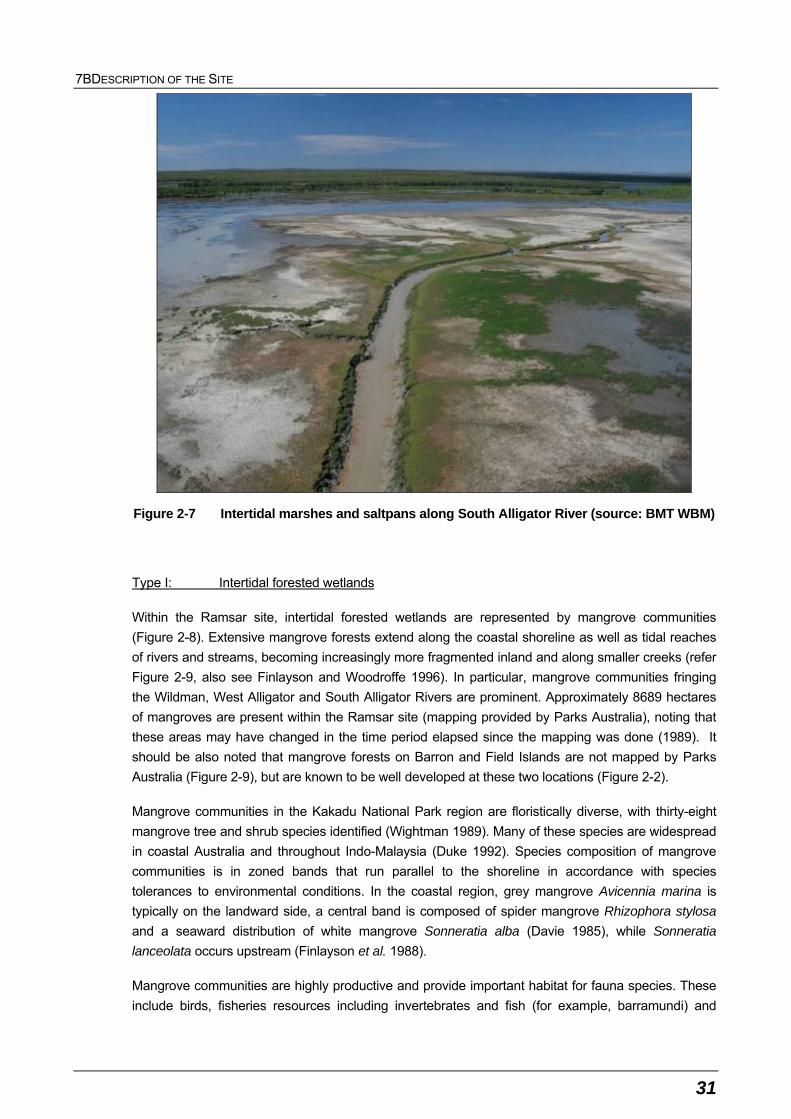
7BDESCRIPTION OF THE SITE
31
Figure 2-7 Intertidal marshes and saltpans along South Alligator River (source: BMT WBM)
Type I: Intertidal forested wetlands
Within the Ramsar site, intertidal forested wetlands are represented by mangrove communities
(Figure 2-8). Extensive mangrove forests extend along the coastal shoreline as well as tidal reaches
of rivers and streams, becoming increasingly more fragmented inland and along smaller creeks (refer
Figure 2-9, also see Finlayson and Woodroffe 1996). In particular, mangrove communities fringing
the Wildman, West Alligator and South Alligator Rivers are prominent. Approximately 8689 hectares
of mangroves are present within the Ramsar site (mapping provided by Parks Australia), noting that
these areas may have changed in the time period elapsed since the mapping was done (1989). It
should be also noted that mangrove forests on Barron and Field Islands are not mapped by Parks
Australia (Figure 2-9), but are known to be well developed at these two locations (Figure 2-2).
Mangrove communities in the Kakadu National Park region are floristically diverse, with thirty-eight
mangrove tree and shrub species identified (Wightman 1989). Many of these species are widespread
in coastal Australia and throughout Indo-Malaysia (Duke 1992). Species composition of mangrove
communities is in zoned bands that run parallel to the shoreline in accordance with species
tolerances to environmental conditions. In the coastal region, grey mangrove Avicennia marina is
typically on the landward side, a central band is composed of spider mangrove Rhizophora stylosa
and a seaward distribution of white mangrove Sonneratia alba (Davie 1985), while Sonneratia
lanceolata occurs upstream (Finlayson et al. 1988).
Mangrove communities are highly productive and provide important habitat for fauna species. These
include birds, fisheries resources including invertebrates and fish (for example, barramundi) and
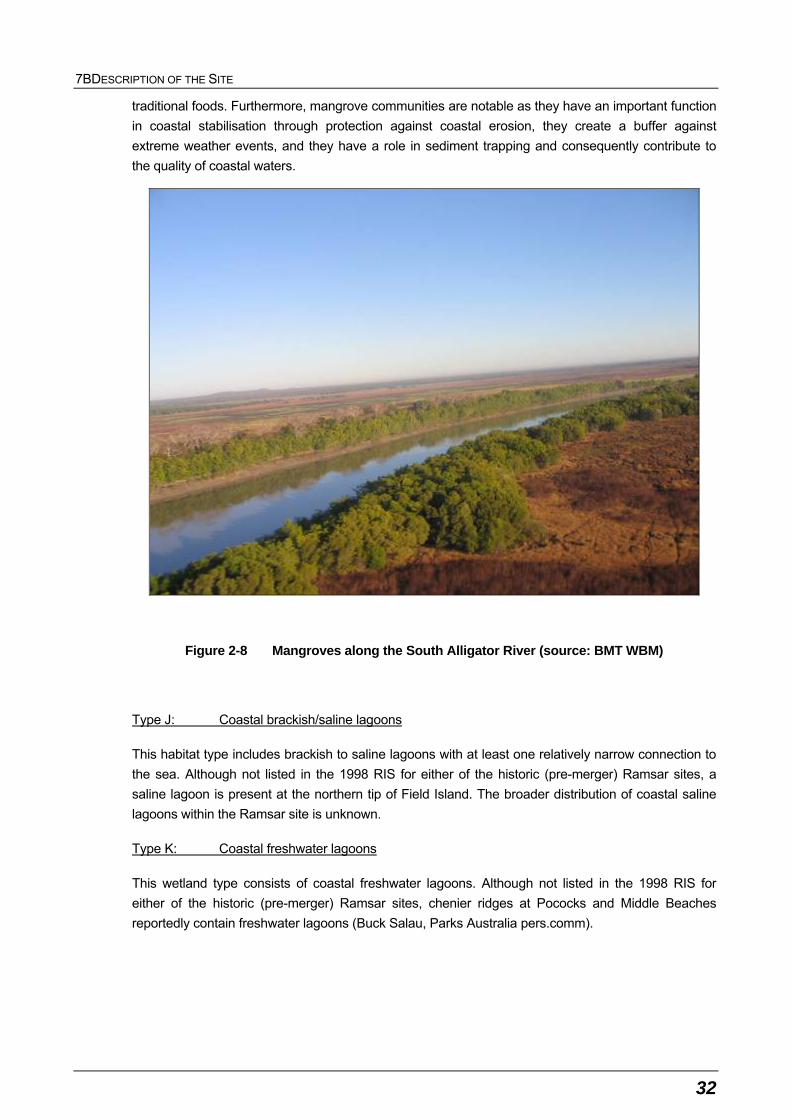
7BDESCRIPTION OF THE SITE
32
traditional foods. Furthermore, mangrove communities are notable as they have an important function
in coastal stabilisation through protection against coastal erosion, they create a buffer against
extreme weather events, and they have a role in sediment trapping and consequently contribute to
the quality of coastal waters.
Figure 2-8 Mangroves along the South Alligator River (source: BMT WBM)
Type J: Coastal brackish/saline lagoons
This habitat type includes brackish to saline lagoons with at least one relatively narrow connection to
the sea. Although not listed in the 1998 RIS for either of the historic (pre-merger) Ramsar sites, a
saline lagoon is present at the northern tip of Field Island. The broader distribution of coastal saline
lagoons within the Ramsar site is unknown.
Type K: Coastal freshwater lagoons
This wetland type consists of coastal freshwater lagoons. Although not listed in the 1998 RIS for
either of the historic (pre-merger) Ramsar sites, chenier ridges at Pococks and Middle Beaches
reportedly contain freshwater lagoons (Buck Salau, Parks Australia pers.comm).
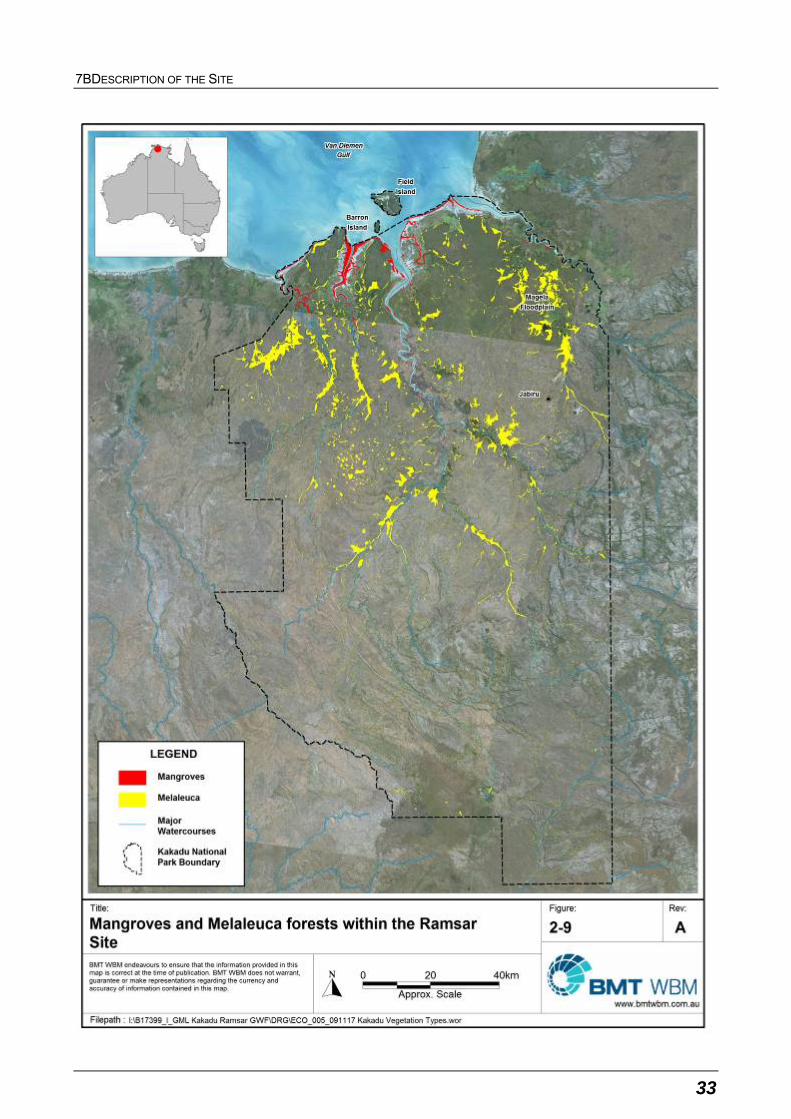
7BDESCRIPTION OF THE SITE
33
I:\B17399_I_GML Kakadu Ramsar GWF\DRG\ECO_005_091117 Kakadu Vegetation Types.wor
Figure 2-9 Mangroves and Melaleuca forest extent within the Ramsar site (source: Parks
Australia unpublished data)
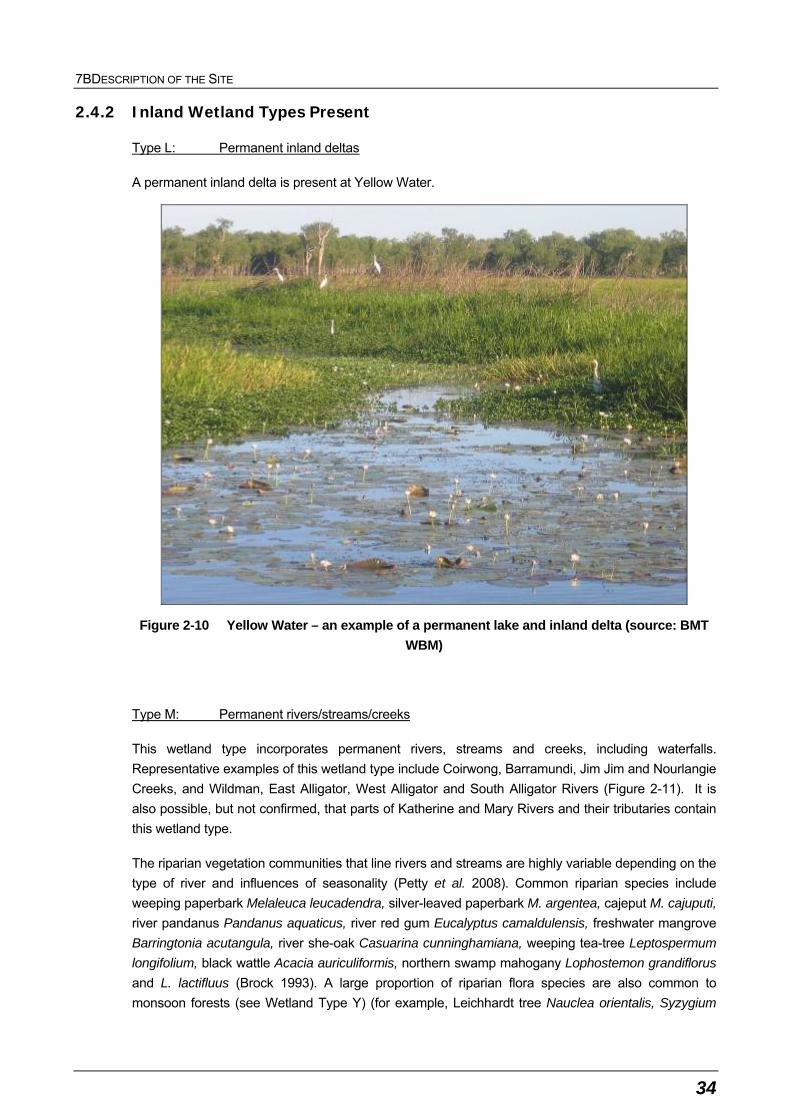
7BDESCRIPTION OF THE SITE
34
2.4.2 Inland Wetland Types Present
Type L: Permanent inland deltas
A permanent inland delta is present at Yellow Water.
Figure 2-10 Yellow Water – an example of a permanent lake and inland delta (source: BMT
WBM)
Type M: Permanent rivers/streams/creeks
This wetland type incorporates permanent rivers, streams and creeks, including waterfalls.
Representative examples of this wetland type include Coirwong, Barramundi, Jim Jim and Nourlangie
Creeks, and Wildman, East Alligator, West Alligator and South Alligator Rivers (Figure 2-11). It is
also possible, but not confirmed, that parts of Katherine and Mary Rivers and their tributaries contain
this wetland type.
The riparian vegetation communities that line rivers and streams are highly variable depending on the
type of river and influences of seasonality (Petty et al. 2008). Common riparian species include
weeping paperbark Melaleuca leucadendra, silver-leaved paperbark M. argentea, cajeput M. cajuputi,
river pandanus Pandanus aquaticus, river red gum Eucalyptus camaldulensis, freshwater mangrove
Barringtonia acutangula, river she-oak Casuarina cunninghamiana, weeping tea-tree Leptospermum
longifolium, black wattle Acacia auriculiformis, northern swamp mahogany Lophostemon grandiflorus
and L. lactifluus (Brock 1993). A large proportion of riparian flora species are also common to
monsoon forests (see Wetland Type Y) (for example, Leichhardt tree Nauclea orientalis, Syzygium
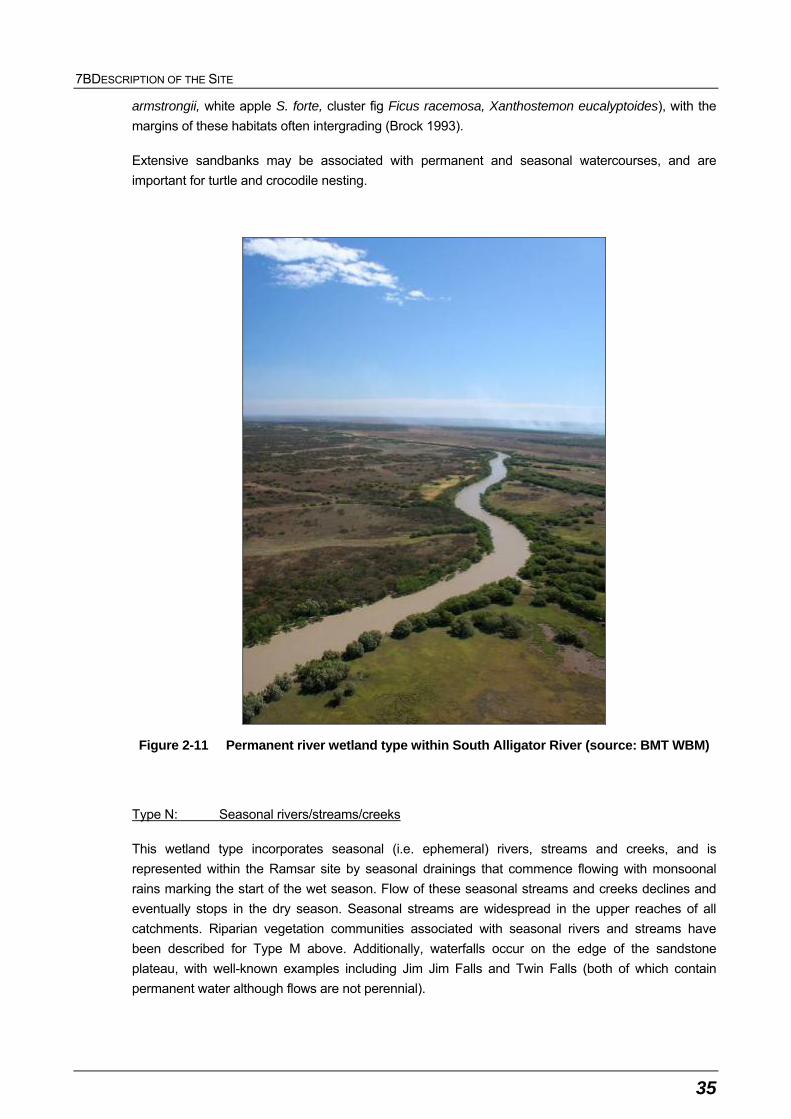
7BDESCRIPTION OF THE SITE
35
armstrongii, white apple S. forte, cluster fig Ficus racemosa, Xanthostemon eucalyptoides), with the
margins of these habitats often intergrading (Brock 1993).
Extensive sandbanks may be associated with permanent and seasonal watercourses, and are
important for turtle and crocodile nesting.
Figure 2-11 Permanent river wetland type within South Alligator River (source: BMT WBM)
Type N: Seasonal rivers/streams/creeks
This wetland type incorporates seasonal (i.e. ephemeral) rivers, streams and creeks, and is
represented within the Ramsar site by seasonal drainings that commence flowing with monsoonal
rains marking the start of the wet season. Flow of these seasonal streams and creeks declines and
eventually stops in the dry season. Seasonal streams are widespread in the upper reaches of all
catchments. Riparian vegetation communities associated with seasonal rivers and streams have
been described for Type M above. Additionally, waterfalls occur on the edge of the sandstone
plateau, with well-known examples including Jim Jim Falls and Twin Falls (both of which contain
permanent water although flows are not perennial).
7BDESCRIPTION OF THE SITE
36
Type O: Permanent Freshwater Lakes
This wetland type includes permanent freshwater lakes that are larger than eight hectares in area.
Although not listed in the 1998 RIS for either historic (pre-merger) site, this wetland type is
represented within the Ramsar site by permanent freshwater billabongs that exceed the eight
hectares area threshold (as digitised for part of the Ramsar site by BMT WBM 2010, refer Figure
2-15). With regards to the figure, note that billabong digitisation was only done for a portion of the
site, and that only billabongs greater than eight hectares are classified as Type O.
Representative examples of billabongs include Chirracarwoo Lagoon (approximately 101 hectares),
Leichhardt Billabong (approximately 17 hectares), Billabong (approximately 32 hectares) and Yellow
Water.
Mixed community herblands comprised of submerged, floating and emergent plant species are
associated with permanent freshwater billabongs. These communities are often dominated by
waterlilies such as white snowflake lily Nymphoides indica and the traditional food species red lily
Nelumbo nucifera, with other macrophyte species including Limnophila australis, Triglochin dubium
and Caldesia oligococca (Finlayson 2005). Billabongs provide dry season refuges for many of the
aquatic fauna species.
Type Tp: Permanent freshwater marshes/pools
This wetland type includes ponds less than eight hectares in area, as well as marshes and swamps
on inorganic soils with emergent vegetation that is waterlogged for at least most of the growing
season. Within the Ramsar site, it is represented by permanent freshwater billabongs that are smaller
than the eight hectares area threshold, such as Couramoul Waterhole (approximately three hectares)
(refer Figure 2-9). With regards to this figure, note that billabong digitisation was only done for a
portion of the site, and that only billabongs less than eight hectares are classified as Type Tp.
Additionally, this wetland type incorporates sedge and grass-dominated marshes on the wettest parts
of the floodplains that are inundated for most or all of the year (Cowie et al. 2000). These marshes
are widespread throughout the floodplain of all catchments within the site.
Type Ts: Seasonal/intermittent freshwater marshes/pools
This wetland type is composed of seasonal/intermittent freshwater marshes and pools on inorganic
soils, including seasonally flooded meadows and sedge marshes (Figure 2-12). This wetland type is
represented within the Ramsar site by vast tracts of freshwater wetlands that comprise the seasonally
inundated floodplains. While vegetation is sparsely distributed during the dry season, floodplain
wetlands are covered with one to two per metres of water and a multitude of plants during the wet
season (Finlayson and Woodroffe 1996).
The floodplain wetlands are primarily sedge- and/or grass-dominated meadows that form complex
spatial mosaics. Flora species comprising the floodplain wetlands are predominantly cosmopolitan in
distribution (Taylor and Dunlop 1985), with characteristic species including wild rice Oryza spp.,
spike-rush Eleocharis spp), native hymenachne Hymenachne acutigluma and water couch
Pseudoraphis spinescens (Russell-Smith 1995, Finlayson 2005). Commonly encountered waterlilies
include blue waterlily Nymphaea violaceae, yellow snowflake lily Nymphoides hydrocharoides and
white snowflake lily Nymphoides indica.
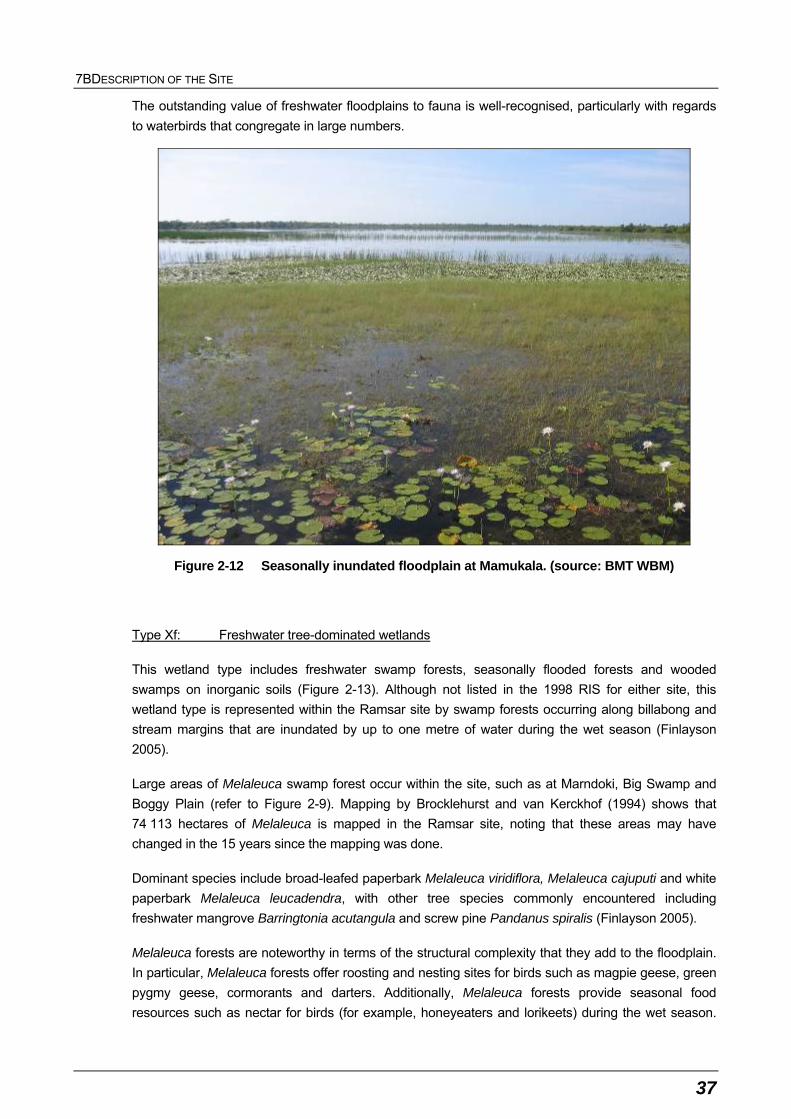
7BDESCRIPTION OF THE SITE
37
The outstanding value of freshwater floodplains to fauna is well-recognised, particularly with regards
to waterbirds that congregate in large numbers.
Figure 2-12 Seasonally inundated floodplain at Mamukala. (source: BMT WBM)
Type Xf: Freshwater tree-dominated wetlands
This wetland type includes freshwater swamp forests, seasonally flooded forests and wooded
swamps on inorganic soils (Figure 2-13). Although not listed in the 1998 RIS for either site, this
wetland type is represented within the Ramsar site by swamp forests occurring along billabong and
stream margins that are inundated by up to one metre of water during the wet season (Finlayson
2005).
Large areas of Melaleuca swamp forest occur within the site, such as at Marndoki, Big Swamp and
Boggy Plain (refer to Figure 2-9). Mapping by Brocklehurst and van Kerckhof (1994) shows that
74 113 hectares of Melaleuca is mapped in the Ramsar site, noting that these areas may have
changed in the 15 years since the mapping was done.
Dominant species include broad-leafed paperbark Melaleuca viridiflora, Melaleuca cajuputi and white
paperbark Melaleuca leucadendra, with other tree species commonly encountered including
freshwater mangrove Barringtonia acutangula and screw pine Pandanus spiralis (Finlayson 2005).
Melaleuca forests are noteworthy in terms of the structural complexity that they add to the floodplain.
In particular, Melaleuca forests offer roosting and nesting sites for birds such as magpie geese, green
pygmy geese, cormorants and darters. Additionally, Melaleuca forests provide seasonal food
resources such as nectar for birds (for example, honeyeaters and lorikeets) during the wet season.
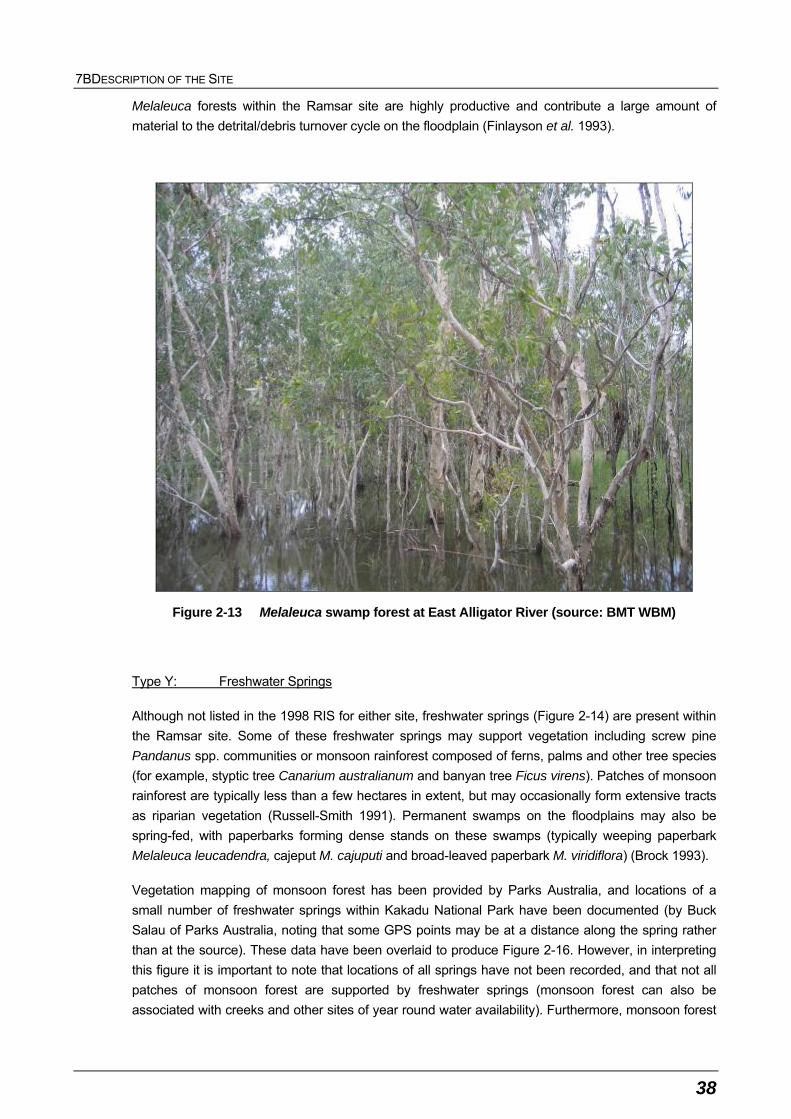
7BDESCRIPTION OF THE SITE
38
Melaleuca forests within the Ramsar site are highly productive and contribute a large amount of
material to the detrital/debris turnover cycle on the floodplain (Finlayson et al. 1993).
Figure 2-13 Melaleuca swamp forest at East Alligator River (source: BMT WBM)
Type Y: Freshwater Springs
Although not listed in the 1998 RIS for either site, freshwater springs (Figure 2-14) are present within
the Ramsar site. Some of these freshwater springs may support vegetation including screw pine
Pandanus spp. communities or monsoon rainforest composed of ferns, palms and other tree species
(for example, styptic tree Canarium australianum and banyan tree Ficus virens). Patches of monsoon
rainforest are typically less than a few hectares in extent, but may occasionally form extensive tracts
as riparian vegetation (Russell-Smith 1991). Permanent swamps on the floodplains may also be
spring-fed, with paperbarks forming dense stands on these swamps (typically weeping paperbark
Melaleuca leucadendra, cajeput M. cajuputi and broad-leaved paperbark M. viridiflora) (Brock 1993).
Vegetation mapping of monsoon forest has been provided by Parks Australia, and locations of a
small number of freshwater springs within Kakadu National Park have been documented (by Buck
Salau of Parks Australia, noting that some GPS points may be at a distance along the spring rather
than at the source). These data have been overlaid to produce Figure 2-16. However, in interpreting
this figure it is important to note that locations of all springs have not been recorded, and that not all
patches of monsoon forest are supported by freshwater springs (monsoon forest can also be
associated with creeks and other sites of year round water availability). Furthermore, monsoon forest
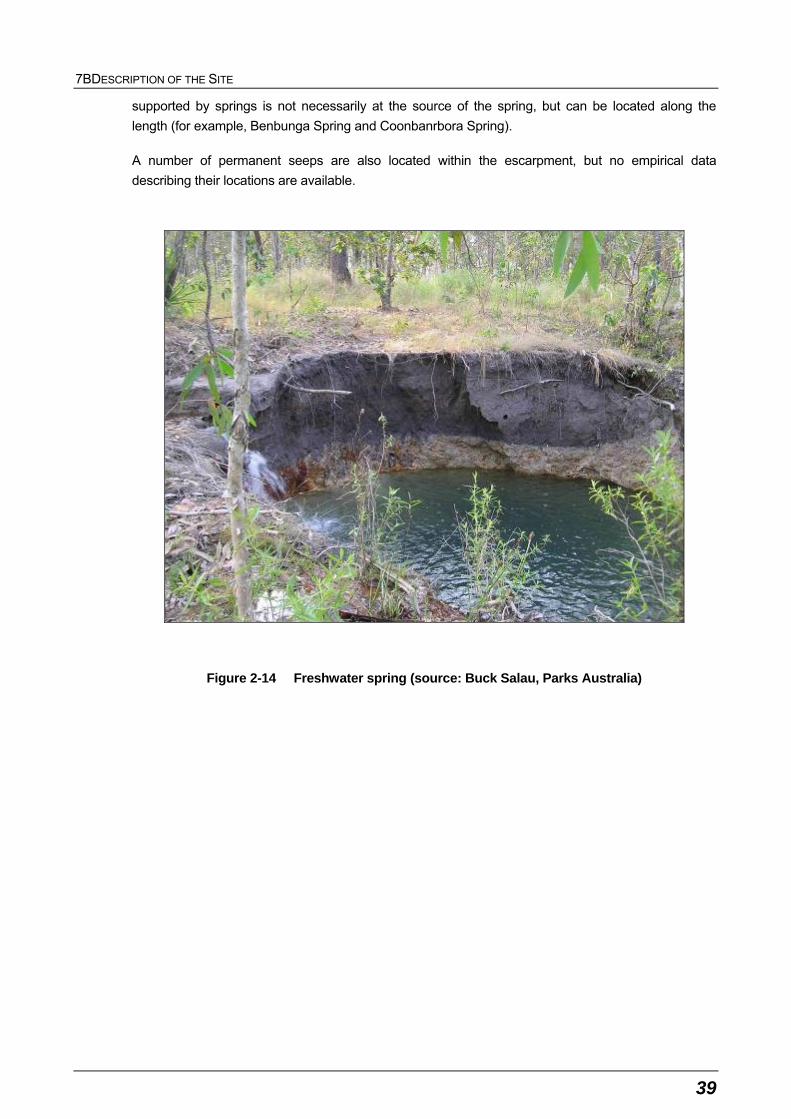
7BDESCRIPTION OF THE SITE
39
supported by springs is not necessarily at the source of the spring, but can be located along the
length (for example, Benbunga Spring and Coonbanrbora Spring).
A number of permanent seeps are also located within the escarpment, but no empirical data
describing their locations are available.
Figure 2-14 Freshwater spring (source: Buck Salau, Parks Australia)
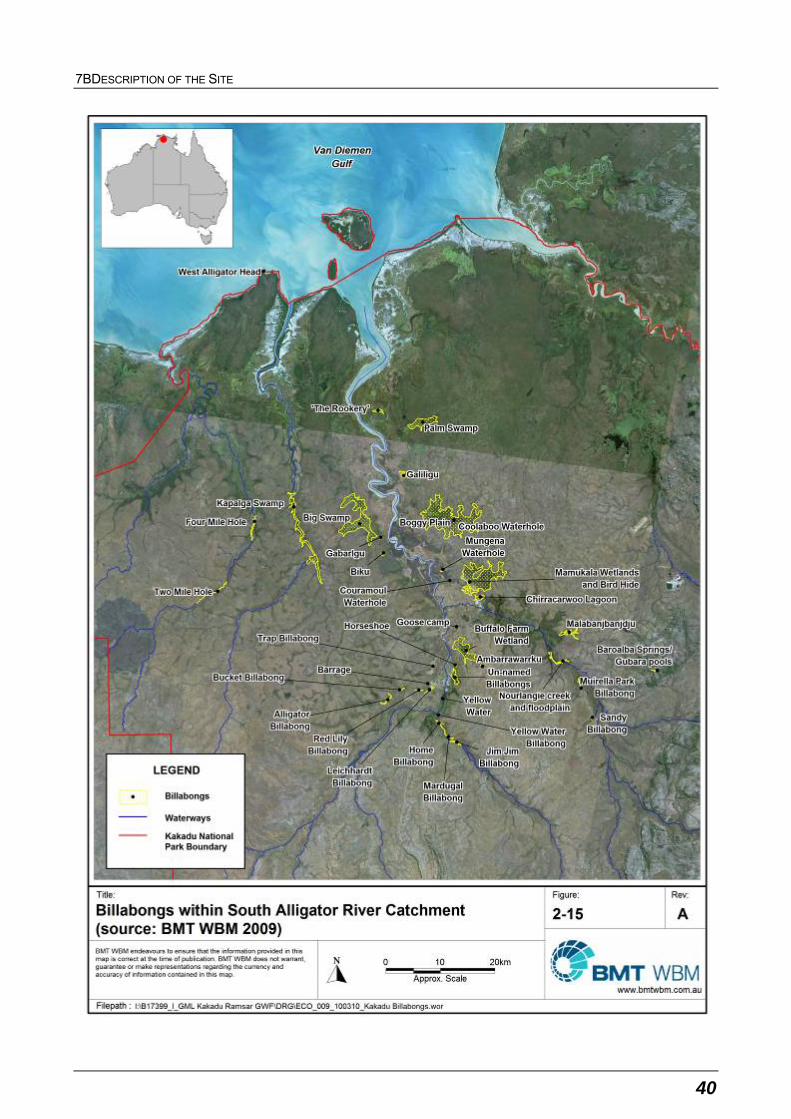
7BDESCRIPTION OF THE SITE
40
I:\B17399_I_GML Kakadu Ramsar GWF\DRG\ECO_009_100310_Kakadu Billabongs.wor
Figure 2-15 Billabongs within South Alligator River catchment (source: BMT WBM 2009)
I:\B17399_I_GML Kakadu Ramsar GWF\DRG\ ECO_006_091117 Kakadu Forests Springs.wor
Figure 2-16 Freshwater springs and monsoon forest within the Ramsar site (source: Parks
Australia unpublished data)
7BDESCRIPTION OF THE SITE
41
2.4.3 Discrepancies with the 1998 RISs
A number of differences exist between the 1998 RISs for the historic (pre-merger) Ramsar sites and
the current study in terms of the identification of wetland types that are present. However, differences
do not represent an actual change in wetland types over time but instead reflect (i) differences in the
interpretation of wetland typology descriptions; and (ii) an increase in knowledge of wetland type
distribution since the preparation of the 1998 RISs.
Summarised from above, the following wetland types that were previously not identified for Kakadu
National Park site but are now known to be present include the following:
Type D – Rocky marine shores
Type J – Coastal brackish/saline lagoons
Type K – Coastal freshwater lagoon
Type O – Permanent freshwater lakes
Type Xf – Freshwater tree dominated wetlands, and
Type Y - Freshwater springs.
The following wetland types that were previously identified as present within the site are not
considered to occur in the site.
Type A: Permanent shallow marine waters
This wetland type incorporates marine waters that are less than six metres deep at low tide, including
sea bays and straits. However, only waters above low water are included within the Ramsar site
boundaries, and subtidal waters within the river channels are classified as estuarine waters (Type F).
Therefore, this wetland type is not considered to be present in the Ramsar site.
Type R: Seasonal/intermittent saline/brackish/alkaline lakes and flats
Seasonal saline lakes are not thought to be represented within the Kakadu National Park Ramsar
site.
Type Sp: Permanent saline/brackish/alkaline marshes/pools
Permanent saline marshes within the Ramsar site are not considered to be inland, but are rather
classified as coastal wetlands (Type H).
Type Xp: Forested peatlands
This wetland type incorporates peat swamp forests and forested peatlands are not represented within
Kakadu National Park. It is likely that inclusion of Type Xp in the 1998 RISs was an error that should
rather have been Type Xf (described above).
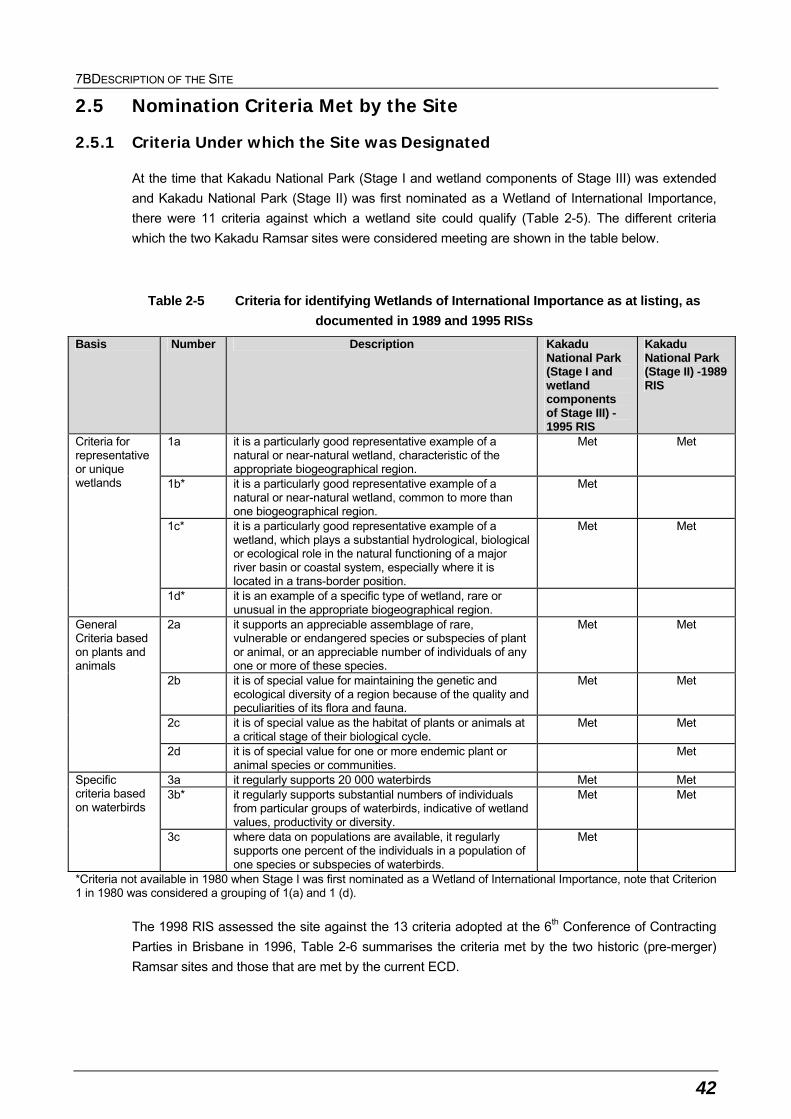
7BDESCRIPTION OF THE SITE
42
2.5 Nomination Criteria Met by the Site
2.5.1 Criteria Under which the Site was Designated
At the time that Kakadu National Park (Stage I and wetland components of Stage III) was extended
and Kakadu National Park (Stage II) was first nominated as a Wetland of International Importance,
there were 11 criteria against which a wetland site could qualify (Table 2-5). The different criteria
which the two Kakadu Ramsar sites were considered meeting are shown in the table below.
Table 2-5 Criteria for identifying Wetlands of International Importance as at listing, as
documented in 1989 and 1995 RISs
Basis Number Description Kakadu National Park (Stage I and wetland components of Stage III) - 1995 RIS
Kakadu National Park (Stage II) -1989 RIS
1a it is a particularly good representative example of a natural or near-natural wetland, characteristic of the appropriate biogeographical region.
Met Met
1b* it is a particularly good representative example of a natural or near-natural wetland, common to more than one biogeographical region.
Met
1c* it is a particularly good representative example of a wetland, which plays a substantial hydrological, biological or ecological role in the natural functioning of a major river basin or coastal system, especially where it is located in a trans-border position.
Met Met
Criteria for representative or unique wetlands
1d* it is an example of a specific type of wetland, rare or unusual in the appropriate biogeographical region.
2a it supports an appreciable assemblage of rare, vulnerable or endangered species or subspecies of plant or animal, or an appreciable number of individuals of any one or more of these species.
Met Met
2b it is of special value for maintaining the genetic and ecological diversity of a region because of the quality and peculiarities of its flora and fauna.
Met Met
2c it is of special value as the habitat of plants or animals at a critical stage of their biological cycle.
Met Met
General Criteria based on plants and animals
2d it is of special value for one or more endemic plant or animal species or communities.
Met
3a it regularly supports 20 000 waterbirds Met Met 3b* it regularly supports substantial numbers of individuals
from particular groups of waterbirds, indicative of wetland values, productivity or diversity.
Met Met Specific criteria based on waterbirds
3c where data on populations are available, it regularly supports one percent of the individuals in a population of one species or subspecies of waterbirds.
Met
*Criteria not available in 1980 when Stage I was first nominated as a Wetland of International Importance, note that Criterion 1 in 1980 was considered a grouping of 1(a) and 1 (d).
The 1998 RIS assessed the site against the 13 criteria adopted at the 6th Conference of Contracting
Parties in Brisbane in 1996, Table 2-6 summarises the criteria met by the two historic (pre-merger)
Ramsar sites and those that are met by the current ECD.
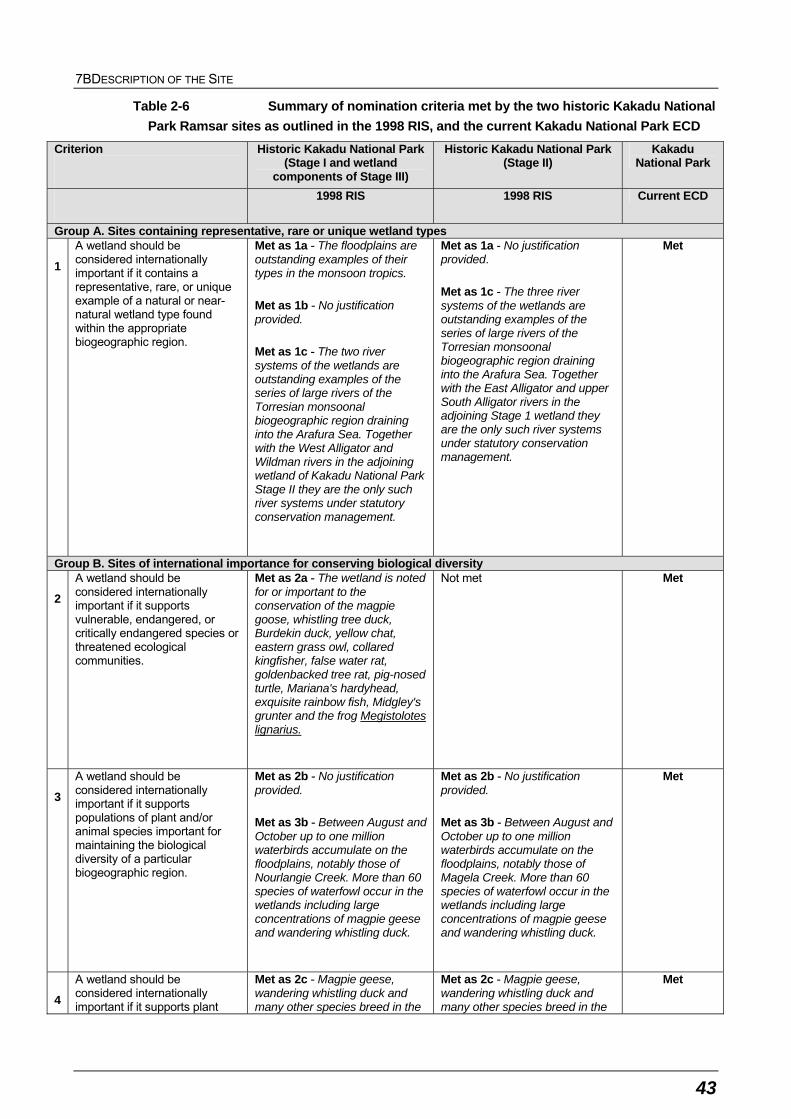
7BDESCRIPTION OF THE SITE
43
Table 2-6 Summary of nomination criteria met by the two historic Kakadu National
Park Ramsar sites as outlined in the 1998 RIS, and the current Kakadu National Park ECD
Criterion
Historic Kakadu National Park (Stage I and wetland
components of Stage III)
Historic Kakadu National Park (Stage II)
Kakadu National Park
1998 RIS 1998 RIS Current ECD
Group A. Sites containing representative, rare or unique wetland types
1
A wetland should be considered internationally important if it contains a representative, rare, or unique example of a natural or near-natural wetland type found within the appropriate biogeographic region.
Met as 1a - The floodplains are outstanding examples of their types in the monsoon tropics.
Met as 1b - No justification provided.
Met as 1c - The two river systems of the wetlands are outstanding examples of the series of large rivers of the Torresian monsoonal biogeographic region draining into the Arafura Sea. Together with the West Alligator and Wildman rivers in the adjoining wetland of Kakadu National Park Stage II they are the only such river systems under statutory conservation management.
Met as 1a - No justification provided.
Met as 1c - The three river systems of the wetlands are outstanding examples of the series of large rivers of the Torresian monsoonal biogeographic region draining into the Arafura Sea. Together with the East Alligator and upper South Alligator rivers in the adjoining Stage 1 wetland they are the only such river systems under statutory conservation management.
Met
Group B. Sites of international importance for conserving biological diversity
2
A wetland should be considered internationally important if it supports vulnerable, endangered, or critically endangered species or threatened ecological communities.
Met as 2a - The wetland is noted for or important to the conservation of the magpie goose, whistling tree duck, Burdekin duck, yellow chat, eastern grass owl, collared kingfisher, false water rat, goldenbacked tree rat, pig-nosed turtle, Mariana's hardyhead, exquisite rainbow fish, Midgley's grunter and the frog Megistolotes lignarius.
Not met Met
3
A wetland should be considered internationally important if it supports populations of plant and/or animal species important for maintaining the biological diversity of a particular biogeographic region.
Met as 2b - No justification provided.
Met as 3b - Between August and October up to one million waterbirds accumulate on the floodplains, notably those of Nourlangie Creek. More than 60 species of waterfowl occur in the wetlands including large concentrations of magpie geese and wandering whistling duck.
Met as 2b - No justification provided.
Met as 3b - Between August and October up to one million waterbirds accumulate on the floodplains, notably those of Magela Creek. More than 60 species of waterfowl occur in the wetlands including large concentrations of magpie geese and wandering whistling duck.
Met
4
A wetland should be considered internationally important if it supports plant
Met as 2c - Magpie geese, wandering whistling duck and many other species breed in the
Met as 2c - Magpie geese, wandering whistling duck and many other species breed in the
Met
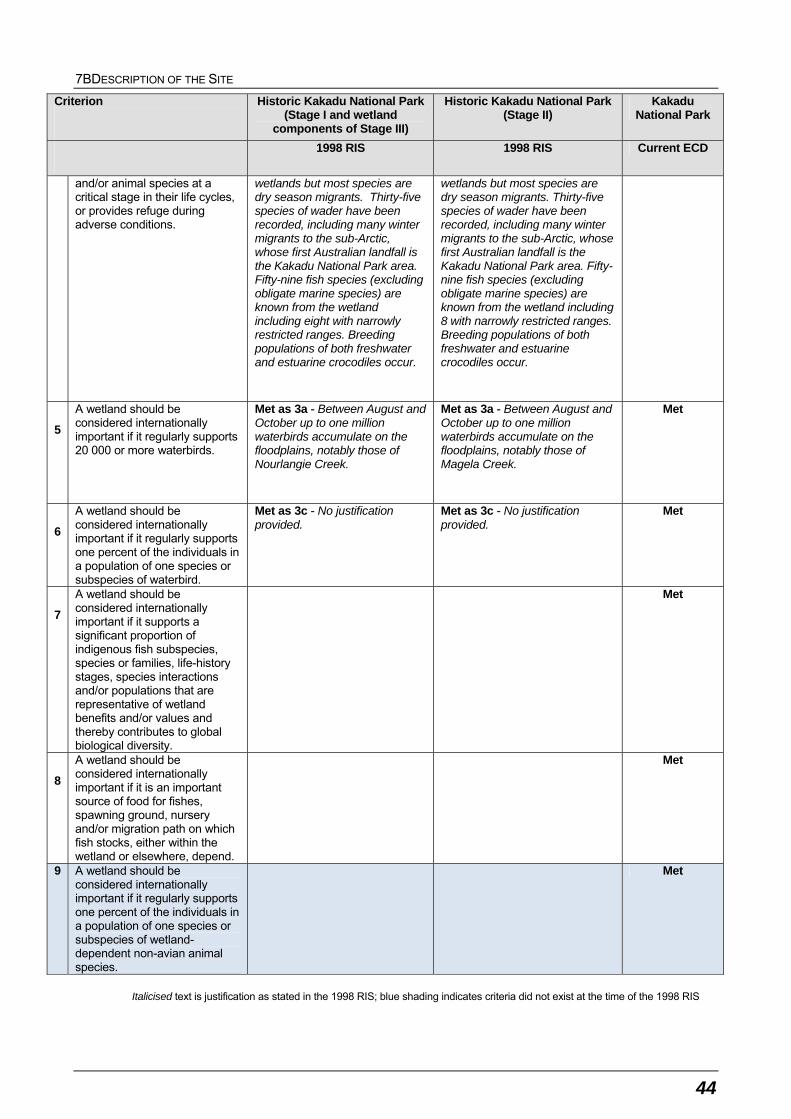
7BDESCRIPTION OF THE SITE
44
Criterion
Historic Kakadu National Park (Stage I and wetland
components of Stage III)
Historic Kakadu National Park (Stage II)
Kakadu National Park
1998 RIS 1998 RIS Current ECD
and/or animal species at a critical stage in their life cycles, or provides refuge during adverse conditions.
wetlands but most species are dry season migrants. Thirty-five species of wader have been recorded, including many winter migrants to the sub-Arctic, whose first Australian landfall is the Kakadu National Park area. Fifty-nine fish species (excluding obligate marine species) are known from the wetland including eight with narrowly restricted ranges. Breeding populations of both freshwater and estuarine crocodiles occur.
wetlands but most species are dry season migrants. Thirty-five species of wader have been recorded, including many winter migrants to the sub-Arctic, whose first Australian landfall is the Kakadu National Park area. Fifty-nine fish species (excluding obligate marine species) are known from the wetland including 8 with narrowly restricted ranges. Breeding populations of both freshwater and estuarine crocodiles occur.
5
A wetland should be considered internationally important if it regularly supports 20 000 or more waterbirds.
Met as 3a - Between August and October up to one million waterbirds accumulate on the floodplains, notably those of Nourlangie Creek.
Met as 3a - Between August and October up to one million waterbirds accumulate on the floodplains, notably those of Magela Creek.
Met
6
A wetland should be considered internationally important if it regularly supports one percent of the individuals in a population of one species or subspecies of waterbird.
Met as 3c - No justification provided.
Met as 3c - No justification provided.
Met
7
A wetland should be considered internationally important if it supports a significant proportion of indigenous fish subspecies, species or families, life-history stages, species interactions and/or populations that are representative of wetland benefits and/or values and thereby contributes to global biological diversity.
Met
8
A wetland should be considered internationally important if it is an important source of food for fishes, spawning ground, nursery and/or migration path on which fish stocks, either within the wetland or elsewhere, depend.
Met
9 A wetland should be considered internationally important if it regularly supports one percent of the individuals in a population of one species or subspecies of wetland-dependent non-avian animal species.
Met
Italicised text is justification as stated in the 1998 RIS; blue shading indicates criteria did not exist at the time of the 1998 RIS
7BDESCRIPTION OF THE SITE
45
2.5.2 Assessment Based on Current Information and Ramsar Criteria
There have been a number of developments in the past decade that influence the application of the
Ramsar criteria to wetland sites this includes:
Refinements and revisions of the Ramsar criteria since 1996. An additional criterion was added
at the 9th Ramsar Conference in Uganda in 2005.
Revision of population estimates for waterbirds (Wetlands International 2006; Bamford et al.
2008), which influences the application of criterion six.
A decision with respect to the appropriate bioregionalisation for aquatic systems in Australia,
which for inland systems are now based on drainage divisions and for marine systems the
interim marine classification and regionalisation for Australia (IMCRA). This affects the
application of criteria one and three.
Updating of threatened species listings, which affects criterion two.
Additional data have been collected for the site, which could potentially influence the application
of all criteria.
Therefore an assessment of the Kakadu National Park Ramsar site against the current nine Ramsar
criteria has been undertaken. The Nomination Criteria have been reconsidered in this ECD, with
specific reference to more up-to-date requirements outlined in “Handbook 14 Designating Ramsar
Sites” (Ramsar Convention Secretariat 2007) and the National Framework (DEWHA 2008).
7BDESCRIPTION OF THE SITE
46
2.5.3 Criterion 1
A wetland should be considered internationally important if it contains a representative, rare, or
unique example of a natural or near-natural wetland type found within the appropriate biogeographic
region.
Criterion 1 (met at time of listing and continues to be met based on current assessment)
Criterion 1 considers habitat types and their representativeness within a given biogeographic region
(bioregion). As outlined in Section 1.4.5, the site occurs in the Timor Sea Drainage Division and the
Northern IMCRA Provincial Bioregion. The Timor Sea Drainage Division contains several major river
systems which include (proceeding northward then eastward) the Fitzroy, Isdell, Prince Regent,
Mitchell, Drysdale, King George, Ord, Victoria, Adelaide, Mary, West, South and East Alligator, Mann
and Goyder Rivers. Of these, the Ord, Victoria Daly and Fitzroy Rivers are the largest by area and
flow volumes (CSIRO 2009).
As discussed in Section 2.4, the wetland types occurring within the site are representative of
landscape and wetland types found in the Northern IMCRA Provincial Bioregion and the Timor Sea
Drainage Division. The 1998 RISs note that:
The floodplains are outstanding examples of their types in the monsoon tropics (Stage I/III and II).
The three river systems are outstanding examples of the series of large rivers of region (Stage
I/III and II), and are the only rivers under statutory conservation management within the region.
Of particular noteworthiness, the Kakadu National Park Ramsar site incorporates all major ‘Top End’
habitat types within a single drainage basin – the South Alligator River (Director of National Parks
2007). There are no particularly unique or rare wetland types within the site, and the range of
landscape and wetland habitat types are found in other catchments within the bioregion (for example,
Mary River, Adelaide River).
Unlike more developed areas of Australia, most catchments, rivers and estuaries in the Timor Sea
drainage division, including those within the Kakadu National Park Ramsar site, are considered in a
natural or near-natural condition (National Land and Water Resources Audit 2002; see Figure 2-17).
Unlike other catchments within the bioregion, the Ramsar site and most of the catchment area of
constituent wetlands are situated within a National Park, and are therefore subject to limited direct
development pressure. Floodplain wetlands have also largely recovered from past disturbance by
water buffalo (see Section 5.2), although areas of moderate degradation occur in places as a result of
impacts of weeds and feral animals (Figure 2-17). Mining has also resulted in disturbance to the
landscape although the extent of disturbance is relatively small (see Section 5.5).
The fundamental processes that control wetland functioning, notably fluvial hydrology, tidal hydraulics
and water quality processes remain in natural condition (see Section 3.5). Fire regimes, which are a
key control of flora and fauna communities and populations in non-tidal areas, are actively managed
within the Kakadu National Park (see Section 3.5.2). Furthermore, there is a major management
program for weeds and feral animals within Kakadu National Park, but this is unmatched elsewhere in
the bioregion.
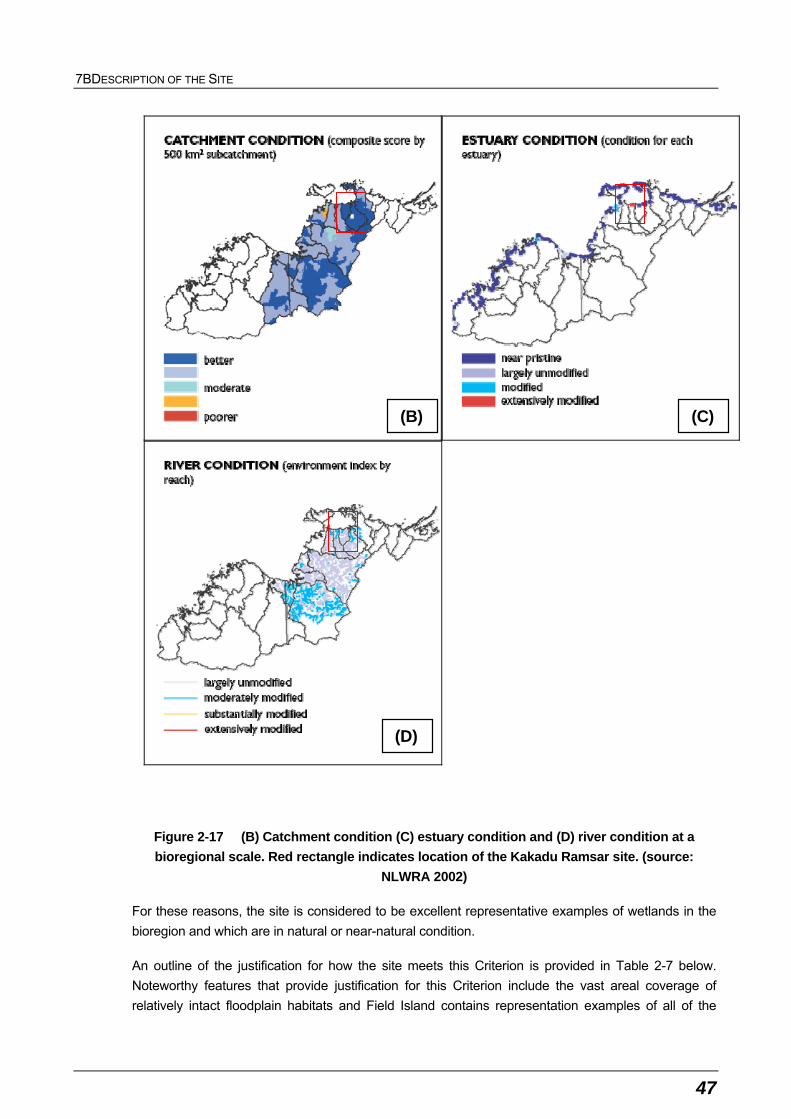
7BDESCRIPTION OF THE SITE
47
(C)
(D)
(B)
Figure 2-17 (B) Catchment condition (C) estuary condition and (D) river condition at a
bioregional scale. Red rectangle indicates location of the Kakadu Ramsar site. (source:
NLWRA 2002)
For these reasons, the site is considered to be excellent representative examples of wetlands in the
bioregion and which are in natural or near-natural condition.
An outline of the justification for how the site meets this Criterion is provided in Table 2-7 below.
Noteworthy features that provide justification for this Criterion include the vast areal coverage of
relatively intact floodplain habitats and Field Island contains representation examples of all of the
7BDESCRIPTION OF THE SITE
48
coastal wetland types known to occur within the Ramsar site, with the exception of coastal freshwater
lagoons. This represents a remarkably high level of habitat diversity within a relatively small area.
Table 2-7 Justification for criterion 1
Ramsar Handbook Element Justification
Representative, rare, unique wetland type in natural/near-natural condition
All wetland types are in natural/near-natural condition and are representative of wetland types found in the Northern IMCRA Provincial Bioregion and within the Timor Sea Drainage Division.
No unique or rare wetland types known to occur within the site.
Substantial role in natural functioning of a major river basin or coastal system
The site contains almost the complete catchment of the South Alligator and Wildman drainage basins, which in the case of South Alligator, represents one of the largest river systems in the drainage division.
Hydrological importance: The vast floodplain systems provide dry season water retention for floodplain wetlands.
The vast floodplain systems represent a major natural floodplain system.
2.5.4 Criterion 2
A wetland should be considered internationally important if it supports vulnerable, endangered, or
critically endangered species or threatened ecological communities.
Criterion 2 (met at time of listing and continues to be met based on current assessment)
The ECD Framework (DEWHA 2008) indicates that ‘wetland’ flora and fauna species should be
considered in the context of this Criterion. This has been interpreted here as ‘wetland-dependent’
species, and therefore does not include terrestrial species that are not reliant on aquatic/wetland
habitats (see Appendix C for complete species lists as well as a list of wetland-dependent vertebrate
fauna). It is also possible that threatened aquatic invertebrate species also occur with the site (for
example, species of dragonfly, see Clausnitzer et al. 2009), however these are either not listed as
nationally or internationally threatened, or there are no published records of these species within the
site.
No internationally or nationally threatened wetland-dependent flora species are known to occur within
the Kakadu National Park Ramsar site. There are nine internationally or nationally threatened
wetland-dependent fauna species known to occur within the site as outlined in Table 2-8. Further
information on these species has been provided in Section 3.7.1 in the context of the threatened
species critical service.
Note that the Australian painted snipe Rostratula australis, listed as vulnerable under the EPBC Act,
is not included above as there are no verified records within the site, though it is acknowledged that
areas of potentially suitable habitat occur within the site and this cryptic species may occur within

7BDESCRIPTION OF THE SITE
49
either site. Franklin (2008) lists 34 records of the Australian painted snipe within the northern tropical
rivers catchments (a study area which includes Kakadu National Park), and found that records were
concentrated in drier parts of the northern catchments.
The water mouse Xeromys myoides is listed as vulnerable under the EPBC Act and by the IUCN.
There is a single record from Kakadu National Park in 1903, though no further evidence of the water
mouse occurrence has been confirmed, despite recent targeted surveys in potentially suitable habitat
(for example, intertidal mangrove wetlands and adjacent salt marsh and sedgeland) (S. Ward pers.
comm. 2009). As a result, this species has not been included in the context of meeting the Criterion.
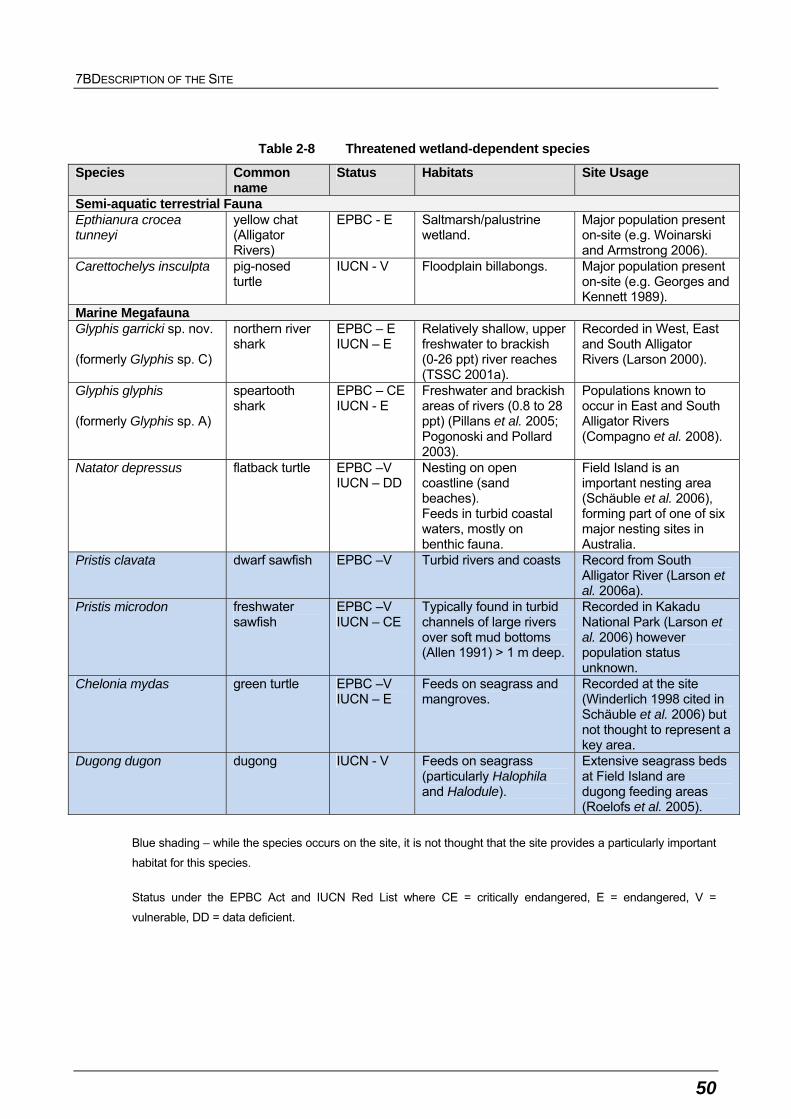
7BDESCRIPTION OF THE SITE
50
Table 2-8 Threatened wetland-dependent species
Species Common name
Status Habitats Site Usage
Semi-aquatic terrestrial Fauna Epthianura crocea tunneyi
yellow chat (Alligator Rivers)
EPBC - E Saltmarsh/palustrine wetland.
Major population present on-site (e.g. Woinarski and Armstrong 2006).
Carettochelys insculpta pig-nosed turtle
IUCN - V Floodplain billabongs. Major population present on-site (e.g. Georges and Kennett 1989).
Marine Megafauna Glyphis garricki sp. nov. (formerly Glyphis sp. C)
northern river shark
EPBC – E IUCN – E
Relatively shallow, upper freshwater to brackish (0-26 ppt) river reaches (TSSC 2001a).
Recorded in West, East and South Alligator Rivers (Larson 2000).
Glyphis glyphis (formerly Glyphis sp. A)
speartooth shark
EPBC – CE IUCN - E
Freshwater and brackish areas of rivers (0.8 to 28 ppt) (Pillans et al. 2005; Pogonoski and Pollard 2003).
Populations known to occur in East and South Alligator Rivers (Compagno et al. 2008).
Natator depressus flatback turtle EPBC –V IUCN – DD
Nesting on open coastline (sand beaches). Feeds in turbid coastal waters, mostly on benthic fauna.
Field Island is an important nesting area (Schäuble et al. 2006), forming part of one of six major nesting sites in Australia.
Pristis clavata dwarf sawfish EPBC –V Turbid rivers and coasts Record from South Alligator River (Larson et al. 2006a).
Pristis microdon freshwater sawfish
EPBC –V IUCN – CE
Typically found in turbid channels of large rivers over soft mud bottoms (Allen 1991) > 1 m deep.
Recorded in Kakadu National Park (Larson et al. 2006) however population status unknown.
Chelonia mydas green turtle EPBC –V IUCN – E
Feeds on seagrass and mangroves.
Recorded at the site (Winderlich 1998 cited in Schäuble et al. 2006) but not thought to represent a key area.
Dugong dugon dugong IUCN - V Feeds on seagrass (particularly Halophila and Halodule).
Extensive seagrass beds at Field Island are dugong feeding areas (Roelofs et al. 2005).
Blue shading – while the species occurs on the site, it is not thought that the site provides a particularly important
habitat for this species.
Status under the EPBC Act and IUCN Red List where CE = critically endangered, E = endangered, V =
vulnerable, DD = data deficient.
7BDESCRIPTION OF THE SITE
51
2.5.5 Criterion 3
A wetland should be considered internationally important if it supports populations of plant and/or
animal species important for maintaining the biological diversity of a particular biogeographic region.
The site meet Criterion 3 for most elements outlined in Section 70 of the Ramsar Handbook for Wise
Use of Wetlands 14 (Ramsar Convention Secretariat 2007), namely:
Section 70 (i) High biodiversity
A range of endemic species occur at the site (see below), automatically qualifying the site as
supporting high biodiversity. In addition, the site also supports a diverse assemblage of flora and
fauna species, including:
Nearly 1600 plant species (Director of National Parks 2007).
Sixty-one mammal species, including four species regarded as wetland-dependent (Appendix C).
One hundred and five reptile species, including 20 species regarded as wetland-dependent
(Appendix C).
Twenty-six frog species (all wetland-dependent species) (Appendix C).
Two hundred and sixty-seven bird species, comprising 91 waterbird species (including 28
migratory and nine resident shorebird species, and 10 gull and tern species) and 11 bird species
(other than waterbirds) which regarded as wetland-dependent (Appendix C).
Fifty-nine fish species (Bishop et al. 2001; see Appendix C), which represents over half of the
total freshwater fish fauna of the Timor Sea bioregion (Allen et al. 2002) (refer Section 2.5.9).
Species lists for terrestrial vertebrate fauna recorded within the site (as well as wetland-dependent
vertebrate fauna) are provided in Appendix C.
Section 70 (ii). Centres of endemism or contains significant numbers of endemic species
Wetland flora within the Ramsar site is largely comprised of wide-ranging, non-endemic species, with
only four species present that are restricted to the drainage division - Bambusa arnhemica,
Hygrochloa aquatica, Nymphoides spongiosa and N. subacuta (Cowie et al. 2000).
The ancient stone country contains significant endemic aquatic invertebrate components, including:
Endemic family of shrimps (Kakaducarididae), containing two mono-specific genera
(Leptopalaemon and Kakaducaris) (Bruce 1993, Page et al. 2008).
Endemic genus of isopod (Eophreatoicus) that has exceptional species diversity (approximately
30 species, Wilson et al. 2009).
A high proportion of mayfly species from the family Leptophlebiidae is endemic to the bioregion.
Specifically, seven of the nine species found in Kakadu National Park are endemic to the Timor
Sea Drainage Division (Finlayson et al. 2006), with one of these species thought to be restricted
to a single stream within the Ramsar site (Dean and Suter 2004).
Kakadu National Park contains a significant portion of the total geographic range of four freshwater
fish species that are restricted to the drainage division (Allen et al. 2002). These species are exquisite
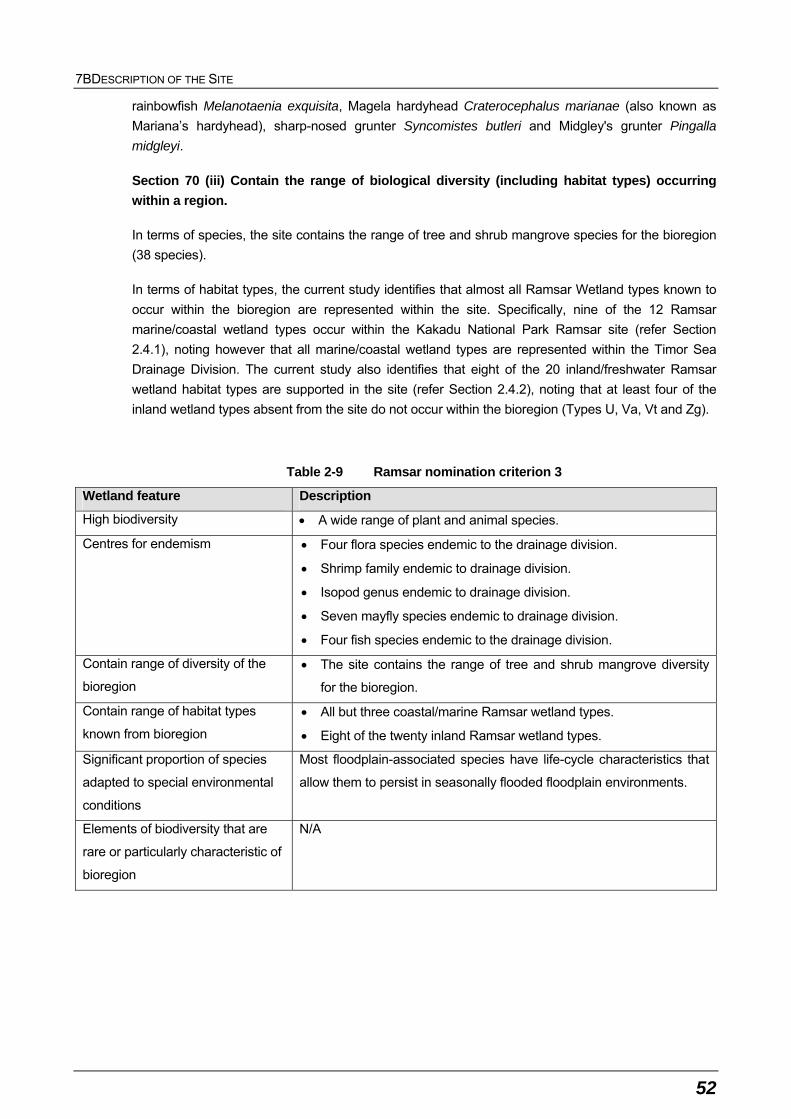
7BDESCRIPTION OF THE SITE
52
rainbowfish Melanotaenia exquisita, Magela hardyhead Craterocephalus marianae (also known as
Mariana’s hardyhead), sharp-nosed grunter Syncomistes butleri and Midgley's grunter Pingalla
midgleyi.
Section 70 (iii) Contain the range of biological diversity (including habitat types) occurring
within a region.
In terms of species, the site contains the range of tree and shrub mangrove species for the bioregion
(38 species).
In terms of habitat types, the current study identifies that almost all Ramsar Wetland types known to
occur within the bioregion are represented within the site. Specifically, nine of the 12 Ramsar
marine/coastal wetland types occur within the Kakadu National Park Ramsar site (refer Section
2.4.1), noting however that all marine/coastal wetland types are represented within the Timor Sea
Drainage Division. The current study also identifies that eight of the 20 inland/freshwater Ramsar
wetland habitat types are supported in the site (refer Section 2.4.2), noting that at least four of the
inland wetland types absent from the site do not occur within the bioregion (Types U, Va, Vt and Zg).
Table 2-9 Ramsar nomination criterion 3
Wetland feature Description
High biodiversity A wide range of plant and animal species.
Centres for endemism Four flora species endemic to the drainage division.
Shrimp family endemic to drainage division.
Isopod genus endemic to drainage division.
Seven mayfly species endemic to drainage division.
Four fish species endemic to the drainage division.
Contain range of diversity of the
bioregion
The site contains the range of tree and shrub mangrove diversity
for the bioregion.
Contain range of habitat types
known from bioregion
All but three coastal/marine Ramsar wetland types.
Eight of the twenty inland Ramsar wetland types.
Significant proportion of species
adapted to special environmental
conditions
Most floodplain-associated species have life-cycle characteristics that
allow them to persist in seasonally flooded floodplain environments.
Elements of biodiversity that are
rare or particularly characteristic of
bioregion
N/A
7BDESCRIPTION OF THE SITE
53
2.5.6 Criterion 4
A wetland should be considered internationally important if it supports plant and/or animal species at
a critical stage in their life cycles, or provides refuge during adverse conditions.
Based on Ramsar Convention Secretariat (2007), there are two elements that need to be considered
for this criterion:
1. Section 74. Whether the site has high proportions of the population of mobile or migratory
species gathered in small areas at particular stages of their life-cycle, and
2. Section 75. For non-migratory species, whether the site supports habitats for species that are
unable to evade unfavourable climatic or other conditions (that is the site contains critical refugia
areas).
In the context of Section 74 of Ramsar Convention Secretariat (2007), the following are relevant in
addressing this Criterion:
Breeding habitat for significant waterbird aggregations. The most significant breeding colonies
are located within mangal communities of the major rivers, and floodplain-associated freshwater
marshes. Examples include:
Colony near mouth of South Alligator River – Multi-species colony with an estimated
colony size of up to 5000 waterbirds (Chatto 2000).
Colony within mangroves adjacent to and east of South Alligator River, approximately 15
kilometres from the South Alligator River mouth. This is a large multi-species colony
(exceeding 13 000 birds per annum in some years) that is dominated by egrets. Eight
waterbird species have been confirmed to breed here (Chatto 2000).
Colony within mangroves along the southern banks of the East Alligator River and
extending up a tributary approximately 15 kilometres in from river mouth. Ten waterbird
species have been confirmed to breed here, with the highest estimated annual usage
exceeding 11 500 birds (Chatto 2000).
Significant breeding aggregations of magpie geese Anseranas semipalmata throughout
the floodplains of the site (up to 27 percent of the Northern Territory breeding population),
with the South Alligator floodplains regarded as the third most important area of nesting
habitat after the Mary-Adelaide and Daly River floodplains (Bayliss and Yeomans 1990).
Feeding and roosting habitat for:
Thirty-nine shorebird species (including 29 non-breeding migratory species), which
collectively occur in significant numbers. The site is identified as being internationally
important for migratory shorebirds in the East Asian-Australasian Flyway (Bamford et al.
2008).
Fifty-three waterbird species (other than shorebirds), which collectively occur in significant
numbers (see data for Criterion 5).
In the context of Section 75 in Ramsar Convention Secretariat (2007), the following are relevant
in addressing this Criterion:
7BDESCRIPTION OF THE SITE
54
Dry season refuge for large concentrations of waterbirds as a result of the persistence of
freshwaters on the Magela and Nourlangie floodplains and several back swamps of the South
Alligator River (for example, Boggy Plain) (Morton et al. 1990b). During the late dry season,
waterbird abundance is likely to exceed a million birds (Morton et. al. 1991). Notable records
include a maximum monthly dry season mean abundance (1981 to 1984) of 545 000 birds from
nine waterbird species (Morton et al. 1993b) and approximately 600 000 birds from five duck
species (Morton et al. 1990b). Such large aggregations appear to be unique in Australia (Morton
et al. 1990b).
Feeding, refuge and breeding habitats for terrestrial vertebrate fauna species (other than
waterbirds) regarded as wetland-dependent. These include:
Three mammal species: northern myotis Myotis moluccarum, mangrove pipistrelle
Pipistrellus westralis, and water-rat Hydromys chrysogaster.
A wide variety of reptiles are known to depend on aquatic or semi-aquatic habitats of the
site during the dry season (Shine 1986a,b, Sadlier 1990, Friend and Cellier 1990,
Braithwaite et al. 1991, Woinarski and Gambold 1992, Finlayson et al. 2006). This
includes freshwater crocodile Crocodylus johnstoni, saltwater crocodile Crocodylus
porosus, pig-nosed turtle Carrettochelys insculpta, Chelodina burrungandjii, northern long-
necked turtle Chelodina rugosa, northern snapping turtle Elseya dentata, Elseya jukesi,
saw-shelled turtle Elseya latisternum, northern red-faced turtle Emydura victoriae,
mangrove monitor Varanus indicus, Merten’s water monitor Varanus mertensi, Mitchell’s
water monitor Varanus mitchellii, water python Liasis fuscus, Arafura file snake
Acrochordus arafurae, little file snake Acrochordus granulatus, bockadam Ceberus
rynchops, Macleay’s water snake Enhydris polyepis, white-bellied mangrove snake
Fordonia leucobalia, Richardson's mangrove snake Myron richardsonii and keelback
Tropidonophis mairii.
Twenty-six frog species have been recorded on the site (for example, Tyler et al. 1983,
Tyler and Cappo 1983, Tyler and Crook 1987, Woinarski and Gambold 1992, Finlayson et
al. 2006, see Appendix C).
Twelve bird species (other than waterbirds): osprey Pandion haliaetus, white-bellied sea-
eagle Haliaeetus leucogaster, brahminy kite Haliastur indus, azure kingfisher Alcedo
azurea, little kingfisher Alcedo pusilla, collared kingfisher Todiramphus chloris, yellow chat
Epthianura crocea tunneyi, mangrove robin Eopsaltria pulverulenta, white-breasted
whistler Pachycephala lanioides, mangrove golden whistler Pachycephala melanura,
shining flycatcher Myiagra alecto, and mangrove grey fantail Rhipidura phasiana (see
Appendix C).
The permanent billabongs and river channel environments provide dry season refugia for these semi-
aquatic wetland-dependent species, as well as purely aquatic species such as fish, and many aquatic
invertebrates and macrophyte species. It should be noted however that these same refugia functions
would also take place in other permanent waterbodies in wetlands throughout the bioregion. It is
uncertain how critical the Ramsar site is in terms of maintaining viable populations of most of the non-
migratory/non-mobile species. The possible exceptions to this are threatened and/or endemic
species, such as:
7BDESCRIPTION OF THE SITE
55
Endemic invertebrate species found in the stone country (see section 2.5.3). Note however that
the specific watering requirements of these species are unknown.
The regionally endemic exquisite rainbowfish Melanotaenia exquisita, which is restricted to
perennial pools at Jim Jim Creek within the Park (see section 2.6.2).
The perennial river systems of the site which support two threatened shark species, two
threatened sawfish species and pig-nosed turtle (see Section 2.5.2).
2.5.7 Criterion 5
A wetland should be considered internationally important if it regularly supports 20 000 or more
waterbirds.
The findings of various studies indicate that the site regularly supports in excess of 20 000 or more
waterbirds on an annual basis (Bayliss and Yeomans 1990, Bamford 1990, Morton et al. 1991,
Chatto 2000, Chatto 2003a, Chatto 2006, see Appendix C). Peaks in abundance occur immediately
prior to and after the wettest months of the year (January–March). During these peak periods, the
waterbird population within floodplain areas of the site has been estimated to contain almost one
million birds, with densities of up to 100 birds per hectare recorded during the late dry season (Morton
et al. 1991). The total waterbird population for the Alligator Rivers Region during the late dry season
is likely to be in excess of 2.5 million birds (Morton et al. 1993b). Notable records of waterbird
abundance are outlined below:
The highest estimated annual usage of the five largest breeding colonies collectively amount to
greater than 40 500 birds (Chatto 2000).
In excess of 172 000 waterbirds were counted within the upstream South Alligator River
floodplains during October 2001 (Chatto 2006). Approximately 23 000 birds were recorded within
the downstream floodplains and approximately 49 000 birds were recorded within the upstream
floodplains of the East Alligator River in October 2001 (Chatto 2006).
The highest monthly mean for the dry season is 545 000 birds from nine waterbird species and
approximately 600 000 birds from five duck species across five floodplains in the Alligator Rivers
Region: Magela, Nourlangie, East Alligator River floodplains (upstream and downstream), and
Boggy Plain (Morton et al. 1990a and 1993b).
Bamford (1990) recorded nearly 69 000 waterbirds during ground counts on a limited number of
floodplain billabongs in October to November 1987.
Chatto (2003a) recorded large aggregations of shorebirds from Finke Bay (9000 birds in 1993)
and in coastal areas between the South Alligator River and Minimini Creek (12 500 birds in
1992).
For a single species alone, namely magpie goose Anseranas semipalmata, population estimates
exceeded 300 000 birds in each of the five years surveyed (1983-1986) with the highest estimate
during the 1984 dry season (2 539 802 ± 1 372 568) and lowest estimate during the 1986 wet
season (517 998 ± 210 353) (Bayliss and Yeomans 1990). Morton et al. (1990a) estimated that
the Alligator Rivers Region (that is, Magela, Nourlangie, East Alligator, Cooper and South
7BDESCRIPTION OF THE SITE
56
Alligator (Boggy Plain) floodplains) supports an average of about 1.6 million geese in the dry
season, though considerably less during the wet season (November to March).
2.5.8 Criterion 6
A wetland should be considered internationally important if it regularly supports one percent of the
individuals in a population of one species or subspecies of waterbird.
The following waterbird species have been recorded within Kakadu National Park in numbers which
exceed one percent of the estimated population size (Wetlands International 2006):
Magpie goose Anseranas semipalmata - The one percent population threshold for this species is
20 000 birds (Wetlands International 2006). Significant counts include:
Annual population counts in excess of 300 000 birds and estimates of greater than 1.6
million geese in the dry season (see Section 2.5.5).
Highest estimated number of nests in the years 1984 to 1986 was 45 200 ± 9403 (1985),
with the lowest being 24 446 + 5373 (1986) (Bayliss and Yeomans 1990).
Bamford (1990) recorded 32 154 magpie geese during surveys in October to November
1987.
Wandering whistling-duck Dendrocygna arcuata - The one percent population threshold for this
species is 10 000 birds (Wetlands International 2006). Peak abundance (highest monthly mean
for period 1981-1984) for the flood plains of the Alligator Rivers Region was estimated to be
400 000 birds (Morton et al.1990b).
Plumed whistling-duck Dendrocygna eytoni - The one percent population threshold for this
species is 10 000 birds (Wetlands International 2006). Peak abundance (highest monthly mean
for period 1981-1984) for the flood plains of the Alligator Rivers Region was estimated to be
70 000 birds (Morton et al.1990b).
Radjah shelduck Tadorna radjah – A one percent population threshold has not been calculated
for this species (Wetlands International 2006), though the following comments provide a guide –
Garnett and Crowley (2000) estimate an Australian population of 100 000 breeding adults
(150 000 individuals), though population may be smaller (Wetlands International 2006). In
assuming the upper estimate, counts recorded for the site would exceed any conservative
estimate of a one percent population threshold. Morton et al. (1990b) estimated peak abundance
(highest monthly mean for period 1981-1984) for the flood plains of the Alligator Rivers Region to
be 30 000 birds.
Pacific black duck Anas superciliosa - The one percent population threshold for this species is 10
000 birds (Wetlands International 2006). Peak abundance (highest monthly mean for period
1981-1984) for the flood plains of the Alligator Rivers Region was estimated to be 50 000 birds
(Morton et al.1990b).
Grey teal Anas gracilis - The one percent population threshold for this species is 20 000 birds
(Wetlands International 2006). Peak abundance (highest monthly mean for period 1981-1984) for
7BDESCRIPTION OF THE SITE
57
the flood plains of the Alligator Rivers Region was estimated to be 50 000 birds (Morton et
al.1990b).
Brolga Grus rubicunda - The one percent population threshold for this species is 1000 birds
(Wetlands International 2006). Peak abundance (highest monthly mean for period 1981-1984) for
the flood plains of the Alligator Rivers Region was estimated to be 24 000 birds (Morton et
al.1993a).
Black-necked stork Ephippiorhynchus asiaticus - The one percent population threshold for this
species is 300 birds (Wetlands International 2006). Aerial counts (which in comparison to ground
surveys are known to under-estimate numbers) undertaken monthly between 1981 and 1984
demonstrated that estimated average numbers on the floodplains of Alligator Rivers exceeded
the one percent threshold for five of the 12 counts (Morton et al.1993a). From both ground and
aerial counts, a measure of the maximum regional population was estimated to be about 1800
birds (Morton et al.1993a).
The following migratory shorebird species have been recorded within Kakadu National Park in
numbers which exceed one percent of the estimated population size in the East Asian – Australasian
Flyway (Bamford et al. 2008):
Marsh sandpiper Tringa stagnatilis – Bamford et al. (2008) estimates that the one percent
population threshold for the flyway is 1000 birds. Site records include 1600 birds (Chatto 2003a).
Little curlew Numenius minutus - The current flyway one percent threshold is 1800 (Bamford et
al. 2008). Site records include 180 000 birds (Morton et al. 1990). Morton et al. (1991) reported
approximately 300 000 little curlew passing through the wetlands in Kakadu National Park during
October in the early 1980’s, and Bamford (1990) reported 50 000 little curlew in Kakadu National
Park in the late dry seasons of 1987, 1988 and 1989 (with a single day count from six day roosts
of 17 380 birds (11 November 1987) and 10 000 birds from a single roost on Boggy Plains (19
October 1987).
Common sandpiper Actitis hypoleucos - The current flyway one percent threshold is 250
(Bamford et al. 2008). Site records include 300 birds (Bamford 1988).
Australian pratincole Stiltia isabella - The current flyway one percent threshold is 600 (Bamford et
al. 2008). Site records include 30 000 birds (Morton et al. 1991) and 1391 birds (Bamford 1990).
Sharp-tailed sandpiper Calidris acuminata - The current flyway one percent threshold is 1600
(Bamford et al. 2008). Site records include 4900 birds (Chatto 2003a) and 3000 birds (Chatto
2003a).
Chatto (2003a) indicates that other species may occur in numbers which exceed the threshold (terek
sandpiper Xenus cinereus, broad-billed sandpiper Limicola falcinellus, grey plover Pluvialis
squatarola, and lesser sand plover Charadrius mongolus) though suitable data to confirm this view
are not currently available.
2.5.9 Criterion 7
A wetland should be considered internationally important if it supports a significant proportion of
indigenous fish subspecies, species or families, life-history stages, species interactions and/or
7BDESCRIPTION OF THE SITE
58
populations that are representative of wetland benefits and/or values and thereby contributes to
global biological diversity.
From a species richness perspective, the freshwater fish fauna of the site is reportedly high on a
national scale. To date, 59 freshwater fish species (that is, species that have an obligatory freshwater
stage) have been recorded in the site (Bishop et al. 2001; see Appendix C). This represents
approximately 20 percent of the total number of fish species found in Australian freshwaters (302
species) and 60 percent of the freshwater fish recorded from the Timor Sea Drainage Division
(approximately 100 species) (Allen et al. 2002, CSIRO 2009), and is the highest species richness of
any catchment in the bioregion (Burrows 2008). However, Burrows (2008) also notes that this is also
by far the most intensively sampled region of northern Australia, both spatially and temporally.
Additionally, Burrows (2008) derived species richness values for sampling locations throughout the
bioregion based on past surveys, but noted that differences in sampling methods and effort preclude
direct comparisons of these data (refer Section 3.3.6).
Allen et al. (2002) notes that the Magela Creek catchment alone is species-rich compared to
catchments on other continents, and despite its small size, has as many or more species than the
extensive Murray-Darling system in south east Australia.
Five species have been recorded only from the northern part of the Northern Territory (exquisite
rainbowfish Melanotaenia exquisita, Magela hardyhead Craterocephalus marianae, sharp-nosed
grunter Syncomistes butleri, Midgley's grunter Pingalla midgleyi and a potential new species of
Hypseleotris gudgeon), and Kakadu National Park contains a significant portion of the total range of
the first four of these species. Ramsar Convention Secretariat (2007) also considers endemism as an
important element of biodiversity, and the four fish species listed above are endemic to the drainage
division (refer Section 2.5.5).
There are insufficient data to determine the proportion of marine/estuarine fish (or shellfish) species
that the Ramsar site support relative to the total fish diversity in the bioregion.
Ramsar Convention Secretariat (2007) also emphasises that the term diversity can encompass a
number of life-history stages, species interactions and complexity of fish-environmental interactions.
The fish assemblages of the site is comprised of species with different life-history characteristics,
including potadromous (entirely freshwater) species, to diadromous (requiring marine and
freshwaters to complete life-cycle) and fully marine species. The site also supports a wide variety of
life history stages for many species (i.e. eggs, larvae, recruitment sites, spawning sites).
2.5.10 Criterion 8
A wetland should be considered internationally important if it is an important source of food for fishes,
spawning ground, nursery and/or migration path on which fish stocks, either within the wetland or
elsewhere, depend.
Kakadu National Park provides important habitats, feeding areas, dispersal and migratory pathways,
and spawning sites for numerous fish species of direct and indirect fisheries significance. These fish
have important fisheries resource values both within and external to the Ramsar site.
No commercial fishing is allowed within the site. However, recreational angling is a key use of the
site. The recreational fishery is based almost entirely on one species: barramundi Lates calcarifer,
7BDESCRIPTION OF THE SITE
59
although other non-target species are also captured. From a cultural perspective, barramundi
represents a key traditional food species and has other cultural values (for example, totem – see
Section 3.7.3; 3.8.4).
While commercial fishing does not occur within the site, many commercially significant species occur
within Kakadu National Park that may be harvested elsewhere. Many fish (for example, barramundi,
threadfin salmon, mullet species) and crustacean (mud crabs, prawns) species spend their juvenile
stages in shallow nearshore waters of the site, particularly around mangroves, saltmarsh and
seagrass habitats. Species such as barramundi also inhabit freshwater floodplain and billabongs.
These species also spawn in inshore waters, although there is no information on specific spawning
habitats within the site (See Section 3.3.6).
Note that Section 3.7.2 (Service 3) provides a more detailed account of fish habitat values of the site.
2.5.11 Criterion 9
A wetland should be considered internationally important if it regularly supports one percent of the
individuals in a population of one species or subspecies of wetland-dependent non-avian animal
species.
Criterion 9 relates to non-avian wetland taxa including, inter alia, mammals, reptiles, amphibians, fish
and aquatic macroinvertebrates. In interpreting the application of Criterion 9 to these species, Ramsar
Convention Secretariat (2007) indicates that reliable population size limits from published sources
must be included in the justification for the application of this Criterion.
The following species meet this Criterion:
Northern river shark Glyphis garricki sp. nov – This species occurs in scattered localities in
coastal New Guinea and Australia, with specific Australian locations known to be King Sound and
Doctors Creek in Western Australia, and the Adelaide, West, East and South Alligator Rivers in
the Northern Territory (Compagno et al. 2008). It is inferred that the total population size of this
species is estimated to be 250 mature individuals (see Ward and Larson 2006a). Based on this,
the one percent population threshold is three individuals, and therefore this species is considered
to exceed the one percent population threshold as it is known from three localities within the
Ramsar site.
Speartooth shark Glyphis glyphis – This species occurs in scattered localities in northern
Australia, with specific locations known to be the Bizant and Wenlock Rivers in Queensland and
the Adelaide, East Alligator and South Alligator Rivers in the Northern Territory, as well as near
Port Romilly in New Guinea (Compagno et al. 2008). It is inferred that the total population size of
this species is estimated to be 250 mature individuals (see Ward and Larson 2006b). Therefore,
the one percent population threshold is exceeded within the Ramsar site.
Pig-nosed turtle Carettochelys insculpta – This species occurs in New Guinea and northern
Australia. Within Australia, substantial breeding populations of pig-nosed turtles are known to
occur in four major river drainages in the Northern Territory, namely, the East Alligator, South
Alligator, Daly and Victoria Rivers (TSSC 2005), with reliable anecdotal reports also including the
Victoria, Fitsmaurice and Goomadeer systems (Doody et al. 2000). As the Australian pig-nosed
turtle population is completely isolated from the New Guinean populations (Cogger and
Heathcote 1981), the one percent population threshold is calculated based on only the Australian
7BDESCRIPTION OF THE SITE
60
numbers of individuals. Population surveys estimate that the Australian population is
approximately 3000 individuals (R. Sims pers. comm. to TSSC 2005), and the one percent
threshold is therefore 30 individuals. Georges and Kennett (1989) found pig-nosed turtles to be
widespread between the tidal reaches and the head-waters of the South Alligator River, and that
high densities may be present in the upper reaches during the dry season (33.8 ± 11.3 turtles per
hectare in small discrete ponds on the main channel). Based on this information, the one percent
population threshold is exceeded within the Ramsar site.
Saltwater crocodile Crocodylus porosus – Although saltwater crocodiles have historically had a
wide distribution throughout southeast Asia and Australasia, the species is currently thought to be
extinct throughout most of Asia. Isolated, relatively small populations are known to remain in
Myanmar (Burma), eastern India, Indonesia, Malaysia, Philippines and the Solomon Islands. The
vast majority of the global population of saltwater crocodiles occurs in northern Australia, and
they are also common in New Guinea. In Australia, the saltwater crocodile population has been
thriving since the species was protected from hunting, particularly in the Northern Territory, which
has the largest population and densities in Australia (Fukuda et al. 2007), and population size is
estimated as 60 000 individuals (NTG not dated), but may actually be far greater than this
number (Simon Ward pers. commo. 2010). Within the Northern Territory, Kakadu National Park
(Alligators Rivers Region) contains the largest protected area of suitable habitat (approximately
19 120 km2) (Leach et al. 2009) and it is estimated that the site contains approximately 15 000
saltwater crocodiles (S. Ward pers. comm. 2009), therefore exceeding the one percent
population threshold.
It is likely that the freshwater crocodile Crocodylus johnstoni also meets this Criterion; however,
sufficient data are not available at the site scale to determine whether the Criterion is met for this
species. Freshwater crocodiles are endemic to northern Australia, occurring in Western Australia,
Northern Territory and Queensland. Considering their distribution and that the site contains a
significant proportion of the suitable habitat within this distribution, it is likely that the site support at
least one percent of the population. Should adequate data become available, then this species will be
included in this Criterion.
The endemic invertebrate species that appear to be restricted to seeps in the escarpment country are
also likely to exceed this threshold. However, as there are no published accurate estimates of
population numbers of these species, under Ramsar Handbook 14 guidelines (Ramsar Convention
Secretariat 2007) these species cannot contribute to this criterion. It is noted that there has been
comparatively less collection effort in other areas outside the site than has occurred in Kakadu
National Park. Investigation of survey data for other regionally endemic species as part of the current
study has shown such data are largely incomplete and forms an information gap.
8BCRITICAL COMPONENTS, PROCESSES AND SERVICES/BENEFITS
61
3 CRITICAL COMPONENTS, PROCESSES AND SERVICES/BENEFITS
3.1 Study Approach
3.1.1 Background
This Section outlines the critical components, processes and services/benefits that make up the
ecological character of the Kakadu National Park Ramsar site.
The method employed to identify critical components, processes and services/benefits is presented in
Appendix B. Following the method within the National Framework (2008), the assignment of a given
wetland component, process or service/benefit as critical was guided by the following considerations:
the component, process or service/benefit is an important determinant of the uniqueness of the
site, or is widely accepted as representing a particularly outstanding example of an
environmental value supported by the site,
the component, process or service/benefit is important for supporting one or more of the Ramsar
Nomination Criteria under which the site was listed, and
a change to the component, process or service/benefit would result in a fundamental change in
ecological character of the site.
Additionally, a second tier of ‘supporting’ components, processes and services/benefits have been
identified. These ‘supporting’ components, processes and services/benefits, while important to
wetland functioning, were in isolation were not considered to directly address the criteria listed above
(see Appendix B).
For each of the critical components, processes and services/benefits (C, P, S/B), a brief description is
provided for (i) the rationale for inclusion as a critical; (ii) a description of the element and (iii) a
description of patterns in variability over time. It should be noted that in nearly all cases, there was no
actual baseline data-set describing the wetland indicator before or at the time of declaration of the
sites (Stage I = 1980; Stage II = 1989; Stage III = 1995). Therefore, in the following sections, both
pre-listing and post-listing data have been used to describe patterns in variability in space or over
time. The specific years in which the data was collected is noted in the following sections, together
with a description of whether the numerical values are likely to representative of conditions at the time
of listing.
3.1.2 Environmental Values Identified by the Fox Review
As discussed above, in assessing whether a particular component, process or service/benefit (C, P,
S/B) is critical, there is a need to consider (among other factors) any elements that have been
identified as having particularly outstanding environmental values. Environmental values may be
documented in nomination criteria for the declaration of Ramsar or national park sites. The
‘Commission of Inquiry in respect of all environmental aspects for and in relation to the development
by the Australian Atomic Energy Commission in association with Ranger Uranium Mines Pty Ltd or
8BCRITICAL COMPONENTS, PROCESSES AND SERVICES/BENEFITS
62
uranium deposits in the Northern Territory’ prepared by Fox et al. (1977) included an extensive
review of Kakadu National Park’s natural and cultural values. The Fox report was crucial to
supporting the gazettal of Kakadu as a National Park and listing under the World Heritage Convention
and Ramsar Convention shortly thereafter. Therefore, the Fox et al. (1977) report was used as a
basis for identifying critical components, process and services/benefits that are important with respect
to determining the site’s unique character with respect to the Framework (as per second bullet point
above).
In particular, the critical components and services/benefits nominated by this ECD were selected so
as to strongly correlate with the ‘qualities of the area favouring establishment of a national park’ as
listed in Fox et al. (1977) as follows:
1. The region has a wide variety of landscape, vegetation and wildlife types which are not to be
found elsewhere on the continent.
2. The important land type features which are well represented in the Alligator Rivers Region are
the Arnhem Land plateau, the escarpment and outliers, the floodplains, the permanent lagoons
and swamps and the major tidal river systems.
3. Biological features that are of importance are:
a. A wide range of aquatic and terrestrial vegetation types.
b. An abundance and considerable diversity of plant and animals species including birds and
fishes.
c. The occurrence of relic communities and species such as rainforests and semi-deciduous
forests, some birds, insects, fishes and one species of turtle.
d. The occurrence of rare species well represented in the region and some endemic races and
perhaps species and certainly many new records of species.
4. Attractive scenic features including notably, vegetation communities associated with various
landscape features and the concentration of aquatic birds that occur in the swamp lands during
the dry season.
5. The region has an abundance of Aboriginal relics and features especially Aboriginal art of which
there is no equivalent elsewhere in Australia.
6. It provides scope for scientific study in many disciplines including geology, geomorphology,
botany, zoology, ecology, limnology, archaeology and Aboriginal culture.
7. It presents a variety of opportunities for organised and unorganised recreational and educational
activities such as sightseeing and lecture tours, bird and animal watching, natural history study,
swimming, bush walking, photography, and wilderness exploration for those experienced and
qualified in this kind of activity in such a region and climate.
8. The foregoing features exist in a close to natural state, in a very diversified but relatively compact
region.
8BCRITICAL COMPONENTS, PROCESSES AND SERVICES/BENEFITS
63
9. Although individual sites may have limited capacity at any one time, a representative national
park in the regional could collectively serve a large number of visitors with varying interests
providing it was comprehensively organised and specifically managed for the purpose.
3.2 Overview of Critical Services, Components and Processes
A summary of the critical and supporting wetland components, processes and services/benefits for
the Kakadu National Park Ramsar site as determined in the present study is shown in Table 3-1. In
summary, the following have been identified:
eleven critical components and six supporting components
four critical processes and five supporting processes, and
three critical services/benefits and five supporting services/benefits.
The broad interaction of wetland components, processes and services/benefits (both critical and
supporting) at a whole-of-site level is shown in Figure 3-1. The figure shows three broad processes
(climate, geomorphology and regional-scale hydrodynamic and hydrological processes) that together
have shaped the topography, marine and freshwater flow regime and other important aspects of the
site. At the local habitat scale, there is a mix of physical and chemical processes as well as biological
processes that control the wetland habitats and associated biota. The interaction of the wetland
components with the wetland processes yields a range of wetland services/benefits that are
characterised as biodiversity (ecosystem services) and cultural services (relevant to providing a social
or economic benefit to humans) using the terminology in the National Framework and Millennium
Ecosystem Assessment.
The following sections provide a more detailed description of critical components, processes and
services for Kakadu National Park that form the basis of this ECD. Where possible, information on the
different original listing and extension dates (1980,1989,1995 and 2010) has been identified to aid in
the description of natural variability for the components, processes and services at the time of listing.

8BCRITICAL COMPONENTS, PROCESSES AND SERVICES/BENEFITS
64
Table 3-1 Summary of critical and supporting components, processes and
services/benefits
Components Processes Services/Benefits
Cri
tica
l
C1 – Mangroves
C2 – Melaleuca Forests
C3 – Palustrine Wetlands and
Billabongs
C4 – Waterfalls, Seeps and
Waterholes
C5 – Populations of Migratory
and Resident Waterbirds
C6 – Populations of Freshwater
Fish
C7 – Populations of Freshwater
and Saltwater Crocodiles
C8 – Populations of Threatened
Sharks
C9 – Yellow Chat Populations
C10 – Pig-nosed Turtle
Populations
C11 – Locally Endemic Invertebrate Species
P1 – Fluvial Hydrology
P2 - Fire Regimes
P3 – Breeding of Waterbirds
P4 – Flatback Turtle Nesting
S1 – Maintenance of Global Biodiversity
S2 – Fisheries Resource Values
S3 – Contemporary Living Culture
Su
pp
ort
ing
Seagrass
Monsoon Rainforests and
Riparian Vegetation
Other Wetland Habitats
Terrestrial Habitats
Aquatic Invertebrates
Regionally Endemic Species
Climate
Geology/Geomorphology
Tidal Hydraulics
Groundwater
Water Quality
Ecosystem Processes
Recreation and Tourism
Scientific Research and Education
Historical Cultural Heritage
Biological Products
Sites/Items of Cultural Significance
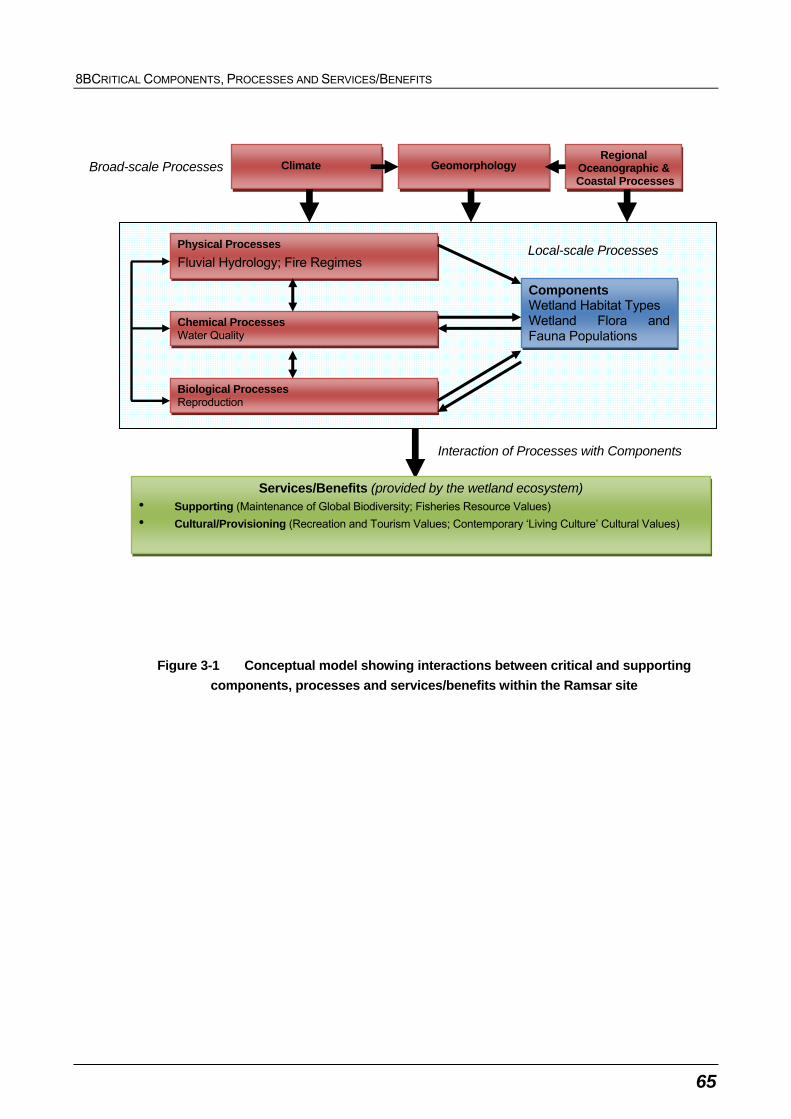
8BCRITICAL COMPONENTS, PROCESSES AND SERVICES/BENEFITS
65
Figure 3-1 Conceptual model showing interactions between critical and supporting
components, processes and services/benefits within the Ramsar site
Climate Geomorphology
Services/Benefits (provided by the wetland ecosystem) • Supporting (Maintenance of Global Biodiversity; Fisheries Resource Values)
• Cultural/Provisioning (Recreation and Tourism Values; Contemporary ‘Living Culture’ Cultural Values)
Physical Processes
Fluvial Hydrology; Fire Regimes
Chemical Processes Water Quality
Components Wetland Habitat Types Wetland Flora and Fauna Populations
Biological Processes Reproduction
Local-scale Processes
Broad-scale Processes
Interaction of Processes with Components
Regional Oceanographic &
Coastal Processes
8BCRITICAL COMPONENTS, PROCESSES AND SERVICES/BENEFITS
66
3.3 Critical Components
As outlined in Section 2.4, a range of wetland habitat types are known to be present within the
Ramsar site boundary, including a diversity of those designated within the coastal/marine and inland
wetland categories under the Ramsar classification scheme. Within these habitat types, a rich
diversity of wildlife exists from all the major groups of organisms (from planktonic organisms to
vertebrates) which make up the ecosystem components of the wetland. Critical components of the
site have been selected on the basis of those habitats, key species and wildlife populations that are
fundamental in determining the site’s ecological character and underpin the critical services/benefits,
and are described below.
3.3.1 C1 – Mangroves
Reasons for Selection as ‘Critical’
Mangroves were selected as a critical component due to the essential role that these communities
have in terms of provisioning for species of fisheries value (Service 2). Furthermore, mangrove
communities are important with respect to habitat provisioning for waterbird breeding colonies, and
therefore, in turn, mangrove communities are fundamental to determining the site’s ecological
character, contribute to support of Ramsar Nomination Criteria 4, 5 and 6, and provide opportunities
for recreation and tourism.
Description
Refer to Wetland Type I in Section 2.4.1.
Patterns in Variability
There are two data sources describing patterns in mangrove extent: Mitchell et al. (2007) and Cobb
et al. (2007).
Mitchell et al. (2007) provides the most detailed mangrove mapping within Kakadu National Park
(refer Table 3-2). The assessment was undertaken based on 1990 aerial photography, which is close
to baseline pre-listing conditions in Stage II (1989), and includes the estuarine portions of Wildman,
West and most of South Alligator Rivers, as well as Field and Barron Islands. The estuarine portions
of East Alligator River are almost entirely within Stage I, which was declared in 1980, and therefore
these data describe mangrove extent post-Ramsar site listing.
Table 3-2 shows that West and South Alligator Rivers had the largest mangrove areas. Tree height,
as a relative measure of tree age, varied inconsistently between locations and broad
geomorphological zones within locations (inland, coast and creek). Mitchell et al. (2007) concluded
that the patterns in tree height are related to contemporary changes in erosion and sedimentation
patterns.
Cobb et al. (2007) examined changes in mangrove area over time within Kakadu National Park. Note
that this assessment was based on a review of remote imagery that did not involve ground-truthing,
and was based on different mapping methods to those used by Mitchell et al. (2007). Mangroves
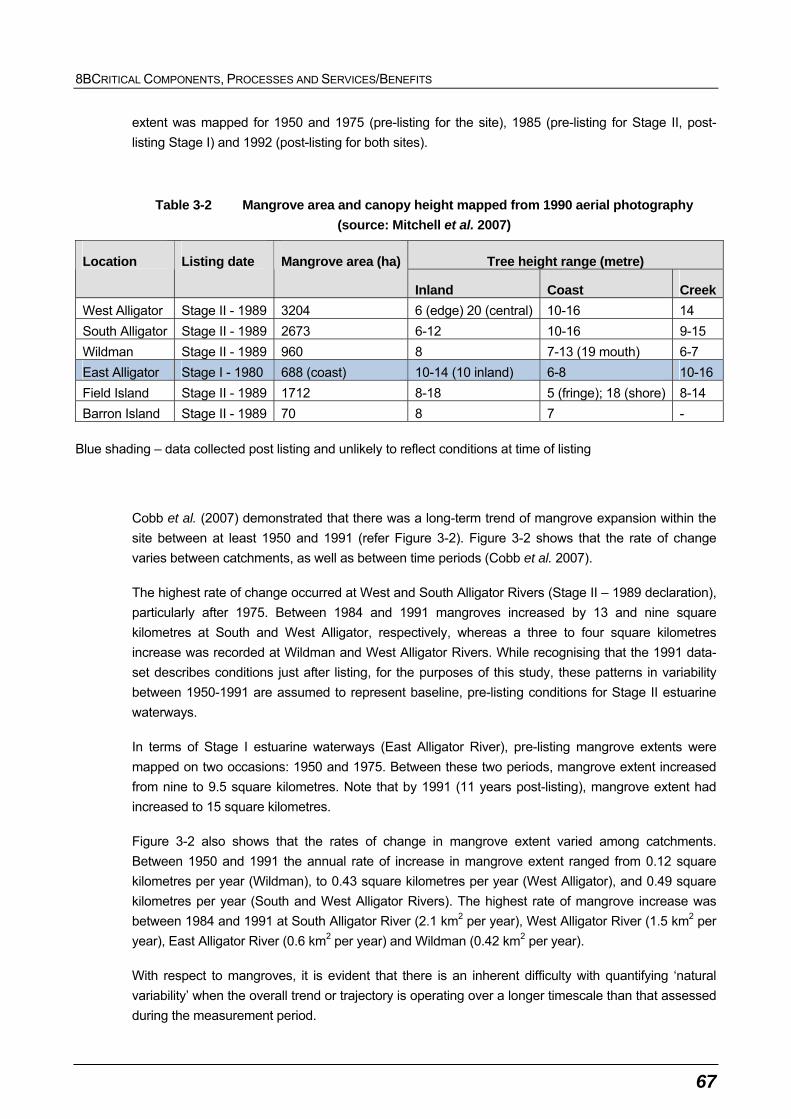
8BCRITICAL COMPONENTS, PROCESSES AND SERVICES/BENEFITS
67
extent was mapped for 1950 and 1975 (pre-listing for the site), 1985 (pre-listing for Stage II, post-
listing Stage I) and 1992 (post-listing for both sites).
Table 3-2 Mangrove area and canopy height mapped from 1990 aerial photography
(source: Mitchell et al. 2007)
Tree height range (metre) Location Listing date Mangrove area (ha)
Inland Coast Creek
West Alligator Stage II - 1989 3204 6 (edge) 20 (central) 10-16 14
South Alligator Stage II - 1989 2673 6-12 10-16 9-15
Wildman Stage II - 1989 960 8 7-13 (19 mouth) 6-7
East Alligator Stage I - 1980 688 (coast) 10-14 (10 inland) 6-8 10-16
Field Island Stage II - 1989 1712 8-18 5 (fringe); 18 (shore) 8-14
Barron Island Stage II - 1989 70 8 7 -
Blue shading – data collected post listing and unlikely to reflect conditions at time of listing
Cobb et al. (2007) demonstrated that there was a long-term trend of mangrove expansion within the
site between at least 1950 and 1991 (refer Figure 3-2). Figure 3-2 shows that the rate of change
varies between catchments, as well as between time periods (Cobb et al. 2007).
The highest rate of change occurred at West and South Alligator Rivers (Stage II – 1989 declaration),
particularly after 1975. Between 1984 and 1991 mangroves increased by 13 and nine square
kilometres at South and West Alligator, respectively, whereas a three to four square kilometres
increase was recorded at Wildman and West Alligator Rivers. While recognising that the 1991 data-
set describes conditions just after listing, for the purposes of this study, these patterns in variability
between 1950-1991 are assumed to represent baseline, pre-listing conditions for Stage II estuarine
waterways.
In terms of Stage I estuarine waterways (East Alligator River), pre-listing mangrove extents were
mapped on two occasions: 1950 and 1975. Between these two periods, mangrove extent increased
from nine to 9.5 square kilometres. Note that by 1991 (11 years post-listing), mangrove extent had
increased to 15 square kilometres.
Figure 3-2 also shows that the rates of change in mangrove extent varied among catchments.
Between 1950 and 1991 the annual rate of increase in mangrove extent ranged from 0.12 square
kilometres per year (Wildman), to 0.43 square kilometres per year (West Alligator), and 0.49 square
kilometres per year (South and West Alligator Rivers). The highest rate of mangrove increase was
between 1984 and 1991 at South Alligator River (2.1 km2 per year), West Alligator River (1.5 km2 per
year), East Alligator River (0.6 km2 per year) and Wildman (0.42 km2 per year).
With respect to mangroves, it is evident that there is an inherent difficulty with quantifying ‘natural
variability’ when the overall trend or trajectory is operating over a longer timescale than that assessed
during the measurement period.

8BCRITICAL COMPONENTS, PROCESSES AND SERVICES/BENEFITS
68
Figure 3-2 Area of mangroves mapped from 1950 to 1991 aerial photographs (source:
Cobb et al. 2007)
Note: ‘funnel’ refers to the estuarine funnel at the river mouth, ‘cuspate’ refers to cuspate meanders, ‘sinuous’ refers to sinuous
meanders and ‘fluvial’ refers to the main channel of the river.

8BCRITICAL COMPONENTS, PROCESSES AND SERVICES/BENEFITS
69
3.3.2 C2 - Melaleuca Forests
Reason for Selection as ‘Critical’
In a study that identified qualities of the Alligator Rivers Region that favoured National Park
establishment, one of the recognised qualities was vegetation communities associated with various
landscape features and the concentration of aquatic birds that occur in the swamp lands during the
dry season (refer Fox et al. 1977). Melaleuca forests fit the description of these vegetation
communities, and as such were selected as a critical component.
Description
Refer Wetland Type Xf in Section 2.4.2.
Patterns in Variability
Melaleuca forest can display natural variation in the extent of areas covered as well as the density of
the forest. Due to the longevity of Melaleuca individuals, natural variability of Melaleuca forest
communities is typically not detected over short timescales, with the exception of sudden dieback
events that result from certain unexpected changes in environmental conditions. Specifically,
saltwater intrusion is one of the principal factors contributing to the loss of Melaleuca communities
within the Ramsar site. In contrast to this, concern has also been expressed regarding possible
encroachment of Melaleuca forests over long timescales into areas of the Ramsar site that were
previously not occupied by Melaleuca (for example, see Riley and Lowry 2002).
As discussed in section 2.4.2, Brocklehurst and van Kerckhof (1994) mapped Melaleuca forest extent
in Kakadu National Park in 1992, which describes post-listing conditions for Stage I and II, and pre-
listing condition for Stage III. This was a one-off study, and therefore, there are no empirical data
describing natural variability in Melaleuca forest over time at the whole-of-site scale. However, a
number of studies have examined changes in Melaleuca extent on localised scales, as described
below.
Winn et al. (2006) used aerial photography interpretation to examine changes in Melaleuca extent
(and morphological change – see section 3.2.3) at the mouth of the East Alligator River (Stage I)
between 1950 and 19971. Between 1950 and 1975 (pre-listing), dramatic increases in tidal creek
expansion (and associated saltwater intrusion) occurred, resulting in a 45 percent reduction in
Melaleuca forest extent. Around the time of listing, a further 26 percent reduction in Melaleuca extent
occurred between 1975 and 1984, and a further seven percent reduction occurred between 1985 and
1997. Similar to temporal trends in mangrove extent (and intertidal flat extent; see Winn et al. 2006), it
is apparent that there has been a long-term trend of increased salt water intrusion into freshwater
wetlands (and associated changes in vegetation communities), which has been evident for at least 30
years prior to Ramsar site listing. These changes represent part of the ecological character of the
Ramsar site.
There has been a large body of research describing changes in Melaleuca density and/or extent in
the Magela floodplain, which is predominantly within Stage II (1989 listing). Two studies examined 1 Note that the only empirical data presented by Winn et al. (2006) were percentage change values.

8BCRITICAL COMPONENTS, PROCESSES AND SERVICES/BENEFITS
70
changes in Melaleuca forests prior to Stage II listing: Williams (1984) examined Melaleuca densities,
and Staben (2008) examined Melaleuca extent. Williams (1984) reported an overall decline in the
density of Melaleuca on the Magela floodplain between 1950 and 1975.
Staben (2008) mapped Melaleuca extent on the Magela floodplains during four time periods: 1950,
1975, 1996 and 2004 (Figure 3-3). In contrast to the observed reduction in Melaleuca densities
documented by Williams (1984), Staben (2008) observed an increase in Melaleuca extent between
1950 (118.9 hectares) and 1975 (133.4 hectares) time periods. Between 1975 and 1995 (i.e. six
years after listing of Stage II), Melaleuca extent remained almost static (three hectare increase), but
declined in 120.4 hectares by 2004. Staben (2008) suggested that differences in the results of these
two studies could relate to differences in mapping methodologies and/or sampling (classification)
errors in either of the studies.
Two other studies undertaken in the Magela floodplain describe changes in Melaleuca forests
between a pre-listing sampling episode (either 1975 or 1983) and one post-listing sampling episode
(1996, 2006). Riley and Lowry (2002) observed a net decline in the number of trees between 1975
and 1996 in the study area as a whole, as well as within four out of five sub-areas that together
comprised the study area (refer Table 3-3). Similarly, Boyden et al. (2008) examined changes in the
percentage cover of Melaleuca on the Magela floodplain between 1983 and 2003, and found a ten
percent decrease in cover (refer Figure 3-4). These two studies are consistent with the findings of all
other studies undertaken on the Magela floodplain except Staben (2008).
A number of processes could ultimately control these temporal patterns. Williams (1984) suggested
that factors such as late dry-season fires, strong winds, buffalo and in some instances saltwater
intrusion may be responsible for the decline in Melaleuca trees prior to listing. Other authors also
highlight the potential impacts of fire, feral pigs, changes in rainfall patterns and successional
changes due to sediment accumulation. This suggests that both natural and anthropogenic factors
could have resulted in the observed changes to wetland communities in the period prior to listing.
Table 3-3 Number of Melaleuca trees on the Magela Floodplain (source: Riley and
Lowry 2002)
Year Sub-area 2 Sub-area 3 Sub-area 4 Sub-area 6 Sub-area 7 Total
1975 1886 2545 11 238 5447 10 317 31 433
1996 819 1404 6989 1797 13 695 24 704
Change 1067 -1141 -4249 -3650 +3378 -6729
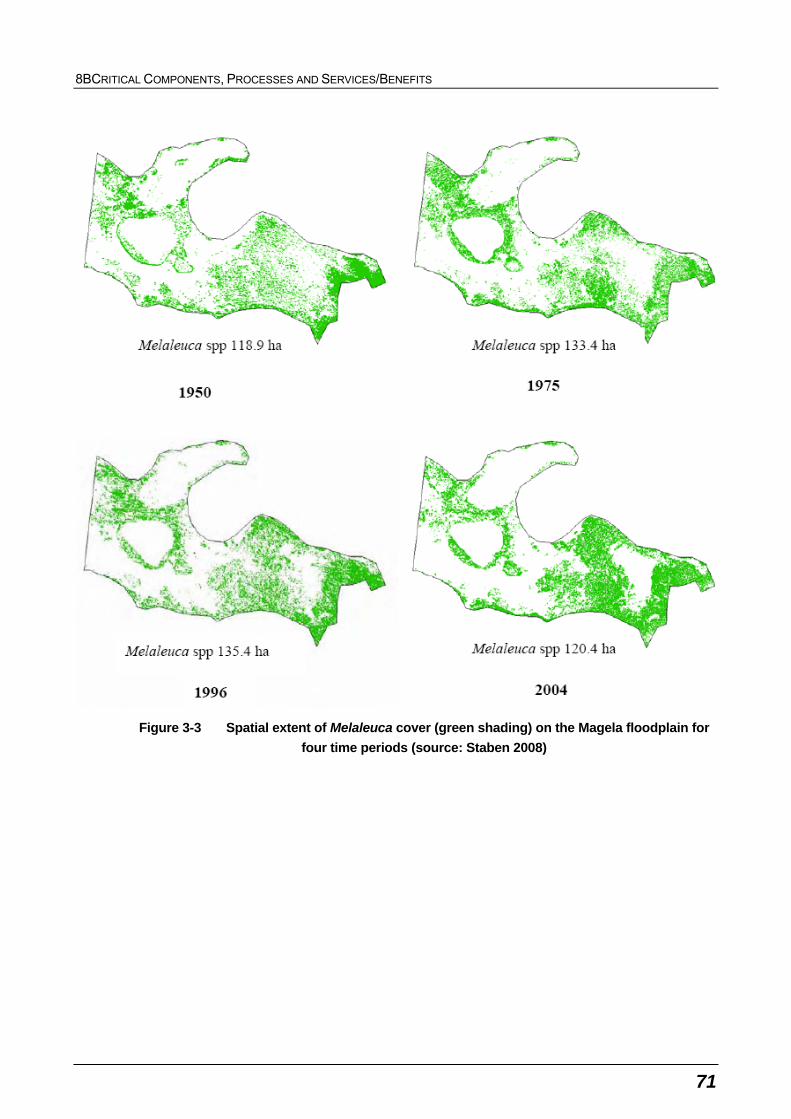
8BCRITICAL COMPONENTS, PROCESSES AND SERVICES/BENEFITS
71
Figure 3-3 Spatial extent of Melaleuca cover (green shading) on the Magela floodplain for
four time periods (source: Staben 2008)
8BCRITICAL COMPONENTS, PROCESSES AND SERVICES/BENEFITS
72
3.3.3 C3 – Palustrine Wetlands and Billabongs
Reasons for Selection as ‘Critical’
Fox et al. (1977) considered these habitats as important land type features that are well-represented
within the Alligator Rivers Region, and therefore these habitats contributed significantly to proposals
for declaration as a National Park. Furthermore, palustrine wetlands and billabongs were selected as
a critical component as they are fundamental to determining the site’s ecological character.
Specifically, billabongs provide areas of deep water habitat for aquatic flora and fauna, as well as dry
season refuge for many of the aquatic fauna species that inhabit the floodplains. These fauna species
include a diversity of freshwater fish (Criterion 7), a large number of waterbirds (Criteria 5 and 6),
certain threatened species (for example, pig-nosed turtles – Criterion 2 and 9) and a number of
traditional food species (for example, file snakes, freshwater turtles – see Section 3.8.4). Additionally,
many traditional dietary staple plant species are associated with billabongs (for example, water lilies –
see Section 3.8.4). Billabongs such as Yellow Water are also of value due to their tourism and
recreational significance (section 3.8.1).
Description
Refer Wetland Types O, Tp and Ts in Section 2.4.2.
Patterns in Variability
The spatial arrangement of palustrine wetlands within the landscape emulates some constancy due
to geology and topo-climatic patterns, however the distribution and abundance of wetland plant
species exhibits substantial natural variation over time (Finlayson 2005). Parameters contributing to
the dynamic nature of palustrine wetlands may include rainfall, fire and magpie goose Anseranas
semipalmata foraging.
While broad-scale mapping of billabongs are available (refer Section 2.4), there are no empirical data
describing natural variability of palustrine wetlands over time at a whole-of-site scale. Furthermore,
there area no data describing changes in vegetation communities at more localised spatial scales
prior to listing.
The only study to date describing temporal changes in vegetation distribution was undertaken on the
Magela floodplain (located in Stage II) between 1983 (six years prior to listing) and 2003 (14 years
after listing) (Boyden et al. 2008). Boyden et al. (2008) mapped the relative change in the percentage
cover and distribution of eight native vegetation classes in the Magela floodplain (refer Figure 3-4).
Most plant classes exhibited little change, except for Eleocharis that decreased by 57 percent and
Nelumbo that decreased by 85 percent. While this study considered changes occurring both before
and after site listing, the study provides a basis for demonstrating the nature of temporal variability in
these communities.
Empirical data for billabongs are limited to the mapping layer for the catchment of the South Alligator
River (refer Section 2.4.2). As such, patterns in natural variability over time can not be quantitatively
described. However, it is known that a high degree of variability is exhibited by billabongs in terms of

8BCRITICAL COMPONENTS, PROCESSES AND SERVICES/BENEFITS
73
their size and permanency, predominantly due to seasonal and annual variations in climatic
parameters (particularly rainfall) (for example, see Finlayson et al. 2006).
Figure 3-4 Generalised vegetation class changes on the Magela floodplain between 1983
and 2003 (source: Boyden et al. 2008)
8BCRITICAL COMPONENTS, PROCESSES AND SERVICES/BENEFITS
74
3.3.4 C4 – Waterfalls, Seeps and Waterholes
Reasons for Selection as ‘Critical’
Key features that were identified in proposals for the National Park declaration included the plateau
and its gorges and the wilderness values of these areas, as well as the main escarpment, scenic
landforms and associate flora and fauna (refer Fox et al. 1977). Furthermore, these habitats were
selected as a critical component as they support endemic aquatic invertebrates (Criterion 3 and
Critical Service 1) and provide opportunities for recreation, tourism and scientific research (for
example, Wilson et al. 2009).
Description
As briefly mentioned in Section 2.4.2, the sandstone cliffs of the Arnhem Land Escarpment in Kakadu
National Park contain a number of waterfalls. Water levels of the creeks forming the waterfalls
typically drop very quickly at the end of the wet season, and the waterfalls are either greatly reduced
in volume or may totally dry up, leaving a number of deep pools at the base of the escarpment.
The top of the plateau is generally a harsh and dry environment. However, water seeping from rock
walls, together with deep alluvial soils, has allowed development of tall monsoon forests within
gorges. These habitats are important for fauna refuge during the drier months, and also support a
number of threatened flora species2. In places the dominant plant species is Allosyncarpia ternata, a
tree species that is endemic to the Kakadu and Arnhem Land region.
Patterns in Variability
There are no empirical data describing variability over time in extent of permanent waterholes and
seeps in the stone country.
3.3.5 C5 - Populations of Migratory and Resident Waterbirds
Reasons for Selection as ‘Critical’
Populations of migratory and resident waterbirds are fundamental to determining the site’s ecological
character, and were noted as a feature of importance with respected to proposals for declaration of
the National Park (refer Fox et al. 1977). Furthermore, populations of migratory and resident
waterbirds were selected as a critical component due to the support for Ramsar Nomination Criteria 4
and 5, the opportunities presented for recreation and tourism, the provisioning of traditional foods
(Section 3.8.4) and opportunities presented for scientific research (for example, Traill et al. 2010a,b).
2 Note that these flora species are not wetland-dependent and have therefore not been considered in this ECD in the context of Ramsar Nomination Criterion 2.
8BCRITICAL COMPONENTS, PROCESSES AND SERVICES/BENEFITS
75
Description
The Ramsar site supports significant overall numbers of waterbirds, as well as significant numbers of
individual bird species. Specific details have been described for justification of the Ramsar
Nomination Criteria in Sections 2.5.7 and 2.5.8 (also see Appendix C for waterbird species list).
Waterbirds feed on aquatic invertebrates, vertebrates such as fish and frogs, and plant material. As
such, these populations of migratory and resident waterbirds are important to ecosystem functioning,
particularly with respect to wetland nutrient cycling processes. Herbivorous birds (for example,
magpie geese Anseranas semipalmata, wandering whistling duck Dendrocygna arcuata) are most
abundant and are supported by the vast expanse of vegetation.
Waterbirds are also important with respect to plant recruitment processes. Specifically, waterbirds
may disperse seeds through endozoochory (ingestion of seeds) or epizoochory (for example,
transportation of seeds in mud stuck to feet), and intensive turning over of floodplain soils occurs as a
result of magpie geese foraging for water chestnut Eleocharis dulcis tubers.
Species that are listed under international migratory agreements are listed in Appendix C. Important
sites for migratory shorebirds include:
intertidal feeding habitats of Field Island (roost and intertidal feeding sites); the coast between
Finke Bay and East Alligator and between the South Alligator River and Minimini Creek (and
nearby open saline wetlands)
roost sites of Field Island and beaches of West Alligator Head area (especially Middle Beach –
an important mainland site)
inland wetlands associated with all the major rivers, including: Gulungal, Narramoor, Kapalga
South, Kapalga Ruins, Fischer’s Hole Billabongs; Magela Creek; Mirangie Spring, Obiworbby
Spring, Gaden’s Spring, Boggy Plain, Causeway Point, Jarrahwingkoombarngy Swamp, and
Billyangardee Spring, and
for individual species – the mouth of East Alligator River (black-tailed godwit Limosa limosa);
South and East Alligator River wetlands (lesser sand plover Charadrius mongolus), and Boggy
Plain, Jarrahwingkoombarngy Swamp and Billyangardee Spring (little curlew Numenius minutus).
There is a range of biological processes that, together with physical (abiotic) processes described
elsewhere, are critical to the maintenance of wetland ecosystem functioning and waterbird values.
The availability of food sources will affect the frequency and intensity of use of the site as a feeding
habitat by waterbirds, noting that a broad range of feeding techniques are used by the array of
waterbirds that use the site. These feeding adaptations range from shorebirds feeding on
macroinvertebrates within intertidal habitats to herbivorous waterbirds of the freshwater floodplain
wetlands. The following is a summary of some of the key processes which are required to maintain
feeding habitat values for waterbirds:
freshwater flow regimes to support freshwater wetland characteristics and buffers to increasing
salinity levels
8BCRITICAL COMPONENTS, PROCESSES AND SERVICES/BENEFITS
76
primary and secondary productivity of aquatic flora, algae and micro- and macro-invertebrates
within shallow wetland habitats
water quality to a level required to support high primary and secondary productivity, and
maintenance of natural patterns of tidal inundation. Tidal inundation influences intertidal feeding
habitat characteristics, that is, overall extent, productivity and daily availability to shorebirds.
Patterns in Variability
For the majority of waterbird species, birds appear to migrate into the Alligator Rivers Region from
shallower floodplains to the west, from sub-tropical areas to the south, from distant locations in
southern Australia, and from the northern hemisphere (Morton et al. 1993a,b, Bamford 1990, Bayliss
and Yeomans 1990, Chatto 2000-2006). For waterbirds (excluding migratory shorebirds), a
consistent pattern in changes in waterbird abundance is primarily linked to the seasonality of rainfall
and the annual wetting and drying cycle of tropical wetlands (Morton et al. 1990a, Bayliss and
Yeomans 1990, Chatto 2006). Rainfall is highly seasonal so that wetlands are flooded annually (wet
season December to March) and then followed by an extended dry season (April to November). For
waterbirds (excluding migratory shorebirds), this pattern of abundance is generally characterised by
lower numbers during the wet season (typically dispersed throughout floodplain habitats to nest), then
increasing to dramatic peaks in the late dry season and concentrating in higher densities at remnant
wetlands as the only remaining sources of permanent freshwater and food (Morton et al. 1990a,
1993c). The influx is typically dominated numerically by magpie geese, but all species become more
abundant in the dry season (Morton et al. 1990a; Bayliss and Yeomans 1990; Chatto 2006). Whilst
variations in abundance and distribution between years within the same season have been recorded,
the most likely explanation is reflected in annual and local variations in rainfall (Morton et al. 1990a).
In regards to the migratory shorebird component of the waterbird assemblage, there is an increase in
numbers between July and September (linked to the arrival of birds migrating from northern breeding
grounds), then followed by a decline over the wet season as some birds continue migration or move
into freshly inundated wetlands, then an exodus of those remaining birds from May to July (Chatto
2006). There is some evidence which indicates that there is variation in the timing of peak abundance
of certain species (though not significantly altering the overall pattern of shorebird abundance
mentioned above) and this is probably linked to differences in migratory paths used to enter and
depart from Australia (Geering et al. 2007). Examples include higher abundances coinciding with
northern migration (marsh sandpiper Tringa stagnatilis, common sandpiper Actitis hypoleucos, sharp-
tailed sandpiper Calidris acuminata) and southern migration (little curlew, oriental pratincole Glareola
maldivarum) (Chatto 2003b, 2006). Differences in a species’ use of site on southward and northward
migration elsewhere within the flyway have been widely reported (for example, Minton 2004, Gosbell
and Clemens 2006). Interpretation of changes in abundance for migratory species needs to also
consider potential external factors (potential variability in breeding success) and in particular,
anthropogenic impacts to key stopover sites within other parts of the flyway.
Of the three general functional groupings of migratory shorebirds recorded in Kakadu National Park
(species of marine shorelines; species of freshwater shorelines; and species of grasslands), Bamford
(1990) noted that most species of freshwater shorelines and grasslands were scarce or absent from
early wet season (December) until towards the end of the following dry season (September-
8BCRITICAL COMPONENTS, PROCESSES AND SERVICES/BENEFITS
77
November). Of these, the little curlew provides a dramatic example, where numbers may increase
dramatically within a short period (30 000 to 50 000 birds recorded), and then plummet, all within the
period September through to October with a large proportion of the population moving to the sub-
coastal floodplains some distance to the east and west of the Alligator Rivers Region (Bamford 1990,
Morton et al. 1991). Those species of marine shorelines, not unexpectedly, do not exhibit the
concomitant pattern of change in abundance as their preferred wetland habitat is not affected to the
same extent by the seasonal effects of flooding and drying.
3.3.6 C6 – Populations of Freshwater Fish
Reasons for Selection as ‘Critical’
Freshwater fish are a key component of aquatic ecosystems throughout the Ramsar site, and were
noted as an important biological feature in proposals for National Park declaration (refer Fox et al.
1977). The importance of freshwater fish populations within the site is also reflected through the
support of Ramsar Nomination Criterion 7, the presence of endemic species (Service 1) and the
fisheries resource values provided by the site (Critical Service 2).
Description
Freshwater fish abundance and diversity in Kakadu National Park are high in an Australian context
(Allen et al. 2002). Freshwater fish can be found in all aquatic habitats, including floodplain wetlands,
billabongs, creeks, rivers and permanent pools at creek headwaters in the escarpment. Due to
differences in habitat characteristics and food resources, the greatest fish diversity is supported by
channel, backflow and floodplain billabongs, whilst escarpment habitats and sandy creek beds
typically contain the lowest fish diversity (Cowie et al. 2000).
Freshwater fish are a key dietary component for the top aquatic predators in the site (for example,
crocodiles, fishing eagles) and therefore contribute to controlling ecosystem processes and biological
interactions. Barramundi are also opportunistic predators, primarily feeding on aquatic invertebrates
and fish. Typically the diet of larger barramundi consists of 60 percent fish and 40 percent
crustaceans (predominantly prawns/shrimp), whilst smaller barramundi primarily feed on crustaceans
(Allsop et al. 2006).
Densities of freshwater fish are highly seasonal and are related to flooding and water depth. Most fish
migrate seasonally, moving out of dry season refuges at the start of the wet season to colonise
wetted creeks, floodplains and billabongs (Cowie et al. 2000). The proliferation of freshwater fish
during the wet season and their progressive concentration in shrinking water bodies from mid to late
dry season presents ideal feeding conditions for fish-eating birds (Cowie et al. 2000). Exclusively fish-
eating species include darters Anhinga novaehollandiae, little black cormorants Phalacrocorax
sulcirostris, Australian pelicans Pelecanus conspicillatus, ospreys Pandion haliaetus and great egrets
Ardea alba.
Freshwater fish communities in the upper Arnhem Land escarpment are distinctly different to those in
the lowland floodplain habitats as a result of a gradient in environmental conditions occurring along
the creek systems of the site (Gardner et al. 2002). Escarpment communities inhabit aquatic areas
with low temperatures, high dissolved oxygen and low turbidity over a rocky substrate. In contrast,
8BCRITICAL COMPONENTS, PROCESSES AND SERVICES/BENEFITS
78
habitats in the lower freshwater reaches are typically warmer, with lower dissolved oxygen and soft
sediment substrates (Gardner et al. 2002).
Most freshwater fish migrate seasonally, moving out of dry season refuges (for example, permanent
billabongs) at the beginning of the wet season to colonise floodplains. The main purpose of
undertaking these migrations is to benefit from increased food availability during the wet season and
to breed (Griffin 1995, Cowie et al. 2000). Most of the fish species in Magela Creek, a seasonally
flowing tributary of the East Alligator River, show a peak in breeding activity soon after the start of the
wet season (Bishop and Forbes 1991).
Approximately 20 percent of species within the Alligator Rivers Region are catadromous, migrating
from freshwater areas to breed in marine or estuarine environments (Bayliss et al. 1997). The
remaining fish species are typically potadromous and do not have an obligate estuarine phase (i.e.
primarily migrate from rivers to floodplain areas to use increased habitat and food availability during
the wet season). Perhaps the most important catadromous fish species within the site is barramundi
Lates calcarifer (refer Section 3.7.2). Mature barramundi (and also possibly the Ord River mullet and
tarpon) migrate to coastal areas early in the wet season to breed. Barramundi eggs and larvae
require saltwater so spawning occurs from September to February in coastal swamps, river mouths
and marine embayments (Davis 1985; Allsop et al. 2006).
Towards the end of the wet season there is a large migration of adult and juvenile fish upstream from
coastal areas to permanent freshwater bodies (Bishop and Forbes 1991). These upstream migrations
are thought to be crucial to transferring assimilated aquatic productivity from floodplain areas to the
less productive rivers and streams. For example, in Magela Creek, the upstream migration of black-
striped rainbowfish Malanotaenia nigrans has been estimated to be up to one tonne wet weight per
day, which is almost an order of magnitude greater than the downstream migration (Pidgeon and
Boyden 1993).
Patterns in Variability
There are few data describing temporal patterns in fish abundance in the periods prior to listing of the
Ramsar site. Data on abundance and size distribution of fish species in eight pools within Magela
Creek (Stages I and II) during a sampling season in 1981 is presented in Woodland and Ward (1992).
Spangled perch Leiopotherapon unicolour and bony bream Nematalosa erebi were the most
dominant species according to biomass, while Magela hardyhead Craterocephalus marianae was
numerically the most dominant species at the start of the study, prior to suffering high levels of
predation by larger fish (Woodland and Ward 1992). Surveys were not systematic so do not
constitute a baseline for identifying changes in communities.
As noted, many of the freshwater species within the site are migratory, therefore diversity and
abundance of fish assemblages vary greatly at different times of year, even in permanent
waterbodies. During major migration times, fish numbers can also vary greatly from day to day
(Humphrey et al. 2005).
Based on long-term data from Magela Creek, Gardner et al. (2002) note a number of patterns in
freshwater fish community dynamics as follows:
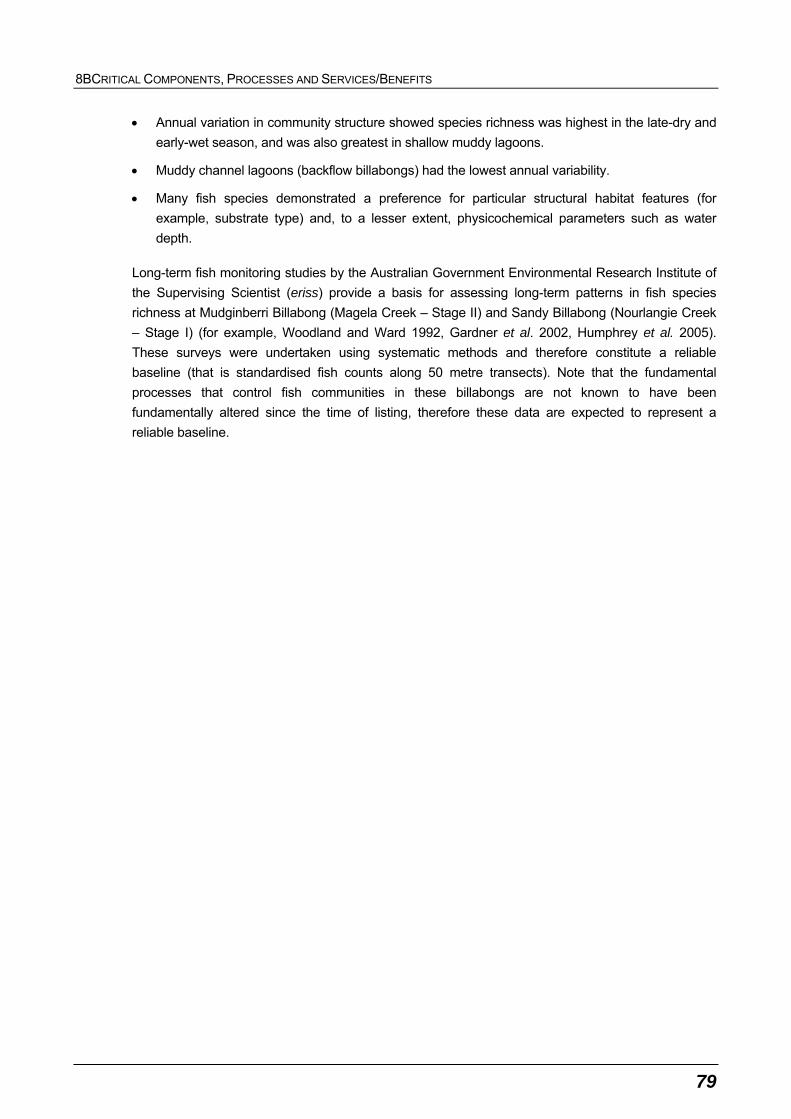
8BCRITICAL COMPONENTS, PROCESSES AND SERVICES/BENEFITS
79
Annual variation in community structure showed species richness was highest in the late-dry and
early-wet season, and was also greatest in shallow muddy lagoons.
Muddy channel lagoons (backflow billabongs) had the lowest annual variability.
Many fish species demonstrated a preference for particular structural habitat features (for
example, substrate type) and, to a lesser extent, physicochemical parameters such as water
depth.
Long-term fish monitoring studies by the Australian Government Environmental Research Institute of
the Supervising Scientist (eriss) provide a basis for assessing long-term patterns in fish species
richness at Mudginberri Billabong (Magela Creek – Stage II) and Sandy Billabong (Nourlangie Creek
– Stage I) (for example, Woodland and Ward 1992, Gardner et al. 2002, Humphrey et al. 2005).
These surveys were undertaken using systematic methods and therefore constitute a reliable
baseline (that is standardised fish counts along 50 metre transects). Note that the fundamental
processes that control fish communities in these billabongs are not known to have been
fundamentally altered since the time of listing, therefore these data are expected to represent a
reliable baseline.
8BCRITICAL COMPONENTS, PROCESSES AND SERVICES/BENEFITS
80
Table 3-4 Mean abundance (number fish per 50 metres) of fish species from Mudginberri and
Sandy billabongs for the period 1994 to 2005 (source: Humphrey et al. 2005)
The results of the long-term fish monitoring program undertaken by eriss are documented by
Humphrey et al. (2005). At Mudginberri and Sandy Billabongs, the species with the highest
abundances were typically fly-specked hardyhead Craterocephalus stercusmuscarum, followed by
chequered rainbowfish Melanotaenia splendida inornata and banded grunter Amniataba percoides
(refer Table 3-4, Humphrey et al. 2005). At Mudginberri Billabong, a total of 30 species was recorded,
with mean species density of 12.9 species per 50 metre transect, and at Sandy Billabong a total of 29
species was recorded and the mean species density was 13.2 species per 50 metre transect
(Humphrey et al. 2005). The mean species density values recorded by Humphrey et al. (2005) were
comparable to baseline species richness values recorded by Bishop et al. (1990), despite differences
in sampling methods and effort.
8BCRITICAL COMPONENTS, PROCESSES AND SERVICES/BENEFITS
81
3.3.7 C7 – Populations of Freshwater and Saltwater Crocodiles
Reasons for Selection as ‘Critical’
Saltwater and freshwater crocodiles represent critical components not only in terms of their ecological
roles within the site, but also in terms of their iconic and cultural values.
Description
Saltwater Crocodiles
The Australian distribution of saltwater crocodile Crocodylus porosus extends across the north from
Broome and down the east coast to Gladstone. They inhabit both salt and fresh waters, including tidal
rivers, estuaries, nearby freshwater billabongs, lagoons and wetlands. Saltwater crocodiles also bask
on riverbanks and sandbars.
Saltwater crocodiles are opportunistic predators with a wide ranging diet, feeding in channel,
billabong and floodplain habitats. In Kakadu National Park, the diet of juveniles largely consists of
crabs and prawns, as well as fish, amphibians and small reptiles, and larger adults also consume
fauna such as birds, kangaroos, wild pigs and sharks (NTG undated). The relatively high number of
saltwater crocodiles in Kakadu National Park means that their predatory activities can have a
significant effect on the population dynamics of their prey species. For example, in populations of
waterbird species that are not typically present in high numbers, their reproductive success and
consequent abundances may be controlled in part by saltwater crocodile predation on eggs, chicks
and adult birds, particularly during the wet/breeding season.
Compared with other parts of northern Australia, saltwater crocodile densities are greatest in the
Northern Territory, with Kakadu National Park containing a significant proportion of the Australian
population (S. Ward pers. comm. 2009). Fukuda et al. (2007) suggest that a number of environmental
influences are linked to the greater abundances in this area, namely:
the proportion of a catchment area that consists of favourable wetland vegetation types
(Melaleuca, grass and sedge)
rainfall seasonality, and
temperature (mean temperature in the coolest quarter of the year).
Saltwater crocodiles nest over the wet season between October and May, with an increase in
temperature triggering reproductive activities (Webb 1991). The extent and timing of nesting is related
to rainfall and water levels in the late dry season: years with high rainfall and cool conditions between
August and November are associated with high nesting effort, while years with poor rainfall and hot
conditions between August and November are associated with low nesting effort (Webb 1991).
Nest mounds are constructed out of live or dead vegetation and mud. These nests are typically
located among dense aquatic grasses or on floating mats, close to a permanent water source
(billabong margins, riverbanks etc.) (Grigg and Taylor 1980). The nest mounds are approximately 1.8
metres high, and a hole is excavated in the mound into which approximately 50 eggs are laid (Leach
et al. 2009) and incubated for 75 to 90 days. The mounds serve a number of functions, including
8BCRITICAL COMPONENTS, PROCESSES AND SERVICES/BENEFITS
82
insulation of the eggs from temperature extremes, prevention of dehydration, prevention of predation
and minimisation of flood damage to the embryos. There is a high mortality of saltwater crocodile
eggs, predominantly due to flooding that may kill over half of the eggs laid each year (Webb and
Manolis 1989).
Freshwater Crocodiles
Freshwater crocodiles Crocodylus johnstoni are endemic to northern Australia, occurring in Western
Australia, Northern Territory and Queensland. They inhabit rivers wetlands, billabongs and creeks,
remaining in permanent waters during the dry season. Basking also occurs on riverbanks.
Freshwater crocodiles are ambush predators, with fish and crustaceans (for example, crayfish and
shrimp) comprising the majority of their diet, although a significant proportion is derived from other
fauna such as amphibians, small reptiles, birds and insects (Cogger 2000). Approximately 40 percent
of the diet of freshwater crocodiles is of terrestrial origin (for example, birds, reptiles) (Webb et al.
1983).
Freshwater crocodiles typically inhabit the floodplains during the wet season, and move to river
channels late in the wet season to stay in close proximity to permanent water during the dry season.
Female freshwater crocodiles dig holes in sand embankments as nests. Nesting occurs during the
dry season, after the water levels fall and riverbanks are exposed. Early wet season flooding can be
detrimental to nesting success as embryos will drown if eggs are inundated. The temperature at
which eggs are incubated determines the sex-ratio of hatchlings (Whitehead et al. 1990).
Pattern in Variability
Saltwater Crocodiles
Since protection in 1971, the Northern Territory population increased from approximately 3000 post-
hatchlings (juveniles to adults age classes) to approximately 70 000 – 75 000 by 1994 (NTG undated)
and now represents a large proportion of Australia’s saltwater crocodile population.
The most recent information on saltwater crocodile trends in the Kakadu National Park Ramsar site is
provided by Britton (2009), who analysed population trends in the four major tidal rivers of Kakadu
National Park from 1977 to 2007. For the purposes of the present study, the tidal reaches of
Wildman, South Alligator and West Alligator Rivers are considered to occur in Stage II (1989 listing)
whereas the tidal reaches of East Alligator are considered to occur in Stage I (1980 listing).
Table 3-5 shows saltwater crocodile densities prior to Ramsar site declaration. Since this time, there
has been a general increase in saltwater crocodile densities (refer Figure 3-5). However, this trend
was not consistent across all four river systems (Figure 3-6). Saltwater crocodile densities (number
counted per kilometre) were generally greatest in the Wildman, East and South Alligator Rivers
(Figure 3-6). Densities in the West Alligator Rivers were lower than the other rivers, perhaps due to
issues with survey effort and other biases (Britton 2009). There is also a trend of increasing numbers
of saltwater crocodiles recorded in freshwater areas, possibly in response to increasing population
densities in other more optimal habitats.
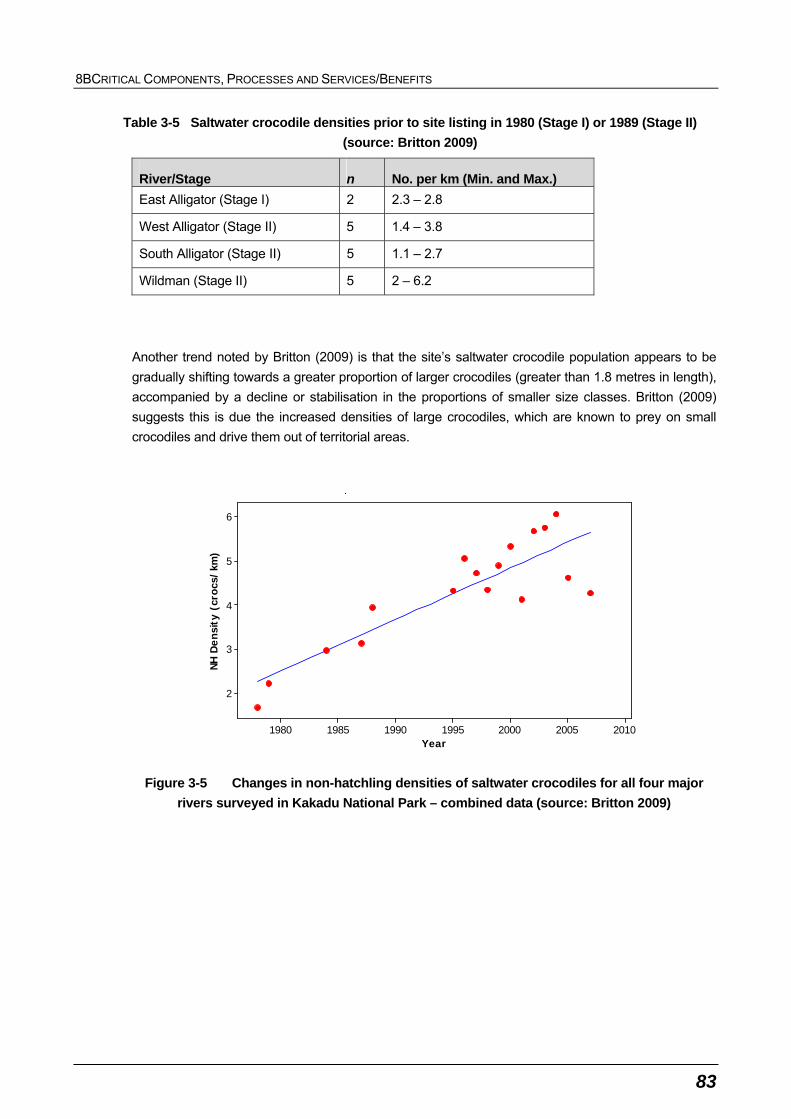
8BCRITICAL COMPONENTS, PROCESSES AND SERVICES/BENEFITS
83
Table 3-5 Saltwater crocodile densities prior to site listing in 1980 (Stage I) or 1989 (Stage II)
(source: Britton 2009)
River/Stage n No. per km (Min. and Max.)
East Alligator (Stage I) 2 2.3 – 2.8
West Alligator (Stage II) 5 1.4 – 3.8
South Alligator (Stage II) 5 1.1 – 2.7
Wildman (Stage II) 5 2 – 6.2
Another trend noted by Britton (2009) is that the site’s saltwater crocodile population appears to be
gradually shifting towards a greater proportion of larger crocodiles (greater than 1.8 metres in length),
accompanied by a decline or stabilisation in the proportions of smaller size classes. Britton (2009)
suggests this is due the increased densities of large crocodiles, which are known to prey on small
crocodiles and drive them out of territorial areas.
Year
NH D
ensi
ty (
croc
s/km
)
2010200520001995199019851980
6
5
4
3
2
p
Figure 3-5 Changes in non-hatchling densities of saltwater crocodiles for all four major
rivers surveyed in Kakadu National Park – combined data (source: Britton 2009)
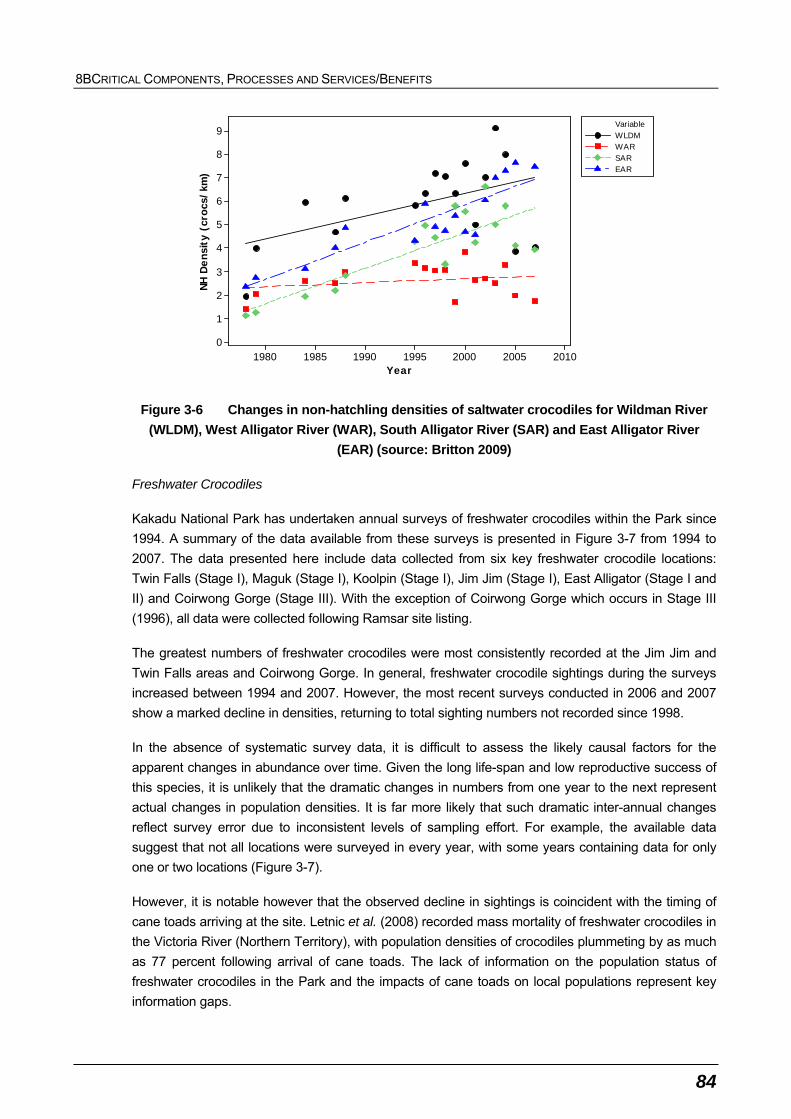
8BCRITICAL COMPONENTS, PROCESSES AND SERVICES/BENEFITS
84
Year
NH D
ensi
ty (
croc
s/km
)
2010200520001995199019851980
9
8
7
6
5
4
3
2
1
0
Variable
SAREAR
WLDMWAR
Figure 3-6 Changes in non-hatchling densities of saltwater crocodiles for Wildman River
(WLDM), West Alligator River (WAR), South Alligator River (SAR) and East Alligator River
(EAR) (source: Britton 2009)
Freshwater Crocodiles
Kakadu National Park has undertaken annual surveys of freshwater crocodiles within the Park since
1994. A summary of the data available from these surveys is presented in Figure 3-7 from 1994 to
2007. The data presented here include data collected from six key freshwater crocodile locations:
Twin Falls (Stage I), Maguk (Stage I), Koolpin (Stage I), Jim Jim (Stage I), East Alligator (Stage I and
II) and Coirwong Gorge (Stage III). With the exception of Coirwong Gorge which occurs in Stage III
(1996), all data were collected following Ramsar site listing.
The greatest numbers of freshwater crocodiles were most consistently recorded at the Jim Jim and
Twin Falls areas and Coirwong Gorge. In general, freshwater crocodile sightings during the surveys
increased between 1994 and 2007. However, the most recent surveys conducted in 2006 and 2007
show a marked decline in densities, returning to total sighting numbers not recorded since 1998.
In the absence of systematic survey data, it is difficult to assess the likely causal factors for the
apparent changes in abundance over time. Given the long life-span and low reproductive success of
this species, it is unlikely that the dramatic changes in numbers from one year to the next represent
actual changes in population densities. It is far more likely that such dramatic inter-annual changes
reflect survey error due to inconsistent levels of sampling effort. For example, the available data
suggest that not all locations were surveyed in every year, with some years containing data for only
one or two locations (Figure 3-7).
However, it is notable however that the observed decline in sightings is coincident with the timing of
cane toads arriving at the site. Letnic et al. (2008) recorded mass mortality of freshwater crocodiles in
the Victoria River (Northern Territory), with population densities of crocodiles plummeting by as much
as 77 percent following arrival of cane toads. The lack of information on the population status of
freshwater crocodiles in the Park and the impacts of cane toads on local populations represent key
information gaps.
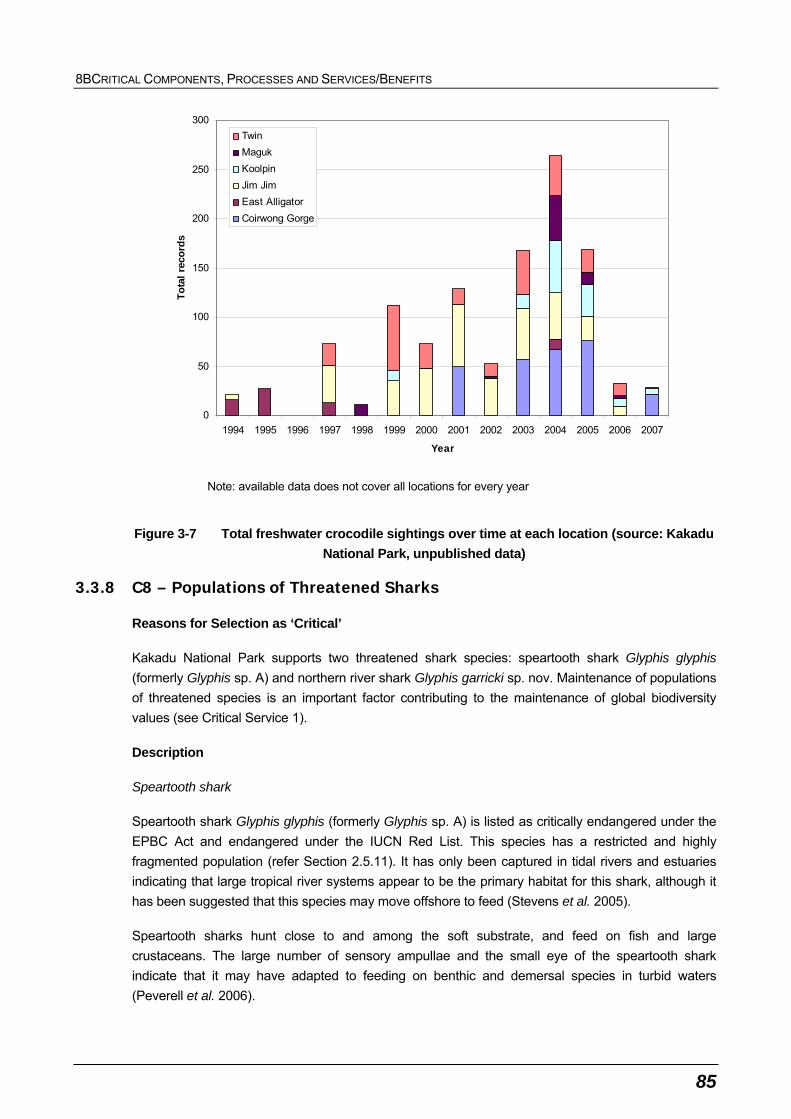
8BCRITICAL COMPONENTS, PROCESSES AND SERVICES/BENEFITS
85
0
50
100
150
200
250
300
1994 1995 1996 1997 1998 1999 2000 2001 2002 2003 2004 2005 2006 2007
Year
To
tal
reco
rds
Twin
Maguk
Koolpin
Jim Jim
East Alligator
Coirwong Gorge
Note: available data does not cover all locations for every year
Figure 3-7 Total freshwater crocodile sightings over time at each location (source: Kakadu
National Park, unpublished data)
3.3.8 C8 – Populations of Threatened Sharks
Reasons for Selection as ‘Critical’
Kakadu National Park supports two threatened shark species: speartooth shark Glyphis glyphis
(formerly Glyphis sp. A) and northern river shark Glyphis garricki sp. nov. Maintenance of populations
of threatened species is an important factor contributing to the maintenance of global biodiversity
values (see Critical Service 1).
Description
Speartooth shark
Speartooth shark Glyphis glyphis (formerly Glyphis sp. A) is listed as critically endangered under the
EPBC Act and endangered under the IUCN Red List. This species has a restricted and highly
fragmented population (refer Section 2.5.11). It has only been captured in tidal rivers and estuaries
indicating that large tropical river systems appear to be the primary habitat for this shark, although it
has been suggested that this species may move offshore to feed (Stevens et al. 2005).
Speartooth sharks hunt close to and among the soft substrate, and feed on fish and large
crustaceans. The large number of sensory ampullae and the small eye of the speartooth shark
indicate that it may have adapted to feeding on benthic and demersal species in turbid waters
(Peverell et al. 2006).
8BCRITICAL COMPONENTS, PROCESSES AND SERVICES/BENEFITS
86
There are no data describing natural variability in abundance of this species. In the context of this
service, it would appear that the most notable life-history function provided by the site is a feeding
area for neonate, juvenile and adult sharks. Note that this species has not been captured outside
rivers and estuaries which may suggest that it complete its life-cycle in rivers. Based on tracking
studies in the Wenlock River, neonates and juveniles of this species are thought to have highly
restricted home ranges that are confined to the upper Wenlock estuary (less than 10 square
kilometres stream reach), whereas adults may have wider home ranges (Pillans et al. 2008).
Due to the lack of data on specific habitat requirements of this species, it is not possible at this stage
to determine critical components and processes supporting this species. It is likely however that the
following are important to maintenance of this species (and the northern river shark) within the site:
presence of suitable prey, including fish and large demersal invertebrates (crabs, prawns etc.)
(Critical Component 6)
physical (tides, fluvial) processes controlling stream morphology and habitat suitability, as well as
movement patterns of sharks (Pillans et al. 2005; 2008) (Critical Process 1), and
tidal and fluvial processes controlling important water quality variables (salinity and turbidity) that
are thought to determine habitat suitability (see Pillans et al. 2008).
Northern river shark
Northern river shark Glyphis garricki (formerly Glyphis sp. C) is listed as endangered under the EPBC
Act and IUCN Red List. This species has a restricted and highly fragmented population (refer 2.5.11),
and is thought to be restricted to the relatively shallow, upper freshwater to brackish (0-26 ppt)
reaches of the Fitzroy, Adelaide, Mary and Alligator (East, West, South) River systems (TSSC 2001a;
Morgan et al. 2004; Field et al. 2008). Despite considerable fishing and collecting activity in the
Northern Territory, no specimens have ever been found in coastal marine habitats (Thorburn et al.
2003, Larson et al. 2004).
Very little is known of its life-history or ecology. It is likely that the key service offered by the site for
this species is a feeding area for juveniles and adults. It is unknown whether the site supports mating
or breeding habitat for this species. Refer to speartooth shark for possible controls on abundance.
Patterns in Variability
Insufficient data to assess pre-listing or present day distribution and abundance patterns of either
species.
3.3.9 C9 - Yellow Chat Populations
Reasons for Selection as ‘Critical’
The site supports one wetland-dependent threatened bird species: yellow chat (Alligator Rivers)
Epthianura crocea tunneyi. Maintenance of populations of threatened species is an important factor
contributing to the maintenance of global biodiversity values (see Critical Service 1).
8BCRITICAL COMPONENTS, PROCESSES AND SERVICES/BENEFITS
87
Description
Yellow chat (Alligator Rivers) is listed as endangered under both the EPBC Act and Territory Parks
and Wildlife Act 2000. Yellow chat (Alligator Rivers) is endemic to the Northern Territory and is
restricted to a small geographic area encompassing the floodplains from the Adelaide River to the
East Alligator River, between Oenpelli and Darwin (Armstrong 2004, Woinarski and Armstrong 2006,
TSSC 2006).
Yellow chat is typically associated with low vegetation (for example, saltmarsh, samphire, chenopod
shrublands or grasslands) bordering wetlands (especially ephemeral wetlands on floodplains)
(Higgins et al. 2001). Within the Northern Territory, the Alligator Rivers subspecies is only known from
a small number of sites. It is mainly found on seasonally-inundated alluvial floodplains where low
lying areas support cover of grasses, herbs and sedges, but is also known from vegetated margins of
channels, including mangrove stands (Keast 1958; Armstrong 2004). Within the Ramsar site, the
majority of recorded sightings are derived from floodplain wetlands associated with the South Alligator
River (and north of the Arnhem Highway) (see Figure 3-8).
The subspecies is thought to be relatively sedentary (Keast 1958), though known to undertake local
movements where they concentrate around wetter areas of floodplain habitat at the end of the dry
season (Armstrong 2004). Yellow chat (Alligator Rivers) is mainly insectivorous and typically forages
on the ground in dense grass or in low shrubs (TSSC 2006, Woinarski et al. 2007).
The subspecies has been suspected to occur in a single contiguous population (Garnett and Crowley
2000) though may actually comprise multiple subpopulations (Woinarski and Armstrong 2006). The
extent of occupancy is estimated to be less than 500 square kilometres, based on the extent of the
floodplain habitats that yellow chat (Alligator Rivers) has been recorded (Armstrong 2004, TSSC
2006).
There is no accurate information on the total population size for this species, though Garnett and
Crowley (2000) conditionally estimated that the number of breeding birds was approximately 500
individuals. The most recent targeted survey undertaken in Kakadu National Park in 2004, estimated
that the Kakadu National Park population is probably fewer than 300 individuals (Armstrong 2004).
Results from the 2004 survey were regarded as largely comparable to earlier survey records within
Kakadu National Park, and providing no evidence of recent decline in numbers within the site (TSSC
2006).
Patterns in Variability
There are no data describing patterns in variability of this species.
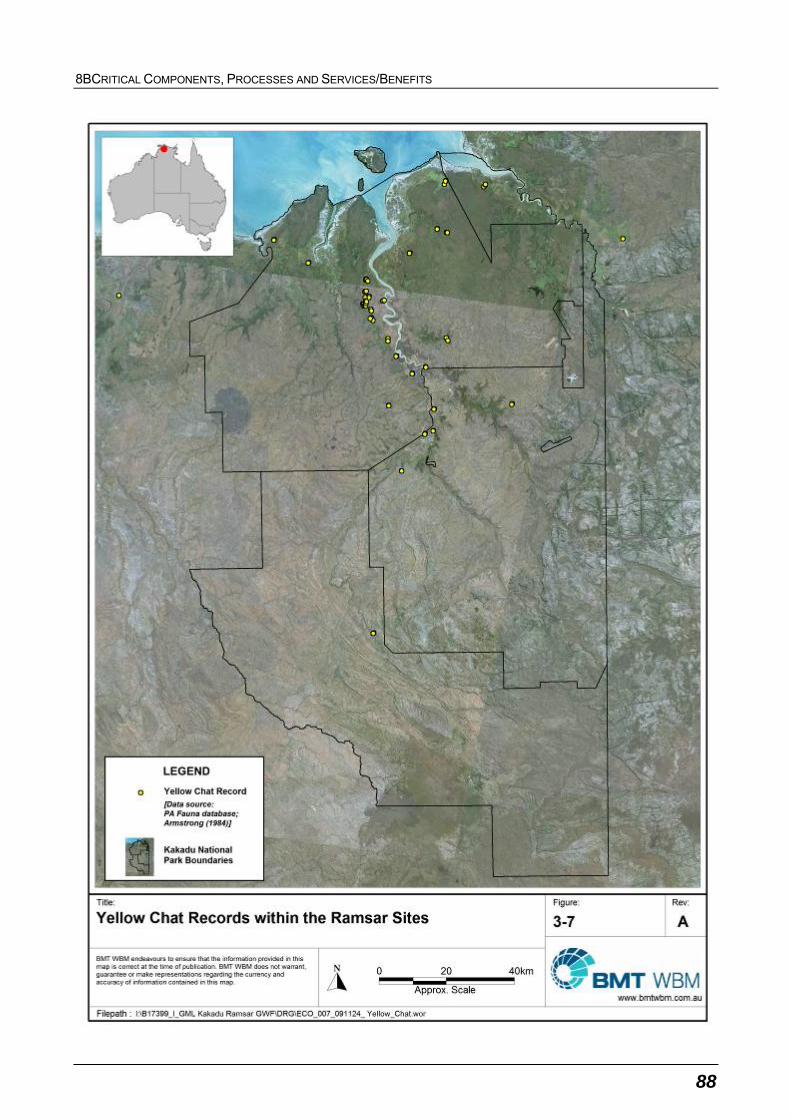
8BCRITICAL COMPONENTS, PROCESSES AND SERVICES/BENEFITS
88
I:\B17399_I_GML Kakadu Ramsar GWF\DRG\ ECO_007_091124_ Yellow_Chat.wor
Figure 3-8 Yellow chat records for Kakadu National Park (source: Parks Australia
unpublished and Armstrong 2004)
8BCRITICAL COMPONENTS, PROCESSES AND SERVICES/BENEFITS
89
3.3.10 C10 - Pig-nosed Turtle Populations
Reasons for Selection as ‘Critical’
The site supports the threatened (IUCN-Vulnerable) pig-nosed turtle Carettochelys insculpta.
Maintenance of populations of threatened species is an important factor contributing to the
maintenance of global biodiversity values (see Critical Service 1).
Description
Pig-nosed turtle Carettochelys insculpta is listed under as vulnerable under the IUCN Red List, and
as a near threatened species under the Territory Parks and Wildlife Conservation Act 2000. Pig-
nosed turtles have been recorded in South Alligator River (Schodde et al. 1972, Legler, 1980, 1982,
Press 1986) and East Alligator River (Georges et al. 1989).
Pig-nosed turtles are a freshwater species, favouring still waters with an approximate depth of two
metres (Legler 1980, 1982, Georges and Kennett 1989). Billabongs along the Alligator River systems
are known to represent a significant refuge for this species (Press et al. 1995a). Cover for pig-nosed
turtles within billabongs is provided by characteristics such as fallen branches, exposed roots and
undercut banks.
Pig-nosed turtles are omnivorous, with a diet including leaves, flowers, fruit, invertebrates and fish
(Schodde et al. 1972). This diversity of food sources enables opportunism, allowing varying
exploitation of resources dependent on availability. While males are almost entirely aquatic, females
leave the water to nest on sandy banks and lay eggs during the dry season.
The following are important to maintenance of these species within the site:
presence of suitable habitat in terms of vegetation communities (Components 3 and 4), fluvial
hydrology (Process 1) and water quality,
presence of food resources (Component 6), and
biological processes including breeding and migration.
Patterns in Variability
Georges and Kennett (1989) found pig-nosed turtles to be widespread between the tidal reaches and
the head-waters of the South Alligator River, and that high densities were present in the upper
reaches during the dry season (33.8 ± 11.3 turtles per hectare, or 67 turtles per kilometre of channel,
in small discrete ponds on the main channel).
There are few quantitative data describing temporal trends in the number of pig-nosed turtles within
the site. It is believed that feral animals and other stock caused a decline in the South Alligator River
pig-nosed turtle population prior to the declaration of Stage III of Kakadu National Park (1987-1991)
(A. Carr pers. comm. in Pritchard 1979), but this decline was not quantified, and it is not clear whether
the population has subsequently recovered (TSSC 2005). However, it is known that declines in
yellow-spotted monitor lizard Varanus panoptes population numbers associated with the arrival of
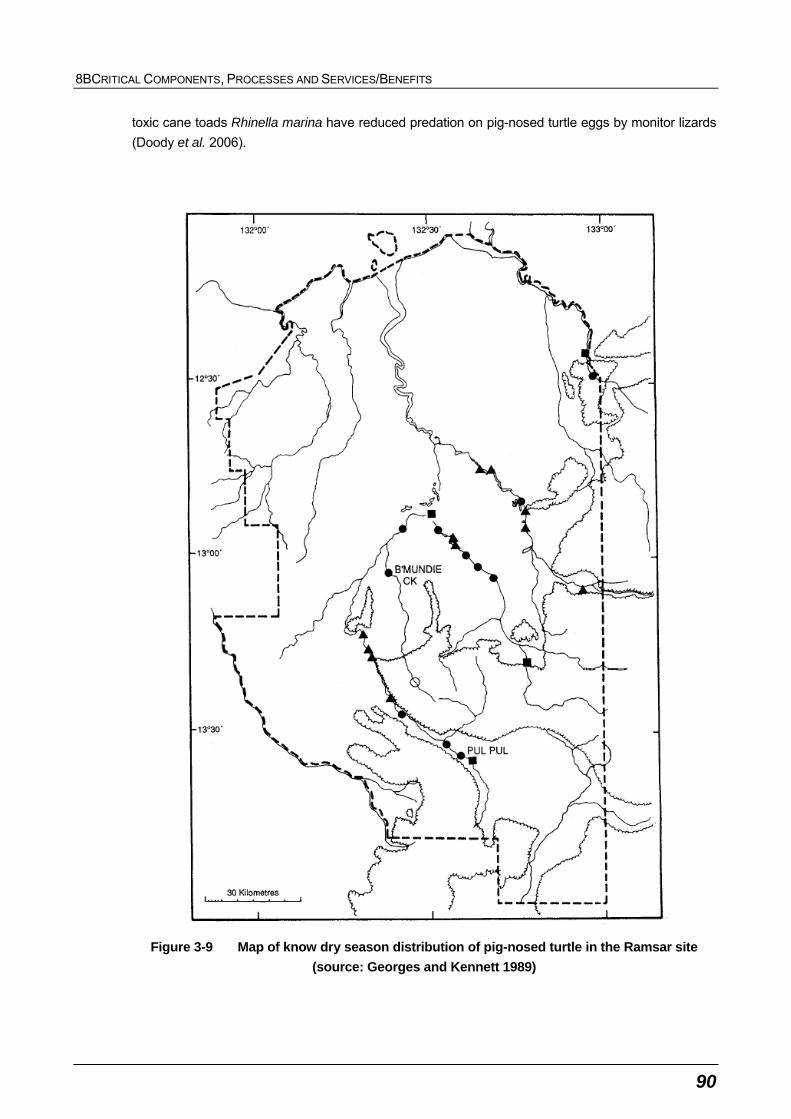
8BCRITICAL COMPONENTS, PROCESSES AND SERVICES/BENEFITS
90
toxic cane toads Rhinella marina have reduced predation on pig-nosed turtle eggs by monitor lizards
(Doody et al. 2006).
Figure 3-9 Map of know dry season distribution of pig-nosed turtle in the Ramsar site
(source: Georges and Kennett 1989)
8BCRITICAL COMPONENTS, PROCESSES AND SERVICES/BENEFITS
91
3.3.11 C11 – Locally Endemic Invertebrate Species
Reasons for Selection as ‘Critical’
Support of locally endemic fauna species was selected as a critical component on the basis of
support for Ramsar Nomination Criterion 3, as well as the importance of endemic species in terms of
justification for National Park nomination (refer Fox et al. 1977) and the fundamental importance of
threatened species to determining the site’s ecological character.
Description
The following aquatic invertebrate taxa are considered to be locally endemic species (occur
exclusively within the catchments of the Ramsar site and the Arnhem Plateau – see Appendix D):
An endemic family of shrimps (Kakaducarididae), which contains two mono-specific genera,
namely Leptopalaemon gagadjui and Kakaducaris glabra. Leptopalaemon gagadjui typically
occurs in upland permanent streams in the north-western area of the Arnhem Land plateau and
is widely distributed (South Alligator River, Nourlangie and Magela Creeks, Namarrgon Gorge),
while K. glabra is restricted to a single location (the type location in Lightning Dreaming Creek,
Namarrgon Gorge) (Bruce 1993, Page et al. 2008, refer Appendix D).
A genus of isopod (Eophreatoicus; Family Phreatoicidea) that reportedly has exceptional
species-level diversity (approximately 30 species lineages, Wilson et al. 2009). Specimens have
been collected from the King River region of western Arnhem Land, and various aquatic habitats
associated with the west Arnhem Land plateau and escarpments, including sites in the East
Alligator (for example, Magela, Ngarradji and Catfish Creeks), South Alligator, Katherine and
Liverpool River catchments (Wilson et al. 2009, refer Appendix D). The species within this genus
are extremely narrow range endemics, with juveniles migrating very small distances downstream
(approximately two to six kilometres) from their headwater refuges (Wilson et al. 2009).
At least one species of mayfly from the family Leptophlebiidae (see section 2.5.3).
These species occur exclusively in upland areas, specifically the ancient stone country. Humphrey
(1999) identified two key controls on endemism in the stone country:
the antiquity and persistence of the escarpment and associated perennial streams, springs and
seeps, and
isolating mechanisms, including processes leading to fragmentation of habitat operating over
geological time-scales (climate change, erosion etc.), and the generally poor dispersal
characteristics of the crustaceans.
Note that regional endemic species (including fish, aquatic plants and invertebrates) are considered
as supporting components in section 3.4.6.
Patterns in Variability
There are few data describing patterns in variability of these endemic aquatic invertebrate species.
This is because it is only relatively recently that many of the endemic invertebrates have been
observed, with most remaining undescribed (for example, Eophreatoicus; Wilson et al. 2009).

8BCRITICAL COMPONENTS, PROCESSES AND SERVICES/BENEFITS
92
3.4 Supporting Components
The supporting components outlined below are considered to be important or noteworthy in the
context of maintaining the character of the site, but are not considered to represent critical
components in the context of the considerations outlined in section 3.1.1 of this report. In this
context:
The supporting components are not, in isolation, thought to fundamentally underpin the identified
critical services/benefits. However, supporting components may, in combination with other critical
and supporting components, underpin critical services/benefits.
Some supporting components are already partially covered by other critical components,
processes or services/benefits.
The supporting components, while not critical, are important to wetland functioning and are
noteworthy in this regard.
3.4.1 Seagrass
There are no empirical data describing variability in seagrass-meadows cover over time, nor are their
data describing seagrass extent prior to the Ramsar site declarations.
As discussed in section 2.4.1, a one-off snap-shot of seagrass coverage of the site (and surrounding
areas) was undertaken by Roelofs et al. (2005). This survey was undertaken post-Ramsar
declaration. It is unknown whether the seagrass extent mapped by Roelofs et al. (2005) was
representative of conditions the time of listing (that is, Stage II 1989). However, in qualitative terms it
is known that tropical seagrasses can show great changes over time in response to disturbance by
waves and flooding (for example, Preen et al. 1995, Kendrick et al. 1999, Campbell and McKenzie
2004). The dominant seagrass species within the site are pioneer species that can rapidly recolonise
following disturbance (Bridges et al. 1981; Birch and Birch 1984). Consequently, when considering
natural variability in seagrass extent over time, episodic changes must be taken into account.
3.4.2 Monsoon Rainforests and Riparian Vegetation
Some but not all monsoon rainforests patches can be associated with seeps, which constitute a type
of wetland. Riparian vegetation has been included in this component due to the overlaps in spatial
distribution and species composition between these two habitat types. However, it is to be noted that
certain riparian communities would also be classified as Component 4 (Melaleuca forests). Monsoon
rainforests and/or riparian vegetation communities are associated with Wetland Types M, N and Y
(refer Section 2.4.2).
There are no broad-scale empirical data describing variability over time in extent of riparian and/or
monsoon rainforest supported by springs within the Ramsar site (refer section 2.4.2). Banfai and
Bowman (2006) examined aerial photography to document changes at 50 rainforest patches over
time, which incorporated both riparian vegetation as well as ‘non-wetland-dependent’ vegetation
patches. Four time periods were selected: 1964 (pre-listing), 1984, 1994 and 2004.
Banfai and Bowman (2006) found that rainforest boundaries were highly dynamic at the decadal
scale, with a landscape-wide expansion of rainforest boundaries exhibited between 1964 and 2004
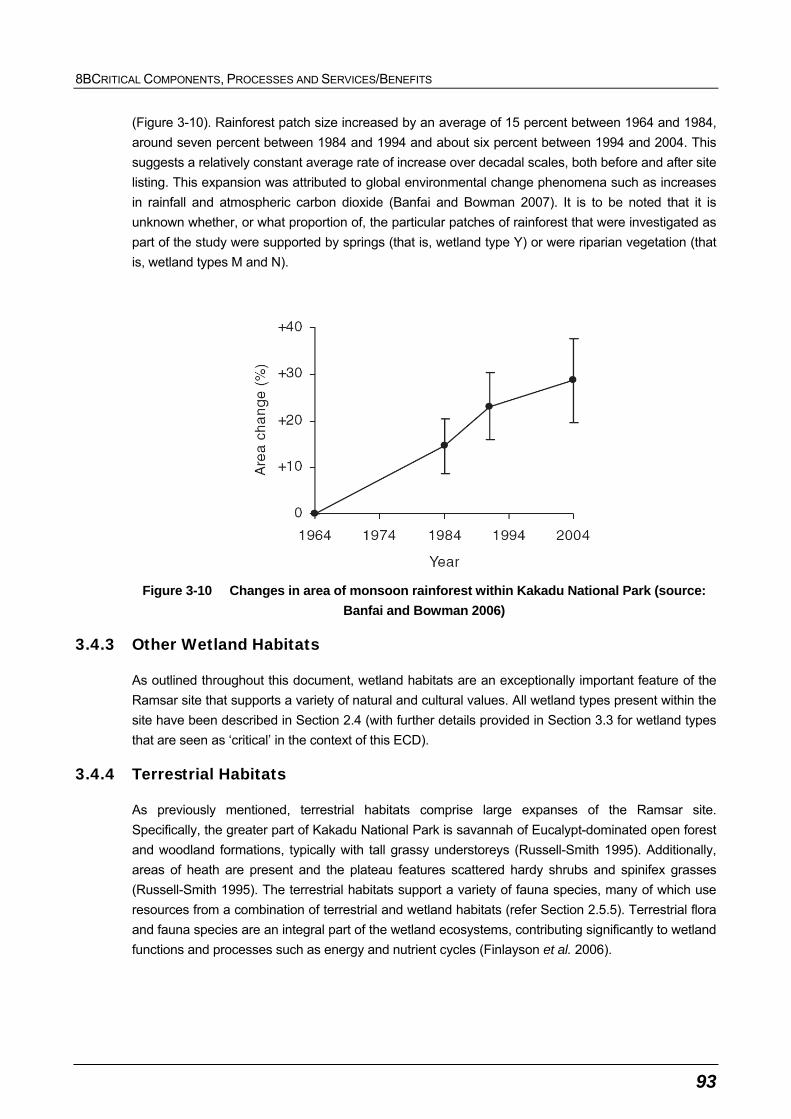
8BCRITICAL COMPONENTS, PROCESSES AND SERVICES/BENEFITS
93
(Figure 3-10). Rainforest patch size increased by an average of 15 percent between 1964 and 1984,
around seven percent between 1984 and 1994 and about six percent between 1994 and 2004. This
suggests a relatively constant average rate of increase over decadal scales, both before and after site
listing. This expansion was attributed to global environmental change phenomena such as increases
in rainfall and atmospheric carbon dioxide (Banfai and Bowman 2007). It is to be noted that it is
unknown whether, or what proportion of, the particular patches of rainforest that were investigated as
part of the study were supported by springs (that is, wetland type Y) or were riparian vegetation (that
is, wetland types M and N).
Figure 3-10 Changes in area of monsoon rainforest within Kakadu National Park (source:
Banfai and Bowman 2006)
3.4.3 Other Wetland Habitats
As outlined throughout this document, wetland habitats are an exceptionally important feature of the
Ramsar site that supports a variety of natural and cultural values. All wetland types present within the
site have been described in Section 2.4 (with further details provided in Section 3.3 for wetland types
that are seen as ‘critical’ in the context of this ECD).
3.4.4 Terrestrial Habitats
As previously mentioned, terrestrial habitats comprise large expanses of the Ramsar site.
Specifically, the greater part of Kakadu National Park is savannah of Eucalypt-dominated open forest
and woodland formations, typically with tall grassy understoreys (Russell-Smith 1995). Additionally,
areas of heath are present and the plateau features scattered hardy shrubs and spinifex grasses
(Russell-Smith 1995). The terrestrial habitats support a variety of fauna species, many of which use
resources from a combination of terrestrial and wetland habitats (refer Section 2.5.5). Terrestrial flora
and fauna species are an integral part of the wetland ecosystems, contributing significantly to wetland
functions and processes such as energy and nutrient cycles (Finlayson et al. 2006).
8BCRITICAL COMPONENTS, PROCESSES AND SERVICES/BENEFITS
94
3.4.5 Aquatic Invertebrates
Kakadu National Park supports highly diverse and abundant aquatic invertebrate populations
(Outridge 1987; Finlayson et al. 1990). Aquatic invertebrates are consumers that have a vital role in
the decomposition and uptake of nutrients in aquatic ecosystems, such that nutrients are processed
and available for higher consumers (that is species that prey on aquatic invertebrates). As discussed
in Section 3.5.5, some aquatic invertebrate species such as shrimp can have a particularly strong
influence on benthic foodwebs by influencing/processing benthic sediments, detritus and algal
communities.
In terms of aquatic invertebrates providing a valuable prey resource, almost half of the wetland bird
species eat swimming or bottom-dwelling aquatic invertebrates (Cowie et al. 2000). These food
resources are shared between species on the basis of foraging zones, foraging techniques and prey
size. A significant feature of the freshwater fish communities is that they typically lack specialist
herbivorous species and most fish species are largely carnivorous (Section 3.2.6) on aquatic
invertebrates as a significant feature of the freshwater fish communities is that they typically lack
specialist herbivorous species (Cowie et al. 2000). MacFarlane (1996) analysed community-based
data and found that predation by fish is non-selective of macroinvertebrate taxa. Invertebrates also
provide food for aquatic reptiles, with crustaceans in particular comprising a significant proportion of
the diets of freshwater and saltwater crocodiles (Section 3.3.7) and pig-nosed turtle (Section 3.2.10).
Aquatic invertebrate fauna can display vast seasonal differences, with species diversity and
distribution typically greatest during the wet season (Finlayson et al. 1990). Finlayson et al. (2006)
state that the major aquatic invertebrate families of Kakadu National Park have a high year-to-year
constancy compared with other regions of Australia, which is most likely related to the relatively low
degree of inter-annual variability in stream flow. Note that endemic aquatic invertebrates are
discussed in Critical Component 11 (refer Section 3.2.11).
3.4.6 Regionally Endemic Species
In addition to the local endemic invertebrate species, which represent critical components (see
Section 3.2.11), the site contains several regionally endemic species (see also Section 2.5.5). The
following aquatic species are considered regionally endemic, meaning they occur exclusively within
the Timor Sea Drainage Division):
Endemic species of Leptophlebiidae mayfly Tillyardophlebia dostinei, which has been recorded
from a single freshwater stream within the site (Rockhole Mine Creek, Dean and Suter 2004).
Dean and Suter (2004) suggest that this species is likely to be more widely distributed, with a
possible conspecific recorded at Manning Gorge in north Western Australia (Timor Sea Drainage
Division).
Seven of the nine species of the mayfly family Leptophlebiidae recorded in the Ramsar site are
thought to be restricted to the Timor Sea Drainage Division (Finlayson et al. 2006).
Magela hardyhead Craterocephalus marianae – This species has a highly restricted geographic
range, occurring within the South Alligator River and East Alligator River within the Ramsar site,
as well as the Mann River in nearby Arnhem Land (Allen et al. 2003). Allen et al. (2003) indicates
8BCRITICAL COMPONENTS, PROCESSES AND SERVICES/BENEFITS
95
that this species is abundant within its limited range, forming large schools in fast flowing, shallow
creeks with sand or gravel beds.
Midgley’s grunter Pingalla midgleyi – This species has a restricted distribution that incorporates
the East Alligator River and South Alligator River within the Ramsar site, as well as the upper
reaches of the Katherine River (Allen et al. 2003). It occurs in well shaded rocky pools in clear,
flowing creeks with a sandy bed. It is thought to be common where it occurs (Allen et al. 2003).
Exquisite rainbowfish Melanotaenia exquisita – This species has a disjunct distribution, and is
thought to be restricted to the South Alligator and Katherine Rivers within the Ramsar site, and
upland tributaries of the Edith River (Northern Territory) and the King George River (Western
Australia). This species typically inhabits small, clear, swift-flowing streams, often congregating in
rock pools at the base of small waterfalls such as Jim Jim Falls in the South Alligator system,
Seventeen Mile Falls in the Katherine system (located outside Kakadu National Park), and King
George Falls in Western Australia.
Sharp-nose grunter Syncomistes butleri – This species is restricted to the Timor Sea Drainage
Division between the Drysdale River (Western Australia) and the Liverpool River (Northern
Territory) (Allen et al. 2003). It is described as reasonably common in the upper reaches of the
large river systems in which it occurs, and is found in slow or fast moving water of lagoons and
streams, typically in deeper waters (Allen et al. 2003).
Bambusa arnhemica (Poaceae) – A bamboo species that is endemic to the high-rainfall north-
western areas of the Northern territory. The species is locally abundant in riparian vegetation, but
has a patchy distribution that includes the South Alligator River in Kakadu National Park, and
other major watercourses such as the Adelaide, Mary, Finniss and lower Daly Rivers (Franklin
and Bowman 2004).
Hygrochloa aquatica (Poaceae) – An aquatic grass species that floats from emerged tufts. This
species is endemic to the Top End, occurring from the Daly River to the East Alligator River, and
grows on the shallow margins of permanent and seasonal swamps, billabongs and floodplains
(Cowie et al. 2000).
Nymphoides spongiosa (Menyanthaceae) – An aquatic herb with floating leaves. The species
grows in still shallow, freshwater swamps, floodplains and lagoons in Kakadu National Park and
neighbouring regions (for example, Mary River, Howard River).
Nymphoides subacuta (Menyanthaceae) – An aquatic herb with floating leaves. The species
grows in shallow freshwater swamps and lagoons in Kakadu National Park and the Darwin
region.
3.5 Critical Processes
3.5.1 P1 – Fluvial Hydrology
Reason for Selection as ‘Critical’
Fluvial hydrology is one of the key drivers of ecosystems and species within the Ramsar site, and is
therefore fundamental to determining the site’s ecological character.
Description and Patterns in Variability

8BCRITICAL COMPONENTS, PROCESSES AND SERVICES/BENEFITS
96
It is not meaningful to discuss patterns in variability of fluid hydrology pre and post Ramsar listing for
several key reasons. Firstly, any one stream can intersect up to three of the Ramsar site Stages, so
different pre-listing dates (and baselines) could apply to a single stream. Secondly, patterns in rainfall
and hydrology vary greatly over a wide range of temporal scales, including decadal scale variations
(see Section 3.5.1). Given the limited amount of long-term data and taking into account these
complex longer term cycles, and that processes operating are greater than regional scales will
ultimately control hydrology (that is, weather conditions), descriptions of these patterns before and
after a time of listing is not meaningful. Patterns in hydrology for the overall data record are therefore
briefly described.
The main drainage systems of the Kakadu National Park region begin with run-off from the plateau or
start as springs at the foot of the Arnhem Land escarpment (Press et al. 1995b). Almost the entire
region is drained into Van Diemen Gulf by four main rivers including the East Alligator, South
Alligator, West Alligator and Wildman Rivers. The combined catchment area of the four major rivers is
about 28 000 square kilometres (Cobb et al. 2007).
The four rivers consist of distinctly different stages along their passage to the sea (Press et al.
1995b). The first stage consists of the rivers’ upper reaches, which typically follow arrow and deep
clefts in the sandstone. In the second river stage, the rivers broaden out into braided alluvial channels
in the low sandy plains after leaving the plateau country and adjacent hills. This region covers most of
Kakadu National Park. Four or more channels are typically separated by banks of loose sands and
reformed in times of high flood. These channels divide and distribute their water widely over the third
river stage, the expansive floodplains. The floodplains function as a large retarding basin, storing the
water up over the wet season and gradually releasing it. The final stage of the rivers is the estuary,
which is typically a relatively narrow tidal channel cutting through the floodplains. The South Alligator
River has the longest estuarine section, extending approximately 50 kilometres from the sea. The
estuarine channel banks are formed by silty levee banks often with a narrow ribbon of mangroves
and monsoon rainforest trees in the otherwise mostly treeless floodplains.
Due to the strong seasonality in rainfall in the region, catchment runoff also follows a pronounced
seasonal pattern with distinctive wetting up of the catchment in the early wet season followed by large
flood flows between January and March (refer Figure 3-11). Stream flows can vary to a large extent
due to the wet season rainfall patterns. Typically, wet season stream flows comprise a series of peak
flows superimposed on a base flow beginning about mid-December and ceasing about end of June
(Press et al. 1995b). At the mouths of the two largest rivers, the South and East Alligator Rivers, the
estimated annual flows are 2730 and 2560 million cubic metres, respectively. Estimated annual flows
for Magela and Nourlangie Creek are 245 and 680 million cubic metres, respectively. However, these
estimates may considerably underestimate potential discharges during extreme events (Cobb et al.
2007). Petty et al. (2008) reported that within the South Alligator River system, wet season flows vary
from being contained within steep banks approximately twenty metres across within the South
Alligator Valley near Gimbat, to a broad ‘sheet’ of water kilometres across flowing across the
floodplains north of Yellow Water.
By the end of the dry season perennial creeks still flow albeit at a much reduced level, whilst annual
creeks are generally dry but may still contain patches of stagnant water as well as billabongs within
the creek bed (Petty et al. 2008). Major streams in the catchment cease to flow for several months of
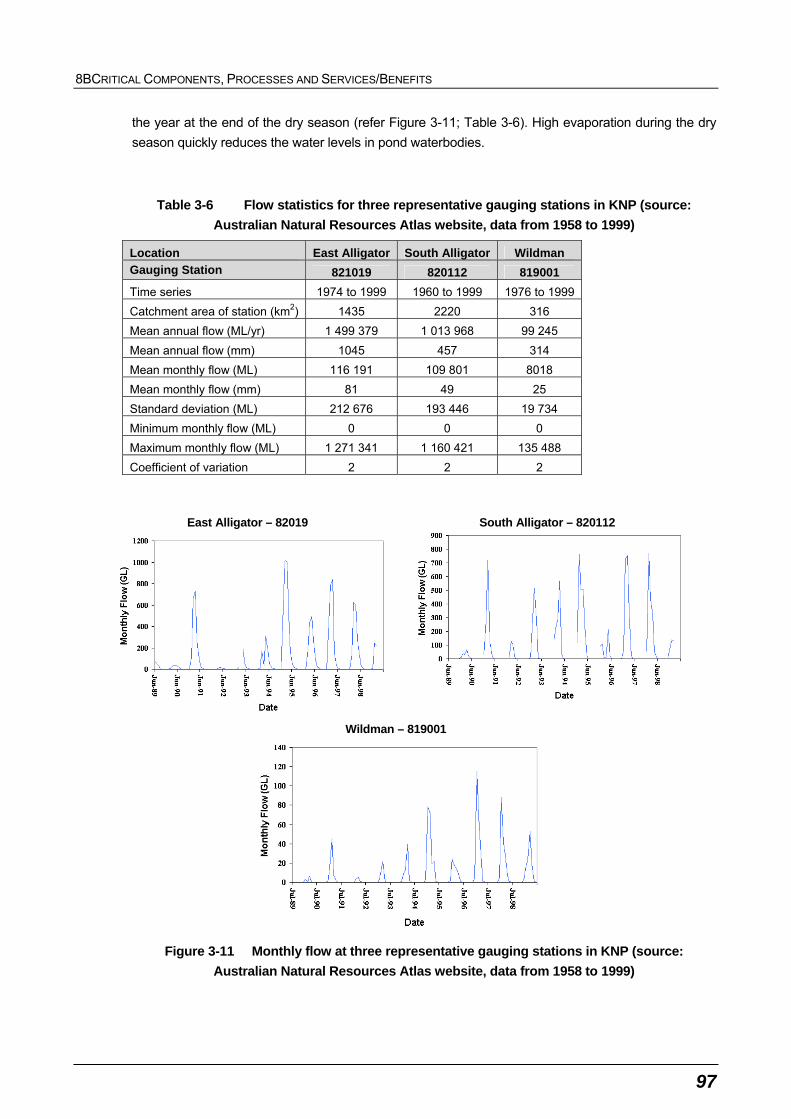
8BCRITICAL COMPONENTS, PROCESSES AND SERVICES/BENEFITS
97
the year at the end of the dry season (refer Figure 3-11; Table 3-6). High evaporation during the dry
season quickly reduces the water levels in pond waterbodies.
Table 3-6 Flow statistics for three representative gauging stations in KNP (source:
Australian Natural Resources Atlas website, data from 1958 to 1999)
Location East Alligator South Alligator Wildman
Gauging Station 821019 820112 819001
Time series 1974 to 1999 1960 to 1999 1976 to 1999
Catchment area of station (km2) 1435 2220 316
Mean annual flow (ML/yr) 1 499 379 1 013 968 99 245
Mean annual flow (mm) 1045 457 314
Mean monthly flow (ML) 116 191 109 801 8018
Mean monthly flow (mm) 81 49 25
Standard deviation (ML) 212 676 193 446 19 734
Minimum monthly flow (ML) 0 0 0
Maximum monthly flow (ML) 1 271 341 1 160 421 135 488
Coefficient of variation 2 2 2
East Alligator – 82019
South Alligator – 820112
Wildman – 819001
Figure 3-11 Monthly flow at three representative gauging stations in KNP (source:
Australian Natural Resources Atlas website, data from 1958 to 1999)
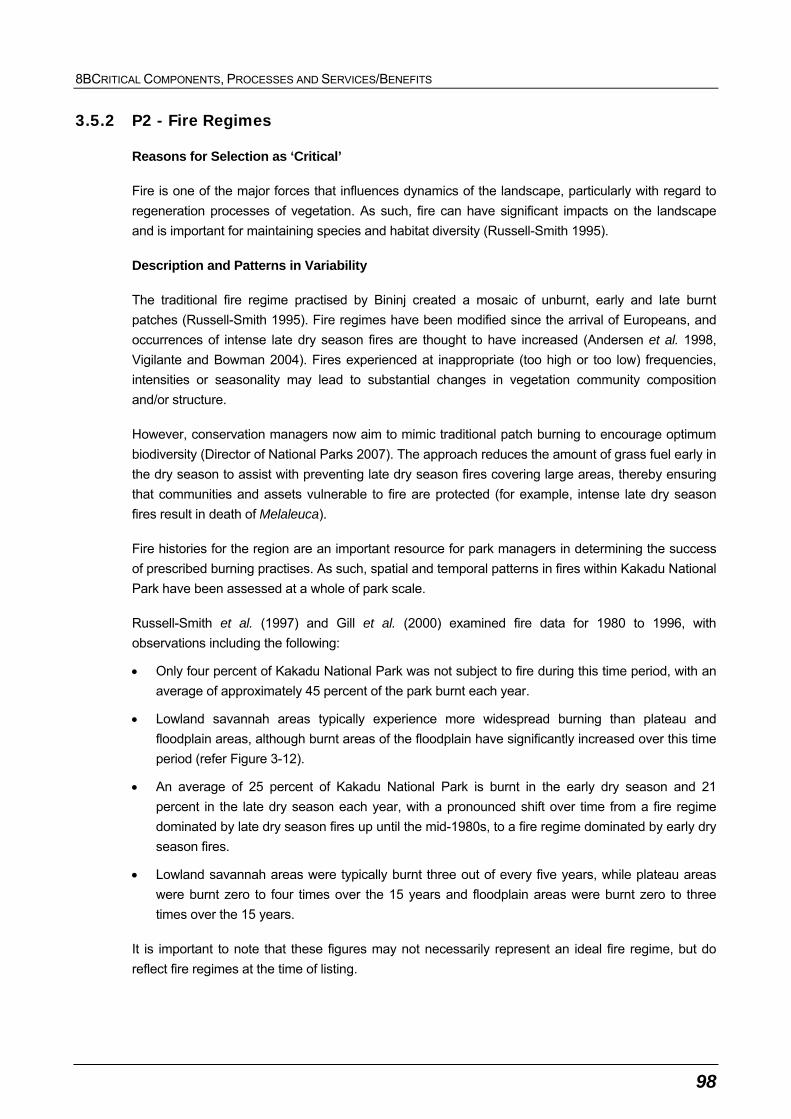
8BCRITICAL COMPONENTS, PROCESSES AND SERVICES/BENEFITS
98
3.5.2 P2 - Fire Regimes
Reasons for Selection as ‘Critical’
Fire is one of the major forces that influences dynamics of the landscape, particularly with regard to
regeneration processes of vegetation. As such, fire can have significant impacts on the landscape
and is important for maintaining species and habitat diversity (Russell-Smith 1995).
Description and Patterns in Variability
The traditional fire regime practised by Bininj created a mosaic of unburnt, early and late burnt
patches (Russell-Smith 1995). Fire regimes have been modified since the arrival of Europeans, and
occurrences of intense late dry season fires are thought to have increased (Andersen et al. 1998,
Vigilante and Bowman 2004). Fires experienced at inappropriate (too high or too low) frequencies,
intensities or seasonality may lead to substantial changes in vegetation community composition
and/or structure.
However, conservation managers now aim to mimic traditional patch burning to encourage optimum
biodiversity (Director of National Parks 2007). The approach reduces the amount of grass fuel early in
the dry season to assist with preventing late dry season fires covering large areas, thereby ensuring
that communities and assets vulnerable to fire are protected (for example, intense late dry season
fires result in death of Melaleuca).
Fire histories for the region are an important resource for park managers in determining the success
of prescribed burning practises. As such, spatial and temporal patterns in fires within Kakadu National
Park have been assessed at a whole of park scale.
Russell-Smith et al. (1997) and Gill et al. (2000) examined fire data for 1980 to 1996, with
observations including the following:
Only four percent of Kakadu National Park was not subject to fire during this time period, with an
average of approximately 45 percent of the park burnt each year.
Lowland savannah areas typically experience more widespread burning than plateau and
floodplain areas, although burnt areas of the floodplain have significantly increased over this time
period (refer Figure 3-12).
An average of 25 percent of Kakadu National Park is burnt in the early dry season and 21
percent in the late dry season each year, with a pronounced shift over time from a fire regime
dominated by late dry season fires up until the mid-1980s, to a fire regime dominated by early dry
season fires.
Lowland savannah areas were typically burnt three out of every five years, while plateau areas
were burnt zero to four times over the 15 years and floodplain areas were burnt zero to three
times over the 15 years.
It is important to note that these figures may not necessarily represent an ideal fire regime, but do
reflect fire regimes at the time of listing.
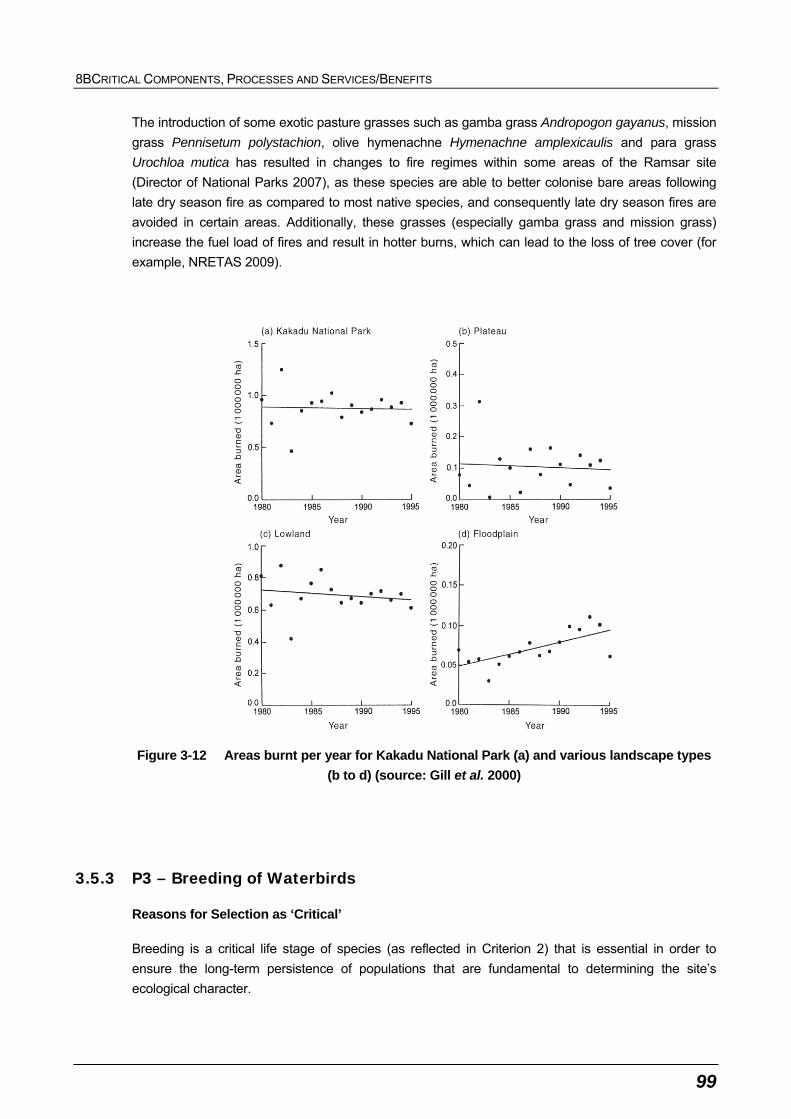
8BCRITICAL COMPONENTS, PROCESSES AND SERVICES/BENEFITS
99
The introduction of some exotic pasture grasses such as gamba grass Andropogon gayanus, mission
grass Pennisetum polystachion, olive hymenachne Hymenachne amplexicaulis and para grass
Urochloa mutica has resulted in changes to fire regimes within some areas of the Ramsar site
(Director of National Parks 2007), as these species are able to better colonise bare areas following
late dry season fire as compared to most native species, and consequently late dry season fires are
avoided in certain areas. Additionally, these grasses (especially gamba grass and mission grass)
increase the fuel load of fires and result in hotter burns, which can lead to the loss of tree cover (for
example, NRETAS 2009).
Figure 3-12 Areas burnt per year for Kakadu National Park (a) and various landscape types
(b to d) (source: Gill et al. 2000)
3.5.3 P3 – Breeding of Waterbirds
Reasons for Selection as ‘Critical’
Breeding is a critical life stage of species (as reflected in Criterion 2) that is essential in order to
ensure the long-term persistence of populations that are fundamental to determining the site’s
ecological character.

8BCRITICAL COMPONENTS, PROCESSES AND SERVICES/BENEFITS
100
Description
The most notable waterbird breeding colonies within the site are located within mangal communities
of the major rivers and floodplain freshwater marshes. Breeding sites within mangroves are used by a
variety of colonially nesting waterbirds (up to 12 species), though these multi-species colonies are
typically dominated by egrets and herons (Chatto 2000). Chatto (2000) found that the breeding period
for colonially nesting waterbirds (darters, cormorants, egrets, herons, spoonbills) extended throughout
the year, generally beginning in November and ending in as late as October. The highest estimated
annual usage of the five largest breeding colonies collectively amount to greater than 40 500 birds
(Chatto 2000). Key sites for colonially breeding birds are associated with the downstream estuarine
sections of both the East and South Alligator Rivers (southern and northern sides and within 15
kilometres of river mouth) (Chatto 2000). There are no seabird breeding colonies within the Ramsar
site (Chatto 2001).
Floodplain wetlands are important for nesting waterbirds, although only five species breed in large
numbers in the region (magpie geese Anseranas semipalmata, plumed whistling-duck Dendrocygna
eytoni, wandering whistling-duck Dendrocygna arcuata, radjah shellduck Tadorna radjah and comb-
crested jacana Irediparra gallinacea) (Bayliss and Yeomans 1990; Morton et al. 1991; Finlayson et al.
2006; Chatto 2006). Kakadu National Park’s importance as waterbird breeding habitat is highlighted
by the significant breeding aggregations of magpie geese throughout the floodplains of the site (up to
27 percent of the Northern Territory breeding population), with the South Alligator floodplains
regarded as the third most important area of nesting habitat after the Mary-Adelaide and Daly River
floodplains (Bayliss and Yeomans 1990). Waterbirds nest throughout floodplain wetlands during the
wet season, and whilst variations in breeding effort (and location of higher density nesting) have been
recorded between years, this is most likely to reflect local variations in rainfall (Frith and Davies 1961;
Bayliss and Yeomans 1990). Important sites for nesting waterbirds include:
South Alligator River upstream floodplains, including Boggy Plains (especially magpie geese) and
Leichhardt’s Lagoon (especially wandering whistling-duck).
East Alligator River downstream floodplains, including the area around the junction of East
Alligator River and Coopers Creek (especially radjah shelduck).
East Alligator River upstream floodplains, including Magela and Nourlangie Plains (especially for
magpie geese).
Waterbirds are more abundant as water levels drop during the dry season, with the bulk of species
increasing in numbers during the dry season (Morton et al. 1991). These birds largely migrate from
wetlands located to the south of the Ramsar site, including species such as the grey teal Anas
gracilis, pink-eared duck Malacorhynchus membranaceus, hardhead Aythya australis and purple
swamphen Porphyrio porphyrio. Magpie geese dominate the influx of waterbirds, concentrating
around permanent and semi-permanent waterbodies during the dry season, and dispersing to the
floodplains following significant rains at the start of the wet season (Whitehead 1998).
8BCRITICAL COMPONENTS, PROCESSES AND SERVICES/BENEFITS
101
Patterns in Variability
There are no available data to describe nesting densities and reproductive success, either before or
after declaration of the Ramsar site. Furthermore, although summary data are available from Birds
Australia, raw waterbird count data are not publicly available. Refer to Section 3.2.7 for a general
description of patterns in waterbird abundance.
3.5.4 P4 – Flatback Turtle Nesting
Reasons for Selection as ‘Critical’
Breeding is a critical life stage of species (as reflected in Criterion 2) that is essential in order to
ensure the long-term persistence of populations that are fundamental to determining the site’s
ecological character. The Ramsar site is considered critical in the context of maintaining the long-term
viability of the flatback turtle Natator depressus, and underpins Critical Service 1 (see Section 3.6.1).
Description
Flatback turtle Natator depressus is listed as vulnerable under the EPBC Act. This marine turtle
species is generally found feeding in subtidal coastal waters, unlike conditions found within the site
boundaries. Field Island is an important nesting area (Schäuble et al. 2006). In particular, the
beaches on the western side of the island are key breeding grounds, comprising the majority of
suitable nesting habitat in the region (Winderlich 1998, Schäuble et al. 2006). Field Island and
surrounding waters form one of six major nesting sites in Australia, identified in the Australian
Government Recovery Plan for Marine Turtles as ‘habitat critical to the survival of flatback turtles and
is a key marine turtle-monitoring site within a national monitoring framework’ (Environment Australia
2003).
In general, a female flatback turtle displays a strong fidelity to her chosen nesting beach, with most
females returning to the same beach within a nesting season and in successive nesting seasons
(Limpus 2007). In the Northern Territory, nesting density reaches a peak in July, although some
nesting may occur year-round (Fry in Limpus 2007). This dry season peak of nesting activity may be
adaptive to protect the eggs from the high sand temperatures that occur in the wet season (Guinea in
Limpus 2007).
Patterns in Variability
The key parameters describing this component are: (i) turtle nesting intensity indicators (number of
nesting attempts per night or individuals nesting per survey night) and (ii) clutch size and clutch
success. Turtle nesting patterns have been (and continue to be) monitored at Field Island annually.
Schäuble et al. (2006) reported monitoring program results for these (and other) indicators on an
annual basis between 1990 and 2001 (refer Figure 3-13), which is post-listing (Stage II 1989). Note
that there are no data describing breeding rates prior to site listing.
Figure 3-13 shows that the mean number of nesting attempts has remained relatively consistent over
time, whereas the maximum number of nesting attempts per night has tended to increase over time.
The number of nesting individuals was variable over time, which may reflect differences in sampling
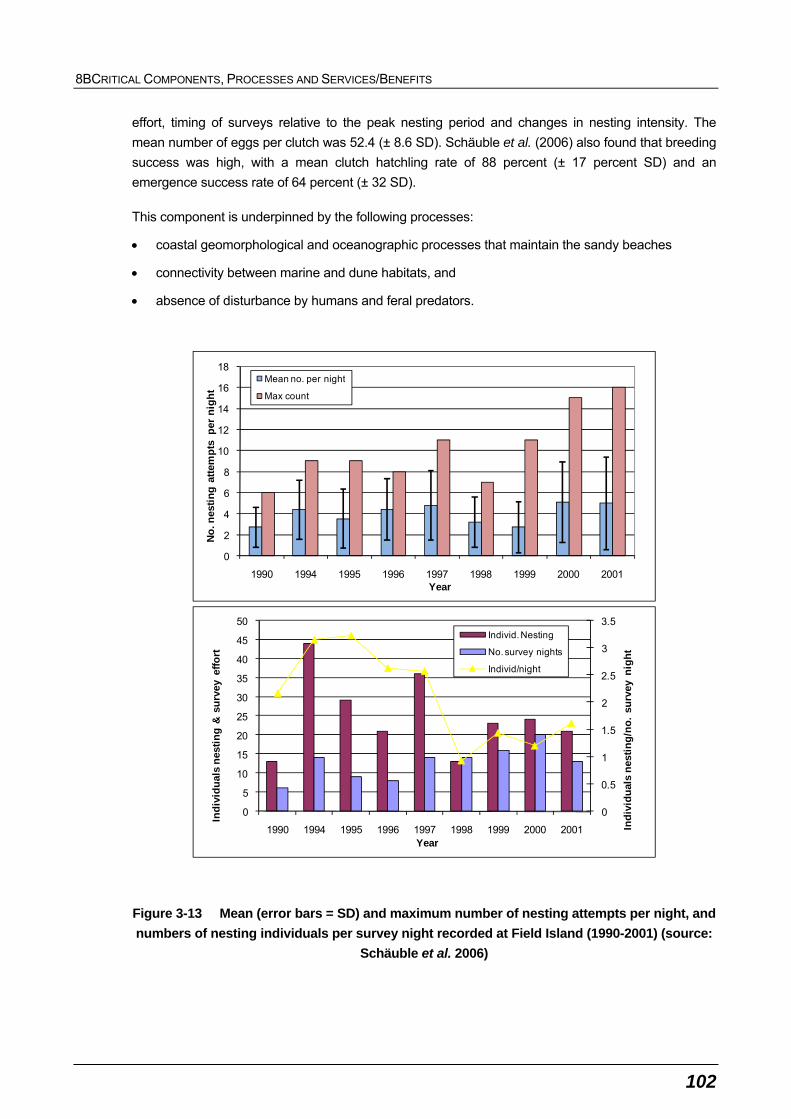
8BCRITICAL COMPONENTS, PROCESSES AND SERVICES/BENEFITS
102
effort, timing of surveys relative to the peak nesting period and changes in nesting intensity. The
mean number of eggs per clutch was 52.4 (± 8.6 SD). Schäuble et al. (2006) also found that breeding
success was high, with a mean clutch hatchling rate of 88 percent (± 17 percent SD) and an
emergence success rate of 64 percent (± 32 SD).
This component is underpinned by the following processes:
coastal geomorphological and oceanographic processes that maintain the sandy beaches
connectivity between marine and dune habitats, and
absence of disturbance by humans and feral predators.
0
2
4
6
8
10
12
14
16
18
1990 1994 1995 1996 1997 1998 1999 2000 2001
No
. nes
tin
g a
ttem
pts
per
nig
ht
Year
Mean no. per night
Max count
0
0.5
1
1.5
2
2.5
3
3.5
0
5
10
15
20
25
30
35
40
45
50
1990 1994 1995 1996 1997 1998 1999 2000 2001 Ind
ivid
ual
s n
esti
ng
/no
. su
rvey
nig
ht
Ind
ivid
ual
s n
esti
ng
& s
urv
ey e
ffo
rt
Year
Individ. Nesting
No. survey nights
Individ/night
Figure 3-13 Mean (error bars = SD) and maximum number of nesting attempts per night, and
numbers of nesting individuals per survey night recorded at Field Island (1990-2001) (source:
Schäuble et al. 2006)
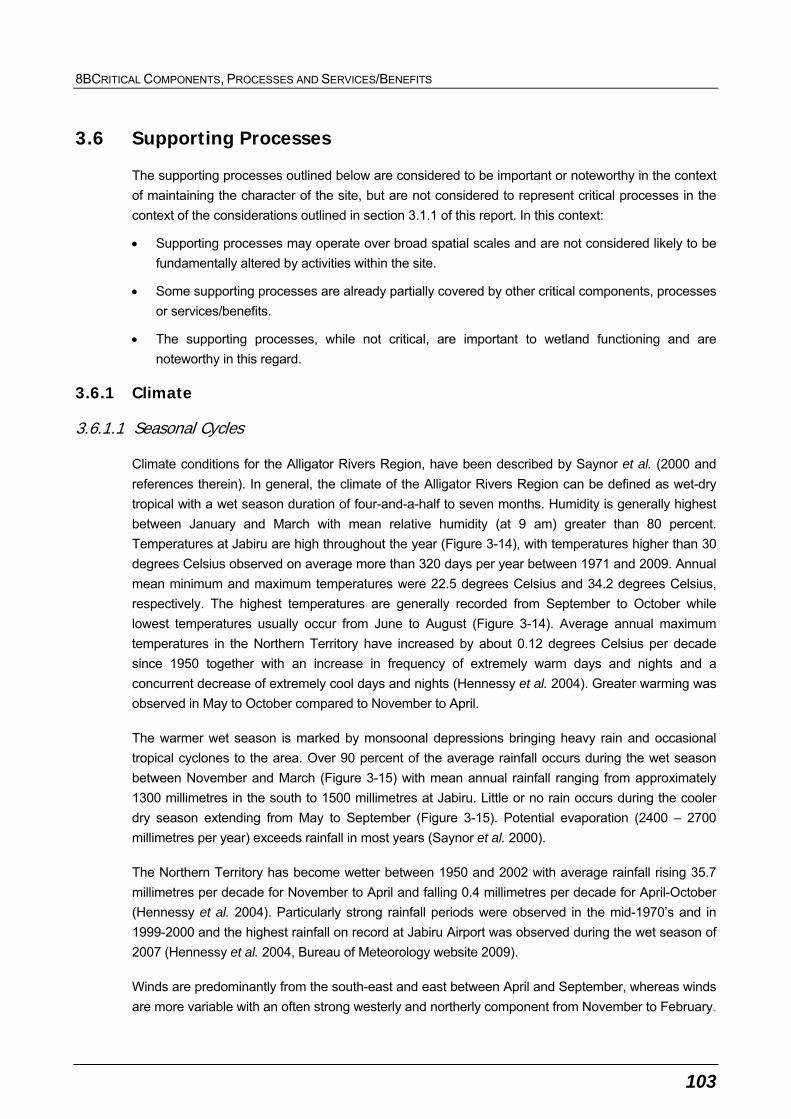
8BCRITICAL COMPONENTS, PROCESSES AND SERVICES/BENEFITS
103
3.6 Supporting Processes
The supporting processes outlined below are considered to be important or noteworthy in the context
of maintaining the character of the site, but are not considered to represent critical processes in the
context of the considerations outlined in section 3.1.1 of this report. In this context:
Supporting processes may operate over broad spatial scales and are not considered likely to be
fundamentally altered by activities within the site.
Some supporting processes are already partially covered by other critical components, processes
or services/benefits.
The supporting processes, while not critical, are important to wetland functioning and are
noteworthy in this regard.
3.6.1 Climate
3.6.1.1 Seasonal Cycles
Climate conditions for the Alligator Rivers Region, have been described by Saynor et al. (2000 and
references therein). In general, the climate of the Alligator Rivers Region can be defined as wet-dry
tropical with a wet season duration of four-and-a-half to seven months. Humidity is generally highest
between January and March with mean relative humidity (at 9 am) greater than 80 percent.
Temperatures at Jabiru are high throughout the year (Figure 3-14), with temperatures higher than 30
degrees Celsius observed on average more than 320 days per year between 1971 and 2009. Annual
mean minimum and maximum temperatures were 22.5 degrees Celsius and 34.2 degrees Celsius,
respectively. The highest temperatures are generally recorded from September to October while
lowest temperatures usually occur from June to August (Figure 3-14). Average annual maximum
temperatures in the Northern Territory have increased by about 0.12 degrees Celsius per decade
since 1950 together with an increase in frequency of extremely warm days and nights and a
concurrent decrease of extremely cool days and nights (Hennessy et al. 2004). Greater warming was
observed in May to October compared to November to April.
The warmer wet season is marked by monsoonal depressions bringing heavy rain and occasional
tropical cyclones to the area. Over 90 percent of the average rainfall occurs during the wet season
between November and March (Figure 3-15) with mean annual rainfall ranging from approximately
1300 millimetres in the south to 1500 millimetres at Jabiru. Little or no rain occurs during the cooler
dry season extending from May to September (Figure 3-15). Potential evaporation (2400 – 2700
millimetres per year) exceeds rainfall in most years (Saynor et al. 2000).
The Northern Territory has become wetter between 1950 and 2002 with average rainfall rising 35.7
millimetres per decade for November to April and falling 0.4 millimetres per decade for April-October
(Hennessy et al. 2004). Particularly strong rainfall periods were observed in the mid-1970’s and in
1999-2000 and the highest rainfall on record at Jabiru Airport was observed during the wet season of
2007 (Hennessy et al. 2004, Bureau of Meteorology website 2009).
Winds are predominantly from the south-east and east between April and September, whereas winds
are more variable with an often strong westerly and northerly component from November to February.
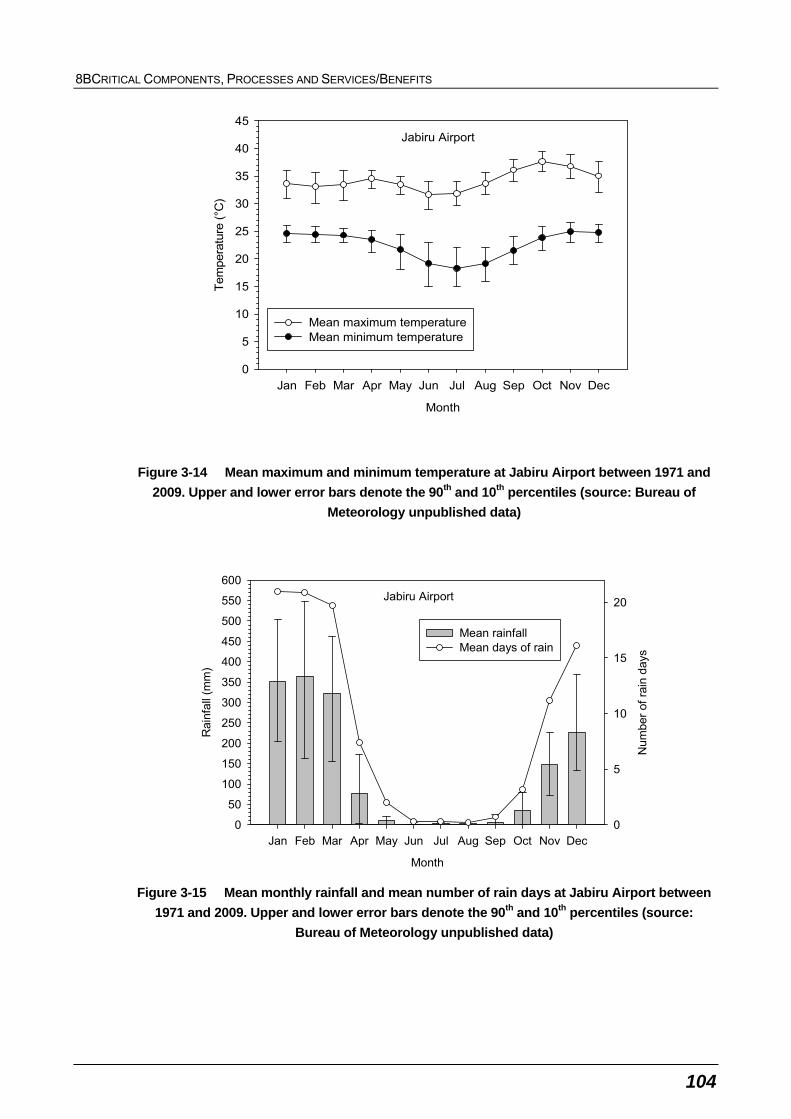
8BCRITICAL COMPONENTS, PROCESSES AND SERVICES/BENEFITS
104
Jabiru Airport
Month
Jan Feb Mar Apr May Jun Jul Aug Sep Oct Nov Dec
Tem
pera
ture
(°C
)
0
5
10
15
20
25
30
35
40
45
Mean maximum temperatureMean minimum temperature
Figure 3-14 Mean maximum and minimum temperature at Jabiru Airport between 1971 and
2009. Upper and lower error bars denote the 90th and 10th percentiles (source: Bureau of
Meteorology unpublished data)
Jabiru Airport
Month
Jan Feb Mar Apr May Jun Jul Aug Sep Oct Nov Dec
Rai
nfall
(mm
)
0
50
100
150
200
250
300
350
400
450
500
550
600
Num
ber
of r
ain
day
s
0
5
10
15
20
Mean rainfall Mean days of rain
Figure 3-15 Mean monthly rainfall and mean number of rain days at Jabiru Airport between
1971 and 2009. Upper and lower error bars denote the 90th and 10th percentiles (source:
Bureau of Meteorology unpublished data)
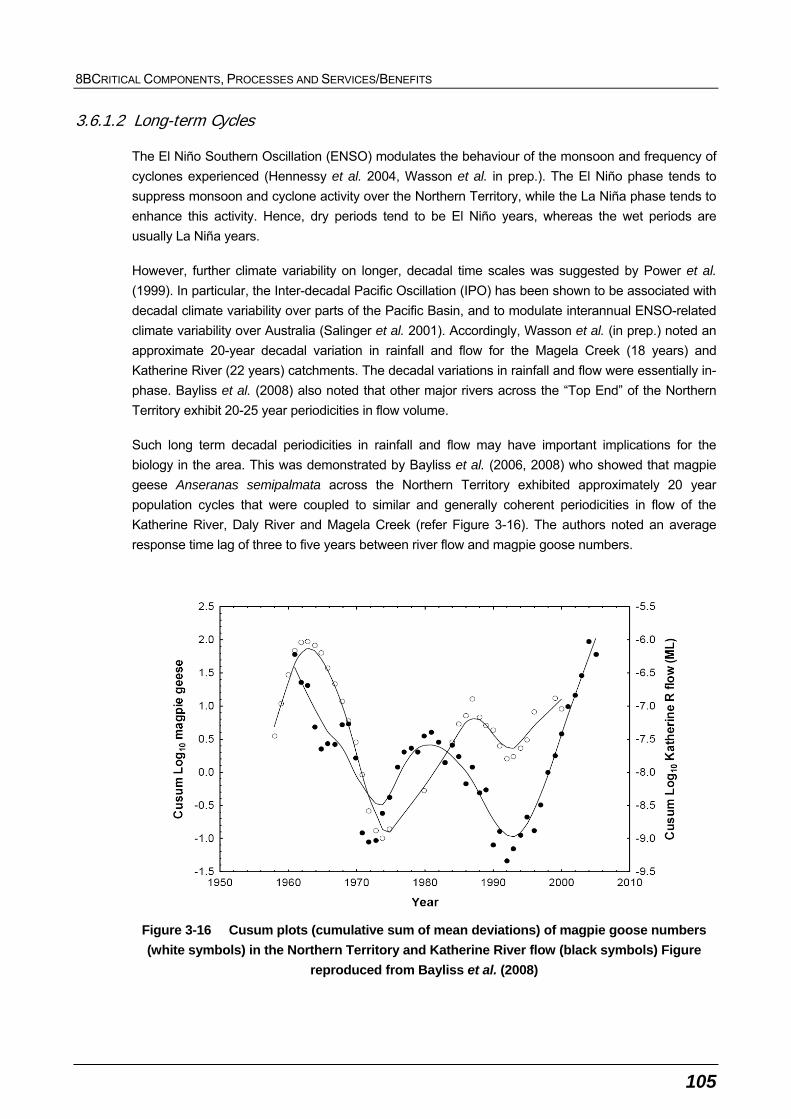
8BCRITICAL COMPONENTS, PROCESSES AND SERVICES/BENEFITS
105
3.6.1.2 Long-term Cycles
The El Niño Southern Oscillation (ENSO) modulates the behaviour of the monsoon and frequency of
cyclones experienced (Hennessy et al. 2004, Wasson et al. in prep.). The El Niño phase tends to
suppress monsoon and cyclone activity over the Northern Territory, while the La Niña phase tends to
enhance this activity. Hence, dry periods tend to be El Niño years, whereas the wet periods are
usually La Niña years.
However, further climate variability on longer, decadal time scales was suggested by Power et al.
(1999). In particular, the Inter-decadal Pacific Oscillation (IPO) has been shown to be associated with
decadal climate variability over parts of the Pacific Basin, and to modulate interannual ENSO-related
climate variability over Australia (Salinger et al. 2001). Accordingly, Wasson et al. (in prep.) noted an
approximate 20-year decadal variation in rainfall and flow for the Magela Creek (18 years) and
Katherine River (22 years) catchments. The decadal variations in rainfall and flow were essentially in-
phase. Bayliss et al. (2008) also noted that other major rivers across the “Top End” of the Northern
Territory exhibit 20-25 year periodicities in flow volume.
Such long term decadal periodicities in rainfall and flow may have important implications for the
biology in the area. This was demonstrated by Bayliss et al. (2006, 2008) who showed that magpie
geese Anseranas semipalmata across the Northern Territory exhibited approximately 20 year
population cycles that were coupled to similar and generally coherent periodicities in flow of the
Katherine River, Daly River and Magela Creek (refer Figure 3-16). The authors noted an average
response time lag of three to five years between river flow and magpie goose numbers.
Figure 3-16 Cusum plots (cumulative sum of mean deviations) of magpie goose numbers
(white symbols) in the Northern Territory and Katherine River flow (black symbols) Figure
reproduced from Bayliss et al. (2008)
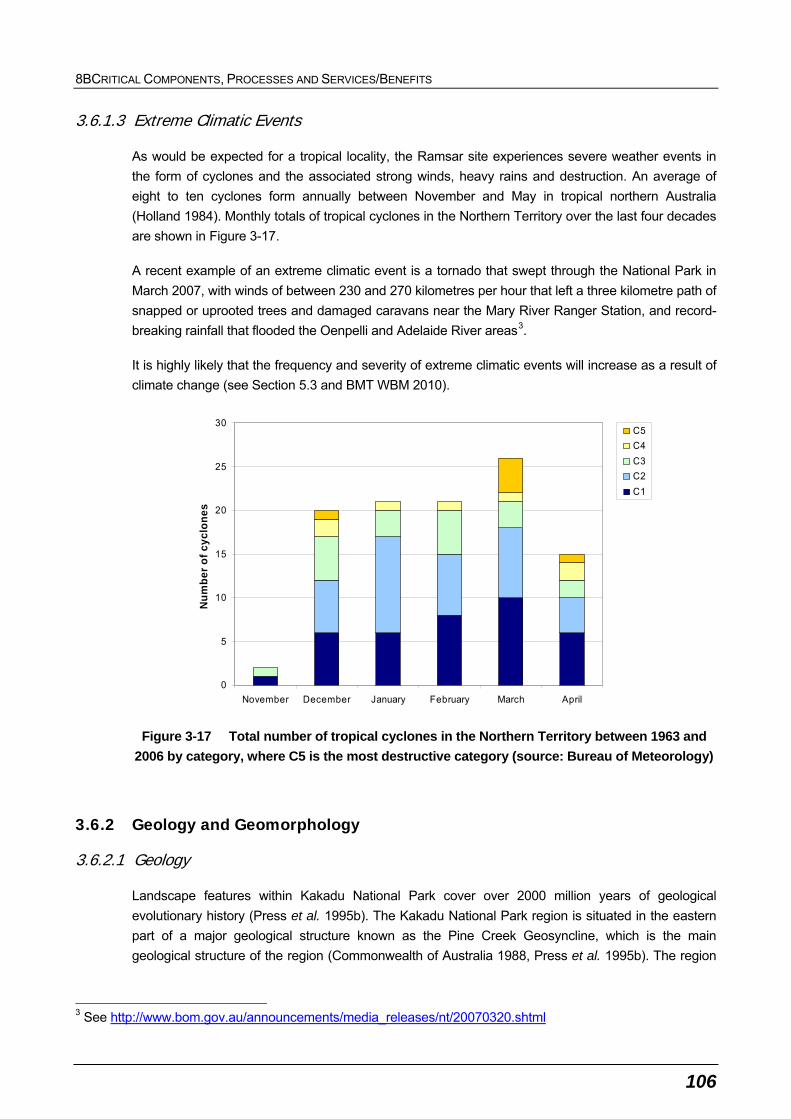
8BCRITICAL COMPONENTS, PROCESSES AND SERVICES/BENEFITS
106
3.6.1.3 Extreme Climatic Events
As would be expected for a tropical locality, the Ramsar site experiences severe weather events in
the form of cyclones and the associated strong winds, heavy rains and destruction. An average of
eight to ten cyclones form annually between November and May in tropical northern Australia
(Holland 1984). Monthly totals of tropical cyclones in the Northern Territory over the last four decades
are shown in Figure 3-17.
A recent example of an extreme climatic event is a tornado that swept through the National Park in
March 2007, with winds of between 230 and 270 kilometres per hour that left a three kilometre path of
snapped or uprooted trees and damaged caravans near the Mary River Ranger Station, and record-
breaking rainfall that flooded the Oenpelli and Adelaide River areas3.
It is highly likely that the frequency and severity of extreme climatic events will increase as a result of
climate change (see Section 5.3 and BMT WBM 2010).
0
5
10
15
20
25
30
November December January February March April
Nu
mb
er
of
cy
clo
ne
s
C5
C4
C3
C2
C1
Figure 3-17 Total number of tropical cyclones in the Northern Territory between 1963 and
2006 by category, where C5 is the most destructive category (source: Bureau of Meteorology)
3.6.2 Geology and Geomorphology
3.6.2.1 Geology
Landscape features within Kakadu National Park cover over 2000 million years of geological
evolutionary history (Press et al. 1995b). The Kakadu National Park region is situated in the eastern
part of a major geological structure known as the Pine Creek Geosyncline, which is the main
geological structure of the region (Commonwealth of Australia 1988, Press et al. 1995b). The region
3 See http://www.bom.gov.au/announcements/media_releases/nt/20070320.shtml
8BCRITICAL COMPONENTS, PROCESSES AND SERVICES/BENEFITS
107
provides a favourable setting for mineral deposits of economic significance, particularly in the eastern
part.
In the historic Stage I and Stage II areas of Kakadu National Park, the mineralisation is mainly located
in a rock formation known as the Cahill Formation, which includes the Ranger, Jabiluka and
Koongarra uranium deposits. The Cahill Formation is considered a major uranium deposit on a world
scale, but exploration indicated the presence of a range of metals, including gold (Commonwealth of
Australia 1988). Mineralisation in the Stage III area of the region is primarily located in a series of rock
formations known as the El Sherana Group and includes gold, platinum and minor uranium deposits.
While the area is regarded as highly prospective for mineral exploration, the rock formations are often
masked by younger overlying sequences, including the sandstones forming the Arnhem Land
escarpment. The sandstone formations of the Arnhem Land escarpment date back about 1700
million years and can be up to 300 metres in depth. Erosion of the younger rocks has resulted in a
deep soil cover over much of the region, which is about 40 metres deep. However, the tectonic
stability and antiquity of the landscape resulted in deep weathering of the rocks forming strongly
leached and relatively infertile soils (Press et al. 1995b). Together with the pronounced rainfall
seasonality, this has markedly influenced flora and fauna development in the region.
In contrast, the extensive coastal and riverine alluvial plains are of recent origin, often dating back no
more than a few thousand years (Press et al. 1995b). These recent landforms are a result of
sediment deposition in drowned river valleys associated with sea level stabilisation at about its
present level ca. 6000 years ago. Hence, the deeper saline sediments underlying the floodplains are
overlain by brackish, organic-rich, acidic soils, which support the freshwater wetlands (Press et al.
1995b).
3.6.2.2 Geomorphology
Rivers in the Northern Territory have several morphological phases and move from one phase to
another as they respond to tidal pressure and seasonal freshwater runoff (Chappell and Woodroffe
1984, Petty et al. 2005). Different longitudinal regions of the rivers will exhibit distinct morphological
features depending on the state of development of the particular region (Figure 3-18).
Because the flooding tide has higher peak velocities than the ebbing tide, a much higher sediment
load can be transported during floods. This sediment is deposited along the tidal channels, gradually
forming mud levees at the upper estuary (refer Figure 3-18). These levees contain the channel,
prevent further saltwater penetration and impound freshwater in large wetlands (Petty et al. 2005).
During the course of the dry season, the salinity of these wetlands will increase, and in some areas
will become quite brackish.
The annual freshwater impoundment maintains the low salinity soil surface of the wetlands, overlying
a highly saline subsoil region. Without the impoundment, subsoil salt may emerge resulting in
widespread die-off of freshwater species.
Some notable morphological features formed in recent times (several thousand years) include
palaeo-channels, dendritic channels and billabongs, which generally form in palaeo-channels.
Palaeo-channels are remnant tidal channels that were active during the mid-Holocene, and have

8BCRITICAL COMPONENTS, PROCESSES AND SERVICES/BENEFITS
108
since been partially or completely infilled by deposition of tidal sediments (Woodroffe and Mulrennan
1993). They are apparent as billabongs, freshwater swamps and wetlands. As palaeo-channels are
some of the lowest-lying topography within a coastal floodplain, they are particularly vulnerable to
saltwater intrusion. The intrusion of saltwater can result in the death of freshwater vegetation and
development of bare surfaces susceptible to aeolian (wind blown) erosion.

8BCRITICAL COMPONENTS, PROCESSES AND SERVICES/BENEFITS
109
Figure 3-18 Typical cross section of (top) upper estuary and (bottom) lower estuary
8BCRITICAL COMPONENTS, PROCESSES AND SERVICES/BENEFITS
110
3.6.3 Tidal Hydraulics
Tidal processes of rivers in the region have been described in detail by Vertessy (1990) and are
summarised here. In the South Alligator River, the largest river within the site, the tidal component
extends from the mouth in Van Diemen Gulf to just downstream of Yellow Water for a distance of
about 105 kilometres. The maximum range in tide height at the mouth is 5.8 metres. Comparable
values at other stations along the South Alligator River indicate that there is only minor attenuation of
tidal amplitude with distance from the sea over most of the river.
Tides are moderately asymmetric at the mouth (that is, not equal in duration), with spring tide ebb and
flood durations of approximately 415 and 320 minutes and neap tide ebb and flood durations of 410
and 325 minutes, respectively. Ebb/flood duration and velocity become increasingly asymmetric with
distance from the mouth, with flood tides having shorter durations and higher peak velocities. In the
mid and upstream reaches flood current velocities approach two metres per second, whereas ebb
current velocities rarely exceed one metre per second. Due to the shorter flood tide with a steeper
gradient, the flood tide can carry a much higher sediment load than the ebb tide, consequently
resulting in sediment transported up the river.
Storm surges induced by cyclonic winds in the order of four metres are another major influence on
water levels at the mouth of the South Alligator River. This increase in water level is added to the
existing tide level at the time of the cyclone to give a combined storm tide level. Because of the
random nature of the combination of tide and storm surge, however, this level is not necessarily
above the Highest Astronomical Tide level (HAT) for the river. With regards to salinity, flows
experienced during the wet season are sufficient to flush the tidal channel to fresh water levels over
almost the full length of the estuary (see BMT WBM 2010).
3.6.4 Water Quality
Description and Patterns in Variability
Only limited water quality data are available from the Alligator Rivers Region. While water quality data
are available from a number of stations within the Magela Creek catchment in the eastern part of
Kakadu National Park, only little information on water quality is available from the western and middle
sections of the site (Figure 3-19). Most of the data were collected between the early 1970s and mid-
1980s. Since this time, there has been some intensive monitoring in selected waterways in the
Magela floodplain; however there has been comparatively little water quality data collection
elsewhere in the site.
Freshwaters
There are no regional or local water quality guidelines for the Ramsar site. Therefore, available water
quality data have been compared with ANZECC/ARMCANZ (2000) guidelines values. However, it is
to be noted that the ANZECC guidelines are not based on regional reference values and
consequently any non-conformity with the ANZECC guidelines does not necessarily represent a
change in ecological character (refer Section 4.3).
8BCRITICAL COMPONENTS, PROCESSES AND SERVICES/BENEFITS
111
Table 3-7 shows a comparison of the 20th and 80th percentiles of available water quality data with
ANZECC/ARMCANZ (2000) guideline values. It is noted from this data that the water in streams of
the region are fairly acidic, with the 20th percentile of pH often below the ANZECC guideline value.
Relatively high acidity is especially notable for stations along the Magela Creek Plain, characterised
by acid sulfate soils and where extremely acidic “first flushes” after the dry season are commonly
observed events (Willett 2008).
While no information on nutrient concentrations is available for the upland stations of the region, the
90th percentile of nutrient concentrations often exceeded ANZECC guideline values at the lowland
stations (Table 3-7). Notably high 80th percentile nutrient concentrations were recorded at stations
within the Magela Creek catchment, a region characterised by a number of backflow, channel and
flood plain billabongs (Hart and McGregor 1980). Concurrent with increased nutrient concentrations,
elevated 80th percentiles of conductivity, turbidity and chlorophyll a and relatively low 20th percentiles
of dissolved oxygen were recorded at these stations (refer Table 3-7). In line with these findings, Hart
and McGregor (1980) showed that billabong waters in the Magela Creek catchment had elevated
conductivity, turbidity, nutrient and chlorophyll a concentrations at the end of the dry season. A
significant improvement in water quality with commencement of the wet season and flushing of the
billabongs was noted. The authors also demonstrated that billabong waters became significantly
depleted in dissolved oxygen when mixing of the water column did not occur for several days under
certain conditions.
In support of these results, Figure 3-20 shows the seasonality in water quality parameters at a site
within the Magela Creek catchment. Conductivity is generally higher around the end of the dry
season, concurrent with an increase in nutrient concentrations. Based on these results, evapo-
concentration is the likely mechanism that leads to the observed increase in nutrient and ion
concentrations in the Magela Creek catchment. As a result of increased nutrient supply, chlorophyll
concentrations may increase within the billabongs. With the onset of wet season flushing, nutrient
concentrations are diluted as demonstrated by the concurrent decrease in conductivity values (Figure
3-20).
Townsend and Douglas (2000) investigated the effect of different fire regimes on stream water quality
in Kakadu National Park in three Eucalypt-dominated open-forest catchments. The authors found that
fires lit in the late dry season reduced canopy cover, riparian tree density and increased the amounts
of bare ground, thereby increasing erosion. Accordingly, Townsend and Douglas (2000) found that
storm runoff concentrations of suspended sediments, iron and manganese were two to five times
higher after late dry season fires. In contrast, fires lit during the early dry season had an overall
negligible effect on wet season stream water quality, except possibly for a small increase in nitrogen
concentrations and loads (Townsend and Douglas 2004).
Estuarine and Marine Waters
There are no available empirical data describing the water quality of estuarine and marine waters.
This is considered an important information gap.
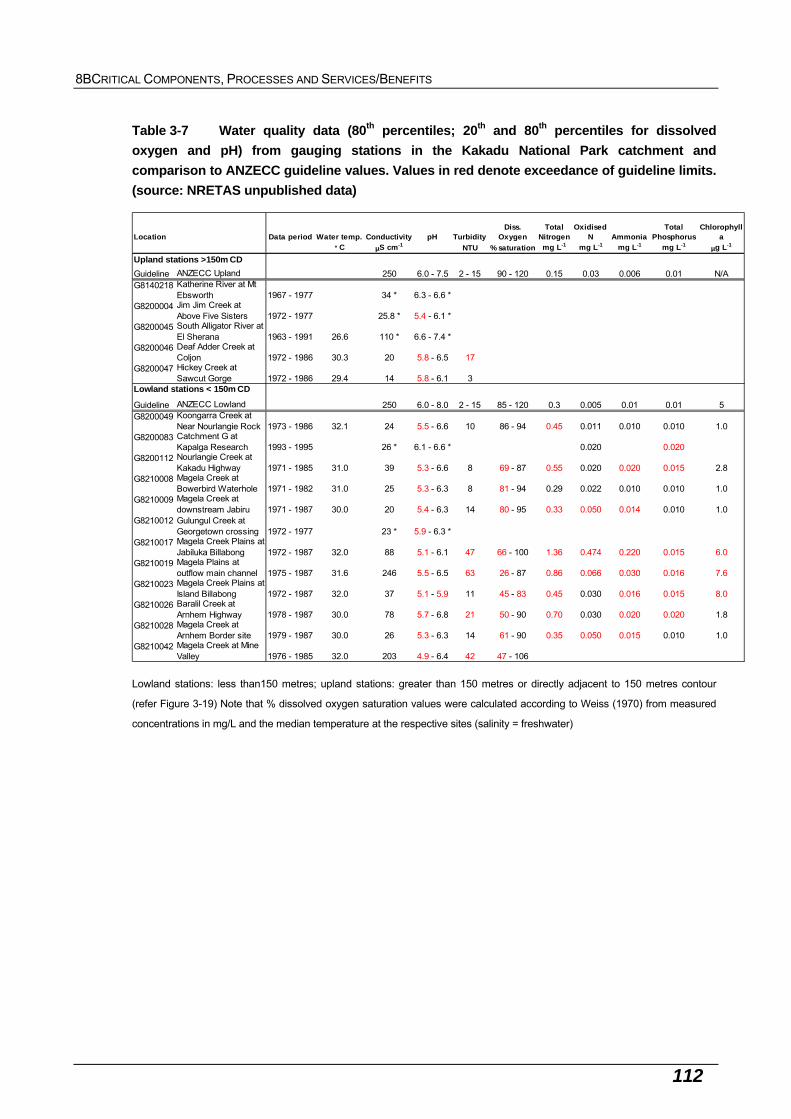
8BCRITICAL COMPONENTS, PROCESSES AND SERVICES/BENEFITS
112
Table 3-7 Water quality data (80th percentiles; 20th and 80th percentiles for dissolved
oxygen and pH) from gauging stations in the Kakadu National Park catchment and
comparison to ANZECC guideline values. Values in red denote exceedance of guideline limits.
(source: NRETAS unpublished data)
Location Data period Water temp. Conductivity pH TurbidityDiss.
OxygenTotal
NitrogenOxidised
N AmmoniaTotal
PhosphorusChlorophyll
a
° C μS cm-1 NTU % saturation mg L-1 mg L-1 mg L-1 mg L-1μg L-1
Upland stations >150m CD
Guideline ANZECC Upland 250 6.0 - 7.5 2 - 15 90 - 120 0.15 0.03 0.006 0.01 N/AG8140218 Katherine River at Mt
Ebsworth 1967 - 1977 34 * 6.3 - 6.6 *G8200004 Jim Jim Creek at
Above Five Sisters 1972 - 1977 25.8 * 5.4 - 6.1 *G8200045 South Alligator River at
El Sherana 1963 - 1991 26.6 110 * 6.6 - 7.4 *G8200046 Deaf Adder Creek at
Coljon 1972 - 1986 30.3 20 5.8 - 6.5 17G8200047 Hickey Creek at
Sawcut Gorge 1972 - 1986 29.4 14 5.8 - 6.1 3Lowland stations < 150m CD
Guideline ANZECC Lowland 250 6.0 - 8.0 2 - 15 85 - 120 0.3 0.005 0.01 0.01 5G8200049 Koongarra Creek at
Near Nourlangie Rock 1973 - 1986 32.1 24 5.5 - 6.6 10 86 - 94 0.45 0.011 0.010 0.010 1.0G8200083 Catchment G at
Kapalga Research 1993 - 1995 26 * 6.1 - 6.6 * 0.020 0.020G8200112 Nourlangie Creek at
Kakadu Highway 1971 - 1985 31.0 39 5.3 - 6.6 8 69 - 87 0.55 0.020 0.020 0.015 2.8G8210008 Magela Creek at
Bowerbird Waterhole 1971 - 1982 31.0 25 5.3 - 6.3 8 81 - 94 0.29 0.022 0.010 0.010 1.0G8210009 Magela Creek at
downstream Jabiru 1971 - 1987 30.0 20 5.4 - 6.3 14 80 - 95 0.33 0.050 0.014 0.010 1.0G8210012 Gulungul Creek at
Georgetown crossing 1972 - 1977 23 * 5.9 - 6.3 *G8210017 Magela Creek Plains at
Jabiluka Billabong 1972 - 1987 32.0 88 5.1 - 6.1 47 66 - 100 1.36 0.474 0.220 0.015 6.0G8210019 Magela Plains at
outflow main channel 1975 - 1987 31.6 246 5.5 - 6.5 63 26 - 87 0.86 0.066 0.030 0.016 7.6G8210023 Magela Creek Plains at
Island Billabong 1972 - 1987 32.0 37 5.1 - 5.9 11 45 - 83 0.45 0.030 0.016 0.015 8.0G8210026 Baralil Creek at
Arnhem Highway 1978 - 1987 30.0 78 5.7 - 6.8 21 50 - 90 0.70 0.030 0.020 0.020 1.8G8210028 Magela Creek at
Arnhem Border site 1979 - 1987 30.0 26 5.3 - 6.3 14 61 - 90 0.35 0.050 0.015 0.010 1.0G8210042 Magela Creek at Mine
Valley 1976 - 1985 32.0 203 4.9 - 6.4 42 47 - 106
Lowland stations: less than150 metres; upland stations: greater than 150 metres or directly adjacent to 150 metres contour
(refer Figure 3-19) Note that % dissolved oxygen saturation values were calculated according to Weiss (1970) from measured
concentrations in mg/L and the median temperature at the respective sites (salinity = freshwater)
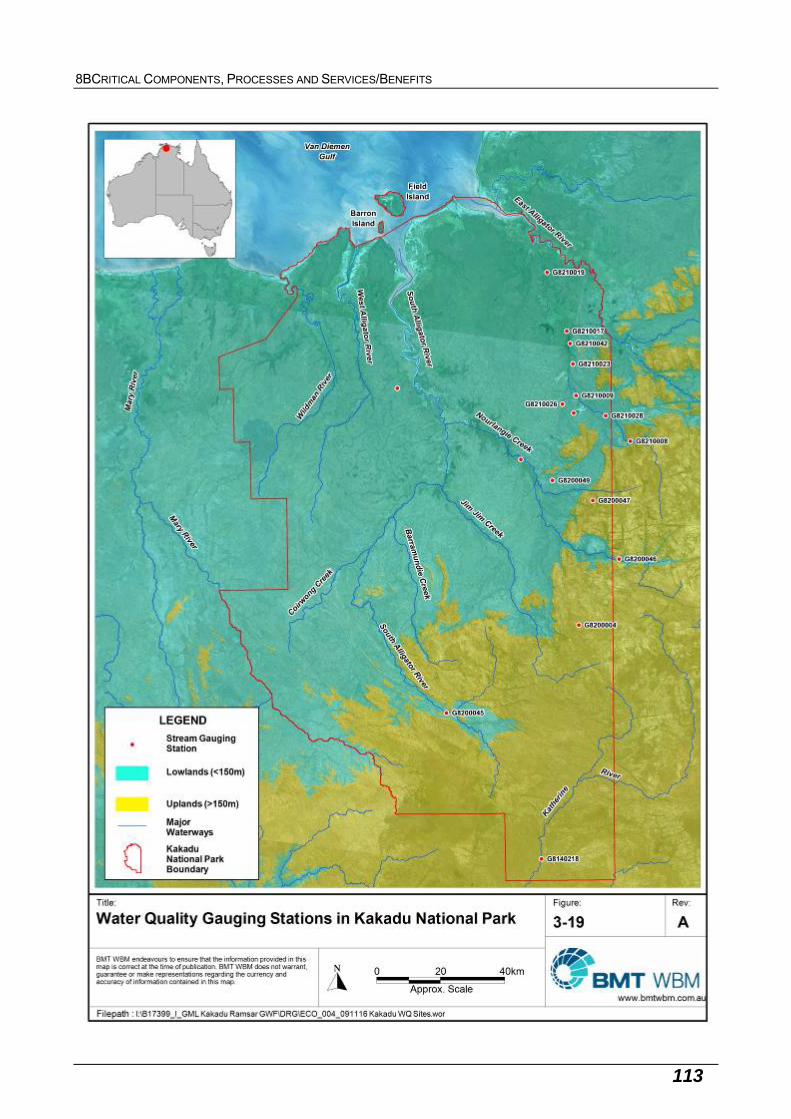
8BCRITICAL COMPONENTS, PROCESSES AND SERVICES/BENEFITS
113
I:\B17399_I_GML Kakadu Ramsar GWF\DRG\ECO_004_091116 Kakadu WQ Sites.wor
Figure 3-19 Water quality gauging stations in Kakadu National Park
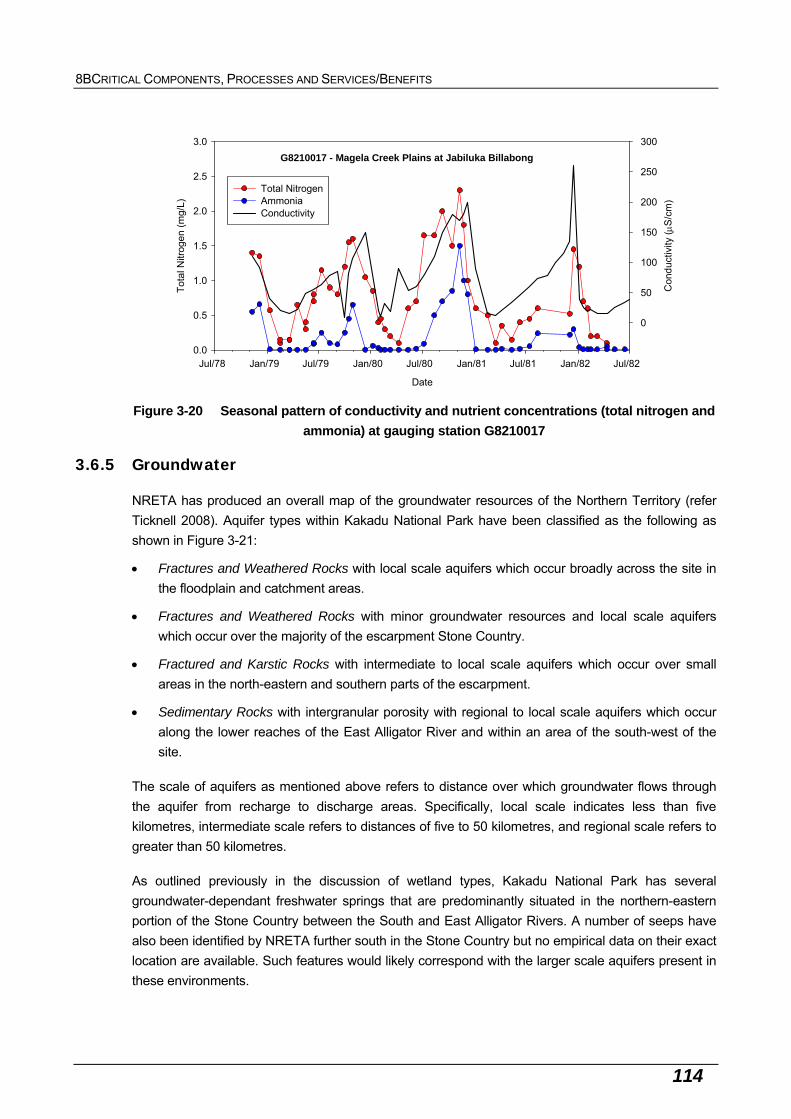
8BCRITICAL COMPONENTS, PROCESSES AND SERVICES/BENEFITS
114
G8210017 - Magela Creek Plains at Jabiluka Billabong
Date
Jul/78 Jan/79 Jul/79 Jan/80 Jul/80 Jan/81 Jul/81 Jan/82 Jul/82
Tot
al N
itrog
en (
mg/
L)
0.0
0.5
1.0
1.5
2.0
2.5
3.0
Con
duc
tivity
(S
/cm
)
0
50
100
150
200
250
300
Total NitrogenAmmoniaConductivity
Figure 3-20 Seasonal pattern of conductivity and nutrient concentrations (total nitrogen and
ammonia) at gauging station G8210017
3.6.5 Groundwater
NRETA has produced an overall map of the groundwater resources of the Northern Territory (refer
Ticknell 2008). Aquifer types within Kakadu National Park have been classified as the following as
shown in Figure 3-21:
Fractures and Weathered Rocks with local scale aquifers which occur broadly across the site in
the floodplain and catchment areas.
Fractures and Weathered Rocks with minor groundwater resources and local scale aquifers
which occur over the majority of the escarpment Stone Country.
Fractured and Karstic Rocks with intermediate to local scale aquifers which occur over small
areas in the north-eastern and southern parts of the escarpment.
Sedimentary Rocks with intergranular porosity with regional to local scale aquifers which occur
along the lower reaches of the East Alligator River and within an area of the south-west of the
site.
The scale of aquifers as mentioned above refers to distance over which groundwater flows through
the aquifer from recharge to discharge areas. Specifically, local scale indicates less than five
kilometres, intermediate scale refers to distances of five to 50 kilometres, and regional scale refers to
greater than 50 kilometres.
As outlined previously in the discussion of wetland types, Kakadu National Park has several
groundwater-dependant freshwater springs that are predominantly situated in the northern-eastern
portion of the Stone Country between the South and East Alligator Rivers. A number of seeps have
also been identified by NRETA further south in the Stone Country but no empirical data on their exact
location are available. Such features would likely correspond with the larger scale aquifers present in
these environments.
8BCRITICAL COMPONENTS, PROCESSES AND SERVICES/BENEFITS
115
Groundwater usually discharges at low lying points in the landscape. It can take the form of individual
springs or as diffuse seepage into streams. Dry season flows into the river systems of the Northern
Territory are maintained through groundwater discharge particularly in karstic systems where there
are more substantial groundwater resources present. However, as these karst systems are very
limited within the Ramsar site, it is likely that the contribution of groundwater to surface water flows is
minor for the mid and lower reaches of Kakadu’s major river systems and/or is highly localised in
relation to major billabongs. Finlayson et al. (2006) indicates that in the floodplain areas, groundwater
levels can fall between two to four metres during the Dry Season.
Groundwater discharge may play a much more important role in the context of the upper reaches of
the river systems and for permanent and ephemeral streams located in the upstream and
escarpment areas but no studies to date have assessed the interaction between groundwater and
surface water in these environments and the relative contribution of groundwater flows during the dry
season.
Groundwater discharge can also occur through trees and riparian vegetation tapping directly into
shallow water aquifers. This process is identified as being very significant in the southern parts of the
Northern Territory by Ticknell (2008), but is not identified as a dominant process in the northern,
coastal areas of the Territory such as Kakadu. The extent to which this process occurs in the site is
also an information gap.
While there have not been any comprehensive studies of groundwater for the Park to date, there
have been site-specific studies of the mineral lease area in the context of movement of potential
contaminants from Jabiluka mine tailings by groundwater flow toward the park (refer Kalf and
Dudgeon 1999). In this study groundwater flows from the mine site into the Magela floodplain was
modelled to predict the concentrations of contaminants to be expected along the flow paths. In terms
of groundwater movement, the findings of the study noted that there were weak upward components
of groundwater flow both east and west of the mine and it was considered that any such flow which
reaches the shallow alluvial or weathered rock zone would be diluted and flushed away by the annual
wet season surface flows.
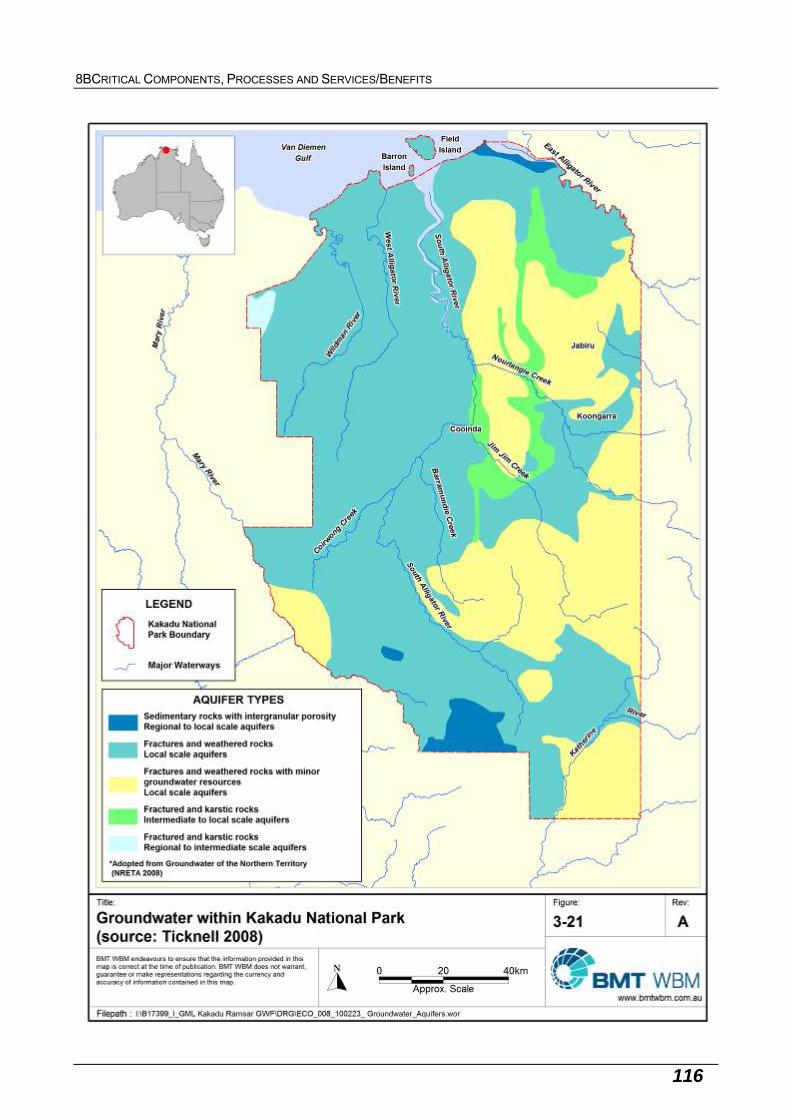
8BCRITICAL COMPONENTS, PROCESSES AND SERVICES/BENEFITS
116
I:\B17399_I_GML Kakadu Ramsar GWF\DRG\ECO_008_100223_ Groundwater_Aquifers.wor
Figure 3-21 Groundwater within Kakadu National Park (source: Ticknell 2008)
8BCRITICAL COMPONENTS, PROCESSES AND SERVICES/BENEFITS
117
This is consistent with general observations about the water quality of groundwater resources of the
Northern Territory including Kakadu, which are characterised by NRETA (2008) as being generally of
low salinity as a result of high rainfall, high recharge rates and higher through-flow of groundwater
(due to small aquifers) compared to more arid zones in the south.
3.6.6 General Ecosystem/Biological Processes
3.6.6.1 Nutrient Cycling
Information on nutrient cycling processes within Kakadu National Park is scarce. In one study
addressing nutrient cycling in the broader region, Cook (1994) investigated the effect of fires on
nutrient fluxes in the tropical savannah at Kapalga, Kakadu National Park. The magnitude of nutrient
fluxes due to fires was greatest in forest communities, where grassy fuel loads were high. Up to 94
percent of measured nutrients were transferred to the atmosphere during the fires. While nutrients
transferred to the atmosphere as entrained ash settled within several kilometres of the fires, nutrients
transferred in gaseous forms, such as nitrogen, are lost from the system. Cook (1994) noted that the
losses of nitrogen greatly exceeded the inputs through rainfall and re-deposition of ash. Furthermore,
nitrogen fixation was found to be of insufficient magnitude to replace the lost nitrogen, indicating that
annual burning may deplete nitrogen reserves in Kakadu National Park savannas.
3.6.6.2 Aquatic Foodwebs
Similar to other areas throughout Australia’s wet-dry tropics, aquatic food webs in the Kakadu
National Park region are closely linked with seasonal hydrology. Douglas et al. (2005) provide a
review and conceptual model of river and wetland food webs in Australia’s wet-dry tropics, using
numerous examples from Kakadu National Park. Based on this review, the aquatic food webs and
associated ecosystem processes in Kakadu National Park are assumed to be underpinned by five
general principles, as outlined below. Refer to Douglas et al. (2005) for further information.
1. Seasonal hydrology is a strong driver of ecosystem processes and food web structure. Food
web structure is highly dynamic throughout the year, with the seasonal hydrological cycle (a
reliable flood-pulse) driving the supply of carbon and nutrients that support food webs. The
seasonal variation in water levels drives major changes in habitat availability, primary
productivity and, consequently, the abundance and composition of consumer communities.
2. Hydrological connectivity is largely intact and supports important terrestrial-aquatic food web
subsidies. The food webs of tropical rivers are characterised by very strong hydrological
connections, exchanges between terrestrial and aquatic ecosystems, as well as between
productive habitats like floodplains and less productive rivers habitats. Additionally, the flow
regime is a key driver of exchanges between organisms and their food resources. For
example, at the end of the wet season, aquatic fauna migrating from the floodplain to dry-
season refuges transfer their assimilated aquatic production to these upstream rivers or
billabongs. Similarly, terrestrial riparian inputs of fruit, insects, leaves and other organic
debris are thought to be important contributors to the aquatic food web. The very strong
aquatic linkages and floodplain connectivity are largely due to the relatively undisturbed
hydrological condition of the rivers in the region (for example, lack of major waterway barriers
and agriculture) and the high level of intact riparian and floodplain vegetation.
8BCRITICAL COMPONENTS, PROCESSES AND SERVICES/BENEFITS
118
3. River and wetland food webs are strongly dependent on algal production. Relative to other
aquatic plants and terrestrial inputs, benthic (and epiphytic) algae are typically the major
source of organic carbon supporting consumers and sustaining the food webs. For instance,
work in the floodplain wetlands of the East Alligator River has shown that most of the
biomass carbon and nitrogen of fish and aquatic invertebrates was derived from epiphytic
algae.
4. A few common macro-consumer species have a strong influence on benthic food webs.
Tropical aquatic food webs are typically dominated by a small number of relatively large-
bodied consumers, such as fish and shrimp, which have a strong influence on benthic
sediments, detritus, nutrient demand, and algal and invertebrate communities. The catfish
Neosiluris ater and the shrimp Macrobrachium bellatum are species that have been shown to
have such an influence elsewhere in the Northern Territory, although the strengths of these
top-down control effects are likely to vary in response to seasonal hydrology. The top aquatic
predators within the site (for example, barramundi, saltwater and freshwater crocodiles)
similarly have a strong influence on lower components of food chains.
5. Omnivory is widespread and food chains are short. Widespread omnivory is a characteristic
of tropical fish communities, thought to be a response to the strong seasonal variability in the
availability of food resources. This omnivory means that fish feed on a broad range of items,
often across several trophic levels, which results in short, diffuse and highly interconnected
food webs.
3.7 Critical Services/Benefits
The present study identifies three critical services/benefits for the Kakadu National Park Ramsar site
(Table 3-1). In the context of the nomenclature outlined by the Millennium Ecosystem Assessment
(2003), critical services/benefits for the site are classified as follows:
S1 – Maintenance of Global Biodiversity, which is considered to represent a supporting service.
S2 – Fisheries Resource Values, which can be considered to represent cultural, supporting or
provisioning services.
S3 – Contemporary Living Culture, which can be considered to represent a cultural service.
3.7.1 S1 – Maintenance of Global Biodiversity
Reasons for Selection as ‘Critical’
Biological diversity, or biodiversity, is the variety of all life forms, the genes they contain and the
ecosystem processes of which they form a part. The term biodiversity can therefore incorporate most
of the critical and supporting components outlined in the previous sections. However, in the context of
how the Ramsar site provides a critical role in maintaining global biodiversity, two critical components
together have been selected in the context of this critical service:
supporting critical habitat for globally and nationally threatened wetland-dependent species, and
supporting critical habitat for locally endemic species.
8BCRITICAL COMPONENTS, PROCESSES AND SERVICES/BENEFITS
119
These two critical components are also important in their own right. The role of the site in maintaining
threatened wetland fauna species underpins Ramsar Nomination Criterion 2, and was identified by
Fox et al. (1977) as justification for National Park declaration (refer Fox et al. 1977). Endemic species
form a key element of biodiversity, as recognised in Section 70 of Ramsar Convention Secretariat
(2007), which underpins Ramsar Nomination Criterion 3.
In addition to the values of these species in terms of maintaining global biodiversity, some species
are of great scientific research value (see Section 3.7.1), provide a cultural resource (for example,
pig-nosed turtle, see Section 3.7.3) and/or play a role in maintaining wetland ecosystems and
foodwebs (see general account in Section 3.5.5).
Description
Five globally or nationally threatened species are considered to have critical habitat within the
Ramsar site (Table 3-8). Several other threatened species are also known or likely to occur in the
site, however the site is not considered to represent critical habitats for these species (see Section
2.5.2). The role of the wetlands within the Ramsar site in maintaining these species, together with
patterns in variability, are described in other sections relating to critical components and processes
(see Table 3-8).
Refer to Section 3.2.11 (Critical Component C11) for an account of locally endemic invertebrate
species within the Ramsar site.

8BCRITICAL COMPONENTS, PROCESSES AND SERVICES/BENEFITS
120
Table 3-8 Threatened wetland species that have critical habitats within the Ramsar site
Species Reproduction Recruitment Feeding Population Critical
Element
Northern river
shark
Unknown. Yes – neonates
and juveniles
appear to be
restricted to
estuaries.
Yes – turbid
rivers.
Small, highly fragmented population globally
(New Guinea and Australia). South, East and
West Alligator Rivers, and three other localities
external to the Ramsar site, support this species
(Compagno et al. 2008).
C8
Speartooth
shark
Unknown but
possible.
Yes – neonates
and juveniles
restricted to
upper estuary.
Yes – turbid
rivers.
Small, highly fragmented population globally
(New Guinea and Australia). East and South
Alligator Rivers are two of the five known
Australian localities supporting this species
(Compagno et al. 2008).
C8
Pig-nosed
turtle
Yes – nest on
river banks.
Yes. Yes –
particularly
billabongs
Breeding populations in Australia are known in
the East and South Alligator Rivers, with two
other known localities external to the site and a
number of other anecdotal reports (Doody et al.
2000). Also occurs as isolated population in
New Guinea (Cogger & Heathcote 1981).
C10
Flatback turtle Yes – critical
nesting site.
No. No. Field Island represents one of six major nesting
sites in Australia, and has been identified as a
habitat critical to the survival of this species.
P4
Yellow chat Yes. Yes. Yes. Small geographic area encompassing the
floodplains from the Adelaide River to the East
Alligator River, (Woinarski et al. 2007). Total
population size estimated to be about 500
breeding birds (Garnett and Crowley 2000) and
Kakadu National Park sub-population probably
around 300 (Armstrong 2004).
C9
Freshwater
and dwarf
sawfish
Possibly -
Freshwaters of
large river
systems.
Possibly -
Freshwater and
upper
estuaries.
Yes. Both have a wide geographic distribution but
highly fragmented, and thought to be
uncommon where they occur. Freshwater
sawfish recorded in eight catchments within
Northern Territory, including South and East
Alligator Rivers (Peverell et al. 2006).
Population size unknown. Dwarf sawfish
recorded in five catchments, including South
Alligator River (Peverell et al. 2004)
N/A
Green turtle
and dugong
No. No. Some
feeding – but
not core
area.
Limited area of feeding habitat (intertidal
seagrass) within the site is not critical to
maintaining populations of these species at
even a local scale.
N/A
Blue shading – site is not known to be a critical habitat for this species
8BCRITICAL COMPONENTS, PROCESSES AND SERVICES/BENEFITS
121
3.7.2 S2 – Fisheries Resource Values
Reasons for Selection as ‘Critical’
Kakadu National Park supports important fisheries resources in the form of fisheries habitats. This
was selected as a critical service/benefit due to fisheries values being an important determinant of the
site’s unique character, and the importance of fisheries values with respect to support of other
services/benefits including recreation and tourism (supporting service) and contemporary living
culture (Service 3). This service/benefit is based on fisheries habitat and fish abundance, and
excludes fishing activities.
In the context of this service, barramundi Lates calcarifer has been selected as a key indicator of the
fisheries habitat values of the site. Selection of barramundi as a key indicator is based on a number of
reasons: recreational fishing focuses almost entirely on this species, has been relatively well-studied
and also represents a key traditional food species together with other cultural values (refer Section
3.7.3). Habitat values and patterns in the abundance of barramundi are discussed below.
3.7.2.1 Habitats
Description
All wetland types together support the ecosystems and constituent habitats, populations and food
webs that support fisheries resource values within and adjacent to the site. Commercial fishing is
banned throughout the site and no recreational fishing is allowed upstream of the Kakadu Highway,
except on Jim Jim, Muirella Park and Sandy Billabongs, and Yellow Water. Fishing is also prohibited
on the West Alligator River and some other billabongs. Due to the wide home range of many
estuarine and marine species, the site is also likely to support habitats and other fisheries resources
that contribute to fisheries productivity outside the site.
Most commercially important species, including barramundi, use a wide range of habitats (and habitat
patches) as part of their life-cycle. It is therefore appropriate to consider fisheries habitat values in the
context of:
the range habitat types supporting different life-history functions of different fisheries species (and
their prey, for example, bony bream, mullet, rainbowfish etc.)
hydraulic (flow regimes) and bio-physical habitat conditions, which ultimately control patterns in
fish community structure across a range of spatial and temporal scales
connectivity/linkages between different habitat types and patches, which vary seasonally
specific environmental conditions and stresses within particular habitat patches (for example,
water quality conditions), and
biological interactions (particularly predation, prey availability) within particular habitat types and
patches.
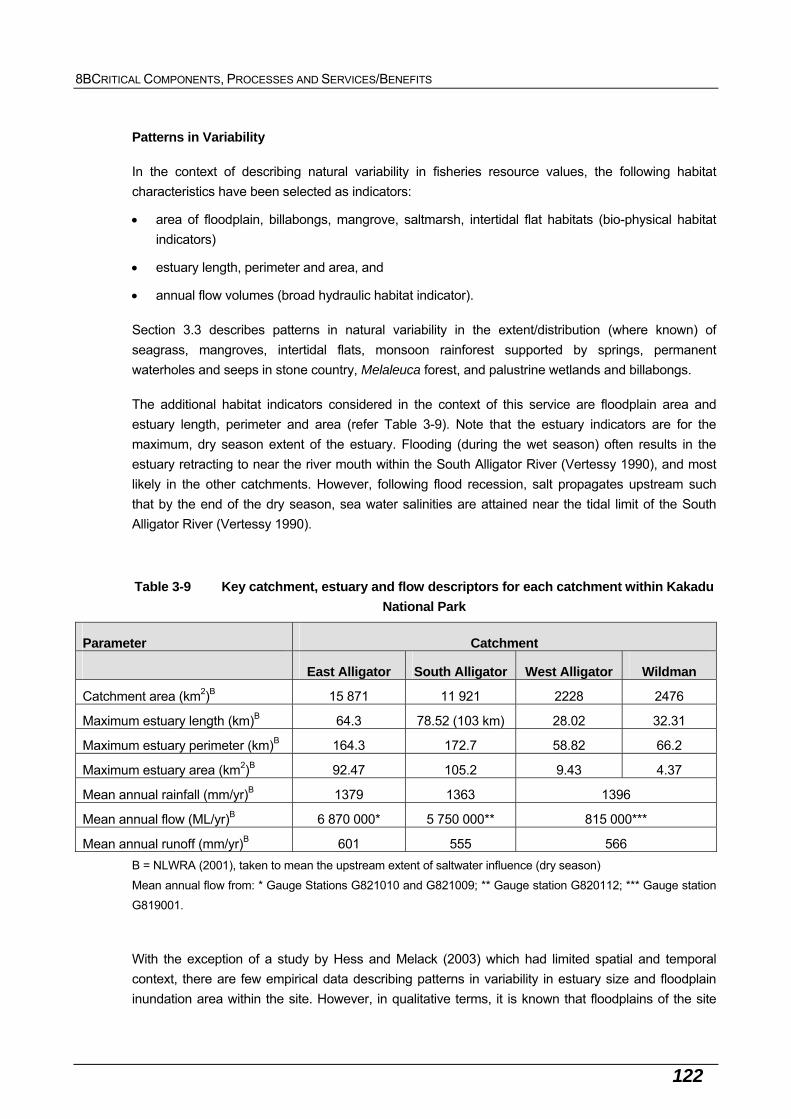
8BCRITICAL COMPONENTS, PROCESSES AND SERVICES/BENEFITS
122
Patterns in Variability
In the context of describing natural variability in fisheries resource values, the following habitat
characteristics have been selected as indicators:
area of floodplain, billabongs, mangrove, saltmarsh, intertidal flat habitats (bio-physical habitat
indicators)
estuary length, perimeter and area, and
annual flow volumes (broad hydraulic habitat indicator).
Section 3.3 describes patterns in natural variability in the extent/distribution (where known) of
seagrass, mangroves, intertidal flats, monsoon rainforest supported by springs, permanent
waterholes and seeps in stone country, Melaleuca forest, and palustrine wetlands and billabongs.
The additional habitat indicators considered in the context of this service are floodplain area and
estuary length, perimeter and area (refer Table 3-9). Note that the estuary indicators are for the
maximum, dry season extent of the estuary. Flooding (during the wet season) often results in the
estuary retracting to near the river mouth within the South Alligator River (Vertessy 1990), and most
likely in the other catchments. However, following flood recession, salt propagates upstream such
that by the end of the dry season, sea water salinities are attained near the tidal limit of the South
Alligator River (Vertessy 1990).
Table 3-9 Key catchment, estuary and flow descriptors for each catchment within Kakadu
National Park
Parameter Catchment
East Alligator South Alligator West Alligator Wildman
Catchment area (km2)B 15 871 11 921 2228 2476
Maximum estuary length (km)B 64.3 78.52 (103 km) 28.02 32.31
Maximum estuary perimeter (km)B 164.3 172.7 58.82 66.2
Maximum estuary area (km2)B 92.47 105.2 9.43 4.37
Mean annual rainfall (mm/yr)B 1379 1363 1396
Mean annual flow (ML/yr)B 6 870 000* 5 750 000** 815 000***
Mean annual runoff (mm/yr)B 601 555 566
B = NLWRA (2001), taken to mean the upstream extent of saltwater influence (dry season)
Mean annual flow from: * Gauge Stations G821010 and G821009; ** Gauge station G820112; *** Gauge station
G819001.
With the exception of a study by Hess and Melack (2003) which had limited spatial and temporal
context, there are few empirical data describing patterns in variability in estuary size and floodplain
inundation area within the site. However, in qualitative terms, it is known that floodplains of the site
8BCRITICAL COMPONENTS, PROCESSES AND SERVICES/BENEFITS
123
are a hydrologically dynamic habitat. During the annual wet season, the underlying clay soils are
flooded by 10 to 200 centimetres of water, while during the dry season they are dry and deeply
cracked. The annual wetting and drying cycle is a reliable occurrence, but the timing of wet season
onset, and the extent and duration of inundation are not (see Section 3.5.1). Maintenance of the
seasonal flooding regime is critical to the maintenance of aquatic foodwebs and wetland ecosystem
functioning (Douglas et al. 2005; see Section 3.5.5). River flow dynamics, and patterns in variability,
are described in Section 3.5.1 of this report.
3.7.2.2 Barramundi Abundance
Description
Recreational fishing within the site is based almost entirely on barramundi. The maximum allowable
catch is two fish per day per person (Director of National Parks 2007). Under the Northern Territory
Fisheries Act 2005, Indigenous people may fish by traditional methods in traditional areas, and are
otherwise subject to the same controls as recreational fishers. The catch by Indigenous people in the
Northern Territory was estimated to be 44 134 barramundi in 2000 (Coleman et al. 2003), however
the contribution of the site to this total catch has not been quantified.
There are insufficient recent data to determine key fishing areas and fish production within the site.
However, creek surveys undertaken in 1986-1987 between Darwin and East Alligator River indicated
that South Alligator River and East Alligator River ranked second and third respectively to Mary River
in terms of recreational fishing effort (approximately 29 percent and 10 percent of total effort,
respectively) and catch (approximately 9000 fish in South Alligator River in 1986) (Griffin 1989).
Notably, compared to a survey done in 1978-1979 using the same methods, recreational effort had
increased by approximately 27 percent and catch by approximately five percent (Griffin 1989).
However, it is likely that recreational fishing effort has increased markedly since the 1986-1987
survey due to the increase in visitor numbers to the Park (refer Section 3.8.1).
In the context of this critical service, Kakadu National Park is an important breeding, recruitment and
feeding site, as well as dry season refugia. Barramundi ecology is strongly influenced by fluvial
hydrology and tidal processes (Pusey et al. 2004). In addition to its role in controlling geomorphology
and therefore habitat structure, freshwater flows and tidal processes ultimately control spawning,
feeding and abundance patterns during all life-cycle stages (Pusey et al. 2004). The catchments of
the site have a large river discharge and low catchment gradient (and associated high residence time
of fluvial flows), which together with the relatively undisturbed condition of floodplain habitats, provide
the necessary conditions for maintaining high barramundi abundances (Pusey et al. 2004).
Spawning occurs in estuarine creek mouths, with spawning sites typically in areas with low tidal
current velocities (Pusey et al. 2004). The on-set of spawning is thought to occur immediately prior to
the wet season, and is thought to be linked to water temperature (Pusey et al. 2004). Barramundi are
tolerant of a wide range of water quality conditions (i.e. salinity, dissolved oxygen, turbidity). However
local fish kills can occur in drying water holes in response to high water temperatures and low
dissolved oxygen concentrations (Pusey et al. 2004), as well as after rainfall when deoxygenated,
nutrient enriched waters flow into waterholes. Barramundi is not known to have a highly selective diet,
but does vary according to age (small invertebrates and small fish as juveniles, fish, prawns, crabs as
8BCRITICAL COMPONENTS, PROCESSES AND SERVICES/BENEFITS
124
adults) (Pusey et al. 2004). Prey items can be strongly influenced by flows and water quality
conditions.
Patterns in Variability
The key indicator in the context of this critical service is barramundi abundance. Barramundi
abundance has been assessed at Yellow Water billabong in September 1990 by Griffin (1994). Griffin
(1994) suggested that the population was comprised of approximately 6000 individuals at that time,
with catch per unit effort (CPUE) of 3.8 fish per 100 metre net per hour. At Corroboree Billabong on
the Mary River, the CPUE was 6.7 fish per 100 metre net per hour.
Long-term fish monitoring studies by eriss provide standardised, empirical fish catch data from two
sandy bed billabongs located in Nourlangie Creek (Sandy Billabong) and Magela Creek (Mudginberri
Billabong) sub catchments (based on visual census techniques – see Humphrey et al. 2005). Over
the monitoring period 1994 to 2005, the mean overall number of barramundi recorded per 50 metre
(using the visual boat census technique) was 0.987 individuals per 50 metres at Mudginberri
Billabong, and 0.283 individuals per 50 metres at Sandy Billabong (see Section 3.2.6).
There are no available data describing patterns in barramundi abundance over time or within other
areas of the Ramsar site.
3.7.3 S3 – Contemporary Living Culture
Reasons for Selection as ‘Critical’
Contemporary living culture was selected as a critical service as it is an important determinant of the
site’s unique character. In particular, it is noteworthy that the Kakadu National Park Ramsar site
meets all four of the Ramsar cultural characteristics as outlined by Resolutions VIII.19 and IX.21
(cultural characteristics ‘a’, ‘c’ and ‘d’ described below; refer Section 3.8.3 for cultural characteristic
‘b’).
Description
Bininj within Kakadu National Park undertake cultural and land management practices, follow
customary law and uphold traditions established over thousands of years of continuous occupation.
Kakadu National Park’s contemporary ‘living culture’ is described under three of the Ramsar cultural
characteristics below.
Maintenance of the living culture is dependent on factors such as land ownership, access to land and
resources, transmission of cultural knowledge and practices to younger generations, protection of
sites and documentation of cultural heritage.
Cultural characteristic ‘a’: Sites which provide a model of wetland wise use, demonstrating
the application of traditional knowledge and methods of management and use that maintain
the ecological character of the wetland.
The management of Kakadu National Park provides a model of wetland wise use, incorporating
traditional knowledge and providing a balance between competing interests such as nature
conservation and tourism. Kakadu National Park’s model of joint-management between Bininj and
8BCRITICAL COMPONENTS, PROCESSES AND SERVICES/BENEFITS
125
the Australian Government is renowned on a worldwide scale for its success in its integration of Bininj
and western management techniques, as well as its recognition of Indigenous land rights and self-
determination (de Lacy 1994).
Sustainable Use
Bininj and Parks Australia have developed a successful system of wise-use whereby Bininj can
sustainably harvest native plants and animals within the national park. This system is critical in
maintaining Bininj cultural heritage as Traditional Ecological Knowledge is transferred (for example,
harvesting techniques, species’ ecology), Bininj languages are used, other cultural practices are
undertaken while harvesting traditional foods, and land management is often undertaken
simultaneously. Resources that are harvested may be used for food, art and craft, medicine and other
customary uses, as described in further detail below. Bininj continue to hold detailed knowledge of
the usage, availability and ecology of hundreds of plant and animal species (Brockwell et al 1995).
Threat Management
Bininj knowledge has assisted Parks Australia in monitoring and managing threats to the Ramsar
site, thereby maintaining the ecological character. For example, feral buffalo were causing extensive
environmental damage during the 1960s through vegetation destruction, soil compaction, weed
dispersal, habitat modification and erosion (see Higgins 1999, Director of National Parks 2007). Bininj
and local community members established a buffalo control program to reduce buffalo numbers, and
started to restore wetlands in the 1970s. Bininj traditional ecological knowledge regarding the original
state of the environment, the impact of buffalo and the management and restoration of wetlands was
central to the successful restoration of the wetlands (D. Lindner pers. comm. 2009).
Cultural characteristic ‘c’: Sites where the ecological character of the wetland depends on the
interaction with local communities or Indigenous peoples.
Through historical and current practices, Bininj have influenced, and continue to influence, the
ecological character of the Kakadu National Park Ramsar site. Bininj hold a substantial body of
traditional ecological knowledge which includes topics such as fire, species, ecosystems, ecological
processes, landscape change and seasons. A joint management arrangement enables Bininj to look
after Kakadu National Park in cooperation with National Park staff, providing opportunities for relevant
Bininj to be consulted, make decisions and implement these in the management of Kakadu National
Park. As such, the application of traditional ecological knowledge and cultural knowledge in land
management, cultural heritage management and tourism contributes towards maintaining the
ecological character of the wetlands and surrounds.
Bininj and the local community have been working with Parks Australia North on natural resource
management programs since the inception of Kakadu National Park. Approximately 30 percent of the
staff employed through Kakadu National Park are Bininj people with 20 percent having a close
connection to Kakadu National Park or the region (S. Winderlich pers. comm. 2009). Bininj and the
local community have also initiated a number of programs over the years to deal with threats to
Kakadu National Park’s ecological character, notably Mimosa pigra control, restoration of billabongs
at Gina and Yellow Water, fencing for protection of cultural sites and the re-establishment of
floodplain burning (information provided through Kakadu National Park ECD Workshop Jabiru 2009).

8BCRITICAL COMPONENTS, PROCESSES AND SERVICES/BENEFITS
126
Fire Management
Fire management is a particularly important interaction that influences the ecological character of the
Ramsar site. Archaeological records reveal an increase in charcoal and a change in vegetation after
the arrival of Bininj, suggesting that fire was being actively managed by humans and was
consequently having a significant impact on the environment (Hiscock and Kershaw 1992). Fire was
an important tool for expressing ownership, for managing food resources, as a hunting strategy, for
clearing grasses and undergrowth to make travel easier, for communication, for defence and for
specific spiritual and cultural obligations (Russell-Smith 1995, Director of National Parks 2007). For
example, wetland burning has transformed Boggy Plain from a dense monoculture of grass to a
mosaic of diverse habitats rich in resources. The Boggy Plain project has assisted in passing on
Traditional Ecological Knowledge to younger generations.
The present vegetation communities and suites of fauna are dependent on the traditional burning
practices established by Bininj over a long period of time (Director of National Parks 2007, Russell-
Smith 1995). Bininj work with Parks Australia to develop fire management strategies and annual
burning plans that replicate traditional burning (Director of National Parks 2007, also see Section
3.5.2).
Cultural characteristic ‘d’: Sites where relevant non-material values such as sacred sites are
present and their existence is strongly linked with the maintenance of the ecological character
of the wetland.
‘In some cultures, belief systems do not differentiate between the economic, social, cultural and
spiritual value of wetlands and people seem to have a more holistic perspective of their world.
Indigenous people in Australia consider themselves an integral part of their natural environment. With
the poorest soils of any inhabited continent and with a very dry climate, the high productivity of
Australia’s wetlands has given them special significance for these people. Their wetlands are very
often sacred to them: they are story places and evidence of the work of the ancestral creators who
made the landscape and provided for the needs of people. This holistic perspective is also found in
many indigenous belief systems in Africa and the Americas.
The spiritual connection between people and wetlands has a long history and is still of great
significance today in many cultures, their belief systems and traditions representing an important
feature of wetland cultural heritage – and at the same time often ensuring the conservation and wise
use of wetlands.’ (Ramsar Convention Secretariat 2002).
The Kakadu National Park landscape is overlain by a complex spiritual and social system sustained
by Bininj. Bininj believe that the natural features in the current landscape reflect the journey and
actions of the first people, the Nayuhyunggi. The living essence of some of these first people remains
in the land, and as such all land is valuable under this spiritual perspective, with some sites viewed as
particularly sacred or significant (Chaloupka 1993). Further information regarding culturally significant
sites is provided in Section 3.8.5 below.
Sites of cultural significance are important to the maintenance of the ecological character of Kakadu
National Park, as many of these sites must remain undisturbed in order not to disrupt the powers of
the creation ancestors residing within. Many sites need to be cared for and some even require the
8BCRITICAL COMPONENTS, PROCESSES AND SERVICES/BENEFITS
127
practice of increase ceremonies to ensure that the plants, animals and people of Kakadu National
Park prosper.
3.8 Supporting Services/Benefits
The supporting services/benefits outlined below are considered to be important or noteworthy in the
context of maintaining the character of the site, but are not considered to represent critical
services/benefits in the context of the considerations outlined in section 3.1.1 of this report. In this
context:
The supporting services/benefits are not, in isolation, thought to fundamentally underpin the
listing criteria. However, supporting services/benefits may, in combination with other elements,
underpin nomination criteria.
Some supporting services/benefits are already partially covered by other critical components,
processes or services/benefits.
The supporting components, while not critical, are important to wetland functioning and are
noteworthy in this regard.
In addition to these services, it is recognised that the Katherine River provides a source of water for
the township of Katherine (Simon Ward, pers. comm. 2010). The specific values of the site in
maintaining these flow regimes and water resource values for Katherine have not been quantified,
and this represents an information gap in the context of this ECD.
3.8.1 Recreation and Tourism
Kakadu National Park is an iconic destination for both international and Australian visitors. Tourists
are attracted to Kakadu National Park for its wildlife and magnificent landscapes, as well as for its
ancient cultural heritage including impressive galleries of Aboriginal rock art (Commonwealth of
Australia 1988, Director of National Parks 2007). Furthermore, the World Heritage listing of Kakadu
National Park is also likely to contribute to the attractiveness of the Ramsar site as a tourist
destination (Director of National Parks 2007). International visitors are principally from the United
Kingdom, Germany and the United States (Figure 3-23).
Tourist access is controlled through the Kakadu National Park Management Plan 2007-2014
(Director of National Parks 2007). Specifically, the Management Plan aims to maintain ‘a strong and
successful partnership between traditional owners, governments, the tourism industry and Park user
groups, providing world’s best practice in caring for country and sustainable tourism’. Evaluation of
achievement of the aim is measured through the (Director of National Parks 2007):
level of Bininj satisfaction with the nature, scope and impact of recreational and tourism
opportunities in the Park
level of visitor and tourism industry satisfaction with recreational and tourism opportunities in the
Park, and
the extent to which Bininj gain economic benefit from commercial tourism opportunities.
Major tourism infrastructure is provided at locations such as Gagudju Lodge Cooinda and Aurora
Kakadu Resort, including accommodation, restaurants, pubs and service infrastructure. Camping
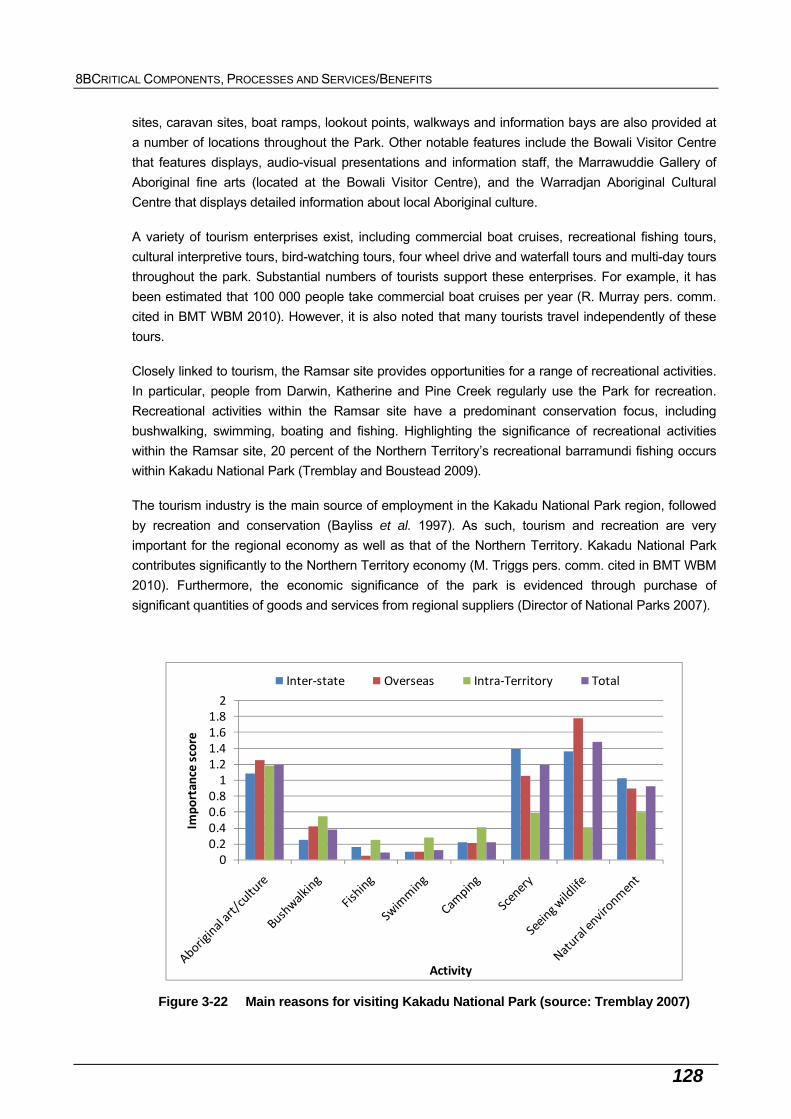
8BCRITICAL COMPONENTS, PROCESSES AND SERVICES/BENEFITS
128
sites, caravan sites, boat ramps, lookout points, walkways and information bays are also provided at
a number of locations throughout the Park. Other notable features include the Bowali Visitor Centre
that features displays, audio-visual presentations and information staff, the Marrawuddie Gallery of
Aboriginal fine arts (located at the Bowali Visitor Centre), and the Warradjan Aboriginal Cultural
Centre that displays detailed information about local Aboriginal culture.
A variety of tourism enterprises exist, including commercial boat cruises, recreational fishing tours,
cultural interpretive tours, bird-watching tours, four wheel drive and waterfall tours and multi-day tours
throughout the park. Substantial numbers of tourists support these enterprises. For example, it has
been estimated that 100 000 people take commercial boat cruises per year (R. Murray pers. comm.
cited in BMT WBM 2010). However, it is also noted that many tourists travel independently of these
tours.
Closely linked to tourism, the Ramsar site provides opportunities for a range of recreational activities.
In particular, people from Darwin, Katherine and Pine Creek regularly use the Park for recreation.
Recreational activities within the Ramsar site have a predominant conservation focus, including
bushwalking, swimming, boating and fishing. Highlighting the significance of recreational activities
within the Ramsar site, 20 percent of the Northern Territory’s recreational barramundi fishing occurs
within Kakadu National Park (Tremblay and Boustead 2009).
The tourism industry is the main source of employment in the Kakadu National Park region, followed
by recreation and conservation (Bayliss et al. 1997). As such, tourism and recreation are very
important for the regional economy as well as that of the Northern Territory. Kakadu National Park
contributes significantly to the Northern Territory economy (M. Triggs pers. comm. cited in BMT WBM
2010). Furthermore, the economic significance of the park is evidenced through purchase of
significant quantities of goods and services from regional suppliers (Director of National Parks 2007).
00.20.40.60.81
1.21.41.61.82
Importance score
Activity
Inter‐state Overseas Intra‐Territory Total
Figure 3-22 Main reasons for visiting Kakadu National Park (source: Tremblay 2007)
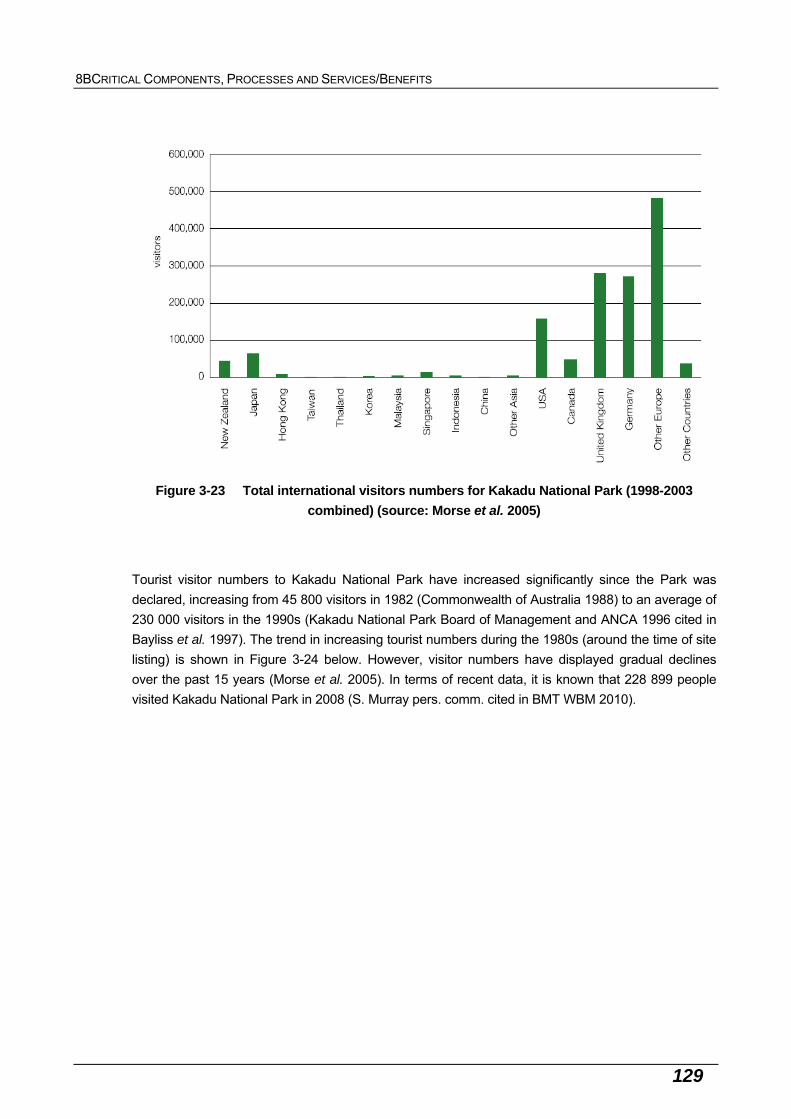
8BCRITICAL COMPONENTS, PROCESSES AND SERVICES/BENEFITS
129
Figure 3-23 Total international visitors numbers for Kakadu National Park (1998-2003
combined) (source: Morse et al. 2005)
Tourist visitor numbers to Kakadu National Park have increased significantly since the Park was
declared, increasing from 45 800 visitors in 1982 (Commonwealth of Australia 1988) to an average of
230 000 visitors in the 1990s (Kakadu National Park Board of Management and ANCA 1996 cited in
Bayliss et al. 1997). The trend in increasing tourist numbers during the 1980s (around the time of site
listing) is shown in Figure 3-24 below. However, visitor numbers have displayed gradual declines
over the past 15 years (Morse et al. 2005). In terms of recent data, it is known that 228 899 people
visited Kakadu National Park in 2008 (S. Murray pers. comm. cited in BMT WBM 2010).
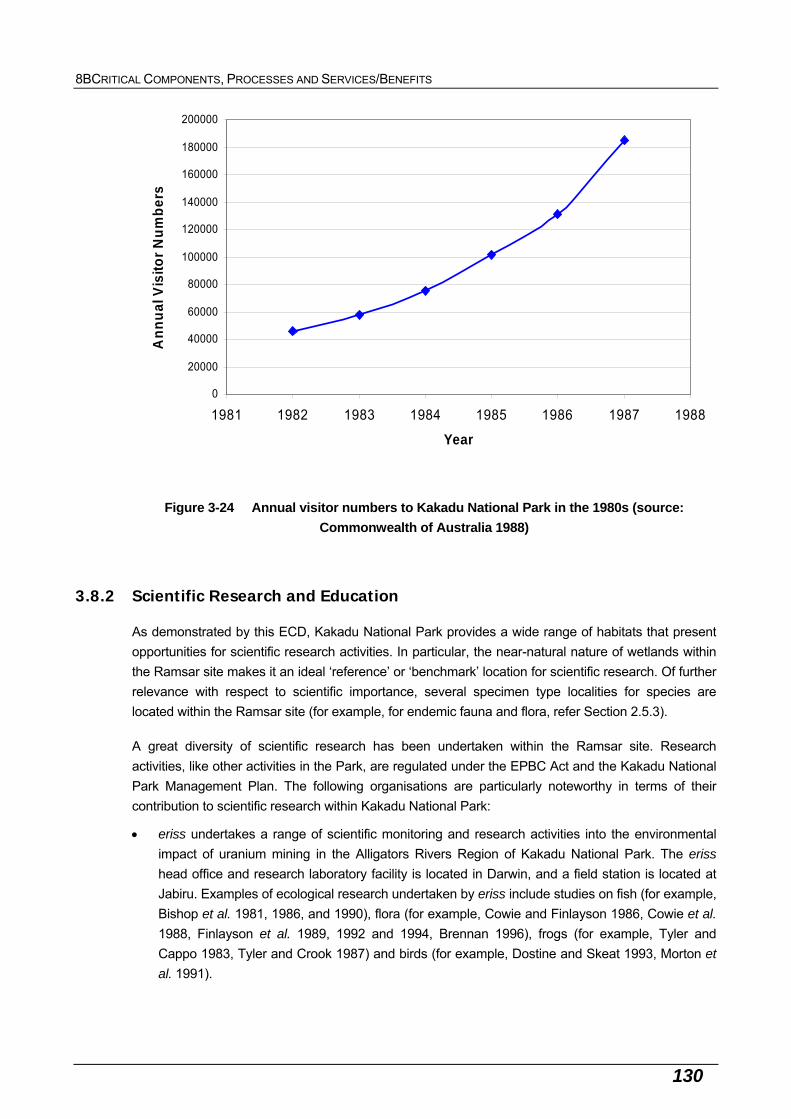
8BCRITICAL COMPONENTS, PROCESSES AND SERVICES/BENEFITS
130
0
20000
40000
60000
80000
100000
120000
140000
160000
180000
200000
1981 1982 1983 1984 1985 1986 1987 1988
Year
An
nu
al V
isit
or
Nu
mb
ers
Figure 3-24 Annual visitor numbers to Kakadu National Park in the 1980s (source:
Commonwealth of Australia 1988)
3.8.2 Scientific Research and Education
As demonstrated by this ECD, Kakadu National Park provides a wide range of habitats that present
opportunities for scientific research activities. In particular, the near-natural nature of wetlands within
the Ramsar site makes it an ideal ‘reference’ or ‘benchmark’ location for scientific research. Of further
relevance with respect to scientific importance, several specimen type localities for species are
located within the Ramsar site (for example, for endemic fauna and flora, refer Section 2.5.3).
A great diversity of scientific research has been undertaken within the Ramsar site. Research
activities, like other activities in the Park, are regulated under the EPBC Act and the Kakadu National
Park Management Plan. The following organisations are particularly noteworthy in terms of their
contribution to scientific research within Kakadu National Park:
eriss undertakes a range of scientific monitoring and research activities into the environmental
impact of uranium mining in the Alligators Rivers Region of Kakadu National Park. The eriss
head office and research laboratory facility is located in Darwin, and a field station is located at
Jabiru. Examples of ecological research undertaken by eriss include studies on fish (for example,
Bishop et al. 1981, 1986, and 1990), flora (for example, Cowie and Finlayson 1986, Cowie et al.
1988, Finlayson et al. 1989, 1992 and 1994, Brennan 1996), frogs (for example, Tyler and
Cappo 1983, Tyler and Crook 1987) and birds (for example, Dostine and Skeat 1993, Morton et
al. 1991).
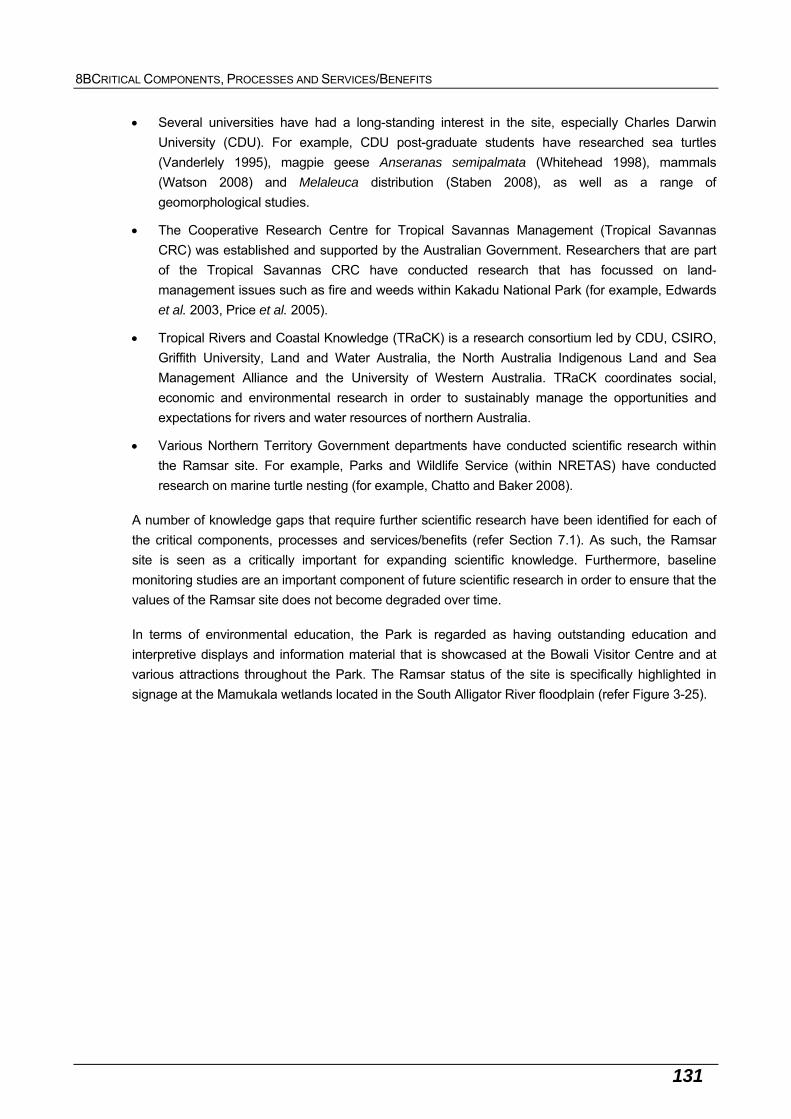
8BCRITICAL COMPONENTS, PROCESSES AND SERVICES/BENEFITS
131
Several universities have had a long-standing interest in the site, especially Charles Darwin
University (CDU). For example, CDU post-graduate students have researched sea turtles
(Vanderlely 1995), magpie geese Anseranas semipalmata (Whitehead 1998), mammals
(Watson 2008) and Melaleuca distribution (Staben 2008), as well as a range of
geomorphological studies.
The Cooperative Research Centre for Tropical Savannas Management (Tropical Savannas
CRC) was established and supported by the Australian Government. Researchers that are part
of the Tropical Savannas CRC have conducted research that has focussed on land-
management issues such as fire and weeds within Kakadu National Park (for example, Edwards
et al. 2003, Price et al. 2005).
Tropical Rivers and Coastal Knowledge (TRaCK) is a research consortium led by CDU, CSIRO,
Griffith University, Land and Water Australia, the North Australia Indigenous Land and Sea
Management Alliance and the University of Western Australia. TRaCK coordinates social,
economic and environmental research in order to sustainably manage the opportunities and
expectations for rivers and water resources of northern Australia.
Various Northern Territory Government departments have conducted scientific research within
the Ramsar site. For example, Parks and Wildlife Service (within NRETAS) have conducted
research on marine turtle nesting (for example, Chatto and Baker 2008).
A number of knowledge gaps that require further scientific research have been identified for each of
the critical components, processes and services/benefits (refer Section 7.1). As such, the Ramsar
site is seen as a critically important for expanding scientific knowledge. Furthermore, baseline
monitoring studies are an important component of future scientific research in order to ensure that the
values of the Ramsar site does not become degraded over time.
In terms of environmental education, the Park is regarded as having outstanding education and
interpretive displays and information material that is showcased at the Bowali Visitor Centre and at
various attractions throughout the Park. The Ramsar status of the site is specifically highlighted in
signage at the Mamukala wetlands located in the South Alligator River floodplain (refer Figure 3-25).
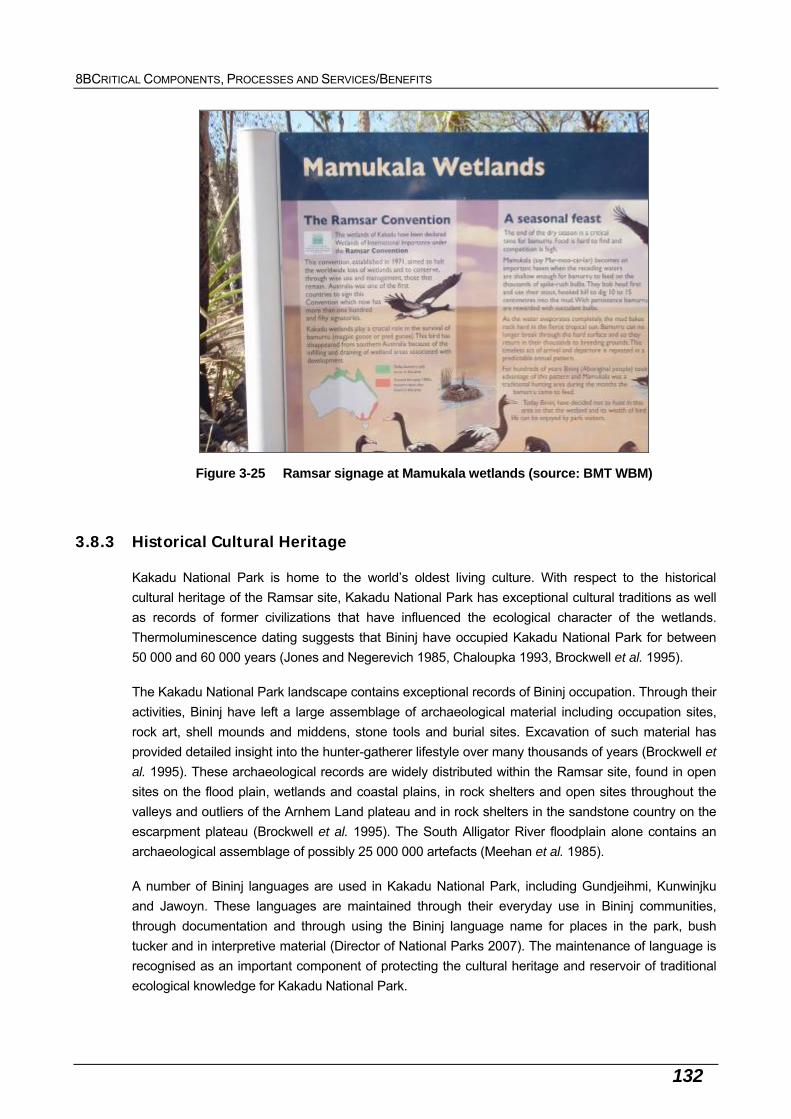
8BCRITICAL COMPONENTS, PROCESSES AND SERVICES/BENEFITS
132
Figure 3-25 Ramsar signage at Mamukala wetlands (source: BMT WBM)
3.8.3 Historical Cultural Heritage
Kakadu National Park is home to the world’s oldest living culture. With respect to the historical
cultural heritage of the Ramsar site, Kakadu National Park has exceptional cultural traditions as well
as records of former civilizations that have influenced the ecological character of the wetlands.
Thermoluminescence dating suggests that Bininj have occupied Kakadu National Park for between
50 000 and 60 000 years (Jones and Negerevich 1985, Chaloupka 1993, Brockwell et al. 1995).
The Kakadu National Park landscape contains exceptional records of Bininj occupation. Through their
activities, Bininj have left a large assemblage of archaeological material including occupation sites,
rock art, shell mounds and middens, stone tools and burial sites. Excavation of such material has
provided detailed insight into the hunter-gatherer lifestyle over many thousands of years (Brockwell et
al. 1995). These archaeological records are widely distributed within the Ramsar site, found in open
sites on the flood plain, wetlands and coastal plains, in rock shelters and open sites throughout the
valleys and outliers of the Arnhem Land plateau and in rock shelters in the sandstone country on the
escarpment plateau (Brockwell et al. 1995). The South Alligator River floodplain alone contains an
archaeological assemblage of possibly 25 000 000 artefacts (Meehan et al. 1985).
A number of Bininj languages are used in Kakadu National Park, including Gundjeihmi, Kunwinjku
and Jawoyn. These languages are maintained through their everyday use in Bininj communities,
through documentation and through using the Bininj language name for places in the park, bush
tucker and in interpretive material (Director of National Parks 2007). The maintenance of language is
recognised as an important component of protecting the cultural heritage and reservoir of traditional
ecological knowledge for Kakadu National Park.
8BCRITICAL COMPONENTS, PROCESSES AND SERVICES/BENEFITS
133
3.8.4 Biological Products
As described in Critical Service 3 above, Aboriginal communities have a strong relationship with
ecosystems of the Ramsar site. In particular, ecosystems are important with respect to provision of
biological products including traditional foods (termed ‘bush tucker’) as well as materials that are
useful for various purposes. While the diet and customs of Aboriginal communities may have
changed since European colonisation, many traditional biological products are still sourced from
ecosystems.
Bush Tucker
Species that are known to be included in the traditional diet are listed in Table 3-10 below. As
indicated in the table, a large proportion of the bush tucker species originate from floodplains and
billabongs. Of particular note are magpie geese Anseranas semipalmata and their eggs, which are
regarded as one of the most important animal staples in the traditional diet (Lucas and Russell-Smith
1993). Other major sources of animal protein include freshwater mussels, fish, turtles, and crocodile
eggs. The most abundant sources of carbohydrate include several species of water lily Nymphaea
spp. and water chestnut Eleocharis dulcis, with a variety of other plant species used as minor sources
of carbohydrates (Cowie et al. 2000).
Materials
Biological products have a variety of customary uses such as medicine, craft, weapons and utensils.
The following examples of resources that are derived from biological products are provided in Cowie
et al. (2000):
common swamp reed Phragmites vallatoria is used for fighting spears or goose spears
a bamboo Bambusia arnhemica is used for spears, craft and didgeridoos
common bulrush Typha domingensis is used for spears
bark from the shrub Melochia corchorifolia is used for fibre for making string
bark from paperbarks Melaleuca spp. is used for carrying or wrapping food, for shelter, for
torches and as traditional medicine, and
bark from freshwater mangrove Barringtonia acutangula is used for poisoning fish.
Other notable examples of materials include swamp banksia Banksia dentata that is used as fire
sticks, and spring pandanus Pandanus spiralis that is used to make dilly bags, mats and baskets
(Wightman and Brown 1994).
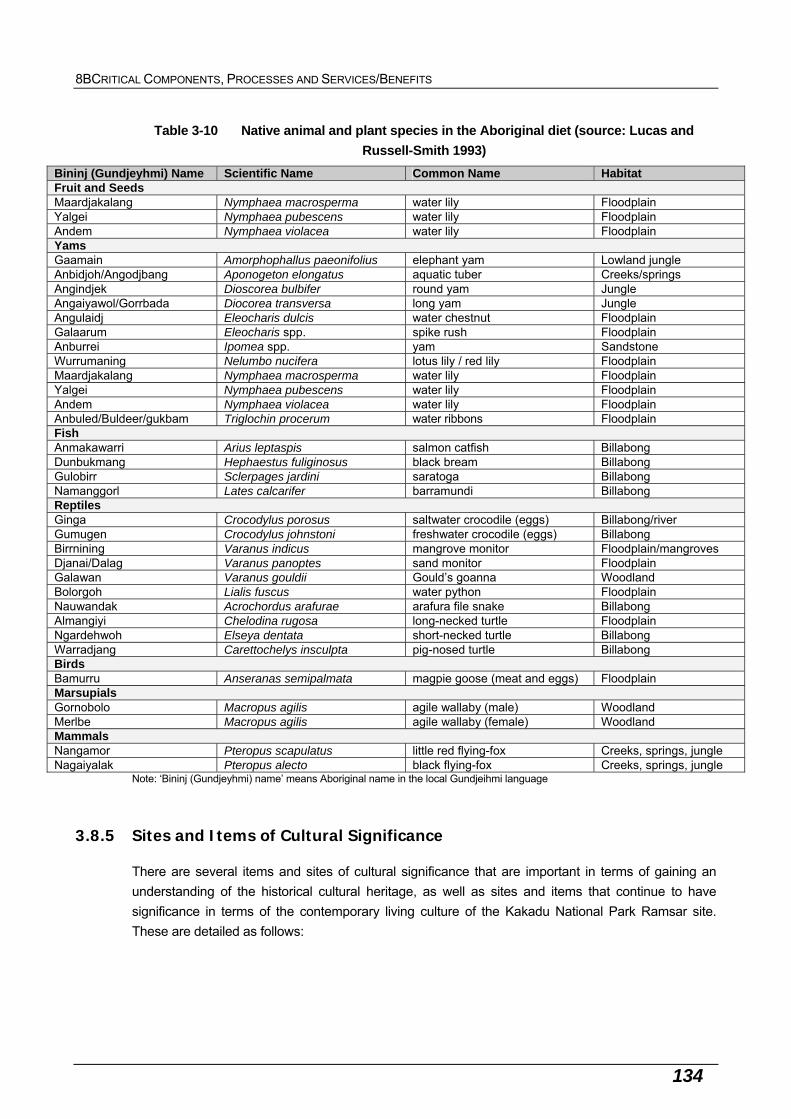
8BCRITICAL COMPONENTS, PROCESSES AND SERVICES/BENEFITS
134
Table 3-10 Native animal and plant species in the Aboriginal diet (source: Lucas and
Russell-Smith 1993)
Bininj (Gundjeyhmi) Name Scientific Name Common Name Habitat Fruit and Seeds Maardjakalang Nymphaea macrosperma water lily Floodplain Yalgei Nymphaea pubescens water lily Floodplain Andem Nymphaea violacea water lily Floodplain Yams Gaamain Amorphophallus paeonifolius elephant yam Lowland jungle Anbidjoh/Angodjbang Aponogeton elongatus aquatic tuber Creeks/springs Angindjek Dioscorea bulbifer round yam Jungle Angaiyawol/Gorrbada Diocorea transversa long yam Jungle Angulaidj Eleocharis dulcis water chestnut Floodplain Galaarum Eleocharis spp. spike rush Floodplain Anburrei Ipomea spp. yam Sandstone Wurrumaning Nelumbo nucifera lotus lily / red lily Floodplain Maardjakalang Nymphaea macrosperma water lily Floodplain Yalgei Nymphaea pubescens water lily Floodplain Andem Nymphaea violacea water lily Floodplain Anbuled/Buldeer/gukbam Triglochin procerum water ribbons Floodplain Fish Anmakawarri Arius leptaspis salmon catfish Billabong Dunbukmang Hephaestus fuliginosus black bream Billabong Gulobirr Sclerpages jardini saratoga Billabong Namanggorl Lates calcarifer barramundi Billabong Reptiles Ginga Crocodylus porosus saltwater crocodile (eggs) Billabong/river Gumugen Crocodylus johnstoni freshwater crocodile (eggs) Billabong Birrnining Varanus indicus mangrove monitor Floodplain/mangroves Djanai/Dalag Varanus panoptes sand monitor Floodplain Galawan Varanus gouldii Gould’s goanna Woodland Bolorgoh Lialis fuscus water python Floodplain Nauwandak Acrochordus arafurae arafura file snake Billabong Almangiyi Chelodina rugosa long-necked turtle Floodplain Ngardehwoh Elseya dentata short-necked turtle Billabong Warradjang Carettochelys insculpta pig-nosed turtle Billabong Birds Bamurru Anseranas semipalmata magpie goose (meat and eggs) Floodplain Marsupials Gornobolo Macropus agilis agile wallaby (male) Woodland Merlbe Macropus agilis agile wallaby (female) Woodland Mammals Nangamor Pteropus scapulatus little red flying-fox Creeks, springs, jungle Nagaiyalak Pteropus alecto black flying-fox Creeks, springs, jungle
Note: ‘Bininj (Gundjeyhmi) name’ means Aboriginal name in the local Gundjeihmi language
3.8.5 Sites and Items of Cultural Significance
There are several items and sites of cultural significance that are important in terms of gaining an
understanding of the historical cultural heritage, as well as sites and items that continue to have
significance in terms of the contemporary living culture of the Kakadu National Park Ramsar site.
These are detailed as follows:
8BCRITICAL COMPONENTS, PROCESSES AND SERVICES/BENEFITS
135
Traditional Camping Areas
Traditional camping areas, or occupation sites, are found throughout Kakadu National Park from the
coast, along the rivers, to the floodplain and into the outliers and main escarpment area. These
camping areas can be a focal point for artefacts and middens, as well as rock art.
Rock Art
It is estimated that there are at least 10 000 art sites throughout Kakadu National Park, primarily
located in the escarpment and its outliers (Brockwell et al. 1995). The rock art tells a story of
landscape change over thousands of years (Chaloupka 1993), and enhances other archaeological
research by providing details of economic activities, technology and material culture, as well as
insights into ideology, religion and traditional life (Brockwell et al 1995). The rock art of Kakadu
National Park is internationally significant due to its extensiveness, antiquity, exquisite beauty and
artistic excellence, and as it is the world’s longest continuing art tradition (Chaloupka 1993, Brockwell
et al. 1995).
Shell Mounds and Middens
Shell mounds and middens are found on the floodplains, rivers and coastal regions. Specific sites
include Ngarradj Warde Djobkeng, Malakunanja, Nawamoyn, Paribari and Malangangerr. These sites
are dated as far back as 7000 years before present, during Kakadu National Park’s ‘big swamp’
period when the mangrove landscape provided abundant molluscs for exploitation (Hiscock 1999).
Comparison of midden variability in faunal composition, location of middens, time period and intensity
of use, and associated artefacts (for example, stone tools) have contributed greatly to the
understanding of the archaeological record of Australia.
Stone and Organic Tools
Early stone tools found in Kakadu National Park rock shelters from at least 20 000 years ago include
flaked stone artefacts, grindstones, ground ochre pieces and hafted edge-ground axes (Brockwell et
at. 1995). More recent stone artefacts (approximately 5000 years ago) include finely worked small
stone points and steep-edged chisels, while organic artefacts (from approximately 7000 years ago to
present) include tools made from bone, wood and shell (Brockwell et al. 1995).
During the last thousand years, freshwater floodplains developed and created plentiful resources able
to support higher levels of human occupation, and as such extensive scatters of stone artefacts are
found on the floodplain. Stone artefacts such leilira blades (large points) and use-polished flakes
appear during this period. Furthermore, organic materials such as wooden, fibre, bone and shell
artefacts and the food remains of plant and bone are preserved in Kakadu National Park (Brockwell
et al. 1995).
Fish Traps
Fish traps made from stone or basketry are believed to pre-date the arrival of Europeans (Hiscock
and Kershaw 1992). Within Kakadu National Park, permanent fish traps have been found on the
8BCRITICAL COMPONENTS, PROCESSES AND SERVICES/BENEFITS
136
Wildman River. Examination of these traps provides information on the hunter-gatherer society of
Kakadu National Park prior to European arrival and influence.
Dugout Canoes
Dugout canoes were produced by cutting down a large tree and hollowing out a canoe from the trunk,
a process observed by Baldwin Spencer in 1900 (Spencer 2009). Several dugout canoes have been
discovered in Kakadu National Park, including some retrieved from the banks of the East Alligator
River that have been preserved as cultural heritage items.
Significant Sites
Sites of cultural significance include areas that relate to the activities that took place during the
creation era and the travels of the first people, significant rock art and occupation sites, burial sites,
ceremonial sites, story places, increase sites, dreaming places and others (Brockwell et al. 1995,
Brockwell et al. 2001). Dreaming places may be named after animals and may be significant for the
reproduction or control of the relevant species (Brockwell et al. 1995). For example, wetland sites of
Kakadu National Park include Whistle Duck, Goanna, King Brown, Hawk, Gecko, Barramundi and
Turkey Dreamings. The maintenance of these sites is important for the continuation of each these
species and certain Bininj may have specific responsibilities related to these Dreamings. Cultural
protocols and totems may also place restrictions on the ability of some Bininj to eat certain species of
animal.
3.9 Conceptual Models
Several conceptual models have been prepared to support this ECD, in particular to illustrate the
interaction of critical components and processes to produce ecosystem services/benefits.
In seeking to logically characterise the broad range of wetland habitats present in Kakadu National
Park, the models reflect: the coastal and estuarine areas that are characteristic of the northern areas
of the site around the mouths of the major rivers; the wetland environments within the floodplains
themselves which link the estuarine and freshwater habitats; and the freshwater dominated wetland
systems associated with the upper catchment of the floodplain leading into the escarpment and the
Stone Country.
Figure 3-26 provides an overview of the locations of wetland conceptual models presented in the
ECD, noting the selection of the representative environments that have been chosen to demonstrate
the interaction of critical ecosystem components, processes and services.
Figure 3-27 depicts the estuarine shoreline and island habitats that are characteristic of those
wetlands found at and around the mouth of the South Alligator River. The wetland environments
within this area are strongly influenced by tidal processes, noting the remarkable diversity of wetland
environments (and associated ecosystem services) supported by Field Island.
Figure 3-28 and Figure 3-29 depict the floodplain wetland habitat characteristic of the South Alligator
River near the tidal interface of the River with the Yellow Water area. Seasonal models have been
presented (dry season and wet season) to illustrate the changes to use of the site during the
seasonal cycle by waterbirds, crocodiles and other key wetland fauna. In the tropical monsoon

8BCRITICAL COMPONENTS, PROCESSES AND SERVICES/BENEFITS
137
environments of Kakadu National Park, these species and groups are heavily influenced by water
levels, rainfall and other climatic conditions which control key life cycle processes such as migrations
and breeding.
Figure 3-30 depicts the freshwater wetland habitats characteristic of the upper catchment of the
South Alligator and Magela Floodplains, leading through the monsoon forests into the escarpment
and the Stone Country. As outlined in the critical services section, the pool habitats within the
escarpment are particularly notable in this region of the Park, supporting a range of endemic
invertebrate and fish species, freshwater crocodiles and various waterbird species.
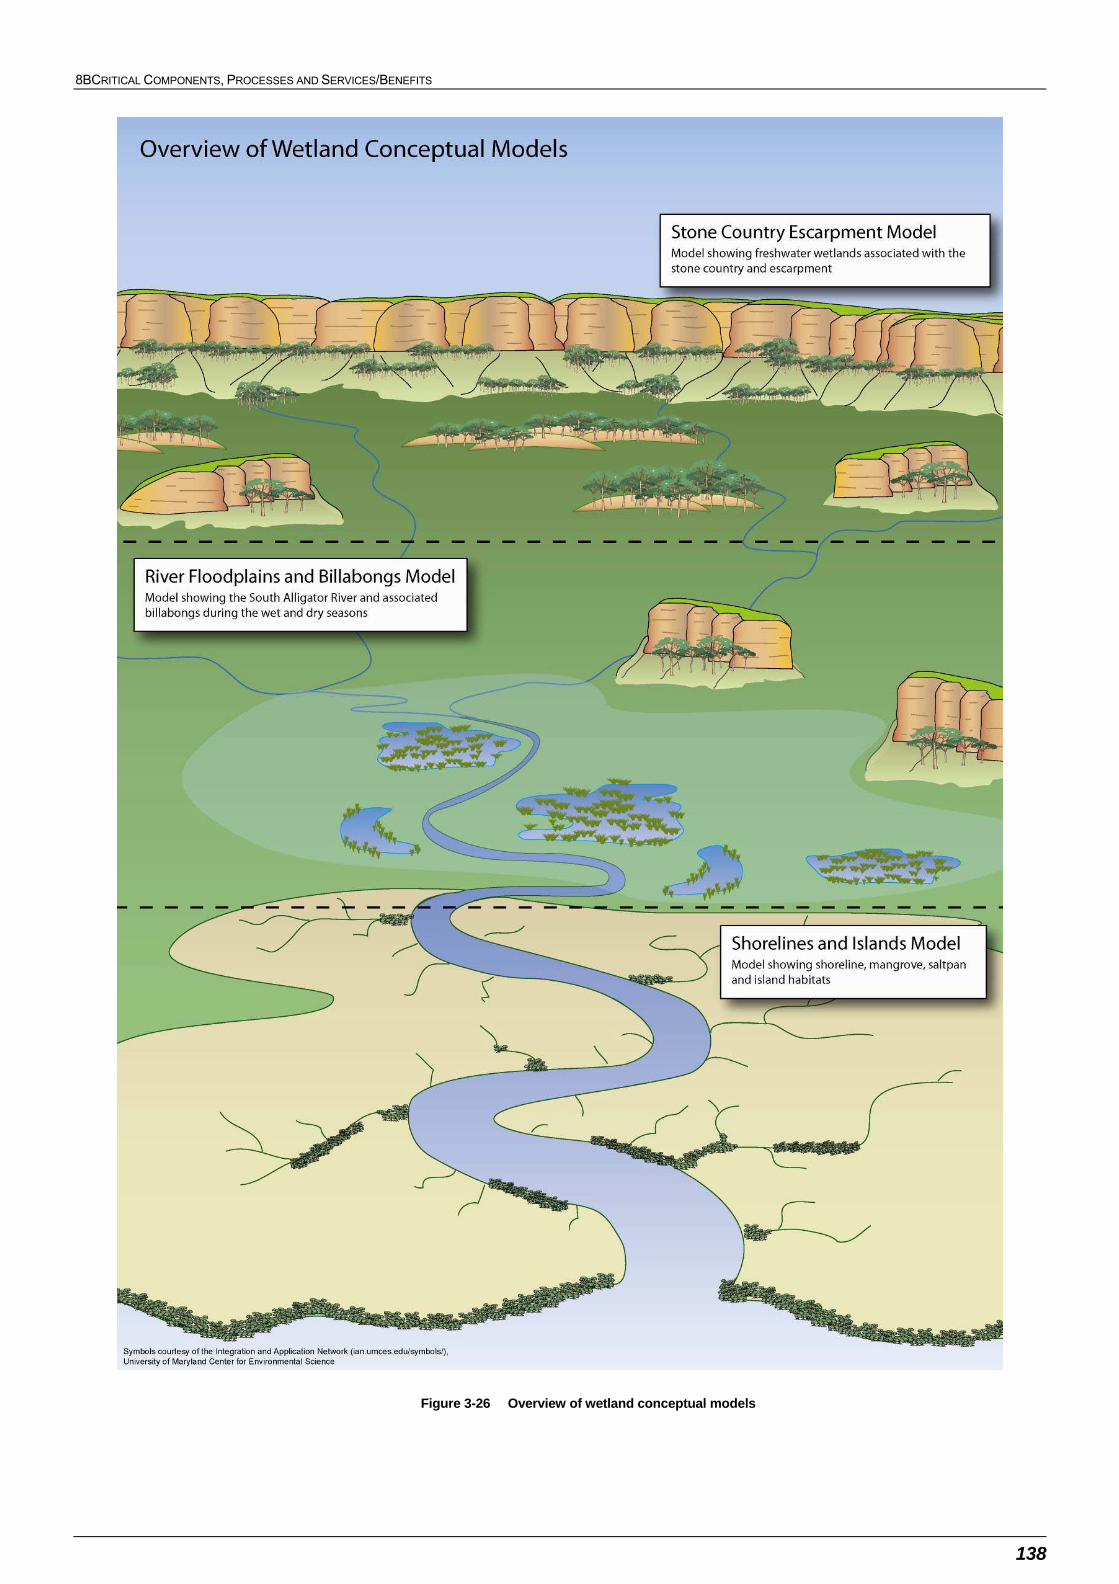
8BCRITICAL COMPONENTS, PROCESSES AND SERVICES/BENEFITS
138
Figure 3-26 Overview of wetland conceptual models
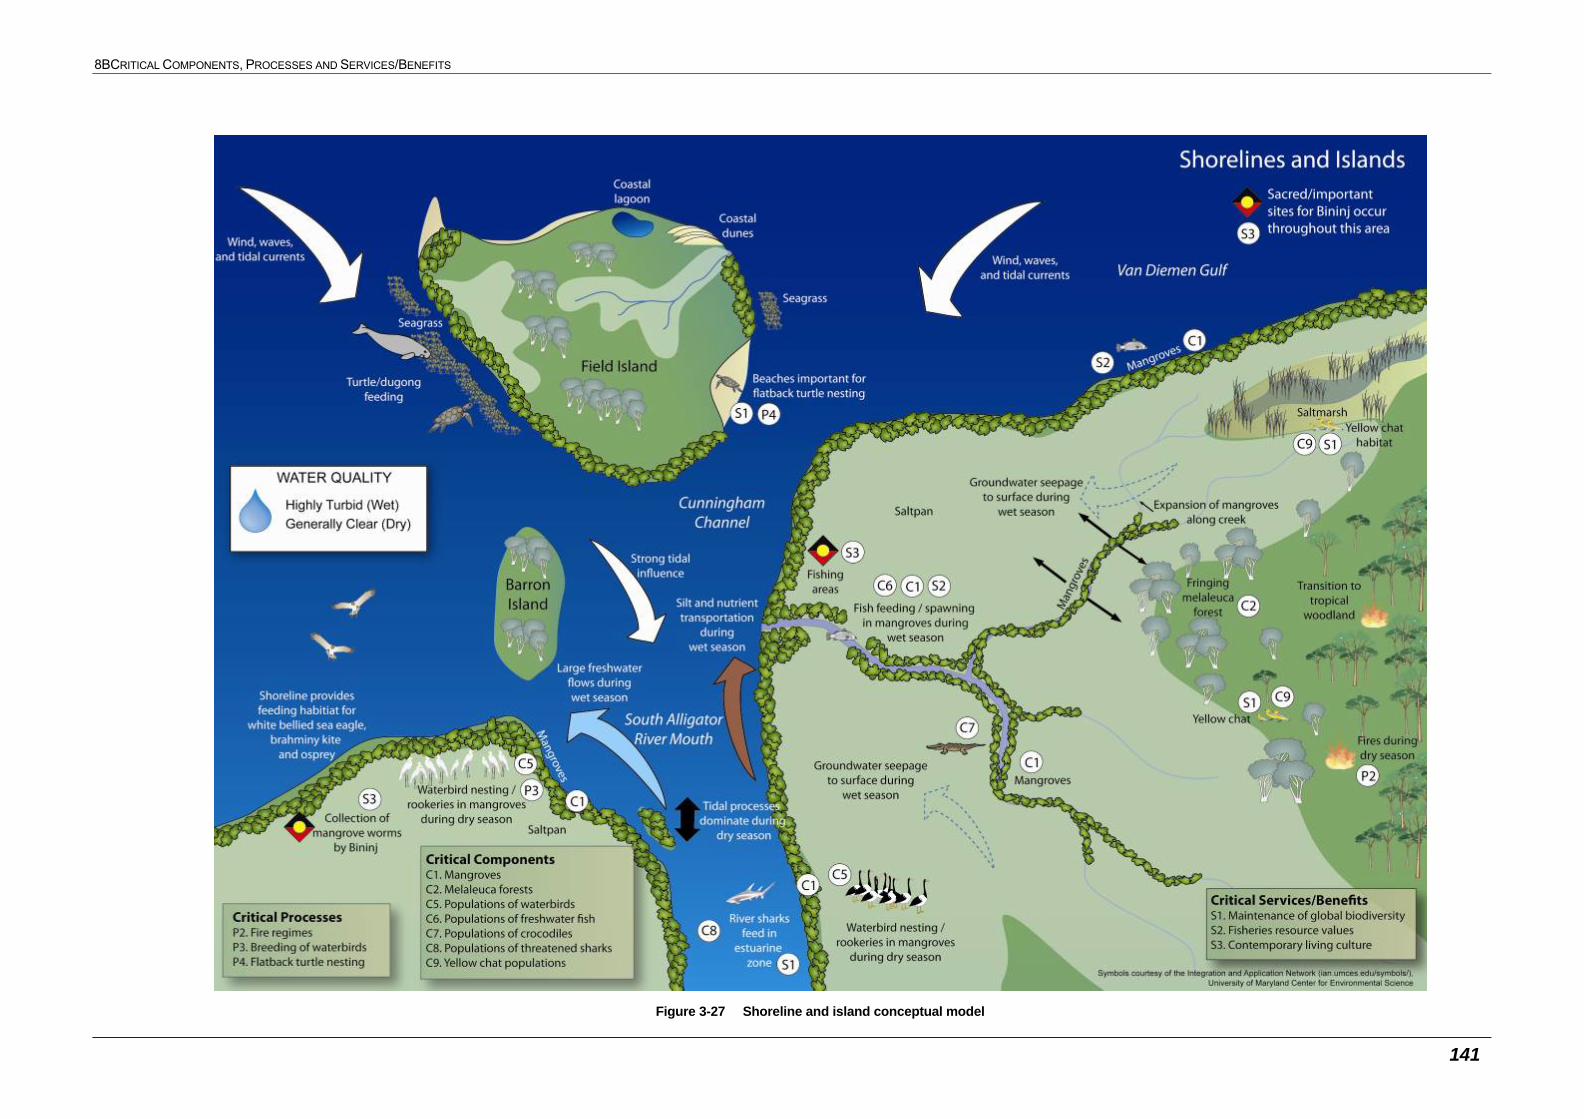
8BCRITICAL COMPONENTS, PROCESSES AND SERVICES/BENEFITS
141
Figure 3-27 Shoreline and island conceptual model
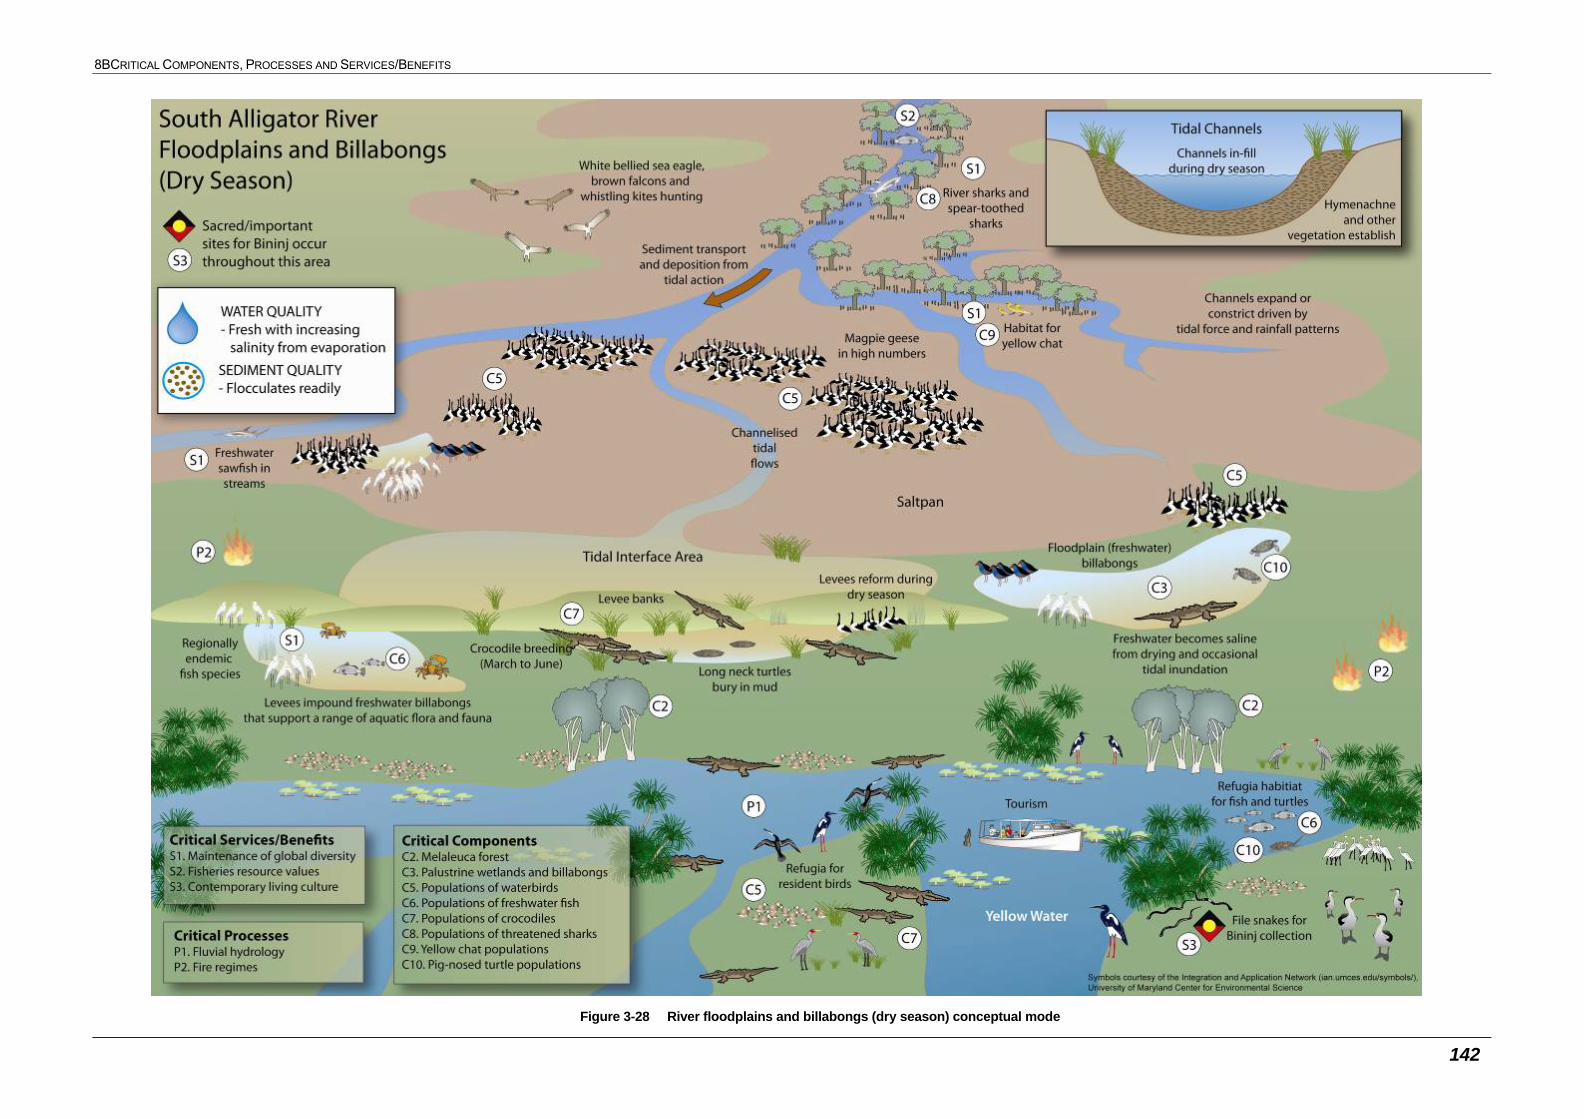
8BCRITICAL COMPONENTS, PROCESSES AND SERVICES/BENEFITS
142
Figure 3-28 River floodplains and billabongs (dry season) conceptual mode
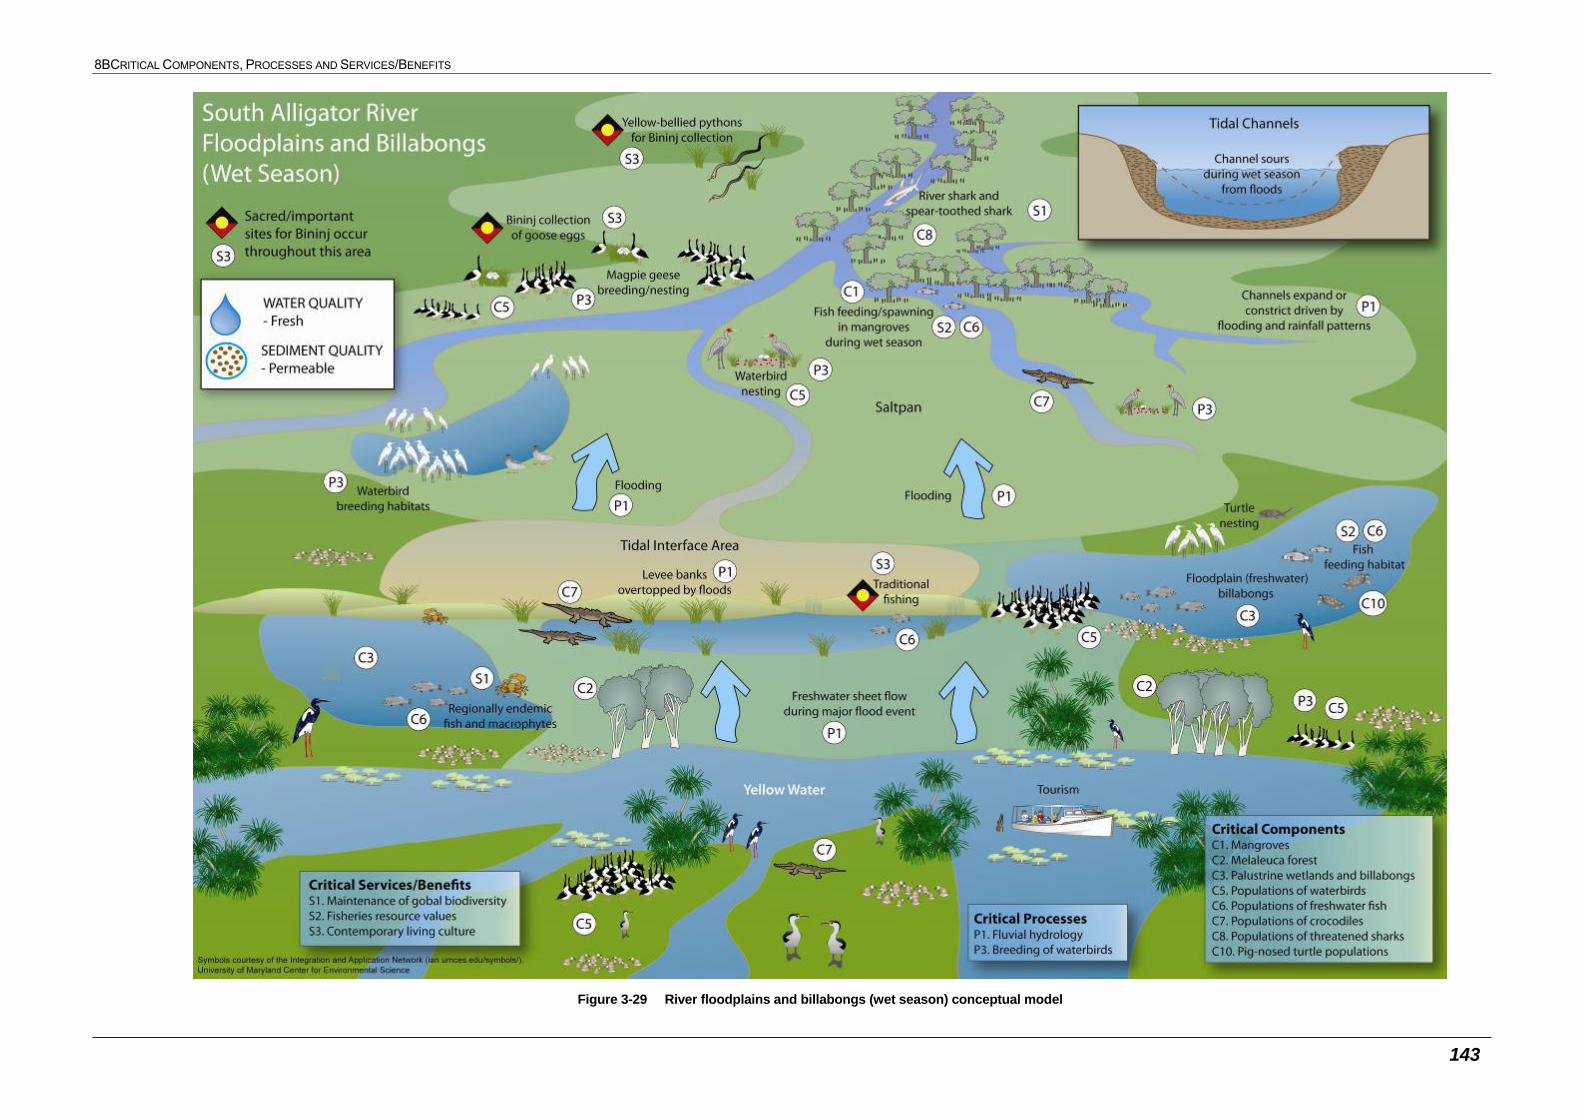
8BCRITICAL COMPONENTS, PROCESSES AND SERVICES/BENEFITS
143
Figure 3-29 River floodplains and billabongs (wet season) conceptual model
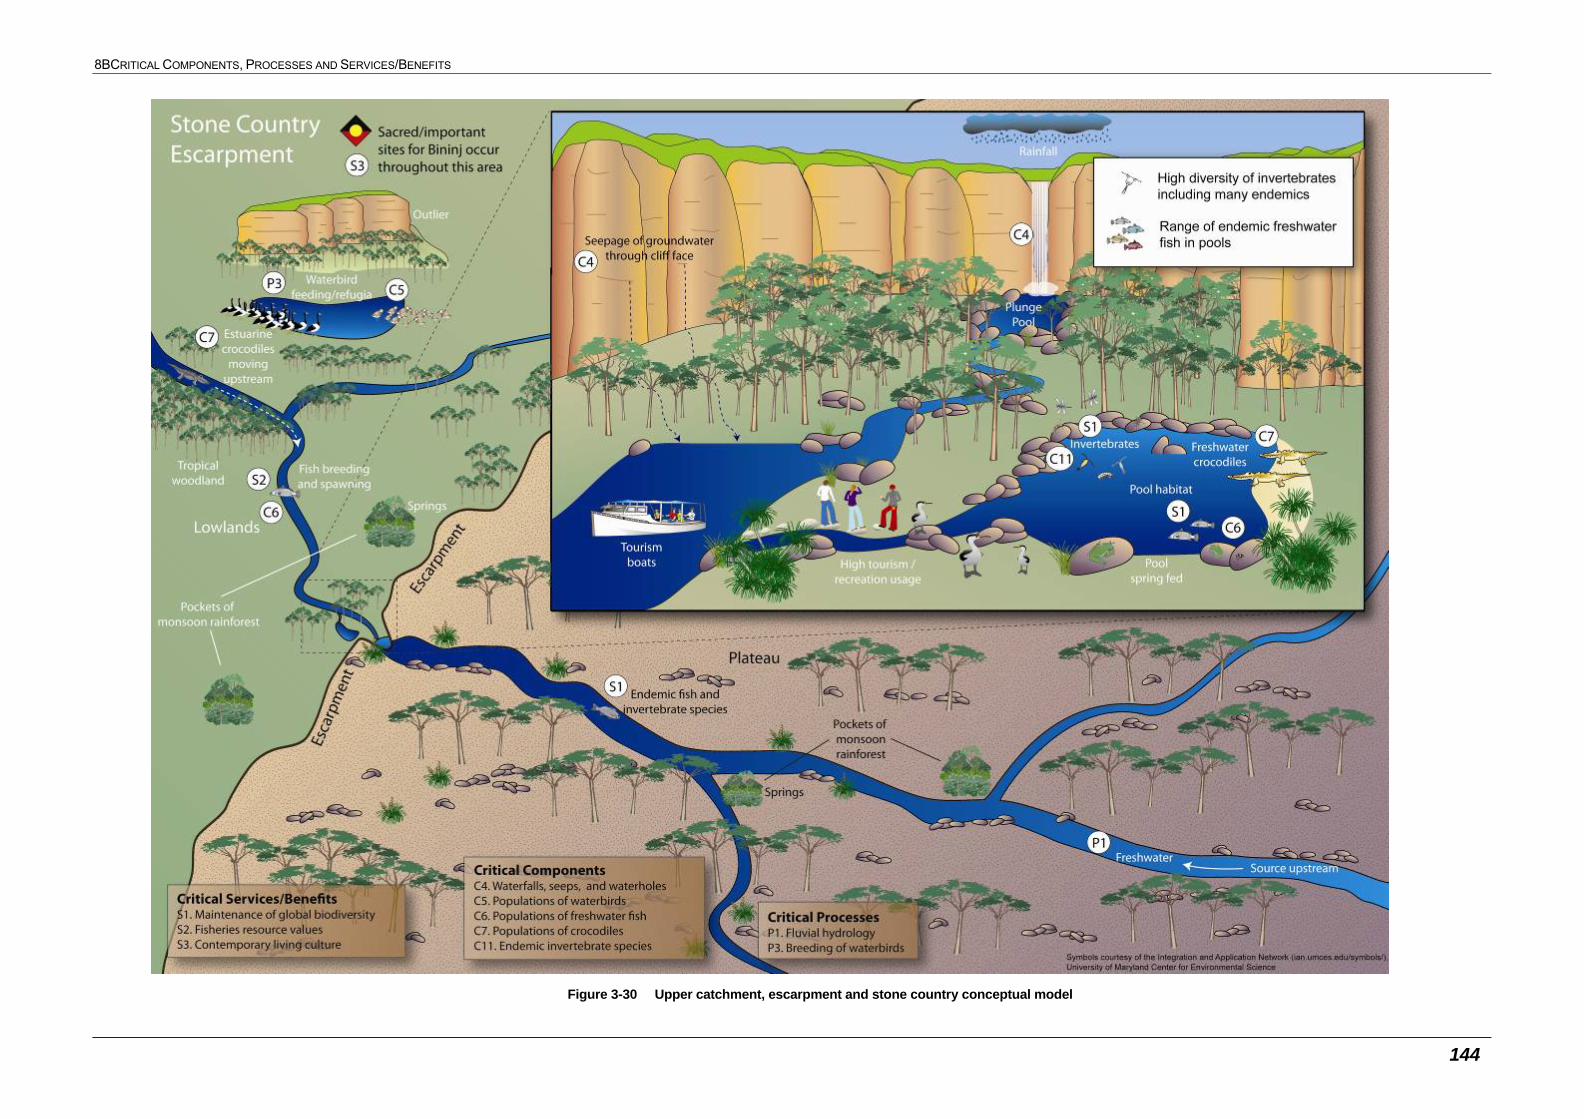
8BCRITICAL COMPONENTS, PROCESSES AND SERVICES/BENEFITS
144
Figure 3-30 Upper catchment, escarpment and stone country conceptual model
9BLIMITS OF ACCEPTABLE CHANGE
145
4 LIMITS OF ACCEPTABLE CHANGE
4.1 Background
A key requirement of the ECD is to define the limits of acceptable change (LACs) for the critical
components, processes and services/benefits of the wetland. LACs are defined as ‘the variation that
is considered acceptable in a particular measure of feature of the ecological character of the wetland’
(DEWHA 2008). The LACs may equal the natural variability or may be set at some other value. LACs
are based on quantitative information from relevant monitoring programs, scientific papers, technical
reports, or other publications and information about the wetland or input from wetland scientists and
experts.
Consistent with the above, the approach taken for the identification of LACs for the Kakadu National
Park Ramsar site has been the following:
to assess natural variability and provide limits of acceptable change for each of the critical
services/benefits and to identify, where relevant, particular aspects of the service for which LACs
have been derived, and
to assess natural variability and provide LACs for critical wetland ecosystem components and
processes specifically in the context of those wetland species (for example, species of
conservation significance), populations (for example, waterbirds, fish) and habitat types (for
example, seagrass, Melaleuca) that underpin the critical services/benefits.
It should be noted that in deriving the LACs as part of the current study, there are significant data and
knowledge gaps and as a result, there are high levels of uncertainty associated with deriving the
limits. As such, the LACs should be regarded by the site manager and other users of the document
as being based on current knowledge and best professional judgement at the time of preparation of
this ECD document, but need to be subject to further expert review over time and evaluated as
knowledge about the site and it’s ecological character improves.
In interpreting and assessing compliance with the LACs, a change to ecological character will
generally be deemed to have occurred where an LAC has been exceeded. In most cases this will
need to be determined through monitoring of the extent and condition of key wetland parameters
(refer Section 7.2) and may require several sampling episodes in order to determine that the change
is not part of broader natural variability of the system (for example, LACs based on a percent
reduction in the use of the site by waterbirds based on successive counts of waterbirds over a
specified time period).
It should also be noted that there may be a range of processes occurring outside of the site that could
affect the exceedance of a particular LAC; for example, the populations of migratory species that use
the site. As such, in the future evaluation of LACs it is important to determine if the underlying reason
for the exceedance of an LAC is attributable to natural variability, related to anthropogenic impacts on
or near the site or alternatively a result of anthropogenic impacts off the site (for example, lack of
available breeding habitat for migratory birds in the northern hemisphere).

9BLIMITS OF ACCEPTABLE CHANGE
146
4.2 Derivation of Limits of Acceptable Change
In developing LACs as part of this ECD, a number of approaches were adopted, using existing data
sets and information as well as national, state and local guidelines (see also Appendix B.2).
4.2.1 Natural Variability and Probability Based LACs
Defining Baseline Conditions
As outlined in the National Framework, it is most preferable for LACs to be based on the known
natural variability (over time) of a parameter. The LAC can then be set at the upper and lower bounds
of that natural variability profile in the time period leading up to Ramsar site declaration. However, in
most cases such data are unavailable or incomplete.
Recognising these information gaps, particularly with respect to natural variability prior to listing, we
have adopted the following hierarchy (in order of preference) for establishing baseline conditions and
natural variability:
1. Empirical data (pre-listing) data describing natural variability prior to site declaration; or
2. Empirical data (post-listing) for parameters that are unlikely to have substantially changed since
listing; or
3. Empirical data/qualitative data for parameters that may have changed since listing, but represent
the only available data for establishing ‘baseline conditions’.
Where there are no data (or very few data), this has been identified as an information gap and a
recommended LAC has been provided that could be used, should data become available as result of
future studies.
Defining Baseline Data Quality
In characterising the baseline information used in deriving LACs, the following typology has been
used:
Level A – This LAC has been developed from data and/or information (such as bird count data,
fisheries catch data or similar) that has been reviewed by the authors and deemed to be
sufficient for setting an LAC. This type of LAC is typically derived from long-term monitoring data;
Level B – This type of LAC is derived from empirical data, but is unlikely to describe the range of
natural variability in time. This can include two sub-types:
Repeated measurements but over a limited temporal context;
Single measurement (no temporal context) of the extent of a particular habitat type,
abundance of a species or diversity of an assemblage;
Level C – This type of LAC is not based on empirical data describing patterns in natural
variability. This can include two sub-types:
Based on a published or other acceptable source of information, such as personal
communication with relevant scientists and researchers, or is taken from referenced
studies as part of management plans, journal articles or similar documents;
9BLIMITS OF ACCEPTABLE CHANGE
147
Where there are no or limited data sets and a lack of published information about the
parameter, and the LAC has been derived based on the best professional judgement of
the authors.
The LAC tables below provide a LAC quality rating incorporating both the baseline data
characteristics (see Defining Baseline Conditions above) and data quality (Level A, B or C).
Measures Used to Describe LACs
Depending on the LAC parameter under consideration, several types of measures may be used to
describe natural variability:
Percentile values. The use of percentile values allows for some change in the measured
parameter, but still within the range of natural variability. Common examples of this type of LAC
include water quality and biological indicator guideline values derived from statistical analysis of
reference datasets. This approach is conceptually similar to the approach used for assessing
water quality guideline values (for example, ANZECC/ARMCANZ 2000). Refer to Table 4-1 for
an outline of the approach used to define percentile-based LACs.
An allowable proportional change relative to a baseline value. While the use of percentile values
to describe natural variability (and therefore LACs) is typically preferred, this is not always
possible due to data limitations (such as insufficient baseline data to derive percentile values),
and/or in some cases it is not meaningful to use percentiles due to the pattern in variability of the
measured parameter (for example, the extent of some habitat types which show low natural
variability). Similar to the approach used to define percentile-based LACs, professional
judgement was used to set ‘proportional change’ based LAC values, based on criteria outlined in
Table 4-1.
Broad Ecosystem State and Function
This type of LAC is based on a broad change in an ecosystem from one state to another or on the
basis of the wetland continuing to provide a particular function (such as provision of breeding habitat).
An example of this type of LAC is a change in a particular wetland from a freshwater system to a
brackish water system. This type of LAC has the advantage of encompassing a variety of indicators,
and specifically addresses ecosystem end-points that can be directly linked to high level critical
components and services. This type of LAC is particularly relevant where there is a lack of data and
information to support a more quantitative LAC about ecological response or threshold.
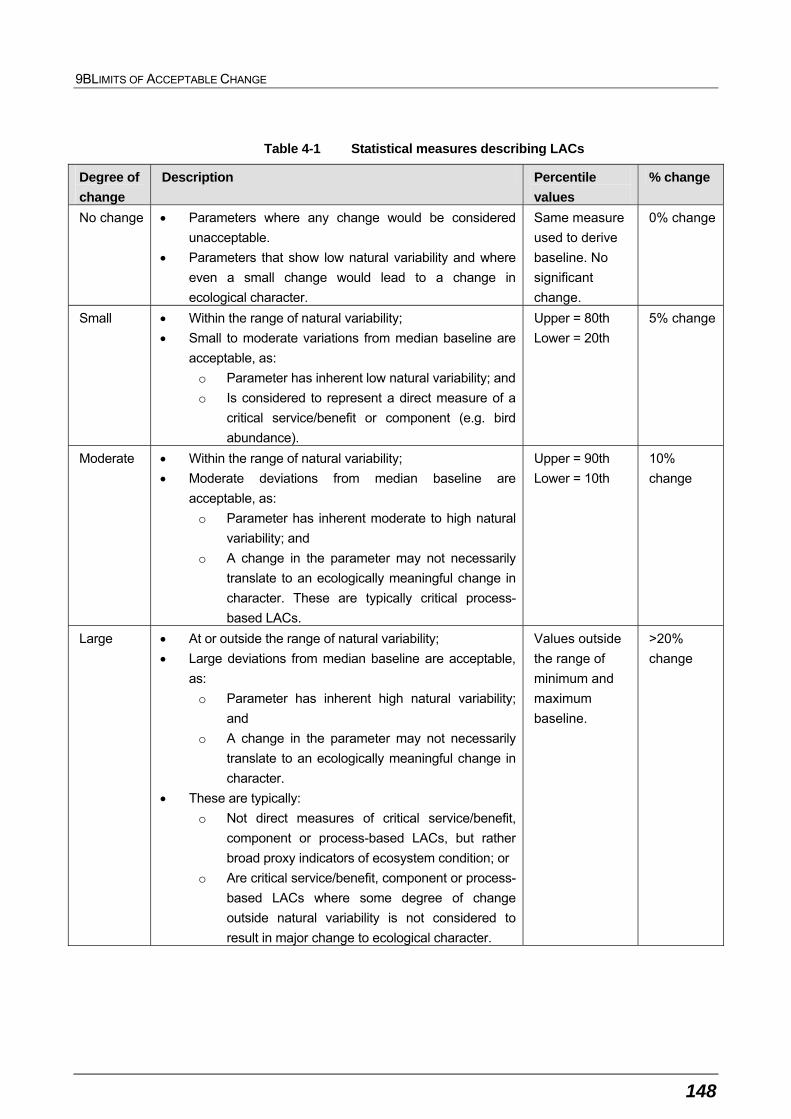
9BLIMITS OF ACCEPTABLE CHANGE
148
Table 4-1 Statistical measures describing LACs
Degree of
change
Description Percentile
values
% change
No change Parameters where any change would be considered
unacceptable.
Parameters that show low natural variability and where
even a small change would lead to a change in
ecological character.
Same measure
used to derive
baseline. No
significant
change.
0% change
Small Within the range of natural variability;
Small to moderate variations from median baseline are
acceptable, as:
o Parameter has inherent low natural variability; and
o Is considered to represent a direct measure of a
critical service/benefit or component (e.g. bird
abundance).
Upper = 80th
Lower = 20th
5% change
Moderate Within the range of natural variability;
Moderate deviations from median baseline are
acceptable, as:
o Parameter has inherent moderate to high natural
variability; and
o A change in the parameter may not necessarily
translate to an ecologically meaningful change in
character. These are typically critical process-
based LACs.
Upper = 90th
Lower = 10th
10%
change
Large At or outside the range of natural variability;
Large deviations from median baseline are acceptable,
as:
o Parameter has inherent high natural variability;
and
o A change in the parameter may not necessarily
translate to an ecologically meaningful change in
character.
These are typically:
o Not direct measures of critical service/benefit,
component or process-based LACs, but rather
broad proxy indicators of ecosystem condition; or
o Are critical service/benefit, component or process-
based LACs where some degree of change
outside natural variability is not considered to
result in major change to ecological character.
Values outside
the range of
minimum and
maximum
baseline.
>20%
change
9BLIMITS OF ACCEPTABLE CHANGE
149
4.3 Summary of Limits of Acceptable Change
Table 4-2 lists the LAC indicators relevant to each critical component process and service/benefit,
and Table 4-3 outlines the specific LACs. For each LAC indicator outlined in the Table 4-3, the
following information is provided: (i) the degree of acceptable change based on the typology outlined
in Table 4-1 (refer to Appendix B for details); (ii) LAC values describing the degree of allowable
change (relative to baseline conditions – see Appendix B) in the short-term (within 20 years of ECD
preparation) or the long-term (greater than 20 years of ECD preparation); (iii) the spatial and temporal
scale at which measurements must be undertaken to assess the LAC; (iv) data quality rating for
baseline data and (v) secondary critical component, process and service/benefits addressed by the
LAC. Short-term LACs should be reviewed to determine their potential applicability in subsequent
periods (that is, post 2030).
As shown in Table 4-3, in most cases, the LACs in the current study have been subjectively derived
(level 3) based on the best scientific judgement of the authors. This is due to:
a largely incomplete data set for key parameters such as waterbird usage, fish usage and
environment condition (both geographically and temporally) since listing, and
the general lack of scientific knowledge about the response of particular species and habitats to
multiple stressors (for instance a combination of water flows, salinity and habitat availability).
Further discussion on these information gaps is provided in Section 7.1 of this document.
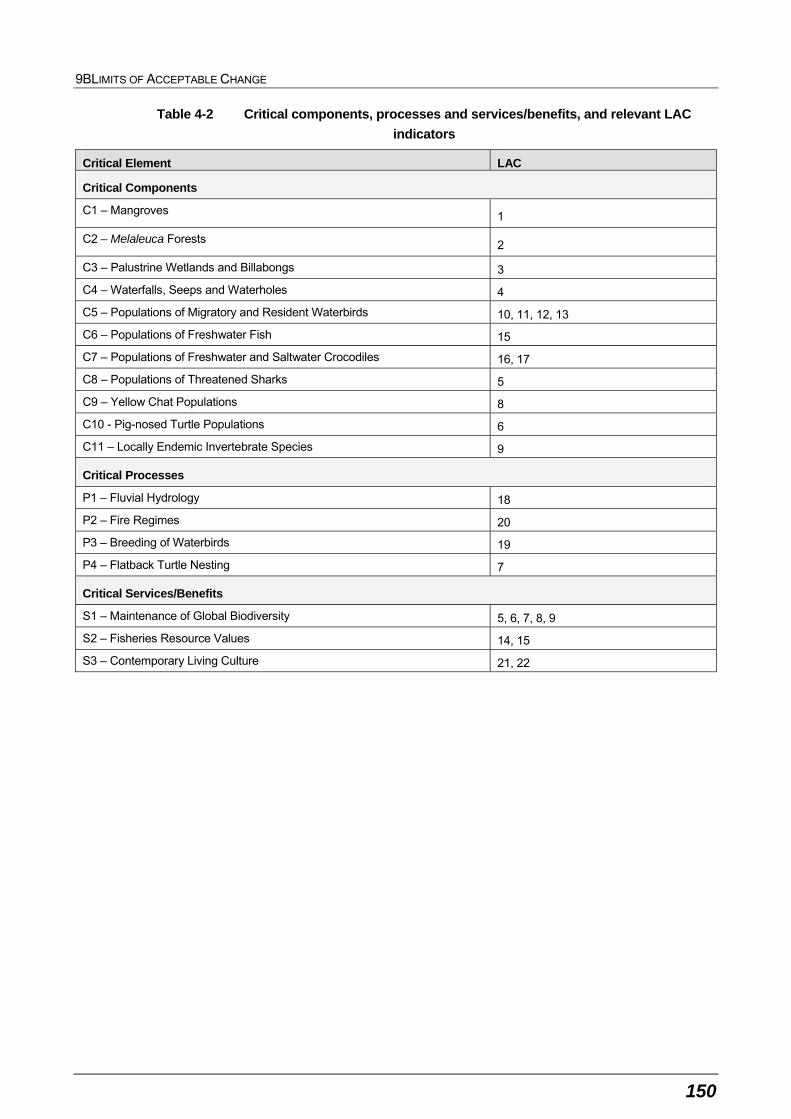
9BLIMITS OF ACCEPTABLE CHANGE
150
Table 4-2 Critical components, processes and services/benefits, and relevant LAC
indicators
Critical Element LAC
Critical Components
C1 – Mangroves 1
C2 – Melaleuca Forests 2
C3 – Palustrine Wetlands and Billabongs 3
C4 – Waterfalls, Seeps and Waterholes 4
C5 – Populations of Migratory and Resident Waterbirds 10, 11, 12, 13
C6 – Populations of Freshwater Fish 15
C7 – Populations of Freshwater and Saltwater Crocodiles 16, 17
C8 – Populations of Threatened Sharks 5
C9 – Yellow Chat Populations 8
C10 - Pig-nosed Turtle Populations 6
C11 – Locally Endemic Invertebrate Species 9
Critical Processes
P1 – Fluvial Hydrology 18
P2 – Fire Regimes 20
P3 – Breeding of Waterbirds 19
P4 – Flatback Turtle Nesting 7
Critical Services/Benefits
S1 – Maintenance of Global Biodiversity 5, 6, 7, 8, 9
S2 – Fisheries Resource Values 14, 15
S3 – Contemporary Living Culture 21, 22
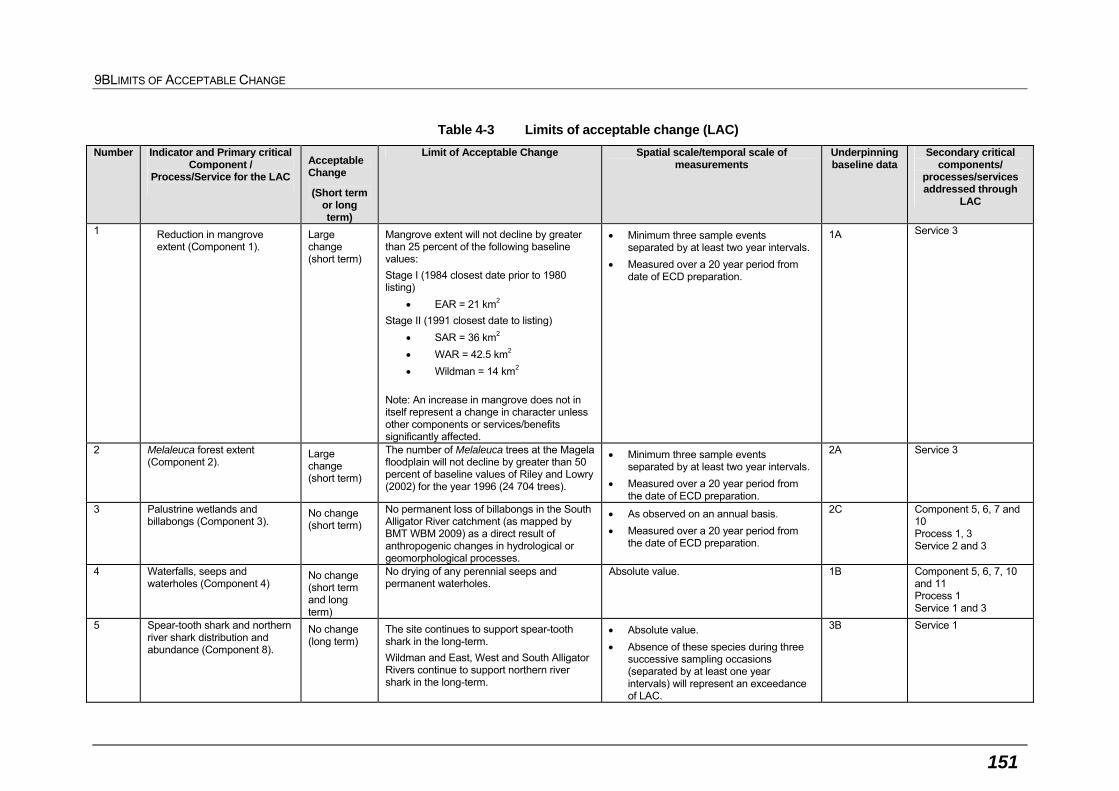
9BLIMITS OF ACCEPTABLE CHANGE
151
Table 4-3 Limits of acceptable change (LAC)
Number Indicator and Primary critical Component /
Process/Service for the LAC
Acceptable Change
(Short term or long term)
Limit of Acceptable Change Spatial scale/temporal scale of measurements
Underpinning baseline data
Secondary critical components/
processes/services addressed through
LAC
1 Reduction in mangrove extent (Component 1).
Large change (short term)
Mangrove extent will not decline by greater than 25 percent of the following baseline values:
Stage I (1984 closest date prior to 1980 listing)
EAR = 21 km2
Stage II (1991 closest date to listing)
SAR = 36 km2
WAR = 42.5 km2
Wildman = 14 km2
Note: An increase in mangrove does not in itself represent a change in character unless other components or services/benefits significantly affected.
Minimum three sample events separated by at least two year intervals.
Measured over a 20 year period from date of ECD preparation.
1A
Service 3
2 Melaleuca forest extent (Component 2).
Large change (short term)
The number of Melaleuca trees at the Magela floodplain will not decline by greater than 50 percent of baseline values of Riley and Lowry (2002) for the year 1996 (24 704 trees).
Minimum three sample events separated by at least two year intervals.
Measured over a 20 year period from the date of ECD preparation.
2A Service 3
3 Palustrine wetlands and billabongs (Component 3).
No change (short term)
No permanent loss of billabongs in the South Alligator River catchment (as mapped by BMT WBM 2009) as a direct result of anthropogenic changes in hydrological or geomorphological processes.
As observed on an annual basis.
Measured over a 20 year period from the date of ECD preparation.
2C Component 5, 6, 7 and 10 Process 1, 3 Service 2 and 3
4 Waterfalls, seeps and waterholes (Component 4)
No change (short term and long term)
No drying of any perennial seeps and permanent waterholes.
Absolute value. 1B Component 5, 6, 7, 10 and 11 Process 1 Service 1 and 3
5 Spear-tooth shark and northern river shark distribution and abundance (Component 8).
No change (long term)
The site continues to support spear-tooth shark in the long-term.
Wildman and East, West and South Alligator Rivers continue to support northern river shark in the long-term.
Absolute value.
Absence of these species during three successive sampling occasions (separated by at least one year intervals) will represent an exceedance of LAC.
3B Service 1
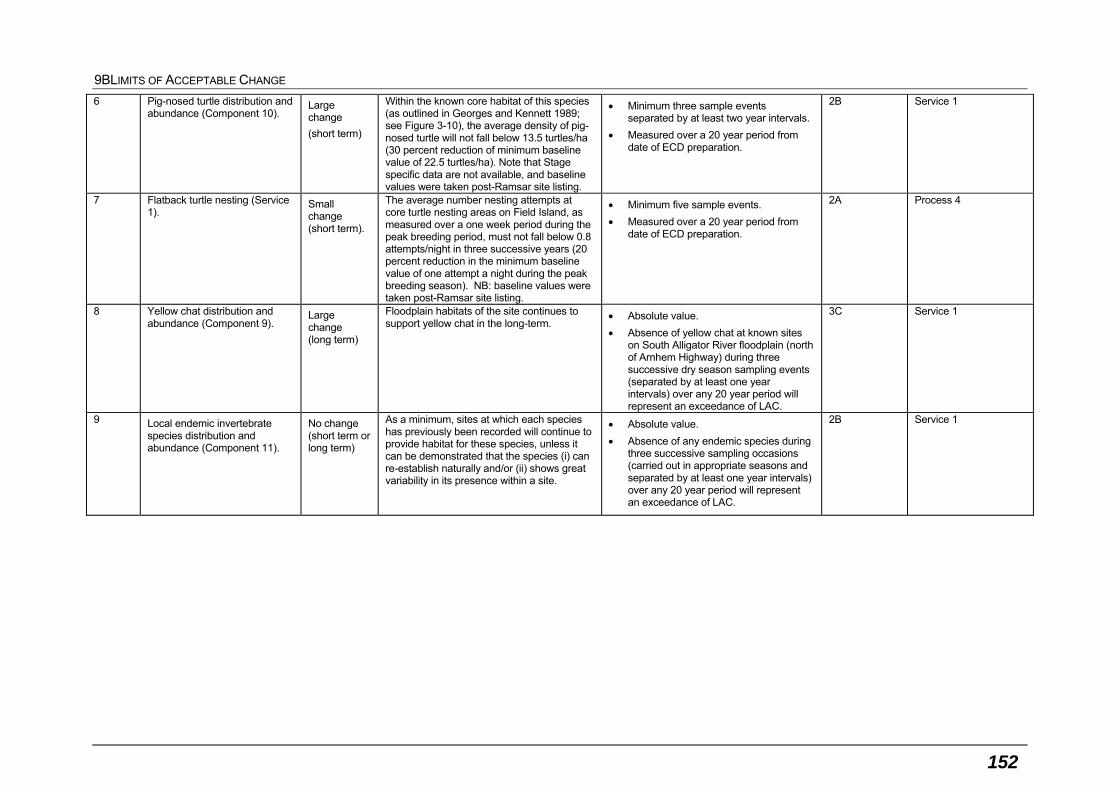
9BLIMITS OF ACCEPTABLE CHANGE
152
6 Pig-nosed turtle distribution and abundance (Component 10).
Large change
(short term)
Within the known core habitat of this species (as outlined in Georges and Kennett 1989; see Figure 3-10), the average density of pig-nosed turtle will not fall below 13.5 turtles/ha (30 percent reduction of minimum baseline value of 22.5 turtles/ha). Note that Stage specific data are not available, and baseline values were taken post-Ramsar site listing.
Minimum three sample events separated by at least two year intervals.
Measured over a 20 year period from date of ECD preparation.
2B Service 1
7 Flatback turtle nesting (Service 1).
Small change (short term).
The average number nesting attempts at core turtle nesting areas on Field Island, as measured over a one week period during the peak breeding period, must not fall below 0.8 attempts/night in three successive years (20 percent reduction in the minimum baseline value of one attempt a night during the peak breeding season). NB: baseline values were taken post-Ramsar site listing.
Minimum five sample events.
Measured over a 20 year period from date of ECD preparation.
2A Process 4
8 Yellow chat distribution and abundance (Component 9).
Large change (long term)
Floodplain habitats of the site continues to support yellow chat in the long-term.
Absolute value.
Absence of yellow chat at known sites on South Alligator River floodplain (north of Arnhem Highway) during three successive dry season sampling events (separated by at least one year intervals) over any 20 year period will represent an exceedance of LAC.
3C Service 1
9 Local endemic invertebrate species distribution and abundance (Component 11).
No change (short term or long term)
As a minimum, sites at which each species has previously been recorded will continue to provide habitat for these species, unless it can be demonstrated that the species (i) can re-establish naturally and/or (ii) shows great variability in its presence within a site.
Absolute value.
Absence of any endemic species during three successive sampling occasions (carried out in appropriate seasons and separated by at least one year intervals) over any 20 year period will represent an exceedance of LAC.
2B Service 1
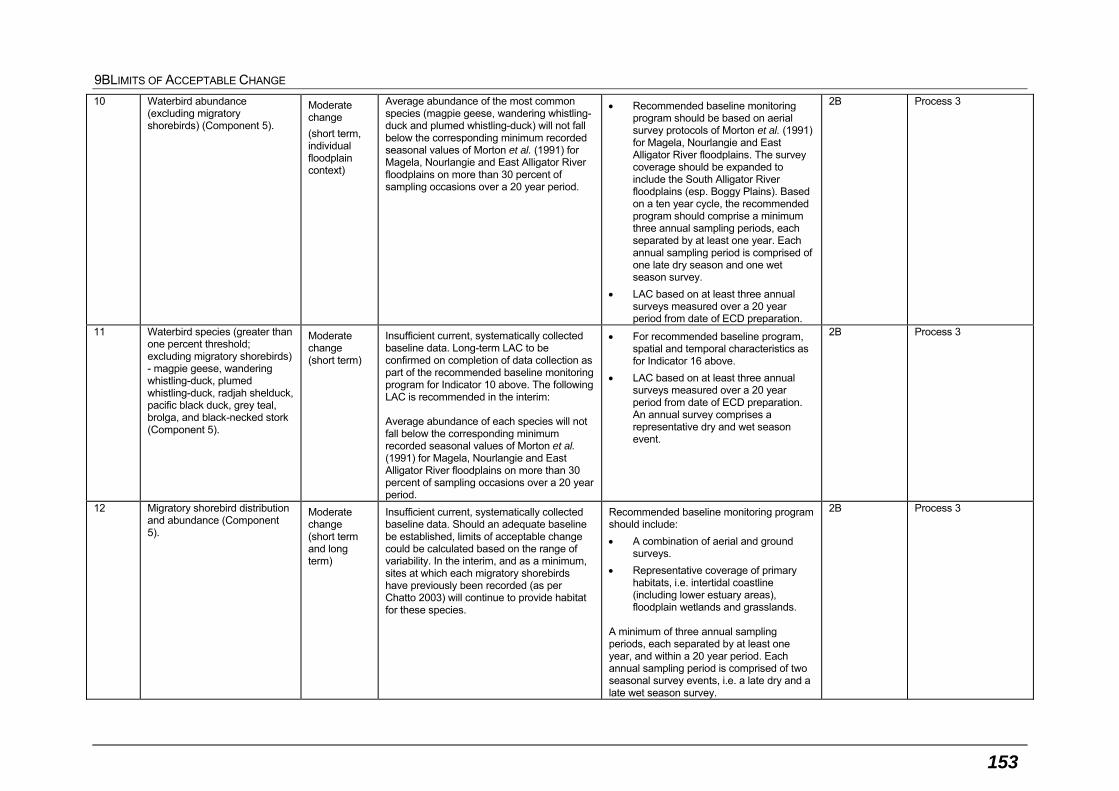
9BLIMITS OF ACCEPTABLE CHANGE
153
10 Waterbird abundance (excluding migratory shorebirds) (Component 5).
Moderate change
(short term, individual floodplain context)
Average abundance of the most common species (magpie geese, wandering whistling-duck and plumed whistling-duck) will not fall below the corresponding minimum recorded seasonal values of Morton et al. (1991) for Magela, Nourlangie and East Alligator River floodplains on more than 30 percent of sampling occasions over a 20 year period.
Recommended baseline monitoring program should be based on aerial survey protocols of Morton et al. (1991) for Magela, Nourlangie and East Alligator River floodplains. The survey coverage should be expanded to include the South Alligator River floodplains (esp. Boggy Plains). Based on a ten year cycle, the recommended program should comprise a minimum three annual sampling periods, each separated by at least one year. Each annual sampling period is comprised of one late dry season and one wet season survey.
LAC based on at least three annual surveys measured over a 20 year period from date of ECD preparation.
2B Process 3
11 Waterbird species (greater than one percent threshold; excluding migratory shorebirds) - magpie geese, wandering whistling-duck, plumed whistling-duck, radjah shelduck, pacific black duck, grey teal, brolga, and black-necked stork (Component 5).
Moderate change (short term)
Insufficient current, systematically collected baseline data. Long-term LAC to be confirmed on completion of data collection as part of the recommended baseline monitoring program for Indicator 10 above. The following LAC is recommended in the interim: Average abundance of each species will not fall below the corresponding minimum recorded seasonal values of Morton et al. (1991) for Magela, Nourlangie and East Alligator River floodplains on more than 30 percent of sampling occasions over a 20 year period.
For recommended baseline program, spatial and temporal characteristics as for Indicator 16 above.
LAC based on at least three annual surveys measured over a 20 year period from date of ECD preparation. An annual survey comprises a representative dry and wet season event.
2B Process 3
12 Migratory shorebird distribution and abundance (Component 5).
Moderate change (short term and long term)
Insufficient current, systematically collected baseline data. Should an adequate baseline be established, limits of acceptable change could be calculated based on the range of variability. In the interim, and as a minimum, sites at which each migratory shorebirds have previously been recorded (as per Chatto 2003) will continue to provide habitat for these species.
Recommended baseline monitoring program should include:
A combination of aerial and ground surveys.
Representative coverage of primary habitats, i.e. intertidal coastline (including lower estuary areas), floodplain wetlands and grasslands.
A minimum of three annual sampling periods, each separated by at least one year, and within a 20 year period. Each annual sampling period is comprised of two seasonal survey events, i.e. a late dry and a late wet season survey.
2B Process 3
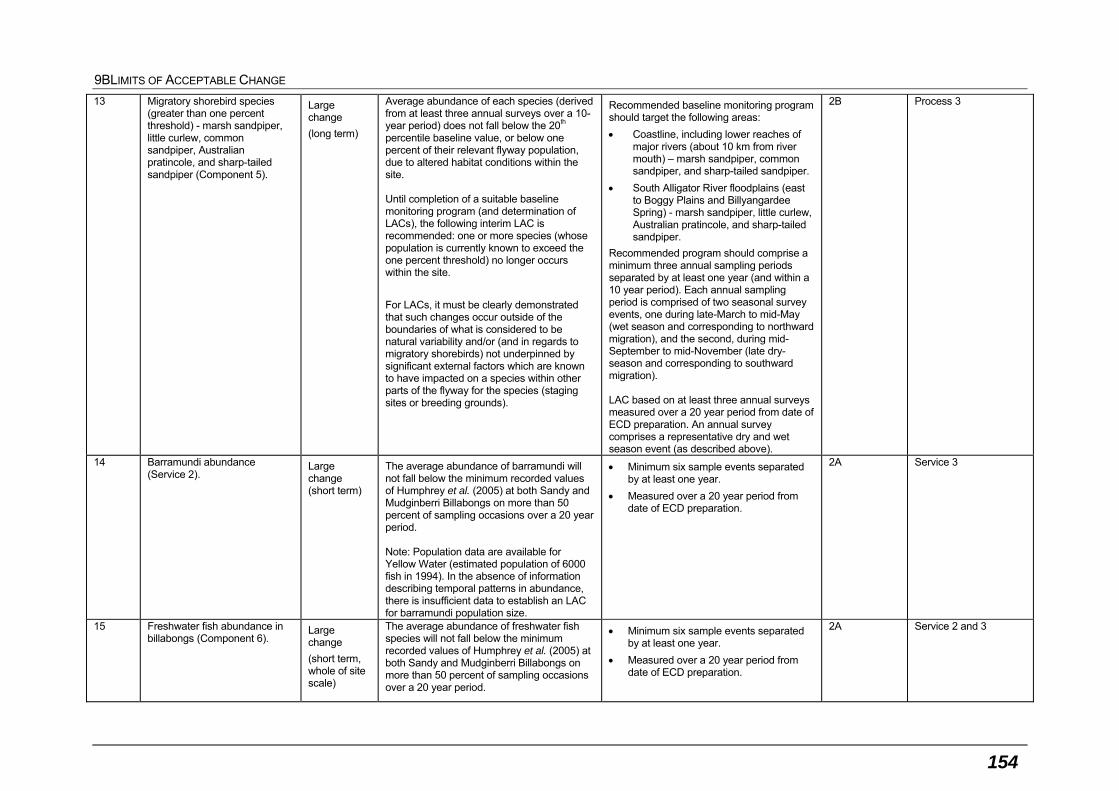
9BLIMITS OF ACCEPTABLE CHANGE
154
13 Migratory shorebird species (greater than one percent threshold) - marsh sandpiper, little curlew, common sandpiper, Australian pratincole, and sharp-tailed sandpiper (Component 5).
Large change
(long term)
Average abundance of each species (derived from at least three annual surveys over a 10-year period) does not fall below the 20th percentile baseline value, or below one percent of their relevant flyway population, due to altered habitat conditions within the site. Until completion of a suitable baseline monitoring program (and determination of LACs), the following interim LAC is recommended: one or more species (whose population is currently known to exceed the one percent threshold) no longer occurs within the site.
For LACs, it must be clearly demonstrated that such changes occur outside of the boundaries of what is considered to be natural variability and/or (and in regards to migratory shorebirds) not underpinned by significant external factors which are known to have impacted on a species within other parts of the flyway for the species (staging sites or breeding grounds).
Recommended baseline monitoring program should target the following areas:
Coastline, including lower reaches of major rivers (about 10 km from river mouth) – marsh sandpiper, common sandpiper, and sharp-tailed sandpiper.
South Alligator River floodplains (east to Boggy Plains and Billyangardee Spring) - marsh sandpiper, little curlew, Australian pratincole, and sharp-tailed sandpiper.
Recommended program should comprise a minimum three annual sampling periods separated by at least one year (and within a 10 year period). Each annual sampling period is comprised of two seasonal survey events, one during late-March to mid-May (wet season and corresponding to northward migration), and the second, during mid-September to mid-November (late dry-season and corresponding to southward migration). LAC based on at least three annual surveys measured over a 20 year period from date of ECD preparation. An annual survey comprises a representative dry and wet season event (as described above).
2B Process 3
14 Barramundi abundance (Service 2).
Large change (short term)
The average abundance of barramundi will not fall below the minimum recorded values of Humphrey et al. (2005) at both Sandy and Mudginberri Billabongs on more than 50 percent of sampling occasions over a 20 year period. Note: Population data are available for Yellow Water (estimated population of 6000 fish in 1994). In the absence of information describing temporal patterns in abundance, there is insufficient data to establish an LAC for barramundi population size.
Minimum six sample events separated by at least one year.
Measured over a 20 year period from date of ECD preparation.
2A Service 3
15 Freshwater fish abundance in billabongs (Component 6).
Large change
(short term, whole of site scale)
The average abundance of freshwater fish species will not fall below the minimum recorded values of Humphrey et al. (2005) at both Sandy and Mudginberri Billabongs on more than 50 percent of sampling occasions over a 20 year period.
Minimum six sample events separated by at least one year.
Measured over a 20 year period from date of ECD preparation.
2A Service 2 and 3
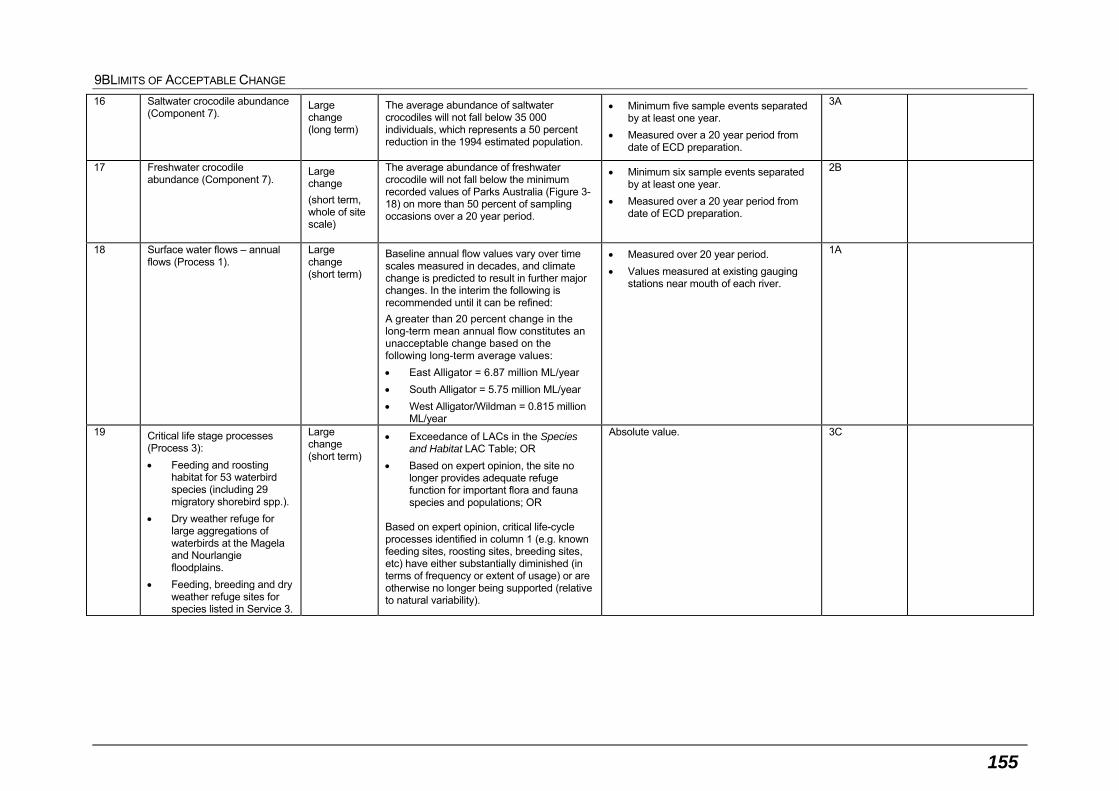
9BLIMITS OF ACCEPTABLE CHANGE
155
16 Saltwater crocodile abundance (Component 7).
Large change (long term)
The average abundance of saltwater crocodiles will not fall below 35 000 individuals, which represents a 50 percent reduction in the 1994 estimated population.
Minimum five sample events separated by at least one year.
Measured over a 20 year period from date of ECD preparation.
3A
17 Freshwater crocodile abundance (Component 7).
Large change
(short term, whole of site scale)
The average abundance of freshwater crocodile will not fall below the minimum recorded values of Parks Australia (Figure 3-18) on more than 50 percent of sampling occasions over a 20 year period.
Minimum six sample events separated by at least one year.
Measured over a 20 year period from date of ECD preparation.
2B
18 Surface water flows – annual flows (Process 1).
Large change (short term)
Baseline annual flow values vary over time scales measured in decades, and climate change is predicted to result in further major changes. In the interim the following is recommended until it can be refined:
A greater than 20 percent change in the long-term mean annual flow constitutes an unacceptable change based on the following long-term average values:
East Alligator = 6.87 million ML/year
South Alligator = 5.75 million ML/year
West Alligator/Wildman = 0.815 million ML/year
Measured over 20 year period.
Values measured at existing gauging stations near mouth of each river.
1A
19 Critical life stage processes (Process 3):
Feeding and roosting habitat for 53 waterbird species (including 29 migratory shorebird spp.).
Dry weather refuge for large aggregations of waterbirds at the Magela and Nourlangie floodplains.
Feeding, breeding and dry weather refuge sites for species listed in Service 3.
Large change (short term)
Exceedance of LACs in the Species and Habitat LAC Table; OR
Based on expert opinion, the site no longer provides adequate refuge function for important flora and fauna species and populations; OR
Based on expert opinion, critical life-cycle processes identified in column 1 (e.g. known feeding sites, roosting sites, breeding sites, etc) have either substantially diminished (in terms of frequency or extent of usage) or are otherwise no longer being supported (relative to natural variability).
Absolute value. 3C

9BLIMITS OF ACCEPTABLE CHANGE
156
20 Fire – frequency (Process 2). Large change (short term)
The area of wetland burnt per year within individual habitat types will not exceed maximum recorded baseline values outlined in Gill et al. (2000) more than twice over a 20 year period.
Baseline values may not represent optimal fire regimes. These values should be reviewed to determine whether other elements of ecological character could be affected by through the maintenance of these regimes.
20 year measurement periods from time of ECD preparation.
Whole-of-site spatial scale and within plateau, lowland and floodplain habitats.
1A
21 Loss or damage to rock art sites, archaeological sites and materials (potentially due to human interference, feral animal damage, weathering, environmental degradation and natural processes including vegetation growth, storms and tidal inundation of flood plains) (Service 3).
Medium change (short term) No change
Changes to the following indicators are considered unacceptable:
A greater than 10 percent reduction in the number of recorded sites due to preventable damage (e.g. human interference, feral animal damage, weathering, environmental degradation) (NB: Kakadu National Park has 203 sacred sites recorded on its list of 5000 recorded cultural sites (with possibly another 2000 sites which have not yet been recorded) stored on a cultural database at Kakadu National Park Headquarters).
A greater than 10 percent reduction in the number of sites managed/maintained (outlined in the cultural database at Kakadu National Park Headquarters) due to preventable damage.
No damage to representative and high priority sites (to be identified through Kakadu National Park’s Cultural Heritage Program).
Absolute measure. 2B
22 Indigenous ‘living culture’ (including the body of Traditional Ecological Knowledge, Bininj languages, traditional fire and land management practices, traditional resource use) (Service 3).
N/A Due to the lack of quantitative data regarding ‘living culture’ attributes, the limits of acceptable change are unable to be defined quantitatively. However a change in the ability of Bininj to own, occupy, access and use the land and resources of Kakadu National Park could result in a loss of ‘living culture’. A change in the ability of Bininj to use and transmit Bininj cultural practices, knowledge, language and spirituality could also result in a loss of ‘living culture’**
N/A N/A

9BLIMITS OF ACCEPTABLE CHANGE
157
Note that where particular areas have been quantified, these are based on the best available data/mapping and should be revised if a more appropriate baseline dataset is derived.
** These cultural elements could be monitored by Bininj and reported through cultural heritage workshops to discuss indicators of ‘living culture’, including: use and transmission of languages, cultural
practices, cultural knowledge; access to land and resources; and the ability to undertake spirituality practices
N/A = no available data
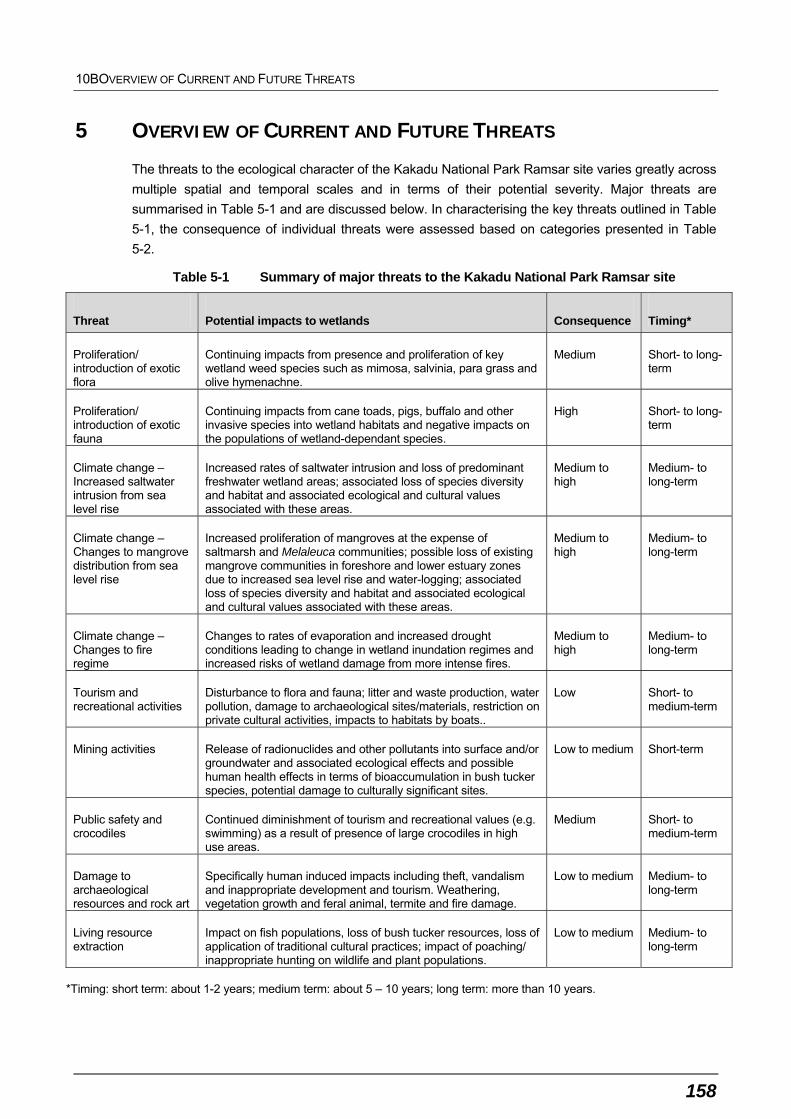
10BOVERVIEW OF CURRENT AND FUTURE THREATS
158
5 OVERVIEW OF CURRENT AND FUTURE THREATS
The threats to the ecological character of the Kakadu National Park Ramsar site varies greatly across
multiple spatial and temporal scales and in terms of their potential severity. Major threats are
summarised in Table 5-1 and are discussed below. In characterising the key threats outlined in Table
5-1, the consequence of individual threats were assessed based on categories presented in Table
5-2.
Table 5-1 Summary of major threats to the Kakadu National Park Ramsar site
Threat Potential impacts to wetlands Consequence Timing*
Proliferation/ introduction of exotic flora
Continuing impacts from presence and proliferation of key wetland weed species such as mimosa, salvinia, para grass and olive hymenachne.
Medium Short- to long-term
Proliferation/ introduction of exotic fauna
Continuing impacts from cane toads, pigs, buffalo and other invasive species into wetland habitats and negative impacts on the populations of wetland-dependant species.
High Short- to long-term
Climate change –Increased saltwater intrusion from sea level rise
Increased rates of saltwater intrusion and loss of predominant freshwater wetland areas; associated loss of species diversity and habitat and associated ecological and cultural values associated with these areas.
Medium to high
Medium- to long-term
Climate change –Changes to mangrove distribution from sea level rise
Increased proliferation of mangroves at the expense of saltmarsh and Melaleuca communities; possible loss of existing mangrove communities in foreshore and lower estuary zones due to increased sea level rise and water-logging; associated loss of species diversity and habitat and associated ecological and cultural values associated with these areas.
Medium to high
Medium- to long-term
Climate change – Changes to fire regime
Changes to rates of evaporation and increased drought conditions leading to change in wetland inundation regimes and increased risks of wetland damage from more intense fires.
Medium to high
Medium- to long-term
Tourism and recreational activities
Disturbance to flora and fauna; litter and waste production, water pollution, damage to archaeological sites/materials, restriction on private cultural activities, impacts to habitats by boats..
Low Short- to medium-term
Mining activities Release of radionuclides and other pollutants into surface and/or groundwater and associated ecological effects and possible human health effects in terms of bioaccumulation in bush tucker species, potential damage to culturally significant sites.
Low to medium Short-term
Public safety and crocodiles
Continued diminishment of tourism and recreational values (e.g. swimming) as a result of presence of large crocodiles in high use areas.
Medium Short- to medium-term
Damage to archaeological resources and rock art
Specifically human induced impacts including theft, vandalism and inappropriate development and tourism. Weathering, vegetation growth and feral animal, termite and fire damage.
Low to medium Medium- to long-term
Living resource extraction
Impact on fish populations, loss of bush tucker resources, loss of application of traditional cultural practices; impact of poaching/ inappropriate hunting on wildlife and plant populations.
Low to medium Medium- to long-term
*Timing: short term: about 1-2 years; medium term: about 5 – 10 years; long term: more than 10 years.
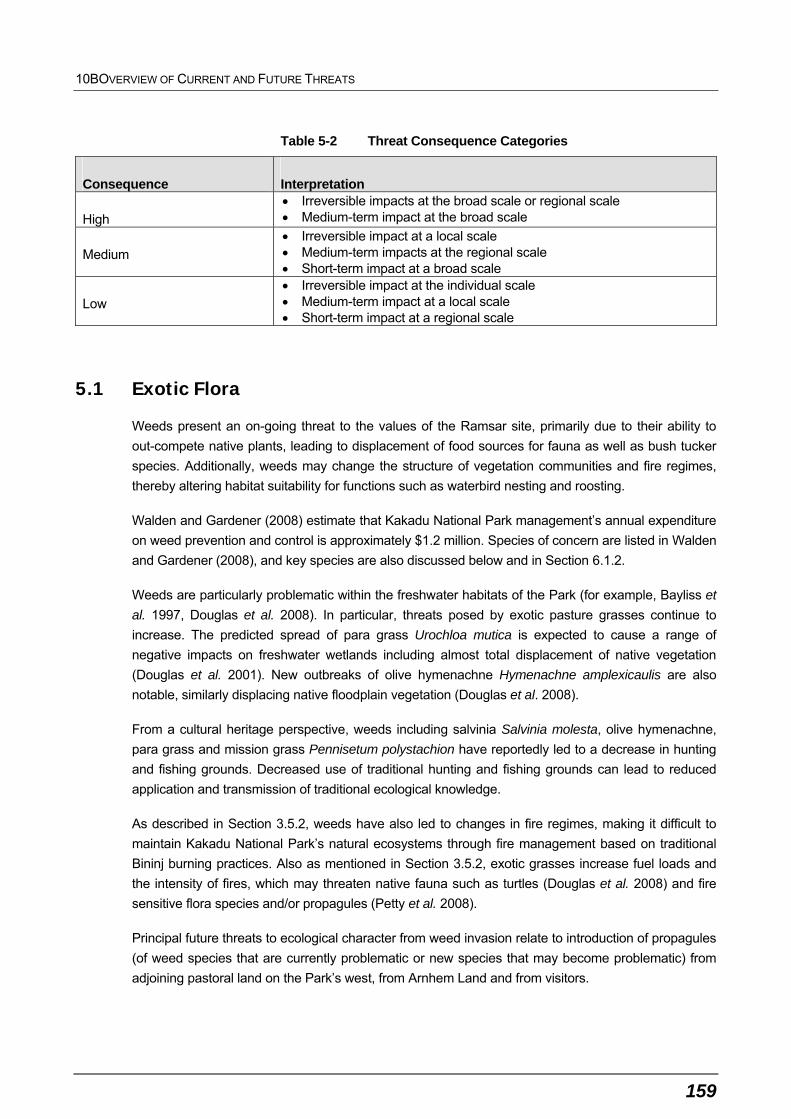
10BOVERVIEW OF CURRENT AND FUTURE THREATS
159
Table 5-2 Threat Consequence Categories
Consequence Interpretation
High Irreversible impacts at the broad scale or regional scale Medium-term impact at the broad scale
Medium Irreversible impact at a local scale Medium-term impacts at the regional scale Short-term impact at a broad scale
Low Irreversible impact at the individual scale Medium-term impact at a local scale Short-term impact at a regional scale
5.1 Exotic Flora
Weeds present an on-going threat to the values of the Ramsar site, primarily due to their ability to
out-compete native plants, leading to displacement of food sources for fauna as well as bush tucker
species. Additionally, weeds may change the structure of vegetation communities and fire regimes,
thereby altering habitat suitability for functions such as waterbird nesting and roosting.
Walden and Gardener (2008) estimate that Kakadu National Park management’s annual expenditure
on weed prevention and control is approximately $1.2 million. Species of concern are listed in Walden
and Gardener (2008), and key species are also discussed below and in Section 6.1.2.
Weeds are particularly problematic within the freshwater habitats of the Park (for example, Bayliss et
al. 1997, Douglas et al. 2008). In particular, threats posed by exotic pasture grasses continue to
increase. The predicted spread of para grass Urochloa mutica is expected to cause a range of
negative impacts on freshwater wetlands including almost total displacement of native vegetation
(Douglas et al. 2001). New outbreaks of olive hymenachne Hymenachne amplexicaulis are also
notable, similarly displacing native floodplain vegetation (Douglas et al. 2008).
From a cultural heritage perspective, weeds including salvinia Salvinia molesta, olive hymenachne,
para grass and mission grass Pennisetum polystachion have reportedly led to a decrease in hunting
and fishing grounds. Decreased use of traditional hunting and fishing grounds can lead to reduced
application and transmission of traditional ecological knowledge.
As described in Section 3.5.2, weeds have also led to changes in fire regimes, making it difficult to
maintain Kakadu National Park’s natural ecosystems through fire management based on traditional
Bininj burning practices. Also as mentioned in Section 3.5.2, exotic grasses increase fuel loads and
the intensity of fires, which may threaten native fauna such as turtles (Douglas et al. 2008) and fire
sensitive flora species and/or propagules (Petty et al. 2008).
Principal future threats to ecological character from weed invasion relate to introduction of propagules
(of weed species that are currently problematic or new species that may become problematic) from
adjoining pastoral land on the Park’s west, from Arnhem Land and from visitors.
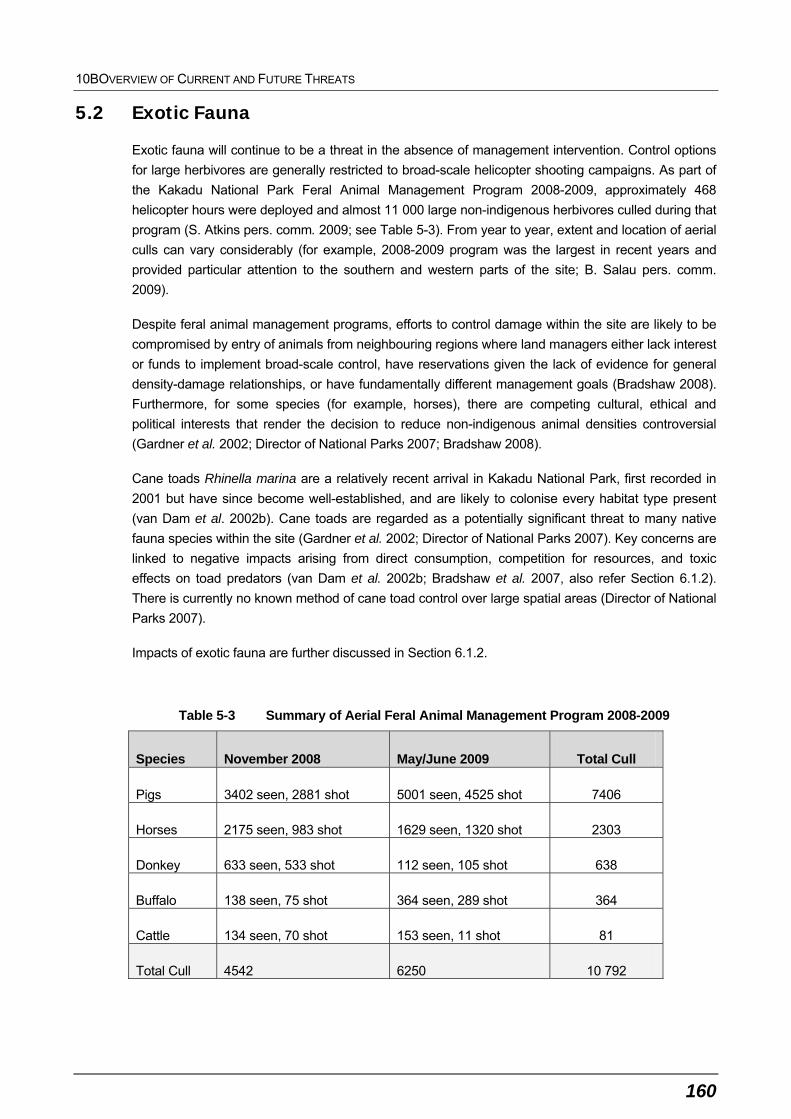
10BOVERVIEW OF CURRENT AND FUTURE THREATS
160
5.2 Exotic Fauna
Exotic fauna will continue to be a threat in the absence of management intervention. Control options
for large herbivores are generally restricted to broad-scale helicopter shooting campaigns. As part of
the Kakadu National Park Feral Animal Management Program 2008-2009, approximately 468
helicopter hours were deployed and almost 11 000 large non-indigenous herbivores culled during that
program (S. Atkins pers. comm. 2009; see Table 5-3). From year to year, extent and location of aerial
culls can vary considerably (for example, 2008-2009 program was the largest in recent years and
provided particular attention to the southern and western parts of the site; B. Salau pers. comm.
2009).
Despite feral animal management programs, efforts to control damage within the site are likely to be
compromised by entry of animals from neighbouring regions where land managers either lack interest
or funds to implement broad-scale control, have reservations given the lack of evidence for general
density-damage relationships, or have fundamentally different management goals (Bradshaw 2008).
Furthermore, for some species (for example, horses), there are competing cultural, ethical and
political interests that render the decision to reduce non-indigenous animal densities controversial
(Gardner et al. 2002; Director of National Parks 2007; Bradshaw 2008).
Cane toads Rhinella marina are a relatively recent arrival in Kakadu National Park, first recorded in
2001 but have since become well-established, and are likely to colonise every habitat type present
(van Dam et al. 2002b). Cane toads are regarded as a potentially significant threat to many native
fauna species within the site (Gardner et al. 2002; Director of National Parks 2007). Key concerns are
linked to negative impacts arising from direct consumption, competition for resources, and toxic
effects on toad predators (van Dam et al. 2002b; Bradshaw et al. 2007, also refer Section 6.1.2).
There is currently no known method of cane toad control over large spatial areas (Director of National
Parks 2007).
Impacts of exotic fauna are further discussed in Section 6.1.2.
Table 5-3 Summary of Aerial Feral Animal Management Program 2008-2009
Species November 2008 May/June 2009 Total Cull
Pigs 3402 seen, 2881 shot 5001 seen, 4525 shot 7406
Horses 2175 seen, 983 shot 1629 seen, 1320 shot 2303
Donkey 633 seen, 533 shot 112 seen, 105 shot 638
Buffalo 138 seen, 75 shot 364 seen, 289 shot 364
Cattle 134 seen, 70 shot 153 seen, 11 shot 81
Total Cull 4542 6250 10 792
10BOVERVIEW OF CURRENT AND FUTURE THREATS
161
5.3 Climate Change
There have been several assessments of the implications of climate change for Kakadu National
Park or elements thereof. The most substantive study to date was undertaken by Bayliss et al. (1997)
which assessed the vulnerability of predicted climate change and sea level rise in the Alligator Rivers
Region.
More recent assessments include the National Coastal Vulnerability Assessment Case Study of the
South Alligator River Catchment (BMT WBM 2010) and the Implications of Climate Change for
Australian World Heritage Properties: A Preliminary Assessment undertaken and published by the
Australian National University in 2009 (ANU 2009). Climate change research relevant to the Park and
wetland management has also been undertaken for some time by eriss as outlined in Bartolo et al.
(2008).
Overall, the principal threats to the wetland values of the Kakadu National Park Ramsar site from
climate change can be summarised as follows:
increased rate and extent of saltwater inundation into freshwater coastal environments due to sea
level rise and storm surge events
response of mangrove communities to rising sea level, and
more intensive fire regimes that eventuate due to hotter dry seasons and the resulting damage
these hot fires have on monsoon forest.
5.3.1 Saltwater Intrusion into Freshwater Areas
A range of studies have been conducted to predict the impacts of sea level rise on saltwater intrusion
processes with claims of a 50 percent loss of Kakadu National Park’s freshwater floodplain wetlands
based on a one to two degrees Celsius increase and a complete loss of wetlands from a two to three
degree Celsius increase (Hare in Bartolo et al. 2008). Bayliss et al. (1997) indicated that all wetland
areas in the region below four metres in elevation are assessed as being vulnerable to climate-
induced changes.
A more recent and detailed study by the authors (refer BMT WBM 2010) used hydrodynamic and
catchment modelling outputs to assess the increased risk of saltwater intrusion from sea level rise
and extreme rainfall events on low-lying coastal wetlands in the South Alligator River catchment. The
tidal channel and floodplain model indicated that the sea level rise predictions resulted in the most
significant impact, as these increased water levels were efficiently propagated up the river to the tidal
head (landward limit of the tidal component of the system). Storm surge impacts were less significant,
both in the degree of increase and also because they are associated with cyclones which are
expected to happen about once per year.
Interpretation of the tidal component results suggested increased tidal pressure on dendritic channels
within the South Alligator River system. This may act to keep channels open for longer or force them
to extend further. In addition, increased tidal flows and velocities are expected to occur due to an
increased tidal prism. Resulting impacts may be dramatic, particularly if tide levels overtop river banks
10BOVERVIEW OF CURRENT AND FUTURE THREATS
162
and/or levees. Significant changes may occur if a greater volume of tidal water flows onto the
floodplain via the overtopped levees.
The study concluded that the combined effect of expansion of the dendritic channel system, together
with increased levee overtopping is likely to result in increased saltwater intrusion during the dry
season. Subsequently, there is an increased likelihood of nearby freshwater billabongs being
impacted by saltwater intrusion. This response is considered more likely for areas already threatened
by saltwater intrusion and areas adjacent to tidal/dendritic channels.
Based on the previous assessments, it is clear that more precise information on areas likely to be
impacted will be required including detailed topographic survey data to calibrate hydrological and
catchment models used to predict sea level rises. In this context, it should be noted at the time of
preparation of this ECD a detailed study of saltwater intrusion associated with sea level rise and
climate change had been recommended as part of the report of the House of Representative
Commission of Inquiry on Climate Change and Coastal Management.
5.3.2 Mangrove Expansion
The response of macro-tidal estuaries to sea level rise is only partially understood, but it is clear that
the current trend of mangrove expansion observed over the past 50 years in the Park will continue
and expand under sea level rise scenarios, particularly in those marginal saltpan areas that are
currently only receiving occasional tidal inflows. As outlined in Section 3.2.1 and 3.2.2, the impacts of
this will be for mangroves to continue to replace salt marsh/pan and fringing Melaleuca communities,
assuming that suitable habitat conditions exist (for example, bed levels are at a suitable height,
creeks are adequately flushed etc.). Inversely, current mangrove communities along downstream
tidal channels and in the lower reaches of the estuaries could be at risk from more permanent
inundation and water logging if sea levels rise too quickly for the communities to naturally respond.
This ‘drowning’ effect has not been specifically observed at broad-scales to date in the Park but is
regarded as a potential threat, particularly given the more extreme sea level rise predictions that are
emerging.
5.3.3 Changes to Fire Regimes
It is generally accepted that increased frequencies and intensities of fire associated with higher
temperatures, longer dry seasons and increased weed prevalence threaten the values of the Ramsar
site (for example, refer Section 5.1). However, perceptions and opinions about over-burning in upland
areas versus the lack of burning in floodplain areas continue to be areas of contention between
stakeholders (D. Lindner pers. comm. 2009)
5.4 Tourism and Recreational Activities
The management challenge for Kakadu National Park is to maintain a balance between providing
opportunities for the appropriate use, appreciation and enjoyment of the Park by a diversity of visitors,
and protecting the rights and interests of Bininj and the natural and cultural values of the Park (refer
Director of National Parks 2007). Specific threats to Ramsar values from visitor and recreational
activities include:
10BOVERVIEW OF CURRENT AND FUTURE THREATS
163
disturbance to fauna species, particularly waterbirds, at feeding and nesting sites or during
breeding season
recreational boating activities that can damage foreshore flora, promote salt water intrusion
through alterations to hydrology and foreshore vegetation, spread weeds and feral animals,
disturb fauna and introduce a range of pollutants through boat sewage, boat wash and
subsequent erosion, leaching of anti-fouling compounds, fuel spills etc. Boating activities are also
a concern for Bininj as these waterways can be important hunting and fishing grounds, and the
protection of ecosystems (‘caring for country’) is an important aspect of Bininj culture, and
camping and recreational fishing leading to problems associated with litter, water pollution, fire,
removal and damage to native vegetation, and associated soil erosion and soil compaction.
In general, the management regime implemented by Parks Australia is such that the potential
impacts from tourism and recreation activities on ecological character are considered to be a low risk.
5.5 Mining Activities
The main risk identified for ecosystems surrounding the uranium mine sites in the Alligator River
Region is from the dispersion of mine waste waters to streams and shallow wetlands, including
contamination with radioactive substances (Supervising Scientist 2002). In particular, high rainfall
during the wet season often results in the need to release low-level contaminated runoff stored in on-
site water bodies (van Dam et al. 2002a). While toxicity tests have been conducted to investigate the
effect of uranium on invertebrate and vertebrate species (van Dam et al. 2002a, Hogan et al. 2005),
historical water quality monitoring in Magela Creek showed that uranium concentrations are
approximately an order of magnitude lower than the site-specific water quality trigger value
(established by the Supervising Scientist), indicating that the risk to the downstream environment
from controlled waste water release may be negligible (Hogan et al. 2005).
Since the major tailings water leak from the Ranger mine that occurred in the 1999-2000 wet season
(refer Supervising Scientist 2000), a monitoring program using biological, chemical and radiological
techniques to monitor and assess impacts upon ecosystems and humans arising from mining
activities has been developed and implemented at Ranger and Jabiluka (refer Supervising Scientist
2002). This program has been undertaken since that time with an annual review of key knowledge
needs and monitoring. In general, the precautionary approach and extensiveness of the program are
such that there is a strong level of confidence that any impacts from tailings water leakage or other
impact would be detected and acted upon. Nonetheless, the impacts from mining operations remain
a salient threat to the ecological character of Kakadu National Park at least in the short term for the
remaining duration of mining activities.
In this context, it is noted that historical mining sites in the South Alligator River region continue to be
monitored and rehabilitated, but to date, the general view of the Knowledge Management Committee
was that these sites are not thought to represent a threat to future ecological character.
5.6 Public Safety and Crocodiles
Following the protection of crocodiles in the 1970s, the abundance of saltwater crocodiles Crocodylus
porosus has increased within Kakadu National Park (refer Section 3.3.7), thereby increasing the
10BOVERVIEW OF CURRENT AND FUTURE THREATS
164
likelihood of crocodile attacks on humans. However, only two fatal crocodile attacks have occurred
within the Park over a period of 27 years during which an estimated 3.5 million people visited the Park
(SMH 2004). The emphasis of crocodile management within the Park is to educate visitors about
crocodiles and their dangers through brochures, signs and advice. Should an increase in crocodile
attacks occur, it is possible that visitor numbers may be affected. This may deter some visitors, but
may attract others.
5.7 Damage to Archaeological Resources and Rock Art
Archaeological resources and rock art are under threat from natural and human-induced impacts.
Human induced impacts include theft, vandalism and inappropriate development and tourism.
Weathering, vegetation growth and feral animal, termite and fire damage also threaten to damage
rock art and archaeological sites, all of which may be preventable impacts. Natural processes, such
as tidal inundation of floodplains and storms, may threaten archaeological sites and rock art, and
climate change could amplify the effects of these impacts.
5.8 Living Resource Extraction
Although the use of lead shot for hunting is banned in Kakadu National Park, this practice continues
in some areas of the park. Lead poisoning through the ingestion of spent lead shot can impact on
significant wildlife populations, such as magpie geese Anseranas semipalmata (Director of National
Parks 2007). Over-harvesting of popular bush tucker items (for example, magpie geese, turtles) by
not following Bininj cultural protocols or practices can impact on the populations of these species and
cause social tensions.
Adequate fishing resources are also an important component of maintaining Bininj Traditional
Ecological Knowledge and cultural practices. The restriction of some areas of Kakadu National Park
to public fishing is important for Bininj to undertake fishing and other cultural practices in private.
11BCHANGES TO ECOLOGICAL CHARACTER
165
6 CHANGES TO ECOLOGICAL CHARACTER
‘Ecological character’ is defined as a combination of the wetland ecosystem services/benefits,
components and processes that underpin wetland systems at any given point in time. In assessing
changes to ecological character for Kakadu National Park Ramsar site, as required by the National
Framework (2008), the relevant timescales for the assessment of ecological character are taken to
include 1980 and 1989 (when Stages I and II, respectively, were listed as Wetlands of International
Importance), 1995 when Stage III wetland components were added to the Stage I area and 2010 (the
time of preparation of this first ECD and the extension of the remaining Stage III area).
While there has been a considerable body of research in the Magela Creek catchment and several
other areas within the site, comparatively less quantitative information exists at a whole-of-site scale.
As such, the analyses below attempt to characterise whole-of-site changes to ecological character
but also rely on specific investigations and information about particular areas of the site where
relevant.
6.1 Ecological Character Change Methods
Based on the National Framework and similar approaches undertaken in other ECDs, a two-step
approach has been employed to assess changes in ecological character for the Kakadu National
Park Ramsar site as discussed in the sections below. These are:
1. based on the documentation reviewed and Ramsar Nomination Criteria listed as part of the 1998
RISs, an assessment of whether these listing Criteria continue to apply, and
2. based on the critical components, processes and services/benefits and LACs identified, whether
there has been a measurable change to ecological character that is the likely result of
anthropogenic activities in Kakadu National Park.
6.1.1 Assessment of Listing Criteria
Based on the analysis of the previous and current Nomination Criteria presented in Table 2-6 (refer
Section 2.5), Kakadu National Park continues to meet the Nomination Criteria for which the original
two sites were listed. In addition, as outlined in Section 2.5, Kakadu National Park Ramsar site is
deemed to meet the three additional Ramsar Criteria.
6.1.2 Potential Changes to Ecological Character Since Listing
When considering changes in ecological character of the site, the National Framework requires the
ECD to examine any changes to character that have occurred since the listing date. In order to do
this, a baseline of ecological character at the time of listing must be established.
As described in Section 3.1.2, the Fox et al. (1977) report forms a baseline description of ecological
character at the time of listing. The fact that the ‘ecosystem services’ listed by Fox et al. (1977)
continue be supported at the present time lends support to the notion that broad scale ecological
character changes of the site has not occurred.
Notwithstanding, this information forms only a qualitative basis for assessing ecological character
changes since listing and more recent studies, monitoring data as well as the expert views of the
11BCHANGES TO ECOLOGICAL CHARACTER
166
Knowledge Management Committee need also to be considered in assessing ecological character
changes. Some of the key issues with regard to possible changes to ecological character are
discussed below:
Exotic Flora
The prominent weed species of concern in Kakadu National Park are mimosa Mimosa pigra, salvinia
Salvinia, para grass Urochloa mutica and olive hymenachne Hymenachne amplexicaulis. In general,
weed management within the Park has largely contained or managed impacts of these species on
wetland flora and fauna communities since listing (Director of National Parks 2007), although the
success of weed management is highly variable and is dependent on resources and opportunities
(Walden and Gardener 2008). Impacts from weeds are not considered to have caused a change to
the ecological character of the site, with further discussion about each of the key species provided
below:
Mimosa
Mimosa is a thorny shrub that was discovered in the Park in the early 1980s (around the time of
listing) that grows in coastal floodplain areas of the Northern Territory, favouring seasonally or
periodically inundated freshwater wetland habitats (Walden et al. 2004). The principal impacts from
mimosa on wetland ecosystems include reduction of biodiversity and vegetation structure and
alteration of hydrological regimes by encroaching into waterbodies and increasing sediment
deposition. A number of studies assessing the risk of mimosa have been undertaken, the most
complete and notable being Walden et al. (2004).
Kakadu National Park has been described as ‘an island in a sea of mimosa’, noting control has been
given a high priority with approximately $7 million dollars of Australian Government funding provided
to the removal of over 8000 hectares of mimosa during the early 2000s (Walden et al. 2004). This
large scale reduction has greatly reduced the immediate risk to Kakadu National Park (Walden et al.
2004). Kakadu remains free from serious infestation by the systematic survey and destruction of new
outbreaks, which involves four full-time staff and an annual budget of over $400 000 (Storrs et al.
1999).
Salvinia
Salvinia molesta is a free floating aquatic species discovered in the Kakadu National Park in 1983
and, due to its very fast reproduction rate and seasonal flooding, has now spread throughout the
Magela Creek system and also can be found in the East Alligator River and Nourlangie Creek system
(Storrs and Julien 1996). Significant financial and operational resources are applied to control the
weed including previous trials of the use of the biological control agent Cyrtobagous salvinae (a
weevil) (Storrs and Julien 1996). In this context, salvinia is not considered to have caused any
notable ecological character changes to the site and is being adequately controlled under current
management regimes (S. Winderlich pers. comm. 2009).
11BCHANGES TO ECOLOGICAL CHARACTER
167
Para Grass
Para grass is a highly invasive pasture weed introduced as fodder for domestic livestock at Oenpelli
in Arnhem Land in the 1960s. Parks Australia eradicate isolated infestations and note the South
Alligator River system is at most risk from future invasion (Walden and Bayliss 2003 cited in Douglas
et al. 2008). As per the above, the presence and distribution of para grass is not seen as change in
ecological character since listing of the site.
Olive Hymenachne
In more recent times (since 2002), olive hymenachne Hymenachne amplexicaulis has also become a
weed species of concern and management aims to control the further spread of this species (for
example, refer Douglas et al. 2008, Walden and Gardener 2008). The presence of olive hymenachne
is also a contributing factor to saline intrusion as discussed below.
Exotic Fauna
A variety of non-indigenous fauna species are known to occur within the site and include: pigs Sus
scrofa, Asian swamp buffalo Bubalus bubalis, cattle Bos spp., horses Equus caballus, donkeys E.
asinus, cats Felis catus, dogs Canis lupus familiaris, black rats Rattus rattus, house mice Mus
musculus, cane toads Rhinella marina, flower-pot snake Rhamphotyphlops braminus, house gecko
Hemidactylus frenatus, sambar deer Cervus unicolour, various ant species4 and honeybees Apis
mellifera (Press et al. 1995b; Director of National Parks 2007; Bradshaw 2008). These species, to
varying extents, whether individually or collectively, are thought likely to add pressure to the
maintenance of the sites’s values for biodiversity and threatened species, although the relative impact
of these on native fauna is likely to vary considerably (Gardner et al. 2002; Finlayson et al. 2006;
Bradshaw et al. 2007). The majority of introduced taxa have been widely acknowledged as implicit in
the degradation of habitat values for both native fauna biodiversity and threatened species (see Table
6-1).
Additional exotic fauna species that have a high potential to enter the Park include banteng Bos
javanicus and crazy ants Anoplolepis gracilipes (Director of National Parks 2007).
Of the non-indigenous fauna recorded on the site, the greatest threats to fauna habitat values are
linked to the presence of large, hard-hoofed herbivorous mammals (buffalo, horses, donkeys and
pigs) and cane toads (Director of National Parks 2007; Bradshaw 2008), as discussed in further detail
below:
Large Herbivores
The severe and adverse environmental impacts effected by buffalo within the site and the region has
been widely reported (for example, Braithwaite et al. 1984; Taylor and Friend 1984; Tulloch and
Cellier 1986; Skeat et al. 1996). As a result of a major eradication program implemented in the mid-
1980s (and completed in 1997), buffalo numbers within the Alligator Rivers Region were significantly
reduced (Gardner et al. 2002; Director of National Parks 2007). Since then, numbers within the site
have increased gradually, though buffalo (and horses, donkeys and cattle) remain abundant within
4 Pheidole megacephala, Solenopsis geminata, Monomorium destructor, M. floricola, M. pharaonis, Paratrechina longicornis, Tapinoma melanocephalum, Tetramorium bicarinatum, and T. simillimum.
11BCHANGES TO ECOLOGICAL CHARACTER
168
neighbouring Arnhem Land and pastoral properties (Director of National Parks 2007; B. Salau pers.
comm. 2009).
High buffalo numbers have in the past lead to significant environmental damage in lowland
environments, and continue to represent a threat to wetland environments (such as springs,
billabongs and riparian vegetation) in the stone country (Simon Ward, pers. comm. 2010). High
buffalo numbers can cause severe damage to wetland environments (for example, trampling of nests,
eggs and vegetation, increased stream erosion and sedimentation) and cultural resources (that is,
damage to rock art, sacred sites and archaeological resources). Specifically, buffalo can damage
rock art by rubbing against it, damage sacred sites through trampling and environmental degradation
and destroy archaeological resources through trampling, grazing and wallowing in open artefact
scatters on the flood plain (Jones 1985, Higgins 1999, D. Lindner pers. comm. 2009).
Both pigs and horses generate physical degradation of habitat, particularly around wetlands (most
notably freshwater floodplains, tidal flats and monsoon forests), and are implicated in the spread of
some of the most significant weed species within the site (for example, mimosa Mimosa pigra and
olive hymenachne Hymenachne amplexicaulis (pigs) and mission grass Pennisetum polystachion,
gamba grass Andropogon gayanus and gambia pea Crotalaria goreensis (horses); (Director of
National Parks 2007). Pigs are regarded as common throughout the region and Kakadu National
Park, and it is considered that pig abundance may have increased concomitantly with the decline in
buffalo populations, although there is little quantitative data (Gardner et al. 2002). Pig rooting of
floodplain areas, while prevalent, is reported as having a far less deleterious impact than buffalos in
terms of channelisation and associated saltwater intrusion. The creation of levees and ruts from the
rooting is interpreted by some to be inhibiting tidal flows (Petty et al. 2005). Pig rooting may be
impacting on the breeding of pig-nosed turtles and populations of bush-tucker turtles and water
chestnut tubers (S. Ward pers. comm. 2010).
Whilst horses are considered relatively common throughout the site, there is anecdotal evidence that
both donkeys and horses are comparatively more common in the drier southern and western parts of
Kakadu National Park (B. Salau pers comm. 2009).
While all of these species are actively controlled and managed, the broad scale program to eradicate
buffalo from the Park in the early 1980s appears to have had the most resoundingly positive effect on
the ecological character of the wetlands since listing. Research by Petty et al. (2005) has
documented how buffalo were exacerbating the natural processes of tidal channel extension and
contraction in the South Alligator floodplain through creation of swim channels. This process had
been leading to extensive saltwater intrusion into the freshwater areas of Yellow Water for the
decades previous. Although some billabongs in the tidal interface area of the South Alligator have
been permanently lost and associated Melaleuca communities degraded by saltwater intrusion, it is
reported that much of the ‘pre-buffalo’ character of the tidal interface region has been restored in the
past 10 years (Petty et al. 2005).
Furthermore, floating grass mats (also known as sudds) within the site are thought to be recovering
as a result of the reduction in buffalo numbers. Floating grass mats are a habitat found in flow
channels, waterholes and billabongs of Kakadu during the wet season. They are typically comprised
of a range of submerged plant species including Leersia hexandra and native hymenachne
Hymenachne acutigluma, and occur along the banks of billabongs (Finlayson et al. 2006). Studies
elsewhere in the Northern Territory in billabongs near the Finnis River south of Darwin noted the
11BCHANGES TO ECOLOGICAL CHARACTER
169
importance of these mats for a range of fauna including saltwater crocodile nesting, waterbird feeding
and underwater habitat for fish and invertebrate species (Hill et al. 1987). In the context of historical
changes to ecological character, studies in the Finnis River showed an accelerated loss of floating
mats in the period from 1963 to 1978 which was principally the result of buffalo causing the
detachment of mats from the bank. The floating mats present in the Kakadu National Park within
billabongs and the Magela Creek are less complex or extensive compared to sites such as the Finnis
River or Arafura Swamp (Cowie et al. 2000) and there has not been extensive study of these habitats
within the Park to date. However, it is likely that this habitat (and associated ecological values) have
also benefited from the removal of buffalo from the site.
Cane Toad
As mentioned in Section 5.2, a recent and notorious introduced species is the cane toad Rhinella
marina. The preliminary risk assessment of cane toads prepared by van Dam et al. (2002b) outlined
the potential effects of cane toads on Kakadu National Park’s resources which included toxic effects
on predators such as reptiles, birds and mammals, potential competition with native frogs, and
cultural effects from the loss of important bush tucker species. That work assessed the susceptibility
of 151 native species as potential cane toad predators and concluded that ten species were
considered likely to be at risk of experiencing population level effects (northern quoll, mangrove
monitor, Merten’s water monitor, northern sand goanna, spotted tree monitor, northern death adder,
king brown snake, dingo), with a further 12 species (or species groups) at possible risk of
experiencing population level effects (leeches, snails, ornate burrowing frog, northern dwarf treefrog,
desert tree frog, blue-tongued lizard, carpet python, brown tree snake, slaty-grey snake, freshwater
crocodile, black bittern, blue-winged kookaburra). A notable proportion of this higher risk group
comprises wetland-dependent species (three snake species, four lizard species, all frog species).
Many of the ‘at risk’ species also represent traditional food sources. Loss of traditional food sources
can lead to decreased application and transmission of traditional ecological knowledge and other
activities often associated with this, including decreased used of Bininj languages and decreased
application of traditional land and fire management practices.
It would appear many of these impacts foreshadowed by Van Dam et al. (2002b) have now been
realised, with anecdotal reports of declines in the populations of a number of predatory wetland-
dependent species such as freshwater crocodiles, goannas, snakes and frog fauna in Kakadu
National Park and throughout the broader region (S. Winderlich pers. comm. 2009). There are no
empirical estimates of the degree of impact of cane toads on native fauna populations within the site;
hence firm conclusions on whether there has been a change in character can not be drawn. This
represents a key information gap in the context of this ECD and broader management of Kakadu
National Park.
There are presently no effective cane toad control measures. Consequently, no cane toad threat
abatement plan has been developed to date.
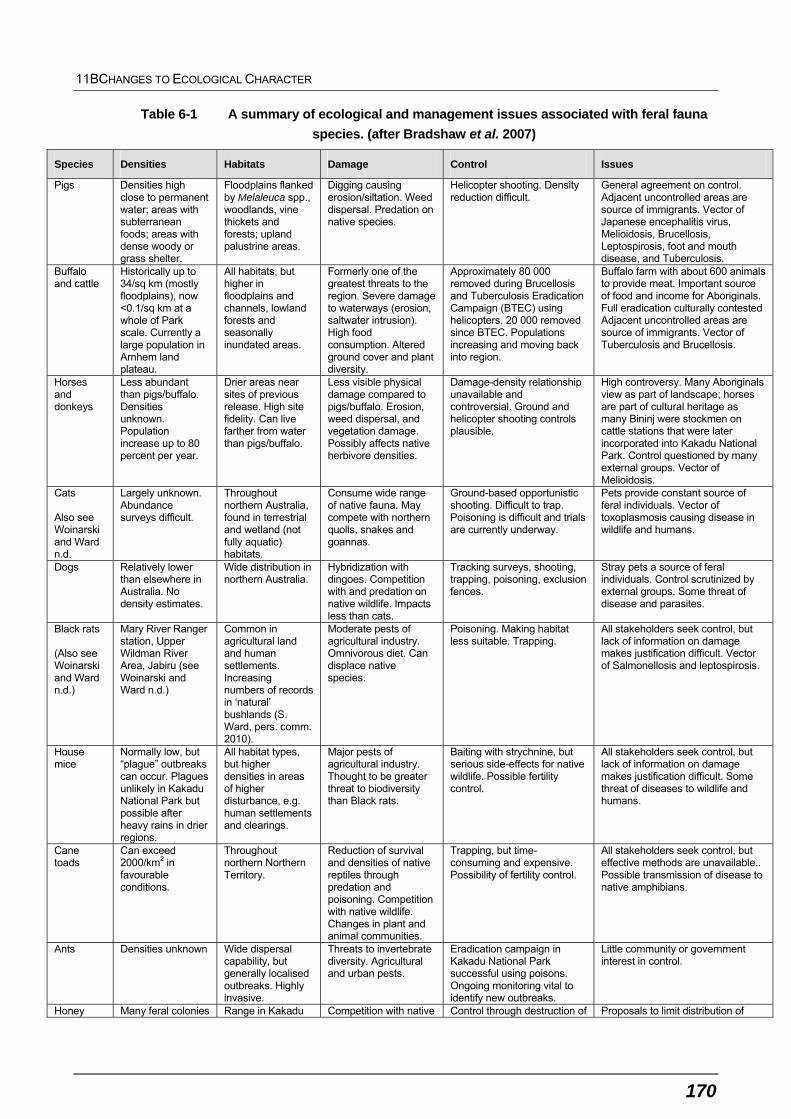
11BCHANGES TO ECOLOGICAL CHARACTER
170
Table 6-1 A summary of ecological and management issues associated with feral fauna
species. (after Bradshaw et al. 2007)
Species Densities Habitats Damage Control Issues
Pigs Densities high close to permanent water; areas with subterranean foods; areas with dense woody or grass shelter.
Floodplains flanked by Melaleuca spp., woodlands, vine thickets and forests; upland palustrine areas.
Digging causing erosion/siltation. Weed dispersal. Predation on native species.
Helicopter shooting. Density reduction difficult.
General agreement on control. Adjacent uncontrolled areas are source of immigrants. Vector of Japanese encephalitis virus, Melioidosis, Brucellosis, Leptospirosis, foot and mouth disease, and Tuberculosis.
Buffalo and cattle
Historically up to 34/sq km (mostly floodplains), now <0.1/sq km at a whole of Park scale. Currently a large population in Arnhem land plateau.
All habitats, but higher in floodplains and channels, lowland forests and seasonally inundated areas.
Formerly one of the greatest threats to the region. Severe damage to waterways (erosion, saltwater intrusion). High food consumption. Altered ground cover and plant diversity.
Approximately 80 000 removed during Brucellosis and Tuberculosis Eradication Campaign (BTEC) using helicopters. 20 000 removed since BTEC. Populations increasing and moving back into region.
Buffalo farm with about 600 animals to provide meat. Important source of food and income for Aboriginals. Full eradication culturally contested Adjacent uncontrolled areas are source of immigrants. Vector of Tuberculosis and Brucellosis.
Horses and donkeys
Less abundant than pigs/buffalo. Densities unknown. Population increase up to 80 percent per year.
Drier areas near sites of previous release. High site fidelity. Can live farther from water than pigs/buffalo.
Less visible physical damage compared to pigs/buffalo. Erosion, weed dispersal, and vegetation damage. Possibly affects native herbivore densities.
Damage-density relationship unavailable and controversial. Ground and helicopter shooting controls plausible.
High controversy. Many Aboriginals view as part of landscape; horses are part of cultural heritage as many Bininj were stockmen on cattle stations that were later incorporated into Kakadu National Park. Control questioned by many external groups. Vector of Melioidosis.
Cats Also see Woinarski and Ward n.d.
Largely unknown. Abundance surveys difficult.
Throughout northern Australia, found in terrestrial and wetland (not fully aquatic) habitats.
Consume wide range of native fauna. May compete with northern quolls, snakes and goannas.
Ground-based opportunistic shooting. Difficult to trap. Poisoning is difficult and trials are currently underway.
Pets provide constant source of feral individuals. Vector of toxoplasmosis causing disease in wildlife and humans.
Dogs Relatively lower than elsewhere in Australia. No density estimates.
Wide distribution in northern Australia.
Hybridization with dingoes. Competition with and predation on native wildlife. Impacts less than cats.
Tracking surveys, shooting, trapping, poisoning, exclusion fences.
Stray pets a source of feral individuals. Control scrutinized by external groups. Some threat of disease and parasites.
Black rats (Also see Woinarski and Ward n.d.)
Mary River Ranger station, Upper Wildman River Area, Jabiru (see Woinarski and Ward n.d.)
Common in agricultural land and human settlements. Increasing numbers of records in ‘natural’ bushlands (S. Ward, pers. comm. 2010).
Moderate pests of agricultural industry. Omnivorous diet. Can displace native species.
Poisoning. Making habitat less suitable. Trapping.
All stakeholders seek control, but lack of information on damage makes justification difficult. Vector of Salmonellosis and leptospirosis.
House mice
Normally low, but “plague” outbreaks can occur. Plagues unlikely in Kakadu National Park but possible after heavy rains in drier regions.
All habitat types, but higher densities in areas of higher disturbance, e.g. human settlements and clearings.
Major pests of agricultural industry. Thought to be greater threat to biodiversity than Black rats.
Baiting with strychnine, but serious side-effects for native wildlife. Possible fertility control.
All stakeholders seek control, but lack of information on damage makes justification difficult. Some threat of diseases to wildlife and humans.
Cane toads
Can exceed 2000/km2 in favourable conditions.
Throughout northern Northern Territory.
Reduction of survival and densities of native reptiles through predation and poisoning. Competition with native wildlife. Changes in plant and animal communities.
Trapping, but time-consuming and expensive. Possibility of fertility control.
All stakeholders seek control, but effective methods are unavailable.. Possible transmission of disease to native amphibians.
Ants Densities unknown Wide dispersal capability, but generally localised outbreaks. Highly invasive.
Threats to invertebrate diversity. Agricultural and urban pests.
Eradication campaign in Kakadu National Park successful using poisons. Ongoing monitoring vital to identify new outbreaks.
Little community or government interest in control.
Honey Many feral colonies Range in Kakadu Competition with native Control through destruction of Proposals to limit distribution of
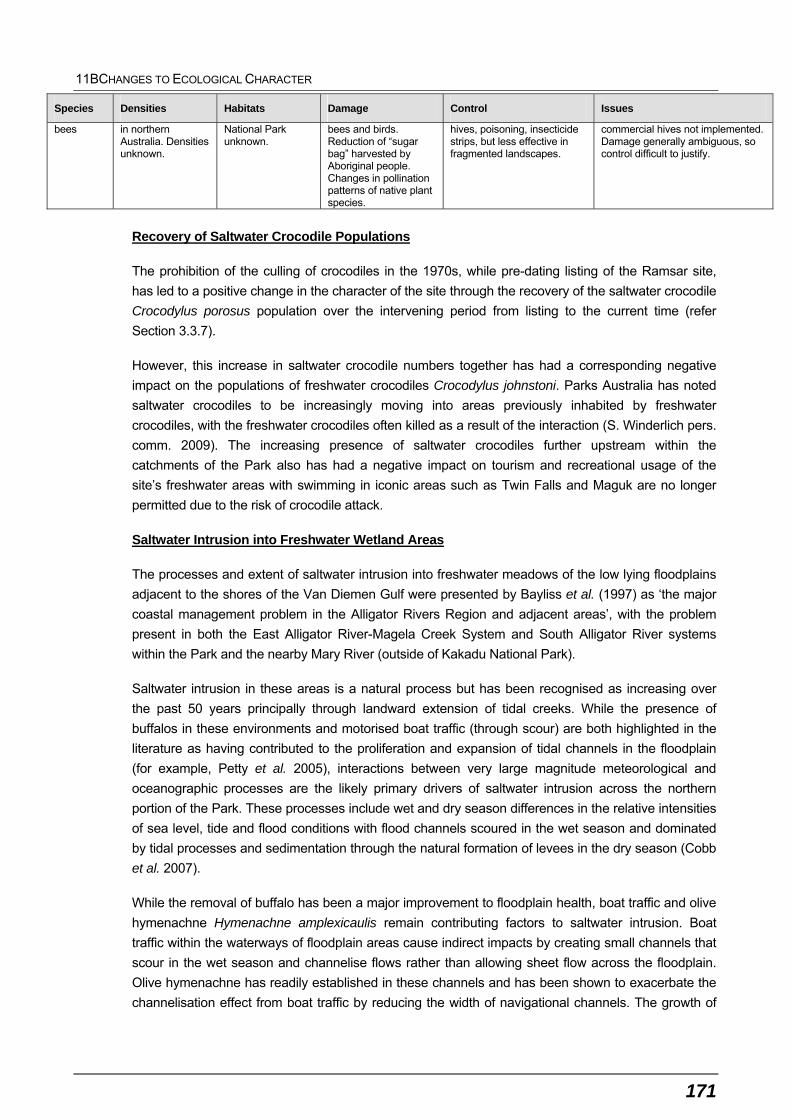
11BCHANGES TO ECOLOGICAL CHARACTER
171
Species Densities Habitats Damage Control Issues
bees in northern Australia. Densities unknown.
National Park unknown.
bees and birds. Reduction of “sugar bag” harvested by Aboriginal people. Changes in pollination patterns of native plant species.
hives, poisoning, insecticide strips, but less effective in fragmented landscapes.
commercial hives not implemented. Damage generally ambiguous, so control difficult to justify.
Recovery of Saltwater Crocodile Populations
The prohibition of the culling of crocodiles in the 1970s, while pre-dating listing of the Ramsar site,
has led to a positive change in the character of the site through the recovery of the saltwater crocodile
Crocodylus porosus population over the intervening period from listing to the current time (refer
Section 3.3.7).
However, this increase in saltwater crocodile numbers together has had a corresponding negative
impact on the populations of freshwater crocodiles Crocodylus johnstoni. Parks Australia has noted
saltwater crocodiles to be increasingly moving into areas previously inhabited by freshwater
crocodiles, with the freshwater crocodiles often killed as a result of the interaction (S. Winderlich pers.
comm. 2009). The increasing presence of saltwater crocodiles further upstream within the
catchments of the Park also has had a negative impact on tourism and recreational usage of the
site’s freshwater areas with swimming in iconic areas such as Twin Falls and Maguk are no longer
permitted due to the risk of crocodile attack.
Saltwater Intrusion into Freshwater Wetland Areas
The processes and extent of saltwater intrusion into freshwater meadows of the low lying floodplains
adjacent to the shores of the Van Diemen Gulf were presented by Bayliss et al. (1997) as ‘the major
coastal management problem in the Alligator Rivers Region and adjacent areas’, with the problem
present in both the East Alligator River-Magela Creek System and South Alligator River systems
within the Park and the nearby Mary River (outside of Kakadu National Park).
Saltwater intrusion in these areas is a natural process but has been recognised as increasing over
the past 50 years principally through landward extension of tidal creeks. While the presence of
buffalos in these environments and motorised boat traffic (through scour) are both highlighted in the
literature as having contributed to the proliferation and expansion of tidal channels in the floodplain
(for example, Petty et al. 2005), interactions between very large magnitude meteorological and
oceanographic processes are the likely primary drivers of saltwater intrusion across the northern
portion of the Park. These processes include wet and dry season differences in the relative intensities
of sea level, tide and flood conditions with flood channels scoured in the wet season and dominated
by tidal processes and sedimentation through the natural formation of levees in the dry season (Cobb
et al. 2007).
While the removal of buffalo has been a major improvement to floodplain health, boat traffic and olive
hymenachne Hymenachne amplexicaulis remain contributing factors to saltwater intrusion. Boat
traffic within the waterways of floodplain areas cause indirect impacts by creating small channels that
scour in the wet season and channelise flows rather than allowing sheet flow across the floodplain.
Olive hymenachne has readily established in these channels and has been shown to exacerbate the
channelisation effect from boat traffic by reducing the width of navigational channels. The growth of
11BCHANGES TO ECOLOGICAL CHARACTER
172
native hymenachne Hymenachne acutigluma was previously controlled by feeding buffalo but has
also flourished as a result of reduced floodplain fire management practices (Petty et al. 2005).
The effect of saltwater intrusion in the floodplain areas of the Park has had the effect of changing the
spatial characteristics and distribution of tidal creeks and associated mangrove environments over a
long time period, often at the expense of predominantly freshwater systems. This includes the loss of
several freshwater billabong environments located proximal to the tidal channels and at the fresh-salt
interface areas of the major river systems, noting that these features have both ecological and
cultural significance in terms of bush tucker and traditional customary use.
In recognition of these impacts, the intrusion of saltwater has been studied and monitored over time
and measures have been implemented by Parks Australia to control impacts. These include the
afore-mentioned eradication of buffalo (the program terminated in 1997), continuing efforts by Parks
Australia to control and regulate boating traffic in the river systems and in some cases through
construction of temporary bunds and other capital works to deter tidal intrusion (refer BMT WBM
2010).
However, the extent to which saltwater intrusion represents an ecological character change is difficult
to assess noting that saltwater intrusion into Kakadu National Park’s freshwater wetlands is a
continuous natural process. A key factor to be considered is whether the environmental change or the
rate of change can be perceived as having an anthropogenic source. In this context, establishing
what is ‘natural variability’ in terms of saltwater intrusion is extremely difficult and consideration of
longer term trends (for example, before the listing date) have been taken into account in the setting of
relevant LACs (see next section in terms of the assessment of ecological character against LACs). As
will be discussed below in the context of future threats, the implications of climate change induced
sea level rise must also be considered in terms of defining the ‘natural’ rate of change to freshwater
wetland systems of Kakadu National Park and their ability to adapt to saltwater intrusion processes.
6.1.3 Assessment of Ecological Character Changes Against LACs
In order to be more definitive about changes to ecological character, the National Framework (2008)
requires an assessment of whether or not any LACs set as part of the ECD have been exceeded.
Drawing upon the discussions above, Table 6-2 outlines this assessment.
While there has been extensive data gathering and monitoring in the context of the impacts of
uranium mining operations at Kakadu National Park for over thirty years, research about wetland
environments within the Park undertaken by eriss and monitoring of species and habitats by Parks
Australia, the broad information base for an assessment of ecological character change is limited by:
1 A largely inadequate baseline for the key parameters at the times of listing and extension in
1980/1989/1995/2010.
2 Limited continuous data sets over the intervening period to the time of ECD preparation for
critical components and processes at a landscape scale.
3 Generally limited understanding of natural variability in some key parameters, noting that tropical
wetland environments such as Kakadu National Park can have enormous variation within and
between years or decades.
11BCHANGES TO ECOLOGICAL CHARACTER
173
This situation is not uncommon to Ramsar sites around Australia, and is particularly understandable
given the size, relative remoteness and diversity of habitats present at Kakadu National Park. With
this in mind, the analysis presented in Table 6-2 should be viewed as a preliminary attempt at
characterising changes in ecological character of the site since listing that can be added to and
improved as part of future ECD investigations and assessments.
While the level of quantitative information and data needed to provide a more definitive assessment
of ecological character change (and to set more definitive LACs sought by the National Framework)
are not available, it would appear unlikely that any of the LACs presented in Table 6-2 have been
meaningfully exceeded except that saltwater intrusion processes have possibly degraded freshwater
billabongs and other palustrine wetlands and reduced the extent of Melaleuca communities.
Further information about determining change in ecological character can be found within the recently
released ‘National Guidance on Notifying Change in Ecological Character of Australian Ramsar
Wetlands (Article 3.2)’ (DEWHA 2009b). As outlined in the document, ‘a breach of an LAC indicates
that a component, process or benefit/service has changed beyond its natural variability and the
breach of this feature, by definition, requires a remedial response’. However, it is acknowledged by
the Guidance document that there are often extreme ranges of natural variability over time, and until
such time that natural variability is determined for the circumstances associated with the breach, a
notification of ecological character change under the Convention will be made only where there is
confidence that the change exceeds any previous condition, that is, it has not previously been
experienced to that degree.
Overall, taking into account the findings of the three assessment approaches, there is no evidence to
suggest that the site has experienced an ecological character change since listed.
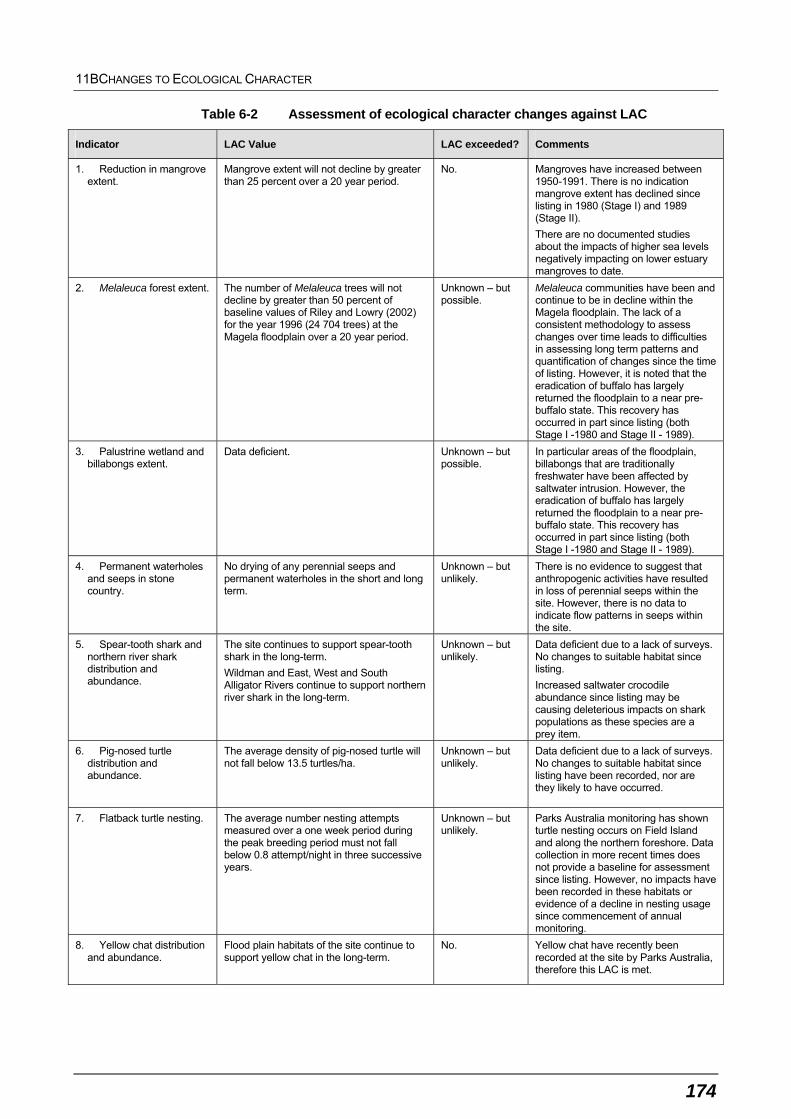
11BCHANGES TO ECOLOGICAL CHARACTER
174
Table 6-2 Assessment of ecological character changes against LAC
Indicator LAC Value LAC exceeded? Comments
1. Reduction in mangrove extent.
Mangrove extent will not decline by greater than 25 percent over a 20 year period.
No. Mangroves have increased between 1950-1991. There is no indication mangrove extent has declined since listing in 1980 (Stage I) and 1989 (Stage II).
There are no documented studies about the impacts of higher sea levels negatively impacting on lower estuary mangroves to date.
2. Melaleuca forest extent. The number of Melaleuca trees will not decline by greater than 50 percent of baseline values of Riley and Lowry (2002) for the year 1996 (24 704 trees) at the Magela floodplain over a 20 year period.
Unknown – but possible.
Melaleuca communities have been and continue to be in decline within the Magela floodplain. The lack of a consistent methodology to assess changes over time leads to difficulties in assessing long term patterns and quantification of changes since the time of listing. However, it is noted that the eradication of buffalo has largely returned the floodplain to a near pre-buffalo state. This recovery has occurred in part since listing (both Stage I -1980 and Stage II - 1989).
3. Palustrine wetland and billabongs extent.
Data deficient. Unknown – but possible.
In particular areas of the floodplain, billabongs that are traditionally freshwater have been affected by saltwater intrusion. However, the eradication of buffalo has largely returned the floodplain to a near pre-buffalo state. This recovery has occurred in part since listing (both Stage I -1980 and Stage II - 1989).
4. Permanent waterholes and seeps in stone country.
No drying of any perennial seeps and permanent waterholes in the short and long term.
Unknown – but unlikely.
There is no evidence to suggest that anthropogenic activities have resulted in loss of perennial seeps within the site. However, there is no data to indicate flow patterns in seeps within the site.
5. Spear-tooth shark and northern river shark distribution and abundance.
The site continues to support spear-tooth shark in the long-term.
Wildman and East, West and South Alligator Rivers continue to support northern river shark in the long-term.
Unknown – but unlikely.
Data deficient due to a lack of surveys. No changes to suitable habitat since listing.
Increased saltwater crocodile abundance since listing may be causing deleterious impacts on shark populations as these species are a prey item.
6. Pig-nosed turtle distribution and abundance.
The average density of pig-nosed turtle will not fall below 13.5 turtles/ha.
Unknown – but unlikely.
Data deficient due to a lack of surveys. No changes to suitable habitat since listing have been recorded, nor are they likely to have occurred.
7. Flatback turtle nesting. The average number nesting attempts measured over a one week period during the peak breeding period must not fall below 0.8 attempt/night in three successive years.
Unknown – but unlikely.
Parks Australia monitoring has shown turtle nesting occurs on Field Island and along the northern foreshore. Data collection in more recent times does not provide a baseline for assessment since listing. However, no impacts have been recorded in these habitats or evidence of a decline in nesting usage since commencement of annual monitoring.
8. Yellow chat distribution and abundance.
Flood plain habitats of the site continue to support yellow chat in the long-term.
No. Yellow chat have recently been recorded at the site by Parks Australia, therefore this LAC is met.
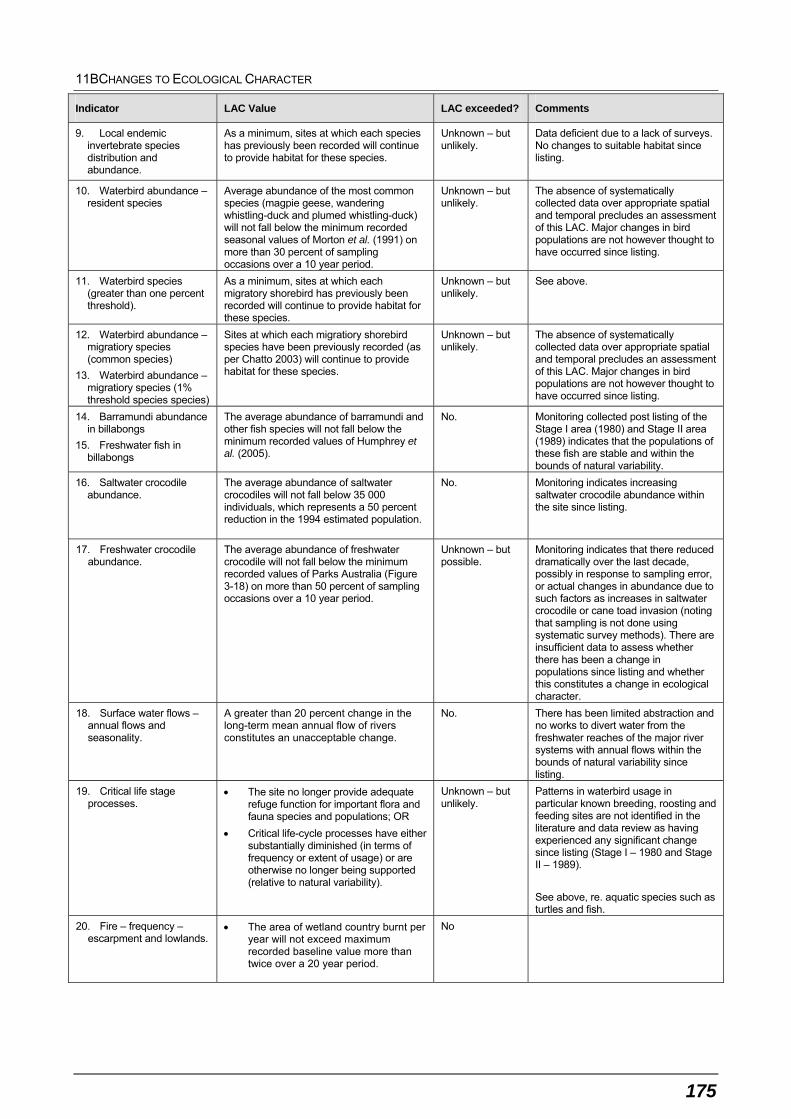
11BCHANGES TO ECOLOGICAL CHARACTER
175
Indicator LAC Value LAC exceeded? Comments
9. Local endemic invertebrate species distribution and abundance.
As a minimum, sites at which each species has previously been recorded will continue to provide habitat for these species.
Unknown – but unlikely.
Data deficient due to a lack of surveys. No changes to suitable habitat since listing.
10. Waterbird abundance – resident species
Average abundance of the most common species (magpie geese, wandering whistling-duck and plumed whistling-duck) will not fall below the minimum recorded seasonal values of Morton et al. (1991) on more than 30 percent of sampling occasions over a 10 year period.
Unknown – but unlikely.
The absence of systematically collected data over appropriate spatial and temporal precludes an assessment of this LAC. Major changes in bird populations are not however thought to have occurred since listing.
11. Waterbird species (greater than one percent threshold).
As a minimum, sites at which each migratory shorebird has previously been recorded will continue to provide habitat for these species.
Unknown – but unlikely.
See above.
12. Waterbird abundance – migratiory species (common species)
13. Waterbird abundance – migratiory species (1% threshold species species)
Sites at which each migratiory shorebird species have been previously recorded (as per Chatto 2003) will continue to provide habitat for these species.
Unknown – but unlikely.
The absence of systematically collected data over appropriate spatial and temporal precludes an assessment of this LAC. Major changes in bird populations are not however thought to have occurred since listing.
14. Barramundi abundance in billabongs
15. Freshwater fish in billabongs
The average abundance of barramundi and other fish species will not fall below the minimum recorded values of Humphrey et al. (2005).
No. Monitoring collected post listing of the Stage I area (1980) and Stage II area (1989) indicates that the populations of these fish are stable and within the bounds of natural variability.
16. Saltwater crocodile abundance.
The average abundance of saltwater crocodiles will not fall below 35 000 individuals, which represents a 50 percent reduction in the 1994 estimated population.
No. Monitoring indicates increasing saltwater crocodile abundance within the site since listing.
17. Freshwater crocodile abundance.
The average abundance of freshwater crocodile will not fall below the minimum recorded values of Parks Australia (Figure 3-18) on more than 50 percent of sampling occasions over a 10 year period.
Unknown – but possible.
Monitoring indicates that there reduced dramatically over the last decade, possibly in response to sampling error, or actual changes in abundance due to such factors as increases in saltwater crocodile or cane toad invasion (noting that sampling is not done using systematic survey methods). There are insufficient data to assess whether there has been a change in populations since listing and whether this constitutes a change in ecological character.
18. Surface water flows – annual flows and seasonality.
A greater than 20 percent change in the long-term mean annual flow of rivers constitutes an unacceptable change.
No. There has been limited abstraction and no works to divert water from the freshwater reaches of the major river systems with annual flows within the bounds of natural variability since listing.
19. Critical life stage processes.
The site no longer provide adequate refuge function for important flora and fauna species and populations; OR
Critical life-cycle processes have either substantially diminished (in terms of frequency or extent of usage) or are otherwise no longer being supported (relative to natural variability).
Unknown – but unlikely.
Patterns in waterbird usage in particular known breeding, roosting and feeding sites are not identified in the literature and data review as having experienced any significant change since listing (Stage I – 1980 and Stage II – 1989).
See above, re. aquatic species such as turtles and fish.
20. Fire – frequency – escarpment and lowlands.
The area of wetland country burnt per year will not exceed maximum recorded baseline value more than twice over a 20 year period.
No
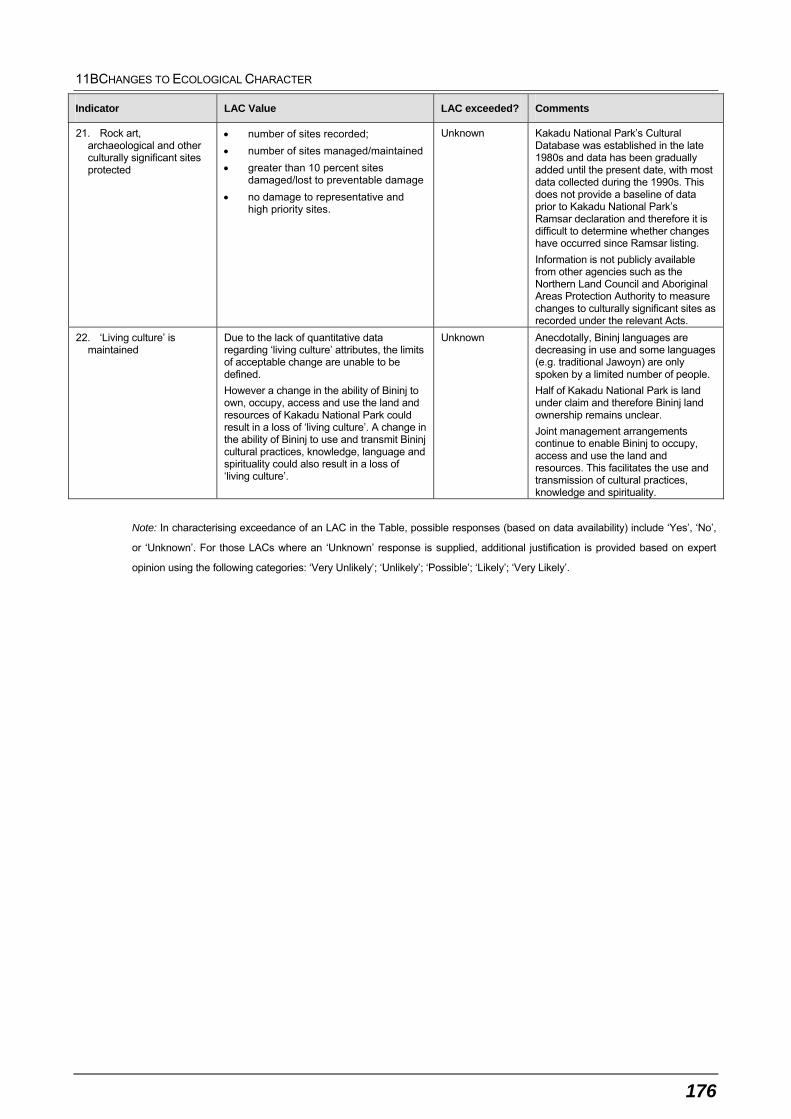
11BCHANGES TO ECOLOGICAL CHARACTER
176
Indicator LAC Value LAC exceeded? Comments
21. Rock art, archaeological and other culturally significant sites protected
number of sites recorded;
number of sites managed/maintained
greater than 10 percent sites damaged/lost to preventable damage
no damage to representative and high priority sites.
Unknown Kakadu National Park’s Cultural Database was established in the late 1980s and data has been gradually added until the present date, with most data collected during the 1990s. This does not provide a baseline of data prior to Kakadu National Park’s Ramsar declaration and therefore it is difficult to determine whether changes have occurred since Ramsar listing.
Information is not publicly available from other agencies such as the Northern Land Council and Aboriginal Areas Protection Authority to measure changes to culturally significant sites as recorded under the relevant Acts.
22. ‘Living culture’ is maintained
Due to the lack of quantitative data regarding ‘living culture’ attributes, the limits of acceptable change are unable to be defined.
However a change in the ability of Bininj to own, occupy, access and use the land and resources of Kakadu National Park could result in a loss of ‘living culture’. A change in the ability of Bininj to use and transmit Bininj cultural practices, knowledge, language and spirituality could also result in a loss of ‘living culture’.
Unknown Anecdotally, Bininj languages are decreasing in use and some languages (e.g. traditional Jawoyn) are only spoken by a limited number of people.
Half of Kakadu National Park is land under claim and therefore Bininj land ownership remains unclear.
Joint management arrangements continue to enable Bininj to occupy, access and use the land and resources. This facilitates the use and transmission of cultural practices, knowledge and spirituality.
Note: In characterising exceedance of an LAC in the Table, possible responses (based on data availability) include ‘Yes’, ‘No’,
or ‘Unknown’. For those LACs where an ‘Unknown’ response is supplied, additional justification is provided based on expert
opinion using the following categories: ‘Very Unlikely’; ‘Unlikely’; ‘Possible’; ‘Likely’; ‘Very Likely’.
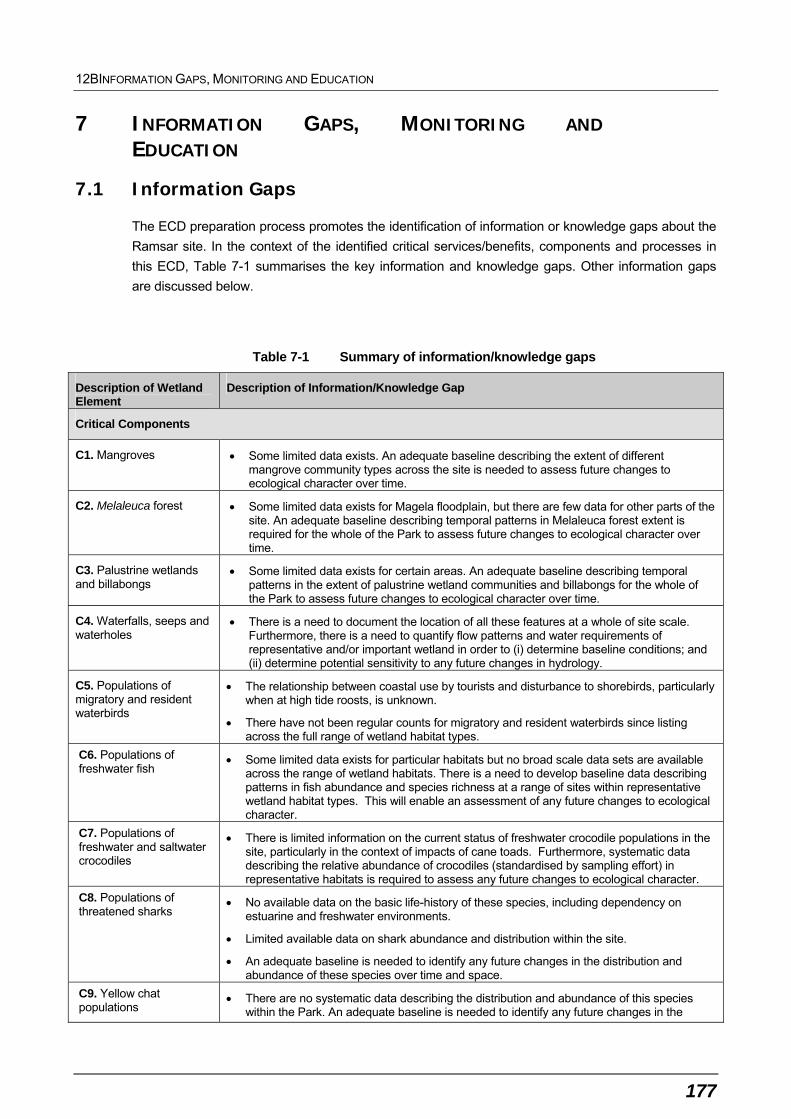
12BINFORMATION GAPS, MONITORING AND EDUCATION
177
7 INFORMATION GAPS, MONITORING AND EDUCATION
7.1 Information Gaps
The ECD preparation process promotes the identification of information or knowledge gaps about the
Ramsar site. In the context of the identified critical services/benefits, components and processes in
this ECD, Table 7-1 summarises the key information and knowledge gaps. Other information gaps
are discussed below.
Table 7-1 Summary of information/knowledge gaps
Description of Wetland Element
Description of Information/Knowledge Gap
Critical Components
C1. Mangroves Some limited data exists. An adequate baseline describing the extent of different mangrove community types across the site is needed to assess future changes to ecological character over time.
C2. Melaleuca forest Some limited data exists for Magela floodplain, but there are few data for other parts of the site. An adequate baseline describing temporal patterns in Melaleuca forest extent is required for the whole of the Park to assess future changes to ecological character over time.
C3. Palustrine wetlands and billabongs
Some limited data exists for certain areas. An adequate baseline describing temporal patterns in the extent of palustrine wetland communities and billabongs for the whole of the Park to assess future changes to ecological character over time.
C4. Waterfalls, seeps and waterholes
There is a need to document the location of all these features at a whole of site scale. Furthermore, there is a need to quantify flow patterns and water requirements of representative and/or important wetland in order to (i) determine baseline conditions; and (ii) determine potential sensitivity to any future changes in hydrology.
C5. Populations of migratory and resident waterbirds
The relationship between coastal use by tourists and disturbance to shorebirds, particularly when at high tide roosts, is unknown.
There have not been regular counts for migratory and resident waterbirds since listing across the full range of wetland habitat types.
C6. Populations of freshwater fish
Some limited data exists for particular habitats but no broad scale data sets are available across the range of wetland habitats. There is a need to develop baseline data describing patterns in fish abundance and species richness at a range of sites within representative wetland habitat types. This will enable an assessment of any future changes to ecological character.
C7. Populations of freshwater and saltwater crocodiles
There is limited information on the current status of freshwater crocodile populations in the site, particularly in the context of impacts of cane toads. Furthermore, systematic data describing the relative abundance of crocodiles (standardised by sampling effort) in representative habitats is required to assess any future changes to ecological character.
C8. Populations of threatened sharks
No available data on the basic life-history of these species, including dependency on estuarine and freshwater environments.
Limited available data on shark abundance and distribution within the site.
An adequate baseline is needed to identify any future changes in the distribution and abundance of these species over time and space.
C9. Yellow chat populations
There are no systematic data describing the distribution and abundance of this species within the Park. An adequate baseline is needed to identify any future changes in the
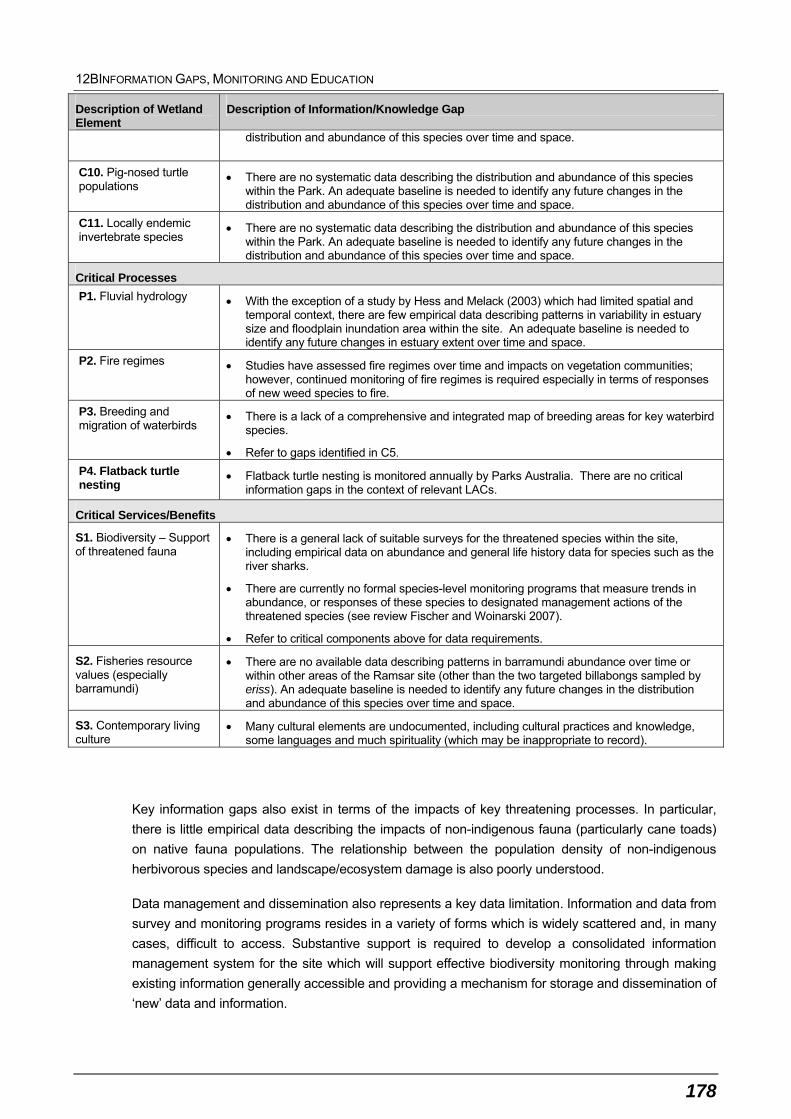
12BINFORMATION GAPS, MONITORING AND EDUCATION
178
Description of Wetland Element
Description of Information/Knowledge Gap
distribution and abundance of this species over time and space.
C10. Pig-nosed turtle populations
There are no systematic data describing the distribution and abundance of this species within the Park. An adequate baseline is needed to identify any future changes in the distribution and abundance of this species over time and space.
C11. Locally endemic invertebrate species
There are no systematic data describing the distribution and abundance of this species within the Park. An adequate baseline is needed to identify any future changes in the distribution and abundance of this species over time and space.
Critical Processes
P1. Fluvial hydrology With the exception of a study by Hess and Melack (2003) which had limited spatial and temporal context, there are few empirical data describing patterns in variability in estuary size and floodplain inundation area within the site. An adequate baseline is needed to identify any future changes in estuary extent over time and space.
P2. Fire regimes Studies have assessed fire regimes over time and impacts on vegetation communities; however, continued monitoring of fire regimes is required especially in terms of responses of new weed species to fire.
P3. Breeding and migration of waterbirds
There is a lack of a comprehensive and integrated map of breeding areas for key waterbird species.
Refer to gaps identified in C5.
P4. Flatback turtle nesting
Flatback turtle nesting is monitored annually by Parks Australia. There are no critical information gaps in the context of relevant LACs.
Critical Services/Benefits
S1. Biodiversity – Support of threatened fauna
There is a general lack of suitable surveys for the threatened species within the site, including empirical data on abundance and general life history data for species such as the river sharks.
There are currently no formal species-level monitoring programs that measure trends in abundance, or responses of these species to designated management actions of the threatened species (see review Fischer and Woinarski 2007).
Refer to critical components above for data requirements.
S2. Fisheries resource values (especially barramundi)
There are no available data describing patterns in barramundi abundance over time or within other areas of the Ramsar site (other than the two targeted billabongs sampled by eriss). An adequate baseline is needed to identify any future changes in the distribution and abundance of this species over time and space.
S3. Contemporary living culture
Many cultural elements are undocumented, including cultural practices and knowledge, some languages and much spirituality (which may be inappropriate to record).
Key information gaps also exist in terms of the impacts of key threatening processes. In particular,
there is little empirical data describing the impacts of non-indigenous fauna (particularly cane toads)
on native fauna populations. The relationship between the population density of non-indigenous
herbivorous species and landscape/ecosystem damage is also poorly understood.
Data management and dissemination also represents a key data limitation. Information and data from
survey and monitoring programs resides in a variety of forms which is widely scattered and, in many
cases, difficult to access. Substantive support is required to develop a consolidated information
management system for the site which will support effective biodiversity monitoring through making
existing information generally accessible and providing a mechanism for storage and dissemination of
‘new’ data and information.
12BINFORMATION GAPS, MONITORING AND EDUCATION
179
In addition to the above, it should also be recognised that eriss publishes a biennial assessment of
key knowledge needs based on the recommendations of ARRTC (Alligator Rivers Region Technical
Committee). The latest publications covering the periods 2004 to 2006 and 2007 to 2008 outline
specific priorities related to existing mining operations and more broad scale monitoring needs for the
Alligator Rivers Region. Some of the priorities and objectives relevant to the Ramsar values of the
site that should be considered in addition to the gaps outlined above include (refer Appendix 3A and
3B in Jones and Webb 2009):
Reassessment of current threats, including surface water transport of radionuclides that could
pose human health risks to the Aboriginal population eating bush tucker.
Review and assess ecological risks via the surface water pathways, including risks of
bioaccumulation and trophic transfer.
Investigate diffuse contamination of groundwater, particularly into irrigation areas adjacent to the
Magela Creek.
Investigate wetland filters, particularly the ability/capacity of filters to remove metals from the
water column and protect downstream environments.
Continue ecotoxicology research and assessment in relation to uranium toxicity to local native
species.
Landscape-scale analysis of impact to detect possible impacts from mining to be distinguished
from those arising from other causes and/or natural variability.
Continue to monitor and rehabilitate former mine sites of the South Alligator River valley, noting
that existing monitoring of these sites currently occurs and the results reported to Parks Australia.
7.2 Monitoring Needs
In the context of the site’s Ramsar status and the current ECD study, the primary monitoring needs
relate to the need to assess the suitability of limits of acceptable change (versus natural variability)
and to assess more definitively if changes to ecological character have occurred or are being
approached. Principally, this monitoring should relate to:
Broad-scale observation/monitoring of wetland habitat extent (noting that a logical precursor to
this would be to establish a better correlation between existing wetland mapping and the Ramsar
wetland type classification system).
Habitat condition monitoring (principally in the form of monitoring underlying wetland ecosystem
processes such as water quality and hydrological process or surrogate biological indicators).
Formal species-level monitoring programs for threatened species, specifically measuring trends
in abundance and responses of these species to designated management actions for them.
More regular counts of breeding, roosting and feeding waterbirds with a particular emphasis on
those species that meet the one percent population threshold and in key life-cycle locations.
Continued and more intensive survey and monitoring of fish and invertebrate species that
underpin the critical services of the site including key nursery area and spawning sites.

12BINFORMATION GAPS, MONITORING AND EDUCATION
180
A monitoring program for non-indigenous flora and fauna, providing data on habitat, densities and
damage. Data needs to be analysed within the appropriate quantitative frameworks to provide
robust appraisals of the threats of non-indigenous species (risk analysis) and the options for
control (cost–benefit analyses) (Finlayson et al. 2006; Bradshaw et al. 2007).
Monitor the number, nature and condition of archaeological materials, sites and rock art sites
associated with wetland environments and habitats that contribute to historical cultural heritage
values of the sites for Bininj.
7.3 Communication, Education, Participation and Awareness
The Ramsar Convention recognises that developing communication, education, participation and
awareness (CEPA) messages is a powerful tool for the conservation and wise use of wetlands. As
such, the Convention has a CEPA Program that was adopted by Resolution X.8 in 2008 (following
previous Resolutions in 1999 and 2002). The guidelines of the CEPA Program encourage
Contracting Parties to a number of activities that promote Wetland CEPA.
A comprehensive CEPA program for an individual Ramsar site is beyond the scope of an ECD, but
key communication messages and CEPA actions, such as a community education program, can be
used as a component of a management plan.
A combined set of CEPA messages relevant to the ECD can be used to communicate the importance
of the Kakadu National Parks Ramsar site, why they were listed, the ecological character of the site,
threats to the site and future actions required. These key messages also serve as a summary of the
key findings and conclusions of the ECD study and are as follows:
Kakadu National Park is listed as a Wetland of International Importance under the Ramsar
Convention and meets all nine Nomination Criteria.
The Kakadu National Park Ramsar site was historically two separate Ramsar sites within Kakadu
National Park. These were Kakadu National Park (Stage I including wetland components of
Stage III) and Kakadu National Park (Stage II). Kakadu National Park Stage I encompassed the
East Alligator River, Stone County and inland areas of the Park, and the Stage II site which is
centred on the floodplain wetlands associated with the Wildman, West Alligator and South
Alligator River systems. In April 2010, the two Ramsar sites were merged together to form a
single Ramsar site, called Kakadu National Park. In addition, the site was extended by
approximately 600 000 hectares to include all remaining areas of Stage III. The merger and
extension bought the Ramsar boundary in line with the existing boundary of the national park.
Through its unique and outstanding cultural landscape, the world’s oldest ‘living culture’,
extraordinary rock art, archaeological resources and Bininj environmental management, Kakadu
National Park provides a unique example of wise use of wetlands through the application of
traditional Bininj practices. This provides excellent opportunities to showcase wise wetland
management through a cultural landscape and to empower local communities.
Limits of acceptable change for these wetland services, components and processes have been
set by the ECD that can be used in future planning and management of the Park. In particular,
12BINFORMATION GAPS, MONITORING AND EDUCATION
181
the ECD outlines information gaps and monitoring needs for assessing whether the ecological
character of the site is being maintained over time.
Based on a review of information and data at the time of the site’s listing in 1980 and 1989 in
combination with the extensions in 1995 and 2010, critical components, processes and services
identified as being present at the time of listing continue to be provided by the site at the time of
preparation of this ECD in 2010. This includes the site continuing to support substantial waterbird,
saltwater crocodile, turtle and fish populations during different life history stages, the presence of
a range of wetland species of conservation significance, and cultural and provisioning services
that are significant to both indigenous and non-indigenous wetland users.
While it is considered that there has not been a change in ecological character since listing, there
are particular wetland elements that appear to have declined in abundance since the time of
listing. In particular, saltwater intrusion into freshwater wetland areas has resulted in the loss of
freshwater billabongs and associated Melaleuca communities that have high natural and cultural
values. Anecdotal evidence suggests that the abundance of some wetland-dependant fauna,
such as freshwater crocodiles Crocodylus johnstoni, may have declined since listing, possibly in
response to cane toad invasion. Further research is required to quantify changes and to possible
implications with respect to maintaining the ecological character of the site.
A number of weeds have proliferated within the Park since listing (mimosa, salvinia, para grass,
olive hymenachne), but as a result of active management and control, it is a conclusion of the
study that the ecological character of the site has not been significantly changed or degraded.
Positive changes to ecological character have also occurred over the intervening decades since
listing of the site, principally through the eradication of buffalo from the Park’s floodplain wetlands
and the return of these environments to somewhat of a ‘pre-buffalo’ state.
In terms of future threats to ecological character, the site continues to be threatened by weeds
and other exotic flora, exotic fauna, impacts from increasing visitors and recreational activities,
mining activities and future threats such as climate change which is likely to exacerbate saltwater
intrusion impacts already observed.
Given the current and future threats, it is imperative that ecological understanding of the site
continues to be obtained and developed and wherever practicable, broad-scale monitoring of
possible changes to ecological character needs to be pursued.
13BREFERENCES
182
8 REFERENCES
Allen, G.R. (1991) Field Guide to the Freshwater Fishes of New Guinea. Madang, Christensen
Research Institute.
Allen, G. R., Midgley, S. H., Allen, M. (2002) Field Guide to the Freshwater Fishes of Australia.
Western Australian Museum, Perth.
Allsop, Q., de Lestang, P., Griffin, R. and White, G. (2006) Fishnote No. 27: Barramundi – Your
Questions Answered. Government Publication, Northern Territory Government, Darwin. [Online]
http://www.nt.gov.au/d/Content/File/p/Fishnote/FN27.pdf
Andersen, A.N., Braithwaite, R.W., Cook, G.D., Corbett, L.C., Williams, R.J., Douglas, M., Gill, A.M.,
Setterfield, S. and Muller, W.J. (1998) Fire research for conservation management in tropical
savannas: introducing the Kapalga fire experiment. Australian Journal of Ecology 23, 95-110.
Armstrong, M. (2004) The yellow chat Epthianura crocea tunneyi in Kakadu National Park. Report to
Parks Australia North.
Australian Local Government Association (ALGA) (2006) Policy and Research: Environment. [Online]
http://www.alga.asn.au/policy/environment/coasts/roles/
Australian National University (ANU) (2009) Implications of Climate Change for Australia's World
Heritage Properties: A Preliminary Assessment. Report Prepared for the Australian Government
Department of Climate Change and Department of the Environment, Water, Heritage and the Arts by
the Fenner School of Environment and Society, the ANU. [Online]
http://www.environment.gov.au/heritage/publications/climatechange/pubs/worldheritage-
climatechange.pdf
Bamford, M.J. (1988) Kakadu National Park: A Preliminary Survey of Migratory Waders
October/November 1987. RAOU Report No. 41. Royal Australasian Ornithologists Union, Melbourne.
Bamford, M.J. (1990) RAOU Survey of Migratory Waders in Kakadu National Park: Phase III. RAOU
Report 70. Royal Australasian Ornithologists Union, Melbourne.
Bamford, M, Watkins, D., Bancroft, W., Tischler. G. and Wahl, J. (2008) Migratory Shorebirds of the
East Asian - Australasian Flyway; Population Estimates and Internationally Important Sites. Wetlands
International - Oceania. Canberra.
Banfai, D.S. and Bowman, D.M.J.S. (2006) Forty years of lowland monsoon rain forest expansion in
Kakadu National Park, northern Australia. Biological Conservation 131, 553–565.
Banfai, D.S. and Bowman, D.M.J.S. (2007) Drivers of rain-forest boundary dynamics in Kakadu
National Park, northern Australia: a field assessment. Journal of Tropical Ecology 23: 73-86.
Bartolo, R., Wasson, R., Valentine, E., Cleland, E., Bayliss, P. and Winderlich, S. (2008) Climate
Change - The Status of Climate Change Research in the Kakadu Landscape Context. In: Kakadu
National Park Landscape Symposia Series 2007-2009, Symposium 1: Landscape Change Overview,
13BREFERENCES
183
17-18 April 2007. (Eds. D. Walden and S. Nou) [Online]
http://environment.gov.au/ssd/publications/ir/pubs/ir532.pdf
Bayliss, B., Brennan, K., Eliot, I., Finlayson, M., Hall, R., House T., Pidgeon, B., Walden, D. and
Waterman, P. (1997) Vulnerability Assessment of Predicted Climate Change and Sea Level Rise in
the Alligator Rivers Region, Northern Territory, Australia. Supervising Scientist Report 123,
Supervising Scientist, Canberra. [Online] http://environment.gov.au/ssd/publications/ssr/123.html
Bayliss, P. and Yeomans, K.M. (1990) Seasonal distribution and abundance of magpie geese,
Anseranas semipalmata Latham, in the Northern Territory, and their relationship to habitat, 1983-86.
Australian Wildlife Research 17, 15-38.
Bayliss, P., Bartolo, R. and van Dam, R. (2008) Quantitative ecological risk assessments for the Daly
River. In: Ecological risk assessments for Australia’s Northern Tropical Rivers. A report to Land and
Water Australia. (Eds. R. Bartolo, P. Bayliss, R. van Dam). pp 272-415. [Online]
http://www.environment.gov.au/ssd/tropical-rivers/triap-sp2.html
Bayliss, P., van Dam, R., Boyden, J., and Walden D. (2006) Ecological risk assessment of Magela
floodplain to differentiate mining and non-mining impacts. In: eriss research summary 2004-2005
Supervising Scientist Report 189. (Eds. K.G. Evans, J. Rovis-Hermann, A. Webb and D.R. Jones) pp.
172-185. Supervising Scientist, Darwin Northern Territory. [Online]
http://environment.gov.au/ssd/publications/ssr/pubs/ssr189-print.pdf
Birch, W. R. and Birch, M. (1984) Succession and pattern of tropical intertidal seagrasses in Cockle
Bay, Queensland, Australia: a decade of observations. Aquatic Botany 19, 343–367.
Bishop, K. and Forbes, M. (1991) The freshwater fishes of northern Australia. In: Monsoonal
Australia: Landscape Ecology and Man in the Northern Lowlands. (Eds. C. Haynes, M Ridpath, M.
Williams and A. Balkema). Brookfield Publishers, Rotterdam. pp 79-107.
Bishop, K.A., Allen, S.A. and Pollard, D.A. (1981) Autecological Studies on the Freshwater Fishes of
the Alligator Rivers Region. Parts A and B. Outline of the Study, Summary, Conclusions and
Recommendations. Office of the Supervising Scientist, Research Institute Report Series. [Online]
http://www.environment.gov.au/ssd/publications/ssr/pubs/ssr145.pdf
Bishop, K.A., Allen, S.A. Pollard, D.R. and Cook, M.G. (1986) Ecological Studies on the Fishes of the
Alligator Rivers Region, Northern Territory, Vol. 1: Outline of the Study, Summary, Conclusions and
Recommendations. Research Report 4, Supervising Scientist for the Alligator Rivers Region.
Australian Government Publishing Service, Canberra. [Online]
http://www.environment.gov.au/ssd/publications/rr/pubs/rr4i.pdf
Bishop, K.A., Allen, S.A. Pollard, D.R. and Cook, M.G. (1990) Ecological Studies on the Fishes of the
Alligator Rivers Region, Northern Territory, Vol. 2: Synecology. Research Report 4, Supervising
Scientist for the Alligator Rivers Region. Australian Government Publishing Service, Canberra.
[Online] http://www.environment.gov.au/ssd/publications/rr/pubs/rr4ii.pdf
BMT WBM (2010) Kakadu-Vulnerability to Climate Change Impacts. A report to the Australian
Government Department of Climate Change (in prep).
13BREFERENCES
184
Bowman, D.M.J.S. and Dunlop, C.R. (1986) Vegetation pattern and environmental correlates in
coastal forests of the Australian monsoon tropics. Vegetatio 65, 99-104.
Bowman, D.M.J.S. and Wightman, G.M. (1985) Small scale vegetation pattern associated with a
deeply incised gully, Gunn Point, northern Australia. Proceedings of the Royal Society of Queensland
96, 63-73.
Boyden, J., Walden, D., Bayliss, P. and Saalfeld, K. (2008) A GIS Compendium for Landscape-scale
Risk Assessment of the Magela Creek Floodplain and Broader Alligator Rivers Region, Northern
Territory. Supervising Scientist Report 192. Supervising Scientist, Darwin. [Online]
http://www.environment.gov.au/ssd/publications/ssr/pubs/ssr192.pdf
Bradshaw, C.J.A. (2008) Invasive species. Feral Animal Species in Northern Australia: Savvy
Surveillance and Evidence-based Control. In: Kakadu National Park Landscape Symposia Series
2007–2009. Symposium 1: Landscape Change Overview, 17–18 April 2007, South Alligator Inn,
Kakadu National Park. (Eds. D. Walden and S. Nou) Internal Report 532, April, Supervising Scientist,
Darwin. [Online] http://environment.gov.au/ssd/publications/ir/pubs/ir532.pdf
Bradshaw, C.J.A., Field, I.C., Bowman, D.M.J.S. and Haynes, C. (2007) Current and future threats
from non-indigenous animal species in northern Australia: a spotlight on World Heritage Area Kakadu
National Park. Wildlife Research 34, 419-436.
Braithwaite, R.W., Dudzinski, M.L., Ridpath, M.G., and Parker, B.S. (1984) The impact of water
buffalo on the monsoon forest ecosystem in Kakadu National Park. Australian Journal of Ecology 9,
309-322.
Braithwaite, R.W., Friend, G.R. and Wombey, J.C. (1991) Reptiles and amphibians. In: Monsoonal
Australia: Landscape, Ecology and Man in the Northern Lowlands. (Eds. C.D. Haynes, M.G. Ridpath
and M.A.J. Williams) A.A. Balkema, Rotterdam, The Netherlands.
Brennan, K. (1996) An Annotated Checklist of the Vascular Plants of the Alligator Rivers Region,
Northern Territory, Australia. Supervising Scientist Report 109, Supervising Scientist, Canberra.
[Online] http://www.environment.gov.au/ssd/publications/ssr/pubs/ssr109.pdf
Bridges, K.W., Phillips, R.C. and Young, P.C. (1981) Patterns of some seagrass distribution in the
Torres Strait, Queensland. Australian Journal of Marine and Freshwater Research 33, 273–283.
Britton, A. (2009) Preliminary Report on Current and Historical Population Trends for Saltwater
Crocodile (Crocodylus porosus) Populations in Tidal Rivers of Kakadu National Park – Draft.
Prepared by ‘Big Gecko’ Crocodilian Research and Consulting, in collaboration with the staff and
traditional owners of Kakadu National Park, Sanderson, Northern Territory.
Brock, J. (1993) Native Plants of Northern Australia. Reed.
Brocklehurst, P. and van Kerckhof, D. (1994) Melaleuca Survey of the Northern Territory. Documents
1 and 2. Conservation Commission of the Northern Territory, Darwin. 1:100 000.
13BREFERENCES
185
Brockwell, S., Clarke, A. and Levitus, R. (2001) Seasonal Movement in the Prehistoric Human
Ecology of the Alligator Rivers Region, North Australia. In: Histories of Old Ages. Essays in Honour of
Rhys Jones. (Eds. A. Anderson, I. Lilley and S. O’Connor). Pandanus, Canberra. pp 361-380.
Brockwell, S., Levitus, R., Russell-Smith, J. and Forrest, P. (1995) Aboriginal Heritage. In: Kakadu
Natural and Cultural Heritage Management. (Eds. T. Press, D. Lea, A. Webb and A. Graham)
Australian Nature Conservation Agency and North Australia Research Unit, ANU, Australia.
Bruce, A.J. (1993) Kakaducaris glabra gen. nov., sp. nov., a new freshwater shrimp from the Kakadu
National Park, Northern Territory, Australia, Crustacea: Decapoda: Palaemonidae with the
designation of new subfamily Kakaducaridinae. Hydrobiologia 268, 27-44.
Burrows, D.W. (2008) Technical Report 7 – Freshwater Fish. In: A Compendium of Ecological
Information on Australia’s Northern Tropical Rivers. Sub-project 1 of Australia’s Tropical Rivers: An
Integrated Data Assessment and Analysis (DET 18). (Eds. G.P. Lukacs and C.M. Finlayson) A report
to Land and Water Australia. National Centre for Tropical Wetland Research, Townsville,
Queensland. [Online] http://environment.gov.au/ssd/tropical-rivers/pubs/triap-sp1-fish.pdf
Campbell, S.J. and McKenzie, L.J. (2004) Flood related loss and recovery of intertidal seagrass
meadows in southern Queensland, Australia. Estuarine, Coastal and Shelf Science 60, 477-490.
Chaloupka, G. (1993) Journey in Time. Reed Books, Australia.
Chappell, J., and Woodroffe, C. D. (1985) Morphodynamics of Northern Territory Tidal Rivers and
Floodplains. In: Coasts and Tidal Wetlands of the Australian Monsoon Region. (Eds. K.N. Bardsley,
J.D.S. Davie and C.D. Woodroffe) Australia National University, Darwin. pp. 85-96.
Chatto, R. (2000) Waterbird Breeding Colonies in the Top End of the Northern Territory. Technical
Report 69. Parks and Wildlife Commission of the Northern Territory, Palmerston. [Online]
http://www.territorystories.nt.gov.au/bitstream/handle/10070/203072/2000_waterbirds_rpt69.pdf?sequ
ence=1
Chatto, R. (2003a) The Distribution and Status of Shorebirds around the Coast and Coastal Wetlands
of the Northern Territory. Technical Report 73. Parks and Wildlife Commission of the Northern
Territory,Palmerston.[Online]
http://www.territorystories.nt.gov.au/bitstream/handle/10070/204106/2003_shorebirds_rpt76.pdf?seq
uence=1
Chatto, R. (2003b) A Tour of Selected Significant Coastal Shorebird Sites in the Top End of the
Northern Territory of Australia. In: Status and Conservation of Shorebirds in the East Asian-
Australasian Flyway. (Ed. P. Straw) Wetlands International Global Series 18, International Wader
Studies 17, Sydney.
Chatto, R. (2006) The Distribution and Status of Waterbirds around the Coast and Coastal Wetlands
of the Northern Territory. Parks and Wildlife Commission of the Northern Territory, Palmerston.
[Online] http://www.nt.gov.au/nreta/publications/wildlife/science/pdf/2006_waterbirds_report76.pdf
Chatto, R. and Baker, B. (2008) The Distribution and Status of Marine Turtle Nesting in the Northern
Territory. Technical Report 77. Parks and Wildlife Service, Northern Territory Department of Natural
13BREFERENCES
186
Resources, Environment and The Arts, Darwin. [Online]
http://www.nt.gov.au/nreta/publications/wildlife/science/pdf/marine_turtle_nesting.pdf
Cobb, S.M., Saynor, M.J., Eliot, M. Eliot, I. and Hall, R. (2007) Saltwater Intrusion and Mangrove
Encroachment of Coastal Wetlands in the Alligator Rivers Region, Northern Territory, Australia.
Supervising Scientist Report 191, Supervising Scientist, Darwin, Northern Territory. [Online]
http://environment.gov.au/ssd/publications/ssr/pubs/ssr191.pdf
Cogger, H. (2000) Reptiles and Amphibians of Australia, 6th edition. Reed New Holland Publishers,
Sydney.
Cogger, H. and Heatwole, H. (1981) The Australian Reptiles: Origins, Biogeography, Distribution
Patterns and Island Evolution. In: Ecological Biogeography of Australia. (Ed. A. Keast) Mongraphia
Biologicae Vol. 41, Dr W. Junk, The Hague. pp 1331-1373.
Coleman, A.P.M., Henry G.W., Reid D.D. and Murphy J.J. (2003). Indigenous Fishing Survey of
Northern Australia. In: The National Recreational and Indigenous Fishing Survey. (Eds. G.W. Henry
and J.M. Lyle) New South Wales Fisheries Final Report 48. pp 98 – 123. [Online]
http://www.daff.gov.au/__data/assets/pdf_file/0011/23501/final_recsurvey_report.pdf
Commonwealth of Australia (1988) The Potential of the Kakadu National Park Region. Senate
Standing Committee on Environment, Recreation and the Arts. Australian Government Publishing
Service, Canberra.
Commonwealth of Australia (2006) A Guide to the Integrated Marine and Coastal Regionalisation of
Australia Version 4.0. Department of the Environment and Heritage, Canberra, Australia. [Online]
http://www.environment.gov.au/coasts/mbp/publications/imcra/pubs/imcra4.pdf
Compagno, L.J.V., White, W.T. and Last, P.R. (2008) Glyphis garricki sp. nov., a new species of river
shark (Carcharhiniformes: Carcharhinidae) from northern Australia and Papua New Guinea, with a
redescription of Glyphis glyphis (Müller & Henle, 1839). In: Descriptions of New Australian
Chondrichthyans. (Eds. P.R. Last, W.T. White and J.J. Pogonoski). CSIRO Marine and Atmospheric
Research Paper No. 022. pp 203-225.
Cook, G. D. (1994) The fate of nutrients during fires in a tropical savanna. Australian Journal of
Ecology 19, 359-365
Cowie, I.E. and Finlayson, C.M. (1986) Plants of the Alligator Rivers Region, Northern Territory.
Technical memorandum 17, Supervising Scientist for the Alligator Rivers Region, AGPS, Canberra.
Cowie, I.D., Finlayson, C.M. and Bailey, B.J. (1988) Alien Plants in the Alligator Rivers Region,
Northern Territory, Australia. Technical memorandum 23, Supervising Scientist for the Alligator
Rivers Region, AGPS, Canberra. [Online]
http://environment.gov.au/ssd/publications/tm/pubs/tm23.pdf
Cowie, I.D., Short, P.S. and Osterkamp Madsen, M. (2000) Floodplain Flora: A Flora of the Coastal
Floodplains of the Northern Territory, Australia. Australian Biological Resources Study, Canberra.
13BREFERENCES
187
CSIRO (2009) Water in the Timor Sea Drainage Division. Water for a Healthy Country Flagship.
Australia Government, National Water Commission. [Online]
http://www.clw.csiro.au/publications/waterforahealthycountry/nasy/documents/TimorSea/NASY-
Timor-Sea-Drainage-factsheet.pdf
Davie, J.D.S. (1985) The Mangrove Vegetation of the South Alligator River, Northern Australia. In:
Coasts and Tidal Wetlands of the Australian Monsoon Region, A Collection of Papers Presented at a
Conference Held in Darwin, 4-11 November 1984. (eds K.N. Bardsley, J.D.S. Davie and C.D.
Woodroffe) Australian National University North Australia Research Unit, Darwin. pp 133-152.
Davis, T.L.O. (1985) Seasonal changes in gonad maturity and abundance of larvae and early
juveniles of barramundi, Lates calcarifer (Bloch), in Van Dieman Gulf and the Gulf of Carpentaria.
Journal of Marine and Freshwater Research 36, 177-190.
de Lacy, T. (1994) The Uluru/Kakadu Model: Anangu Tjukurrpa. 50 000 years of Aboriginal Law and
Land Management Changing the Concept of National Parks in Australia. Society and Natural
Resources 7, 479-498.
Dean, J.C. and Suter, P.J. (2004) Descriptions of new species and a new genus of leptophlebiid
mayflies (Insecta: Ephemeroptera) from the Northern Territory, Australia. Memoirs of Museum
Victoria 61, 111-118
Department of the Environment, Water, Heritage and the Arts (DEWHA) (2008) National Framework
and Guidance for Describing the Ecological Character of Australian Ramsar Wetlands. Canberra.
[Online] http://www.environment.gov.au/water/publications/environmental/wetlands/pubs/module-2-
framework.pdf
Department of the Environment, Water, Heritage and the Arts (DEWHA). (2009a) Matters of National
Environmental Significance Significant impact guidelines 1.1 Environment Protection and Biodiversity
Conservation Act 1999. Commonwealth of Australia. [Online]
http://www.environment.gov.au/epbc/publications/pubs/nes-guidelines.pdf
Department of the Environment, Water, Heritage and the Arts (DEWHA). (2009b) Guidance on
Notifying Change in Ecological Character of Australian Ramsar Wetlands (Article 3.2).
Commonwealth of Australia, Canberra. [Online]
http://www.ramsar.org/pdf/wurc/wurc_australia_article3-2.pdf
Department of Natural Resources, Environment and the Arts (NRETA) (2008) Groundwater of the
Northern Territory. Map and Associated Information. Palmerston, Northern Territory.
Department of Natural Resources, Environment, the Arts and Sports (NRETAS) (2009) Draft Weed
Management Plan for Gamba Grass (Andropogon gayanus). Palmerston, Northern Territory.
http://www.nt.gov.au/nreta/natres/weeds/find/gamba/pdf/draft_weedmgmtplan.pdf
Director of National Parks (2007) Kakadu National Park Management Plan 2007-2014. Director of
National Parks. [Online]
http://www.environment.gov.au/parks/publications/kakadu/pubs/management-plan.pdf
http://www.environment.gov.au/water/publications/environmental/wetlands/pubs/module-2-framework.pdf�
13BREFERENCES
188
Doody, J.S., Georges, A. and Young, J.E. (2003) Twice every second year: reproduction in the pig-
nosed turtle, Carettochelys insculpta, in the wet-dry tropics of Australia. Journal of Zoology 259, 179-
188.
Doody, J.S., Green, B., Sims, R., Rhind, D., West, P. and Steer, D. (2006) Indirect impacts of
invasive cane toads (Bufo marinus) on nest predation in pig-nosed turtles (Carettochelys insculpta).
Wildlife Research 33, 349–354.
Dostine, P. and Skeat, A. (1993) OSS/ANPWS Waterbird Population and Habitat Monitoring Project.
Internal report 111, Supervising Scientist for the Alligator Rivers Region, Canberra.
Douglas, M., Bayliss, P., Christopherson, P., Petty, A., Traill, L. and Ferdinands, K. (2008) Landscape
Change in Floodplains. In: Landscape Change Overview, 17–18 April 2007, South Alligator Inn,
Kakadu National Park. Internal Report 532, Supervising Scientist, Darwin. pp 29-34. [Online]
http://environment.gov.au/ssd/publications/ir/pubs/ir532.pdf
Douglas, M., Bunn, S. and Davies, P. (2005) River and wetland food webs in Australia’s wet-dry
tropics: general principles and implications for management. Marine and Freshwater Research 56,
329-342.
Douglas, M.M., Bunn, S.E., Pidgeon, R.J.W., Davies, P.E., Barrow, P., O’Connor, R.A. and Winning,
M. (2001) Weed Management and the Biodiversity and Ecological Processes of Tropical Wetlands.
Final Report. National Wetlands R and D Program, Environment Australia and Land and Water
Australia, Canberra. [online]
http://www.environment.gov.au/water/publications/environmental/wetlands/pubs/weed.pdf
Duke, N.C. (1992) Mangrove Floristics and Biogeography. In: Tropical Mangrove Ecosystems
(Volume 41), Coastal and Estuarine Studies Series. (Eds. A.I. Robertson and D.M. Alongi) American
Geophysical Union, Washington DC. pp 63-100.
Edwards, A., Kennett, R., Price, O., Russell-Smith, J.R.S., Spiers, G. and Woinarski J.C.Z. (2003)
Monitoring the impacts of fire regimes on vegetation in northern Australia an example from Kakadu
National Park. International Journal of Wildland Fire 12, 427–440.
Environment Australia (2003) Recovery Plan for Marine Turtles in Australia. Marine Species Section,
Approvals and Wildlife Division, Environment Australia in consultation with the Marine Turtle
Recovery team, Canberra. [Online] http://www.environment.gov.au/coasts/publications/turtle-
recovery/pubs/marine-turtles.pdf
Field, I.C., Charters, R., Buckworth, R.C., Meekan, M.G. and Bradshaw, C.G.A. (2008) Distribution
and Abundance of Glyphis and Sawfishes in Northern Australia and Their Potential Interactions with
Commercial Fisheries. Commonwealth of Australia. [Online]
http://www.environment.gov.au/coasts/publications/pubs/glyphis-sawfish-distribution.pdf
Finlayson, C.M. (2005) Plant ecology of Australia’s tropical floodplain wetlands: a review. Annals of
Botany 96, 541–555.
13BREFERENCES
189
Finlayson, C.M. and Woodroffe, C.D. (1996) Wetland Vegetation. In: Landscapes and Vegetation
Ecology of the Kakadu Region, Northern Australia. (Eds C.M. Finlayson and I. von Oertzen) Kluwer
Academic Publishers, Dordrecht. pp 81–112.
Finlayson, C.M., Bailey, B.J. and Cowie, I.D. (1989) Macrophyte Vegetation of the Magela Creek
Floodplain, Alligator River Region, Northern Territory. Research Report 5, Supervising Scientist for
the Alligator Rivers Region. Australian Government Publishing Service, Canberra. [Online]
http://environment.gov.au/ssd/publications/rr/pubs/rr5.pdf
Finlayson, C., Cowie, I. and Bailey, B. (1990) Characteristics of a Seasonally Flooded Freshwater
System in Monsoonal Australia. In: Wetland Ecology and Management: Case Studies. (Eds. D.F.
Whigham, D. Dykyjova and S. Hejney) Kluwer Academic Publishers, Dordrecht. pp. 141-162.
Finlayson, C.M., Cowie, I.D. and Bailey, B.J. (1993) Biomass and litter dynamics in a Melaleuca
forest on a seasonally inundated floodplain in tropical, Northern Australia. Wetlands Ecology and
Management 2, 177–188.
Finlayson, C.M., Bailey, B.J., Freeland, W.J. and Flemming, M.R. (1988) Wetlands of the Northern
Territory. In: The Conservation of Australian Wetlands. (Eds. A.J. McComb and P.S. Lake) Surrey
Beatty and Sons, Sydney. pp 103-126.
Finlayson, C.M., Lowry, J., Grazia Bellio, M., Nou, S., Pidgeon, R, Walden, D., Humphrey, C. and
Fox, G. (2006) Biodiversity of the wetlands of the Kakadu Region, northern Australia. Aquatic Science
68, 374-399.
Finlayson, C.M., Thompson, K., von Oertzen, I. and Cowie, I.D. (1992) Macrophytic Vegetation of
Five Magela Creek Billabongs, Alligator Rivers Region, Northern Territory. Internal report 54,
Supervising Scientist for the Alligator Rivers Region, Canberra.
Finlayson, C.M., Thompson, K., von Oertzen, I. and Cowie, I.D. (1994) Vegetation Communities of
Five Magela Creek billabongs, Alligator Rivers Region, Northern Territory. Technical memorandum
46, Supervising Scientist for the Alligator Rivers Region, AGPS, Canberra. [Online]
http://environment.gov.au/ssd/publications/tm/pubs/tm46.pdf
Fisher, A. and Woinarski, J.C.Z. (2007) Fauna - With Special Reference to Threatened Species. In:
Kakadu National Park Landscape Symposia Series 2007–2009. Symposium 1: Landscape Change
Overview, 17–18 April 2007, South Alligator Inn, Kakadu National Park. (Eds. D. Walden and S. Nou)
Internal Report 532, April, Supervising Scientist, Darwin. [Online]
http://environment.gov.au/ssd/publications/ir/pubs/ir532.pdf
Fox, J.R.W., Kelleher, G.G. and Kerr, C.B. (1977) Ranger Uranium Environmental Inquiry: Second
Report. Report Published by the Commonwealth Government Publishing Service, Canberra.
Franklin, D.C. (2008) Report 9: The Waterbirds of Australian Tropical Rivers and Wetlands. In: A
Compendium of Ecological Information on Australia’s Northern Tropical Rivers. Sub-project 1 of
Australia’s Tropical Rivers – An Integrated Data Assessment and Analysis (DET 18). (Eds. G.P.
Lukacs and C.M. Finlayson) A report to Land and Water Australia. National Centre for Tropical
Wetland Research, Townsville, Queensland. [Online] http://environment.gov.au/ssd/tropical-
rivers/pubs/triap-sp1-waterbirds.pdf
13BREFERENCES
190
Franklin, D.C. and Bowman, D.M.J.S. (2004) A multi-scale biogeographic analysis of Bambusa
arnhemica, a bamboo from monsoonal northern Australia. Journal of Biogeography 31, 1335-1353.
Friend, G.R. and Cellier, K.M. (1990) Wetland herpetofauna of Kakadu National Park, Australia:
Seasonal richness trends, habitat preferences and the effects of feral ungulates. Journal of Tropical
Ecology 6, 131-152.
Frith, H.J. and F. Davies, S.J.J. (1961) Ecology of the Magpie Goose Ecology of the Magpie Goose
Anseranas semipalmata Latham. Wildlife Research 6, 91-141.
Fukuda, Y., Whitehead, P. and Boggs, G. (2007) Broad-scale environmental influences on the
abundance of saltwater crocodiles (Crocodylus porosus) in Australia. Wildlife Research 34, 167-176.
Gardner, S., Finlayson C.M., and Pidgeon R.W.J. (eds) (2002) Description and Literature Review of
the Flora and Vertebrate Fauna of Magela Creek, Alligator Rivers Region, Northern Australia.
Scientist Report 169, Supervising Scientist. Darwin, Northern Territory. [Online]
http://environment.gov.au/ssd/publications/ssr/pubs/ssr169.pdf
Garnett, S.T. and Crowley, G.M. (2000) The Action Plan for Australian Birds 2000. Environment
Australian, Canberra. [Online]
http://www.environment.gov.au/biodiversity/threatened/publications/action/birds2000/index.html
Geering, A., Agnew, L. and Harding, S. (2007) Shorebirds of Australia. CSIRO Publishing,
Collingwood.
Georges, A. (1992) Thermal characteristics and sex determination in field nests of the pig-nosed
turtle Carettochelys insculpta (Chelonia: Carettochelydidae) from northern Australia. Australian
Journal of Zoology 40, 511-521.
Georges, A. and Kennett, R. (1989) Dry season distribution and ecology of Carettochelys insculpta
(Chelonia: Carettochelydidae) in Kakadu National Park, Northern Australia. Australian Wildlife
Research 16, 323-335.
Georges, A., Choquenot, D., Coventry, A.J. and Wellings, P. (1989) A note on Carettochelys
insculpta (Testudinata: Carettochelyidae) from northern Australia. Northern Territory Naturalist 11, 8-
11.
GeoSciences Australia (undated) http://www.ozcoasts.org.au/coastal/smartline.jsp#
Gill, A.M., Ryan, P.G., Moore, P.H.R. and Gibson, M. (2000) Fire regimes of World Heritage Kakadu
National Park, Australia. Austral Ecology 25, 616-625.
Gosbell, K. and Clemens, R (2006). Population monitoring in Australia: some insights after 25 years
and future directions. Stilt 50, 145-157.
Griffin, R.K. (1989) Recreational Fishing for Barramundi in the Arnhem Highway Area – Report
1986/87 surveys. Fishery Report 17. Northern Territory Department of Primary Industry and
Fisheries, Darwin. [Online] http://www.nt.gov.au/d/Content/File/p/Fish_Rep/FR17.pdf
13BREFERENCES
191
Griffin, R.K. (1994) The Barramundi Population of Yellow Waters, Kakadu National Park. Fishery
Report No. 33. Department of Primary Industry and Fisheries, Northern Territory Government.
[Online] http://www.nt.gov.au/d/Content/File/p/Fish_Rep/FR33.pdf
Griffin, R. (1995) Wetland Habitats and Barramundi. In: Wetland Research in the Wet-Dry Tropics of
Australia. Supervising Scientist Report 101. pp. 64-68. [Online]
http://environment.gov.au/ssd/publications/ssr/101.html
Grigg, G.C. and Taylor, J.A. (1980) An Aerial Survey of Crocodylus porosus Nesting Habitat in the
Alligator Rivers Region, Northern Territory. Unpublished consultancy report to the Australian National
Parks and Wildlife Service, Canberra.
Hart, T. H. and McGregor, R. J. (1980) Limnological Survey of Eight Billabongs in the Magela Creek
Catchment, Northern Territory. Australian Journal for Marine Freshwater Research 31, 611-626.
Hennessy, K., Page, C., McInnes, K., Walsh, K., Pittock, B., Bathols, J. and Suppiah, R. (2004)
Climate Change in the Northern Territory. Consultancy report for the Northern Territory Department of
Infrastructure, Planning and Environment. CSIRO Atmospheric Research. [Online]
http://www.cmar.csiro.au/e-print/open/hennessy_2004a.pdf
Hess, L.L and Melack, J.M. (2003) Remote sensing of vegetation and flooding on Magela Creek
Floodplain (Northern Territory, Australia) with the SIR-C synthetic aperture radar. Hydrobiologia 500,
65–82.
Higgins, M. (1999) Indigenous Natural Resource Management: Attitudes and Activities Relating to
Feral Animals. Honours Thesis, La Trobe University Melbourne Australia.
Higgins, P.J., Peter, J.M., and Steele, W.K. (2001) Handbook of Australian, New Zealand and
Antarctic Birds. Volume 5: Tyrant-flycatchers to Chats. Oxford University Press, Melbourne.
Hill, R., Webb, G. and Smith, A. (1987) Floating vegetation mats on a floodplain billabong in the
Northern Territory of Australia. Hydrobiologia 150, 153-164.
Hiscock, P. (1999) Holocene Coastal Occupation of Western Arnhem Land. Australian Coastal
Archaeology, Australia.
Hiscock, P. and Kershaw, P. (1992) Palaeoenvironments and prehistory of Australia’s Tropical Top
End. In: The Naive Lands. (Ed. J. Dodson) Longman Cheshire, London. pp. 43-75.
Hogan, A. C., van Dam, R. A., Markich, S. J. and Camilleri, C. (2005) Chronic toxicity of uranium to a
tropical green alga (Chlorella sp.) in natural waters and the influence of dissolved organic carbon.
Aquatic Toxicology 75, 343-353
Holland, G.J. (1984) Tropical cyclones in the Australian/southwest Pacific region. Australian
Meteorological Magazine 32, 33-46.
Houston, W., Porter, G., O’Neill, P. and Elder, R. (2004) The Ecology of the Critically Endangered
Yellow Chat Epthianura crocea macgregori on Curtis Island. The Sunbird 34, 10-23.
13BREFERENCES
192
Humphrey, C.L. (1999) Potential effects of the Jabiluka Mine upon the biodiversity of Kakadu National
Park. In: Response to the ICSU review of the Supervising Scientist’s report to the World Heritage
Committee. Supervising Scientist, Darwin. pp 1−61.
Humphrey, C., Pidgeon, B. and Buckle, D. (2005) Monitoring of Fish Communities in Deep Channel
Billabongs Associated with the Ranger Uranium Mine, Northern Territory. In: Proceedings of
Monitoring Fish Stocks and Aquatic Ecosystems, a workshop conducted by the Australian Society for
Fish Biology, 11-15 July 2005, Darwin. [Online]
www.asfb.org.au/pubs/2005/asfb_2005_proceedings.pdf
IUCN (2009) IUCN Red List of Threatened Species, Version 2009.2. International Union for
Conservation of Nature and Natural Resources. Downloaded 24th November 2009.
www.iucnredlist.org
Jones, D.R. and Webb, A.C. (Eds.) (2009) eriss research summary 2007-2008. Supervising Scientist
Report 200, Department of Environment, Water, Heritage and the Arts, Canberra. [Online]
http://environment.gov.au/ssd/publications/ss07-08/pubs/optimised.pdf
Jones, R. (1985) Archaeological Conclusions. In: Archaeological Research in Kakadu National Park.
(Ed. R. Jones) Commonwealth of Australia.
Jones, R. and Negerevich, T. (1985) A Review of Previous Archaeological Work. In: Archaeological
Research in Kakadu National Park. (Ed. R. Jones) Commonwealth of Australia.
Kalf, F.R.P. and Dudgeon, C.R. (1999) Analysis of Long-term Groundwater Dispersal of
Contaminants from Proposed Jabiluka Mine Tailings Repositories. Supervising Scientist Report 143.
[Online] http://environment.gov.au/ssd/publications/ssr/pubs/ssr145.pdf
Keast, A. (1958) The relationship between seasonal movements and the development of geographic
variation in the Australian Chats, (Epthianura Gould and Ashbyia North (Passeres: Muscicapidae,
Malurinae)). Australian Journal of Zoology 6, 53 – 68.
Kendrick, G.A., Eckersley, J. and Walker, D.I. (1999) Landscape-scale changes in seagrass
distribution over time: a case study from Success Bank, Western Australia. Aquatic Botany 65, 293-
309.
Kennett, R. (1999) Reproduction of two species of freshwater turtle, Chelodina rugosa and Elseya
dentata, from the wet-dry tropics of northern Australia. Journal of Zoology 247, 457-473.
Kennett, R., Christian, K.A. and Pritchard, D. (1993) Underwater nesting by the tropical fresh-water
turtle, Chelodina-Rugosa (Testudinata, Chelidae). Australian Journal of Zoology 41, 47-52.
Kingsford, R.T. and Norman, F.I. (2002). Australian waterbirds – products of the continent’s ecology.
Emu 102, 47-69.
Larson, H.K. (2000) Report to Parks Australia on Estuarine Fish Monitoring of Kakadu National Park,
Northern Australia, Australia. Museum and Art Gallery of the Northern Territory, Darwin.
Larson, H., Gribble, N., Salini, J., Pillans, R., and Peverell, S. (2004) Sharks and Rays. In: Description
of Key Species Groups in the Northern Planning Area. National Oceans Office, Hobart. pp. 59-73.
13BREFERENCES
193
Larson, H., Stirrat, S. and Woinarski, J. (2006) Threatened species of the Northern Territory:
Freshwater Sawfish Pristis microdon. Northern Territory Department of Natural Resources,
Environment and the Arts. [Online]
http://www.nt.gov.au/nreta/wildlife/animals/threatened/pdf/fish/Freshwater_sawfish_VU.pdf
Leach G.J., Delaney R. and Fukuda, Y. (2009) Management Program for the Saltwater Crocodile in
the Northern Territory of Australia, 2009 - 2014. Northern Territory Department of Natural Resources,
Environment, The Arts and Sport, Darwin. [Online]
http://www.nt.gov.au/nreta/wildlife/programs/pdf/crocmanagementplan_2009.pdf
Legler, J.M. (1980) Taxonomy, Distribution and Ecology of Freshwater Turtles in the Alligator Rivers
Region, Northern Territory. Unpublished Report to the Office of the Supervising Scientist, Canberra.
Legler, J.M. (1982) The Ecology of Freshwater Turtles in the Alligator Rivers Region. Unpublished
Report to the Office of the Supervising Scientist, Canberra.
Letnic, M., Webb, J.K., Shine, R. (2008) Invasive cane toads (Bufo marinus) cause mass mortality of
freshwater crocodiles (Crocodylus johnstoni) in tropical Australia. Biological Conservation 141, 1773-
1782.
Limpus, C.J. (2007) A Biological Review of Australian Marine Turtle Species. 5. Flatback Turtle,
Natator depressus (Garman). Queensland Environmental Protection Agency.
Lucas, D.E., and Russell-Smith, J. (Eds) (1993) Traditional Resources of the South Alligator
Floodplain: Utilisation and Management. Final consultancy report to the Australian Nature
Conservation Agency, Jabiru.
MacFarlane, W.J. (1996) Habitat Utilisation by Macroinvertebrates and Fish and Their Trophic
Interactions in Magela Creek. Internal report 211, Supervising Scientist, Canberra.
Meehan, B., Brockwell, S., Allen, J. and Jones, R. (1985) The Wetlands Sites. Archaeological
Research in Kakadu National Park. (Ed. R. Jones) Commonwealth of Australia.
Millennium Ecosystem Assessment (2003). Ecosystems and Human Well-being: A Framework for
Assessment. Island Press, Washington, D.C.
Minton, C. (2004) What Have We Learned From Banding and Flagging Waders in Australia? In:
Status and Conservation of Shorebirds in the East Asian-Australasian Flyway; Proceedings of the
Australasian Shorebirds Conference 13-15 December 2003, Canberra, Australia. (Ed. P. Straw)
Wetlands International Global Series 18, International Wader Studies 17. Sydney, Australia.
Mitchell, A.L., Lucas, R.M., Donnelly, B.E., Pfitzner, K., Milne, A.K. and Finlayson, M. (2007) A new
map of mangroves for Kakadu National Park, Northern Australia, based on stereo aerial photography.
Aquatic Conservation: Marine and Freshwater Ecosystems 17, 446–467.
Morgan, D.L., Allen, M.G., Bedford, P. and Horstman, M. (2004) Fish fauna of the Fitzroy River in the
Kimberley region of Western Australia – including the Bunuba, Gooniyandi, Ngarinyin, Nyikina and
Walmajarri Aboriginal names. Records of the Western Australian Museum 22, 147–161.
13BREFERENCES
194
Morse, J., King, J. and Bartlett, J. (2005) A Shared Vision for Tourism in Kakadu National Park.
Commonwealth of Australia. [Online]
http://www.environment.gov.au/parks/publications/kakadu/pubs/tourism-brochure-full.pdf
Morton, S.R. and Brennan, K.G. (1991) Birds. In: Monsoonal Australia. Landscape, Ecology and Man
in the Northern Lowlands. (Eds. C.D. Haynes, M.G. Ridpath and M.A.J. Williams). A.A. Blakema:
Rotterdam. pp 133-149.
Morton, S.R., Brennan K.G. and Armstrong, M.D. (1990a) Distribution and abundance of Magpie
Geese, Anseranas semipalmata, in the Alligator Rivers Region, Northern Territory. Australian Journal
of Ecology 15, 307-320.
Morton, S. R., Brennan K. G. and Armstrong, M. D. (1990b) Distribution and abundance of ducks in
the Alligator Rivers Region, Northern Territory. Australian Wildlife Research 17, 573-590.
Morton, S. R., Brennan, K., and Armstong, M. (1991) Distribution and Abundance of Waterbirds on
the Alligator Rivers Region, Northern Territory. Open File Record No. 86. Office of Supervising
Scientists for the Alligator Region. Canberra.
Morton, S.R., Brennan, K.G. and Armstrong, M.D. (1993a) Distribution and abundance of Brolgas
and Black-necked Storks in the Alligator Rivers Region, Northern Territory. Emu 93, 88-92.
Morton, S.R., Brennan, K.G., and Armstrong, M.D. (1993b) Distribution and abundance of herons,
egrets, ibises and spoonbills in the Alligator Rivers Region, Northern Territory. Wildlife Research 20,
23–43.
Morton, S.R., Brennan, K.G. and Armstrong, M.D. (1993c) Distribution and abundance of grebes,
Pelicans, Darters, Cormorants, Rails and Terns in the Alligator Rivers Region, Northern Territory.
Wildlife Research 20, 203–217.
National Land and Water Resources Audit (NLWRA) (2001) Report of the National Land and Water
Resources Audit. Turner, Australian Capital Territory.
National Land and Water Resources Audit (NLWRA) (2002) Report of the National Land and Water
Resources Audit. Turner, Australian Capital Territory.
Northern Territory Government (NTG) (undated) Management Plan for Crocodylus porosus in the
Northern Territory: 2005-2010. Parks and Wildlife Service of the Northern Territory. Northern Territory
Government, Darwin. [Online]
http://www.nt.gov.au/nreta/wildlife/programs/public/pdf/management_program_for_crocodiles.pdf
NTG, LCNT and NHT (Northern Territory Government, Northern Territory Landcare and Natural
Heritage Trust) (2005) Integrated Natural Resource Management Plan for the Northern Territory.
Sustaining Our Resources – People, Country and Enterprises. [Online]
http://www.nt.gov.au/nreta/naturalresources/plans/inrm/inrmplan/pdf/completeinrmp310505.pdf
Outridge, P.M. (1987) Possible causes of high species diversity in tropical Australian freshwater
macrobenthic communities. Hydrobiologia 150, 95-107.
13BREFERENCES
195
Page, T., Short, J., Humphrey, C., Hillyer, M. and Hughes, J. (2008) Molecular systematics of the
Kakaducarididae (Crustacea: Decapoda: Caridea. Molecular Phylogenetics and Evolution 46, 1003-
1014.
Petty, A., Douglas, M. and Ferdinands, K. (2008) Riparian Zones and Paperbarks: Landscape
change In: Kakadu National Park Landscape Symposia Series 2007–2009. Symposium 1:
Landscape Change Overview, 17–18 April 2007, South Alligator Inn, Kakadu National Park. Internal
Report 532, Supervising Scientist, Darwin. pp 35-42. [Online]
http://environment.gov.au/ssd/publications/ir/pubs/ir532.pdf
Petty, A., Lindner, D., Freeman, J., and Bowman, D. (2005) Channel Changes within the South
Alligator Tidal Interface Region from 1950 – 2004: Final report of the Kakadu National Park Channel
Change Project. Tropical Savannas CRC.
Peverell, S., Gribble, N., and Larson, H. (2004). Sawfish. In: Description of key species groups in the
Northern Planning Area. pp: 75-83. National Oceans Office, Hobart.
Peverell, S. C., McPherson, G. R., Garrett, R. N., and Gribble, N. A. (2006) New records of the River
Shark Glyphis (Carcharhinidae) reported from Cape York Peninsula, northern Australia. Zootaxa.
1233, 53-68.
Pidgeon, R. and Boyden, J. (1993) Fish Migration Data Collected During 1991/92 Wet Season.
Supervising Scientist for the Alligator Rivers Region, Canberra.
Pillans, R.D., Stevens, J.D., P.M. Kyne and J. Salini (2005). Acoustic Tracking of Glyphis sp. A in the
Adelaide River, Northern Territory, Australia. Canberra, Department of the Environment and Heritage.
[Online] http://www.environment.gov.au/coasts/publications/pubs/glyphis-nt.pdf
Pillans, R.D., Stevens, J.D., Peverell, S. and Edgar, S. (2008) Spatial Distribution and Habitat
Utilisation of the Speartooth Shark Glyphis sp. A in Relation to Fishing in Northern Australia. A report
by CSIRO to the Department of the Environment, Water, Heritage and the Arts. [Online]
http://www.environment.gov.au/coasts/publications/pubs/speartooth-shark.pdf
Pogonoski, J.J. and D.A. Pollard (2003). Bizant River Shark: Glyphis sp. A. In: The Conservation
Status of Australasian Chondrichthyans - Report of the IUCN Shark Specialist Group Australia and
Oceania Regional Red List Workshop, Queensland, Australia,7-9 March 2003 . (Eds. R.D.
Cavanagh, P.M. Kyne, S.L. Fowler, J.A.Musick and M.B. Bennett) pp. 119-120.
Power, S., Tseitkin, F., Mehta, V., Lavery, B., Torok, S. and Holbrook, N. (1999) Decadal climate
variability in Australia during the twentieth century. International Journal of Climatology 19, 169-184.
Preen, A.R., Lee-Long, W.J. and Coles, R.G. (1995) Flood and cyclone related loss, and partial
recovery, of more than 1000 km2 of seagrass in Hervey Bay, Queensland, Australia. Aquatic Botany
52, 3–17.
Press, A. J. (1986) The Gagudju Species Survey. Unpublished Report to the Australian National
Parks and Wildlife Service, Canberra.
13BREFERENCES
196
Press, T., Brock, J. and Anderson, A. (1995a) Fauna. In: Kakadu: Natural and Cultural Heritage and
Management. (Eds. T. Press, D. Lea, A. Webb and A. Graham) Australian Nature Conservation
Agency and North Australia Research Unit, Australian National University, Darwin.
Press, T., Lea, D., Webb, A. and Graham, A. (1995b) Kakadu – Natural and Cultural Heritage and
Management. Australian Nature Conservation Agency, North Australia Research Unit, Australian
National University, Darwin.
Price, O.F., Edwards, A., Connors, G., Woinarski, J.C.Z., Ryan, G., Turner, A. and Russell-Smith, J.
(2005) Fire heterogeneity, Kakadu National Park, 1980–2000. Wildlife Research 32, 425–433.
Pritchard, P.C.H. (1979) Taxonomy, Evolution and Zoogeography. In: Turtles. Perspectives and
Research. (Eds. M. Harless and H. Morlock). John Wiley and Sons, New York. pp 1-42.
Pusey, B., Kennard, M.J. and Arthington, A.H. (2004) Freshwater Fishes of North-Eastern Australia.
CSIRO Publishing.
Ramsar Convention Secretariat (2002) Cultural Heritage of Wetlands. Wetlands and Spiritual Life –
Information Pack. The Ramsar Bureau, Switzerland.
http://www.ramsar.org/pdf/info/cultural_heritage_e09.pdf
Ramsar Convention Secretariat (2007). Designating Ramsar sites: The Strategic Framework and
guidelines for the future development of the List of Wetlands of International Importance. Ramsar
handbooks for the wise use of wetlands, 3rd edition, vol. 14. Ramsar Convention Secretariat, Gland,
Switzerland.
Riley, J. and Lowry, J. (2002) An Initial Assessment of Changes to the Melaleuca Distribution on a
Selected Area of the Magela floodplain. Internal Report 394, Supervising Scientist for the Alligator
Rivers Region, Darwin. [Online] http://www.environment.gov.au/ssd/publications/ir/pubs/ir394.pdf
Roberts, R., Jones, R. and Smith, M.A. (1993) Optical dating at Deaf Adder George, Northern
Territory, indicates human occupation between 53 000 and 60 000 years ago. Australian Archaeology
31, 58–59.
Roelofs, A., Coles, R.G. and Smit, N. (2005) A Survey of Intertidal Seagrass from Van Diemen Gulf to
Castlereagh Bay, Northern Territory, and from Gove to Horn Island. Report to the National Oceans
Office. Tasmania, Australia. [Online]
http://www.environment.gov.au/coasts/mbp/publications/north/pubs/seagrass-survey-report-2005.pdf
Russell-Smith, J. (1991) Classification, species richness, and environmental relation of monsoon
rainforest vegetation in the Northern Territory, Australia. Journal of Vegetation Science 2, 259-278.
Russell-Smith, J. (1995) Flora. In: Kakadu: Natural and Cultural Heritage and Management. (eds T.
Press, D. Lea, A. Webb and A. Graham) Australian National University North Australia Research
Unit, Darwin. pp 127–166.
Russell-Smith, J. and Bowman, D.M.J.S. (1992) Conservation of monsoon rainforest isolates in the
Northern Territory. Biological Conservation 59, 51-63.
13BREFERENCES
197
Russell-Smith, J., Ryan, P.G. and Durieu, R. (1997) A landsat MSS-derived fire history of Kakadu
National Park, monsoonal northern Australia, 1980-94: seasonal extent, frequency and patchiness.
Journal of Applied Ecology 34, 748-766.
Sadlier, R. A. (1990). The Terrestrial and Semiaquatic Reptiles (Lacertilia, Serpentes) of the Magela
Creek Region, Northern Territory. Technical Memorandum 32, Supervising Scientist for the Alligator
Rivers Region, AGPS, Canberra, Australia. [Online]
http://www.environment.gov.au/ssd/publications/tm/pubs/tm32.pdf
Salinger, M. J., Renwick, J. A., Mullan, A. B. (2001) Interdecadal Pacific Oscillation and South Pacific
Climate. International Journal of Climatology 21, 1705-1721
Saynor, M. J., Walden, D., Hall, R., Ryan, B. (2000) Climate Record for the Alligator Rivers Region.
Paper 3. In: Assessment and Monitoring of Coastal Change in the Alligator Rivers Region, Northern
Australia. (Eds. I. Eliot, M., Saynor, M. Eliot and C. Finlayson) Supervising Scientist Report 157,
Supervising Scientist, Darwin. pp. 51-56. [Online]
http://www.environment.gov.au/ssd/publications/ssr/pubs/ssr157.pdf
Schäuble C, Kennett R, Winderlich S (2006) Flatback Turtle (Natator depressus) nesting at Field
Island, Kakadu National Park, Northern Territory, Australia, 1990–2001. Chelonian Conservation and
Biology 5, 188–194.
Schodde, R., Mason, I., and Wolfe, T.O. (1972) Further records of the Pitted-shelled turtle
(Carettochelys insculpta) from Australia. Transactions Royal Society South Australia 96, 115-117.
Shine, R. (1986a) Diets and abundances of aquatic and semi-aquatic reptiles in Alligator Rivers
Region. Technical Memorandum 16, Supervising Scientist for the Alligator Rivers Region, AGPS,
Canberra, Australia. [Online] http://www.environment.gov.au/ssd/publications/tm/pubs/tm16.pdf
Shine, R. (1986b) Predation upon filesnakes (Acrochordus arafurae) by aboriginal hunters: selectivity
with respect to size, sex and reproductive condition. Copeia 1986, 238–239.
Skeat, A.J., East, T.J. and Corbett, L.K. (1996) Impact of Feral Water Buffalo. In: Landscape and
Vegetation Ecology of the Kakadu Region, Northern Australia. (Eds. C.M. Finlayson and I von
Oertzen) Kluwer Academic Publishers, Netherlands. pp 155–177.
Spencer, B. (2009) Native tribes of the Northern Territory of Australia. eBooks@Adelaide The
University of Adelaide, Adelaide. [Online] http://ebooks.adelaide.edu.au/s/spencer/baldwin/s74na/
Staben, G. (2008) Mapping the Spatial and Temporal Distribution of Melaleuca spp. on the Magela
Floodplain Between 1950 and 2004 Using Object-based Analysis and GIS. Research thesis, BSc
(Hons), Charles Darwin University, Darwin Northern Territory, Internal Report 545, June, Supervising
Scientist, Darwin. [Online] http://www.environment.gov.au/ssd/publications/ir/pubs/ir545.pdf
Stern, H., de Hoedt, G. and Ernst, J. (2003) Objective Classification of Australian Climates.
Commonwealth Bureau of Meteorology, Melbourne.
http://www.bom.gov.au/climate/environ/other/koppen_explain.shtml
13BREFERENCES
198
Stevens, J.D., R.D. Pillans and J. Salini (2005) Conservation Assessment of Glyphis sp. A
(Speartooth Shark), Glyphis sp. C (Northern River Shark), Pristis microdon (Freshwater Sawfish) and
Pristis zijsron (Green Sawfish). Hobart, Tasmania: CSIRO Marine Research. [Online]
http://www.environment.gov.au/coasts/publications/pubs/assessment-glyphis.pdf
Storrs, M.J., Ashley, M. and Brown, M, (1999) Aboriginal Community Involvement in the Management
of Mimosa (Mimosa pigra) on the Wetlands of the Northern Territory’s ‘Top End’. In: Proceedings of
the 12th Australian Weed Society Conference, (Eds. A.C. Bishop, M. Boersma and C.D. Barnes) 12–
16 September 1999, Weed Society of Tasmanian, Hobart, Tasmania. pp 562–565.
Storrs, M.J. and Julien, M.H. (1996) Salvinia: A Handbook for the Integrated Control of Salvinia
molesta in Kakadu National Park. Australian Nature Conservation Agency, Darwin.
Supervising Scientist (2000) Investigation of tailings water leak at the Ranger uranium mine.
Supervising Scientist Report 153. Supervising Scientist, Darwin. [Online]
http://environment.gov.au/ssd/publications/ssr/pubs/ssr153-full.pdf
Supervising Scientist (2002) Supervising Scientist Monitoring Program. Instigating an environmental
monitoring program to protect aquatic ecosystems and humans from possible mining impacts in the
Alligator Rivers Region. Environmental Australia. [Online]
http://environment.gov.au/ssd/monitoring/pubs/env-mon-prog-background.pdf
Sydney Morning Herald (SMH) (2004) Guide Grossly Negligent in Fatal Crocodile Attack, Inquest
Told. 3 September 2004. [Online] http://www.smh.com.au/articles/2004/09/02/1093939071473.html
Taylor, J.A. and Dunlop, C.R. (1985) Plant communities of the wet-dry tropics of Australia: The
Alligator Rivers Region, Northern Territory. Proceedings of the Ecological Society of Australia 13, 83-
127.
Taylor, J.A. and Friend, G.R. (1984) Ground surface features attributable to feral buffalo, Bubalus
bubalis I. Their distribution relative to vegetation structure and plant lifeform. Australian Wildlife
Research 11, 303–9.
Thorburn, D.C., Peverell, S., Stevens, S., Last, J.D., and Rowland, A.J. (2003) Status of Freshwater
and Estuarine Elasmobranchs in Northern Australia. Report to Natural Heritage Trust, Canberra.
[Online] http://www.environment.gov.au/coasts/publications/pubs/elasmo-north.pdf
Threatened Species Scientific Committee (TSSC) (2001a) Commonwealth Listing Advice on Glyphis
sp. C (Northern River Shark). [Online] Available from:
http://www.environment.gov.au/biodiversity/threatened/species/nth-river-shark.html
Threatened Species Scientific Committee (TSSC) (2001b) Commonwealth Listing Advice on Glyphis
sp. A (Speartooth Shark). [Online] Available from:
http://www.environment.gov.au/biodiversity/threatened/species/speartooth-shark.html
Threatened Species Scientific Committee (TSSC) (2005) Commonwealth Listing Advice on
Carettochelys insculpta. [Online] Available from
http://www.environment.gov.au/biodiversity/threatened/species/pig-nosed-turtle.html
13BREFERENCES
199
Threatened Species Scientific Committee (TSSC) (2006) Commonwealth Listing Advice on
Epthianura crocea tunneyi. [Online] Available from:
http://www.environment.gov.au/biodiversity/threatened/species/pubs/epthianura-crocea-advice.pdf
Ticknell, S.J. (2008) Groundwater of the Northern Territory, 1:2 000 000 scale. Department of
Natural Resources, Environment and the Arts, Northern Territory.
Townsend, S. A. and Douglas, M. M. (2000) The effect of three fire regimes on stream water quality,
water yield and export coefficients in a tropical savanna (northern Australia). Journal of Hydrology
229, 118-137.
Townsend, S. A. and Douglas, M. M. (2004) The effect of a wildfire on stream water quality and
catchment water yield in a tropical savanna excluded from fire for 10 years (Kakadu National Park,
North Australia). Water Research 38, 3051-3058.
Traill, L.W., Bradshaw, C.J.A., Delean, S. and Brook, B.W. (2010) Wetland conservation and
sustainable use under global change: a tropical Australian case study using magpie geese.
Ecography, In Press.
Traill, L.W., Bradshaw, C.J.A. and Brook, B.W. (2010b) Tropical nomads: seasonal migration of
magpie geese and implications for conservation. Emu Austral Ornithology, In Press.
Tremblay, P. (2007) Economic Contribution of Kakadu National Park to Tourism in the Northern
Territory. Sustainable Tourism CRC.
Tremblay, P. and Boustead, A. (2009) Kakadu National Park Case Study. Report to Sustainable
Tourism CRC.
Tulloch, D.G. and Cellier, K.M. (1986). Grazing behaviour of feral buffaloes on a native pasture in the
northern portion of the Northern Territory. Australian Wildlife Research 13, 433–439.
Tyler, M.J. and Cappo, M. (1983) Diet and Feeding Habits of Frogs of the Magela Creek System.
Open file record 10, Supervising Scientist for the Alligator Rivers Region, Canberra.
Tyler, M.J. and Crook, G.A. (1987). Frogs of the Magela Creek System. Technical memorandum 19,
Supervising Scientist for the Alligator Rivers Region, AGPS, Canberra, Australia, 46 pp. [Online]
http://www.environment.gov.au/ssd/publications/tm/pubs/tm19.pdf
Tyler, M.J., Crook, G.A., and Davies, M. (1983). Reproductive biology of the frogs of the Magela
Creek system, Northern Territory. Records of the South Australian Museum 18, 415–460.
van Dam, R.A., Humphrey, C.L. and Martin, P. (2002a) Mining in the Alligator Rivers Region,
northern Australia: Assessing potential and actual effects on ecosystem and human health.
Toxicology 181-182, 505-515
van Dam, R.A., Walden, D.J. and Begg, G.W. (2002b) A Preliminary Risk Assessment of Cane
Toads in Kakadu National Park. Scientist Report 164, Supervising Scientist, Darwin. [Online]
http://www.environment.gov.au/ssd/publications/ssr/pubs/ssr164.pdf
13BREFERENCES
200
Vanderlely, R. (1995) An Ecological Survey of the Sea Turtles of West Alligator Head and Field
Island, Kakadu National Park. Master of Science thesis, Northern Territory University, Darwin.
Vertessy, R.A (1990) Morphodynamics of Macrotidal Rivers in Far Northern Australia. Thesis
submitted for the degree of Doctor of Philosophy. Australian National University, Canberra.
Vigilante, T. and Bowman, D.M.J.S. (2004) The effects of fire history on the structure and floristic
composition of woody vegetation around Kalumburu, North Kimberley: a landscape-scale natural
experiment. Australian Journal of Botany 52, 381–415.
Walden, D. and Gardener, M. (2008) Invasive Species. Weed Management in Kakadu National Park.
change In: Kakadu National Park Landscape Symposia Series 2007–2009. Symposium 1:
Landscape Change Overview, 17–18 April 2007, South Alligator Inn, Kakadu National Park. Internal
Report 532, Supervising Scientist, Darwin. pp 66-83. [Online] [Online]
http://environment.gov.au/ssd/publications/ir/pubs/ir532.pdf
Walden, D., van Dam, R., Finlayson, M., Storrs, M., Lowry, J. and Kriticos, D. (2004) A Risk
Assessment of the Tropical Wetland Weed Mimosa pigra in Northern Australia. Supervising Scientist
Report 177, Supervising Scientist, Darwin Northern Territory. [Online]
http://www.environment.gov.au/ssd/publications/ssr/pubs/ssr177-print.pdf
Ward, S. and Larson, H. (2006a) Threatened Species of the Northern Territory: Northern River Shark
Glyphis sp. C. Northern Territory Department of Natural Resources, Environment and the Arts.
[Online] http://www.nt.gov.au/nreta/wildlife/animals/threatened/pdf/fish/Northern_River_Shark_EN.pdf
Ward, S. and Larson, H. (2006b) Threatened Species of the Northern Territory: Speartooth Shark /
Bizant River Shark Glyphis sp. A. Northern Territory Department of Natural Resources, Environment
and the Arts. [Online]
http://www.nt.gov.au/nreta/wildlife/animals/threatened/pdf/fish/Northern_River_Shark_EN.pdf
Wasson, R. J., Bayliss, P. and Cleland, S. (in prep.) River Flow and Climate in the ‘Top End’ of
Australia for the Last 1000 Years, and the Asian-Australia Monsoon.
Watson, M. (2008) Vertebrate Monitoring and Re-sampling in Kakadu National Park. PhD Thesis,
Charles Darwin University.
Webb, G.J.W. (1991) The Influence of Season on Australian Crocodiles. In: Monsoonal Australia:
Landscape, Ecology and Man in the Northern Lowlands. (Eds M.G. Ridpath, C.D. Hayers and M.J. D.
Williams) AA Balkema, Rotterdam. pp 125–131.
Webb, G.J.W. and Manolis, S.C. (1989) Crocodiles of Australia. Reed Books, Sydney.
Webb, G.J.W., Choquenot, D. and Whitehead, P.J. (1986) Nests, eggs, and embryonic development
of Carettochelys insculpta (Chelonia: Carettochelidae) from northern Australia. Journal of Zoology,
521-550.
Webb, G., Manolis, S. and Buckworth, R. (1983) Crocodylis johnstoni in the McKinlay River area,
Northern Territory. 1. Variation in the diet, and a new method of assessing the relative importance of
prey. Australian Journal of Zoology 39, 879-899.
13BREFERENCES
201
Weiss, R. F. (1970) The solubility of nitrogen, oxygen and argon in water and seawater. Deep Sea
Research 17, 721-735
Wetlands International (2006) Waterbird Population Estimates. 4th Edition. (Eds. S. Delany, and D.
Scott) Wetland International, Wageningen, The Netherlands.
Whitehead, P.J. (1998) Dynamics of Habitat use by the Magpie Goose Anseranas semipalmata:
Implications for Conservation Management. PhD. thesis, Northern Territory University, Darwin.
Whitehead, P.J., Webb, G.J.W. and Seymour R.S. (1990) Effect of incubation temperature on
development of Crocodylus johnstoni embryos. Physiological Zoology 63, 949-964.
Wightman, G.M. (1989) Mangroves of the Northern Territory, Northern Territory Botanical Bulletin.
Conservation Commission of the Northern Territory, Darwin.
Wightman, G. and Brown, J. (1994) Jawoyn Plant Identikit. Conservation Commission of the Northern
Territory and the Jawoyn Association Katherine Australia.
Willett, I. (2008) Case Study: Acid Sulfate Soils of the Magela Creek Plain, East Alligator River, N.T.
In: Inland Acid Sulfate Soil Systems Across Australia (Eds. R. Fitzpatrick and P. Shand). pp 294-300.
[Online] http://www.clw.csiro.au/acidsulfatesoils/documents/ass-book/Ch20-Inland-ASS.pdf
Williams, A.R. (1984) Changes in Melaleuca forest density on the Magela floodplain, Northern
Territory, between 1950 and 1975. Australian Journal of Ecology 9, 199–202.
Williams, C.K. (1979) Ecology of Australian chats (Epthianura Gould): reproduction in aridity.
Australian Journal of Zoology 27, 213-229.
Wilson, B.A., Brocklehurst, P.S., Clark, M.J. and Dickinson, K.J.M. (1990) Vegetation Survey of the
Northern Territory. Technical Report No. 49 Conservation Commission of the Northern Territory,
Darwin.
Wilson, G., Humphrey, C., Colgan, D., Gray, K. and Johnson, R. (2009) Monsoon-influenced
speciation patterns in a species flock of Eophreatoicus Nicholls (Isopoda; Crustacea). Molecular
phylogenetics and Evolution 51, 349-364.
Winderlich, S. (1998) An overview of the sea turtle research in Kakadu National Park and the
surrounding area. In: Marine turtle conservation and management in northern Australia. Proceedings
of a workshop held at the Northern Territory University 3–4 June 1997; Darwin. Centre for Indigenous
Natural and Cultural Resource Management & Centre for Tropical Wetlands Management, Northern
Territory University, Darwin, Australia. (Eds. R. Kennett, A. Webb, G. Duff, M. Guinea, and G. Hill).
pp. 110–114.
Winn, K.O., Saynor, M.J., Eliot, M.J. and Eliot, I.G. (2006) Saltwater intrusion and morphological
change at the mouth of the East Alligator River, Northern Territory. Journal of Coastal Research 22,
137–149.
Woinarski, J and Armstrong, M (2006). Threatened Species of the Northern Territory: Yellow Chat
(Alligator Rivers subspecies) Epthianura crocea tunneyi. Threatened Species Information Sheet,
13BREFERENCES
202
Parks and Wildlife Commission, Darwin. [Online]
http://www.nt.gov.au/nreta/wildlife/animals/threatened/pdf/birds/yellow_chat_en.pdf
Woinarski, J.C.Z., and Gambold, N. (1992) Gradient analysis of a tropical herpetofauna: distribution
patterns of terrestrial reptiles and amphibians in Stage III of Kakadu National Park, Australia. Wildlife
Research 19, 105–127.
Woinarski, J. and Ward, S. (no date) Under the radar? The Occurrence, Impact and Management of
Feral Cats and Black Rats in Kakadu. http://www.savanna.com.au/all/downloads/RATCAT_2.pdf
Woinarski, J., Pavey, C., Kerrigan, R., Cowie, I., and Ward, S. (2007) Lost from our Landscape:
Threatened species of the Northern territory. Department of Natural Resources, Environment and the
Arts, Palmerston.
Woodland, D.J. and Ward, P.J. (1992) Fish Communities in Sandy Pools of Magela Creek, Alligator
Rivers Region. Supervising Scientist Research Report 9. [Online]
http://www.environment.gov.au/ssd/publications/rr/pubs/rr9.pdf
Woodroffe, C. D. and Mulrennan, M. E. (1993) Geomorphology of the Lower Mary River Plains,
Northern Territory. Australian National University Darwin and the Conversation Commission of the
Northern Territory.
14BGLOSSARY
203
9 GLOSSARY
Acceptable change, means the variation that is considered acceptable in a particular measure or
feature of the ecological character of the wetland. Acceptable variation is that variation that will
sustain the service, component or process to which it refers.
Aeolian sedimentation, means deposition of material transported by wind.
Aquatic/marine fauna, in the context of this report relates to fauna species that spend all or the
majority of their life cycle in or underwater. As such this grouping primarily relates to fish, marine
reptiles, aquatic mammals such as dugong and cetaceans, and aquatic/marine invertebrates.
Bininj (pronounced ‘binn-ing’), is a Kunwinjku and Gundjeihmi word that refers to traditional owners
of Aboriginal land and traditional owners of other land in Kakadu National Park, and other Aboriginals
entitled to enter upon or use or occupy the Park in accordance with Aboriginal tradition governing the
rights of that Aboriginal or group of Aboriginals with respect to the Park (Director of National Parks
2007).
Catadromous, refers to organisms that live in freshwater but migrate to marine waters to breed.
Congener, means species within the same genus.
Ecological character, defined under Resolution IX.1 Annex A: 2005 of the Ramsar Convention as,
the combination of the ecosystem components, processes and benefits/services that characterise the
wetland at a given point in time.
Expert opinion, in the context of interpreting LACs relates to competent, experienced, independent
individuals that have formal qualifications or otherwise expert knowledge in the disciplines of wetland
ecology, hydrology or associated fields.
IMCRA bioregion, refers to the Interim Marine and Coastal Regionalisation for Australia (Mesoscale)
to the 200 metre isobath and derived from biological and physical data, (for example, coastal
geomorphology, tidal attributes, oceanography, bathymetry and intertidal invertebrates).
Mangal, means mangrove habitat consisting of mangrove trees and shrubs and their associated
faunal communities.
National Framework document, refers to the National Framework and Guidance for Describing the
Ecological Character of Australia’s Ramsar Wetlands (DEWHA 2008) and its successive documents
as endorsed by the Natural Resource Management (NRM) Ministerial Council.
Potadromous, refers to organisms that complete their entire lifecycle in freshwaters.
Ramsar Criteria, refers to the nine Criteria for the listing of a site as internationally significant under
the provisions of the Ramsar Convention. Also referred throughout the report as the Nomination
Criteria for the site.
14BGLOSSARY
204
Sedimentation, means the process of deposition of sediment of any size. This is often colloquially
referred to as siltation, but this term implies that only silt-sized material is deposited.
Shorebirds, as used in this report, refers to both resident and migratory species which are
ecologically dependent upon wetlands from the following families: Scolopacidae; Burhinidae;
Haematopodidae; Recurvirostridae; Charadriidae; and Glareolidae. Shorebirds form a sub-set of the
waterbird grouping.
Values, means the perceived benefits to society, either direct or indirect that result from wetland
functions. These values include human welfare, environmental quality and wildlife support.
Waterbirds, refers to those species which are ecologically dependent upon wetlands from the
following families: Anseranatidae, Anatidae, Podicipedidae, Anhingidae, Phalacrocoracidae,
Pelecanidae, Ardeidae, Threskiornithidae, Ciconiidae, Gruidae, Rallidae, Scolopacidae,
Rostratulidae, Jacanidae, Burhinidae, Haematopodidae, Recurvirostridae, Charadriidae, Glareolidae,
Laridae and Sternidae (after Kingsford and Norman 2002; Wetlands International 2006). Only those
species of gulls (Laridae) and terns (Sternidae) which make extensive use of shallow, inshore waters
or inland wetlands are included. Whilst at least some other species of other families traditionally
regarded as “seabirds” (that is, Spheniscidae, Phaethontidae, Sulidae, Fregatidae, Stercorariidae and
Alcidae) also make use of shallow, inshore waters (and thus could be therefore be considered as
waterbirds), these have not been included in the waterbird group (following precedent within
Wetlands 2006). Shorebirds form a sub-set of the waterbird grouping.
Wetlands, is used in this report in the context of the definition under the Ramsar Convention which
includes, areas of marsh, fen, peatland or water, whether natural or artificial, permanent or temporary,
with water that is static or flowing, fresh, brackish or salt, including areas of marine water the depth of
which at low tide does not exceed six metres.
Wetland-dependent terrestrial fauna, in the context of this report relates to fauna species that
occur within or otherwise are dependent on wetland habitats but do not spend the majority of their life
cycle underwater (for example, non-aquatic species). As such this grouping primarily relates to birds,
amphibians such as frogs, non-aquatic mammals such as water mouse, non-aquatic reptiles and
terrestrial invertebrates.
Wetland flora, in the context of this report relates to flora species that are characterised as wetland
or wetland-dependent species or populations.
Wetland ecosystem components, as defined in the ECD National Framework document, are the
physical, chemical and biological parts or features of a wetland.
Wetland ecosystem processes, as defined in the National Framework document, are the dynamic
forces within the ecosystem between organisms, populations and the non-living environment.
Interactions can be physical, chemical or biological.
Wetland ecosystem benefits or services (includes the term ecosystem services), as defined in the
National Framework document, are the benefits that people receive from wetland ecosystems. In
general, benefits and services are based on or underpinned by wetland components and processes

14BGLOSSARY
205
and can be direct (for example, food for humans or livestock) or indirect (for example, wetland
provides habitat for biota which contribute to biodiversity).
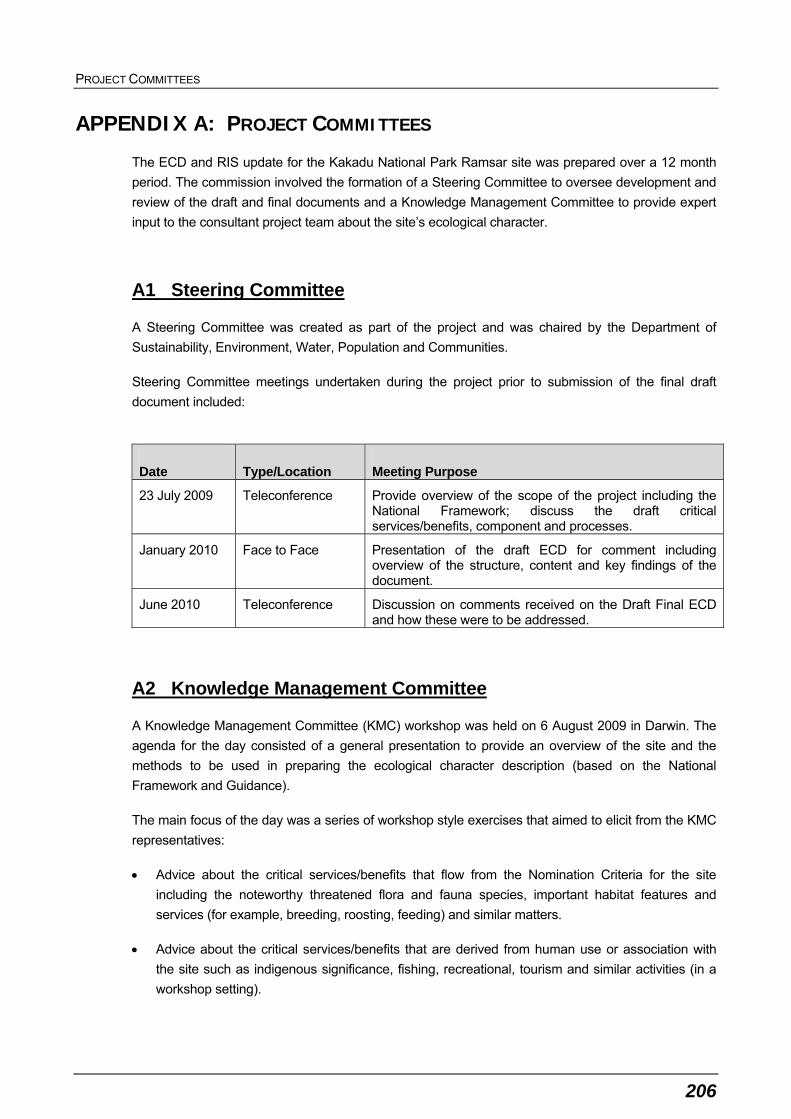
PROJECT COMMITTEES
206
APPENDIX A: PROJECT COMMITTEES
The ECD and RIS update for the Kakadu National Park Ramsar site was prepared over a 12 month
period. The commission involved the formation of a Steering Committee to oversee development and
review of the draft and final documents and a Knowledge Management Committee to provide expert
input to the consultant project team about the site’s ecological character.
A1 Steering Committee
A Steering Committee was created as part of the project and was chaired by the Department of
Sustainability, Environment, Water, Population and Communities.
Steering Committee meetings undertaken during the project prior to submission of the final draft
document included:
Date Type/Location Meeting Purpose
23 July 2009 Teleconference Provide overview of the scope of the project including the National Framework; discuss the draft critical services/benefits, component and processes.
January 2010 Face to Face Presentation of the draft ECD for comment including overview of the structure, content and key findings of the document.
June 2010 Teleconference Discussion on comments received on the Draft Final ECD and how these were to be addressed.
A2 Knowledge Management Committee
A Knowledge Management Committee (KMC) workshop was held on 6 August 2009 in Darwin. The
agenda for the day consisted of a general presentation to provide an overview of the site and the
methods to be used in preparing the ecological character description (based on the National
Framework and Guidance).
The main focus of the day was a series of workshop style exercises that aimed to elicit from the KMC
representatives:
Advice about the critical services/benefits that flow from the Nomination Criteria for the site
including the noteworthy threatened flora and fauna species, important habitat features and
services (for example, breeding, roosting, feeding) and similar matters.
Advice about the critical services/benefits that are derived from human use or association with
the site such as indigenous significance, fishing, recreational, tourism and similar activities (in a
workshop setting).

PROJECT COMMITTEES
207
Advice about the wetland processes (for example, hydrodynamics, water quality, etc) that
underpin the wetland components in each of the conceptual model areas. This was important to
identify the most ‘critical’ processes that underlie wetland values in the study area and form the
basis for future analysis of natural variability and limits of acceptable change.
Advice about any perceived changes to ecological character of the site since listing and
identification of previous or current threats to ecological character of the site (using a whiteboard
exercise).
Notes on the key outcomes and comments made during the workshops are summarised in a
progress report submitted to DSEWPAC during executation of the project.
A3 Stakeholder Consultation
A3.1 Background
Following on from the KMC workshop, a consultation meeting was held at Jabiru with key
stakeholders and traditional owners. The consultation program had the following objectives:
To engage with and consult key stakeholders and traditional owners in appropriate forums.
To empower key stakeholders and traditional owners to provide input into the study and for BMT
WBM to gather information about key aspects of ecological character from the key stakeholders
and traditional owners.
To engender a shared understanding and acceptance of key management agencies of the
critical natural and cultural services/benefits of the wetlands and the underpinning critical wetland
processes and components which characterise the Ramsar values of Kakadu National Park
The specific aims of the consultation meeting were to:
provide information on the study and the process to be followed for development of an ECD
present the outcomes of the KMC workshop
provide a forum for feedback on the outcomes of the KMC workshop including identification of
gaps and/or additional ecosystem services, components and processes, threats and ecological
character changes that have occurred since listing, and
provide information on ‘what’s next’ for this study.
One half day workshop was held in a central location (Kakadu National Park Headquarters) on the
26th August 2009. While the consultation meeting provided the main forum for consultation, it was
recognised that some stakeholders were not able to attend the meeting. A summary sheet was
produced which provided background information about the study, the ECD and the RIS, and
summarised the outcomes of the KMC workshop and the consultation meeting in Jabiru. Contact
details (telephone, post and email) for study team representatives were also provided so that those
unable to participate in the consultation meeting could provide information/feedback to the study
team.
PROJECT COMMITTEES
208
The workshop was composed of a number of slide show presentations and informal group sessions
which discussed various topics. Feedback was sought from participants throughout the workshop.
During the workshop, maps were used to illustrate spatial issues and notes were taken to record
information provided by participants.
A3.2 Outcomes of Consultation
Thirty-six people participated in the workshop, including nineteen Aboriginal people and seventeen
non-Aboriginal people. The workshop was interactive and a substantial amount of information was
shared by participants with the study team. The study team was also able to share information with
participants on Ramsar in general and more specific topics. Topics covered included:
What is Ramsar?
Study team findings to date
Knowledge Management Committee meeting outcomes
Habitat types of Kakadu National Park
Nomination Criteria for Kakadu National Park
Critical services/benefits
Cultural characteristics
Changes to critical services/benefits and cultural characteristics
Threats to tourism, recreation and cultural values
Notes from the workshop were collated and provided to the DSEWPAC as part of a progress report
and used to develop the Kakadu National Park ECD and RIS Update documents.
A3.3 Conclusions
A large number of people attended the workshop and actively participated in listening to
presentations, providing feedback and undertaking group discussion. The information provided will be
relevant and useful in preparing the Kakadu National Park ECD and RIS update documents. The
study team were also able to inform Kakadu National Park stakeholders about the application of the
Ramsar Convention to Kakadu National Park and to learn from participants how this may be most
appropriately used by those who manage the Kakadu National Park Ramsar site.
The Kakadu National Park-based workshop fulfilled the objectives of the Kakadu National Park ECD
and RIS Update Consultation Strategy by providing information to key stakeholders and Traditional
Owners in Kakadu National Park and providing them with an opportunity to contribute to the study in
an appropriate forum.
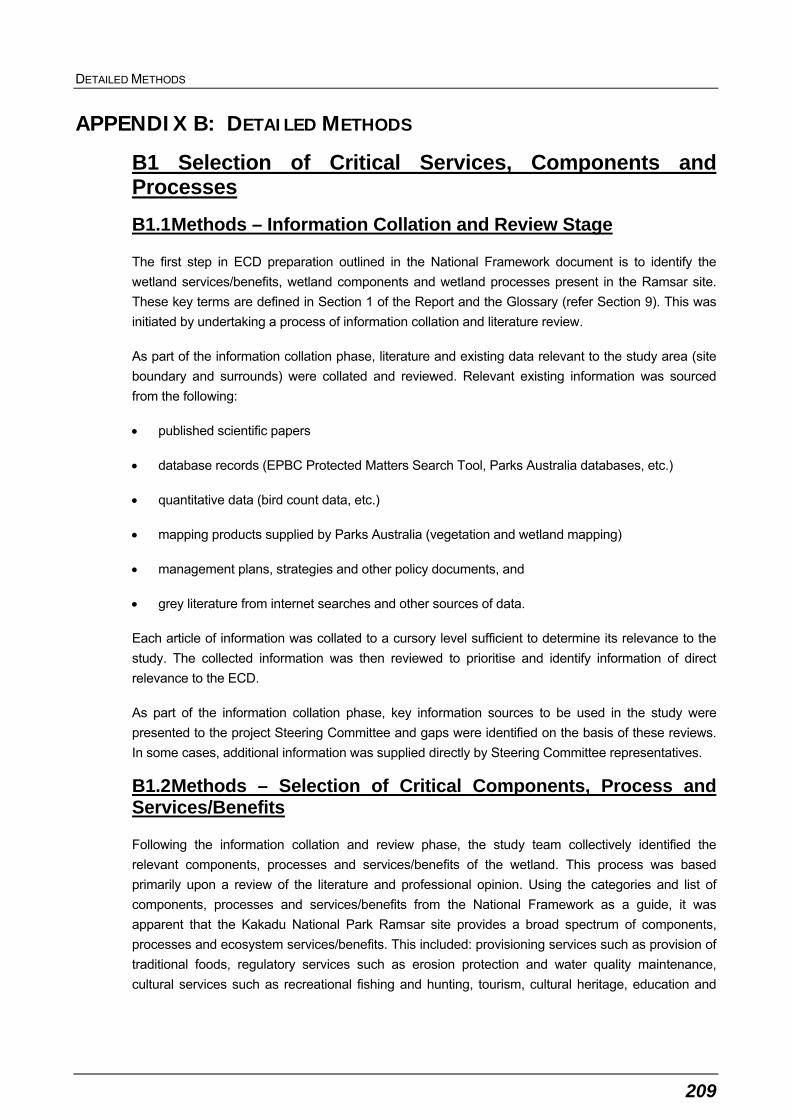
DETAILED METHODS
209
APPENDIX B: DETAILED METHODS
B1 Selection of Critical Services, Components and Processes
B1.1 Methods – Information Collation and Review Stage
The first step in ECD preparation outlined in the National Framework document is to identify the
wetland services/benefits, wetland components and wetland processes present in the Ramsar site.
These key terms are defined in Section 1 of the Report and the Glossary (refer Section 9). This was
initiated by undertaking a process of information collation and literature review.
As part of the information collation phase, literature and existing data relevant to the study area (site
boundary and surrounds) were collated and reviewed. Relevant existing information was sourced
from the following:
published scientific papers
database records (EPBC Protected Matters Search Tool, Parks Australia databases, etc.)
quantitative data (bird count data, etc.)
mapping products supplied by Parks Australia (vegetation and wetland mapping)
management plans, strategies and other policy documents, and
grey literature from internet searches and other sources of data.
Each article of information was collated to a cursory level sufficient to determine its relevance to the
study. The collected information was then reviewed to prioritise and identify information of direct
relevance to the ECD.
As part of the information collation phase, key information sources to be used in the study were
presented to the project Steering Committee and gaps were identified on the basis of these reviews.
In some cases, additional information was supplied directly by Steering Committee representatives.
B1.2 Methods – Selection of Critical Components, Process and Services/Benefits
Following the information collation and review phase, the study team collectively identified the
relevant components, processes and services/benefits of the wetland. This process was based
primarily upon a review of the literature and professional opinion. Using the categories and list of
components, processes and services/benefits from the National Framework as a guide, it was
apparent that the Kakadu National Park Ramsar site provides a broad spectrum of components,
processes and ecosystem services/benefits. This included: provisioning services such as provision of
traditional foods, regulatory services such as erosion protection and water quality maintenance,
cultural services such as recreational fishing and hunting, tourism, cultural heritage, education and
DETAILED METHODS
210
research and supporting ecosystem services such as biodiversity and the presence of endangered
and vulnerable species.
Likewise, given the scope, areal extent and diversity of wetland environments present within the
Kakadu National Park Ramsar site, all wetland components and processes from the National
Framework were seen as occurring within the site, including a broad range of hydrological, climatic,
geomorphologic, physico-chemical, biogeochemical and biological processes. It was noted that while
each of these processes play a part in underpinning normal wetland functioning, some of these
factors such as coastal hydrodynamics and climate also operate at both regional scales and local
scales.
As outlined in Section 2, a range of wetland habitat types are known to be present within the site
boundaries including those designated within the coastal/marine, inland and man-made wetland
categories under the Ramsar classification scheme. Within these systems, a rich diversity of wildlife
exists from all the major groups of organisms (from planktonic organisms to vertebrates) which make
up the components of the wetland.
With the full range of ecosystem components, processes and services/benefits represented, there
was a need to identify the most important or critical in the context of the Ramsar site. Following the
method within the National Framework, the assignment of a given wetland process, component or
service/benefit as critical was determined with reference to the following criteria:
the component, process or service/benefit is an important determinant of the uniqueness of the
site, or is widely accepted as representing a particularly outstanding example of an
environmental value supported by the site
the component, process or service/benefit is important for supporting one or more of the Ramsar
Nomination Criteria under which the site was listed, and
a change to the component, process or service/benefit would result in a fundamental change in
ecological character of the site.
To supplement the criteria from the National Framework, additional consideration was given to
suggestions or recommendations regarding critical services, components or processes by the
Steering Committee and Knowledge Management Committee (particularly where such information
was also documented in scientific literature). Accordingly, a set of draft critical services/benefits were
presented to the Knowledge Management Committee at its meeting in August 2009 and minor
revisions made as part of this process.
In addition to critical components, processes and services/benefits, a range of other elements were
identified as being important to the maintenance of the morphological, physio-chemical and biological
processes. These ‘supporting’ components, processes and services/benefits, while important to
wetland functioning, were in isolation were not considered to directly address the criteria listed above.
For example, a change in water quality (a supporting process) would not itself be considered to result
in a change to ecological character. While changes to a supporting element may result in an
ecological response, it is considered that such changes would be adequately captured through
assessment of LACs for critical components, processes or services/benefits.
DETAILED METHODS
211
Justification for inclusion of critical and supporting components, processes or services/benefits is
provided in the body of this report.
In selecting key species/groups that underpin critical components, processes and services/benefits,
the following methods were considered:
B1.3.1 Flora Species
In nominating particular wetland flora species or communities for consideration under the critical
components, the following considerations were applied:
a. species should generally occur in aquatic environments (for example, macrophytes) or are
otherwise considered to be wetland-associated species or communities, and
b. species or communities should be listed as threatened (i.e. vulnerable or endangered) at the
National (threatened under EPBC Act) and/or International (IUCN) level or are considered to
be particularly noteworthy or critical from a regional biodiversity perspective (refer to
Nomination Criterion 3). This includes species or communities that are perceived by the
authors to be iconic to the site, or are designated as threatened under Northern Territory
legislation (endangered or vulnerable at a State/Territory scale).
B1.3.2 Fauna Species
In nominating particular fauna species/groups for consideration under the critical components, the
following considerations were applied:
1. Species should generally occur in aquatic or marine environments or are otherwise considered to
be wetland-dependent terrestrial species (refer Glossary in Section 9 for definitions of these
terms and Appendix C for list of species).
2. Species should be either:
a. Designated as threatened (for example, endangered or vulnerable) at a national scale (under
the EPBC Act) or international scale (under IUCN Red List), or
b. Particularly noteworthy or critical from a regional biodiversity perspective (refer to Nomination
Criteria 3 or 7). This includes species that are perceived by the authors to be iconic to the
site, or are designated as threatened under Northern Territory legislation (endangered or
vulnerable at a State/Territory scale).
3. Given the boundaries of the Ramsar site are largely confined to near-shore areas or internal
waters, emphasis has been placed on inclusion of those species that use the site as core habitat,
have significant population numbers and spend a large proportion of their life cycle within the site
boundaries. This excludes vagrant species of conservation significance such as whales, sharks
and migratory seabirds that may only occur in the Ramsar site infrequently but for which species
records within the site exist.
DETAILED METHODS
212
B1.3.3 Populations
Populations of wetland biota that form the critical components are more generic groupings that
recognise the abundance and diversity of animals that utilise the various wetland habitats of the site.
This includes for example, amphibians, reptiles, mammals, fish, birds and aquatic invertebrates.
B2 Derivation of Limits of Acceptable Change
B2.1. General
Limits of Acceptable Change were derived using a staged approach as follows:
determine values of the site. These represent the critical components (Section 3.3) and
services/benefits (Section 3.7)
identify critical processes underpinning site values. These are the critical processes, and are
outlined in Section 3.5 of the report
describe patterns in natural variability in critical components, processes and services/benefits
indicators. Variability in indicators is described in Sections 3.3, 3.5 and 3.7 of the report
define the relative magnitude of acceptable change. The relative magnitude of acceptable
change was determined on the basis of (i) an assessment of criticality of the site to the
maintenance of species populations or habitats, based on known or likely patterns in geographic
distribution, abundance and criticality of the site to maintaining the survival of a species; (ii)
patterns (short-term and long-term) in natural variability; and (iii) a qualitative assessment of the
vulnerability of changes outside bounds of natural variability, and
derive specific limits of acceptable change. The broad relative magnitude of acceptable change
definitions was used to describe specific limits of acceptable change.
B2.2 Defining Relative Magnitude of Acceptability
The specific values of the site was determined on the basis of (i) known or likely patterns in the
distribution and abundance of species and habitats that comprise the critical services/ benefits and
components of the site, and (ii) expert opinion and or empirical data describing the criticality of the
site to maintaining the survival of a species. Three levels of criticality were derived based on these
factors (Least, Moderate and Highest Concern), as described in Table B-1 below.
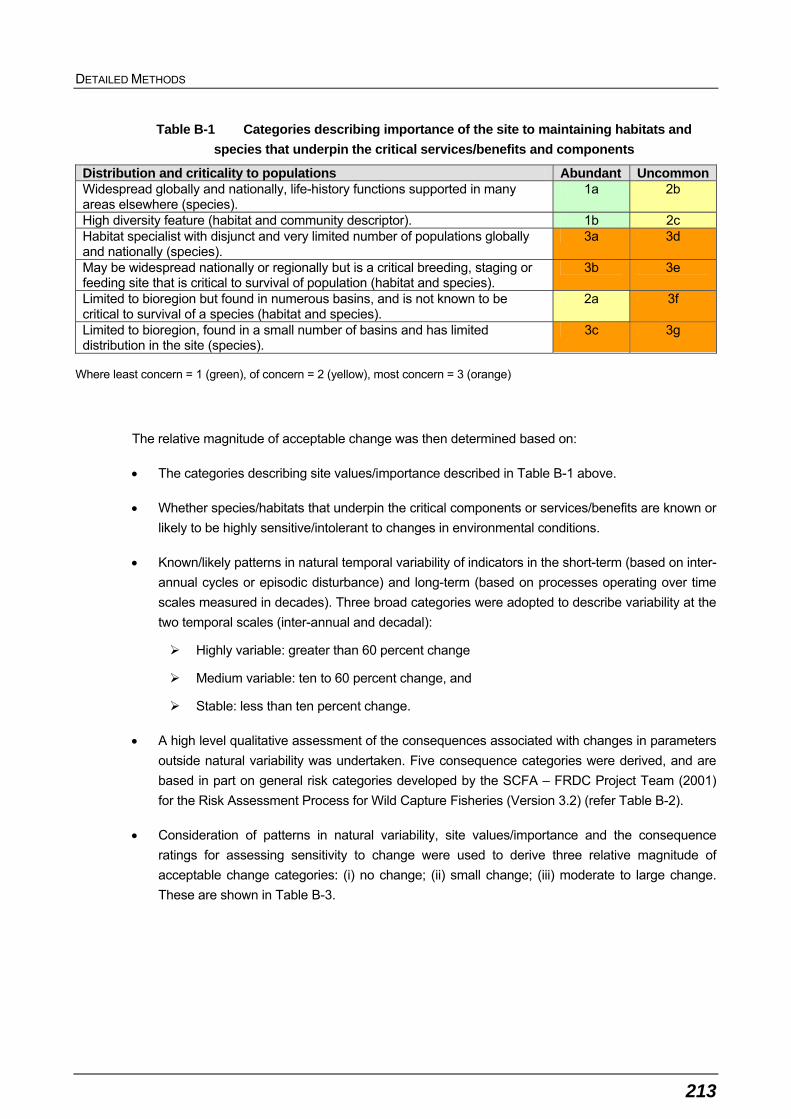
DETAILED METHODS
213
Table B-1 Categories describing importance of the site to maintaining habitats and
species that underpin the critical services/benefits and components
Distribution and criticality to populations Abundant UncommonWidespread globally and nationally, life-history functions supported in many areas elsewhere (species).
1a 2b
High diversity feature (habitat and community descriptor). 1b 2c Habitat specialist with disjunct and very limited number of populations globally and nationally (species).
3a 3d
May be widespread nationally or regionally but is a critical breeding, staging or feeding site that is critical to survival of population (habitat and species).
3b 3e
Limited to bioregion but found in numerous basins, and is not known to be critical to survival of a species (habitat and species).
2a 3f
Limited to bioregion, found in a small number of basins and has limited distribution in the site (species).
3c 3g
Where least concern = 1 (green), of concern = 2 (yellow), most concern = 3 (orange)
The relative magnitude of acceptable change was then determined based on:
The categories describing site values/importance described in Table B-1 above.
Whether species/habitats that underpin the critical components or services/benefits are known or
likely to be highly sensitive/intolerant to changes in environmental conditions.
Known/likely patterns in natural temporal variability of indicators in the short-term (based on inter-
annual cycles or episodic disturbance) and long-term (based on processes operating over time
scales measured in decades). Three broad categories were adopted to describe variability at the
two temporal scales (inter-annual and decadal):
Highly variable: greater than 60 percent change
Medium variable: ten to 60 percent change, and
Stable: less than ten percent change.
A high level qualitative assessment of the consequences associated with changes in parameters
outside natural variability was undertaken. Five consequence categories were derived, and are
based in part on general risk categories developed by the SCFA – FRDC Project Team (2001)
for the Risk Assessment Process for Wild Capture Fisheries (Version 3.2) (refer Table B-2).
Consideration of patterns in natural variability, site values/importance and the consequence
ratings for assessing sensitivity to change were used to derive three relative magnitude of
acceptable change categories: (i) no change; (ii) small change; (iii) moderate to large change.
These are shown in Table B-3.

DETAILED METHODS
214
Table B-2 Defining impact magnitude
Category Habitat affected/modified Key species Ecosystem functioning
Major >60% habitat Mortality likely local extinction.
Total ecosystem collapse.
High 30-60% Mortality may affect recruitment and capacity to increase.
Measurable impact to functions, and some functions are missing/ declining/ increasing outside historical range and/or facilitate new species to appear.
Moderate 5-30% Mortality within some spp. Levels of impact at the maximum acceptable level.
Measurable changes to ecosystem components but no loss of functions (no loss of components).
Minor <5% Affected but no impact on local population status (e.g. stress or behavioural change to individuals).
Keystone species not affected, minor changes in relative abundance.
Negligible <1% No impact. Possible changes, but inside natural variation.
Table B-3 Relative magnitude of acceptable change categories for LAC indicators
Level 2 species or its habitat
Level 1 species or its habitat Impact Significance
Level 3 species or habitat Short-term,
localised Long-term or multiple areas
Short-term, localised
Short-term, multiple areas
Long-term, localised
Long-term, multiple areas
Major No change No change No change No change
No change No change No change
High No change No change No change Moderate change
No change No change No change
Moderate No change Small change
No change Moderate change
Small change
Small change
No change
Minor No change Moderate change
Small change
Moderate change
Moderate change
Moderate change
Small change

FAUNA SPECIES LISTS
215
APPENDIX C: FAUNA SPECIES LISTS
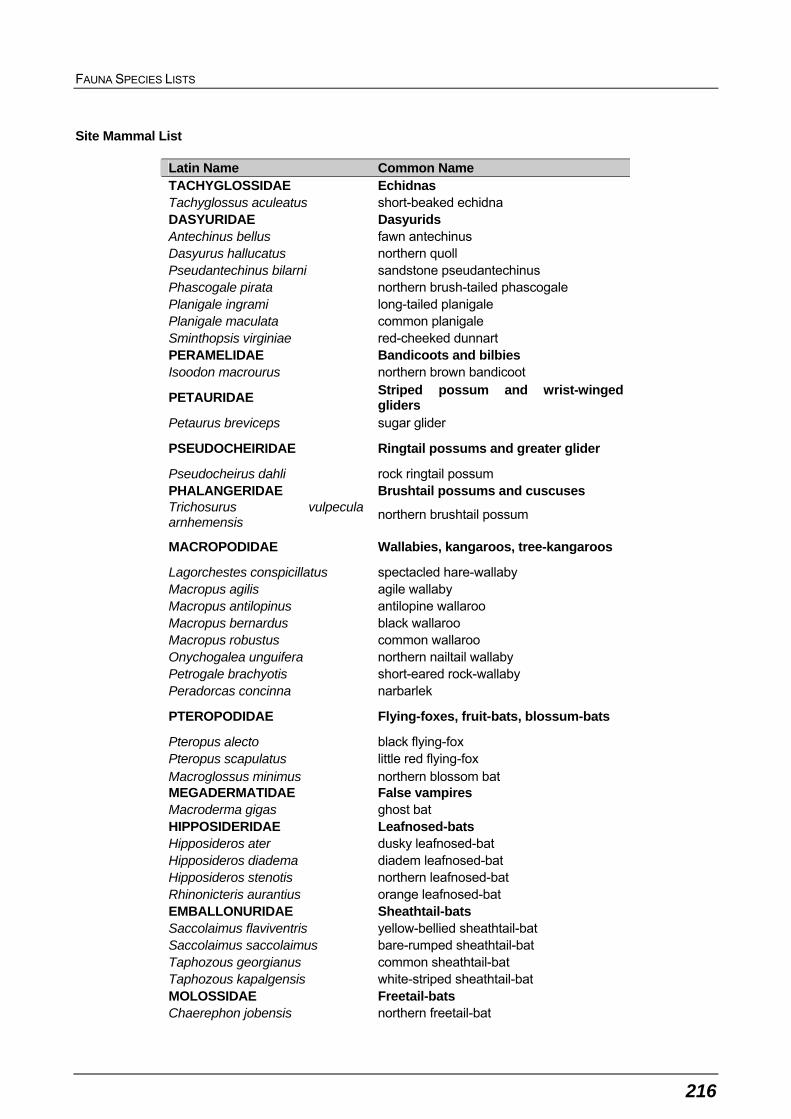
FAUNA SPECIES LISTS
216
Site Mammal List
Latin Name Common Name TACHYGLOSSIDAE Echidnas Tachyglossus aculeatus short-beaked echidna DASYURIDAE Dasyurids Antechinus bellus fawn antechinus Dasyurus hallucatus northern quoll Pseudantechinus bilarni sandstone pseudantechinus Phascogale pirata northern brush-tailed phascogale Planigale ingrami long-tailed planigale Planigale maculata common planigale Sminthopsis virginiae red-cheeked dunnart PERAMELIDAE Bandicoots and bilbies Isoodon macrourus northern brown bandicoot
PETAURIDAE Striped possum and wrist-winged gliders
Petaurus breviceps sugar glider
PSEUDOCHEIRIDAE Ringtail possums and greater glider
Pseudocheirus dahli rock ringtail possum PHALANGERIDAE Brushtail possums and cuscuses Trichosurus vulpecula arnhemensis
northern brushtail possum
MACROPODIDAE Wallabies, kangaroos, tree-kangaroos
Lagorchestes conspicillatus spectacled hare-wallaby Macropus agilis agile wallaby Macropus antilopinus antilopine wallaroo Macropus bernardus black wallaroo Macropus robustus common wallaroo Onychogalea unguifera northern nailtail wallaby Petrogale brachyotis short-eared rock-wallaby Peradorcas concinna narbarlek
PTEROPODIDAE Flying-foxes, fruit-bats, blossum-bats
Pteropus alecto black flying-fox Pteropus scapulatus little red flying-fox Macroglossus minimus northern blossom bat MEGADERMATIDAE False vampires Macroderma gigas ghost bat HIPPOSIDERIDAE Leafnosed-bats Hipposideros ater dusky leafnosed-bat Hipposideros diadema diadem leafnosed-bat Hipposideros stenotis northern leafnosed-bat Rhinonicteris aurantius orange leafnosed-bat EMBALLONURIDAE Sheathtail-bats Saccolaimus flaviventris yellow-bellied sheathtail-bat Saccolaimus saccolaimus bare-rumped sheathtail-bat Taphozous georgianus common sheathtail-bat Taphozous kapalgensis white-striped sheathtail-bat MOLOSSIDAE Freetail-bats Chaerephon jobensis northern freetail-bat
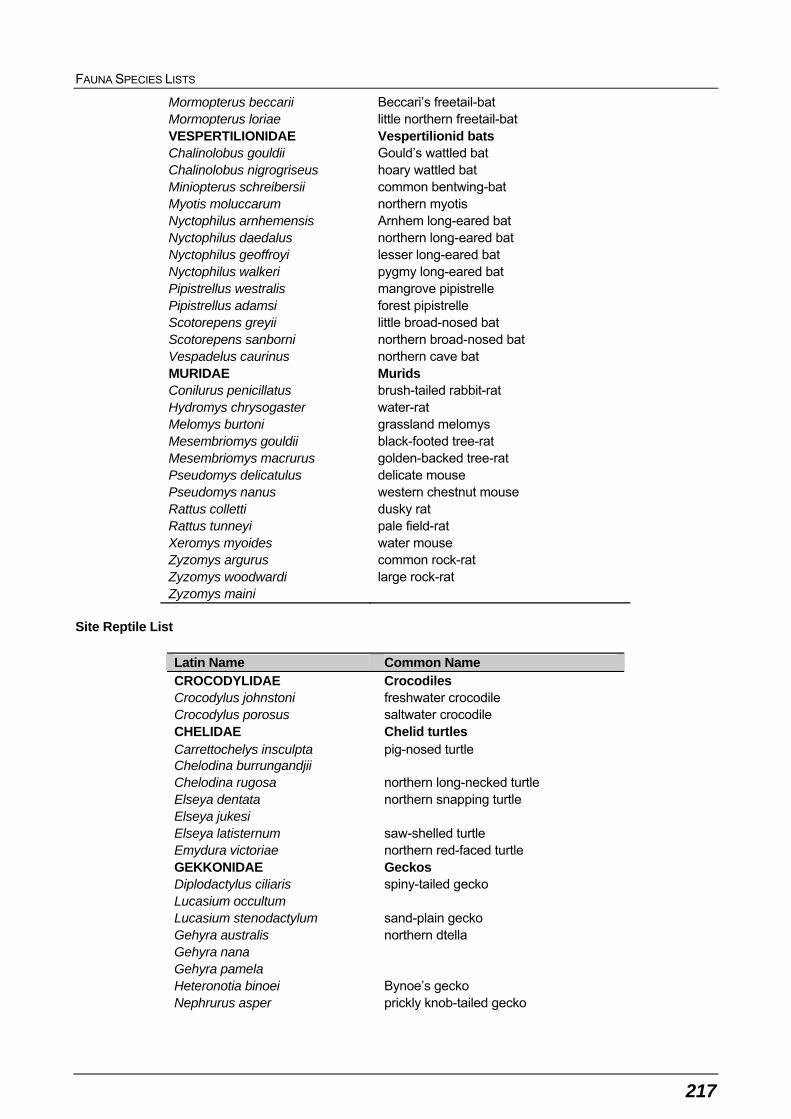
FAUNA SPECIES LISTS
217
Mormopterus beccarii Beccari’s freetail-bat Mormopterus loriae little northern freetail-bat VESPERTILIONIDAE Vespertilionid bats Chalinolobus gouldii Gould’s wattled bat Chalinolobus nigrogriseus hoary wattled bat Miniopterus schreibersii common bentwing-bat Myotis moluccarum northern myotis Nyctophilus arnhemensis Arnhem long-eared bat Nyctophilus daedalus northern long-eared bat Nyctophilus geoffroyi lesser long-eared bat Nyctophilus walkeri pygmy long-eared bat Pipistrellus westralis mangrove pipistrelle Pipistrellus adamsi forest pipistrelle Scotorepens greyii little broad-nosed bat Scotorepens sanborni northern broad-nosed bat Vespadelus caurinus northern cave bat MURIDAE Murids Conilurus penicillatus brush-tailed rabbit-rat Hydromys chrysogaster water-rat Melomys burtoni grassland melomys Mesembriomys gouldii black-footed tree-rat Mesembriomys macrurus golden-backed tree-rat Pseudomys delicatulus delicate mouse Pseudomys nanus western chestnut mouse Rattus colletti dusky rat Rattus tunneyi pale field-rat Xeromys myoides water mouse Zyzomys argurus common rock-rat Zyzomys woodwardi large rock-rat Zyzomys maini
Site Reptile List
Latin Name Common Name CROCODYLIDAE Crocodiles Crocodylus johnstoni freshwater crocodile Crocodylus porosus saltwater crocodile CHELIDAE Chelid turtles Carrettochelys insculpta pig-nosed turtle Chelodina burrungandjii Chelodina rugosa northern long-necked turtle Elseya dentata northern snapping turtle Elseya jukesi Elseya latisternum saw-shelled turtle Emydura victoriae northern red-faced turtle GEKKONIDAE Geckos Diplodactylus ciliaris spiny-tailed gecko Lucasium occultum Lucasium stenodactylum sand-plain gecko Gehyra australis northern dtella Gehyra nana Gehyra pamela Heteronotia binoei Bynoe’s gecko Nephrurus asper prickly knob-tailed gecko
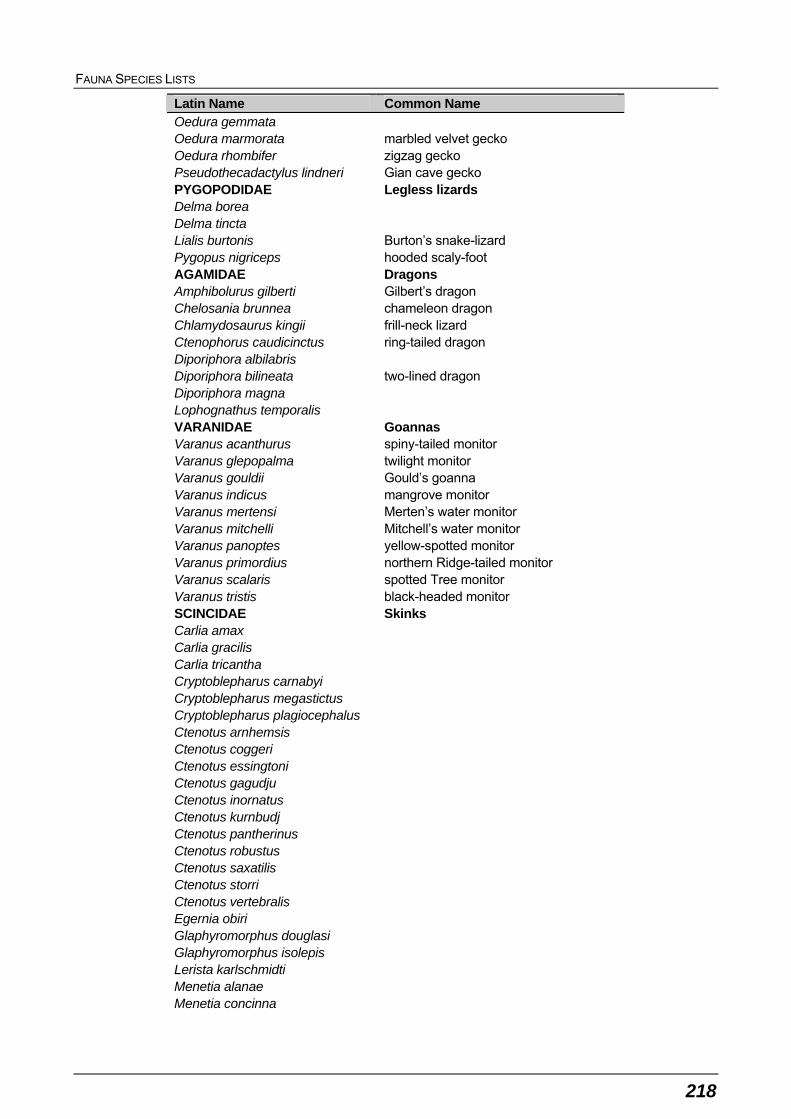
FAUNA SPECIES LISTS
218
Latin Name Common Name Oedura gemmata Oedura marmorata marbled velvet gecko Oedura rhombifer zigzag gecko Pseudothecadactylus lindneri Gian cave gecko PYGOPODIDAE Legless lizards Delma borea Delma tincta Lialis burtonis Burton’s snake-lizard Pygopus nigriceps hooded scaly-foot AGAMIDAE Dragons Amphibolurus gilberti Gilbert’s dragon Chelosania brunnea chameleon dragon Chlamydosaurus kingii frill-neck lizard Ctenophorus caudicinctus ring-tailed dragon Diporiphora albilabris Diporiphora bilineata two-lined dragon Diporiphora magna Lophognathus temporalis VARANIDAE Goannas Varanus acanthurus spiny-tailed monitor Varanus glepopalma twilight monitor Varanus gouldii Gould’s goanna Varanus indicus mangrove monitor Varanus mertensi Merten’s water monitor Varanus mitchelli Mitchell’s water monitor Varanus panoptes yellow-spotted monitor Varanus primordius northern Ridge-tailed monitor Varanus scalaris spotted Tree monitor Varanus tristis black-headed monitor SCINCIDAE Skinks Carlia amax Carlia gracilis Carlia tricantha Cryptoblepharus carnabyi Cryptoblepharus megastictus Cryptoblepharus plagiocephalus Ctenotus arnhemsis Ctenotus coggeri Ctenotus essingtoni Ctenotus gagudju Ctenotus inornatus Ctenotus kurnbudj Ctenotus pantherinus Ctenotus robustus Ctenotus saxatilis Ctenotus storri Ctenotus vertebralis Egernia obiri Glaphyromorphus douglasi Glaphyromorphus isolepis Lerista karlschmidti Menetia alanae Menetia concinna
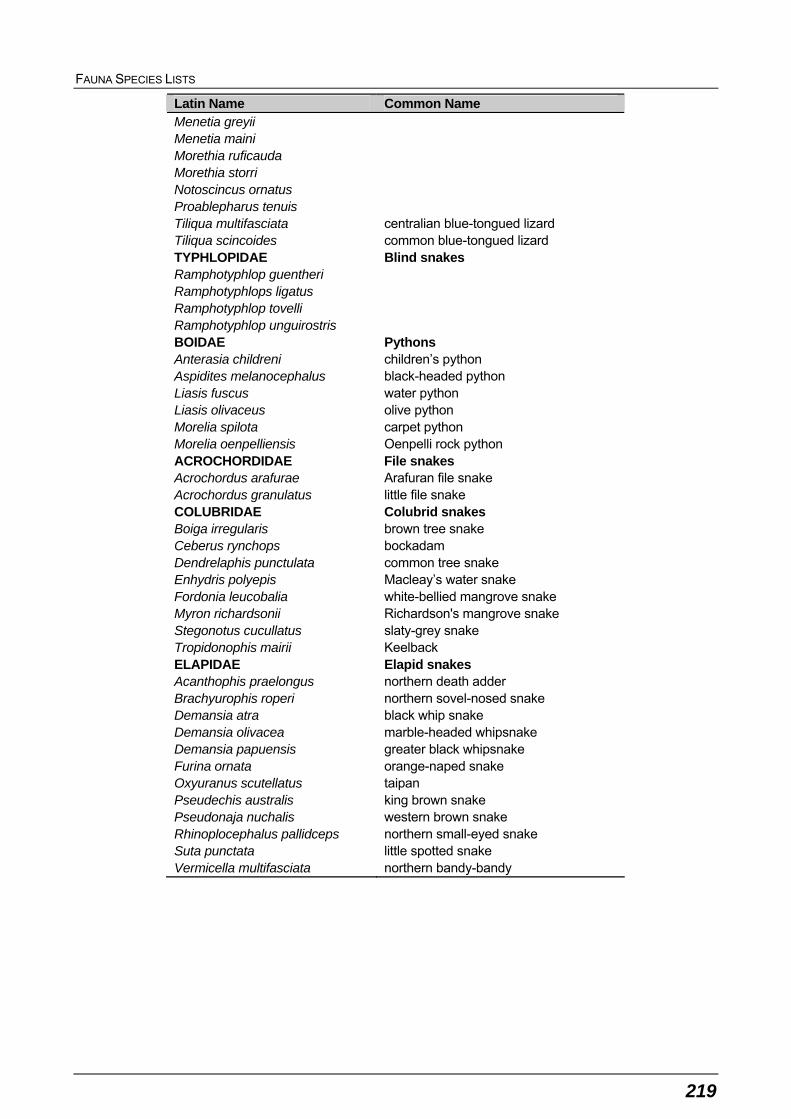
FAUNA SPECIES LISTS
219
Latin Name Common Name Menetia greyii Menetia maini Morethia ruficauda Morethia storri Notoscincus ornatus Proablepharus tenuis Tiliqua multifasciata centralian blue-tongued lizard Tiliqua scincoides common blue-tongued lizard TYPHLOPIDAE Blind snakes Ramphotyphlop guentheri Ramphotyphlops ligatus Ramphotyphlop tovelli Ramphotyphlop unguirostris BOIDAE Pythons Anterasia childreni children’s python Aspidites melanocephalus black-headed python Liasis fuscus water python Liasis olivaceus olive python Morelia spilota carpet python Morelia oenpelliensis Oenpelli rock python ACROCHORDIDAE File snakes Acrochordus arafurae Arafuran file snake Acrochordus granulatus little file snake COLUBRIDAE Colubrid snakes Boiga irregularis brown tree snake Ceberus rynchops bockadam Dendrelaphis punctulata common tree snake Enhydris polyepis Macleay’s water snake Fordonia leucobalia white-bellied mangrove snake Myron richardsonii Richardson's mangrove snake Stegonotus cucullatus slaty-grey snake Tropidonophis mairii Keelback ELAPIDAE Elapid snakes Acanthophis praelongus northern death adder Brachyurophis roperi northern sovel-nosed snake Demansia atra black whip snake Demansia olivacea marble-headed whipsnake Demansia papuensis greater black whipsnake Furina ornata orange-naped snake Oxyuranus scutellatus taipan Pseudechis australis king brown snake Pseudonaja nuchalis western brown snake Rhinoplocephalus pallidceps northern small-eyed snake Suta punctata little spotted snake Vermicella multifasciata northern bandy-bandy
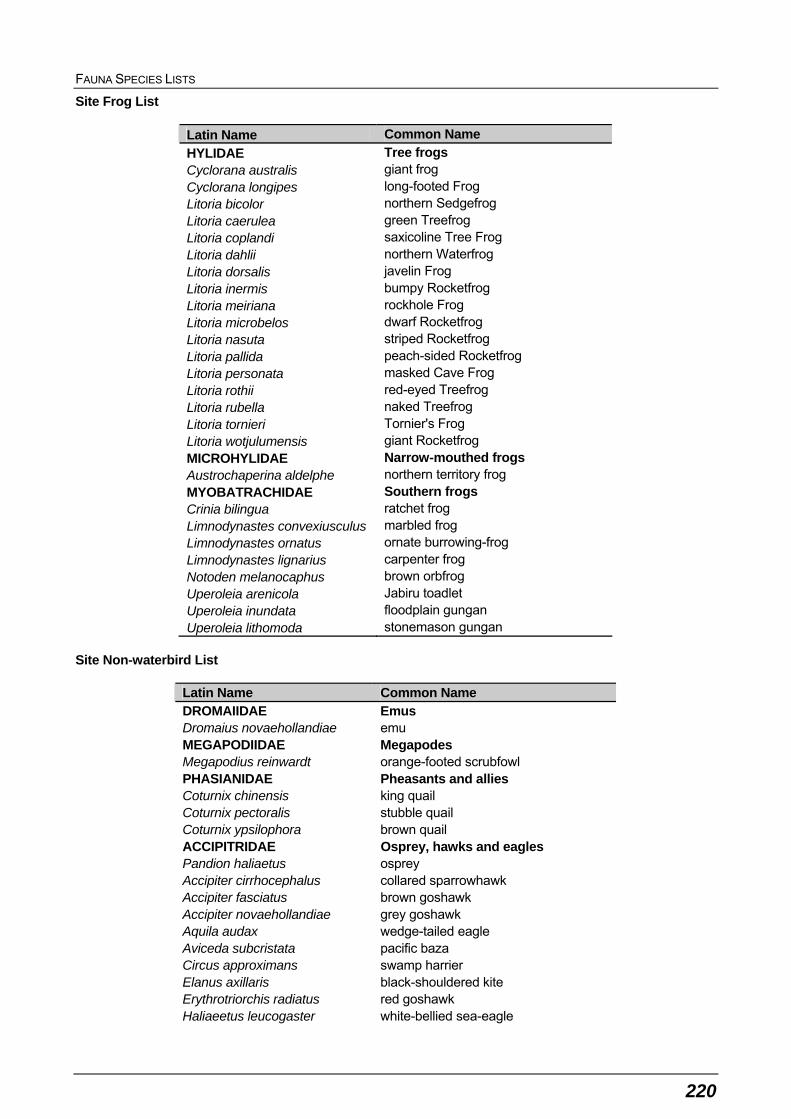
FAUNA SPECIES LISTS
220
Site Frog List
Latin Name Common Name
HYLIDAE Tree frogs Cyclorana australis giant frog Cyclorana longipes long-footed Frog Litoria bicolor northern Sedgefrog Litoria caerulea green Treefrog Litoria coplandi saxicoline Tree Frog Litoria dahlii northern Waterfrog Litoria dorsalis javelin Frog Litoria inermis bumpy Rocketfrog Litoria meiriana rockhole Frog Litoria microbelos dwarf Rocketfrog Litoria nasuta striped Rocketfrog Litoria pallida peach-sided Rocketfrog Litoria personata masked Cave Frog Litoria rothii red-eyed Treefrog Litoria rubella naked Treefrog Litoria tornieri Tornier's Frog Litoria wotjulumensis giant Rocketfrog MICROHYLIDAE Narrow-mouthed frogs Austrochaperina aldelphe northern territory frog MYOBATRACHIDAE Southern frogs Crinia bilingua ratchet frog Limnodynastes convexiusculus marbled frog Limnodynastes ornatus ornate burrowing-frog Limnodynastes lignarius carpenter frog Notoden melanocaphus brown orbfrog Uperoleia arenicola Jabiru toadlet Uperoleia inundata floodplain gungan Uperoleia lithomoda stonemason gungan
Site Non-waterbird List
Latin Name Common Name DROMAIIDAE Emus Dromaius novaehollandiae emu MEGAPODIIDAE Megapodes Megapodius reinwardt orange-footed scrubfowl PHASIANIDAE Pheasants and allies Coturnix chinensis king quail Coturnix pectoralis stubble quail Coturnix ypsilophora brown quail ACCIPITRIDAE Osprey, hawks and eagles Pandion haliaetus osprey Accipiter cirrhocephalus collared sparrowhawk Accipiter fasciatus brown goshawk Accipiter novaehollandiae grey goshawk Aquila audax wedge-tailed eagle Aviceda subcristata pacific baza Circus approximans swamp harrier Elanus axillaris black-shouldered kite Erythrotriorchis radiatus red goshawk Haliaeetus leucogaster white-bellied sea-eagle
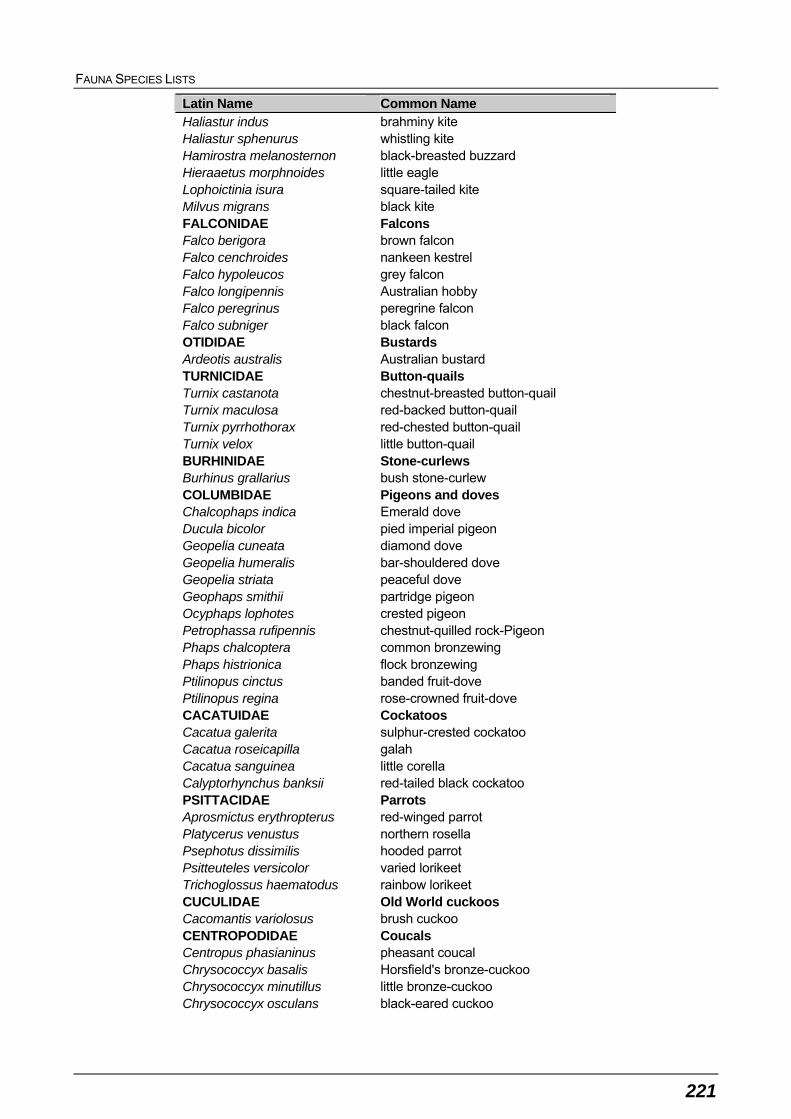
FAUNA SPECIES LISTS
221
Latin Name Common Name Haliastur indus brahminy kite Haliastur sphenurus whistling kite Hamirostra melanosternon black-breasted buzzard Hieraaetus morphnoides little eagle Lophoictinia isura square-tailed kite Milvus migrans black kite FALCONIDAE Falcons Falco berigora brown falcon Falco cenchroides nankeen kestrel Falco hypoleucos grey falcon Falco longipennis Australian hobby Falco peregrinus peregrine falcon Falco subniger black falcon OTIDIDAE Bustards Ardeotis australis Australian bustard TURNICIDAE Button-quails Turnix castanota chestnut-breasted button-quail Turnix maculosa red-backed button-quail Turnix pyrrhothorax red-chested button-quail Turnix velox little button-quail BURHINIDAE Stone-curlews Burhinus grallarius bush stone-curlew COLUMBIDAE Pigeons and doves Chalcophaps indica Emerald dove Ducula bicolor pied imperial pigeon Geopelia cuneata diamond dove Geopelia humeralis bar-shouldered dove Geopelia striata peaceful dove Geophaps smithii partridge pigeon Ocyphaps lophotes crested pigeon Petrophassa rufipennis chestnut-quilled rock-Pigeon Phaps chalcoptera common bronzewing Phaps histrionica flock bronzewing Ptilinopus cinctus banded fruit-dove Ptilinopus regina rose-crowned fruit-dove CACATUIDAE Cockatoos Cacatua galerita sulphur-crested cockatoo Cacatua roseicapilla galah Cacatua sanguinea little corella Calyptorhynchus banksii red-tailed black cockatoo PSITTACIDAE Parrots Aprosmictus erythropterus red-winged parrot Platycerus venustus northern rosella Psephotus dissimilis hooded parrot Psitteuteles versicolor varied lorikeet Trichoglossus haematodus rainbow lorikeet CUCULIDAE Old World cuckoos Cacomantis variolosus brush cuckoo CENTROPODIDAE Coucals Centropus phasianinus pheasant coucal Chrysococcyx basalis Horsfield's bronze-cuckoo Chrysococcyx minutillus little bronze-cuckoo Chrysococcyx osculans black-eared cuckoo
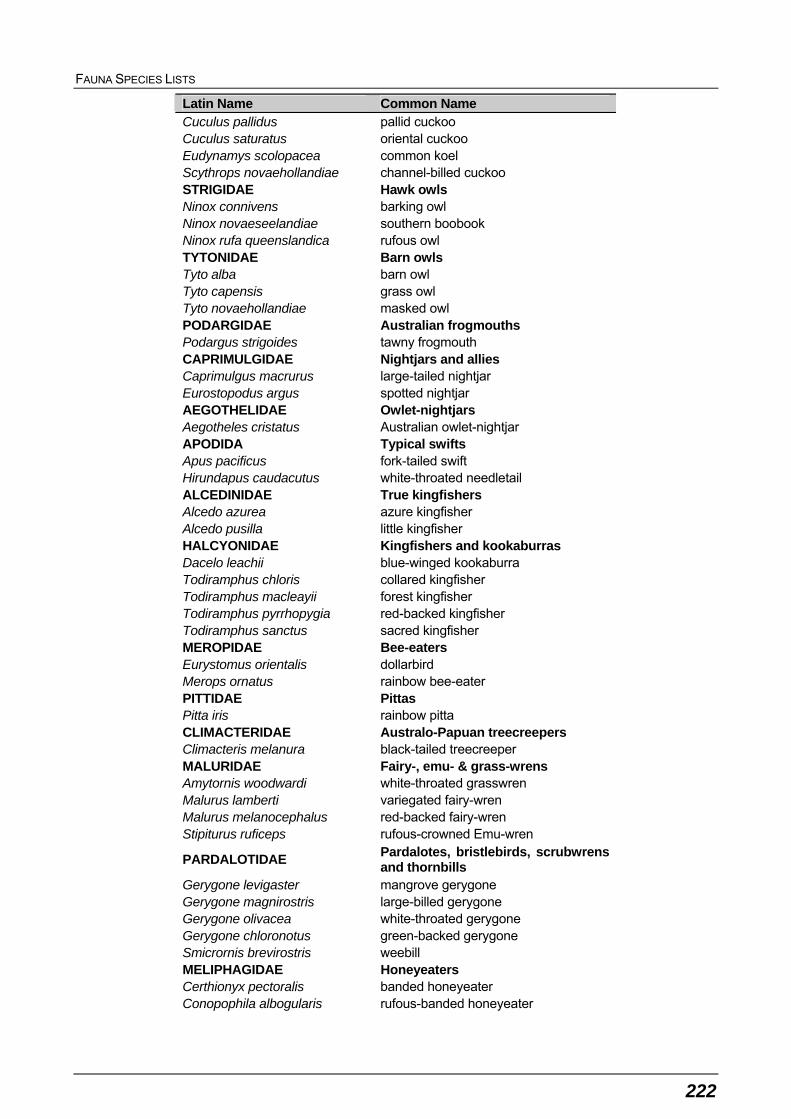
FAUNA SPECIES LISTS
222
Latin Name Common Name Cuculus pallidus pallid cuckoo Cuculus saturatus oriental cuckoo Eudynamys scolopacea common koel Scythrops novaehollandiae channel-billed cuckoo STRIGIDAE Hawk owls Ninox connivens barking owl Ninox novaeseelandiae southern boobook Ninox rufa queenslandica rufous owl TYTONIDAE Barn owls Tyto alba barn owl Tyto capensis grass owl Tyto novaehollandiae masked owl PODARGIDAE Australian frogmouths Podargus strigoides tawny frogmouth CAPRIMULGIDAE Nightjars and allies Caprimulgus macrurus large-tailed nightjar Eurostopodus argus spotted nightjar AEGOTHELIDAE Owlet-nightjars Aegotheles cristatus Australian owlet-nightjar APODIDA Typical swifts Apus pacificus fork-tailed swift Hirundapus caudacutus white-throated needletail ALCEDINIDAE True kingfishers Alcedo azurea azure kingfisher Alcedo pusilla little kingfisher HALCYONIDAE Kingfishers and kookaburras Dacelo leachii blue-winged kookaburra Todiramphus chloris collared kingfisher Todiramphus macleayii forest kingfisher Todiramphus pyrrhopygia red-backed kingfisher Todiramphus sanctus sacred kingfisher MEROPIDAE Bee-eaters Eurystomus orientalis dollarbird Merops ornatus rainbow bee-eater PITTIDAE Pittas Pitta iris rainbow pitta CLIMACTERIDAE Australo-Papuan treecreepers Climacteris melanura black-tailed treecreeper MALURIDAE Fairy-, emu- & grass-wrens Amytornis woodwardi white-throated grasswren Malurus lamberti variegated fairy-wren Malurus melanocephalus red-backed fairy-wren Stipiturus ruficeps rufous-crowned Emu-wren
PARDALOTIDAE Pardalotes, bristlebirds, scrubwrens and thornbills
Gerygone levigaster mangrove gerygone Gerygone magnirostris large-billed gerygone Gerygone olivacea white-throated gerygone Gerygone chloronotus green-backed gerygone Smicrornis brevirostris weebill MELIPHAGIDAE Honeyeaters Certhionyx pectoralis banded honeyeater Conopophila albogularis rufous-banded honeyeater
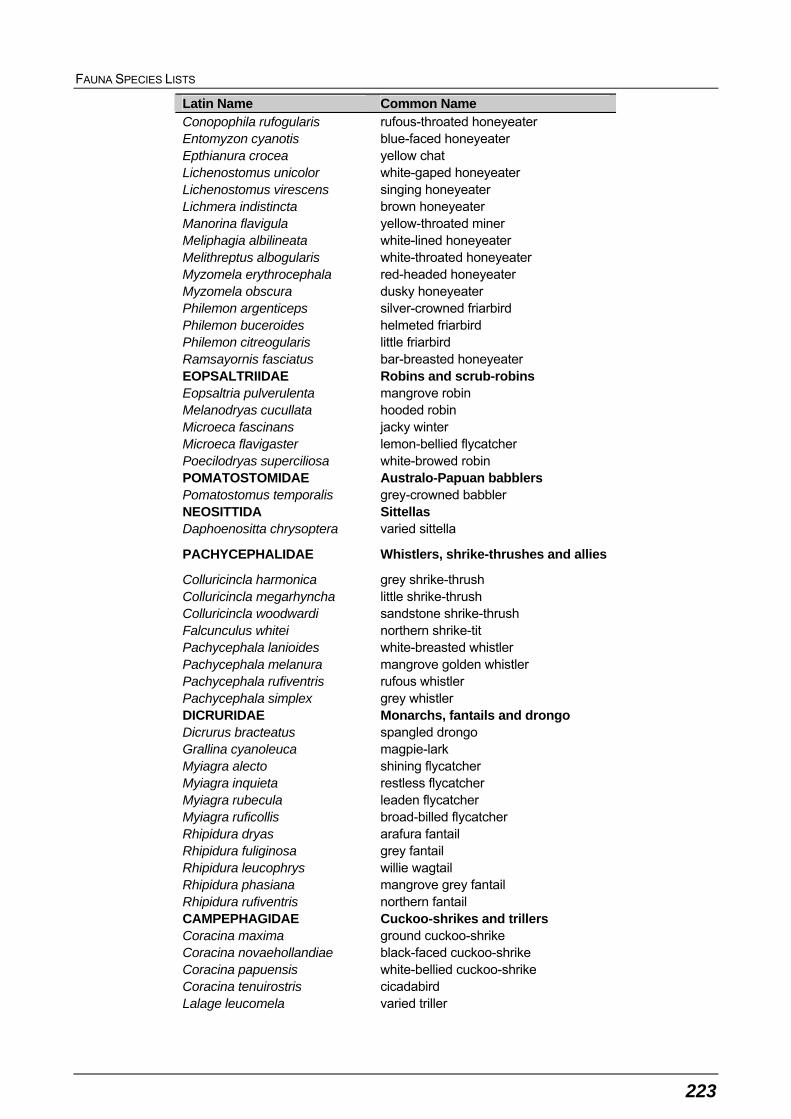
FAUNA SPECIES LISTS
223
Latin Name Common Name Conopophila rufogularis rufous-throated honeyeater Entomyzon cyanotis blue-faced honeyeater Epthianura crocea yellow chat Lichenostomus unicolor white-gaped honeyeater Lichenostomus virescens singing honeyeater Lichmera indistincta brown honeyeater Manorina flavigula yellow-throated miner Meliphagia albilineata white-lined honeyeater Melithreptus albogularis white-throated honeyeater Myzomela erythrocephala red-headed honeyeater Myzomela obscura dusky honeyeater Philemon argenticeps silver-crowned friarbird Philemon buceroides helmeted friarbird Philemon citreogularis little friarbird Ramsayornis fasciatus bar-breasted honeyeater EOPSALTRIIDAE Robins and scrub-robins Eopsaltria pulverulenta mangrove robin Melanodryas cucullata hooded robin Microeca fascinans jacky winter Microeca flavigaster lemon-bellied flycatcher Poecilodryas superciliosa white-browed robin POMATOSTOMIDAE Australo-Papuan babblers Pomatostomus temporalis grey-crowned babbler NEOSITTIDA Sittellas Daphoenositta chrysoptera varied sittella
PACHYCEPHALIDAE Whistlers, shrike-thrushes and allies
Colluricincla harmonica grey shrike-thrush Colluricincla megarhyncha little shrike-thrush Colluricincla woodwardi sandstone shrike-thrush Falcunculus whitei northern shrike-tit Pachycephala lanioides white-breasted whistler Pachycephala melanura mangrove golden whistler Pachycephala rufiventris rufous whistler Pachycephala simplex grey whistler DICRURIDAE Monarchs, fantails and drongo Dicrurus bracteatus spangled drongo Grallina cyanoleuca magpie-lark Myiagra alecto shining flycatcher Myiagra inquieta restless flycatcher Myiagra rubecula leaden flycatcher Myiagra ruficollis broad-billed flycatcher Rhipidura dryas arafura fantail Rhipidura fuliginosa grey fantail Rhipidura leucophrys willie wagtail Rhipidura phasiana mangrove grey fantail Rhipidura rufiventris northern fantail CAMPEPHAGIDAE Cuckoo-shrikes and trillers Coracina maxima ground cuckoo-shrike Coracina novaehollandiae black-faced cuckoo-shrike Coracina papuensis white-bellied cuckoo-shrike Coracina tenuirostris cicadabird Lalage leucomela varied triller
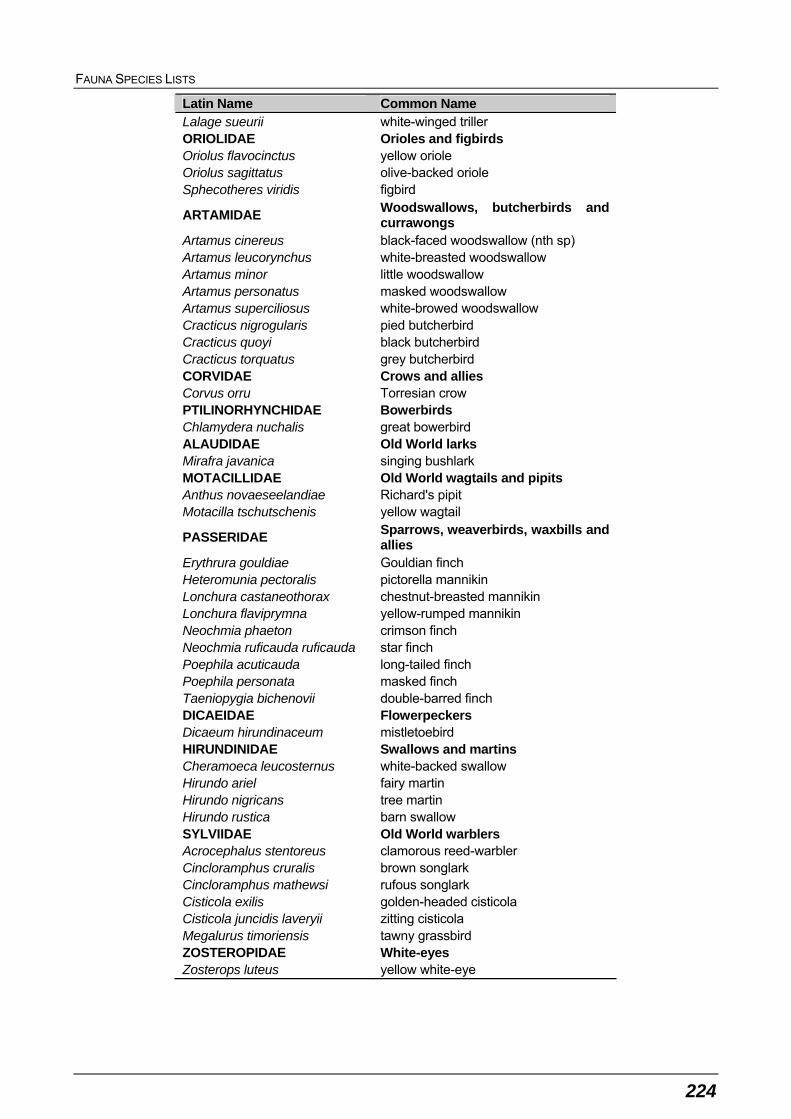
FAUNA SPECIES LISTS
224
Latin Name Common Name Lalage sueurii white-winged triller ORIOLIDAE Orioles and figbirds Oriolus flavocinctus yellow oriole Oriolus sagittatus olive-backed oriole Sphecotheres viridis figbird
ARTAMIDAE Woodswallows, butcherbirds and currawongs
Artamus cinereus black-faced woodswallow (nth sp) Artamus leucorynchus white-breasted woodswallow Artamus minor little woodswallow Artamus personatus masked woodswallow Artamus superciliosus white-browed woodswallow Cracticus nigrogularis pied butcherbird Cracticus quoyi black butcherbird Cracticus torquatus grey butcherbird CORVIDAE Crows and allies Corvus orru Torresian crow PTILINORHYNCHIDAE Bowerbirds Chlamydera nuchalis great bowerbird ALAUDIDAE Old World larks Mirafra javanica singing bushlark MOTACILLIDAE Old World wagtails and pipits Anthus novaeseelandiae Richard's pipit Motacilla tschutschenis yellow wagtail
PASSERIDAE Sparrows, weaverbirds, waxbills and allies
Erythrura gouldiae Gouldian finch Heteromunia pectoralis pictorella mannikin Lonchura castaneothorax chestnut-breasted mannikin Lonchura flaviprymna yellow-rumped mannikin Neochmia phaeton crimson finch Neochmia ruficauda ruficauda star finch Poephila acuticauda long-tailed finch Poephila personata masked finch Taeniopygia bichenovii double-barred finch DICAEIDAE Flowerpeckers Dicaeum hirundinaceum mistletoebird HIRUNDINIDAE Swallows and martins Cheramoeca leucosternus white-backed swallow Hirundo ariel fairy martin Hirundo nigricans tree martin Hirundo rustica barn swallow SYLVIIDAE Old World warblers Acrocephalus stentoreus clamorous reed-warbler Cincloramphus cruralis brown songlark Cincloramphus mathewsi rufous songlark Cisticola exilis golden-headed cisticola Cisticola juncidis laveryii zitting cisticola Megalurus timoriensis tawny grassbird ZOSTEROPIDAE White-eyes Zosterops luteus yellow white-eye

FAUNA SPECIES LISTS
225
Site Waterbird List
Latin Name Common Name ANSERANATIDAE Magpie geese Anseranas semipalmata magpie goose ANATIDAE Swans, geese and ducks Anas gracilis grey teal Anas querquedula garganey Anas superciliosa pacific black duck Aythya australis hardhead Dendrocygna arcuata wandering whistling-duck Dendrocygna eytoni plumed whistling-duck Malacorhynchus membranaceus pink-eared duck Nettapus pulchellus green pygmy goose Tadorna radjah radjah shelduck PODICIPEDIDAE Grebes Poliocephalus poliocephalus hoary-headed grebe Tachybaptus novaehollandiae Australasian grebe ANHINGIDAE Darters Anhinga melanogaster darter PHALACROCORACIDAE Cormorants Phalacrocorax melanoleucos little pied cormorant Phalacrocorax sulcirostris little black cormorant Phalacrocorax varius pied cormorant PELECANIDE Pelicans Pelecanus conspicillatus Australian pelican ARDEIDAE Herons, bitterns and egrets Ardea alba great egret Ardea ibis cattle egret Ardea intermedia intermediate egret Ardea pacifica white-necked heron Ardea picata pied heron Ardea sumatrana great-billed heron Butorides striata striated heron Egretta garzetta little egret Egretta novaehollandiae White-faced heron Egretta sacra eastern reef egret Ixobrychus flavicollis black bittern Nycticorax caledonicus nankeen night heron THRESKIORNITHIDAE Ibises and spoonbills Platalea flavipes yellow-billed spoonbill Platalea regia royal spoonbill Plegadis falcinellus glossy ibis Threskiornis molucca Australian white ibis Threskiornis spinicollis straw-necked ibis CICONIIDAE Storks Ephippiorhynchus asiaticus black-necked stork GRUIDAE Cranes Grus rubicunda brolga RALLIDAE Rails, gallinules and coots Eulabeornis castaneoventris chestnut Rail Fulica atra Eurasian coot Gallirallus philippensis buff-banded rail Porphyrio porphyrio purple swamphen
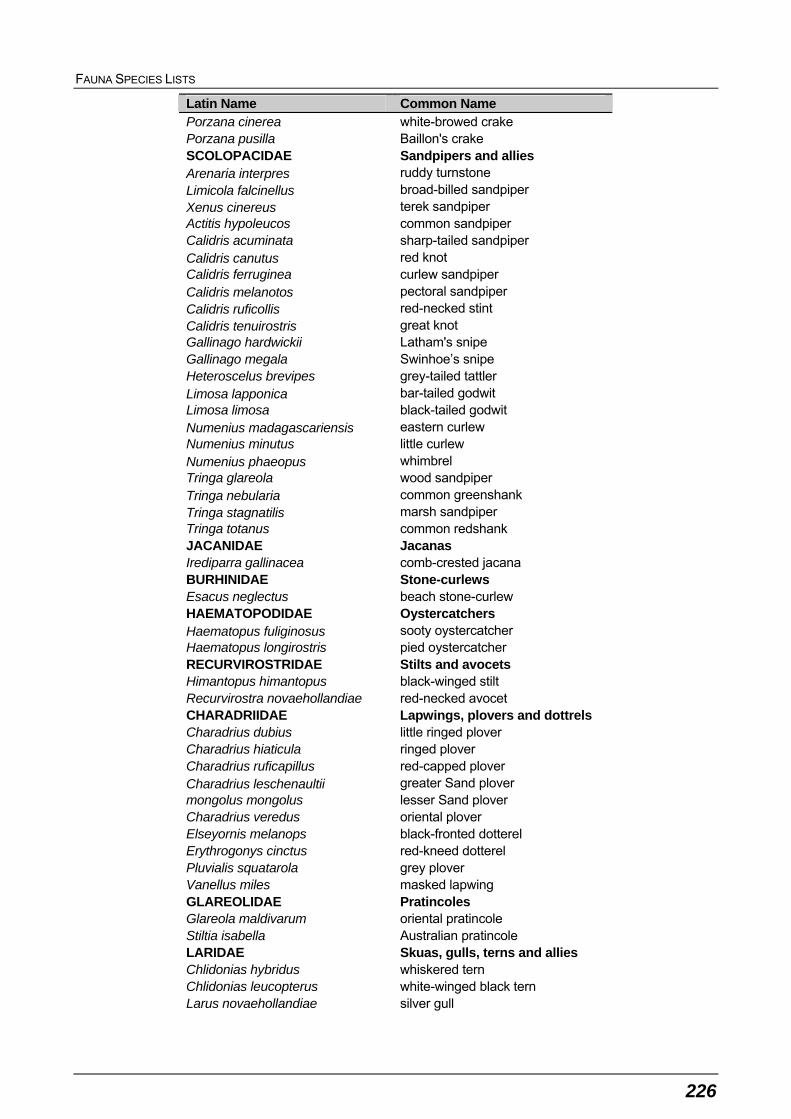
FAUNA SPECIES LISTS
226
Latin Name Common Name Porzana cinerea white-browed crake Porzana pusilla Baillon's crake SCOLOPACIDAE Sandpipers and allies Arenaria interpres ruddy turnstone Limicola falcinellus broad-billed sandpiper Xenus cinereus terek sandpiper Actitis hypoleucos common sandpiper Calidris acuminata sharp-tailed sandpiper Calidris canutus red knot Calidris ferruginea curlew sandpiper Calidris melanotos pectoral sandpiper Calidris ruficollis red-necked stint Calidris tenuirostris great knot Gallinago hardwickii Latham's snipe Gallinago megala Swinhoe’s snipe Heteroscelus brevipes grey-tailed tattler Limosa lapponica bar-tailed godwit Limosa limosa black-tailed godwit Numenius madagascariensis eastern curlew Numenius minutus little curlew Numenius phaeopus whimbrel Tringa glareola wood sandpiper Tringa nebularia common greenshank Tringa stagnatilis marsh sandpiper Tringa totanus common redshank JACANIDAE Jacanas Irediparra gallinacea comb-crested jacana BURHINIDAE Stone-curlews Esacus neglectus beach stone-curlew HAEMATOPODIDAE Oystercatchers Haematopus fuliginosus sooty oystercatcher Haematopus longirostris pied oystercatcher RECURVIROSTRIDAE Stilts and avocets Himantopus himantopus black-winged stilt Recurvirostra novaehollandiae red-necked avocet CHARADRIIDAE Lapwings, plovers and dottrels Charadrius dubius little ringed plover Charadrius hiaticula ringed plover Charadrius ruficapillus red-capped plover Charadrius leschenaultii greater Sand plover mongolus mongolus lesser Sand plover Charadrius veredus oriental plover Elseyornis melanops black-fronted dotterel Erythrogonys cinctus red-kneed dotterel Pluvialis squatarola grey plover Vanellus miles masked lapwing GLAREOLIDAE Pratincoles Glareola maldivarum oriental pratincole Stiltia isabella Australian pratincole LARIDAE Skuas, gulls, terns and allies Chlidonias hybridus whiskered tern Chlidonias leucopterus white-winged black tern Larus novaehollandiae silver gull
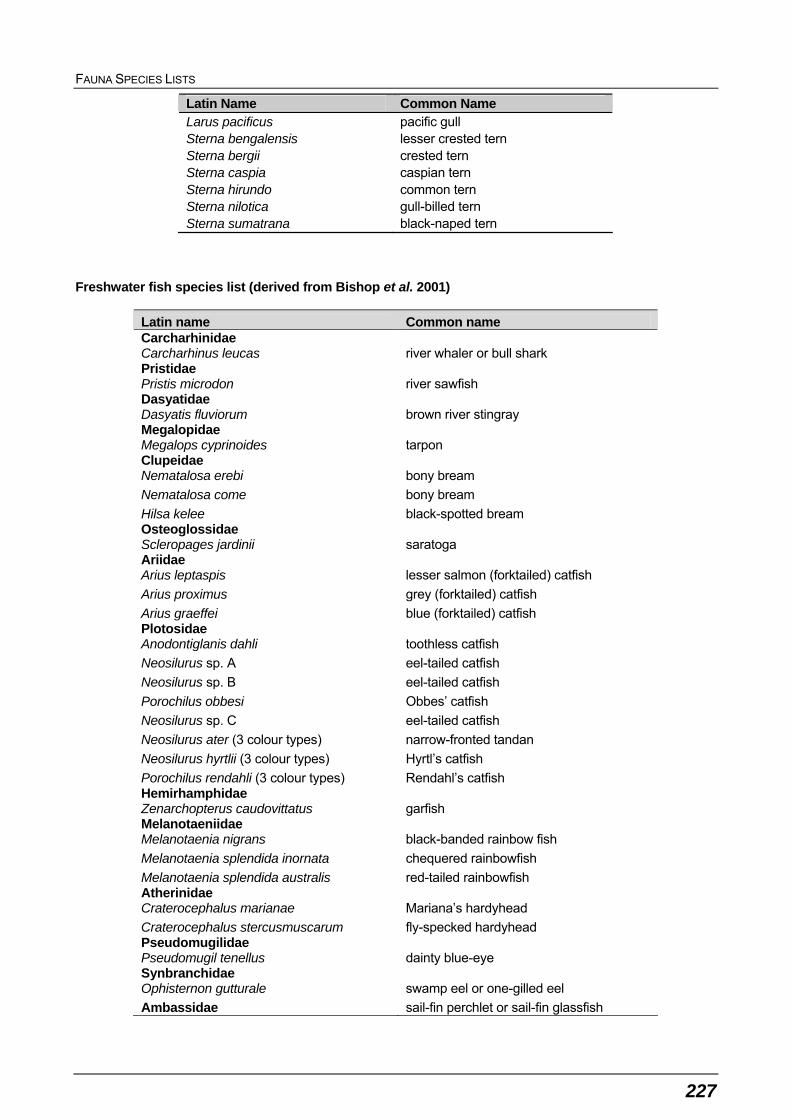
FAUNA SPECIES LISTS
227
Latin Name Common Name Larus pacificus pacific gull Sterna bengalensis lesser crested tern Sterna bergii crested tern Sterna caspia caspian tern Sterna hirundo common tern Sterna nilotica gull-billed tern Sterna sumatrana black-naped tern
Freshwater fish species list (derived from Bishop et al. 2001)
Latin name Common name Carcharhinidae Carcharhinus leucas river whaler or bull shark Pristidae Pristis microdon river sawfish Dasyatidae Dasyatis fluviorum brown river stingray Megalopidae Megalops cyprinoides tarpon Clupeidae Nematalosa erebi bony bream
Nematalosa come bony bream
Hilsa kelee black-spotted bream Osteoglossidae Scleropages jardinii saratoga Ariidae Arius leptaspis lesser salmon (forktailed) catfish
Arius proximus grey (forktailed) catfish
Arius graeffei blue (forktailed) catfish Plotosidae Anodontiglanis dahli toothless catfish
Neosilurus sp. A eel-tailed catfish
Neosilurus sp. B eel-tailed catfish
Porochilus obbesi Obbes’ catfish
Neosilurus sp. C eel-tailed catfish
Neosilurus ater (3 colour types) narrow-fronted tandan
Neosilurus hyrtlii (3 colour types) Hyrtl’s catfish
Porochilus rendahli (3 colour types) Rendahl’s catfish Hemirhamphidae Zenarchopterus caudovittatus garfish Melanotaeniidae Melanotaenia nigrans black-banded rainbow fish
Melanotaenia splendida inornata chequered rainbowfish
Melanotaenia splendida australis red-tailed rainbowfish Atherinidae Craterocephalus marianae Mariana’s hardyhead
Craterocephalus stercusmuscarum fly-specked hardyhead Pseudomugilidae Pseudomugil tenellus dainty blue-eye Synbranchidae Ophisternon gutturale swamp eel or one-gilled eel
Ambassidae sail-fin perchlet or sail-fin glassfish
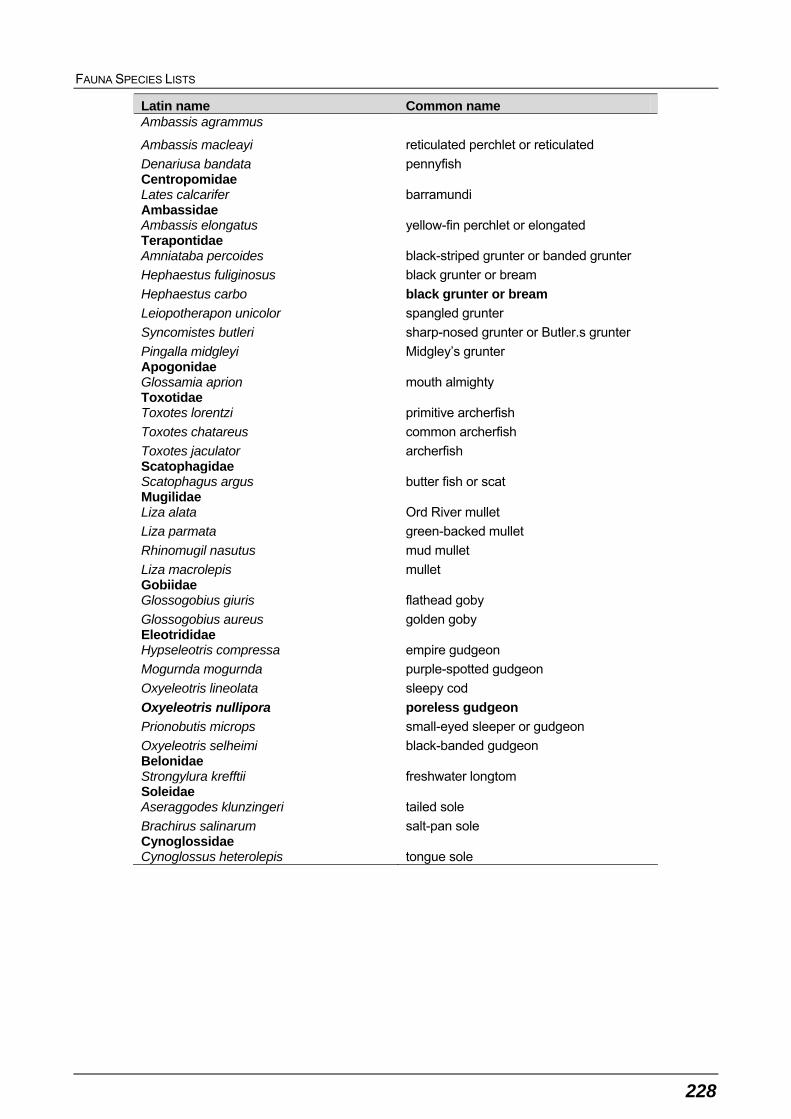
FAUNA SPECIES LISTS
228
Latin name Common name Ambassis agrammus
Ambassis macleayi reticulated perchlet or reticulated
Denariusa bandata pennyfish Centropomidae Lates calcarifer barramundi Ambassidae Ambassis elongatus yellow-fin perchlet or elongated Terapontidae Amniataba percoides black-striped grunter or banded grunter
Hephaestus fuliginosus black grunter or bream
Hephaestus carbo black grunter or bream
Leiopotherapon unicolor spangled grunter
Syncomistes butleri sharp-nosed grunter or Butler.s grunter
Pingalla midgleyi Midgley’s grunter Apogonidae Glossamia aprion mouth almighty Toxotidae Toxotes lorentzi primitive archerfish
Toxotes chatareus common archerfish
Toxotes jaculator archerfish Scatophagidae Scatophagus argus butter fish or scat Mugilidae Liza alata Ord River mullet
Liza parmata green-backed mullet
Rhinomugil nasutus mud mullet
Liza macrolepis mullet Gobiidae Glossogobius giuris flathead goby
Glossogobius aureus golden goby Eleotrididae Hypseleotris compressa empire gudgeon
Mogurnda mogurnda purple-spotted gudgeon
Oxyeleotris lineolata sleepy cod
Oxyeleotris nullipora poreless gudgeon
Prionobutis microps small-eyed sleeper or gudgeon
Oxyeleotris selheimi black-banded gudgeon Belonidae Strongylura krefftii freshwater longtom Soleidae Aseraggodes klunzingeri tailed sole
Brachirus salinarum salt-pan sole Cynoglossidae Cynoglossus heterolepis tongue sole
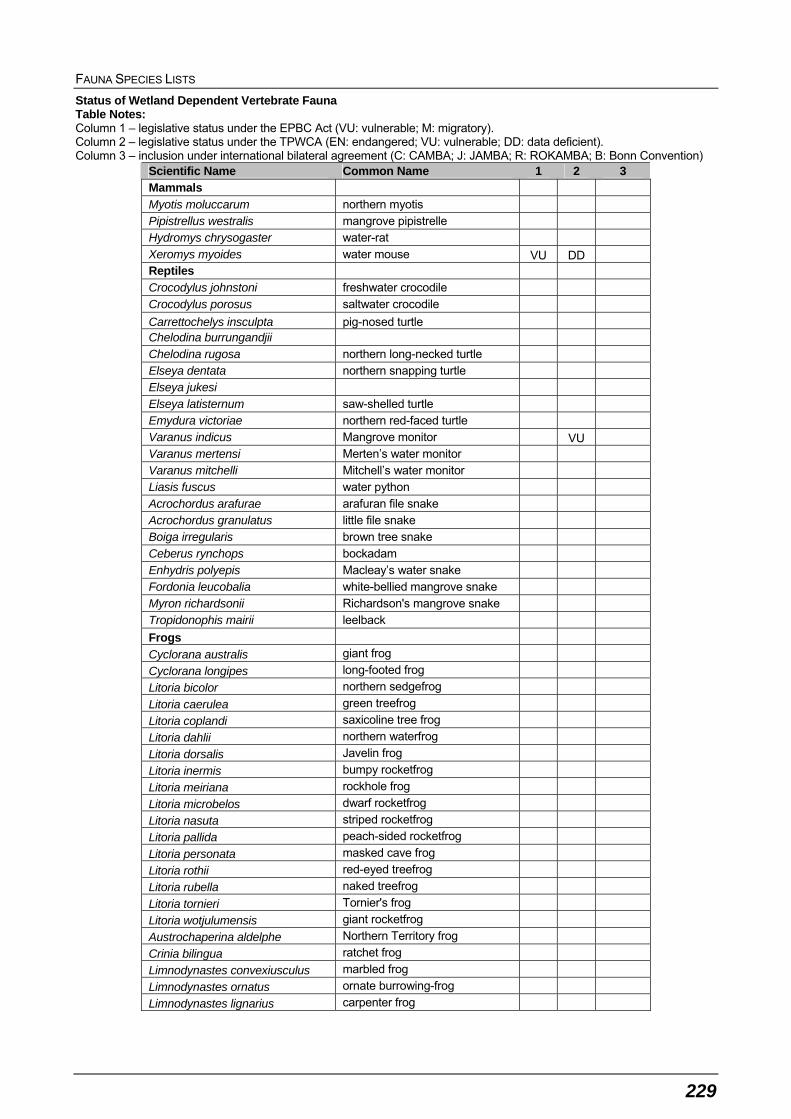
FAUNA SPECIES LISTS
229
Status of Wetland Dependent Vertebrate Fauna Table Notes: Column 1 – legislative status under the EPBC Act (VU: vulnerable; M: migratory). Column 2 – legislative status under the TPWCA (EN: endangered; VU: vulnerable; DD: data deficient). Column 3 – inclusion under international bilateral agreement (C: CAMBA; J: JAMBA; R: ROKAMBA; B: Bonn Convention)
Scientific Name Common Name 1 2 3 Mammals Myotis moluccarum northern myotis Pipistrellus westralis mangrove pipistrelle Hydromys chrysogaster water-rat Xeromys myoides water mouse VU DD Reptiles Crocodylus johnstoni freshwater crocodile Crocodylus porosus saltwater crocodile Carrettochelys insculpta pig-nosed turtle Chelodina burrungandjii Chelodina rugosa northern long-necked turtle Elseya dentata northern snapping turtle Elseya jukesi Elseya latisternum saw-shelled turtle Emydura victoriae northern red-faced turtle Varanus indicus Mangrove monitor VU Varanus mertensi Merten’s water monitor Varanus mitchelli Mitchell’s water monitor Liasis fuscus water python Acrochordus arafurae arafuran file snake Acrochordus granulatus little file snake Boiga irregularis brown tree snake Ceberus rynchops bockadam Enhydris polyepis Macleay’s water snake Fordonia leucobalia white-bellied mangrove snake Myron richardsonii Richardson's mangrove snake Tropidonophis mairii leelback Frogs
Cyclorana australis giant frog Cyclorana longipes long-footed frog Litoria bicolor northern sedgefrog
Litoria caerulea green treefrog Litoria coplandi saxicoline tree frog Litoria dahlii northern waterfrog
Litoria dorsalis Javelin frog Litoria inermis bumpy rocketfrog Litoria meiriana rockhole frog
Litoria microbelos dwarf rocketfrog Litoria nasuta striped rocketfrog Litoria pallida peach-sided rocketfrog
Litoria personata masked cave frog Litoria rothii red-eyed treefrog Litoria rubella naked treefrog
Litoria tornieri Tornier's frog Litoria wotjulumensis giant rocketfrog Austrochaperina aldelphe Northern Territory frog
Crinia bilingua ratchet frog Limnodynastes convexiusculus marbled frog Limnodynastes ornatus ornate burrowing-frog
Limnodynastes lignarius carpenter frog
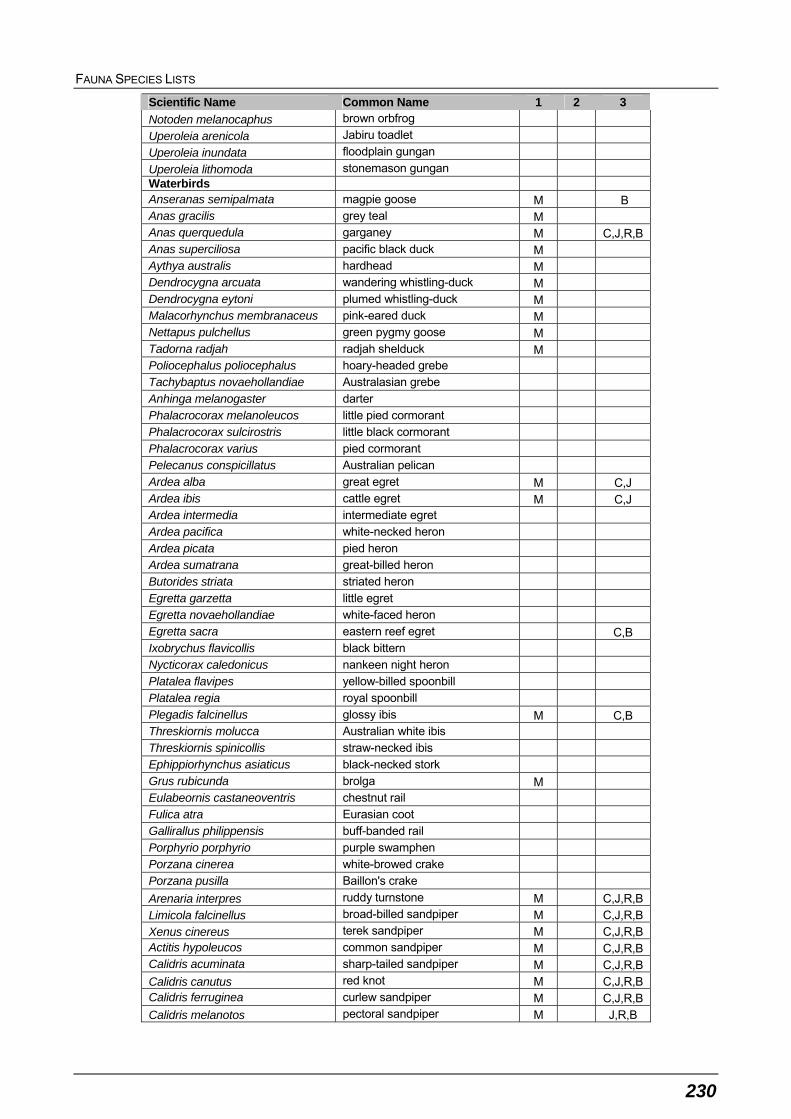
FAUNA SPECIES LISTS
230
Scientific Name Common Name 1 2 3
Notoden melanocaphus brown orbfrog Uperoleia arenicola Jabiru toadlet Uperoleia inundata floodplain gungan
Uperoleia lithomoda stonemason gungan Waterbirds Anseranas semipalmata magpie goose M B Anas gracilis grey teal M Anas querquedula garganey M C,J,R,B Anas superciliosa pacific black duck M Aythya australis hardhead M Dendrocygna arcuata wandering whistling-duck M Dendrocygna eytoni plumed whistling-duck M Malacorhynchus membranaceus pink-eared duck M Nettapus pulchellus green pygmy goose M Tadorna radjah radjah shelduck M Poliocephalus poliocephalus hoary-headed grebe Tachybaptus novaehollandiae Australasian grebe Anhinga melanogaster darter Phalacrocorax melanoleucos little pied cormorant Phalacrocorax sulcirostris little black cormorant Phalacrocorax varius pied cormorant Pelecanus conspicillatus Australian pelican Ardea alba great egret M C,J Ardea ibis cattle egret M C,J Ardea intermedia intermediate egret Ardea pacifica white-necked heron Ardea picata pied heron Ardea sumatrana great-billed heron Butorides striata striated heron Egretta garzetta little egret Egretta novaehollandiae white-faced heron Egretta sacra eastern reef egret C,B Ixobrychus flavicollis black bittern Nycticorax caledonicus nankeen night heron Platalea flavipes yellow-billed spoonbill Platalea regia royal spoonbill Plegadis falcinellus glossy ibis M C,B Threskiornis molucca Australian white ibis Threskiornis spinicollis straw-necked ibis Ephippiorhynchus asiaticus black-necked stork Grus rubicunda brolga M Eulabeornis castaneoventris chestnut rail Fulica atra Eurasian coot Gallirallus philippensis buff-banded rail Porphyrio porphyrio purple swamphen Porzana cinerea white-browed crake Porzana pusilla Baillon's crake
Arenaria interpres ruddy turnstone M C,J,R,B Limicola falcinellus broad-billed sandpiper M C,J,R,B Xenus cinereus terek sandpiper M C,J,R,B Actitis hypoleucos common sandpiper M C,J,R,B Calidris acuminata sharp-tailed sandpiper M C,J,R,B Calidris canutus red knot M C,J,R,B Calidris ferruginea curlew sandpiper M C,J,R,B Calidris melanotos pectoral sandpiper M J,R,B

FAUNA SPECIES LISTS
231
Scientific Name Common Name 1 2 3
Calidris ruficollis red-necked stint M C,J,R,B Calidris tenuirostris great knot M C,J,R,B Gallinago hardwickii Latham's snipe M C,J,R,B Gallinago megala Swinhoe’s snipe M C,J,R,B Heteroscelus brevipes grey-tailed tattler M C,J,R,B Limosa lapponica bar-tailed godwit M C,J,R,B Limosa limosa black-tailed godwit M C,J,R,B Numenius madagascariensis eastern curlew M C,J,R,B Numenius minutus little curlew M C,J,R,B
Numenius phaeopus whimbrel M C,J,R,B Tringa glareola wood sandpiper M C,J,R,B Tringa nebularia common greenshank M C,J,R,B
Tringa stagnatilis marsh sandpiper M C,J,R,B Tringa totanus common redshank M C,R,B Irediparra gallinacea comb-crested jacana Esacus neglectus beach stone-curlew Haematopus fuliginosus sooty oystercatcher Haematopus longirostris pied oystercatcher Himantopus himantopus black-winged stilt M Recurvirostra novaehollandiae red-necked avocet M Charadrius dubius little ringed plover M C,J,R,B Charadrius hiaticula ringed plover M C,J,R,B Charadrius ruficapillus red-capped plover M Charadrius leschenaultii greater sand plover M C,J,R,B Mongolus mongolus lesser sand plover M C,J,R,B Charadrius veredus oriental plover M R,B Elseyornis melanops black-fronted dotterel M Erythrogonys cinctus red-kneed dotterel M Pluvialis squatarola grey plover M C,J,R,B Vanellus miles masked lapwing M Glareola maldivarum oiental pratincole C,J,R,B Stiltia isabella Australian pratincole Chlidonias hybridus whiskered tern Chlidonias leucopterus white-winged black tern M C,J,R,B Larus novaehollandiae silver gull Larus pacificus pacific gull Sterna bengalensis lesser crested tern C Sterna bergii crested tern J Sterna caspia caspian tern M C Sterna hirundo common tern M C,J,R,B Sterna nilotica gull-billed tern Sterna sumatrana black-naped tern M C,J,B Non-waterbirds Pandion haliaetus osprey M B Haliaeetus leucogaster white-bellied sea-eagle M C,B Haliastur indus brahminy kite M Alcedo azurea azure kingfisher Alcedo pusilla little kingfisher Todiramphus chloris collared kingfisher Epthianura crocea tunneyi yellow chat VU EN Eopsaltria pulverulenta mangrove robin Pachycephala lanioides white-breasted whistler Pachycephala melanura mangrove golden whistler Rhipidura phasiana mangrove grey fantail Myiagra alecto shining flycatcher

ENDEMIC SPECIES DISTRIBUTIONS
232
APPENDIX D: ENDEMIC SPECIES DISTRIBUTIONS
Figure D1 Records of the endemic shrimp family Kakaducarididae (source: Page et al.
2008)
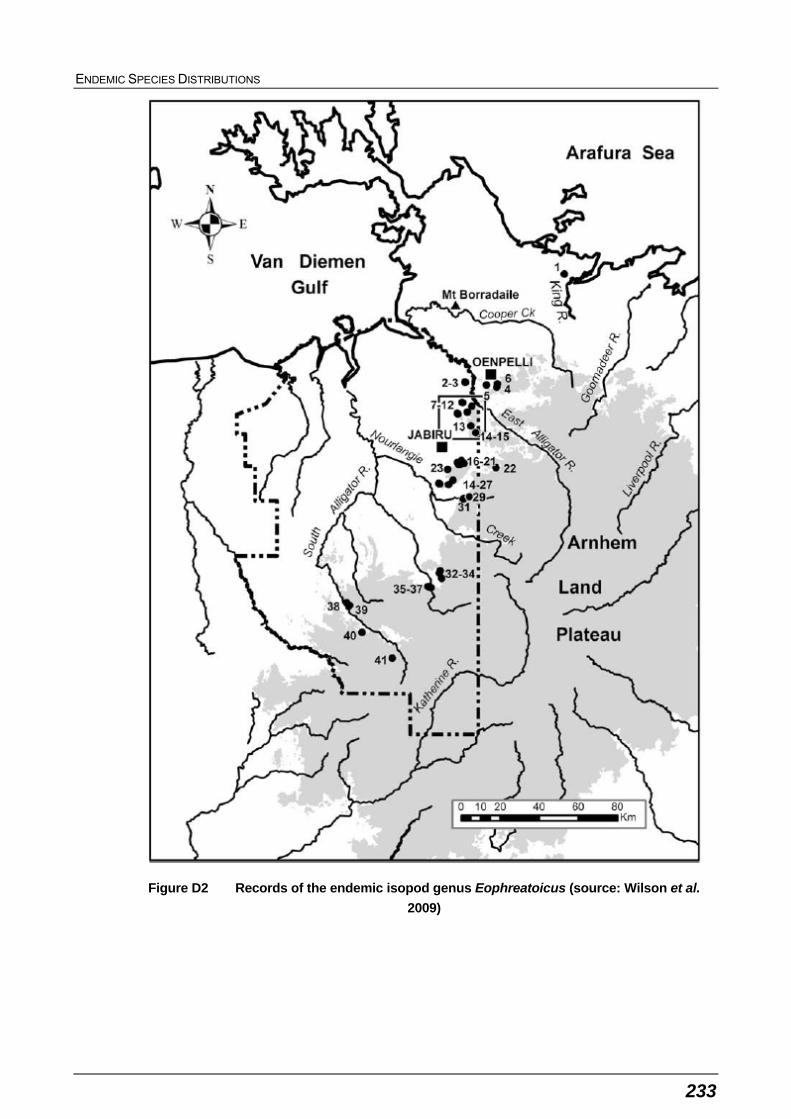
ENDEMIC SPECIES DISTRIBUTIONS
233
Figure D2 Records of the endemic isopod genus Eophreatoicus (source: Wilson et al.
2009)
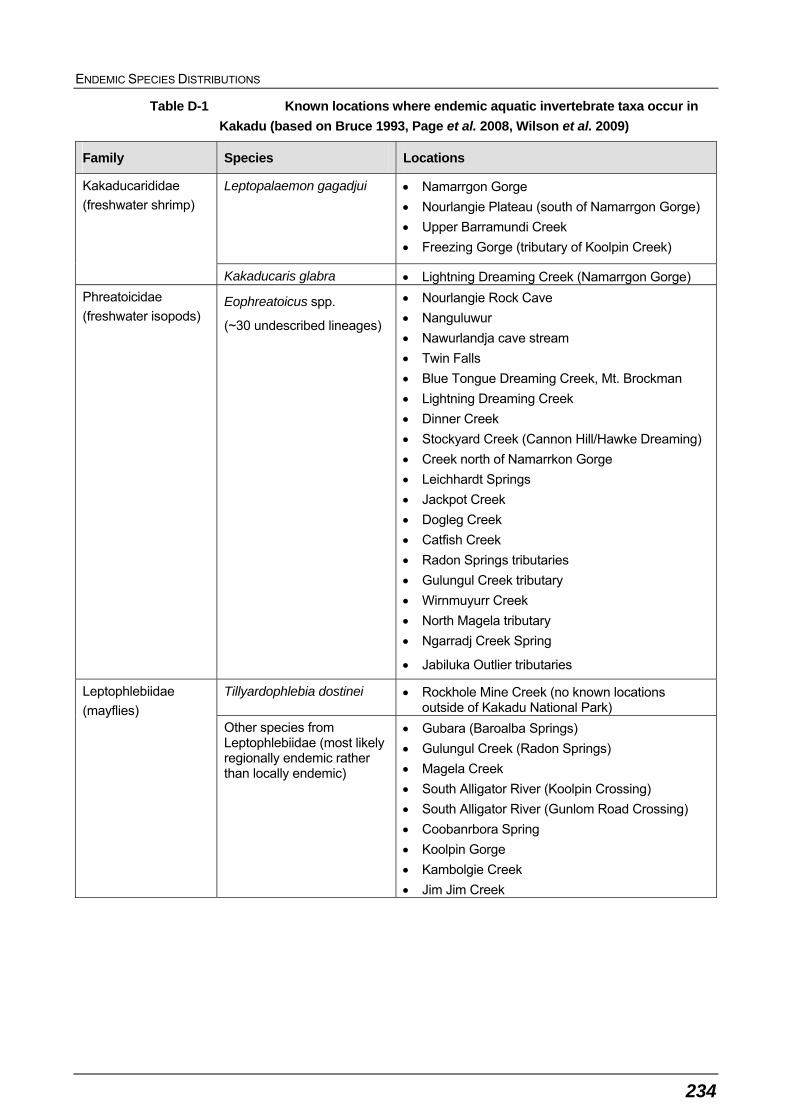
ENDEMIC SPECIES DISTRIBUTIONS
234
Table D-1 Known locations where endemic aquatic invertebrate taxa occur in
Kakadu (based on Bruce 1993, Page et al. 2008, Wilson et al. 2009)
Family Species Locations
Leptopalaemon gagadjui Namarrgon Gorge
Nourlangie Plateau (south of Namarrgon Gorge)
Upper Barramundi Creek
Freezing Gorge (tributary of Koolpin Creek)
Kakaducarididae
(freshwater shrimp)
Kakaducaris glabra Lightning Dreaming Creek (Namarrgon Gorge)
Phreatoicidae
(freshwater isopods) Eophreatoicus spp.
(~30 undescribed lineages)
Nourlangie Rock Cave
Nanguluwur
Nawurlandja cave stream
Twin Falls
Blue Tongue Dreaming Creek, Mt. Brockman
Lightning Dreaming Creek
Dinner Creek
Stockyard Creek (Cannon Hill/Hawke Dreaming)
Creek north of Namarrkon Gorge
Leichhardt Springs
Jackpot Creek
Dogleg Creek
Catfish Creek
Radon Springs tributaries
Gulungul Creek tributary
Wirnmuyurr Creek
North Magela tributary
Ngarradj Creek Spring
Jabiluka Outlier tributaries
Tillyardophlebia dostinei Rockhole Mine Creek (no known locations outside of Kakadu National Park)
Leptophlebiidae
(mayflies) Other species from Leptophlebiidae (most likely regionally endemic rather than locally endemic)
Gubara (Baroalba Springs)
Gulungul Creek (Radon Springs)
Magela Creek
South Alligator River (Koolpin Crossing)
South Alligator River (Gunlom Road Crossing)
Coobanrbora Spring
Koolpin Gorge
Kambolgie Creek
Jim Jim Creek
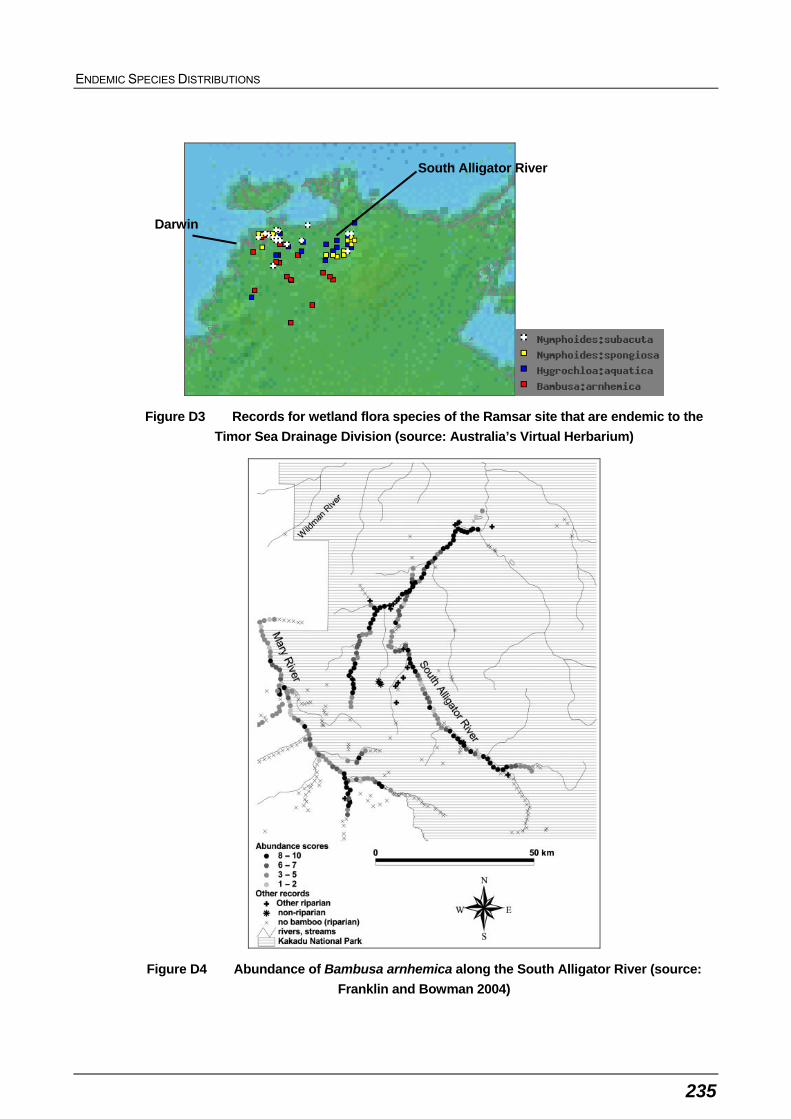
ENDEMIC SPECIES DISTRIBUTIONS
235
Figure D3 Records for wetland flora species of the Ramsar site that are endemic to the
Timor Sea Drainage Division (source: Australia’s Virtual Herbarium)
Figure D4 Abundance of Bambusa arnhemica along the South Alligator River (source:
Franklin and Bowman 2004)
South Alligator River
Darwin
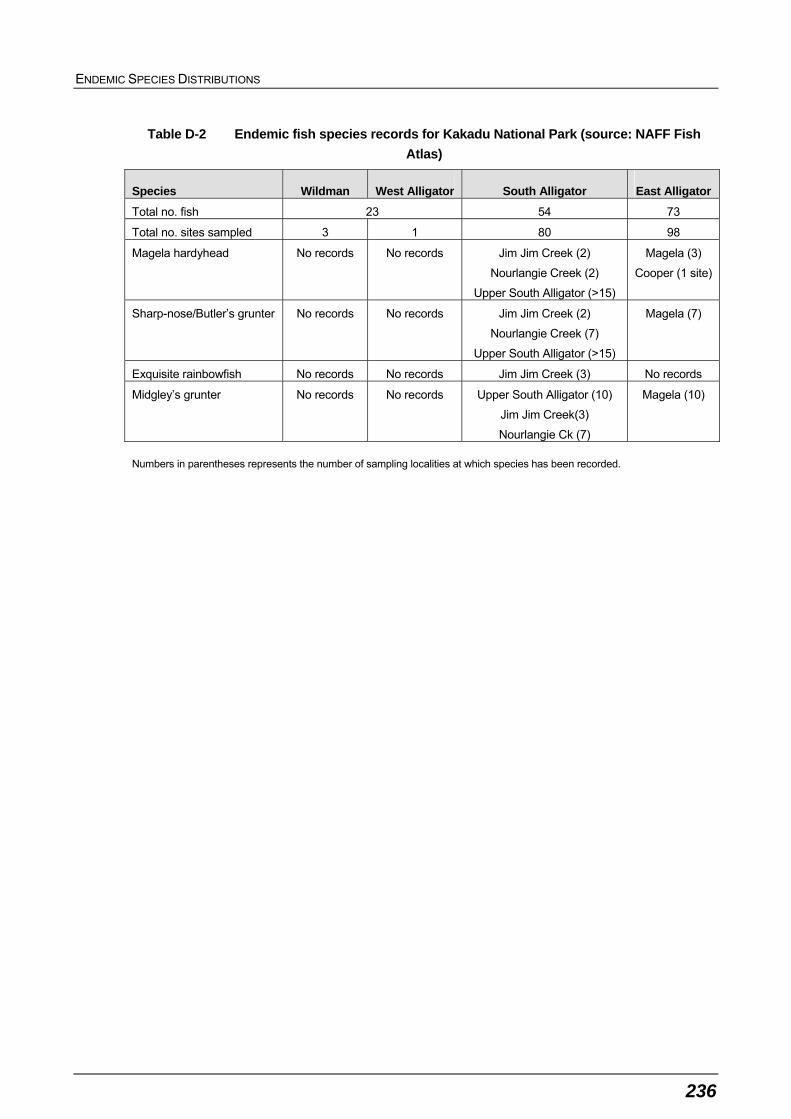
ENDEMIC SPECIES DISTRIBUTIONS
236
Table D-2 Endemic fish species records for Kakadu National Park (source: NAFF Fish
Atlas)
Species Wildman West Alligator South Alligator East Alligator
Total no. fish 23 54 73
Total no. sites sampled 3 1 80 98
Magela hardyhead No records No records Jim Jim Creek (2)
Nourlangie Creek (2)
Upper South Alligator (>15)
Magela (3)
Cooper (1 site)
Sharp-nose/Butler’s grunter No records No records Jim Jim Creek (2)
Nourlangie Creek (7)
Upper South Alligator (>15)
Magela (7)
Exquisite rainbowfish No records No records Jim Jim Creek (3) No records
Midgley’s grunter No records No records Upper South Alligator (10)
Jim Jim Creek(3)
Nourlangie Ck (7)
Magela (10)
Numbers in parentheses represents the number of sampling localities at which species has been recorded.

CURRICULUM VITAE OF PRIMARY AUTHORS
237
APPENDIX E: CURRICULUM VITAE OF PRIMARY AUTHORS

CURRICULUM VITAE OF PRIMARY AUTHORS
238
CURRICULUM VITAE OF PRIMARY AUTHORS
239

CURRICULUM VITAE OF PRIMARY AUTHORS
240
CURRICULUM VITAE OF PRIMARY AUTHORS
241
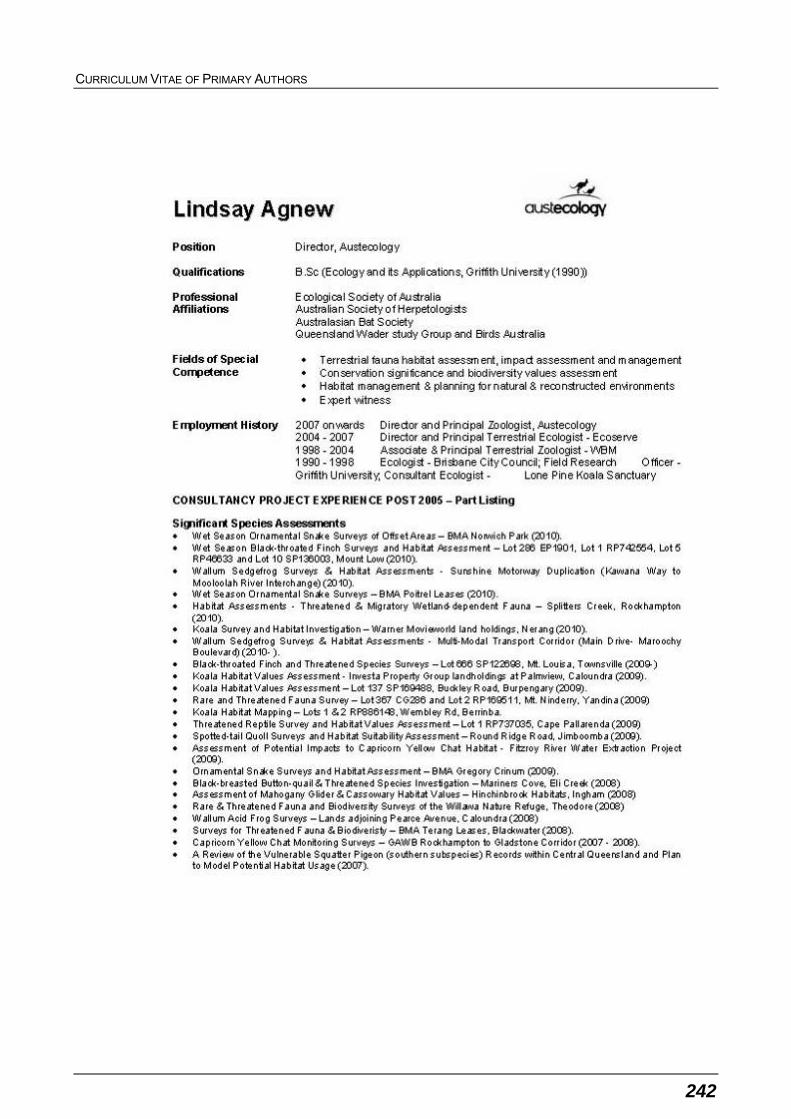
CURRICULUM VITAE OF PRIMARY AUTHORS
242

CURRICULUM VITAE OF PRIMARY AUTHORS
243

CURRICULUM VITAE OF PRIMARY AUTHORS
244
CURRICULUM VITAE OF PRIMARY AUTHORS
245

CURRICULUM VITAE OF PRIMARY AUTHORS
246
CURRICULUM VITAE OF PRIMARY AUTHORS
247

CURRICULUM VITAE OF PRIMARY AUTHORS
248
CURRICULUM VITAE OF PRIMARY AUTHORS
249
CURRICULUM VITAE OF PRIMARY AUTHORS
250
CURRICULUM VITAE OF PRIMARY AUTHORS
251
BMT WBM Brisbane Level 11, 490 Upper Edward Street Brisbane 4000 PO Box 203 Spring Hill QLD 4004 Tel +61 7 3831 6744 Fax +61 7 3832 3627 Email [email protected] Web www.wbmpl.com.au
BMT WBM Denver 14 Inverness Drive East, #B132 Englewood Denver Colorado 80112 USA Tel +1 303 792 9814 Fax +1 303 792 9742 Email [email protected] Web www.wbmpl.com.au
BMT WBM Melbourne Level 5, 99 King Street Melbourne 3000 PO Box 604 Collins Street West VIC 8007 Tel +61 3 8620 6100 Fax +61 3 8620 6105 Email [email protected] Web www.wbmpl.com.au
BMT WBM Morwell Cnr Hazelwood Drive and Miners Way Morwell 3840 PO Box 888 Morwell VIC 3840 Tel +61 3 5135 3400 Fax +61 3 5135 3444 Email [email protected] Web www.wbmpl.com.au
BMT WBM Newcastle 126 Belford Street Broadmeadow 2292 PO Box 266 Broadmeadow NSW 2292 Tel +61 2 4940 8882 Fax +61 2 4940 8887 Email [email protected] Web www.wbmpl.com.au
BMT WBM Perth 1 Brodie Hall Drive Technology Park Bentley 6102 Tel +61 8 9328 2029 Fax +61 8 9486 7588 Email [email protected] Web www.wbmpl.com.au
BMT WBM Sydney Suite 206, 118 Great North Road Five Dock 2046 PO Box 129 Five Dock NSW 2046 Tel +61 2 9713 4836 Fax +61 2 9713 4890 Email [email protected] Web www.wbmpl.com.au
BMT WBM Vancouver 1190 Melville Street #700 Vancouver British Columbia V6E 3W1 Canada Tel +1 604 683 5777 Fax +1 604 608 3232 Email [email protected] Web www.wbmpl.com.au