Kaizen Hedged Premium Spreads Fund - … Hedged Premium Spreads Fund ... Cott Beverages, Inc....
48
Kaizen Hedged Premium Spreads Fund Class I (KZSIX) Altrius Enhanced Income Fund Class I (KEUIX) MarketGrader 100 Enhanced Index Fund Class I (KHMIX) SEMI-ANNUAL REPORT JUNE 30, 2017
Transcript of Kaizen Hedged Premium Spreads Fund - … Hedged Premium Spreads Fund ... Cott Beverages, Inc....
Kaizen Hedged Premium Spreads Fund Class I (KZSIX)
Altrius Enhanced Income Fund Class I (KEUIX)
MarketGrader 100 Enhanced Index Fund Class I (KHMIX)
SEMI-ANNUAL REPORT JUNE 30, 2017

Kaizen Funds Each a series of Investment Managers Series Trust II
This report and the financial statements contained herein are provided for the general information of the shareholders of the Kaizen Funds. This report is not authorized for distribution to prospective investors in the Funds unless preceded or accompanied by an effective prospectus.
www.kaizenfunds.com
Table of Contents Schedule of Investments ............................................................................................................................... 1
Statements of Assets and Liabilities ........................................................................................................... 19
Statements of Operations ........................................................................................................................... 20
Statements of Changes in Net Assets ......................................................................................................... 21
Financial Highlights ..................................................................................................................................... 24
Notes to Financial Statements .................................................................................................................... 27
Expense Examples ....................................................................................................................................... 41
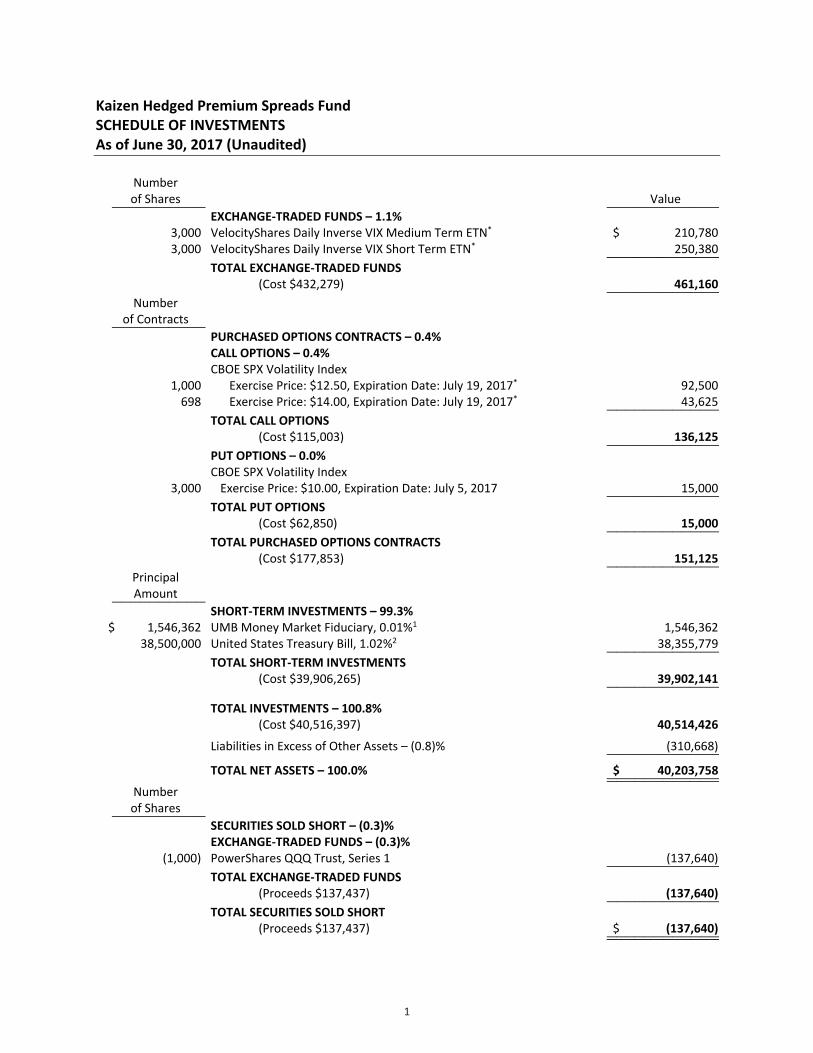
Kaizen Hedged Premium Spreads Fund SCHEDULE OF INVESTMENTS As of June 30, 2017 (Unaudited)
Number of Shares Value __________ ____________
EXCHANGE-TRADED FUNDS – 1.1%
3,000 VelocityShares Daily Inverse VIX Medium Term ETN* $ 210,780
3,000 VelocityShares Daily Inverse VIX Short Term ETN* 250,380 ____________
TOTAL EXCHANGE-TRADED FUNDS (Cost $432,279) 461,160 ____________
Number
of Contracts __________ PURCHASED OPTIONS CONTRACTS – 0.4%
CALL OPTIONS – 0.4%
CBOE SPX Volatility Index 1,000 Exercise Price: $12.50, Expiration Date: July 19, 2017* 92,500
698 Exercise Price: $14.00, Expiration Date: July 19, 2017* 43,625 ____________
TOTAL CALL OPTIONS (Cost $115,003) 136,125 ____________
PUT OPTIONS – 0.0%
CBOE SPX Volatility Index 3,000 Exercise Price: $10.00, Expiration Date: July 5, 2017 15,000 ____________
TOTAL PUT OPTIONS (Cost $62,850) 15,000 ____________
TOTAL PURCHASED OPTIONS CONTRACTS (Cost $177,853) 151,125 ____________
Principal Amount __________
SHORT-TERM INVESTMENTS – 99.3%
$ 1,546,362 UMB Money Market Fiduciary, 0.01%1 1,546,362
38,500,000 United States Treasury Bill, 1.02%2 38,355,779 ____________
TOTAL SHORT-TERM INVESTMENTS (Cost $39,906,265) 39,902,141 ____________
TOTAL INVESTMENTS – 100.8% (Cost $40,516,397) 40,514,426
Liabilities in Excess of Other Assets – (0.8)% (310,668) ____________ TOTAL NET ASSETS – 100.0% $ 40,203,758 ________________________
Number of Shares __________
SECURITIES SOLD SHORT – (0.3)%
EXCHANGE-TRADED FUNDS – (0.3)%
(1,000) PowerShares QQQ Trust, Series 1 (137,640) ____________
TOTAL EXCHANGE-TRADED FUNDS (Proceeds $137,437) (137,640) ____________
TOTAL SECURITIES SOLD SHORT (Proceeds $137,437) $ (137,640) ________________________
1

Kaizen Hedged Premium Spreads Fund SCHEDULE OF INVESTMENTS - Continued As of June 30, 2017 (Unaudited)
Number
of Contracts Value __________ ____________ WRITTEN OPTIONS CONTRACTS – 0.0%
PUT OPTIONS – 0.0%
CBOE SPX Volatility Index (3,000) Exercise Price: $9.50, Expiration Date: July 5, 2017 $ (6,000) ____________
TOTAL PUT OPTIONS (Proceeds $3,150) (6,000) ____________
TOTAL WRITTEN OPTIONS CONTRACTS (Proceeds $3,150) $ (6,000) ________________________
ETN – Exchange Traded Note * Non-income producing security. 1 The rate is the annualized seven-day yield at period end. 2 Segregated as collateral for open written options contracts.
See accompanying Notes to Financial Statements.
2

As of June 30, 2017 (Unaudited)
FUTURES CONTRACTS
Number of UnrealizedContracts Expiration Value at Value at Appreciation
Long (Short) Description Date Trade Date June 30, 2017 (Depreciation)
63 CBOE SPX Volatility Index July 2017 741,103$ 776,475$ 35,372$ (45) CBOE SPX Volatility Index August 2017 (630,448) (570,375) 60,073 (50) CBOE SPX Volatility Index September 2017 (674,893) (683,750) (8,857) (25) E-mini Nasdaq 100 September 2017 (2,872,840) (2,826,375) 46,465 35 E-mini S&P 500 September 2017 4,238,315 4,236,575 (1,740)
TOTAL FUTURES CONTRACTS 801,237$ 932,550$ 131,313$
Kaizen Hedged Premium Spreads FundSCHEDULE OF INVESTMENTS - Continued
See accompanying Notes to Financial Statements.
3

Kaizen Hedged Premium Spreads Fund SUMMARY OF INVESTMENTS As of June 30, 2017 (Unaudited)
Security Type Percent of Total
Net Assets Short-Term Investments 99.3% Exchange-Traded Funds 1.1% Purchased Options Contracts 0.4% __________Total Investments 100.8% Liabilities in Excess of Other Assets (0.8)% __________Total Net Assets 100.0% ____________________
See accompanying Notes to Financial Statements.
4
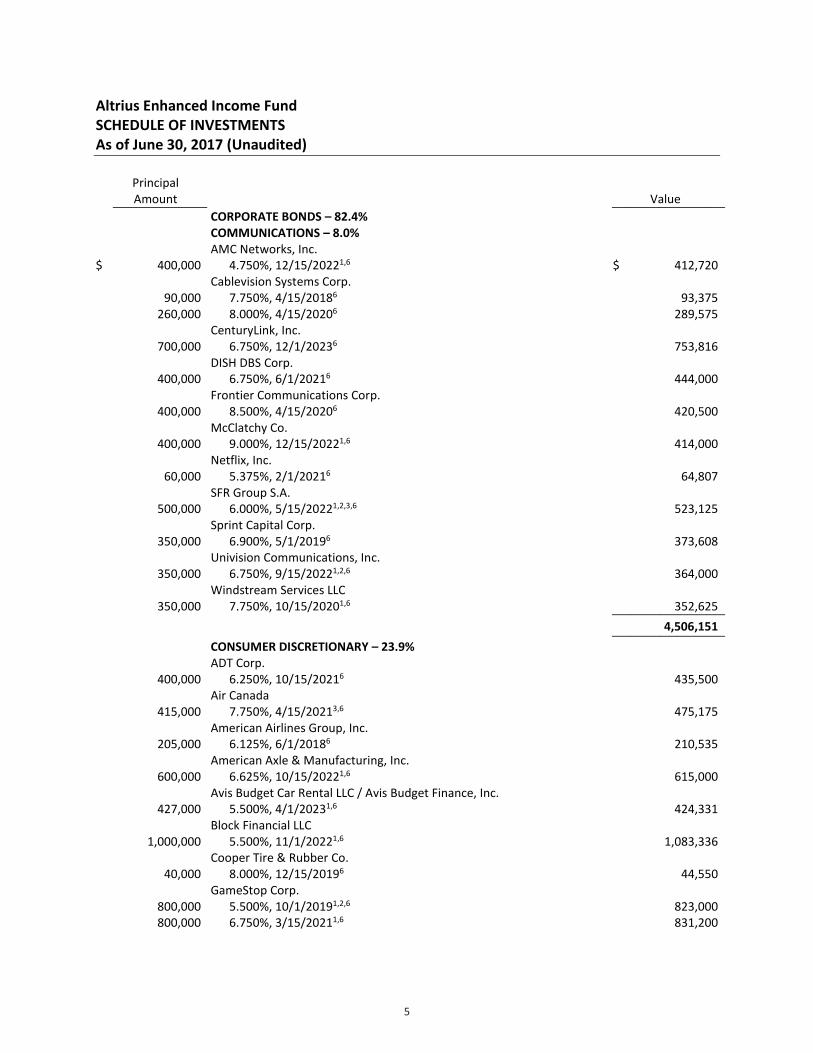
Altrius Enhanced Income Fund SCHEDULE OF INVESTMENTS As of June 30, 2017 (Unaudited)
Principal Amount Value __________ ____________
CORPORATE BONDS – 82.4%
COMMUNICATIONS – 8.0%
$ 400,000 AMC Networks, Inc.
4.750%, 12/15/20221,6 $ 412,720
Cablevision Systems Corp. 90,000 7.750%, 4/15/20186 93,375
260,000 8.000%, 4/15/20206 289,575
700,000 CenturyLink, Inc.
6.750%, 12/1/20236 753,816
400,000 DISH DBS Corp.
6.750%, 6/1/20216 444,000
400,000 Frontier Communications Corp.
8.500%, 4/15/20206 420,500
400,000 McClatchy Co.
9.000%, 12/15/20221,6 414,000
60,000 Netflix, Inc.
5.375%, 2/1/20216 64,807
500,000 SFR Group S.A.
6.000%, 5/15/20221,2,3,6 523,125
350,000 Sprint Capital Corp.
6.900%, 5/1/20196 373,608
350,000 Univision Communications, Inc.
6.750%, 9/15/20221,2,6 364,000
350,000 Windstream Services LLC
7.750%, 10/15/20201,6 352,625 ____________ 4,506,151 ____________ CONSUMER DISCRETIONARY – 23.9%
400,000 ADT Corp.
6.250%, 10/15/20216 435,500
415,000 Air Canada
7.750%, 4/15/20213,6 475,175
205,000 American Airlines Group, Inc.
6.125%, 6/1/20186 210,535
600,000 American Axle & Manufacturing, Inc.
6.625%, 10/15/20221,6 615,000
427,000 Avis Budget Car Rental LLC / Avis Budget Finance, Inc.
5.500%, 4/1/20231,6 424,331
1,000,000 Block Financial LLC
5.500%, 11/1/20221,6 1,083,336
40,000 Cooper Tire & Rubber Co.
8.000%, 12/15/20196 44,550
GameStop Corp. 800,000 5.500%, 10/1/20191,2,6 823,000
800,000 6.750%, 3/15/20211,6 831,200
5

Altrius Enhanced Income Fund SCHEDULE OF INVESTMENTS - Continued As of June 30, 2017 (Unaudited)
Principal Amount Value __________ ____________
CORPORATE BONDS (Continued) CONSUMER DISCRETIONARY (Continued)
$ 405,000 Gap, Inc.
5.950%, 4/12/20211,6 $ 439,009
600,000 Global Partners LP / GLP Finance Corp.
6.250%, 7/15/20221 603,000
40,000 Goodyear Tire & Rubber Co.
8.750%, 8/15/20206 47,000
Hertz Corp. 160,000 5.875%, 10/15/20201,6 154,800
290,000 7.375%, 1/15/20211,6 279,850
144,000 International Game Technology
5.500%, 6/15/20206 149,328
J.C. Penney Corp., Inc. 110,000 8.125%, 10/1/20196 120,175
70,000 5.650%, 6/1/20206 68,863
400,000 KB Home
8.000%, 3/15/20206 450,000
600,000 L Brands, Inc.
5.625%, 10/15/2023 640,500
600,000 LSC Communications, Inc.
8.750%, 10/15/20231,2,6 626,250
600,000 Men's Wearhouse, Inc.
7.000%, 7/1/20221 525,000
80,000 MGM Resorts International
6.750%, 10/1/20206 88,632
350,000 Penske Automotive Group, Inc.
5.750%, 10/1/20221,6 361,375
600,000 Quad/Graphics, Inc.
7.000%, 5/1/2022 610,998
600,000 Rent-A-Center, Inc.
6.625%, 11/15/20201,6 562,500
340,000 RR Donnelley & Sons Co.
7.625%, 6/15/20206 378,250
400,000 Ruby Tuesday, Inc.
7.625%, 5/15/20201,6 379,000
400,000 Sears Roebuck Acceptance Corp.
6.875%, 10/15/20176 367,188
52,000 ServiceMaster Co. LLC
7.100%, 3/1/20186 53,300
400,000 Sonic Automotive, Inc.
5.000%, 5/15/20231,6 380,500
600,000 Tempur Sealy International, Inc.
5.625%, 10/15/20231,6 622,500
400,000 Toys R Us, Inc.
7.375%, 10/15/20186 360,000
6

Altrius Enhanced Income Fund SCHEDULE OF INVESTMENTS - Continued As of June 30, 2017 (Unaudited)
Principal Amount Value __________ ____________
CORPORATE BONDS (Continued) CONSUMER DISCRETIONARY (Continued)
$ 215,000 Yum! Brands, Inc.
3.750%, 11/1/20211,6 $ 220,375 ____________ 13,431,020 ____________ CONSUMER STAPLES – 6.4%
300,000 Alliance One International, Inc.
9.875%, 7/15/20211,6 261,000
370,000 Avon Products, Inc.
6.500%, 3/1/20196 382,025
400,000 Central Garden & Pet Co.
6.125%, 11/15/20231,6 426,000
375,000 Cott Beverages, Inc.
5.375%, 7/1/20221,6 388,594
180,000 New Albertsons, Inc.
7.020%, 7/21/20176 180,000
400,000 Revlon Consumer Products Corp.
5.750%, 2/15/20211,6 368,000
600,000 Rite Aid Corp.
6.750%, 6/15/20211 616,200
372,000 Safeway, Inc.
4.750%, 12/1/2021 366,420
600,000 SUPERVALU, Inc.
7.750%, 11/15/20221 583,500 ____________ 3,571,739 ____________ ENERGY – 10.6%
280,000 Calumet Specialty Products Partners LP / Calumet Finance Corp.
7.625%, 1/15/20221,6 245,000
280,000 Carrizo Oil & Gas, Inc.
7.500%, 9/15/20201,6 284,900
199,000 CONSOL Energy, Inc.
8.250%, 4/1/20201,6 201,736
500,000 Denbury Resources, Inc.
6.375%, 8/15/20211,6 300,000
287,000 Era Group, Inc.
7.750%, 12/15/20221,6 257,583
350,000 Freeport-McMoran Oil & Gas LLC / FCX Oil & Gas, Inc.
6.125%, 6/15/20191,6 354,375
160,000 Harvest Operations Corp.
6.875%, 10/1/20173,6 159,600
Laredo Petroleum, Inc. 39,000 5.625%, 1/15/20221,6 37,830
305,000 7.375%, 5/1/20221,6 308,050
400,000 Martin Midstream Partners LP / Martin Midstream Finance Corp.
7.250%, 2/15/20211,6 404,000
7
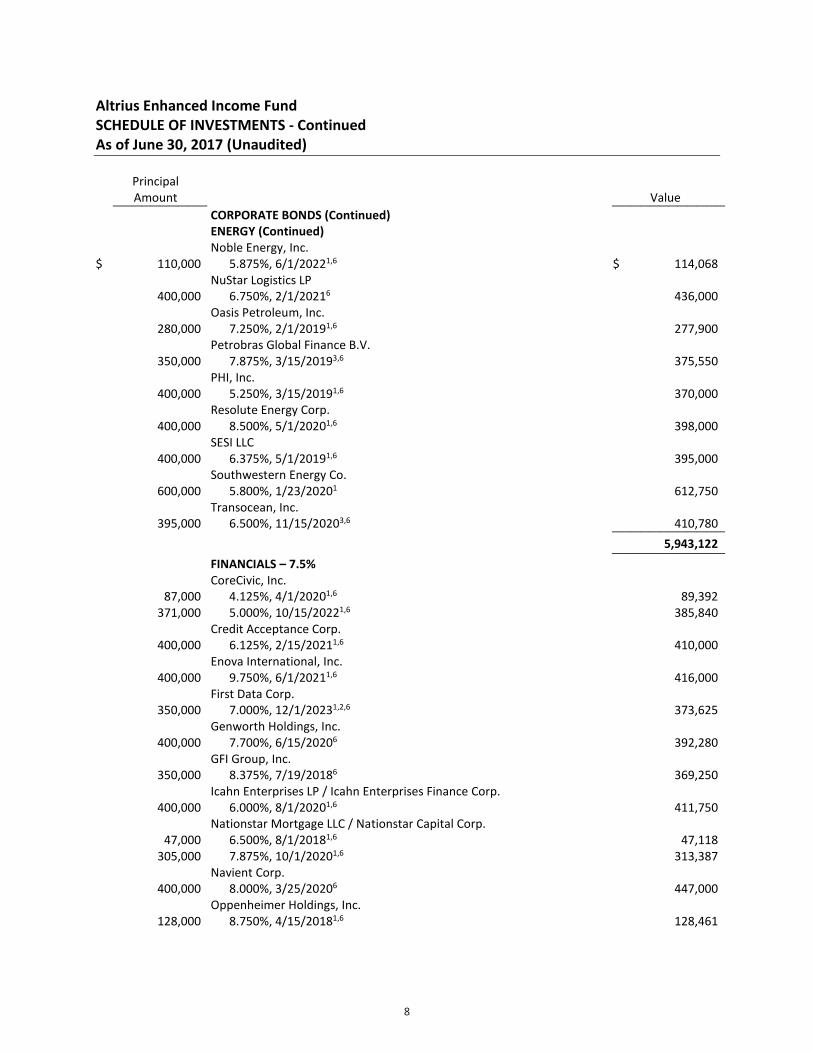
Altrius Enhanced Income Fund SCHEDULE OF INVESTMENTS - Continued As of June 30, 2017 (Unaudited)
Principal Amount Value __________ ____________
CORPORATE BONDS (Continued) ENERGY (Continued)
$ 110,000 Noble Energy, Inc.
5.875%, 6/1/20221,6 $ 114,068
400,000 NuStar Logistics LP
6.750%, 2/1/20216 436,000
280,000 Oasis Petroleum, Inc.
7.250%, 2/1/20191,6 277,900
350,000 Petrobras Global Finance B.V.
7.875%, 3/15/20193,6 375,550
400,000 PHI, Inc.
5.250%, 3/15/20191,6 370,000
400,000 Resolute Energy Corp.
8.500%, 5/1/20201,6 398,000
400,000 SESI LLC
6.375%, 5/1/20191,6 395,000
600,000 Southwestern Energy Co.
5.800%, 1/23/20201 612,750
395,000 Transocean, Inc.
6.500%, 11/15/20203,6 410,780 ____________ 5,943,122 ____________ FINANCIALS – 7.5%
CoreCivic, Inc. 87,000 4.125%, 4/1/20201,6 89,392
371,000 5.000%, 10/15/20221,6 385,840
400,000 Credit Acceptance Corp.
6.125%, 2/15/20211,6 410,000
400,000 Enova International, Inc.
9.750%, 6/1/20211,6 416,000
350,000 First Data Corp.
7.000%, 12/1/20231,2,6 373,625
400,000 Genworth Holdings, Inc.
7.700%, 6/15/20206 392,280
350,000 GFI Group, Inc.
8.375%, 7/19/20186 369,250
400,000 Icahn Enterprises LP / Icahn Enterprises Finance Corp.
6.000%, 8/1/20201,6 411,750
Nationstar Mortgage LLC / Nationstar Capital Corp. 47,000 6.500%, 8/1/20181,6 47,118
305,000 7.875%, 10/1/20201,6 313,387
400,000 Navient Corp.
8.000%, 3/25/20206 447,000
128,000 Oppenheimer Holdings, Inc.
8.750%, 4/15/20181,6 128,461
8
Altrius Enhanced Income Fund SCHEDULE OF INVESTMENTS - Continued As of June 30, 2017 (Unaudited)
Principal Amount Value __________ ____________
CORPORATE BONDS (Continued) FINANCIALS (Continued)
$ 400,000 Popular, Inc.
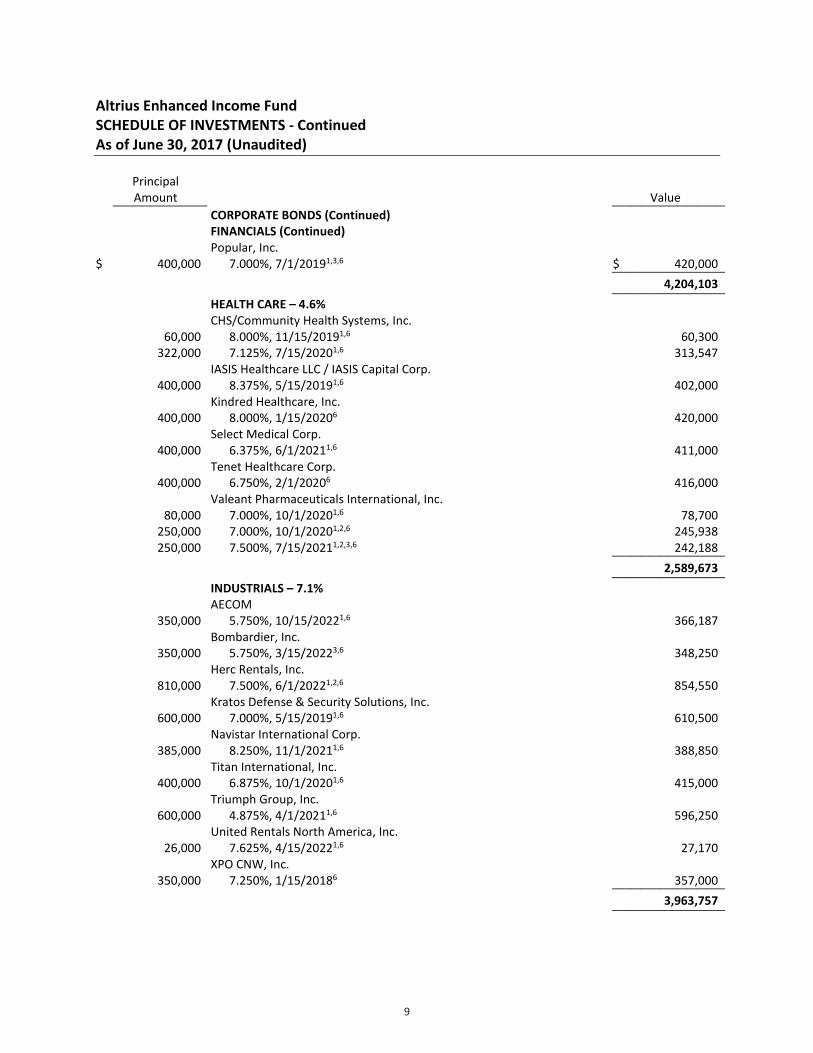
7.000%, 7/1/20191,3,6 $ 420,000 ____________ 4,204,103 ____________ HEALTH CARE – 4.6%
CHS/Community Health Systems, Inc. 60,000 8.000%, 11/15/20191,6 60,300
322,000 7.125%, 7/15/20201,6 313,547
400,000 IASIS Healthcare LLC / IASIS Capital Corp.
8.375%, 5/15/20191,6 402,000
400,000 Kindred Healthcare, Inc.
8.000%, 1/15/20206 420,000
400,000 Select Medical Corp.
6.375%, 6/1/20211,6 411,000
400,000 Tenet Healthcare Corp.
6.750%, 2/1/20206 416,000
Valeant Pharmaceuticals International, Inc. 80,000 7.000%, 10/1/20201,6 78,700
250,000 7.000%, 10/1/20201,2,6 245,938
250,000 7.500%, 7/15/20211,2,3,6 242,188 ____________ 2,589,673 ____________ INDUSTRIALS – 7.1%
350,000 AECOM
5.750%, 10/15/20221,6 366,187
350,000 Bombardier, Inc.
5.750%, 3/15/20223,6 348,250
810,000 Herc Rentals, Inc.
7.500%, 6/1/20221,2,6 854,550
600,000 Kratos Defense & Security Solutions, Inc.
7.000%, 5/15/20191,6 610,500
385,000 Navistar International Corp.
8.250%, 11/1/20211,6 388,850
400,000 Titan International, Inc.
6.875%, 10/1/20201,6 415,000
600,000 Triumph Group, Inc.
4.875%, 4/1/20211,6 596,250
26,000 United Rentals North America, Inc.
7.625%, 4/15/20221,6 27,170
350,000 XPO CNW, Inc.
7.250%, 1/15/20186 357,000 ____________ 3,963,757 ____________
9

Altrius Enhanced Income Fund SCHEDULE OF INVESTMENTS - Continued As of June 30, 2017 (Unaudited)
Principal Amount Value __________ ____________
CORPORATE BONDS (Continued) MATERIALS – 9.7%
$ 600,000 AK Steel Corp.
8.375%, 4/1/20221 $ 627,000
600,000 Allegheny Technologies, Inc.
5.950%, 1/15/20211 601,500
350,000 AngloGold Ashanti Holdings PLC
5.375%, 4/15/20203,6 369,425
400,000 Blue Cube Spinco, Inc.
9.750%, 10/15/20231,6 484,000
500,000 Cemex S.A.B. de C.V.
6.125%, 5/5/20251,2,3,6 538,750
400,000 Chemours Co.
6.625%, 5/15/20231,6 423,000
60,000 Commercial Metals Co.
7.350%, 8/15/20186 63,525
349,000 Hecla Mining Co.
6.875%, 5/1/20211,6 362,087
400,000 Hexion, Inc.
6.625%, 4/15/20201,6 365,000
400,000 LSB Industries, Inc.
8.500%, 8/1/20191,4,6 400,500
160,000 SunCoke Energy, Inc.
7.625%, 8/1/20191,6 157,600
400,000 Tronox Finance LLC
6.375%, 8/15/20201,6 401,000
400,000 United States Steel Corp.
7.375%, 4/1/20206 432,560
220,000 Vale Overseas Ltd.
5.625%, 9/15/20193,6 232,100 ____________ 5,458,047 ____________ TECHNOLOGY – 3.6%
268,000 BMC Software, Inc.
7.250%, 6/1/20186 277,380
400,000 Infor US, Inc.
6.500%, 5/15/20221,6 414,000
400,000 Micron Technology, Inc.
5.875%, 2/15/20221,6 418,500
350,000 Western Digital Corp.
10.500%, 4/1/20241,2,6 412,888
450,000 Zebra Technologies Corp.
7.250%, 10/15/20221,6 478,125 ____________ 2,000,893 ____________
10

Altrius Enhanced Income Fund SCHEDULE OF INVESTMENTS - Continued As of June 30, 2017 (Unaudited)
Principal Amount Value __________ ____________
CORPORATE BONDS (Continued) UTILITIES – 1.0%
Ferrellgas LP / Ferrellgas Finance Corp. $ 35,000 6.500%, 5/1/20211 $ 33,075
165,000 6.750%, 1/15/20221 155,100
300,000 Ferrellgas Partners LP / Ferrellgas Partners Finance Corp.
8.625%, 6/15/20201 283,500
60,000 NRG Energy, Inc.
7.875%, 5/15/20211,6 61,950 ____________ 533,625 ____________
TOTAL CORPORATE BONDS (Cost $45,353,105) 46,202,130 ____________
SHORT-TERM INVESTMENTS – 16.0%
6,003,865 UMB Money Market Fiduciary, 0.01%5 6,003,865
3,000,000 United States Treasury Bill, 0.56% 2,994,237 ____________
TOTAL SHORT-TERM INVESTMENTS (Cost $9,000,432) 8,998,102 ____________
TOTAL INVESTMENTS – 98.4% (Cost $54,353,537) 55,200,232
Other Assets in Excess of Liabilities – 1.6% 901,536 ____________ TOTAL NET ASSETS – 100.0% $ 56,101,768 ________________________ SECURITIES SOLD SHORT – (4.5)%
U.S. GOVERNMENT – (4.5)%
UNITED STATES TREASURY BOND – (2.7)%
(1,500,000) United States Treasury Bond
2.875%, 11/15/2046 $ (1,508,262) ____________
TOTAL UNITED STATES TREASURY BOND (Proceeds $1,467,275) (1,508,262) ____________
UNITED STATES TREASURY NOTE – (1.8)%
(1,000,000) United States Treasury Note
2.250%, 2/15/2027 (995,352) ____________
TOTAL UNITED STATES TREASURY NOTE (Proceeds $973,149) (995,352) ____________
TOTAL U.S. GOVERNMENT (Proceeds $2,440,424) (2,503,614) ____________
TOTAL SECURITIES SOLD SHORT (Proceeds $2,440,424) $ (2,503,614) ________________________
11
Altrius Enhanced Income Fund SCHEDULE OF INVESTMENTS - Continued As of June 30, 2017 (Unaudited)
Number
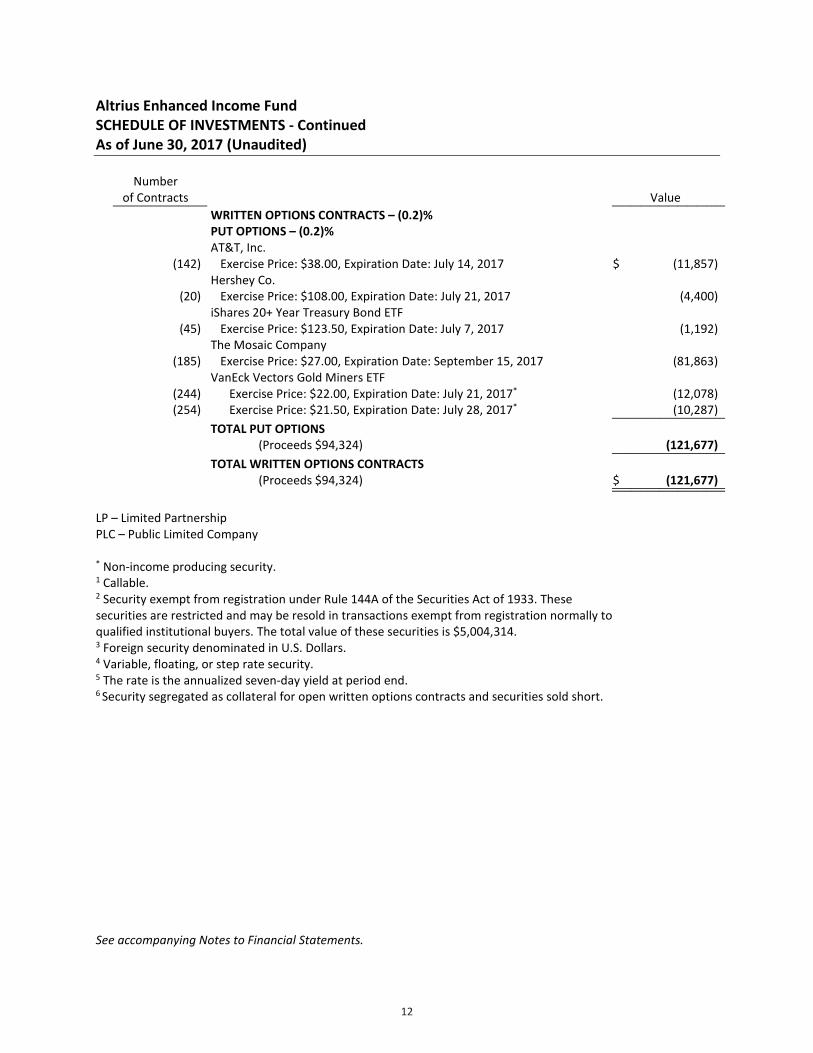
of Contracts Value __________ ____________ WRITTEN OPTIONS CONTRACTS – (0.2)%
PUT OPTIONS – (0.2)%
AT&T, Inc. (142) Exercise Price: $38.00, Expiration Date: July 14, 2017 $ (11,857)
Hershey Co. (20) Exercise Price: $108.00, Expiration Date: July 21, 2017 (4,400)
iShares 20+ Year Treasury Bond ETF (45) Exercise Price: $123.50, Expiration Date: July 7, 2017 (1,192)
The Mosaic Company (185) Exercise Price: $27.00, Expiration Date: September 15, 2017 (81,863)
VanEck Vectors Gold Miners ETF (244) Exercise Price: $22.00, Expiration Date: July 21, 2017* (12,078)
(254) Exercise Price: $21.50, Expiration Date: July 28, 2017* (10,287) ____________
TOTAL PUT OPTIONS (Proceeds $94,324) (121,677) ____________
TOTAL WRITTEN OPTIONS CONTRACTS (Proceeds $94,324) $ (121,677) ________________________
LP – Limited Partnership PLC – Public Limited Company * Non-income producing security. 1 Callable. 2 Security exempt from registration under Rule 144A of the Securities Act of 1933. These securities are restricted and may be resold in transactions exempt from registration normally to qualified institutional buyers. The total value of these securities is $5,004,314. 3 Foreign security denominated in U.S. Dollars. 4 Variable, floating, or step rate security. 5 The rate is the annualized seven-day yield at period end. 6 Security segregated as collateral for open written options contracts and securities sold short. See accompanying Notes to Financial Statements.
12

Altrius Enhanced Income Fund SUMMARY OF INVESTMENTS As of June 30, 2017 (Unaudited)
Security Type/Industry Percent of Total
Net Assets Corporate Bonds
Consumer Discretionary 23.9% Energy 10.6% Materials 9.7% Communications 8.0% Financials 7.5% Industrials 7.1% Consumer Staples 6.4% Health Care 4.6% Technology 3.6% Utilities 1.0% __________
Total Corporate Bonds 82.4% Short-Term Investments 16.0% __________Total Investments 98.4% Other Assets in Excess of Liabilities 1.6% __________Total Net Assets 100.0% ____________________
See accompanying Notes to Financial Statements.
13

MarketGrader 100 Enhanced Index Fund SCHEDULE OF INVESTMENTS As of June 30, 2017 (Unaudited)
Number of Shares Value __________ ____________
COMMON STOCKS – 99.0%
COMMUNICATIONS – 3.2%
5,295 Facebook, Inc. - Class A* $ 799,439
5,436 Stamps.com, Inc.* 841,901
13,845 WebMD Health Corp.* 812,009 ____________ 2,453,349 ____________ CONSUMER DISCRETIONARY – 30.1%
7,332 Alaska Air Group, Inc. 658,120
15,603 Best Buy Co., Inc. 894,520
17,731 Cooper Tire & Rubber Co. 640,089
23,974 Copart, Inc.* 762,133
23,204 DR Horton, Inc. 802,162
20,917 eBay, Inc.* 730,422
10,012 Foot Locker, Inc. 493,391
11,665 Grand Canyon Education, Inc.* 914,653
21,550 Hooker Furniture Corp. 886,783
12,731 iRobot Corp.* 1,071,186
31,999 Kate Spade & Co.* 591,662
4,969 Lear Corp. 705,996
15,221 Lennar Corp. - Class A 811,584
24,541 LGI Homes, Inc.* 986,057
33,220 Malibu Boats, Inc. - Class A* 859,401
30,081 Navigant Consulting, Inc.* 594,401
12,545 NIKE, Inc. - Class B 740,155
372 NVR, Inc.* 896,747
19,194 Rollins, Inc. 781,388
10,370 Ross Stores, Inc. 598,660
12,430 Southwest Airlines Co. 772,400
12,408 Starbucks Corp. 723,510
19,485 Steven Madden Ltd.* 778,426
8,308 Tiffany & Co. 779,872
9,147 TJX Cos., Inc. 660,139
11,996 Tupperware Brands Corp. 842,479
2,568 Ulta Salon Cosmetics & Fragrance, Inc.* 737,889
13,588 VF Corp. 782,669
14,956 Viad Corp. 706,671
25,900 Willdan Group, Inc.* 791,245 ____________ 22,994,810 ____________ CONSUMER STAPLES – 6.9%
13,154 Energizer Holdings, Inc. 631,655
17,914 Five Below, Inc.* 884,414
18,886 Hormel Foods Corp. 644,201
5,469 Kimberly-Clark Corp. 706,103
12,305 National Beverage Corp. 1,151,256
5,276 Spectrum Brands Holdings, Inc. 659,711
14
MarketGrader 100 Enhanced Index Fund SCHEDULE OF INVESTMENTS - Continued As of June 30, 2017 (Unaudited)
Number of Shares Value __________ ____________
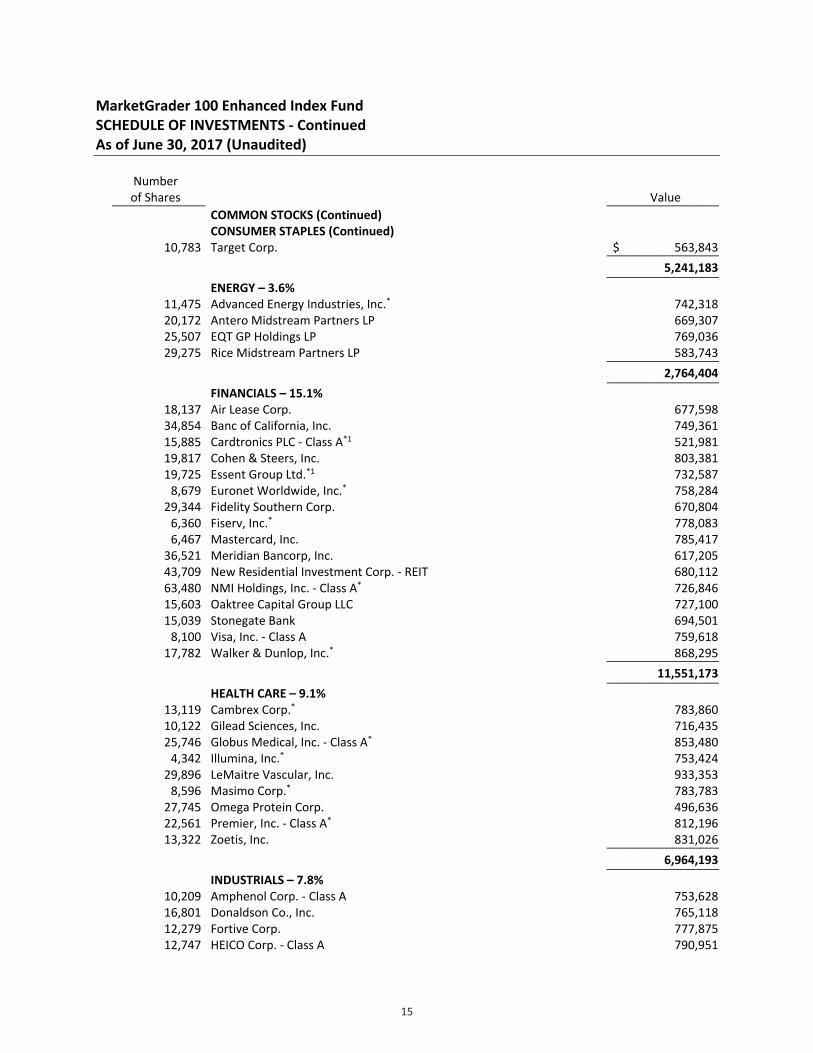
COMMON STOCKS (Continued) CONSUMER STAPLES (Continued) 10,783 Target Corp. $ 563,843 ____________ 5,241,183 ____________ ENERGY – 3.6%
11,475 Advanced Energy Industries, Inc.* 742,318
20,172 Antero Midstream Partners LP 669,307
25,507 EQT GP Holdings LP 769,036
29,275 Rice Midstream Partners LP 583,743 ____________ 2,764,404 ____________ FINANCIALS – 15.1%
18,137 Air Lease Corp. 677,598
34,854 Banc of California, Inc. 749,361
15,885 Cardtronics PLC - Class A*1 521,981
19,817 Cohen & Steers, Inc. 803,381
19,725 Essent Group Ltd.*1 732,587
8,679 Euronet Worldwide, Inc.* 758,284
29,344 Fidelity Southern Corp. 670,804
6,360 Fiserv, Inc.* 778,083
6,467 Mastercard, Inc. 785,417
36,521 Meridian Bancorp, Inc. 617,205
43,709 New Residential Investment Corp. - REIT 680,112
63,480 NMI Holdings, Inc. - Class A* 726,846
15,603 Oaktree Capital Group LLC 727,100
15,039 Stonegate Bank 694,501
8,100 Visa, Inc. - Class A 759,618
17,782 Walker & Dunlop, Inc.* 868,295 ____________ 11,551,173 ____________ HEALTH CARE – 9.1%
13,119 Cambrex Corp.* 783,860
10,122 Gilead Sciences, Inc. 716,435
25,746 Globus Medical, Inc. - Class A* 853,480
4,342 Illumina, Inc.* 753,424
29,896 LeMaitre Vascular, Inc. 933,353
8,596 Masimo Corp.* 783,783
27,745 Omega Protein Corp. 496,636
22,561 Premier, Inc. - Class A* 812,196
13,322 Zoetis, Inc. 831,026 ____________ 6,964,193 ____________ INDUSTRIALS – 7.8%
10,209 Amphenol Corp. - Class A 753,628
16,801 Donaldson Co., Inc. 765,118
12,279 Fortive Corp. 777,875
12,747 HEICO Corp. - Class A 790,951
15

MarketGrader 100 Enhanced Index Fund SCHEDULE OF INVESTMENTS - Continued As of June 30, 2017 (Unaudited)
Number of Shares Value __________ ____________
COMMON STOCKS (Continued) INDUSTRIALS (Continued) 13,294 Hexcel Corp. $ 701,790
5,134 Middleby Corp.* 623,832
2,918 Northrop Grumman Corp. 749,080
11,731 Toro Co. 812,841 ____________ 5,975,115 ____________ MATERIALS – 1.8%
9,020 Compass Minerals International, Inc. 589,006
9,175 Neenah Paper, Inc. 736,294 ____________ 1,325,300 ____________ TECHNOLOGY – 21.4%
5,938 Adobe Systems, Inc.* 839,871
5,212 Apple, Inc. 750,632
19,906 Applied Materials, Inc. 822,317
19,097 Applied Optoelectronics, Inc.* 1,180,004
6,264 Arista Networks, Inc.* 938,285
10,214 Cabot Microelectronics Corp. 754,100
10,873 CDK Global, Inc. 674,778
8,789 Citrix Systems, Inc.* 699,429
12,232 Cognizant Technology Solutions Corp. - Class A 812,205
3,667 Coherent, Inc.* 825,038
14,305 Dolby Laboratories, Inc. - Class A 700,373
15,004 ExlService Holdings, Inc.* 833,922
3,905 FactSet Research Systems, Inc. 648,933
20,613 Finisar Corp.* 535,526
6,159 Lam Research Corp. 871,067
14,052 Manhattan Associates, Inc.* 675,339
10,970 Microsoft Corp. 756,162
32,717 Rudolph Technologies, Inc.* 747,583
5,449 S&P Global, Inc. 795,499
7,421 Skyworks Solutions, Inc. 712,045
9,299 Texas Instruments, Inc. 715,372 ____________ 16,288,480 ____________
TOTAL COMMON STOCKS (Cost $70,279,882) 75,558,007 ____________
Principal Amount __________
SHORT-TERM INVESTMENTS – 2.0%
$ 1,496,937 UMB Money Market Fiduciary, 0.01%2 1,496,937 ____________
TOTAL SHORT-TERM INVESTMENTS (Cost $1,496,937) 1,496,937 ____________
16

MarketGrader 100 Enhanced Index Fund SCHEDULE OF INVESTMENTS - Continued As of June 30, 2017 (Unaudited)
Value ____________
TOTAL INVESTMENTS – 101.0% (Cost $71,776,819) $ 77,054,944
Liabilities in Excess of Other Assets – (1.0)% (740,585) ____________ TOTAL NET ASSETS – 100.0% $ 76,314,359 ________________________ LP – Limited Partnership PLC – Public Limited Company REIT – Real Estate Investment Trusts * Non-income producing security. 1 Foreign security denominated in U.S. Dollars. 2 The rate is the annualized seven-day yield at period end. See accompanying Notes to Financial Statements.
17

MarketGrader 100 Enhanced Index Fund SUMMARY OF INVESTMENTS As of June 30, 2017 (Unaudited)
Security Type/Industry Percent of Total
Net Assets Common Stocks
Consumer Discretionary 30.1% Technology 21.4% Financials 15.1% Health Care 9.1% Industrials 7.8% Consumer Staples 6.9% Energy 3.6% Communications 3.2% Materials 1.8% __________
Total Common Stocks 99.0% Short-Term Investments 2.0% __________Total Investments 101.0% Liabilities in Excess of Other Assets (1.0)% __________Total Net Assets 100.0% ____________________
See accompanying Notes to Financial Statements.
18

STATEMENTS OF ASSETS AND LIABILITIESAs of June 30, 2017 (Unaudited)
Assets:Investments, at cost $ 40,338,544 $ 54,353,537 $ 71,776,819 Purchased options contracts, at cost 177,853 - - Investments, at value $ 40,363,301 $ 55,200,232 $ 77,054,944 Purchased options contracts, at value 151,125 - - Cash - 196,410 - Cash segregated at Broker - 2,552,673 161 Unrealized appreciation on futures contracts 141,911 - - Receivables: Investment securities sold 186,042 - - Fund shares sold 34,564 176,674 239,752 Dividends and interest 13 743,243 79,153 Prepaid expenses 18,684 28,496 21,168 Total assets 40,895,640 58,897,728 77,395,178
Liabilities:Securities sold short, proceeds $ 137,437 $ 2,440,424 $ - Written options contracts, proceeds 3,150 94,324 - Securities sold short, at value $ 137,640 $ 2,503,614 $ - Written options contracts, at value 6,000 121,677 - Unrealized depreciation on futures contracts 10,598 - - Cash due to Broker 264,807 - - Payables: Investment securities purchased 102,482 - 928,445 Fund shares redeemed 86,252 78,147 28,136 Advisory fees 30,828 34,241 57,974 Shareholder servicing fees (Note 7) 2,783 3,973 5,308 Fund administration fees 13,887 4,878 6,416 Auditing fees 7,430 7,438 7,438 Custody fees 6,416 4,015 25,517 Fund accounting fees 5,898 7,511 5,202 Transfer agent fees and expenses 4,072 6,535 5,756 Chief Compliance Officer fees 1,090 2,854 1,340 Trustees' fees and expenses 311 1,043 1,494 Interest on securities sold short - 13,961 - Accrued other expenses 11,388 6,073 7,793 Total liabilities 691,882 2,795,960 1,080,819
Net Assets $ 40,203,758 $ 56,101,768 $ 76,314,359
Components of Net Assets:Paid-in capital (par value of $0.01 per share with an unlimited number of shares authorized) $ 116,904,891 $ 54,981,339 $ 69,350,396 Accumulated net investment income (loss) (244,201) 500 (86,585) Accumulated net realized gain (loss) on investments,
securities sold short, futures contracts, purchased options contracts and written options (76,583,221) 363,777 1,772,423
Net unrealized appreciation (depreciation) on:Investments 24,757 846,695 5,278,125 Securities sold short (203) (63,190) -Purchased options contracts (26,728) - - Futures contracts 131,313 - - Written options contracts (2,850) (27,353) -
Net Assets $ 40,203,758 $ 56,101,768 $ 76,314,359
Shares of beneficial interest issued and outstanding 5,133,508 5,220,823 6,335,821 Net asset value per share $ 7.83 $ 10.75 $ 12.04
Enhanced Index Fund
Class I Shares:
Kaizen HedgedPremium Spreads Fund
Altrius Enhanced Income Fund
MarketGrader 100
See accompanying Notes to Financial Statements.
19

STATEMENTS OF OPERATIONSFor the Six Months Ended June 30, 2017 (Unaudited)
Kaizen Hedged Altrius Enhanced MarketGrader 100Premium Spreads Fund Income Fund Enhanced Index Fund
Investment Income:Dividends -$ -$ 361,281$ Interest 154,402 1,372,341 41
Total investment income 154,402 1,372,341 361,322
Expenses:Advisory fees 289,725 261,452 327,274 Legal fees 36,912 9,917 9,917 Fund administration fees 31,045 30,521 32,248 Registration fees 20,366 23,115 17,604 Fund accounting fees 19,923 42,488 25,943 Transfer agent fees and expenses 11,565 14,618 16,031 Auditing fees 7,438 7,439 7,439 Custody fees 7,344 5,930 23,923 Shareholder reporting fees 6,956 6,480 4,976 Miscellaneous 3,798 3,471 3,223 Trustees' fees and expenses 3,634 3,967 3,768 Interest expense 3,523 7,879 1,624 Chief Compliance Officer fees 2,907 12,860 2,943 Shareholder servicing fees (Note 7) 2,643 23,710 29,625 Insurance fees 2,315 1,240 1,240 Interest on securities sold short - 28,557 -
Total expenses 450,094 483,644 507,778 Advisory fees waived (51,491) (90,683) (59,871)
Net expenses 398,603 392,961 447,907 Net investment income (loss) (244,201) 979,380 (86,585)
Realized and Unrealized Gain (Loss) on Investments, Securities Sold Short, Purchased Options Contracts, Written Options Contracts and Futures Contracts:
Net realized gain (loss) on:Investments (78,410) 130,312 3,974,401 Securities sold short 47,925 - - Purchased options contracts (11,207,403) - - Written options contracts 12,086,180 349,732 - Futures contracts (708,114) - (664,268)
Net realized gain 140,178 480,044 3,310,133 Net change in unrealized appreciation/depreciation on:
Investments 25,535 256,855 1,662,668 Securities sold short (203) (82,262) -Purchased options contracts 124,134 - - Futures contracts 132,642 - - Written options contracts (23,605) (59,556) -
258,503 115,037 1,662,668 Net realized and unrealized gain on investments, securities sold short,
purchased options contracts, written options contracts and futures contracts 398,681 595,081 4,972,801
Net Increase in Net Assets from Operations 154,480$ 1,574,461$ 4,886,216$
Net change in unrealized appreciation/depreciation
See accompanying Notes to Financial Statements.
20
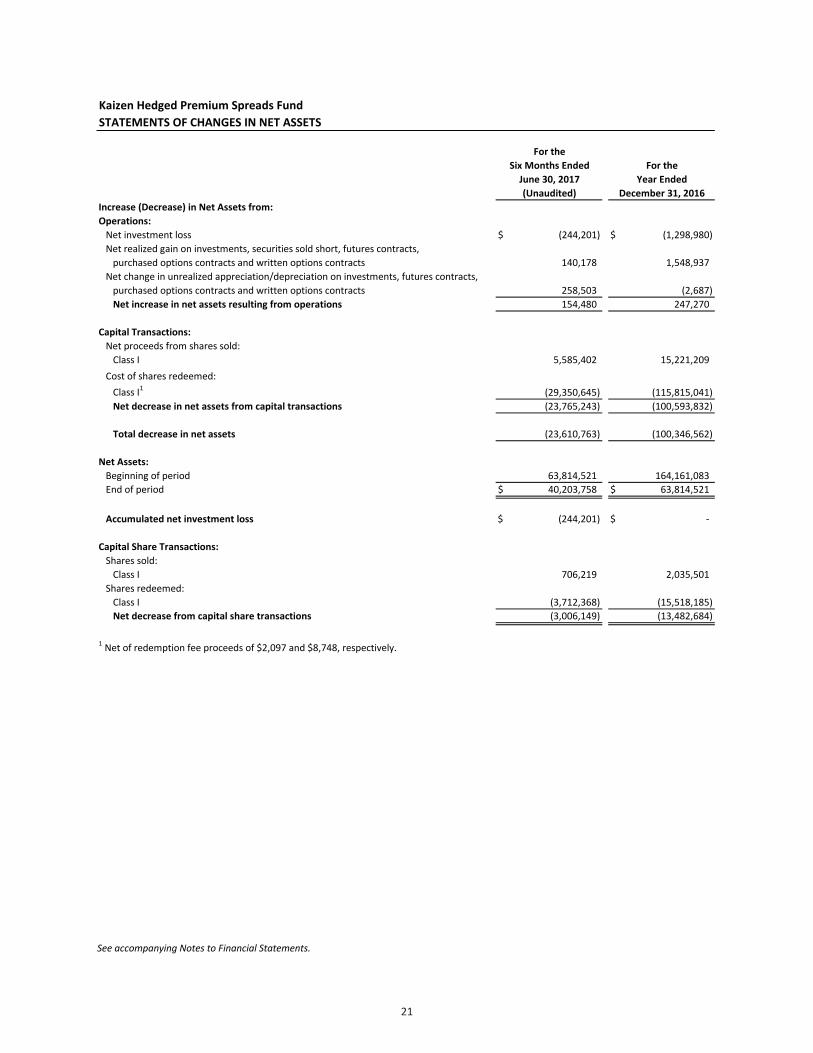
Kaizen Hedged Premium Spreads FundSTATEMENTS OF CHANGES IN NET ASSETS
Increase (Decrease) in Net Assets from:Operations: Net investment loss $ (244,201) $ (1,298,980) Net realized gain on investments, securities sold short, futures contracts, purchased options contracts and written options contracts 140,178 1,548,937 Net change in unrealized appreciation/depreciation on investments, futures contracts, purchased options contracts and written options contracts 258,503 (2,687) Net increase in net assets resulting from operations 154,480 247,270 Capital Transactions: Net proceeds from shares sold: Class I 5,585,402 15,221,209 Cost of shares redeemed: Class I1 (29,350,645) (115,815,041) Net decrease in net assets from capital transactions (23,765,243) (100,593,832) Total decrease in net assets (23,610,763) (100,346,562) Net Assets: Beginning of period 63,814,521 164,161,083 End of period $ 40,203,758 $ 63,814,521 Accumulated net investment loss $ (244,201) $ -
Capital Share Transactions: Shares sold: Class I 706,219 2,035,501 Shares redeemed: Class I (3,712,368) (15,518,185) Net decrease from capital share transactions (3,006,149) (13,482,684)
1 Net of redemption fee proceeds of $2,097 and $8,748, respectively.
Year Ended
For theSix Months Ended
June 30, 2017(Unaudited)
For the
December 31, 2016
See accompanying Notes to Financial Statements.
21

Altrius Enhanced Income FundSTATEMENTS OF CHANGES IN NET ASSETS
For theSix Months Ended For the
June 30, 2017 Year Ended(Unaudited) December 31, 2016
Increase (Decrease) in Net Assets From:Operations: Net investment income 979,380$ 672,714$ Net realized gain on investments and written options contracts 480,044 83,876 Net change in unrealized appreciation/depreciation on investments, securities sold short and written options contracts 115,037 641,115 Net increase in net assets resulting from operations 1,574,461 1,397,705 Distributions to Shareholders: From net investment income: Class I (978,880) (685,318) From net realized gain: Class I - (198,438) Total distributions to shareholders (978,880) (883,756) Capital Transactions: Net proceeds from shares sold: Class I 20,335,018 43,116,862 Reinvestment of distributions: Class I 978,880 883,756 Cost of shares redeemed: Class I1 (5,819,479) (4,503,799) Net increase in net assets from capital transactions 15,494,419 39,496,819
Total increase in net assets 16,090,000 40,010,768 Net Assets: Beginning of period 40,011,768 1,000 End of period 56,101,768$ 40,011,768$ Accumulated net investment income 500$ -$
Capital Share Transactions: Shares sold: Class I 1,896,775 4,128,761 Shares reinvested: Class I 91,302 83,722 Shares redeemed: Class I (543,427) (436,410) Net increase in capital share transactions 1,444,650 3,776,073
1Net of redemption fee proceeds of $5,241 and $26,440, respectively.
See accompanying Notes to Financial Statements.
22

MarketGrader 100 Enhanced Index FundSTATEMENTS OF CHANGES IN NET ASSETS
For theSix Months Ended For the
June 30, 2017 Year Ended(Unaudited) December 31, 2016
Increase (Decrease) in Net Assets From:Operations: Net investment loss (86,585)$ (62,744)$ Net realized gain (loss) on investments and futures contracts 3,310,133 (496,781) Net change in unrealized appreciation/depreciation on investments 1,662,668 3,615,457 Net increase in net assets resulting from operations 4,886,216 3,055,932 Distributions to Shareholders: From net capital gain: Class I - (991,237) Total distributions to shareholders - (991,237) Capital Transactions: Net proceeds from shares sold: Class I 33,137,109 48,861,752 Reinvestment of distributions: Class I - 991,237 Cost of shares redeemed: Class I1 (7,586,955) (6,040,695) Net increase in net assets from capital transactions 25,550,154 43,812,294
Total increase in net assets 30,436,370 45,876,989 Net Assets: Beginning of period 45,877,989 1,000 End of period 76,314,359$ 45,877,989$ Accumulated net investment loss (86,585)$ -$
Capital Share Transactions: Shares sold: Class I 2,828,915 4,632,209 Shares reinvested: Class I - 89,462 Shares redeemed: Class I (651,515) (563,350) Net increase in capital share transactions 2,177,400 4,158,321
1Net of redemption fee proceeds of $3,872 and $11,626, respectively.
See accompanying Notes to Financial Statements.
23

Kaizen Hedged Premium Spreads FundFINANCIAL HIGHLIGHTSClass I
Per share operating performance.For a capital share outstanding throughout each period.
For the For the PeriodSix Months Ended For the August 3, 2015*
June 30, 2017 Year Ended through(Unaudited) December 31, 2016 December 31, 2015
Net asset value, beginning of period 7.84$ 7.59$ 10.00$ Income from Investment Operations:
Net investment loss1 (0.04) (0.10) (0.06) Net realized and unrealized gain (loss) 0.03 0.35 (2.35) Total from investment operations (0.01) 0.25 (2.41)
Redemption fee proceeds1 - 2 - 2 - 2
Net asset value, end of period 7.83$ 7.84$ 7.59$
Total return3 -% 4 3.16% (24)% 4
Ratios and Supplemental Data:Net assets, end of period (in thousands) 40,204$ 63,815$ 164,161$
Ratio of expenses to average net assets (including interest expense):Before fees waived and expenses absorbed 1.71% 5,6 1.72% 6 1.85% 5,6
After fees waived and expenses absorbed 1.51% 5,6 1.62% 6 1.85% 5,6
Ratio of net investment loss to average net assets (including interest expense):Before fees waived and expenses absorbed (1.12)% 5 (1.40)% (1.76)% 5
After fees waived and expenses absorbed (0.92)% 5 (1.30)% (1.76)% 5
Portfolio turnover rate -% 4 -% -% 4
* Commencement of operations.1 Based on average shares outstanding during the period.2 Amount represents less than $0.01 per share.3
4 Not annualized.5 Annualized.6
Total returns would have been lower had expenses not been waived or absorbed by the Advisor. Returns shown do not reflect the deduction oftaxes that a shareholder would pay on Fund distributions or the redemption of Fund shares.
If interest expense had been excluded, the expense ratios would have been lowered by 0.01% for the six months ended June 30, 2017. For the priorperiods ended December 31, 2016 and December 31, 2015, the ratios would have remained unchanged.
See accompanying Notes to Financial Statements.
24

Altrius Enhanced Income FundFINANCIAL HIGHLIGHTS Class I
Per share operating performance. For theFor a capital share outstanding throughout each period. Six Months Ended For the
June 30, 2017 Year Ended(Unaudited) December 31, 2016
Net asset value, beginning of period 10.60$ 10.00$ Income from Investment Operations:
Net investment income1 0.22 0.43 Net realized and unrealized gain on investments, securities sold short and written options contracts 0.14 0.57 Total from investment operations 0.36 1.00
Less Distributions:From net investment income (0.21) (0.37) From net realized gain - (0.05) Total distributions (0.21) (0.42)
Redemption fee proceeds1 - 2 0.02
Net asset value, end of period 10.75$ 10.60$
Total return3 3.46% 4 10.37%
Ratios and Supplemental Data:Net assets, end of period (in thousands) 56,102$ 40,012$
Ratio of expenses to average net assets (including interest expense andinterest on securities sold short):Before fees waived and expenses absorbed 2.03% 5,6 3.09% 6
After fees waived and expenses absorbed 1.65% 5,6 1.53% 6
Ratio of net investment income to average net assets (including interest expenseand interest on securities sold short):Before fees waived and expenses absorbed 3.74% 5 2.48%After fees waived and expenses absorbed 4.12% 5 4.04%
Portfolio turnover rate 11% 4 21%
1 Based on average shares outstanding during the period.2 Amount represents less than $0.01 per share.3
4 Not annualized.5 Annualized.6
Total returns would have been lower had expenses not been waived or absorbed by the Advisor. Returns shown do not reflect thededuction of taxes that a shareholder would pay on Fund distributions or the redemption of Fund shares.
If interest expense and interest on securities sold short had been excluded, the expense ratios would have been lowered by 0.15% forthe six months ended June 30, 2017. For the year ended December 31, 2016, the ratios would have been lowered by 0.03%.
See accompanying Notes to Financial Statements.
25

MarketGrader 100 Enhanced Index FundFINANCIAL HIGHLIGHTS Class I
Per share operating performance. For theFor a capital share outstanding throughout each period. Six Months Ended For the
June 30, 2017 Year Ended(Unaudited) December 31, 2016
Net asset value, beginning of period 11.03$ 10.00$ Income from Investment Operations:
Net investment loss1 (0.02) (0.03) Net realized and unrealized gain on investments 1.03 1.30 Total from investment operations 1.01 1.27
Less Distributions:From net realized gain - (0.25) Total distributions - (0.25)
Redemption fee proceeds1 - 2 0.01
Net asset value, end of period 12.04$ 11.03$
Total return3 9.16% 5 12.74%
Ratios and Supplemental Data:Net assets, end of period (in thousands) 76,314$ 45,878$
Ratio of expenses to average net assets (including interest expense):Before fees waived and expenses absorbed 1.71% 4,6 2.62% 4
After fees waived and expenses absorbed 1.51% 4,6 1.51% 4
Ratio of net investment loss to average net assets (including interest expense):Before fees waived and expenses absorbed (0.49)% 6 (1.37)%After fees waived and expenses absorbed (0.29)% 6 (0.26)%
Portfolio turnover rate 71% 5 105%
1 Based on average shares outstanding during the period.2 Amount represents less than $0.01 per share.3
4
5 Not annualized.6 Annualized.
Total returns would have been lower had expenses not been waived or absorbed by the Advisor. Returns shown do not reflectthe deduction of taxes that a shareholder would pay on Fund distributions or the redemption of Fund shares.If interest expense had been excluded, the expense ratios would have been lowered by 0.01% for the six months ended June30, 2017. For the year ended December 31, 2016, the ratios would have been lowered by 0.01%
See accompanying Notes to Financial Statements.
26

Kaizen Funds NOTES TO FINANCIAL STATEMENTS June 30, 2017 (Unaudited)
Note 1 – Organization Kaizen Hedged Premium Spreads Fund, Altrius Enhanced Income Fund and MarketGrader 100 Enhanced Index Fund (each a “Fund” and collectively the ‘‘Funds’’) are organized as a series of Investment Managers Series Trust II, a Delaware statutory trust (the “Trust”) which is registered as an open-end management investment company under the Investment Company Act of 1940, as amended (the “1940 Act”). The Kaizen Hedged Premium Spreads Fund is a non-diversified fund. The Altrius Enhanced Income Fund and MarketGrader 100 Enhanced Index Fund are diversified funds. The Kaizen Hedged Premium Spreads Fund’s primary investment objective is to seek risk-adjusted returns which are uncorrelated to the broader markets. The Fund currently offers one class of shares, Class I. Class A and Class C Shares are not currently available. The Fund’s Class I shares commenced operations on August 3, 2015. The Altrius Enhanced Income Fund’s primary investment objective is to maximize long-term total return and generate income. The Fund currently offers one class of shares, Class I. Class A and Class C Shares are not currently available. The Fund’s Class I shares commenced investment operations on December 31, 2015. The MarketGrader 100 Enhanced Index Fund’s primary investment objective is to seek investment results that track generally, before fees and expenses, to the performance of the Kaizen MarketGrader 100 Dynamic Risk Overlay Index (the “Underlying Index”). The Fund currently offers one class of shares, Class I. Class A and Class C Shares are not currently available. The Fund’s Class I shares commenced investment operations on December 31, 2015. Each Fund is an investment company and accordingly follows the investment company accounting and reporting guidance of the Financial Accounting Standards Board (FASB) Accounting Standard Codification Topic 946 “Financial Services—Investment Companies.” Note 2 – Accounting Policies The following is a summary of the significant accounting policies consistently followed by the Funds in the preparation of their financial statements. The preparation of financial statements in conformity with accounting principles generally accepted in the United States of America (“GAAP”) requires management to make estimates and assumptions that affect the reported amounts and disclosures in the financial statements. Actual results could differ from these estimates. (a) Valuation of Investments The Funds value equity securities at the last reported sale price on the principal exchange or in the principal over the counter (“OTC”) market in which such securities are traded, as of the close of regular trading on the NYSE on the day the securities are being valued or, if the last-quoted sales price is not readily available, the securities will be valued at the last bid or the mean between the last available bid and ask price. Securities traded on the NASDAQ are valued at the NASDAQ Official Closing Price (“NOCP”). Options are valued at the mean between the last available bid and asked prices used. Debt securities are valued by utilizing a price supplied by independent pricing service providers. The independent pricing service providers may use various valuation methodologies including matrix pricing and other analytical pricing models as well as market transactions and dealer quotations. These models generally consider such factors as yields or prices of bonds of comparable quality, type of issue, coupon, maturity, ratings and general market conditions. If a price is not readily available for a portfolio security, the security will be valued at fair value (the amount which the Funds might reasonably expect to receive for the security upon its current sale) as determined in good faith by the Funds’ advisor, subject to review and approval by the Valuation Committee, pursuant to procedures adopted by the Board of Trustees. The actions of the Valuation Committee are subsequently reviewed by the Board at its next regularly scheduled board meeting. The Valuation
27

Kaizen Funds NOTES TO FINANCIAL STATEMENTS – Continued June 30, 2017 (Unaudited)
Committee meets as needed. The Valuation Committee is comprised of all the Trustees, but action may be taken by any one of the Trustees. (b) Short Sales Short sales are transactions under which the Fund sells a security it does not own in anticipation of a decline in the value of that security. To complete such a transaction, the Fund must borrow the security to make delivery to the buyer. The Fund then is obligated to replace the security borrowed by purchasing the security at market price at the time of replacement. The price at such time may be more or less than the price at which the security was sold by the Fund. When a security is sold short, a decrease in the value of the security will be recognized as a gain and an increase in the value of the security will be recognized as a loss, which is potentially limitless. Until the security is replaced, the Fund is required to pay the lender amounts equal to dividend or interest that accrues during the period of the loan which is recorded as an expense. To borrow the security, the Fund also may be required to pay a premium or an interest fee, which are recorded as interest expense. Cash or securities are segregated for the broker to meet the necessary margin requirements. The Fund is subject to the risk that it may not always be able to close out a short position at a particular time or at an acceptable price. (c) Options The Funds may write or purchase options contracts primarily to enhance the Funds’ returns or reduce volatility. In addition, the Funds may utilize options in an attempt to generate gains from option premiums or to reduce overall portfolio risk. When a Fund writes or purchases an option, an amount equal to the premium received or paid by a Fund is recorded as a liability or an asset and is subsequently adjusted to the current market value of the option written or purchased. Premiums received or paid from writing or purchasing options which expire unexercised are treated by a Fund on the expiration date as realized gains or losses. The difference between the premium and the amount paid or received on effecting a closing purchase or sale transaction, including brokerage commissions, is also treated as a realized gain or loss. If an option is exercised, the premium paid or received is added to the cost of the purchase or proceeds from the sale in determining whether a Fund has realized a gain or a loss on investment transactions. A Fund, as a writer of an option, may have no control over whether the underlying securities may be sold (call) or purchased (put) and as a result bears the market risk of an unfavorable change in the price of the security underlying the written option. Transactions in option contracts written for the six months ended June 30, 2017 in the Kaizen Hedged Premium Spreads Fund were as follows:
Number of Contracts Premium Amount Outstanding at December 31, 2016 2,100 $ 119,505 Options written 127,706 13,926,151 Options terminated in closing purchasing transactions (33,760) (2,503,792) Options expired (92,846) (11,529,504) Options exercised (200) (9,210) Outstanding at June 30, 2017 3,000 $ 3,150
28

Kaizen Funds NOTES TO FINANCIAL STATEMENTS – Continued June 30, 2017 (Unaudited)
Transactions in option contracts written for the six months ended June 30, 2017 in the Altrius Enhanced Income Fund were as follows:
(d) Stock Index Futures The Funds may invest in stock index futures as a substitute for a comparable market position in the underlying securities. A stock index future obligates the seller to deliver (and the purchaser to accept), effectively, an amount of cash equal to a specific dollar amount times the difference between the value of a specific stock index at the close of the last trading day of the contract and the price at which the agreement is made. No physical delivery of the underlying stocks in the index is made. Initial margin deposits required upon entering into futures contracts are satisfied by the segregation of specific securities or cash as collateral for the account of the broker (the Funds’ agent in acquiring the futures position). During the period the futures contracts are open, changes in the value of the contracts are recognized as unrealized gains or losses by “marking to market” on a daily basis to reflect the market value of the contracts at the end of each day’s trading. Variation margin payments are received or made depending upon whether unrealized gains or losses are incurred. When the contracts are closed, the Funds recognize a realized gain or loss equal to the difference between the proceeds from, or cost of, the closing transaction and the Funds’ basis in the contract. Risks of entering into futures contracts include the possibility that a change in the value of the contract may not correlate with the changes in the value of the underlying instruments. The purchase of a futures contract involves the risk that the Funds could lose more than the original margin deposit required to initiate the futures transaction. There is minimal counterparty credit risk involved in entering into futures contracts since they are exchange-traded instruments and the exchange’s clearinghouse, as counterparty to all exchange-traded futures, guarantees the futures against default. (e) Exchange-Traded Notes Exchange-Traded Notes (“ETNs”) are debt securities that combine certain aspects of Exchange-Traded Funds (“ETFs”) and bonds. ETNs are not investment companies and thus are not regulated under the 1940 Act. ETNs, like ETFs, are traded on stock exchanges and generally track specified market indices, and their value depends on the performance of the underlying index and the credit rating of the issuer. ETNs may be held to maturity, but unlike bonds there are no periodic interest payments and principal is not protected. (f) Investment Transactions, Investment Income and Expenses Investment transactions are accounted for on the trade date. Realized gains and losses on investments are determined on the identified cost basis. Dividend income is recorded net of applicable withholding taxes on the ex-dividend date and interest income is recorded on an accrual basis. Withholding taxes on foreign dividends, if applicable, are paid (a portion of which may be reclaimable) or provided for in accordance with the applicable country’s tax rules and rates and are disclosed in the Statement of Operations. Withholding tax reclaims are filed in certain countries to recover a portion of the amounts previously withheld. The Funds record a reclaim receivable based on a number of factors, including a jurisdiction’s legal obligation to pay reclaims as well as payment history and market convention. Discounts or premiums on debt securities are accreted or amortized to interest income over the lives of the respective securities using the effective interest method. Expenses incurred by the Trust with
Number of Contracts Premium Amount Outstanding at December 31, 2016 1,153 $ 321,687 Options written 5,509 691,365 Options terminated in closing purchasing transactions (4,216) (760,791) Options expired (1,317) (94,296) Options exercised (239) (63,641) Outstanding at June 30, 2017 890 $ 94,324
29
Kaizen Funds NOTES TO FINANCIAL STATEMENTS – Continued June 30, 2017 (Unaudited)
respect to more than one Fund are allocated in proportion to the net assets of each Fund except where allocation of direct expenses to each Fund or an alternative allocation method can be more appropriately made. (g) Distributions to Shareholders The Funds will make distributions of net investment income, per the table below and capital gains, if any, at least annually. Distributions to shareholders are recorded on the ex-dividend date. The amount and timing of distributions are determined in accordance with federal income tax regulations, which may differ from GAAP.
Distribution Frequency of Net Investment Income
Kaizen Hedged Premium Spreads Fund Annually Altrius Enhanced Income Fund Monthly MarketGrader 100 Enhanced Index Fund Annually
The character of distributions made during the year from net investment income or net realized gains may differ from the characterization for federal income tax purposes due to differences in the recognition of income, expense and gain (loss) items for financial statement and tax purposes. (h) Federal Income Taxes The Funds intend to comply with the requirements of Subchapter M of the Internal Revenue Code applicable to regulated investment companies and to distribute substantially all of its net investment income and any net realized gains to its shareholders. Therefore, no provision is made for federal income or excise taxes. Due to the timing of dividend distributions and the differences in accounting for income and realized gains and losses for financial statement and federal income tax purposes, the fiscal year in which amounts are distributed may differ from the year in which the income and realized gains and losses are recorded by the Funds. Accounting for Uncertainty in Income Taxes (the “Income Tax Statement”) requires an evaluation of tax positions taken (or expected to be taken) in the course of preparing a Fund’s tax returns to determine whether these positions meet a “more-likely-than-not” standard that, based on the technical merits, have a more than fifty percent likelihood of being sustained by a taxing authority upon examination. A tax position that meets the “more-likely-than-not” recognition threshold is measured to determine the amount of benefit to recognize in the financial statements. The Funds recognize interest and penalties, if any, related to unrecognized tax benefits as income tax expense in the Statements of Operations. The Income Tax Statement requires management of the Funds to analyze tax positions taken in the prior three open tax years, if any, and tax positions expected to be taken in the Funds’ current tax year, as defined by the IRS statute of limitations for all major jurisdictions, including federal tax authorities and certain state tax authorities. As of and during the open years ended December 31, 2015 – 2016 and as of and during the six months ended June 30, 2017, the Funds did not have a liability for any unrecognized tax benefits. The Funds have no examination in progress and are not aware of any tax positions for which it is reasonably possible that the total amounts of unrecognized tax benefits will significantly change in the next twelve months. (i) Use of Estimates The presentation of financial statements in conformity with GAAP requires management to make estimates and assumptions that affect the reported amounts of assets and liabilities at the date of the financial statements and the reported amounts of income and expenses during the reporting period. Actual results could differ from those estimates.
30

Kaizen Funds NOTES TO FINANCIAL STATEMENTS – Continued June 30, 2017 (Unaudited)
Note 3 – Investment Advisory and Other Agreements The Trust, on behalf of the Funds, entered into an Investment Advisory Agreement (the “Agreement”) with Kaizen Advisory, LLC (the “Advisor”). Under the terms of the Agreement, the Funds pay a monthly investment advisory fee to the Advisor. The annual rates are listed by Fund in the table below. The Advisor has contractually agreed to waive its fee and/or pay for operating expenses (excluding any taxes, leverage interest, acquired fund fees and expenses (as determined in accordance with Form N-1A), dividend and interest expense on short sales, brokerage commissions, expenses incurred in connection with any merger or reorganization and extraordinary expenses such as litigation expenses) in order to limit total annual operating expenses of each fund. This agreement is in effect until April 30, 2018 for the Funds and it may be terminated before that date only by the Trust’s Board of Trustees. The table below contains the expense cap by Fund and by Class.
Total Limit on Annual Operating Expenses
Investment Advisory Fees Class I Shares† Kaizen Hedged Premium Spreads Fund 1.10% 1.50% MarketGrader 100 Enhanced Index Fund 1.10% 1.50% Altrius Enhanced Income Fund 1.10% 1.50%
†The total limit on annual operating expenses is calculated based on each Fund’s average daily net assets. The Advisor has engaged Altrius Capital Management, Inc. (“Altrius”) and Two Fish Management, LLC (“Two Fish”) (each, a "Sub-Advisor" and together, the “Sub-Advisors”) to manage the assets of the Altrius Enhanced Income Fund and pays the Sub-Advisors from its advisory fees. For the six months ended June 30, 2017, the Advisor waived advisory fees totaling $51,491 for the Kaizen Hedged Premium Spreads Fund. For the six months ended June 30, 2017, the Advisor waived advisory fees and absorbed other expenses totaling $90,683 for the Altrius Enhanced Income Fund. For the six months ended June 30, 2017, the Advisor also waived advisory fees and absorbed other expenses totaling $59,871 for the MarketGrader 100 Enhanced Index Fund. Other than the Voluntary Limitations, the Advisor may recover from each Fund’s fees and/or expenses previously waived and/or absorbed, if the Fund’s expense ratio, including the recovered expenses, falls below the expense limit at which they were waived. Each Fund’s advisor is permitted to seek reimbursement from the Fund, subject to certain limitations, of fees waived or payments made to the Fund for a period ending three full fiscal years after the date of the waiver or payment. This reimbursement may be requested from the Fund if the reimbursement will not cause the Fund’s annual expense ratio to exceed the lesser of (a) the expense limitation amount in effect at the time such fees were waived or payments made, or (b) the expense limitation amount in effect at the time of the reimbursement. The Advisor may recapture all or a portion of this amount no later than December 31, of the years stated below.
Kaizen Hedged Premium Spreads
Fund
Altrius Enhanced
Income Fund
MarketGrader 100
Enhanced Index Fund 2019 $ 102,973 $ 258,736 $ 274,302 2020 51,491 90,683 59,871 Total $ 154,464 $ 349,419 $ 334,173
31
Kaizen Funds NOTES TO FINANCIAL STATEMENTS – Continued June 30, 2017 (Unaudited)
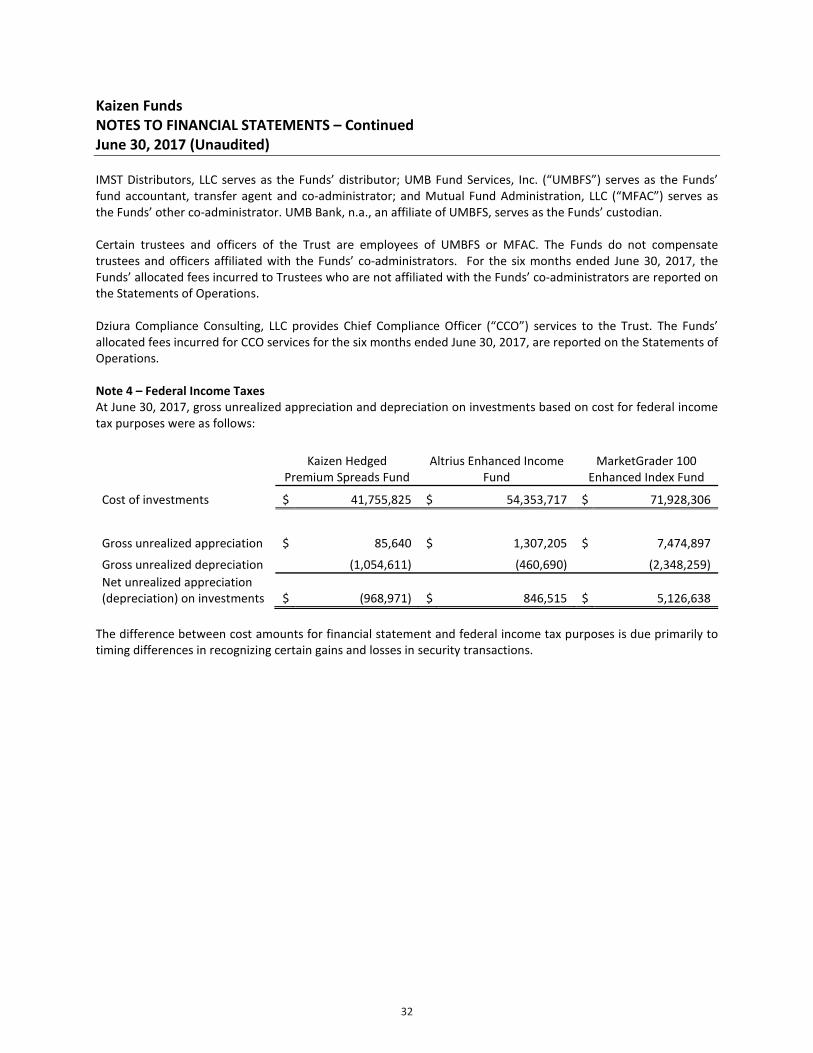
IMST Distributors, LLC serves as the Funds’ distributor; UMB Fund Services, Inc. (“UMBFS”) serves as the Funds’ fund accountant, transfer agent and co-administrator; and Mutual Fund Administration, LLC (“MFAC”) serves as the Funds’ other co-administrator. UMB Bank, n.a., an affiliate of UMBFS, serves as the Funds’ custodian. Certain trustees and officers of the Trust are employees of UMBFS or MFAC. The Funds do not compensate trustees and officers affiliated with the Funds’ co-administrators. For the six months ended June 30, 2017, the Funds’ allocated fees incurred to Trustees who are not affiliated with the Funds’ co-administrators are reported on the Statements of Operations. Dziura Compliance Consulting, LLC provides Chief Compliance Officer (“CCO”) services to the Trust. The Funds’ allocated fees incurred for CCO services for the six months ended June 30, 2017, are reported on the Statements of Operations. Note 4 – Federal Income Taxes At June 30, 2017, gross unrealized appreciation and depreciation on investments based on cost for federal income tax purposes were as follows:
Kaizen Hedged Premium Spreads Fund
Altrius Enhanced Income Fund
MarketGrader 100 Enhanced Index Fund
Cost of investments $ 41,755,825 $ 54,353,717 $ 71,928,306
Gross unrealized appreciation $ 85,640 $ 1,307,205 $ 7,474,897 Gross unrealized depreciation (1,054,611) (460,690) (2,348,259) Net unrealized appreciation (depreciation) on investments $ (968,971) $ 846,515 $ 5,126,638
The difference between cost amounts for financial statement and federal income tax purposes is due primarily to timing differences in recognizing certain gains and losses in security transactions.
32
Kaizen Funds NOTES TO FINANCIAL STATEMENTS – Continued June 30, 2017 (Unaudited)
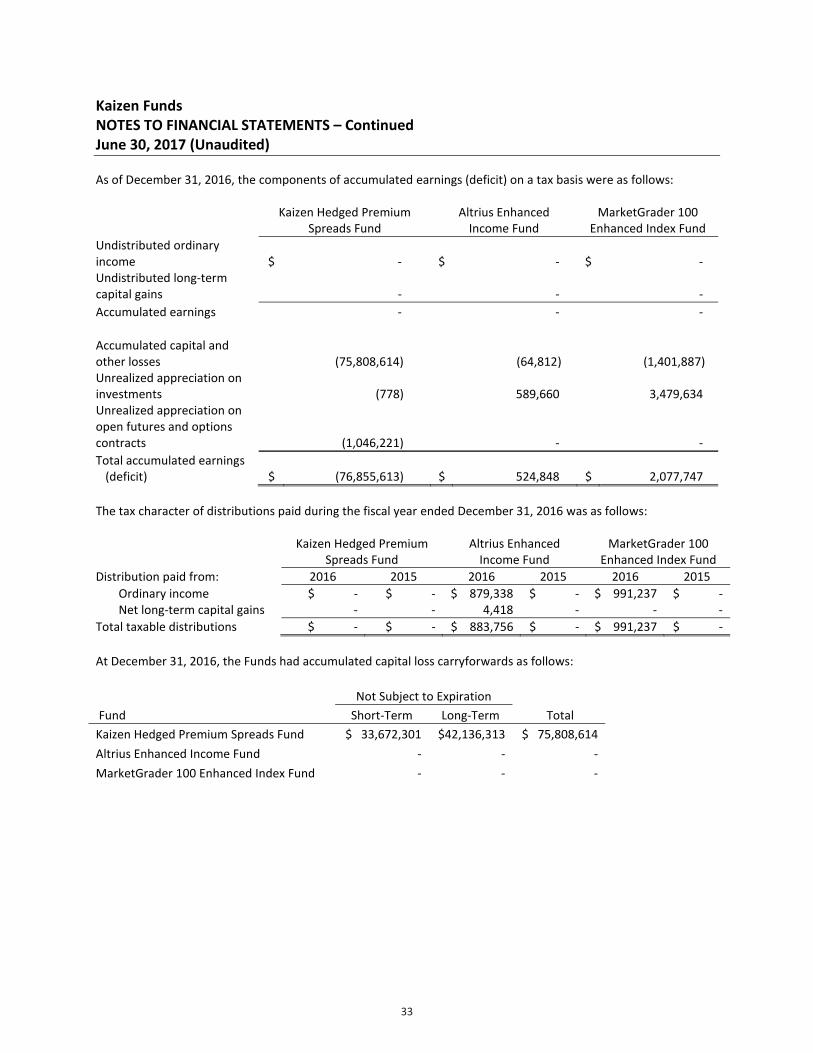
As of December 31, 2016, the components of accumulated earnings (deficit) on a tax basis were as follows:
Kaizen Hedged Premium
Spreads Fund Altrius Enhanced
Income Fund MarketGrader 100
Enhanced Index Fund Undistributed ordinary income $ - $ - $ - Undistributed long-term capital gains - - - Accumulated earnings - - -
Accumulated capital and other losses (75,808,614) (64,812) (1,401,887) Unrealized appreciation on investments (778) 589,660 3,479,634 Unrealized appreciation on open futures and options contracts (1,046,221) - - Total accumulated earnings
(deficit) $ (76,855,613) $ 524,848 $ 2,077,747 The tax character of distributions paid during the fiscal year ended December 31, 2016 was as follows: Kaizen Hedged Premium
Spreads Fund Altrius Enhanced
Income Fund MarketGrader 100
Enhanced Index Fund Distribution paid from: 2016 2015 2016 2015 2016 2015
Ordinary income $ - $ - $ 879,338 $ - $ 991,237 $ - Net long-term capital gains - - 4,418 - - -
Total taxable distributions $ - $ - $ 883,756 $ - $ 991,237 $ - At December 31, 2016, the Funds had accumulated capital loss carryforwards as follows:
Not Subject to Expiration Fund Short-Term Long-Term Total Kaizen Hedged Premium Spreads Fund $ 33,672,301 $42,136,313 $ 75,808,614 Altrius Enhanced Income Fund - - - MarketGrader 100 Enhanced Index Fund - - -
33

Kaizen Funds NOTES TO FINANCIAL STATEMENTS – Continued June 30, 2017 (Unaudited)
Post-October capital losses incurred after October 31 and within the taxable year are deemed to arise on the first business day of the Funds next taxable year. As of December 31, 2016, the following Funds had Post-October capital losses, which are deferred until January 1, 2107 for tax purposes:
Under the Regulated Investment Company Modernization Act of 2010 (the "Act"), the Fund is permitted to carryforward capital losses incurred in taxable years beginning after December 22, 2010, for an unlimited period. However, any losses incurred during those future taxable years will be required to be utilized prior to the losses incurred in pre-enactment taxable years. As a result of this ordering rule, pre-enactment capital loss carryforwards may be more likely to expire unused. Additionally, post-enactment capital losses that are carried forward will retain their character as either short-term or long-term capital losses rather than being considered all short-term as under previous law. Note 5 – Redemption Fee The Funds may impose a redemption fee of 2.00% of the total redemption amount on all shares redeemed within 30 days of purchase. For the six months ended June 30, 2017 and the year ended December 31, 2016, the Kaizen Hedged Premium Spreads Fund received $2,097 and $8,748, respectively, in redemption fees. For the six months ended June 30, 2017 and the year ended December 31, 2016, the Altrius Enhanced Income Fund received $5,241 and $26,440, respectively, in redemption fees. For the six months ended June 30, 2017 and the year ended December 31, 2016, the MarketGrader 100 Enhanced Index Fund received $3,872 and $11,626, respectively, in redemption fees. Note 6 – Investment Transactions For the six months ended June 30, 2017, purchases and sales of investments, excluding short-term investments, were as follows:
Purchases Sales
Proceeds from
Securities Sold Short
Cover Short Securities
Kaizen Hedged Premium Spreads Fund $ - $ - $ - $ - Altrius Enhanced Income Fund 19,250,721 4,715,131 972,375 - MarketGrader 100 Enhanced Index Fund 67,188,689 42,836,800 - -
Note 7 – Shareholder Servicing Plan The Trust, on behalf of each Fund, has adopted a Shareholder Servicing Plan to pay a fee at an annual rate of up to 0.15% of the Funds’ average daily net assets of shares serviced by shareholder servicing agents who provide administrative and support services to their customers. For the six months ended June 30, 2017, shareholder servicing fees incurred are disclosed on the Statements of Operations.
Post-October Capital Losses Fund Short-Term Long-Term Total Kaizen Hedged Premium Spreads Fund $ - $ - $ - Altrius Enhanced Income Fund 116,087 - 116,087 MarketGrader 100 Enhanced Index Fund 546,921 854,966 1,401,887
34

Kaizen Funds NOTES TO FINANCIAL STATEMENTS – Continued June 30, 2017 (Unaudited)
Note 8 – Indemnifications In the normal course of business, the Funds enter into contracts that contain a variety of representations which provide general indemnifications. The Funds’ maximum exposure under these arrangements is unknown, as this would involve future claims that may be made against the Funds that have not yet occurred. However, the Funds expect the risk of loss to be remote. Note 9 – Fair Value Measurements and Disclosure Fair Value Measurements and Disclosures defines fair value, establishes a framework for measuring fair value in accordance with GAAP, and expands disclosure about fair value measurements. It also provides guidance on determining when there has been a significant decrease in the volume and level of activity for an asset or a liability, when a transaction is not orderly, and how that information must be incorporated into a fair value measurement. Under Fair Value Measurements and Disclosures, various inputs are used in determining the value of the Funds’ investments. These inputs are summarized into three broad Levels as described below:
Level 1 – Unadjusted quoted prices in active markets for identical assets or liabilities that the Funds have the ability to access. Level 2 – Observable inputs other than quoted prices included in Level 1 that are observable for the asset or liability, either directly or indirectly. These inputs may include quoted prices for the identical instrument on an inactive market, prices for similar instruments, interest rates, prepayment speeds, credit risk, yield curves, default rates and similar data. Level 3 – Unobservable inputs for the asset or liability, to the extent relevant observable inputs are not available, representing the Funds’ own assumptions about the assumptions a market participant would use in valuing the asset or liability, and would be based on the best information available.
The availability of observable inputs can vary from security to security and is affected by a wide variety of factors, including for example, the type of security, whether the security is new and not yet established in the marketplace, the liquidity of markets, and other characteristics particular to the security. To the extent that valuation is based on models or inputs that are less observable or unobservable in the market, the determination of fair value requires more judgment. Accordingly, the degree of judgment exercised in determining fair value is greatest for instruments categorized in Level 3. The inputs to measure fair value may fall into different Levels of the fair value hierarchy. In such cases, for disclosure purposes, the Level in the fair value hierarchy within which the fair value measurement falls in its entirety, is determined based on the lowest Level input that is significant to the fair value measurement in its entirety.
35
Kaizen Funds NOTES TO FINANCIAL STATEMENTS – Continued June 30, 2017 (Unaudited)
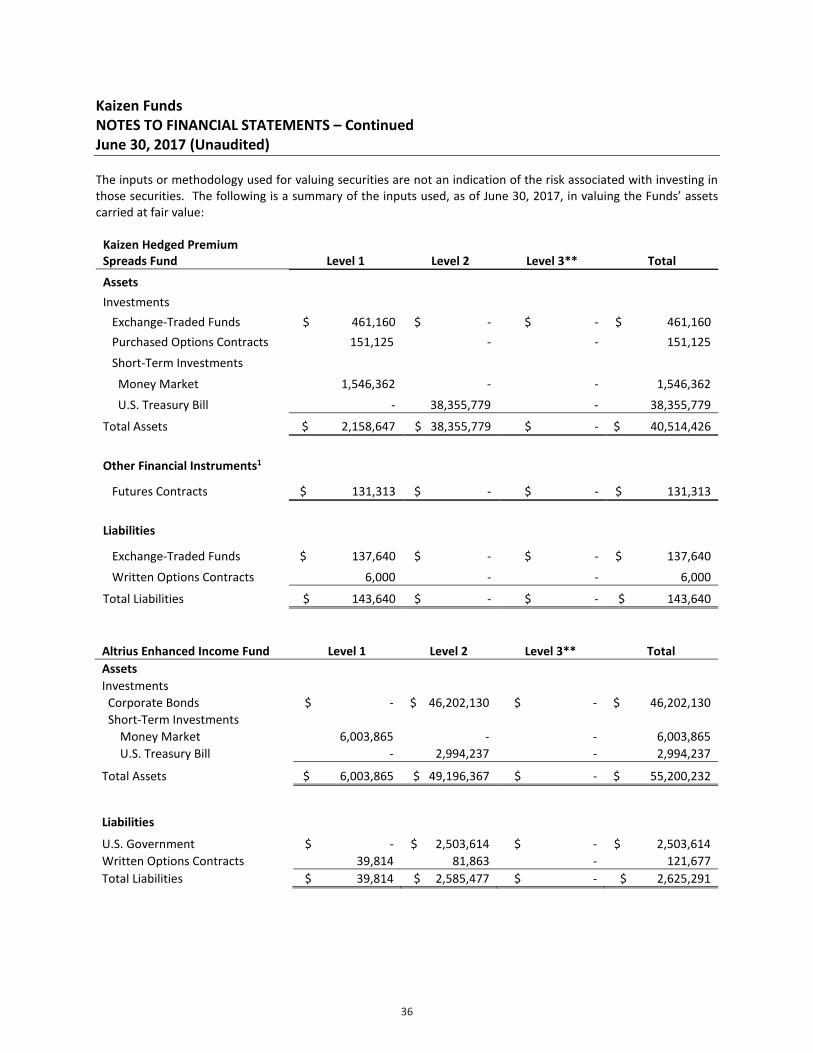
The inputs or methodology used for valuing securities are not an indication of the risk associated with investing in those securities. The following is a summary of the inputs used, as of June 30, 2017, in valuing the Funds’ assets carried at fair value:
Kaizen Hedged Premium Spreads Fund Level 1 Level 2 Level 3** Total Assets Investments Exchange-Traded Funds $ 461,160 $ - $ - $ 461,160 Purchased Options Contracts 151,125 - - 151,125 Short-Term Investments Money Market 1,546,362 - - 1,546,362 U.S. Treasury Bill - 38,355,779 - 38,355,779 Total Assets $ 2,158,647 $ 38,355,779 $ - $ 40,514,426
Other Financial Instruments1
Futures Contracts $ 131,313 $ - $ - $ 131,313 Liabilities
Exchange-Traded Funds $ 137,640 $ - $ - $ 137,640 Written Options Contracts 6,000 - - 6,000 Total Liabilities $ 143,640 $ - $ - $ 143,640
Altrius Enhanced Income Fund Level 1 Level 2 Level 3** Total Assets Investments Corporate Bonds $ - $ 46,202,130 $ - $ 46,202,130 Short-Term Investments Money Market 6,003,865 - - 6,003,865 U.S. Treasury Bill - 2,994,237 - 2,994,237
Total Assets $ 6,003,865 $ 49,196,367 $ - $ 55,200,232
Liabilities
U.S. Government $ - $ 2,503,614 $ - $ 2,503,614 Written Options Contracts 39,814 81,863 - 121,677 Total Liabilities $ 39,814 $ 2,585,477 $ - $ 2,625,291
36

Kaizen Funds NOTES TO FINANCIAL STATEMENTS – Continued June 30, 2017 (Unaudited)
MarketGrader 100 Enhanced Index Fund Level 1 Level 2* Level 3** Total Investments
Common Stocks2 $ 75,558,007 $ - $ - $ 75,558,007 Short-Term Investments 1,496,937 - - 1,496,937
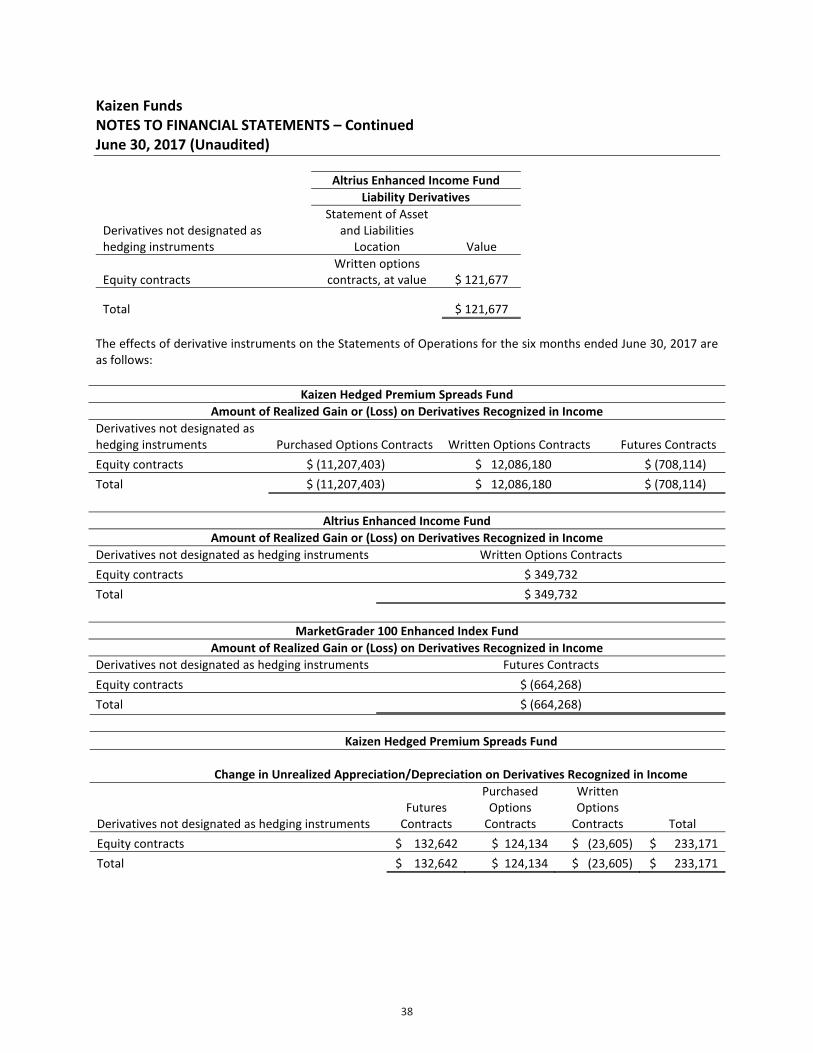
Total Investments $ 77,054,944 $ - $ - $ 77,054,944 * The Fund did not hold any Level 2 securities at period end. ** The Fund did not hold any Level 3 securities at period end. 1 Other financial instruments are derivative instruments such as futures. Futures contracts are valued at the unrealized appreciation (depreciation) on the instrument. 2 All common stocks held in the Fund are Level 1 securities. For a detailed break-out of common stocks by major industry classification, please refer to the Schedule of Investments. Transfers between Levels 1, 2 or 3 are recognized at the end of the reporting period. There were no transfers between Levels at period end. Note 10 – Derivatives and Hedging Disclosures Derivatives and Hedging requires enhanced disclosures about the Funds’ derivative and hedging activities, including how such activities are accounted for and their effects on the Funds’ financial position, performance and cash flows. The effects of these derivative instruments on the Funds’ financial position and financial performance as reflected in the Statements of Assets and Liabilities and Statements of Operations are presented in the tables below. The fair values of derivative instruments as of June 30, 2017 by risk category are as follows:
Kaizen Hedged Premium Spreads Fund Asset Derivatives Liability Derivatives
Derivatives not designated as hedging instruments
Statement of Asset and Liabilities
Location Value
Statement of Asset and Liabilities
Location Value
Equity contracts Purchased options contracts, at value $ 151,125
Written options contracts, at value $ 6,000
Equity contracts
Unrealized appreciation on
futures contracts 141,911
Unrealized depreciation on
futures contracts 10,597
Total $ 293,036 $ 16,597
37
Kaizen Funds NOTES TO FINANCIAL STATEMENTS – Continued June 30, 2017 (Unaudited)
Altrius Enhanced Income Fund Liability Derivatives
Derivatives not designated as hedging instruments
Statement of Asset and Liabilities
Location Value
Equity contracts Written options
contracts, at value $ 121,677
Total $ 121,677 The effects of derivative instruments on the Statements of Operations for the six months ended June 30, 2017 are as follows:
Kaizen Hedged Premium Spreads Fund
Change in Unrealized Appreciation/Depreciation on Derivatives Recognized in Income
Derivatives not designated as hedging instruments Futures
Contracts
Purchased Options
Contracts
Written Options
Contracts Total Equity contracts $ 132,642 $ 124,134 $ (23,605) $ 233,171 Total $ 132,642 $ 124,134 $ (23,605) $ 233,171
Kaizen Hedged Premium Spreads Fund Amount of Realized Gain or (Loss) on Derivatives Recognized in Income
Derivatives not designated as hedging instruments Purchased Options Contracts Written Options Contracts Futures Contracts Equity contracts $ (11,207,403) $ 12,086,180 $ (708,114) Total $ (11,207,403) $ 12,086,180 $ (708,114)
Altrius Enhanced Income Fund Amount of Realized Gain or (Loss) on Derivatives Recognized in Income
Derivatives not designated as hedging instruments Written Options Contracts Equity contracts $ 349,732 Total $ 349,732
MarketGrader 100 Enhanced Index Fund Amount of Realized Gain or (Loss) on Derivatives Recognized in Income
Derivatives not designated as hedging instruments Futures Contracts Equity contracts $ (664,268) Total $ (664,268)
38

Kaizen Funds NOTES TO FINANCIAL STATEMENTS – Continued June 30, 2017 (Unaudited)
Altrius Enhanced Income Fund
Change in Unrealized Appreciation/Depreciation on Derivatives Recognized in Income
Derivatives not designated as hedging instruments Written Options
Contracts Total Equity contracts $ (59,556) $ (59,556) Total $ (59,556) $ (59,556) The number of contracts is included on the Schedule of Investments. The quarterly average volumes of derivative instruments as of June 30, 2017 are as follows:
Kaizen Hedged Premium Spreads Fund Derivatives not designated as hedging instruments
Equity contracts Purchased options contracts Number of contracts 4,633 Equity contracts Written options contracts Number of contracts (3,200) Equity contracts Long futures contracts Number of contracts 63 Equity contracts Short futures contracts Number of contracts (65)
Altrius Enhanced Income Fund Derivatives not designated as hedging instruments
Equity contracts Written options contracts Number of contracts (1,001) Note 11 – Repurchase-to-Maturity Transactions, Repurchase Financings and Disclosures Repurchase-to-Maturity Transactions, Repurchase Financings, and Disclosures requires an entity to modify accounting for repurchase-to-maturity transactions and repurchase financing arrangements, as well as modify required disclosures for repurchase agreements, securities lending transactions, and repurchase-to-maturity transactions that are accounted for as secured borrowings. Management has evaluated the impact on the financial statement disclosures and determined that there is no effect. Note 12 – Disclosure for Investments in Certain Entities that Calculate Net Asset Value per Share (or Its Equivalent) Disclosure for Investments in Certain Entities that Calculate Net Asset Value per Share (or Its Equivalent) removes the requirement to categorize within the fair value hierarchy investments measured using the net asset value per share ("NAV") practical expedient, as well as removes certain disclosure requirements for investments that qualify, but do not utilize, the NAV practical expedient. Management has evaluated the impact on the financial statement disclosures and determined that there is no effect. Note 13 – Recently Issued Accounting Pronouncements In October 2016, the U.S. Securities and Exchange Commission adopted new rules and amended existing rules (together, “final rules”) intended to modernize the reporting and disclosure of information by registered investment companies. In part, the final rules amend Regulation S-X and require standardized, enhanced disclosure about derivatives in investment company financial statements, as well as other amendments. The compliance date for the amendments to Regulation S-X is August 1, 2017. Management is currently evaluating the impact that the adoption of the amendments to Regulation S-X will have on the financial statements and related disclosures.
39

Kaizen Funds NOTES TO FINANCIAL STATEMENTS – Continued June 30, 2017 (Unaudited)
Note 14 – Events Subsequent to the Fiscal Period End The Funds have adopted financial reporting rules regarding subsequent events which require an entity to recognize in the financial statements the effects of all subsequent events that provide additional evidence about conditions that existed at the date of the balance sheet. Management has evaluated the Funds’ related events and transactions that occurred through the date of issuance of the Funds’ financial statements. There were no events or transactions that occurred during this period that materially impacted the amounts or disclosures in the Funds’ financial statements.
40
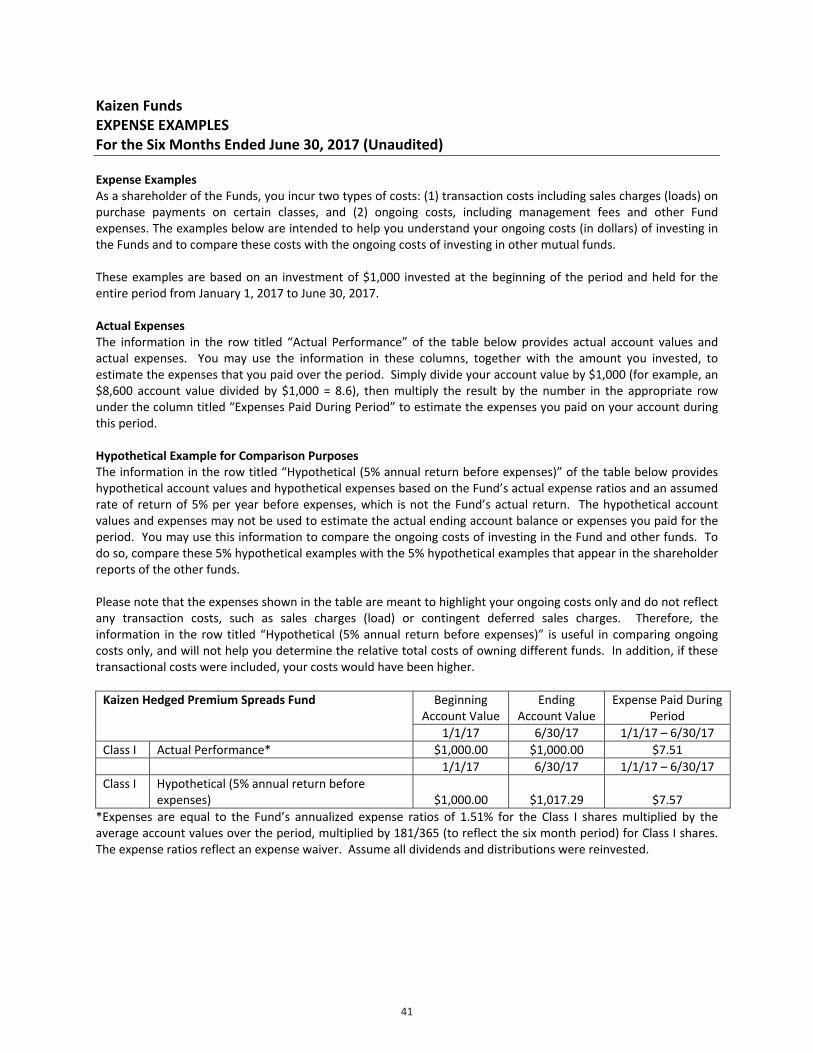
Kaizen Funds EXPENSE EXAMPLES For the Six Months Ended June 30, 2017 (Unaudited)
Expense Examples As a shareholder of the Funds, you incur two types of costs: (1) transaction costs including sales charges (loads) on purchase payments on certain classes, and (2) ongoing costs, including management fees and other Fund expenses. The examples below are intended to help you understand your ongoing costs (in dollars) of investing in the Funds and to compare these costs with the ongoing costs of investing in other mutual funds. These examples are based on an investment of $1,000 invested at the beginning of the period and held for the entire period from January 1, 2017 to June 30, 2017. Actual Expenses The information in the row titled “Actual Performance” of the table below provides actual account values and actual expenses. You may use the information in these columns, together with the amount you invested, to estimate the expenses that you paid over the period. Simply divide your account value by $1,000 (for example, an $8,600 account value divided by $1,000 = 8.6), then multiply the result by the number in the appropriate row under the column titled “Expenses Paid During Period” to estimate the expenses you paid on your account during this period. Hypothetical Example for Comparison Purposes The information in the row titled “Hypothetical (5% annual return before expenses)” of the table below provides hypothetical account values and hypothetical expenses based on the Fund’s actual expense ratios and an assumed rate of return of 5% per year before expenses, which is not the Fund’s actual return. The hypothetical account values and expenses may not be used to estimate the actual ending account balance or expenses you paid for the period. You may use this information to compare the ongoing costs of investing in the Fund and other funds. To do so, compare these 5% hypothetical examples with the 5% hypothetical examples that appear in the shareholder reports of the other funds. Please note that the expenses shown in the table are meant to highlight your ongoing costs only and do not reflect any transaction costs, such as sales charges (load) or contingent deferred sales charges. Therefore, the information in the row titled “Hypothetical (5% annual return before expenses)” is useful in comparing ongoing costs only, and will not help you determine the relative total costs of owning different funds. In addition, if these transactional costs were included, your costs would have been higher.
Kaizen Hedged Premium Spreads Fund Beginning Account Value
Ending Account Value
Expense Paid During Period
1/1/17 6/30/17 1/1/17 – 6/30/17 Class I Actual Performance* $1,000.00 $1,000.00 $7.51 1/1/17 6/30/17 1/1/17 – 6/30/17 Class I Hypothetical (5% annual return before
expenses) $1,000.00 $1,017.29 $7.57 *Expenses are equal to the Fund’s annualized expense ratios of 1.51% for the Class I shares multiplied by the average account values over the period, multiplied by 181/365 (to reflect the six month period) for Class I shares. The expense ratios reflect an expense waiver. Assume all dividends and distributions were reinvested.
41

Kaizen Funds EXPENSE EXAMPLES - Continued For the Six Months Ended June 30, 2017 (Unaudited)
Altrius Enhanced Income Fund Beginning Account Value
Ending Account Value
Expense Paid During Period
1/1/17 6/30/17 1/1/17 – 6/30/17 Class I Actual Performance* $1,000.00 $1,034.60 $8.34
1/1/17 6/30/17 1/1/17 – 6/30/17 Class I Hypothetical (5% annual return before
expenses) $1,000.00 $1,016.60 $8.27 *Expenses are equal to the Fund’s annualized expense ratios of 1.65% for the Class I shares multiplied by theaverage account values over the period, multiplied by 181/365 (to reflect the six month period) for Class I shares.The expense ratios reflect an expense waiver. Assume all dividends and distributions were reinvested.
MarketGrader 100 Enhanced Index Fund Beginning Account Value
Ending Account Value
Expense Paid During Period
1/1/17 6/30/17 1/1/17 – 6/30/17 Class I Actual Performance* $1,000.00 $1,091.60 $7.81
1/1/17 6/30/17 1/1/17 – 6/30/17 Class I Hypothetical (5% annual return before
expenses) $1,000.00 $1,017.33 $7.53 *Expenses are equal to the Fund’s annualized expense ratios of 1.51% for the Class I shares multiplied by theaverage account values over the period, multiplied by 181/365 (to reflect the six month period) for Class I shares.The expense ratios reflect an expense waiver. Assume all dividends and distributions were reinvested.
42

This page is intentionally left blank

This page is intentionally left blank

Kaizen Funds Each a series of Investment Managers Series Trust II
Investment Advisor Kaizen Advisory, LLC
1745 S. Naperville Road, Suite 103 Wheaton, Illinois 60189
Sub-Advisors Altrius Capital Management, Inc.
1323 Commerce Drive New Bern, North Carolina 28562
Two Fish Management, LLC 9333 N Meridian St., Suite 222
Indianapolis, Indiana 46260
Custodian UMB Bank, n.a.
928 Grand Boulevard, 5th Floor Kansas City, Missouri 64106
Fund Co-Administrator Mutual Fund Administration, LLC
2220 E. Route 66, Suite 226 Glendora, California 91740
Fund Co-Administrator, Transfer Agent and Fund Accountant UMB Fund Services, Inc. 235 West Galena Street
Milwaukee, Wisconsin 53212
Distributor IMST Distributors, LLC
Three Canal Plaza, Suite 100 Portland, Maine 04101
www.foreside.com
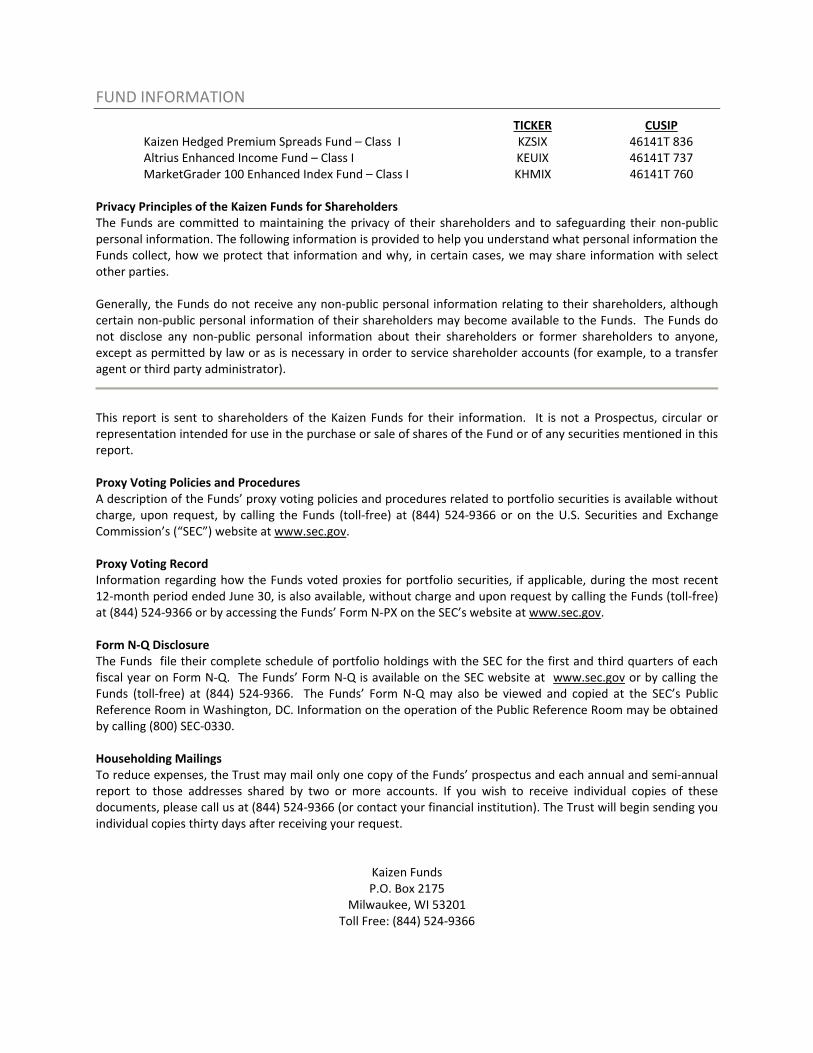
FUND INFORMATION
TICKER CUSIP Kaizen Hedged Premium Spreads Fund – Class I KZSIX 46141T 836 Altrius Enhanced Income Fund – Class I KEUIX 46141T 737 MarketGrader 100 Enhanced Index Fund – Class I KHMIX 46141T 760
Privacy Principles of the Kaizen Funds for Shareholders The Funds are committed to maintaining the privacy of their shareholders and to safeguarding their non-public personal information. The following information is provided to help you understand what personal information the Funds collect, how we protect that information and why, in certain cases, we may share information with select other parties.
Generally, the Funds do not receive any non-public personal information relating to their shareholders, although certain non-public personal information of their shareholders may become available to the Funds. The Funds do not disclose any non-public personal information about their shareholders or former shareholders to anyone, except as permitted by law or as is necessary in order to service shareholder accounts (for example, to a transfer agent or third party administrator).
This report is sent to shareholders of the Kaizen Funds for their information. It is not a Prospectus, circular or representation intended for use in the purchase or sale of shares of the Fund or of any securities mentioned in this report. Proxy Voting Policies and Procedures A description of the Funds’ proxy voting policies and procedures related to portfolio securities is available without charge, upon request, by calling the Funds (toll-free) at (844) 524-9366 or on the U.S. Securities and Exchange Commission’s (“SEC”) website at www.sec.gov. Proxy Voting Record Information regarding how the Funds voted proxies for portfolio securities, if applicable, during the most recent 12-month period ended June 30, is also available, without charge and upon request by calling the Funds (toll-free) at (844) 524-9366 or by accessing the Funds’ Form N-PX on the SEC’s website at www.sec.gov. Form N-Q Disclosure The Funds file their complete schedule of portfolio holdings with the SEC for the first and third quarters of each fiscal year on Form N-Q. The Funds’ Form N-Q is available on the SEC website at www.sec.gov or by calling the Funds (toll-free) at (844) 524-9366. The Funds’ Form N-Q may also be viewed and copied at the SEC’s Public Reference Room in Washington, DC. Information on the operation of the Public Reference Room may be obtained by calling (800) SEC-0330. Householding Mailings To reduce expenses, the Trust may mail only one copy of the Funds’ prospectus and each annual and semi-annual report to those addresses shared by two or more accounts. If you wish to receive individual copies of these documents, please call us at (844) 524-9366 (or contact your financial institution). The Trust will begin sending you individual copies thirty days after receiving your request.
Kaizen Funds P.O. Box 2175
Milwaukee, WI 53201 Toll Free: (844) 524-9366