K King’s Academy - Milwaukeecity.milwaukee.gov/.../ar2011-12KingsAcademyYr2.pdfbasic or minimal on...
90
King’s Academy Programmatic Profile and Educational Performance 2011–12 School Year Report Date: September 2012 Prepared by: Janice Ereth, PhD Susan Gramling Andrea Bogie A nonprofit social research organization and division of the National Council on Crime and Delinquency 426 S. Yellowstone Drive, Suite 250 Madison, WI 53719 Voice (800) 306-6223 fax (608) 831-6446 www.nccdglobal.org
-
Upload
truongtuyen -
Category
Documents
-
view
216 -
download
2
Transcript of K King’s Academy - Milwaukeecity.milwaukee.gov/.../ar2011-12KingsAcademyYr2.pdfbasic or minimal on...

K
King’s Academy
Programmatic Profile and Educational Performance 2011–12 School Year Report Date: September 2012
Prepared by: Janice Ereth, PhD Susan Gramling Andrea Bogie
A nonprofit social research organization and division of the National Council on Crime and Delinquency
426 S. Yellowstone Drive, Suite 250 Madison, WI 53719
Voice (800) 306-6223 fax (608) 831-6446 www.nccdglobal.org

© 2012 by NCCD, All Rights Reserved https://sharepoint.nccdcrc.org/Projects/Project Documents/USA/Wisconsin/508WI_Milw/2011-12/Kings/Kings Academy 2011-12 Yr 2 FINAL.docx
TABLE OF CONTENTS
EXECUTIVE SUMMARY .............................................................................................................................................................. i I. INTRODUCTION .......................................................................................................................................................... 1 II. PROGRAMMATIC PROFILE ...................................................................................................................................... 2 A. Board of Directors ...................................................................................................................................... 2 B. Philosophy of Educational Methodology .......................................................................................... 3 1. Philosophy .................................................................................................................................... 3 2. Description of Educational Programs and Curriculum ................................................. 3 C. Student Population ................................................................................................................................... 5 D. School Structure ......................................................................................................................................... 7 1. Areas of Instruction.................................................................................................................... 7 2. Classrooms .................................................................................................................................... 7 3. Teacher Information .................................................................................................................. 8 4. Hours of Instruction/School Calendar ............................................................................. 10 5. Parent and Family Involvement ......................................................................................... 11 6. Waiting List ................................................................................................................................ 12 7. Disciplinary Policy ................................................................................................................... 12 8. Activities for Continuous School Improvement ........................................................... 13 9. Graduation and High School Information ...................................................................... 14 III. EDUCATIONAL PERFORMANCE ......................................................................................................................... 15 A. Attendance ................................................................................................................................................ 15 B. Parent Participation ................................................................................................................................ 16 C. Special Education Needs ...................................................................................................................... 16 D. Local Measures of Educational Performance ................................................................................ 17 1. Literacy ........................................................................................................................................ 20
a. Students at or Above National Average (Normative Mean) for Their Grade-Level Average on the Fall MAP Reading Test .................................. 21
b. Students Below the National Average (Normative Mean) for Their Grade Level on the Fall MAP Reading Test ..................................................... 23
2. Math ............................................................................................................................................. 24 a. MAP Math Assessment .......................................................................................... 24
i. Students at or Above the National Average (Normative Mean) for Their Grade Level on the Fall MAP Math Test ......................... 25
ii. Students Below the National Average (Normative Mean) for Their Grade Level on the Fall MAP Math Test ................................ 26
b. Saxon Math Assessment ....................................................................................... 27 3. Writing ......................................................................................................................................... 28 4. IEP Progress for Special Education Students ................................................................. 29 E. External Standardized Measures of Educational Performance .............................................. 29 1. SDRT for First Graders ............................................................................................................ 30 2. SDRT for Second Graders ...................................................................................................... 32 3. SDRT for Third Graders .......................................................................................................... 33

© 2012 by NCCD, All Rights Reserved https://sharepoint.nccdcrc.org/Projects/Project Documents/USA/Wisconsin/508WI_Milw/2011-12/Kings/Kings Academy 2011-12 Yr 2 FINAL.docx
TABLE OF CONTENTS (continued) 4. WKCE for Third through Eighth Graders ......................................................................... 34 a. Reading ....................................................................................................................... 34 b. Math ............................................................................................................................. 35 c. Language Arts ........................................................................................................... 36 d. Writing ......................................................................................................................... 37 F. Multiple-Year Student Progress ......................................................................................................... 38 1. First Through Third Graders ................................................................................................ 38 a. Overall.......................................................................................................................... 38 b. Students at or Above GLE ..................................................................................... 39 c. Students Below GLE ................................................................................................ 40 2. Third Through Eighth Graders ............................................................................................ 40 a. Progress for Students Who Met Proficiency Level Expectations ............ 40 b. Progress for Students Who Did Not Meet Proficiency Level
Expectations .............................................................................................................. 42 G. School Scorecard ..................................................................................................................................... 43 H. Annual Review of the School’s Adequate Yearly Progress....................................................... 43 I. Parent/Teacher/Board Satisfaction Regarding Student Academic Progress..................... 44 IV. SUMMARY AND RECOMMENDATIONS ........................................................................................................... 44
i © 2012 by NCCD, All Rights Reserved https://sharepoint.nccdcrc.org/Projects/Project Documents/USA/Wisconsin/508WI_Milw/2011-12/Kings/Kings Academy 2011-12 Yr 2 FINAL.docx
EXECUTIVE SUMMARY for
King’s Academy 2011–12
This is the second annual report on the operation of King’s Academy and is a result of intensive work undertaken by the City of Milwaukee Charter School Review Committee (CSRC), King’s Academy staff, and the Children’s Research Center (CRC). Based on the information gathered and discussed in the attached report, CRC has determined the following findings. I. CONTRACT COMPLIANCE SUMMARY
For the 2011–12 academic year, King’s Academy has met all but three of the provisions of its contract with the City of Milwaukee. The school did not meet the expectations that:
1. At least 75% of the fourth- through eighth- grade student proficient or advanced in
mathematics maintain this proficiency level (actual, 72.2%); 2. At least 60% of the fourth- through eighth- grade students below proficient in reading
will advance one level of proficiency or to the next quartile within their proficiency level (actual, 56.5%); and
3. At least 60% of the fourth- through sixth- grade students below proficient in reading
will advance one level of proficiency or to the next quartile within their proficiency level (actual, 41.7%).
See Appendix A for an outline of specific contract provision compliance information, page references, and a description of whether or not each provision was met. II. Educational Performance A. Local Measures 1. Primary Measures of Academic Progress
The CSRC requires that the school track student progress in reading, writing, mathematics, and special education throughout the year to identify students in need of additional help and to assist teachers in developing strategies to improve the academic performance of all students. In reading:
x Thirty-six (64.3%) students who were at or above the national average (i.e., normative mean) for their grade level at the time of the fall MAP reading test remained at or above the national average at the time of the spring test.
x Forty-three (40.6%) of 106 students below the national average (i.e., normative mean)
for their grade level on the fall Measures of Academic Progress (MAP) reading test reached the average for their grade level or increased at least the difference between

ii © 2012 by NCCD, All Rights Reserved https://sharepoint.nccdcrc.org/Projects/Project Documents/USA/Wisconsin/508WI_Milw/2011-12/Kings/Kings Academy 2011-12 Yr 2 FINAL.docx
fall and spring Rasch Unit (RIT) averages for the functional grade level at which they tested in the fall.
In math:
x Nineteen (54.3%) students at or above the national average (i.e., normative mean) for their grade level at the time of the spring MAP math test remained at or above the national average on the spring test.
x Forty-four (33.8%) of the 130 students who were below the national average (i.e., normative mean) for their grade level on the fall MAP math test either reached the national average for their grade level or reached the spring national average for the grade level at which they tested in the fall.
x Sixty-nine (47.9%) of 144 students who completed the Saxon Math Assessment in the fall of 2011 achieved 70% or more of the benchmarks on the spring test, falling short of the school’s goal of 65%.
In writing:
x Ninety-one (65.0%) of 140 first- through eighth-grade students with fall writing samples earned a score of three or better on the spring sample, meeting the school’s goal that 65% of students earn a three or higher.
2. Secondary Measures of Academic Progress
x Average student attendance was 94.9%, exceeding the school’s goal of 85%. x Parents of 76.9% of 195 students enrolled for the year attended at least one
parent-teacher conference, exceeding the school’s goal of 72%. B. Year-to-Year Academic Achievement on Standardized Tests King’s Academy administered all required standardized tests noted in their contract with the City of Milwaukee. Multiple-year student progress based on standardized test results is described below.
x Stanford Diagnostic Reading Test (SDRT) multiple-year advancement results indicated
that 14 (82.4%) of 17 students who were at or above GLE during the previous school year maintained GLE at the time of the 2011–12 test. This exceeds the CSRC expectation of 75%.
x Students below GLE on the spring 2011 SDRT advanced, on average, 0.9 GLE by the time of the spring 2012 test, falling short of the expectation of more than 1 GLE advance on average.
x Forty-five (91.8%) students who were proficient in reading in 2010–11 maintained
proficiency as measured on the Wisconsin Knowledge and Concepts Examination (WKCE). Twenty-six (72.2%) of 36 students who were proficient in math in 2010–11

iii © 2012 by NCCD, All Rights Reserved https://sharepoint.nccdcrc.org/Projects/Project Documents/USA/Wisconsin/508WI_Milw/2011-12/Kings/Kings Academy 2011-12 Yr 2 FINAL.docx
maintained proficiency as measured on the WKCE. Therefore, the school met the 75% expectation in reading, but not in math.
x Thirteen (56.5%) of 23 students below proficient on the 2010–11 WKCE reading test
showed progress on the 2011–12 WKCE. Fifteen (41.7%) of 36 students who scored basic or minimal on the 2010–11 WKCE math test showed progress on the 2011–12 test. The school fell short of the 60% expectation in both reading and math progress.
C. Scorecard
This year King’s Academy scored 67.5% on the multiple measure scorecard. III. SURVEY/INTERVIEW RESULTS Every other year CRC conducts parent surveys and interviews board members, teachers, and students to obtain feedback on their perceptions about the school. Some of the key results include:
x Parents of 138 of 206 (66.9%) students responded to the survey. Of these, » Most (87.9%) would recommend this school to other parents; and
» More than half (61.7%) rated the school’s overall contribution to their child’s
learning as “excellent,” and 28% as “good.”
x Half (five) of the 10 board members participated in interviews. Of these, » One rated the school as “excellent” overall, and four as “good”;
» Two focused their suggestions for improving the school on reading and math
improvement, one on extending the school year, and another on providing more emphasis on basic education.
x Ten instructional staff participated in interviews. Of these,
» Two (20.0%) indicated the school’s progress toward becoming an excellent
school as “excellent,” six (60.0%) of the teachers indicated the school’s progress as “good,” with two indicating “fair”; and
» Seven (70.0%) rated the school’s contribution to students’ academic progress as “good” and one as “fair.”
x Twenty students were interviewed. Of these,
» The majority (90.0%) indicated that they had improved in reading, and 65% reported improving in math at the school; and
» Eighteen (90.0%) said that they felt safe in school.

iv © 2012 by NCCD, All Rights Reserved https://sharepoint.nccdcrc.org/Projects/Project Documents/USA/Wisconsin/508WI_Milw/2011-12/Kings/Kings Academy 2011-12 Yr 2 FINAL.docx
IV. RECOMMENDATIONS FOR SCHOOL IMPROVEMENT After reviewing the information in this report and considering the information gathered during the administration interview in May 2012, CRC and the school jointly recommend that the focus of the 2012–13 school year be to continue to differentiate instruction based on students’ needs by conducting the following activities:
x Implement the Compass Learning software to improve student needs that are identified by MAP testing. Compass Learning is a personalized approach to skill development;
x Improve communication between administrators and teaching staff regarding
discipline by developing a uniform discipline plan with teacher input; and x Develop a school-wide educational plan based on student data.
V. CRC’s RECOMMENDATIONS This report covers the second year of King’s Academy’s operation as a City of Milwaukee charter school. Based on current and past contract compliance and the scorecard results, CRC recommends that because this is only its second year of operation, King’s Academy continue regular, annual academic monitoring and reporting.

1 © 2012 by NCCD, All Rights Reserved https://sharepoint.nccdcrc.org/Projects/Project Documents/USA/Wisconsin/508WI_Milw/2011-12/Kings/Kings Academy 2011-12 Yr 2 FINAL.docx
I. INTRODUCTION This is the second annual program monitoring report to address educational outcomes for
King’s Academy, one of five schools chartered by the City of Milwaukee for the academic year 2011–
12. This report focuses on the educational component of the monitoring program undertaken by the
City of Milwaukee Charter School Review Committee (CSRC) and was prepared as a result of a contract
between the CSRC and the Children’s Research Center (CRC).1
The following process was used to gather the information in this report.
1. CRC staff assisted the school in developing its student learning memorandum (or
“learning memo”). 2. In the fall, CRC staff visited the school to conduct a structured interview with the
director of education, the principal, and other members of the administrative team. CRC staff made subsequent visits to the school to clarify the data requirements and the data submission process. During the year, additional site visits were made to observe classroom activities, student-teacher interactions, parent-staff exchanges, and overall school operations. At the end of the school year, a structured interview was conducted with the director of education and the principal to review the year and develop recommendations for school improvement.
3. CRC staff interviewed a random selection of students, 10 teachers, and members of the
board of directors. 4. The school distributed surveys to parents of all students. CRC contacted parents who
did not submit a survey to conduct the survey via telephone. 5. CRC staff read case files for selected special education students to ensure that
individualized education programs (IEPs) were up-to-date. 6. The school provided electronic and paper data to CRC. Data were compiled and
analyzed at CRC.
1 CRC is a nonprofit social science research organization and division of the National Council on Crime and Delinquency.

2 © 2012 by NCCD, All Rights Reserved https://sharepoint.nccdcrc.org/Projects/Project Documents/USA/Wisconsin/508WI_Milw/2011-12/Kings/Kings Academy 2011-12 Yr 2 FINAL.docx
II. PROGRAMMATIC PROFILE King’s Academy
7798 N. 60th Street Milwaukee, WI 53223 Phone Number: 414-371-9100 School Website: http://www.kacsmilw.org Director of Education: Ms. Mondell Mayfield
King’s Academy, formerly known as King’s Academy Christian School, was founded in 1999 as
a private, tuition-based school affiliated with Christ the King Baptist Church. The school was
restructured and opened as a City of Milwaukee-chartered school in September 2010. The school is
housed in a facility on the northwest side of Milwaukee, and serves students from K4 through eighth
grade.
A. Board of Directors
King’s Academy’s board of directors consists of 10 members; one of the members acts as the
board president. The director of education and the financial manager report to the board of directors.2
Five of the 10 members of the board participated in a phone interview conducted by CRC staff
using a prepared interview guide. One board member has served on the board for 13 years, another
for 11, one for 10 years, one for five, and one for three years (note that the school had been in
existence prior to being chartered by the City of Milwaukee). These board members represented
experience as a professor at the Milwaukee Area Technical College, as former Milwaukee Public School
teachers, as a founder of the school, a parent, a fundraiser, a registered nurse and social worker, and a
manager in industry.
2 See organization chart on page 2 of the 2011–12 Parent/Student Handbook.

3 © 2012 by NCCD, All Rights Reserved https://sharepoint.nccdcrc.org/Projects/Project Documents/USA/Wisconsin/508WI_Milw/2011-12/Kings/Kings Academy 2011-12 Yr 2 FINAL.docx
The board members rated the school overall as “excellent” (n=1) or “good” (n=4). In addition,
two focused their suggestions for improving the school on reading and math improvement, one on
extending the school year, and the other on providing more emphasis on basic education. For more
information regarding the board interviews, see Appendix H of this report.
B. Philosophy of Educational Methodology 1. Philosophy
The vision of King’s Academy is to partner with parents to instill values and high academic
standards in their children. The school strives to use a holistic approach to education. The school’s
philosophy is that all children can learn and should be in an educational and nurturing environment.
The mission of King’s Academy is to educate all children by promoting academic excellence
with a curriculum that will motivate, educate, and elevate them to become productive citizens.
The goal of King’s Academy is to improve the quality of children’s academic education by
providing a well-rounded, rigorous academic program. The school also intends to assist parents in
preparing children to reach their full potential, provide a strong literacy program that will enhance the
quality of learning in all of the academic areas, and provide opportunities for children to apply their
academic skills in everyday life situations.3
2. Description of Educational Programs and Curriculum
King’s Academy believes that all children can learn and demonstrate mastery in all subject
areas when they are provided with a rigorous academic program in a caring and nurturing
environment. The instructional program reflects the characteristics of the school’s community and
focuses on enhancing the intellectual, physical, emotional, and social development of the students.
3 See the King’s Academy 2011–12 Parent/Student Handbook.

4 © 2012 by NCCD, All Rights Reserved https://sharepoint.nccdcrc.org/Projects/Project Documents/USA/Wisconsin/508WI_Milw/2011-12/Kings/Kings Academy 2011-12 Yr 2 FINAL.docx
The curriculum is designed for students from K4 through eighth grade, addresses the academic needs
of each student, and offers multiple opportunities for success. The instructional program also provides
equal opportunities for all students to be involved in a unique, innovative, and relevant school
experience. The school’s instructional practices accommodate diverse learning styles to ensure rich
experiences for all learners.
King’s Academy’s primary educational model is an integrated literacy program across the
curriculum, which includes reading, language arts, math, science, social studies, and technology. The
integrated literacy program engages students in learning tasks that involve higher-order thinking
skills across all content areas. Houghton Mifflin Harcourt is used as the core curriculum along with
other supplementary materials. This program is aligned with the Wisconsin Department of Public
Instruction’s (DPI) standards for curriculum as well as the state assessment. In this model, the school
uses the 2+ Reading and Math Approach, which is a 90-minute reading/language arts block, 30
minutes of reading-skill building, plus Title I, and reading intervention. The math block includes 45
minutes of math instruction, followed by an additional 30 minutes of math skills and practice, plus
Title I, and math intervention. In addition, the school offers hands-on, high-interest learning
experiences in reading and math through its King’s Academy extended-day program. This model is
designed to help students gain a deeper understanding of complex issues and problems, as well as an
understanding that knowledge across disciplines is interrelated and interactive.4
Transportation to and from school is provided at no cost to students who live outside a two-
mile radius of the school. Lunch is provided at no cost to students who qualify for the free and
reduced hot lunch program, and at a minimal cost for those who do not qualify. Bag lunches are
allowed as well. The school also offered an onsite before- and after-care program.5
4 See page 17 of the 2011–12 Parent/Student Handbook. 5 See page 12 of the 2011–12 Parent/Student Handbook.

5 © 2012 by NCCD, All Rights Reserved https://sharepoint.nccdcrc.org/Projects/Project Documents/USA/Wisconsin/508WI_Milw/2011-12/Kings/Kings Academy 2011-12 Yr 2 FINAL.docx
During the interview and survey process, board members, teachers, and parents were asked
about the school’s program of instruction. Board members expressed satisfaction (one was very
satisfied and four were somewhat satisfied); teachers were primarily very (n=4) or somewhat (n=4)
satisfied; and 85% of the parents rated the program of instruction as excellent or good. Nine of the ten
teachers indicated that the educational methodology was either a very important (n=5) or somewhat
important (n=4) reason for teaching at the school.
C. Student Population At the beginning of the year, 215 students, ranging from K4 through eighth grade, were
enrolled in King’s Academy.6 Six students enrolled after the school year started and 21 students
withdrew from the school prior to the end of the year. Reasons for withdrawal included moved out of
the city (nine), left because of behavioral problems (two), and left for other reasons (10). Of the 215
students who started the year at the school, 195 remained enrolled at the end of the year; this is a
retention rate of 90.7%.
At the end of the year, 200 students were enrolled at King’s Academy. They can be described
as follows:
x Most (182, or 91.0%) of the students were African American, seven (3.5%) were African,
two (1.0%) were Hispanic, one (0.5%) student was Krio, and eight (4.0%) students were of an “other” race/ethnicity.
x There were 111 (55.5%) girls and 89 (44.5%) boys. x Twenty (10.0%) had special education needs. Four students had other health
impairments (OHI) and academic support-related services (SL), three had OHI, three had specific learning disabilities (SLD), two had speech and language impairments (SPL), two had SL only, one had a cognitive disability (CD), one had CD with SPL, one had an emotional/behavioral disability (EBD), one had OHI with SPL, and one student was autistic.
6 Enrolled as of September 16, 2011.

6 © 2012 by NCCD, All Rights Reserved https://sharepoint.nccdcrc.org/Projects/Project Documents/USA/Wisconsin/508WI_Milw/2011-12/Kings/Kings Academy 2011-12 Yr 2 FINAL.docx
x The largest grade levels were eighth grade, with 24 students, and third grade, with 23 students. The number of students by grade level is illustrated in Figure 1.
x There were 153 (76.5%) students eligible for free or reduced lunch prices (142 [71.0%] students were eligible for free and 11 [5.5%] for reduced lunch prices). The remaining 47 (23.5%) were not eligible.
Figure 1
King’s AcademyNumber of Students by Grade Levels*
2011–12
N = 200*At the end of the school year.
8th 24 (12.0%)
7th 18 (9.0%)
6th 20 (10.0%)
5th 20 (10.0%)
4th 22 (11.0%)
3rd 23 (11.5%)
2nd 21 (10.5%)
1st 19 (9.5%)
K5 16 (8.0%)
K4 17 (8.5%)
There were 164 students attending King’s Academy on the last day of the 2010–11 academic
year who were eligible for continued enrollment at the school this past academic year (i.e., they did
not graduate). Of these, 130 were enrolled in the school on the third Friday in September 2011. This
represents a return rate of 79.3%.

7 © 2012 by NCCD, All Rights Reserved https://sharepoint.nccdcrc.org/Projects/Project Documents/USA/Wisconsin/508WI_Milw/2011-12/Kings/Kings Academy 2011-12 Yr 2 FINAL.docx
D. School Structure
1. Areas of Instruction
King’s Academy offers instruction in reading/literacy, language arts, math, science, social
studies, fine arts, and physical education. Special education programming was provided to students
identified as needing an IEP.
Technology is integrated into all curricular areas. The school also has a library/multimedia
center. The center is used not only to support the curriculum, but to equip the students to think
critically about, and express themselves through, the media that define them. The center houses
diverse curriculum and various multimedia material such as magazines, audiovisuals, fiction,
nonfiction, reference, and professional materials. Library skills are integrated into the instructional
program.
The school developed benchmarks for each nine-week session in four core subjects: literacy,
math, science, and social studies. The students were assessed and the teachers used an additional
week to re-teach to reach mastery. Students who were above grade level in reading would join
students in the next grade level for the entire 90-minute reading block.
2. Classrooms
The school was organized into two parts: elementary (K4 through fourth grade) and middle
school (fifth through eighth grades). Middle school students changed rooms for some of their classes.7
The school has 10 classrooms, one for each grade level. The K4 through first grade classrooms had
approximately 20 students each, and the second- through eighth- grade classrooms had
approximately 22 students each. The school building also holds a cafeteria, a library, and a
gymnasium.
7 The school leadership reported that next year, the middle school will consist of sixth through eighth grades.
8 © 2012 by NCCD, All Rights Reserved https://sharepoint.nccdcrc.org/Projects/Project Documents/USA/Wisconsin/508WI_Milw/2011-12/Kings/Kings Academy 2011-12 Yr 2 FINAL.docx
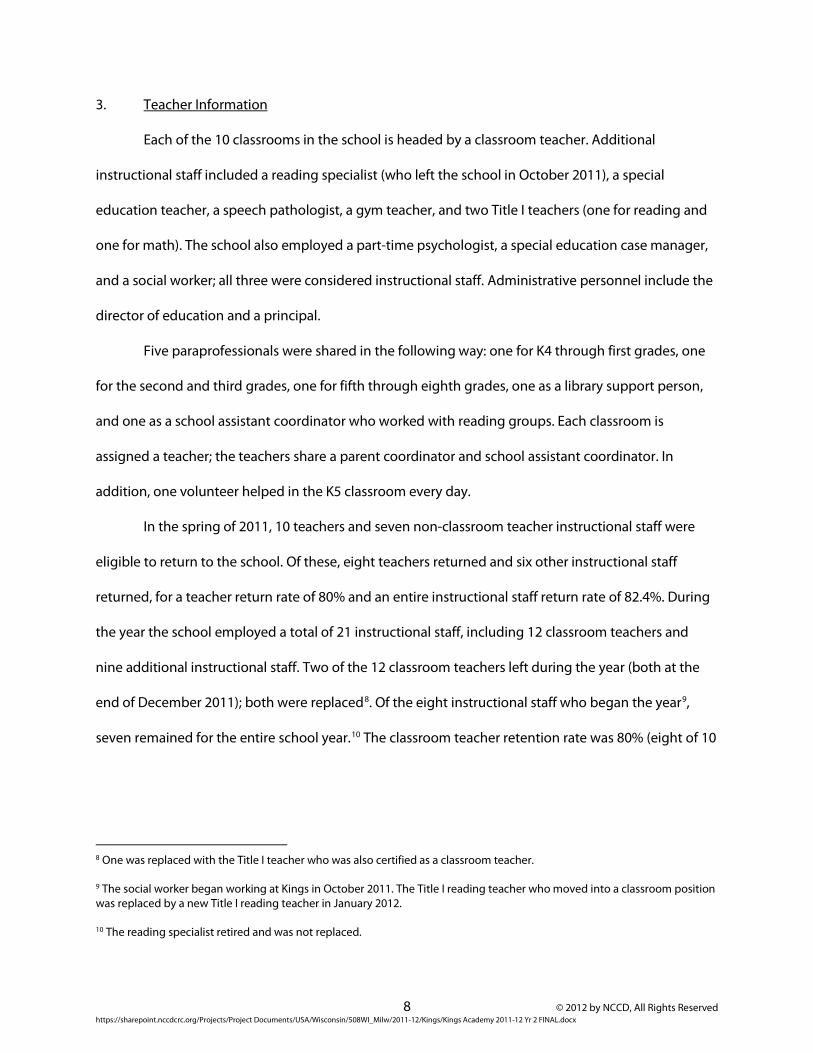
3. Teacher Information
Each of the 10 classrooms in the school is headed by a classroom teacher. Additional
instructional staff included a reading specialist (who left the school in October 2011), a special
education teacher, a speech pathologist, a gym teacher, and two Title I teachers (one for reading and
one for math). The school also employed a part-time psychologist, a special education case manager,
and a social worker; all three were considered instructional staff. Administrative personnel include the
director of education and a principal.
Five paraprofessionals were shared in the following way: one for K4 through first grades, one
for the second and third grades, one for fifth through eighth grades, one as a library support person,
and one as a school assistant coordinator who worked with reading groups. Each classroom is
assigned a teacher; the teachers share a parent coordinator and school assistant coordinator. In
addition, one volunteer helped in the K5 classroom every day.
In the spring of 2011, 10 teachers and seven non-classroom teacher instructional staff were
eligible to return to the school. Of these, eight teachers returned and six other instructional staff
returned, for a teacher return rate of 80% and an entire instructional staff return rate of 82.4%. During
the year the school employed a total of 21 instructional staff, including 12 classroom teachers and
nine additional instructional staff. Two of the 12 classroom teachers left during the year (both at the
end of December 2011); both were replaced8. Of the eight instructional staff who began the year9,
seven remained for the entire school year.10 The classroom teacher retention rate was 80% (eight of 10
8 One was replaced with the Title I teacher who was also certified as a classroom teacher. 9 The social worker began working at Kings in October 2011. The Title I reading teacher who moved into a classroom position was replaced by a new Title I reading teacher in January 2012. 10 The reading specialist retired and was not replaced.

9 © 2012 by NCCD, All Rights Reserved https://sharepoint.nccdcrc.org/Projects/Project Documents/USA/Wisconsin/508WI_Milw/2011-12/Kings/Kings Academy 2011-12 Yr 2 FINAL.docx
stayed all year). The total instructional staff retention rate was 83.3% (15 of 18). All instructional staff at
the school held a current DPI license or permit.11
The average years of experience at the school for the 10 classroom teachers who were there at
the end of the year was 5.2 years12, and the average years for the eight other instructional staff still
there at the end of the year was 1.3 years. The average length of experience for the entire instructional
staff at King’s was 3.6 years.
The school also held staff development meetings prior to and during the school year.
Following is a list of the meeting dates and topics covered:
July 20–21, 2011 Data Retreat August 15, 2011 Classroom Management Classroom Management: Love and Logic August 16, 2011 Technology 101 Integrating the SMART Board in the Curriculum August 17, 2011 Language Arts August 18, 2011 AED/CPR Training August 22, 2011 Parental Involvement: A Teacher’s Tool Kit August 23, 2011 Response to Intervention RtI August 24, 2011 Differentiating Instruction in Math August 25, 2011 M.A.P. Training October 18, 2011 Special Education Workshop October 28, 2011 M.A.P. Assessment Training Collaborative Training November 11, 2011 CRC Training M.A.P. Assessment Training January 3, 2012 Love and Logic January 17, 2012 Integrating Technology Part I January 24, 2012 Integrating Technology Part II January 26, 2012 Surviving the Ages of the Tee’s Integrating February 7, 2012 Literacy Stations/Activity Centers February 21, 2012 Literacy Stations/Activity Centers March 6, 2012 Computer Software Demo
M.A.P. Winter Testing Cycle Data Review Collaborative Planning
March 13, 2012 M.A.P. Data Analysis March 27, 2012 Science Fair: Understanding the Scientific Method
11 One reading specialist who left in October 2011 did not have a current license or permit. 12 The school previously operated as a Milwaukee Parental Choice program (MPCP) school. Therefore, the length of stay for some teachers is longer than two years.
10 © 2012 by NCCD, All Rights Reserved https://sharepoint.nccdcrc.org/Projects/Project Documents/USA/Wisconsin/508WI_Milw/2011-12/Kings/Kings Academy 2011-12 Yr 2 FINAL.docx
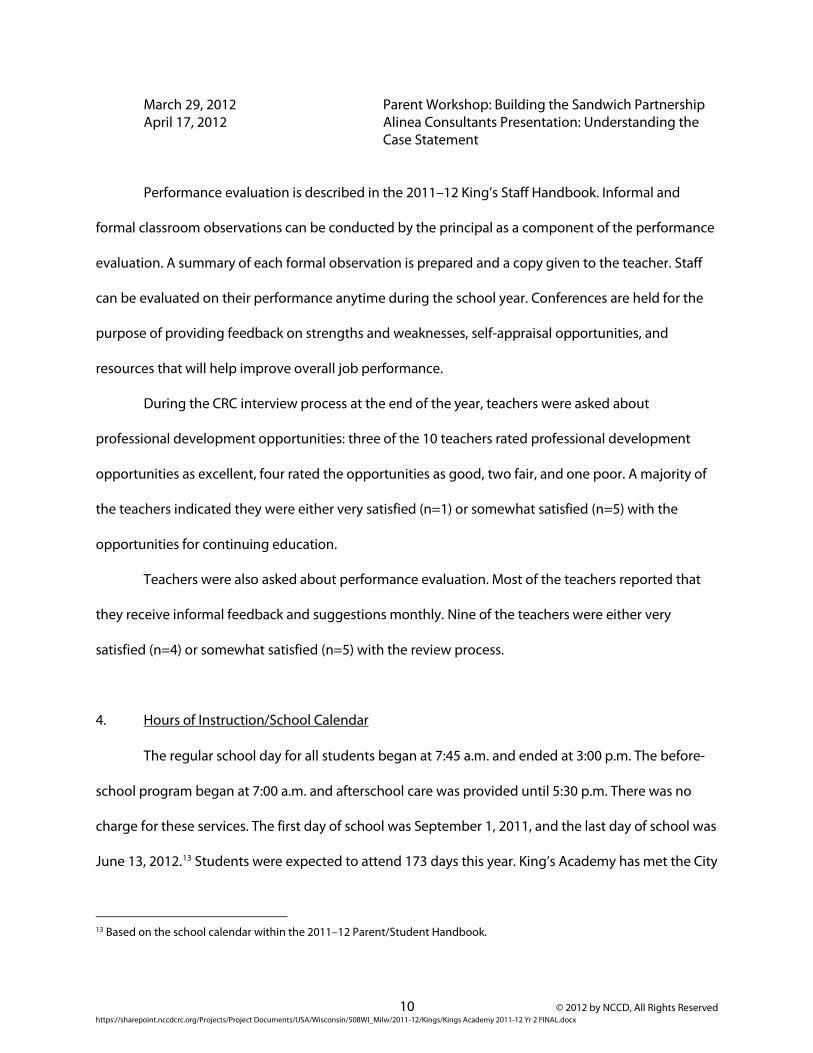
March 29, 2012 Parent Workshop: Building the Sandwich Partnership April 17, 2012 Alinea Consultants Presentation: Understanding the
Case Statement
Performance evaluation is described in the 2011–12 King’s Staff Handbook. Informal and
formal classroom observations can be conducted by the principal as a component of the performance
evaluation. A summary of each formal observation is prepared and a copy given to the teacher. Staff
can be evaluated on their performance anytime during the school year. Conferences are held for the
purpose of providing feedback on strengths and weaknesses, self-appraisal opportunities, and
resources that will help improve overall job performance.
During the CRC interview process at the end of the year, teachers were asked about
professional development opportunities: three of the 10 teachers rated professional development
opportunities as excellent, four rated the opportunities as good, two fair, and one poor. A majority of
the teachers indicated they were either very satisfied (n=1) or somewhat satisfied (n=5) with the
opportunities for continuing education.
Teachers were also asked about performance evaluation. Most of the teachers reported that
they receive informal feedback and suggestions monthly. Nine of the teachers were either very
satisfied (n=4) or somewhat satisfied (n=5) with the review process.
4. Hours of Instruction/School Calendar The regular school day for all students began at 7:45 a.m. and ended at 3:00 p.m. The before-
school program began at 7:00 a.m. and afterschool care was provided until 5:30 p.m. There was no
charge for these services. The first day of school was September 1, 2011, and the last day of school was
June 13, 2012.13 Students were expected to attend 173 days this year. King’s Academy has met the City
13 Based on the school calendar within the 2011–12 Parent/Student Handbook.

11 © 2012 by NCCD, All Rights Reserved https://sharepoint.nccdcrc.org/Projects/Project Documents/USA/Wisconsin/508WI_Milw/2011-12/Kings/Kings Academy 2011-12 Yr 2 FINAL.docx
of Milwaukee’s requirement to publish an annual calendar with the number of days for student
attendance.
5. Parent and Family Involvement
The King’s Academy 2011–12 Parent/Student Handbook states that direct communication
between parents and teachers promotes understanding. Problems can be solved for the benefit of all
when brought to the appropriate source and discussed with the people involved. Parent rights and
responsibilities are stated in the handbook.
Regular conferences are provided; however, teachers or parents can make additional
arrangements when needed. Teachers are not available during class time. The principal is also
available for scheduling conferences. All meetings and visitations with teachers require scheduling.
The King’s Academy Parent and Teacher Organization (PTO) provides an opportunity for
parents to be more involved in school programs, ask questions of teachers and administration, and
offer suggestions for improving existing programs or initiating new ones. One of the roles of the PTO
is to organize fundraising activities.
Parent-teacher conferences were scheduled twice during the year, in October and March.
Telephone conferences, home visits, and alternative meeting times were provided for parents unable
to attend scheduled conferences.
Teachers, parents, and board members were asked about parental involvement. A majority of
board members and teachers indicated that they were somewhat or very satisfied with the level of
parental involvement with the school. A majority (88.8%) of the parents surveyed indicated that the
opportunity for parent involvement with the school was excellent (53.3%) or good (35.5%), and nearly
all (97.2%) indicated that the opportunity for parental participation was an important reason for
choosing the school. (See Appendices E, F, and H for interview and survey results.)

12 © 2012 by NCCD, All Rights Reserved https://sharepoint.nccdcrc.org/Projects/Project Documents/USA/Wisconsin/508WI_Milw/2011-12/Kings/Kings Academy 2011-12 Yr 2 FINAL.docx
6. Waiting List
In September 2011, school leadership reported a waiting list of 14 students representing
several grade levels. As of May 30, 2012, the school had seven students waiting for spots in fall: four for
sixth grade and one each for third, fourth, and fifth grades.
7. Disciplinary Policy
The school’s 2011–12 Parent/Student Handbook explains the discipline policy, including parent
and student rights and expectations, the levels of disciplinary actions, prohibited items and activities,
bullying, and harassment. There are also transportation expectations and rules, as well as
transportation disciplinary procedures. The levels of disciplinary action are as follows:
x Level 1: Conference/intervention
x Level 2: Suspension (temporary exclusion from the building)
x Level 3: Board disciplinary hearing
x Level 4: Recommendation for expulsion (reserved for criminal acts or the most serious
violations of school rules). The process involves a preliminary expulsion hearing and, if needed, an expulsion hearing.
The handbook includes a discipline chart that gives examples of behavior violations, their
explanation, and the minimum and maximum level of disciplinary action.
This year, teachers, parents, and board members were asked about the discipline policy at the
school. Following is a summary of their opinions:
x Teachers:
» Eight of ten considered the discipline at the school as a very important (n=7) or somewhat important (n=1) reason for continuing to teach there; and
» Seven of the ten teachers interviewed were either very satisfied (n=3) or somewhat satisfied (n=4) with the discipline policy. However, eight of the

13 © 2012 by NCCD, All Rights Reserved https://sharepoint.nccdcrc.org/Projects/Project Documents/USA/Wisconsin/508WI_Milw/2011-12/Kings/Kings Academy 2011-12 Yr 2 FINAL.docx
teachers interviewed were either somewhat dissatisfied (n=6) or very dissatisfied (n=2) with the school’s adherence to the discipline policy.
x Parents:
» Most (86.9%) considered discipline as a very important factor in choosing the school;
» A majority (77.6%) rated discipline methods at the school as good (35.5%) or excellent (42.1%); and
» Over half (69.1%) were comfortable with how the staff handle discipline.14
x Board Members: Four of the five board members interviewed were either very or somewhat satisfied with the school’s discipline policy.
8. Activities for Continuous School Improvement
The following is a description of King’s Academy’s response to the activities recommended in
the programmatic profile and educational performance report for the 2010–11 academic year.
x Recommendation: Fully implement the Measures of Academic Progress (MAP) and use the data gathered to inform instruction in the classroom. Response: MAP reading and math assessments were implemented. MAP training was provided to the teachers on an ongoing basis. The school hired a consultant to work with teachers; these sessions were weekly in September and at least once a month during the rest of the school year. The teachers were trained on how to administer the assessments, interpret and analyze the results, and plan strategies based on the data gathered. The MAP tests were administered to the students in fall, winter, and spring. After the winter MAP testing, teachers met with each child to explain the MAP. First, the teacher spoke with the whole class, then met individually with each student to discuss reading and math results and to set individual goals. These meetings were followed by whole class discussions to set classroom goals based on MAP results. The assessment coordinator posted the fall to winter results on the wall.
x Recommendation: Improve the data collection systems throughout the school.
Response: The school set up Microsoft Excel templates for all local measures. The teachers completed the templates and submitted them to the administrative assistant. The spring scores were entered by the administrative assistant. The school also
14 Agreed or strongly agreed with the statement: “I am comfortable with how the staff handles discipline.”

14 © 2012 by NCCD, All Rights Reserved https://sharepoint.nccdcrc.org/Projects/Project Documents/USA/Wisconsin/508WI_Milw/2011-12/Kings/Kings Academy 2011-12 Yr 2 FINAL.docx
implemented daily attendance sheets as well as sign-in binders for each parent conference event.
9. Graduation and High School Information
The parent coordinator helped families with choosing high schools. He/she provided fliers to
the eighth graders regarding individual schools and facilitated the process of sending letters of
recommendation.
This year, all 23 eighth-grade students graduated from King’s Academy. The school reported
that students would attend Riverside (one), Eastbrook (one), Milwaukee School of the Arts (one),
Washington (one), Holy Redeemer (one), Wisconsin Conservatory (one), Community (one),
Messmer (three), Milwaukee Lutheran (four), Pius (one), Wisconsin Lutheran (one), Pulaski (one), Rufus
King (one), Wade (one), Milwaukee Excel (one), and Shorewood (one). Two students had not yet
enrolled in high school.

15 © 2012 by NCCD, All Rights Reserved https://sharepoint.nccdcrc.org/Projects/Project Documents/USA/Wisconsin/508WI_Milw/2011-12/Kings/Kings Academy 2011-12 Yr 2 FINAL.docx
III. EDUCATIONAL PERFORMANCE To monitor the activities at King’s Academy as described in its contract with the City of
Milwaukee, a variety of qualitative and quantitative information was collected at specific intervals
during the academic year. At the start of this year, the school established attendance and parent
participation goals, as well as goals related to special education student records. The school also
identified local and standardized measures of academic performance to monitor student progress.
The local assessment measures included Measures of Academic Progress (MAP) reading and math
assessments for first through eighth grades. First- through eighth- grade students also completed the
Saxon math test in the fall. Writing progress for first through eighth graders was measured using the
6+1 Traits of Writing assessment.
The standardized assessment measures used were the Stanford Diagnostic Reading Test
(SDRT) and the Wisconsin Knowledge and Concepts Examination (WKCE). The WKCE is administered to
all public school third- through eighth-grade students to meet federal No Child Left Behind
requirements that schools test students’ skills in reading and math.
A. Attendance
CRC examined student attendance in two ways. The first reflects the average time students
attended school, and the second rate includes excused absences. Both rates include all students
enrolled in the school at any time. The school considered a student present if the student attended
any time during the day. CRC also examined the time students spent, on average, suspended (in or out
of school). The school’s goal for this year was that students, on average, would attend school 85% of
the time.
16 © 2012 by NCCD, All Rights Reserved https://sharepoint.nccdcrc.org/Projects/Project Documents/USA/Wisconsin/508WI_Milw/2011-12/Kings/Kings Academy 2011-12 Yr 2 FINAL.docx
Attendance data were available for 221 students enrolled during the year. The attendance rate
this year was 94.9%.15 When excused absences were included, the attendance rate rose to 97.1%. This
exceeds the school’s goal of 85% average attendance.
This year, 55 students were suspended at least once. Grade levels ranged from first to eighth
grade. The 55 students spent, on average, 2.2 days out of school on suspension. Due to the small
number of students who served in-school suspensions during the school year, data regarding in-
school suspensions is not included in this report.
B. Parent Participation
At the beginning of the academic year, the school set a goal that at least 72% of parents would
attend at least one of two formal parent conferences. Phone, home visits, and alternative meeting
times were counted as attending. This year, 195 students were enrolled at the time of both
conferences (i.e., for the year). Parents of 150 (76.9%) children attended at least one of the two
conferences, exceeding the goal of 72%. In addition, parents of 77 (39.5%) children attended both
parent conferences.
In addition to participating in formal conferences, parents of students who were functioning
well above their grade level in reading also participated in conferences to determine the
appropriateness of their child working with students at the next grade level in reading.
C. Special Education Needs
This year, the school set a goal to develop and maintain records for all special education
students. The school met this goal, as IEPs were completed for all 20 students with special education
15 Individual student attendance rate was calculated by dividing the total number of days present by the total number of days that the student was enrolled. Individual rates were then averaged across all students.

17 © 2012 by NCCD, All Rights Reserved https://sharepoint.nccdcrc.org/Projects/Project Documents/USA/Wisconsin/508WI_Milw/2011-12/Kings/Kings Academy 2011-12 Yr 2 FINAL.docx
needs.16 In addition, CRC conducted a review of a representative number of files during the year. This
review showed that students had current evaluations indicating their eligibility for special education
services, that IEPs were reviewed in a timely manner, and that parents were invited to develop and be
involved in their child’s IEP.
D. Local Measures of Educational Performance
Charter schools, by their definition and nature, are autonomous schools with curricula that
reflect each school’s individual philosophy, mission, and goals. In addition to administering
standardized tests, each charter school is responsible for describing goals and expectations for its
students in the context of that school’s unique approach to education. These goals and expectations
are established by each City of Milwaukee-chartered school at the beginning of the academic year to
measure the educational performance of its students. These local measures are useful for monitoring
and reporting progress, guiding and improving instruction, clearly expressing the expected quality of
student work, and providing evidence that students are meeting local benchmarks. The CSRC
expectation is that schools establish local measures in reading, writing, math, and special education.
This year, King’s Academy used the Measures of Academic Progress (MAP) tests to measure student
progress in reading and math and the Saxon Math Assessment to assess students’ math skills.
MAP is a series of tests that measure student skills in reading, math, and language usage. The
test yields an RIT scale that shows student understanding, regardless of grade level, which allows easy
comparison of students’ progress from the beginning of the year to the end of year and/or from one
year to the next. Results provide educators with information necessary to build curriculum to meet
their students’ needs.
16 Includes special education students enrolled at the end of the school year.
18 © 2012 by NCCD, All Rights Reserved https://sharepoint.nccdcrc.org/Projects/Project Documents/USA/Wisconsin/508WI_Milw/2011-12/Kings/Kings Academy 2011-12 Yr 2 FINAL.docx
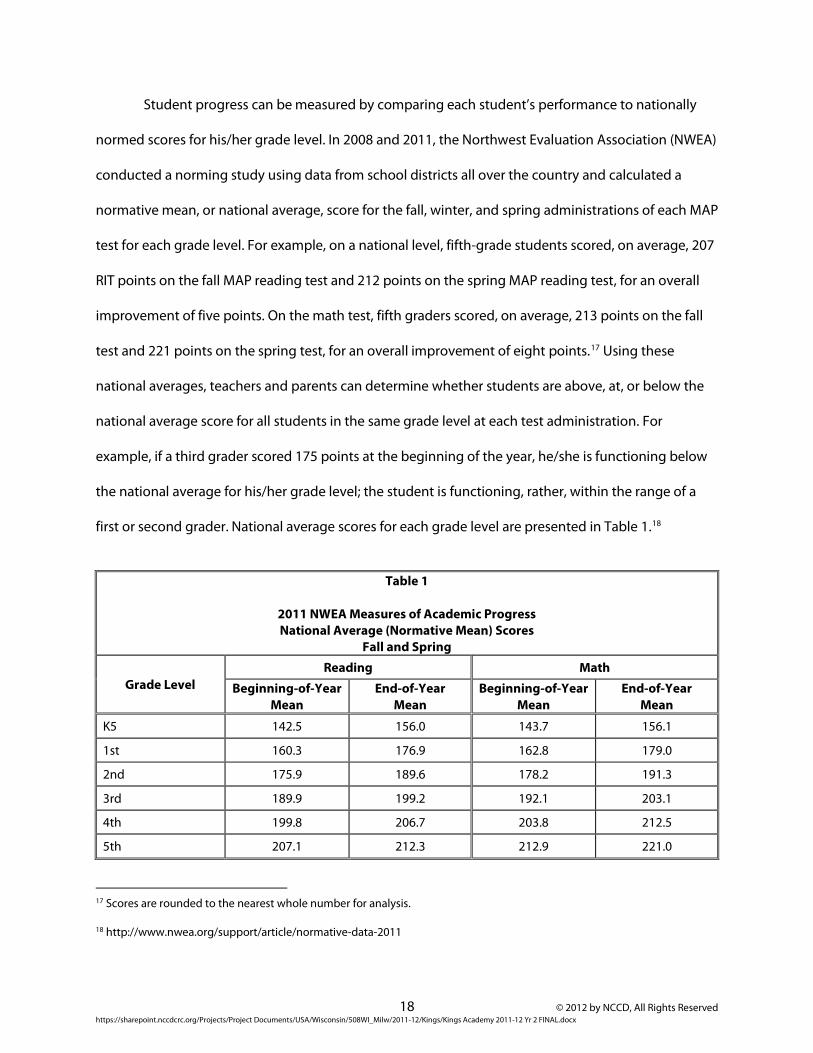
Student progress can be measured by comparing each student’s performance to nationally
normed scores for his/her grade level. In 2008 and 2011, the Northwest Evaluation Association (NWEA)
conducted a norming study using data from school districts all over the country and calculated a
normative mean, or national average, score for the fall, winter, and spring administrations of each MAP
test for each grade level. For example, on a national level, fifth-grade students scored, on average, 207
RIT points on the fall MAP reading test and 212 points on the spring MAP reading test, for an overall
improvement of five points. On the math test, fifth graders scored, on average, 213 points on the fall
test and 221 points on the spring test, for an overall improvement of eight points.17 Using these
national averages, teachers and parents can determine whether students are above, at, or below the
national average score for all students in the same grade level at each test administration. For
example, if a third grader scored 175 points at the beginning of the year, he/she is functioning below
the national average for his/her grade level; the student is functioning, rather, within the range of a
first or second grader. National average scores for each grade level are presented in Table 1.18
Table 1
2011 NWEA Measures of Academic Progress National Average (Normative Mean) Scores
Fall and Spring
Grade Level Reading Math
Beginning-of-Year Mean
End-of-Year Mean
Beginning-of-Year Mean
End-of-Year Mean
K5 142.5 156.0 143.7 156.1
1st 160.3 176.9 162.8 179.0
2nd 175.9 189.6 178.2 191.3
3rd 189.9 199.2 192.1 203.1
4th 199.8 206.7 203.8 212.5
5th 207.1 212.3 212.9 221.0
17 Scores are rounded to the nearest whole number for analysis. 18 http://www.nwea.org/support/article/normative-data-2011

19 © 2012 by NCCD, All Rights Reserved https://sharepoint.nccdcrc.org/Projects/Project Documents/USA/Wisconsin/508WI_Milw/2011-12/Kings/Kings Academy 2011-12 Yr 2 FINAL.docx
Table 1
2011 NWEA Measures of Academic Progress National Average (Normative Mean) Scores
Fall and Spring
Grade Level Reading Math
Beginning-of-Year Mean
End-of-Year Mean
Beginning-of-Year Mean
End-of-Year Mean
6th 212.3 216.4 219.6 225.6
7th 216.3 219.7 225.6 230.5
8th 219.3 222.4 230.2 234.5
9th 221.4 222.9 233.8 236.0
10th 223.2 223.8 234.2 236.6
11th 223.4 223.7 236.0 238.3
The school’s goal for MAP reading and math results was that students who complete both the
fall and the spring tests will increase their RIT scores by at least as much as the national sample did
(i.e., the difference in the normative mean [average] scores for the grade-level average at which the
student tested in the fall). CRC examined progress for students who were at or above the national
average as well as students who were below the national average for their current grade level at the
time of the fall test.
Progress for students at or above grade-level national average in the fall of 2011 was
measured by determining whether the student was able to again score at or above the grade-level
national average at the time of the spring test (basically, this examination indicates if students who are
functioning at or above grade level improved, on average, the same as their national counterparts).
For students below grade-level average, CRC examined how many reached the national
grade-level average for their current grade by the spring test. For students who were still below the
grade-level average on the spring test, progress was measured by determining if student scores
increased by the national average increase associated with the student’s functional grade level (i.e.,
the grade-level average at which the student tested in the fall). For example, if a fourth-grade student

20 © 2012 by NCCD, All Rights Reserved https://sharepoint.nccdcrc.org/Projects/Project Documents/USA/Wisconsin/508WI_Milw/2011-12/Kings/Kings Academy 2011-12 Yr 2 FINAL.docx
scored 161 RIT points on the fall reading test and 185 RIT points on the spring test, the student scored
below the national fourth-grade average on both tests. With a score of 161, the student’s fall score was
between the national fall and spring averages for first grade students; therefore, the student’s
functional grade level was first grade. The average change in scores for all first-grade students was 17
RIT points. Because the student increased his/her score by 24 points, he/she progressed by at least the
national average increase for his/her functional grade level.
Saxon Math is a math placement test that teachers can use to determine the math level of
each student. The student’s level is determined by measuring the number of grade-level benchmarks
he/she meets at the time of the test. Progress in math can be measured by examining how many of
the benchmarks each student meets for his/her current grade level at the beginning and the end of
the school year.
The following sections describe results of the MAP and Saxon Math tests for students at King’s
Academy.
1. Literacy
Both the fall and spring MAP reading tests were completed by 162 students. 19 At the time of
the fall test, 56 (34.6%) of K5 through eighth-grade students were at or above the national average
(i.e., normative mean) for their grade level (Table 2).20 Progress for students at or above the average as
well as those below is described below.
19 An additional 20 students should have had spring MAP results; due to an issue with the computerized MAP test, spring scores for 20 students were not scored. The school is having those students retake the spring test; however, to ensure the validity of the results, spring scores for those students will not be included in this report. 20 The learning memo states that students in first through eighth grades would complete the MAP tests; results were also available for K5 students, so CRC included them in the analysis.

21 © 2012 by NCCD, All Rights Reserved https://sharepoint.nccdcrc.org/Projects/Project Documents/USA/Wisconsin/508WI_Milw/2011-12/Kings/Kings Academy 2011-12 Yr 2 FINAL.docx
Table 2
King’s Academy Local Measures of Academic Progress: MAP Reading Assessment
Student Scores Relative to the National Average Fall 2011
Grade Level N
Students at or Above National Average (Normative
Mean) Fall 2011
Students Below National Average (Normative Mean)
Fall 2011
N % N %
K5 15 11 73.3% 4 26.7%
1st 18 7 38.9% 11 61.1%
2nd 19 4 21.1% 15 78.9%
3rd 21 7 33.3% 14 66.7%
4th 20 8 40.0% 12 60.0%
5th 20 5 25.0% 15 75.0%
6th 17 5 29.4% 12 70.6%
7th 12 4 33.3% 8 66.7%
8th 20 5 25.0% 15 75.0%
Total 162 56 34.6% 106 65.4%
a. Students at or Above National Average (Normative Mean) for Their Grade-Level Average on the Fall
MAP Reading Test
Of the 56 students at or above the normative average for their grade level on the fall test,
36 (64.3%) achieved the normative mean on the spring test (Table 3). To protect student identity, CRC
does not report results for fewer than 10 students; therefore, grade-level results were not included for
some grade levels.

22 © 2012 by NCCD, All Rights Reserved https://sharepoint.nccdcrc.org/Projects/Project Documents/USA/Wisconsin/508WI_Milw/2011-12/Kings/Kings Academy 2011-12 Yr 2 FINAL.docx
Table 3
King’s Academy Local Measures of Academic Progress: MAP Reading Assessment
Progress for Students at or Above the National Average in Fall 2011 Fall 2011 to Spring 2012
Grade Level
Students at or Above National Average Fall 2011
Students Maintained at or Above National Average
Spring 2012
Students Below National Average
Spring 2012
N % N %
K5 11 7 63.6% 4 36.4%
1st 7 Cannot report due to N size Cannot report due to N size
2nd 4 Cannot report due to N size Cannot report due to N size
3rd 7 Cannot report due to N size Cannot report due to N size
4th 8 Cannot report due to N size Cannot report due to N size
5th 5 Cannot report due to N size Cannot report due to N size
6th 5 Cannot report due to N size Cannot report due to N size
7th 4 Cannot report due to N size Cannot report due to N size
8th 5 Cannot report due to N size Cannot report due to N size
Total 56 36 64.3% 20 35.7%

23 © 2012 by NCCD, All Rights Reserved https://sharepoint.nccdcrc.org/Projects/Project Documents/USA/Wisconsin/508WI_Milw/2011-12/Kings/Kings Academy 2011-12 Yr 2 FINAL.docx
c. Students Below the National Average (Normative Mean) for Their Grade Level on the Fall MAP Reading Test There were 106 students who scored less than the national average for their current grade
level on the fall test. By the time of the spring test, 12 (11.3%) had reached the national reading score
for their current grade level and 31 (29.2%) had improved their reading scores by at least the average
change in scores for their functional grade level. This represents a total growth rate of 40.6% for K5
through eighth-grade students.
Table 4
King’s Academy
Local Measures of Academic Progress: MAP Reading Assessment Progress for Students Below the National Average in Fall 2011
Fall 2011 to Spring 2012
Grade Level
Students Below
National Average on
MAP Reading Test
Fall 2011
Students Who Reached National Average
Spring 2012
Students Who Did Not Reach Grade-Level
Average in Spring but Increased at Least the
Difference Between Fall and Spring RIT Means for Functional Grade
Level at Which Student Tested in the Fall
Overall Progress of Students Below
National Average on Fall 2011 MAP Reading Test
N N % N % N %
K5 4 Cannot report due to N size
Cannot report due to N size
Cannot report due to N size
1st 11 2 18.2% 7 63.6% 9 81.8%
2nd 15 1 6.7% 7 46.7% 8 53.3%
3rd 14 1 7.1% 3 21.4% 4 28.6%
4th 12 0 0.0% 2 16.7% 2 16.7%
5th 15 2 13.3% 2 13.3% 4 26.7%
6th 12 1 8.3% 0 0.0% 1 8.3%
7th 8 Cannot report due to N size
Cannot report due to N size
Cannot report due to N size
8th 15 1 6.7% 8 53.3% 9 60.0%
Total 106 12 11.3% 31 29.2% 43 40.6%

24 © 2012 by NCCD, All Rights Reserved https://sharepoint.nccdcrc.org/Projects/Project Documents/USA/Wisconsin/508WI_Milw/2011-12/Kings/Kings Academy 2011-12 Yr 2 FINAL.docx
2. Math
Students in K5 through eighth grades completed the MAP math assessment in the fall and
spring, and students in first through eighth grades completed the Saxon Math placement test in the
fall and spring of the school year.
a. MAP Math Assessment
Both the fall and spring MAP math tests were completed by 165 students.21 At the time of the
fall test, 35 (21.2%) students were at or above the national average for their grade level (Table 5).
Progress for students at or above the average as well as those below is described below.
Table 5
King’s Academy
Local Measures of Academic Progress: MAP Math Assessment Student Scores Relative to National Average
Fall 2011
Grade Level N
Students at or Above National Average
Fall 2011
Students Below National Average
Fall 2011 N % N %
K5 16 8 50.0% 8 50.0%
1st 19 6 31.6% 13 68.4%
2nd 19 1 5.3% 18 94.7%
3rd 21 4 19.0% 17 81.0%
4th 22 5 22.7% 17 77.3%
5th 19 3 15.8% 16 84.2%
6th 17 1 5.9% 16 94.1%
7th 12 3 25.0% 9 75.0%
8th 20 4 20.0% 16 80.0%
Total 165 35 21.2% 130 78.8%
21 An additional 20 students should have had spring MAP results; due to an issue with the computerized MAP test, spring scores for 20 students were not scored. The school is having those students retake the spring test; however, to ensure the validity of the results, spring scores for those students will not be included in this report.

25 © 2012 by NCCD, All Rights Reserved https://sharepoint.nccdcrc.org/Projects/Project Documents/USA/Wisconsin/508WI_Milw/2011-12/Kings/Kings Academy 2011-12 Yr 2 FINAL.docx
i. Students at or Above the National Average (Normative Mean) for Their Grade Level on the Fall MAP Math Test
Of the 35 students at or above the normative average for their grade level on the fall test,
19 (54.3%) achieved the normative mean on the spring test (Table 6). To protect student identity, CRC
does not report results for fewer than 10 students; therefore, results are not presented by grade level.
Table 6
King’s Academy
Local Measures of Academic Progress: MAP Math Assessment Progress for Students at or Above the National Average Fall 2011
Fall 2011 to Spring 2012
Grade Level
Students at or Above National Average Fall 2011
Students Maintained at or Above National Average
Spring 2012
Students Below National Average
Spring 2012
N % N %
K5 8 Cannot report due to N size Cannot report due to N size
1st 6 Cannot report due to N size Cannot report due to N size
2nd 1 Cannot report due to N size Cannot report due to N size
3rd 4 Cannot report due to N size Cannot report due to N size
4th 5 Cannot report due to N size Cannot report due to N size
5th 3 Cannot report due to N size Cannot report due to N size
6th 1 Cannot report due to N size Cannot report due to N size
7th 3 Cannot report due to N size Cannot report due to N size
8th 4 Cannot report due to N size Cannot report due to N size
Total 35 19 54.3% 16 45.7%

26 © 2012 by NCCD, All Rights Reserved https://sharepoint.nccdcrc.org/Projects/Project Documents/USA/Wisconsin/508WI_Milw/2011-12/Kings/Kings Academy 2011-12 Yr 2 FINAL.docx
ii. Students Below the National Average (Normative Mean) for Their Grade Level on the Fall MAP Math Test
There were 130 students who scored less than the national average for their current grade
level on the fall test. By the time of the spring test, eight (6.2%) had reached the national math score
for their current grade level, and 36 (27.7%) had improved their math scores by at least the average
change in scores for their functional grade level. This represents a total growth rate of 33.8% for K5
through eighth-grade students.
Table 7
King’s Academy
Local Measures of Academic Progress: MAP Math Assessment Progress for Students Below the National Average in Fall 2011
Fall 2011 to Spring 2012
Grade Level
Students Below
National Average on MAP
Math Test Fall 2011
Students Who Reached National Average
Spring 2012
Students Who Did Not Reach Grade Level
Average in Spring but Increased at Least the
Difference Between Fall and Spring RIT Means for
Functional Grade Level at Which Student Tested
in the Fall
Overall Progress of Students Below
National Average on Fall 2011 MAP Math Test
N N % N % N %
K5 8 Cannot report due to N size
Cannot report due to N size
Cannot report due to N size
1st 13 1 7.7% 8 61.5% 9 69.2%
2nd 18 1 5.6% 4 22.2% 5 27.8%
3rd 17 1 5.9% 4 23.5% 5 29.4%
4th 17 4 23.5% 3 17.6% 7 41.2%
5th 16 0 0.0% 5 31.3% 5 31.3%
6th 16 0 0.0% 3 18.8% 3 18.8%
7th 9 Cannot report due to N size
Cannot report due to N size
Cannot report due to N size
8th 16 0 0.0% 5 31.3% 5 31.3%
Total 130 8 6.2% 36 27.7% 44 33.8%

27 © 2012 by NCCD, All Rights Reserved https://sharepoint.nccdcrc.org/Projects/Project Documents/USA/Wisconsin/508WI_Milw/2011-12/Kings/Kings Academy 2011-12 Yr 2 FINAL.docx
b. Saxon Math Assessment
King’s Academy students completed the Saxon Math Placement test in the fall and spring of
the school year. The school’s goal was that at least 65% of the students who completed the baseline
test for their grade level in September 2011 would achieve 70% or more of the grade-level
benchmarks on the spring test. As shown in Table 8, the average percent of benchmarks achieved
increased for each grade level between the fall and spring tests. At the time of the spring test, 69
(47.9%) of 144 students who completed both the fall and spring assessments had achieved 70% or
more of the Saxon benchmarks. The school, therefore, did not meet its internal goal of 65%.
Table 8
Kings Academy
Local Measures of Academic Progress: Saxon Math Assessment Progress for Students Who Completed Fall and Spring Assessments
Grade Level N Average % of
Fall Benchmarks
Average % of Spring
Benchmarks
Met Goal*
N %
1st 17 81.2% 87.9% 16 94.1%
2nd 18 65.8% 67.0% 9 50.0%
3rd 22 85.5% 78.9% 18 81.8%
4th 22 60.5% 60.2% 6 27.3%
5th 17 56.7% 67.8% 8 47.1%
6th 14 38.3% 56.1% 1 7.1%
7th 14 38.7% 61.8% 4 28.6%
8th 20 25.6% 56.8% 7 35.0%
Total 144 57.8% 67.3% 69 47.9% *Achieved 70% or more of the Saxon benchmarks at the time of the spring assessment.
28 © 2012 by NCCD, All Rights Reserved https://sharepoint.nccdcrc.org/Projects/Project Documents/USA/Wisconsin/508WI_Milw/2011-12/Kings/Kings Academy 2011-12 Yr 2 FINAL.docx
3. Writing
King’s Academy assessed student writing skills using the 6+1 Traits of Writing. Students
completed writing samples in the fall and spring of the school year. Writing prompts were the same
for both samples and were based on grade-level topics with a focus on the persuasive writing genre.22
Students could score between zero and seven points on each writing sample. The school’s goal was
that 65% of students who completed a fall writing sample would earn a score of three or better on the
spring writing sample.
In the fall of 2011, 149 students completed a writing sample; 140 of those students also
completed a spring writing sample. Of the 140 students, 91 (65.0%) earned a score of three or better
on the spring sample (Table 9). This meets the school’s internal goal of 65%. The minimum score on
the spring sample was 1.0, the maximum was 6.0, and the average score was 3.2 (not shown).
Table 9
King’s Academy
Local Measures of Academic Achievement: 6+1 Traits of Writing 2011–12
Grade N Met Writing Goal
N %
1st 19 18 94.7%
2nd 16 6 37.5%
3rd 23 5 21.7%
4th 21 14 66.7%
5th 13 8 61.5%
6th 13 11 84.6%
7th 15 11 73.3%
8th 20 18 90.0%
Total 140 91 65.0%
22 Writing genres include expository, descriptive, persuasive, and narrative; King’s Academy selected persuasive.

29 © 2012 by NCCD, All Rights Reserved https://sharepoint.nccdcrc.org/Projects/Project Documents/USA/Wisconsin/508WI_Milw/2011-12/Kings/Kings Academy 2011-12 Yr 2 FINAL.docx
4. IEP Progress for Special Education Students The school also set a goal that students who had IEPs and had been enrolled at King’s
Academy for the full year of IEP service would meet at least 80% of their IEP goals at the time of their
annual review or re-evaluation. There were 20 students with special education needs enrolled at the
end of the school year. IEPs were created for all 20 students. Of the 20 students, seven were also
enrolled at King’s Academy and receiving special education services during 2010–11; the school was
responsible for reviewing and tracking IEP goal progress for these students.23 In order to protect
student identity, CRC does not include results for fewer than 10 students; therefore, IEP goal progress
could not be included in the report.
E. External Standardized Measures of Educational Performance
The CSRC requires the school to administer certain standardized tests to students in city-
chartered schools. The school is required to administer the SDRT to all first, second, and third graders
enrolled in charter schools, while third through eighth graders take the WKCE. Student performance
on the SDRT is reported in phonetic analysis, vocabulary, comprehension, and a total SDRT score. The
WKCE is aligned with Wisconsin model academic standards and rates student skills as minimal, basic,
proficient, or advanced.24 The WKCE is administered to students in third through eighth grades and
meets federal No Child Left Behind requirements to test students’ reading and math skills. The SDRT
was administered in April 2012 and the WKCE in October 2011.
23 The remaining 13 students were new to King’s Academy or new to the special education program this year; therefore, progress toward IEP goals could not be measured. 24 Advanced: Demonstrates in-depth understanding of academic knowledge and skills; proficient: demonstrates competency in academic knowledge and skills; basic: demonstrates some academic knowledge and skills; and minimal: demonstrates very limited academic knowledge and skills.

30 © 2012 by NCCD, All Rights Reserved https://sharepoint.nccdcrc.org/Projects/Project Documents/USA/Wisconsin/508WI_Milw/2011-12/Kings/Kings Academy 2011-12 Yr 2 FINAL.docx
The following section describes results of these standardized tests for all children who took
the tests. This includes students who have been enrolled in the school for a full academic year (FAY) or
longer, as well as students who were new to the school.
1. SDRT for First Graders
The SDRT was administered to 19 first graders; results on this measure indicate that first
graders were functioning at or above grade-level equivalents (GLEs) in all three areas tested (Figure 2).
Figure 2
King’s AcademySDRT
Average* Grade-Level Equivalent for 1st Graders2011–12
N = 19*Results are rounded to the nearest one tenth.
2.01.9
2.3
1.8
0.0
0.5
1.0
1.5
2.0
2.5
Phonetic Analysis Vocabulary Comprehension SDRT Total

31 © 2012 by NCCD, All Rights Reserved https://sharepoint.nccdcrc.org/Projects/Project Documents/USA/Wisconsin/508WI_Milw/2011-12/Kings/Kings Academy 2011-12 Yr 2 FINAL.docx
The GLE range and median score for first graders are illustrated in Table 10.
Table 10
King’s Academy
SDRT GLE Range for 1st Graders
2011–12 (N = 19)
Area Tested Lowest Grade Level Scored
Highest Grade Level Scored Median GLE Percent at or
Above GLE Phonetic Analysis K.2 5.2 1.6 89.5%
Vocabulary K.6 3.2 1.7 89.5%
Comprehension K.8 7.7 1.9 84.2%
SDRT Total K.5 3.6 1.8 89.5% Note: Results are rounded to the nearest one tenth.

32 © 2012 by NCCD, All Rights Reserved https://sharepoint.nccdcrc.org/Projects/Project Documents/USA/Wisconsin/508WI_Milw/2011-12/Kings/Kings Academy 2011-12 Yr 2 FINAL.docx
2. SDRT for Second Graders
Results for second graders are presented in Figure 3 and Table 11. As illustrated, second
graders were, on average, reading from 2.0 to 3.3 GLE in the areas tested.
Figure 3
King’s AcademySDRT
Average* Grade-Level Equivalent for 2nd Graders2011–12
N = 19*Results are rounded to the nearest one tenth.Note that three additional students were given parts of the test. These scores were not included.
3.3
2.0
2.52.3
0.0
0.5
1.0
1.5
2.0
2.5
3.0
3.5
Phonetic Analysis Vocabulary Comprehension SDRT Total
Table 11
King’s Academy SDRT
GLE Range for 2nd Graders 2011–12 (N = 19)
Area Tested Lowest Grade Level Scored
Highest Grade Level Scored Median GLE Percentage at or
Above GLE Phonetic Analysis K.9 10.9 2.2 68.4%
Vocabulary K.5 3.6 1.7 47.4%
Comprehension 1.1 5.7 2.5 57.9%
SDRT Total K.9 4.1 2.1 52.6% Note that three additional students were given parts of the test. These scores were not included.
33 © 2012 by NCCD, All Rights Reserved https://sharepoint.nccdcrc.org/Projects/Project Documents/USA/Wisconsin/508WI_Milw/2011-12/Kings/Kings Academy 2011-12 Yr 2 FINAL.docx
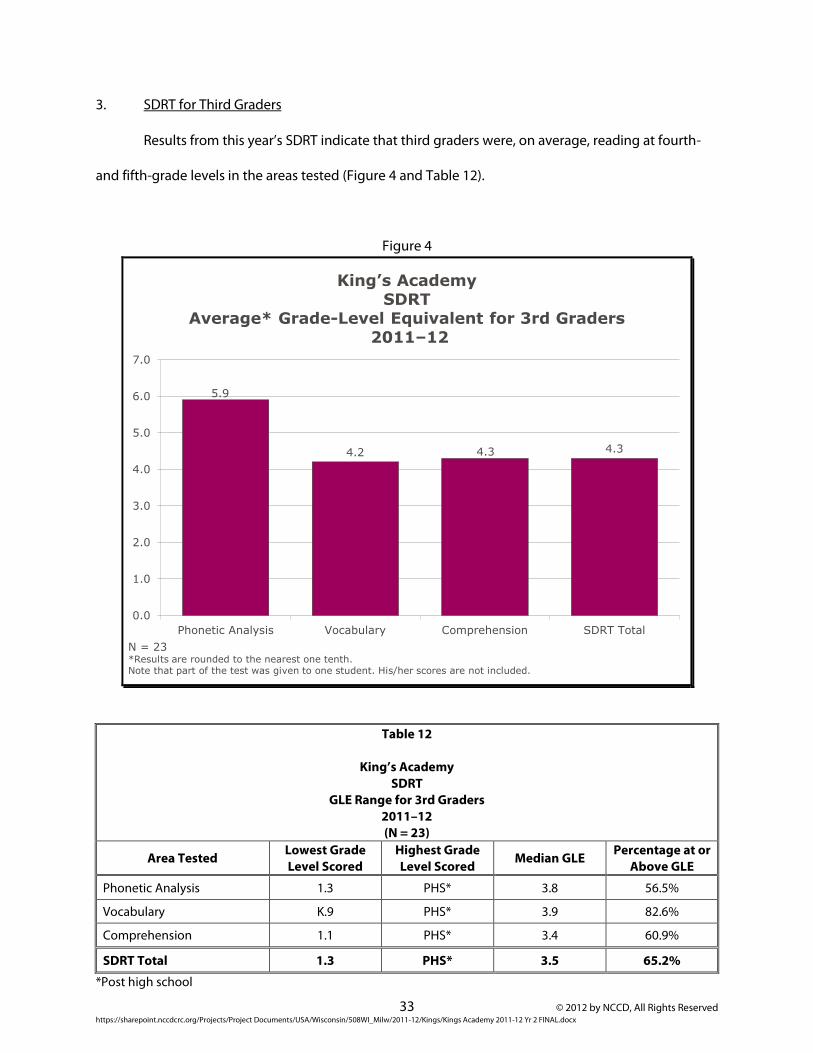
3. SDRT for Third Graders Results from this year’s SDRT indicate that third graders were, on average, reading at fourth-
and fifth-grade levels in the areas tested (Figure 4 and Table 12).
Figure 4
King’s AcademySDRT
Average* Grade-Level Equivalent for 3rd Graders2011–12
5.9
4.2 4.3 4.3
0.0
1.0
2.0
3.0
4.0
5.0
6.0
7.0
Phonetic Analysis Vocabulary Comprehension SDRT Total
N = 23*Results are rounded to the nearest one tenth.Note that part of the test was given to one student. His/her scores are not included.
Table 12
King’s Academy SDRT
GLE Range for 3rd Graders 2011–12 (N = 23)
Area Tested Lowest Grade Level Scored
Highest Grade Level Scored Median GLE Percentage at or
Above GLE Phonetic Analysis 1.3 PHS* 3.8 56.5%
Vocabulary K.9 PHS* 3.9 82.6%
Comprehension 1.1 PHS* 3.4 60.9%
SDRT Total 1.3 PHS* 3.5 65.2% *Post high school

34 © 2012 by NCCD, All Rights Reserved https://sharepoint.nccdcrc.org/Projects/Project Documents/USA/Wisconsin/508WI_Milw/2011-12/Kings/Kings Academy 2011-12 Yr 2 FINAL.docx
4. WKCE for Third Through Eighth Graders
a. Reading
Results for third grade indicate that six (27.3%) students were reading at an advanced level,
and seven (31.8%) scored at the proficient level; one (4.5%) fourth-grade student scored advanced,
and 10 (45.5%) were proficient; three (14.3%) fifth graders scored advanced, and 11 (52.4%) were
proficient; one (4.3%) sixth-grade student scored at the advanced level, and 13 (56.5%) were
proficient; four (19.0%) seventh graders were advanced, and 15 (71.4%) were proficient; and two
(8.3%) eighth graders scored in the advanced category, and 14 (58.3%) were proficient in reading
(Figure 5).25
Figure 5
King’s AcademyWKCE Reading Proficiency Levels
for 3rd Through 8th Graders2011–12
N = 22 N = 22 N = 21 N = 23 N = 21 N = 24
2 (9.1%)
4 (18.2%) 2
(9.5%)
4(17.4%) 1
(4.8%)2
(8.3%)
7 (31.8%)
7 (31.8%)
5(23.8%)
5(21.7%)
1(4.8%)
6(25.0%)
7 (31.8%)
10 (45.5%)
11(52.4%)
13(56.5%)
15(71.4%)
14(58.3%)
6 (27.3%)
1 (4.5%)
3 (14.3%)
1(4.3%)
4(19.0%)
2(8.3%)
0.0%
20.0%
40.0%
60.0%
80.0%
100.0%
3rd 4th 5th 6th 7th 8th
Minimal Basic Proficient Advanced
25 Overall, 65.4% of third- through eighth-grade students were proficient or advanced in reading.

35 © 2012 by NCCD, All Rights Reserved https://sharepoint.nccdcrc.org/Projects/Project Documents/USA/Wisconsin/508WI_Milw/2011-12/Kings/Kings Academy 2011-12 Yr 2 FINAL.docx
On average, third-grade students scored in the 35th percentile statewide in reading, fourth-
grade students scored in the 22nd percentile, fifth graders scored in the 30th percentile, sixth graders
scored in the 23rd percentile, seventh graders scored in the 34th percentile, and eighth-grade
students, on average, scored in the 26th percentile in reading (not shown).
b. Math
In math, two (9.1%) third-grade students exhibited advanced skills, and nine (40.9%) scored
proficient; one (4.5%) fourth grader scored in the advanced range, and six (27.3%) were proficient;
two (9.5%) fifth-grade students were advanced, and eight (38.1%) were proficient in math; none of the
sixth grade students were in the advanced range, and seven (30.4%) were proficient; one (4.8%)
seventh grader was in the advanced range, and 14 (66.7%) were proficient; and none of the eighth
graders were advanced, but six (25.0%) were proficient in math (Figure 6). 26
26 Overall, 42.1% of third- through eighth-grade students were proficient or advanced in reading.

36 © 2012 by NCCD, All Rights Reserved https://sharepoint.nccdcrc.org/Projects/Project Documents/USA/Wisconsin/508WI_Milw/2011-12/Kings/Kings Academy 2011-12 Yr 2 FINAL.docx
Figure 6
King’s AcademyWKCE Math Proficiency Levels for 3rd Through 8th Graders
2011–12
N = 22 N = 22 N = 21 N = 23 N = 21 N = 24
11(50.0%)
10(45.5%) 7
(33.3%)
9(39.1%)
4(19.0%)
5(20.8%)
5(22.7%)
4(19.0%)
7(30.4%)
2(9.5%)
13(54.2%)
9(40.9%)
6(27.3%)
8(38.1%)
7(30.4%)
14(66.7%)
6(25.0%)
2(9.1%)
1(4.5%)
2(9.5%)
1(4.8%)
0.0%
20.0%
40.0%
60.0%
80.0%
100.0%
3rd 4th 5th 6th 7th 8th
Minimal Basic Proficient Advanced
Third graders scored in the 25th percentile in math; fourth graders scored in the 20th
percentile; fifth graders scored, on average, in the 24th percentile in math; sixth graders scored in the
17th percentile; seventh graders scored in the 31st percentile; and eighth-grade students scored, on
average, in the 17th percentile in math (not shown).
c. Language Arts
In addition to reading and math, fourth and eighth graders are tested in language arts,
science, and social studies. CSRC requires results for language arts to be included in this report. As
illustrated below, two (9.1%) fourth graders exhibited advanced, and eight (36.4%) exhibited
proficient language arts skills. Of 23 eighth-grade students, two (8.7%) were advanced, and
five (21.7%) were proficient (Figure 7).

37 © 2012 by NCCD, All Rights Reserved https://sharepoint.nccdcrc.org/Projects/Project Documents/USA/Wisconsin/508WI_Milw/2011-12/Kings/Kings Academy 2011-12 Yr 2 FINAL.docx
Figure 7
King’s AcademyWKCE Language Arts Proficiency Levels
for 4th and 8th Graders2011–12
N = 22 N = 23
4 (18.2%)7 (30.4%)
8 (36.4%)
9 (39.1%)
8 (36.4%)
5 (21.7%)
2 (9.1%) 2 (8.7%)
0.0%
20.0%
40.0%
60.0%
80.0%
100.0%
4th 8th
Minimal Basic Proficient Advanced
d. Writing
The final score from the WKCE at the fourth- and eighth-grade levels is a writing score. The
extended writing sample is scored with two holistic rubrics. A six-point composing rubric evaluates
students’ ability to control purpose/focus, organization/coherence, development of content, sentence
fluency, and word choice. A three-point conventions rubric evaluates students’ ability to use
punctuation, grammar, capitalization, and spelling. Points received on these two rubrics are combined
to produce a single score, with a maximum possible score of nine. The extended writing scores ranged
from 1.3 to 5.6 for fourth graders and from two to six for eighth graders. The median score for fourth-
grade students was three, meaning half of the students scored at or below three, and half scored 3.0
to 5.6 on a scale of zero to nine; the median score for eighth-grade students was four.

38 © 2012 by NCCD, All Rights Reserved https://sharepoint.nccdcrc.org/Projects/Project Documents/USA/Wisconsin/508WI_Milw/2011-12/Kings/Kings Academy 2011-12 Yr 2 FINAL.docx
F. Multiple-Year Student Progress Year-to-year progress is measured by comparing scores on standardized tests from one year to
the next. The tests used to examine progress are the SDRT (reading only) and the WKCE (reading and
math.)
The CSRC requires that multiple-year student progress in first through third grades be
reported for all students tested in consecutive years. Progress for fourth through eighth graders is
reported for students enrolled for a FAY, i.e., since September 17, 2010. The CSRC requires that
progress for students who met proficiency expectations during the prior year be reported separately
from those who did not.
Note that starting in the 2012–13 school year, Wisconsin is raising the benchmark scores
needed for students to reach the proficient or advanced performance levels on the WKCE. These new
college and career readiness proficiency levels are based on the National Assessment of Educational
Progress (NAEP) standards. 27
1. First Through Third Graders
First- through third-grade reading progress was measured using the SDRT. Results from this
test are stated in GLE. The CSRC expects at least 75% of the students who were at or above grade level
the previous spring will maintain at or above grade-level status from spring to spring testing. The
expectation for students with below-grade-level scores in the previous year is to advance more than
one year GLE advancement.
a. Overall
There were 13 students enrolled at King’s Academy as first graders in 2010–11 who took the
test in 2011–12 as second graders, and 13 students enrolled in 2010–11 as second graders who took
27 http://dpi.state.wi.us/oea/pdf/highexp.pdf

39 © 2012 by NCCD, All Rights Reserved https://sharepoint.nccdcrc.org/Projects/Project Documents/USA/Wisconsin/508WI_Milw/2011-12/Kings/Kings Academy 2011-12 Yr 2 FINAL.docx
the test in 2011–12 as third graders. As illustrated in Table 13, the average advancement from first to
second grade was 0.8 GLE, and second to third graders advanced an average of 1.7 GLE. Overall, these
students advanced, on average, 1.2 GLE from 2010–11 to 2011–12. Seven (53.8%) of the second
graders were at or above grade level, and 10 (76.9%) third graders were at or above grade level in
2010–11.
Table 13
King’s Academy
Average GLE Advancement in Reading Based on SDRT Total
Grade (2010–11 to
2011–12)
Average GLE 2010–11
Average GLE 2011–12
Average GLE Advancement
Students at or Above Grade
Level in 2010–11
1st to 2nd (n = 13) 1.4 2.1 0.8 7 (53.8%)
2nd to 3rd (n = 13) 2.8 4.5 1.7 10 (76.9%)
Total (N = 26) -- -- 1.2 17 (65.4%)
It is possible to compare SDRT results over two academic years for third-grade students who
took the SDRT in 2009–10 as first graders to scores they earned as third graders in 2011–12. Because
this is only the second year of operation for King’s Academy as a city charter, first- to third-grade
progress could not be measured
b. Students at or Above GLE
At the time of the 2010–11 test, seven second graders and 10 third graders tested at or above
grade level. Due to the small size of the second-grade cohort, grade-level results could not be
included in this report. Nine (90.0%) of 10 third graders maintained grade level status during 2011–12
(Table 14). Overall, 82.4% of 17 students at or above grade level in 2010–11 maintained grade-level
status in 2011–12; therefore, the school met the CSRC expectation related to this outcome.

40 © 2012 by NCCD, All Rights Reserved https://sharepoint.nccdcrc.org/Projects/Project Documents/USA/Wisconsin/508WI_Milw/2011-12/Kings/Kings Academy 2011-12 Yr 2 FINAL.docx
Table 14
King’s Academy Average GLE Advancement in Reading
for Students at or Above GLE Grade
(2010–11 to 2011–12) # Met Goal* % Met Goal*
1st to 2nd (n = 7) Cannot report due to N size Cannot report due to N size
2nd to 3rd (n = 10) 9 90.0%
Total (N = 17) 14 82.4% *Maintained GLE status in 2011–12.
c. Students Below GLE
The expectation for students who tested below grade level the prior year would, on average,
improve by more than one grade level. There were nine second and third graders who tested below
GLE as first or second graders. In order to protect student identity, CRC does not include results for
fewer than 10 students. Due to the small number of students below GLE in 2010-11, progress could
not be reported.
2. Third Through Eighth Graders
a. Progress for Students Who Met Proficiency-Level Expectations
The CSRC expects that at least 75.0% of the students who reached proficiency, i.e., proficient
or advanced on the WKCE in 2010–11, will maintain their status of proficient or above in 2011–12. As
illustrated, 91.8% of students met this expectation in reading, exceeding CSRC requirements, and
72.2% met this expectation in math, short of CSRC requirements (Tables 15a and 15b).

41 © 2012 by NCCD, All Rights Reserved https://sharepoint.nccdcrc.org/Projects/Project Documents/USA/Wisconsin/508WI_Milw/2011-12/Kings/Kings Academy 2011-12 Yr 2 FINAL.docx
Table 15a
King’s Academy Reading Proficiency-Level Progress
for FAY Students Who Tested Proficient or Advanced in 2010–11 Based on WKCE
Grade Students
Proficient/Advanced in 2010–11
Students Maintained Proficient/Advanced in 2011–12
N %
3rd to 4th 6 Cannot report due to N size
4th to 5th 12 11 91.7%
5th to 6th 6 Cannot report due to N size
6th to 7th 11 10 90.9%
7th to 8th 14 14 100.0%
Total 49 45 91.8%
Table 15b
King’s Academy Math Proficiency-Level Progress
for FAY Students Proficient or Advanced in 2010–11 Based on WKCE
Grade Students
Proficient/Advanced in 2010–11
Students Maintained Proficient/Advanced in 2011–12
N %
3rd to 4th 5 Cannot report due to N size
4th to 5th 8 Cannot report due to N size
5th to 6th 6 Cannot report due to N size
6th to 7th 9 Cannot report due to N size
7th to 8th 8 Cannot report due to N size
Total 36 26 72.2%

42 © 2012 by NCCD, All Rights Reserved https://sharepoint.nccdcrc.org/Projects/Project Documents/USA/Wisconsin/508WI_Milw/2011-12/Kings/Kings Academy 2011-12 Yr 2 FINAL.docx
b. Progress for Students Who Did Not Meet Proficiency-Level Expectations
The CSRC expects at least 60% of students who scored minimal or basic on the 2010–11 test to
progress at least one level, or, if they scored in the same level, to progress one or more quartiles within
that level.28
As illustrated in Table 16a, 56.5% of FAY students who were below proficiency improved at
least one proficiency level or advanced a quartile within their reading proficiency level. The school fell
short of the goal and has therefore not met this expectation in reading.
Table 16a
King’s Academy
Reading Proficiency-Level Progress for FAY Students Minimal or Basic in 2010–11
Based on WKCE
Grade # Students
Minimal/Basic in 2010–11
# Students Who Advanced
One Proficiency
Level
If Not Advanced, #
Who Improved Quartile(s)
Within Proficiency
Level
Total Advancement
N %
3rd to 4th 8 Cannot report due to N size Cannot report due to N size
4th to 5th 0 NA NA NA NA
5th to 6th 10 6 2 8 80.0%
6th to 7th 1 Cannot report due to N size Cannot report due to N size
7th to 8th 4 Cannot report due to N size Cannot report due to N size
Total 23 10 3 13 56.5%
Proficiency-level progress in math is shown in Table 16b. As illustrated, 41.7% of students who
did not meet proficiency-level expectations, i.e., scored minimal or basic, in 2010–11, either advanced
one proficiency level (n=10), or if they did not advance a level, improved at least one quartile within
their level (n=5), falling short of the goal. Therefore, the school did not meet the CSRC expectation in
math. 28 To examine whether or not students who remained within the same level, e.g., minimal in one year and minimal in the next, CRC used the scale score thresholds used by the DPI to establish proficiency levels. The basic and minimal levels were then equally divided into quartiles, and CRC determined whether or not a student had progressed one or more quartiles.

43 © 2012 by NCCD, All Rights Reserved https://sharepoint.nccdcrc.org/Projects/Project Documents/USA/Wisconsin/508WI_Milw/2011-12/Kings/Kings Academy 2011-12 Yr 2 FINAL.docx
Table 16b
King’s Academy Math Proficiency-Level Progress for
FAY Students Minimal or Basic in 2010–11
Grade # Students
Minimal/Basic in 2010–11
# Students Who Advanced One
Proficiency Level
If Not Advanced, # Who Improved
Quartile(s) Within
Proficiency Level
Total Advancement
N %
3rd to 4th 9 Cannot report due to N size Cannot report due to N size
4th to 5th 4 Cannot report due to N size Cannot report due to N size
5th to 6th 10 3 3 6 60.0%
6th to 7th 3 Cannot report due to N size Cannot report due to N size
7th to 8th 10 3 1 4 40.0%
Total 36 10 5 15 41.7%
G. School Scorecard
In the 2009–10 school year, the CSRC piloted a scorecard for each school that it charters. The
scorecard includes multiple measures of student academic progress such as performance on
standardized tests and local measures, as well as point-in-time academic achievement and
engagement elements such as attendance and student and teacher retention and return. The score
provides a summary indicator of school performance. In addition, the CSRC intends to examine
scorecard results from all city-chartered schools over the past three years and establish policies that
will guide decisions about contract renewal, probationary status, and school closure.
The school scored 67.5% on the scorecard this year. This compares to 62.2% on the school’s
2010–11 scorecard. Please see Appendix D for school scorecard information.
H. Annual Review of the School’s Adequate Yearly Progress
Since passage of the No Child Left Behind Act (NCLB), school performance in Wisconsin has
been measured by Adequate Yearly Progress (AYP). AYP consists of four objectives: test participation,

44 © 2012 by NCCD, All Rights Reserved https://sharepoint.nccdcrc.org/Projects/Project Documents/USA/Wisconsin/508WI_Milw/2011-12/Kings/Kings Academy 2011-12 Yr 2 FINAL.docx
graduation rate or attendance rate, and achieving a designated proficiency rate on two academic
indicators—reading and mathematics.
In July 2012, State Superintendent Tony Evers announced that Wisconsin’s request for waivers
from certain provisions of NCLB, including the AYP designation, was approved by the US Department
of Education. AYP will be replaced with an alternate school progress indicator as part of a larger
accountability system, developed by the Wisconsin DPI, that goes into effect in the 2012–13 school
year. Therefore, there is no AYP determination for 2011–12 as the department transitions to the new
accountability system. For more information please see the DPI website:
http://dpi.wi.gov/oea/acct/accountability.html.
I. Parent/Teacher/Board Satisfaction Regarding Student Academic Progress
Based on surveys and interviews, over half (61.7% of 107) of the parents indicated that the
school’s contribution to their child’s learning was excellent, and 28% indicated that it was good. Most
of the 10 teachers also rated the school’s contribution to student learning as good (n=7) or fair (n=1).
When asked about satisfaction with student academic progress, 49.5% of the parents surveyed
rated their child’s academic progress as excellent and 35.5% as good. Four of the 10 teachers
interviewed were very satisfied with the students’ academic progress, three were somewhat satisfied,
and three were somewhat dissatisfied. One of the board members interviewed was very satisfied, and
the four others indicated they were somewhat satisfied with the students’ academic progress.
IV. SUMMARY AND RECOMMENDATIONS
This report covers the second year of King’s Academy’s operation as a City of Milwaukee
charter school.
Based on current and past contract compliance and the scorecard results, CRC recommends
that because this is only its second year of operation, King’s Academy continue regular, annual
academic monitoring and reporting.
© 2012 by NCCD, All Rights Reserved https://sharepoint.nccdcrc.org/Projects/Project Documents/USA/Wisconsin/508WI_Milw/2011-12/Kings/Kings Academy 2011-12 Yr 2 FINAL.docx
Appendix A
Contract Compliance Chart

A1 © 2012 by NCCD, All Rights Reserved https://sharepoint.nccdcrc.org/Projects/Project Documents/USA/Wisconsin/508WI_Milw/2011-12/Kings/Kings Academy 2011-12 Yr 2 FINAL.docx
King’s Academy
Overview of Compliance for Education-Related Contract Provisions 2011–12
Section of Contract Education-Related Contract Provision Report Page
Number
Contract Provisions Met or
Not Met?
Section I, B Description of educational program; student population served. pp. 2–7 Met
Section I,V Charter school shall operate under the days and hours indicated in the calendar for the 2010–11 school year.
p. 10 Met
Section I. C Educational methods. pp. 3–5 Met Section I, D Administration of required standardized tests. pp. 29–38 Met
Section I, D
Academic criteria #1: Maintain local measures, showing pupil growth in demonstrating curricular goals in reading, writing, math, and special education goals.
pp. 17–29 Met
Section I, D and subsequent memos from the CSRC
Academic criteria #2: Year-to-year achievement measures: a. 2nd- and 3rd-grade students at or above grade
level in reading: At least 75% will maintain at or above grade-level status.
b. 4th- through 8th-grade students proficient or advanced in reading: At least 75.0% maintain proficiency level.
c. 4th- through 8th-grade students proficient or
advanced in mathematics: At least 75.0% maintain proficiency level.
a. pp. 39–40 b. pp. 40–41 c. pp. 40–41
a. Met b. Met c. Not met; 72.2%
Section I, D
Academic criteria #3: Year-to-year achievement measures: a. 2nd- and 3rd-grade students with below-grade-
level scores in reading: Advance more than 1.0 GLE in reading.
b. 4th- through 8th-grade students below proficient level in reading: At least 60% will advance one level of proficiency or to the next quartile within the proficiency level range.
c. 4th- through 8th-grade students below
proficient level in math: At least 60% will advance one level of proficiency or to the next quartile within the proficiency level range.
a. p. 40 b. p. 42 c. pp. 42–43
a. NA* b. Not met; 56.5% c. Not met; 41.7%
Section I, E Parental involvement. pp. 11–12 Met
Section I, F Instructional staff hold a DPI license or permit to teach. p. 8 Met
Section I, I Pupil database information. pp. 5–6 Met Section I, K Disciplinary procedures. pp. 12–13 Met *Group size too small; there were very few students below grade level.

© 2012 by NCCD, All Rights Reserved https://sharepoint.nccdcrc.org/Projects/Project Documents/USA/Wisconsin/508WI_Milw/2011-12/Kings/Kings Academy 2011-12 Yr 2 FINAL.docx
Appendix B
Student Learning Memorandum

B1 © 2012 by NCCD, All Rights Reserved https://sharepoint.nccdcrc.org/Projects/Project Documents/USA/Wisconsin/508WI_Milw/2011-12/Kings/Kings Academy 2011-12 Yr 2 FINAL.docx
King’s Academy Learning Memo To: The Charter School Review Committee and Children’s Research Center From: King’s Academy Re: Student Learning Memorandum for the 2011–12 School Year Date: October 10, 2011 The following procedures and outcomes will be used for the 2011–12 school year to monitor the education-related activities described in the school’s contract with the City of Milwaukee. Data will be provided to Children’s Research Center (CRC), the monitoring agent contracted by the City of Milwaukee’s Charter School Review Committee (CSRC). Data will be reported in a spreadsheet or database that includes each student’s Wisconsin state ID number (WSN). CRC requests electronic submission of year-end data on the fifth day following the last day of student attendance for the academic year, or June 30, 2012. The school will record student data in Headmaster, the student database, and/or Excel spreadsheets. The school will be able to generate a student roster in a usable data file format that lists all students enrolled at any time during the school year. The roster will include student name, student WSN, local student ID, enrollment date, withdrawal date and reason, grade, gender, race/ethnicity, free/reduced lunch eligibility, special education status, and if applicable, disability type. Attendance The school will maintain an average daily attendance rate of 90%. Attendance will be reported as present, excused absence, and unexcused absence, and includes days spent in in-school and out-of-school suspension. King’s Academy considers a student present if the student attends any time during the day. Enrollment The school will record the enrollment date for every student. Upon admission, individual student information will be added to the school database, including student name, local student ID, WSN, enrollment date, grade, gender, free/reduced lunch eligibility, race/ethnicity, special education status, and, if applicable, disability type. Termination/Withdrawal The withdrawal date and primary reason, including expulsion, for every student leaving the school will be recorded in the school database. The school will use the following withdrawal codes: 1 = Moved out of city 2 = Moved out of proximate neighborhood 3 = Enrolled in a new school—more sports offered 4 = Enrolled in a new school—curriculum is less demanding 5 = Enrolled in a new school to graduate sooner 6 = Transportation problems 7 = Behavioral problems 8 = Dissatisfaction with academic offerings 9 = Sibling(s) transferred
B2 © 2012 by NCCD, All Rights Reserved https://sharepoint.nccdcrc.org/Projects/Project Documents/USA/Wisconsin/508WI_Milw/2011-12/Kings/Kings Academy 2011-12 Yr 2 FINAL.docx
10 = Graduated 11 = Expelled 88 = Other, describe Parent Participation At least 72% of the parents will attend at least one of two formal parent conferences. Phone, home visits, and alternative meeting times will be counted as attending. Special Education Needs Students The school will maintain updated records on all evaluated students and eligible special education students, including date of the most recent individualized education program (IEP) team eligibility evaluation; eligibility evaluation results (i.e., ineligible or if eligible, disability type); IEP completion date; parent participation in IEP; number of IEP goals; IEP annual review date (to review IEP goals, outcomes, and services, due annually); if the student continues to be eligible, number of IEP goals achieved at the annual review; parent participation in the annual review; and planned date for next evaluation/eligibility assessment. Academic Achievement: Local Measures Mathematics and Reading (1–8): Students will complete the Measures of Academic Progress (MAP) reading and math tests three times a year, in September, January and May. At the time of the fall test, each student’s score will be compared to grade level means based on the 2011 NWEA normative study. All students who complete both the fall and spring reading and math MAP tests will increase their RIT scores by at least the difference in the normative mean score for the grade level average at which the student tested in the fall. Progress for students at or above the normative mean for their current grade level as well as progress for students below the normative mean for their current grade level will be examined. Although the expectation is that all students will increase their RIT scores by at least the difference in the normative mean score for the grade level at which they tested in the fall, the results will be used as baseline data for the development of future annual goals since this is the first year that Kings Academy is using the MAP. Math (1–8): Students will receive a grade level Saxon Math baseline test in the fall. Saxon Math publishes expected benchmarks for each grade level. At least 65% of the students who completed the Saxon Math baseline test by September 30, 2011, will achieve 70% or better of the Saxon Math grade-level benchmarks by the end of the year.
B3 © 2012 by NCCD, All Rights Reserved https://sharepoint.nccdcrc.org/Projects/Project Documents/USA/Wisconsin/508WI_Milw/2011-12/Kings/Kings Academy 2011-12 Yr 2 FINAL.docx
Writing (1–8) Using the 6 + 1 Traits of Writing, 65% of the students who completed a writing sample no later than October 30, 2011 will achieve an overall score of 3 or better on a writing sample taken between May 1 and 31, 2012. The prompt for both writing samples will be the same and will be based on grade-level topics. The genre for third through fourth grades will be descriptive and for fifth through eighth grades, persuasive.
29
Special Education Students (K4–8) Students who have active IEPs and have been enrolled at King’s Academy for the full year of IEP service will meet at least 80% of their IEP goals at the time of their annual review or re-evaluation. Progress will be demonstrated by reporting the number of goals on the IEP and the number of goals that have been met. Note that ongoing student progress on IEP goals is monitored and reported throughout the academic year through the special education progress reports that are attached to the regular report cards. Academic Achievement: Standardized Measures The following standardized test measures will assess academic achievement in reading and/or mathematics. Grades 1, 2, and 3: The Stanford Diagnostic Reading Test (SDRT) will be administered each spring between April 17 and May 12. Progress will be assessed based on the results of testing in reading in the second and subsequent years. Grades 3–8: The Wisconsin Knowledge and Concepts Examination (WKCE) will be administered on an annual basis in the timeframe identified by the Wisconsin Department of Public Instruction. The WKCE reading subtest will provide each student with a proficiency level via a scale score in reading, and the WKCE math subtest will provide each student with a proficiency level via a scale score in math. For fourth and eighth graders, it will also include language arts, science, and social studies scale scores as well as a writing skills indicator. Results will also reflect the student’s statewide percentile score. The Year-to-Year Expectations on Standardized Measures: For current second- and third-grade students with comparison SDRT scores from the previous spring:
x At least 75% of the students whose were at or above grade level the previous spring will maintain at or above grade-level status.
x All students below grade level on the previous year’s SDRT will advance, on
average, more than one year using grade-level equivalencies (GLE) from spring test to spring test.
(The results for third-grade students with comparable first-grade SDRT test results will be reported as supplementary information.) 29 Writing genres include expository, descriptive, persuasive, and narrative.

B4 © 2012 by NCCD, All Rights Reserved https://sharepoint.nccdcrc.org/Projects/Project Documents/USA/Wisconsin/508WI_Milw/2011-12/Kings/Kings Academy 2011-12 Yr 2 FINAL.docx
For current fourth through eighth graders meeting the FAY definition, who were at the proficient or advanced levels on their previous year’s WKCE reading and/or math subtests, it is expected that 75% or more of these students will maintain their status of proficient or above. For current fourth through eighth graders meeting the FAY definition, who were at the minimal or basic levels of proficiency on their previous year’s WKCE reading and/or math subtests, it is expected that 60% of these students will show advancement in scale scores to the next highest quartile within the range of their previous year’s proficiency level or advance to the next proficiency level.

B5 © 2012 by NCCD, All Rights Reserved https://sharepoint.nccdcrc.org/Projects/Project Documents/USA/Wisconsin/508WI_Milw/2011-12/Kings/Kings Academy 2011-12 Yr 2 FINAL.docx
Student Learning Memo Data Addendum
This addendum has been developed to clarify the data collection and submission process related to each of the outcomes stated in King’s Academy’s student learning memo for the academic year. Additionally, important principles applicable to all data collection must be considered. 1. All students attending the school at any time during the academic year should be
included in all student data files created by the school. This includes students who enroll after the first day of school and students who withdraw before the end of the school year. Be sure to include each student’s unique WSN ID number in each data file.
2. All data fields must be completed for each student enrolled at any time during the school
year. If a student is not enrolled when a measure is completed, record N/E for that student to indicate “not enrolled.” This may occur if a student enrolls after the beginning of the school year or withdraws prior to the end of the school year.
3. Record and submit a score/response for each student. Do not submit aggregate data (e.g.,
14 students scored 75%, or the attendance rate was 92%). End-of-the-year data must be submitted to CRC by no later than the fifth working day after the end of the second semester or June 30, 2012. Staff persons responsible for year-end data submission: Lakisha Metcalf and Sylvia Summers
Learning Memo Section/Outcome Data Description Location of Data
Person(s) Responsible for Collecting Data
Student Roster (K4–8)
List of students enrolled at any time during the year. Include the following: x Student Wisconsin state ID
number (WSN) x Local student ID x Student name x Grade x Gender x Race/ethnicity x Free/reduced lunch
eligibility x Special education status
and, if applicable, disability type
Headmaster Lakisha Metcalf Shannon McCoy
Attendance (K4–8)
For each student enrolled at any time during the year, include the following: x WSN x Student name x Number of days expected
Headmaster Shannon McCoy

B6 © 2012 by NCCD, All Rights Reserved https://sharepoint.nccdcrc.org/Projects/Project Documents/USA/Wisconsin/508WI_Milw/2011-12/Kings/Kings Academy 2011-12 Yr 2 FINAL.docx
Learning Memo Section/Outcome Data Description Location of Data
Person(s) Responsible for Collecting Data
attendance x Number of days attended x Number of days excused
absence x Number of days unexcused
absence x Number of days in-school
suspension x Number of days out-of-
school suspension Enrollment, Termination/Withdrawal (K4–8)
For every student enrolled at any time during the year, include the following: x WSN x Student name x Grade x Enrollment date x Withdrawal date (if
applicable) x Withdrawal reason (if
applicable, including if the student was expelled and why)
Note: These fields can be added to the student roster data file described above.
Headmaster Shannon McCoy
Parent Participation (K4–8)
Create a column for each of the following. Include for all students enrolled at any time during the school year: x WSN x Student name x Create one column labeled
conference 1. In this column, indicate with a Y or N whether a parent/guardian/adult attended the first conference. If the student was not enrolled at the time of this conference, enter N/E.
x Create one column labeled conference 2. In this column, indicate with a Y or N whether a parent/guardian/adult attended the second conference. If the student
Excel spreadsheet designed by the school
Lakisha Metcalf Sylvia Summers

B7 © 2012 by NCCD, All Rights Reserved https://sharepoint.nccdcrc.org/Projects/Project Documents/USA/Wisconsin/508WI_Milw/2011-12/Kings/Kings Academy 2011-12 Yr 2 FINAL.docx
Learning Memo Section/Outcome Data Description Location of Data
Person(s) Responsible for Collecting Data
was not enrolled at the time of this conference, enter N/E.
Local Measures of Academic Progress Special Education Needs Students (Grades K4–8)
For each student who had or was assessed for special education services, include the following: x WSN x Student name x The special education need,
e.g., ED, CD, LD, OHI, etc. x Eligibility assessment date x IEP completion date x Parent participation in IEP
completion (Y/N) x IEP review completion date x IEP review results, e.g.,
continue in special education, no longer eligible for special education
x Parent participation in IEP review (Y/N)
x Number of goals on IEP x Number of goals met on IEP
Headmaster or Excel spreadsheet designed by the school
Loula Roberson Delores Jones
Academic Achievement: Local Measures MAP Reading and Math (Grades 1–8)
For each first- through eighth-grade student enrolled at any time during the year, provide the following: x WSN x Student name x Fall MAP reading RIT
score x MAP reading target score x Spring MAP reading RIT
score x Met MAP reading target (Y
or N) x Fall MAP math RIT score x MAP math target score x Spring MAP math RIT
score x Met MAP math target (Y
or N) Note: If a student was not enrolled at the time of either test, enter NE.
Excel spreadsheet designed by the school
Sylvia Summers Madeline Neuworth Brenda Ushi

B8 © 2012 by NCCD, All Rights Reserved https://sharepoint.nccdcrc.org/Projects/Project Documents/USA/Wisconsin/508WI_Milw/2011-12/Kings/Kings Academy 2011-12 Yr 2 FINAL.docx
Learning Memo Section/Outcome Data Description Location of Data
Person(s) Responsible for Collecting Data
Local Measures of Academic Progress Saxon Math (Grades 1–8)
For all students enrolled at any time during the year, provide the following: x WSN x Student name x Fall test administration
date x Fall baseline Saxon Math
score x Spring test administration
date x Percentage of benchmarks
met by end of school year
Excel spreadsheet designed by the school
Sylvia Summers Shannon McCoy Brenda Ushi
Local Measures of Academic Progress Writing (Grades 1–8)
For all students enrolled at any time during the year, provide the following: x WSN x Student name x Fall test administration
date x Fall writing sample score x Spring test administration
date x Spring writing sample
score
Excel spreadsheet designed by the school
Sylvia Summers
Academic Achievement: Standardized Measures SDRT (Grades 1–3)
Create a spreadsheet including all first- through third-grade students enrolled at any time during the school year. Include the following: x WSN x School student ID number x Student name x Grade x Phonetics scale score x Phonetics GLE x Vocabulary scale score x Vocabulary GLE x Comprehension scale score x Comprehension GLE x Total scale score x Total GLE
Provide the test date(s) in an email or other document.
Excel spreadsheet designed by school and/or provide the electronic file supplied by the test publisher. Also, please provide copies of the paper print outs for each student.
Sylvia Summers Shannon McCoy
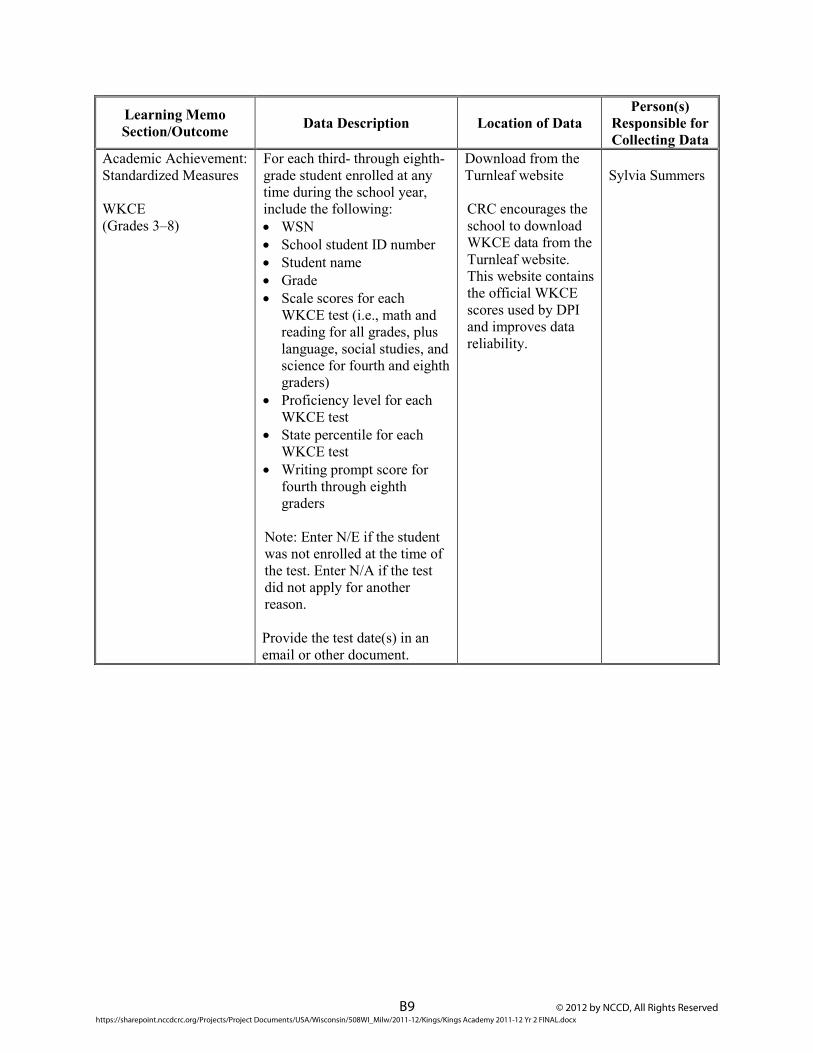
B9 © 2012 by NCCD, All Rights Reserved https://sharepoint.nccdcrc.org/Projects/Project Documents/USA/Wisconsin/508WI_Milw/2011-12/Kings/Kings Academy 2011-12 Yr 2 FINAL.docx
Learning Memo Section/Outcome Data Description Location of Data
Person(s) Responsible for Collecting Data
Academic Achievement: Standardized Measures WKCE (Grades 3–8)
For each third- through eighth-grade student enrolled at any time during the school year, include the following: x WSN x School student ID number x Student name x Grade x Scale scores for each
WKCE test (i.e., math and reading for all grades, plus language, social studies, and science for fourth and eighth graders)
x Proficiency level for each WKCE test
x State percentile for each WKCE test
x Writing prompt score for fourth through eighth graders
Note: Enter N/E if the student was not enrolled at the time of the test. Enter N/A if the test did not apply for another reason. Provide the test date(s) in an email or other document.
Download from the Turnleaf website CRC encourages the school to download WKCE data from the Turnleaf website. This website contains the official WKCE scores used by DPI and improves data reliability.
Sylvia Summers

© 2012 by NCCD, All Rights Reserved https://sharepoint.nccdcrc.org/Projects/Project Documents/USA/Wisconsin/508WI_Milw/2011-12/Kings/Kings Academy 2011-12 Yr 2 FINAL.docx
Appendix C
Trends

C1 © 2012 by NCCD, All Rights Reserved https://sharepoint.nccdcrc.org/Projects/Project Documents/USA/Wisconsin/508WI_Milw/2011-12/Kings/Kings Academy 2011-12 Yr 2 FINAL.docx
Table C1
King’s Academy Student Enrollment and Retention
School Year
Number Enrolled at
Start of School Year
Number Enrolled
During Year
Number Withdrew
Number at End of School Year
Number and Rate Enrolled
for Entire School Year
2010–11 193 17 29 181 168 (87.0%)
2011–12 215 6 21 200 195 (90.7%)
Table C2
King’s Academy Student Return Rates
Year Number Enrolled at End of Previous Year
Number Enrolled at Start of This School
Year Student Return Rate
2011–12 164 130 79.3%
Table C3
King’s Academy Student Attendance
School Year Attendance Rate
2010–11 93.0%
2011–12 94.9%
Table C4
King’s Academy Parent/Guardian Participation Rate
School Year Parent/Guardian Participation Rate
2010–11 79.8%
2011–12 76.9%
Table C5
King’s Academy SDRT Year-to-Year Progress
Average Grade-Level Advancement Grades 1–3
School Year N Average Grade-Level Advancement
2011–12 30 1.2

C2 © 2012 by NCCD, All Rights Reserved https://sharepoint.nccdcrc.org/Projects/Project Documents/USA/Wisconsin/508WI_Milw/2011-12/Kings/Kings Academy 2011-12 Yr 2 FINAL.docx
Table C6
King’s Academy
WKCE Year-to-Year Progress Students Who Remained Proficient
Grades 4–8 School Year Reading Math
2011–12 91.8% 72.2%
Table C7
King’s Academy WKCE Year-to-Year Progress
Students Who Were Minimal or Basic and Showed Improvement Grades 4–8
School Year Reading Math
2011–12 56.5% 41.7%
Table C8
King’s Academy Teacher Retention
Teacher Type Year
Number at Beginning of School
Year
Number Started
After School Year Began
Number Terminated
Employment During the
Year
Number at End of
School Year
Retention Rate:
Number and Rate
Employed at School for
Entire School Year
Classroom Teachers Only 2010–11 10 0 0 10 100.0%
All Instructional Staff
2010–11 14 5 1 18 92.9%
Classroom Teachers Only 2011–12 10 1 2 9 80.0%
All Instructional Staff
2011–12 18 2 3 17 83.3%

C3 © 2012 by NCCD, All Rights Reserved https://sharepoint.nccdcrc.org/Projects/Project Documents/USA/Wisconsin/508WI_Milw/2011-12/Kings/Kings Academy 2011-12 Yr 2 FINAL.docx
Table C9
King’s Academy Teacher Return Rate*
Teacher Type Year Number at End of Prior School
Year
Number Returned at
Beginning of Current School
Year
Return Rate
Classroom Teachers Only 2011–12 10 8 80.0%
All Instructional Staff 2011–12 7 6 82.4%
*Includes only teachers who were eligible to return, i.e., offered a position for fall.
Table C10
King’s Academy Scorecard
School Year
2010-11 62.2%
2011-12 67.5%
© 2012 by NCCD, All Rights Reserved https://sharepoint.nccdcrc.org/Projects/Project Documents/USA/Wisconsin/508WI_Milw/2011-12/Kings/Kings Academy 2011-12 Yr 2 FINAL.docx
Appendix D
CSRC Pilot Scorecard

D1 https://sharepoint.nccdcrc.org/Projects/Project Documents/USA/Wisconsin/508WI_Milw/2011-12/Kings/Kings Academy 2011-12 Yr 2 FINAL.docx © 2012 by NCCD, All Rights Reserved
City of Milwaukee Charter School Review Committee Pilot School Scorecard r: 4/11
K5–8TH GRADE
STUDENT ACADEMIC PROGRESS: GRADES 1–3
x SDRT—% remained at or above GL (4.0) 10% x SDRT—% below GL who improved
more than 1 GL (6.0)
STUDENT ACADEMIC PROGRESS: GRADES 3–8 x WKCE reading—% maintained
proficient and advanced (7.5)
35%
x WKCE math—% maintained proficient and advanced (7.5)
x WKCE reading—% below proficient who progressed
(10.0)
x WKCE math—% below proficient who progressed
(10.0)
LOCAL MEASURES x % met reading (3.75)
15% x % met math (3.75)
x % met writing (3.75)
x % met special education (3.75)
STUDENT ACHIEVEMENT: GRADES 3–8 x WKCE reading—% proficient or
advanced (7.5)
15% x WKCE math—% proficient or
advanced (7.5)
ENGAGEMENT x Student attendance (5.0)
25% x Student reenrollment (5.0) x Student retention (5.0) x Teacher retention (5.0) x Teacher return* (5.0)
HIGH SCHOOL
STUDENT ACADEMIC PROGRESS: GRADES 9, 10, and 12 x EXPLORE to PLAN—composite score at or above
17 on EXPLORE and at or above 18 on PLAN (5)
30%
x EXPLORE to PLAN—composite score of less than 17 on EXPLORE but increased 1 or more on PLAN
(10)
x Adequate credits to move from 9th to 10th grade
(5)
x Adequate credits to move from 10th to 11th grade (5)
x DPI graduation rate (5)
POST-SECONDARY READINESS: GRADES 11 and 12 x Post-secondary acceptance for graduates
(college, university, technical school, military) (10)
15% x % of 11th/12th graders tested (2.5) x % of graduates with ACT composite score of
21.25 or more (2.5)
LOCAL MEASURES x % met reading (3.75)
15% x % met math (3.75) x % met writing (3.75) x % met special education (3.75)
STUDENT ACHIEVEMENT: GRADE 10 x WKCE reading—% proficient and advanced (7.5)
15% x WKCE math—% proficient and advanced (7.5)
ENGAGEMENT x Student attendance (5.0)
25% x Student reenrollment (5.0) x Student retention (5.0) x Teacher retention (5.0) x Teacher return* (5.0)
*Teachers not offered continuing contracts are excluded when calculating this rate. Note: If a school has less than 10 students in any cell on this scorecard, CRC does not report these data. This practice was adopted to protect student identity. Therefore, these cells are reported as not available (NA) on the scorecard. The total score will be calculated based on the school’s denominator.

D2 © 2012 by NCCD, All Rights Reserved https://sharepoint.nccdcrc.org/Projects/Project Documents/USA/Wisconsin/508WI_Milw/2011-12/Kings/Kings Academy 2011-12 Yr 2 FINAL.docx
King’s Academy Charter School Review Committee
Pilot Score Card 2011–12 School Year
Area Measure Max. Points
% Total Score Performance Points
Earned Student Academic Progress 1st through 3rd Grades
SDRT: % remained at or above GL 4
10%
82.4% 3.3
SDRT: % below GL who improved more than 1 GL NA (6) NA NA
Student Academic Progress 3rd through 8th Grades
WKCE reading: % maintained proficient and
advanced 7.5
35%
91.8% 6.9
WKCE math: % maintained proficient and
advanced 7.5 72.2% 5.4
WKCE reading: % below proficient who progressed 10 56.5% 5.7
WKCE math: % below proficient who progressed 10 41.7% 4.2
Local Measures
% met reading 3.75
15%
48.8%30 1.8
% met math 3.75 41.7%31 1.6
% met writing 3.75 65.0% 2.4
% met special education32 NA (3.75) NA NA
Student Achievement 3rd through 8th Grades
WKCE reading: % proficient or advanced 7.5
15% 65.4% 4.9
WKCE math: % proficient or advanced 7.5 42.1% 3.2
Engagement
Student attendance 5
25%
94.9% 4.7
Student reenrollment 5 79.3% 4.0
Student retention 5 90.7% 4.5
Teacher retention rate 5 83.3% 4.2
Teacher return rate 5 82.4% 4.1
TOTAL 90.2533 60.9 (67.5%)
30 Percent is based on the number of students at or above the national average for their grade level on the fall MAP reading test who remained at or above the national average in the spring, and the number of students below the national average on the fall test who progressed from fall to spring. 31 Percent is based on Saxon math results and MAP math test results (for MAP, the number of students at or above the national average for their grade level on the fall MAP math test who remained at or above the national average in the spring, and the number of students below the national average on the fall test who progressed from fall to spring). 32 Due to the small number of special education students who were enrolled at King’s Academy for two consecutive years, IEP goal progress could not be included in this report. 33 Note: To protect student identity, fewer than 10 students in any cell is not reported on this scorecard; these cells are reported as not available (NA). The percentage is calculated based on the modified denominator, rather than 100 possible points.

© 2012 by NCCD, All Rights Reserved https://sharepoint.nccdcrc.org/Projects/Project Documents/USA/Wisconsin/508WI_Milw/2011-12/Kings/Kings Academy 2011-12 Yr 2 FINAL.docx
Appendix E
Teacher Interviews

E1 © 2012 by NCCD, All Rights Reserved https://sharepoint.nccdcrc.org/Projects/Project Documents/USA/Wisconsin/508WI_Milw/2011-12/Kings/Kings Academy 2011-12 Yr 2 FINAL.docx
Teacher Interviews
In the spring of 2011, CRC interviewed 10 teachers regarding their reasons for teaching and overall satisfaction with the school. One teacher taught K5 through fourth, three taught fifth through eighth grades, and one teacher taught second through eighth grades. CRC also interviewed the special education teacher. Teachers were responsible for seven to 24 students at a given time. No teachers indicated that they share classroom responsibility with another teacher. One teacher had been teaching at the school for 12 years, one for seven years, two for six years, four for two years, one for one year, and one for six months. All teachers indicated that they routinely use data to make decisions in the classroom, and nine teachers indicated that school leadership used data to make school-wide decisions. One teacher indicated that the school did not use student data to make school-wide decisions. All teachers stated that their performance reviews occurred every semester. Eight of the 10 teachers indicated that they received informal feedback and suggestions monthly, one teacher received feedback each semester, and one teacher never received feedback. Four teachers were satisfied with the review process, five teachers were somewhat satisfied with the review process, and one teacher was somewhat dissatisfied with the process. Eight teachers interviewed reported that they had plans to continue teaching at the school, and two teachers indicated that they did not have plans to continue teaching at the school. Teachers were asked to rate how important various reasons were for teaching at the school. Teachers rated students, general atmosphere, discipline, administrative leadership, parental involvement, colleagues, class size, and age/grade level of the students as somewhat important or very important for teaching at this school. See Table E1 for more details.

E2 © 2012 by NCCD, All Rights Reserved https://sharepoint.nccdcrc.org/Projects/Project Documents/USA/Wisconsin/508WI_Milw/2011-12/Kings/Kings Academy 2011-12 Yr 2 FINAL.docx
Table E1
Reasons for Teaching at King’s Academy 2011–12 (N = 10)
Reason Importance
Very Important Somewhat Important
Somewhat Unimportant
Not at All Important
Location 4 2 1 3
Financial 4 5 1 0
Educational methodology 5 4 1 0 Age/grade level of students 4 5 0 1
Discipline 7 1 2 0
General atmosphere 8 1 1 0
Class size 5 5 0 0
Type of school 5 1 1 3
Parental involvement 6 3 1 0
Administrative leadership 7 2 1 0
Colleagues 6 3 0 1
Students 10 0 0 0
Teachers were asked whether any additional criteria influenced their decision to continue teaching at the school. One teacher each mentioned that the school was connected to his/her church; having a voice in a new school and developing the school; relationship with the church; and the resources and support provided as additional reasons for continuing to teach at the school. Six teachers did not offer additional reasons. In terms of overall evaluation of the school, teachers were asked to rate the school’s performance related to class size; materials and equipment; student assessment plan; shared leadership; professional support and development; and the school’s progress toward becoming an excellent school. Teachers most often rated students’ assessment plans, standardized tests, local measures, and professional support as good. Teachers most often rated shared leadership as fair. Two of the 10 teachers listed the school’s progress toward becoming an excellent school as excellent, six teachers listed the school’s progress as good, and two teachers reported the school’s progress to be fair.

E3 © 2012 by NCCD, All Rights Reserved https://sharepoint.nccdcrc.org/Projects/Project Documents/USA/Wisconsin/508WI_Milw/2011-12/Kings/Kings Academy 2011-12 Yr 2 FINAL.docx
Table E2
King’s Academy School Performance Rating
2011–12 (N = 10)
Area Rating
Excellent Good Fair Poor
1. Class size 4 4 1 1
2. Materials and equipment 4 3 3 0
3. Student assessment plan 1 8 1 0
3a. Local measures 1 7 2 0
3b. Standardized test 1 7 1 1
3c. Progress reports 2 4 4 0 4. Shared leadership, decision making, and
accountability 0 3 6 1
5. Professional support 3 3 4 0
6. Professional development opportunities 3 4 2 1
7. Progress toward becoming an excellent school 2 6 2 0
On a satisfaction rating scale ranging from very satisfied to very dissatisfied, teacher response was generally mixed, but tended to be more in the satisfied range. Areas where teachers expressed the most satisfaction were with performance as a teacher, parent-teacher relationships, student/teacher ratio, parent involvement, opportunities for teacher involvement, and community/business involvement. Teachers reported some dissatisfaction with the school’s adherence to the discipline policy. Table E3 lists all of the teachers’ responses.

E4 © 2012 by NCCD, All Rights Reserved https://sharepoint.nccdcrc.org/Projects/Project Documents/USA/Wisconsin/508WI_Milw/2011-12/Kings/Kings Academy 2011-12 Yr 2 FINAL.docx
Table E3
King’s Academy Teacher Satisfaction
2011–12 (N = 10)
Performance Measure
Response
Very Satisfied
Somewhat Satisfied
Somewhat Dissatisfied
Very Dissatisfied
No Opinion/
N/A Program of instruction 4 4 2 0 0
Enrollment policy and procedure 1 4 2 0 3
Students’ academic progress 4 3 3 0 0
Student teacher ratio 5 2 2 1 0
Discipline policy 3 4 2 1 0
Adherence to discipline policy 0 2 6 2 0
Instructional support 3 3 4 0 0
Parent-teacher relationships 5 5 0 0 0 Teacher collaboration to plan learning experiences 2 2 4 2 0
Parent involvement 1 7 2 0 0
Community/business involvement 0 6 0 0 4
Performance as a teacher 6 4 0 0 0
Principal’s performance 4 5 1 0 0
Professional support staff performance 4 5 1 0 0
Opportunities for teacher involvement 0 6 2 1 1
Opportunities for continuing education 1 5 3 1 0
Frequency of staff meetings 2 3 4 1 0
Effectiveness of staff meetings 1 3 5 1 0
When teachers were asked to name three things they liked most about the school, teachers noted the following:
x Teachers/staff, i.e., support/collaboration (six teachers);
x General atmosphere (four teachers);
x Class size (four teachers);
x Building/layout (three teachers); and
x Opportunities for development (two teachers);
x Technology (two teachers); and

E5 © 2012 by NCCD, All Rights Reserved https://sharepoint.nccdcrc.org/Projects/Project Documents/USA/Wisconsin/508WI_Milw/2011-12/Kings/Kings Academy 2011-12 Yr 2 FINAL.docx
x Flexibility in lesson planning (two teachers).
x One teacher each said administration accepts suggestions, relationships with students, the curriculum, and the resources for teachers to use.
Teachers most often mentioned the following as least liked about the school:
x Lack of elective classes (five teachers);
x Lack of sufficient prep time (five teachers);
x Discipline policy and follow-through (four teachers);
x Micro-management from administrators (two teachers); and
x Lack of teaching assistants (two teachers).
x One teacher each said more emphasis on the amount of time and resources needed to
appropriately implement school improvement, inconsistent communication between administration and staff, too many staff meetings, staff move personal responsibilities outside school, lack of utilization of experience and skills, no librarian, and lack of support from the principal and administration.
When asked what barriers could affect their decision to remain at the school, two teachers said certification requirements, and two teachers said financial needs. One teacher each identified too many special education students for one teacher, if future growth does not meet expectations, communication issues, and failure to develop a clear disciplinary policy. When asked to provide a suggestion to improve the school, two teachers suggested adding more elective classes such as art and music; two teachers suggested improving communication and follow-through from administration; and one teacher each said to add a study skills class for middle school students; clearly stated expectations and buy-in from staff and parents; provide more competitive salaries; consistent adherence to discipline policy; provide more prep time; and decrease bussing to promote parental involvement. When asked for a suggestion to improve the classroom, four teachers mentioned adding additional support staff, including paraprofessionals, in the classroom. One teacher each said to add smartboards with Elmo, add another special education teacher, equip a science lab, decrease class size, isolate students by skill level, and increase planning time. Teachers were also asked to rate the school’s contribution to students’ academic progress. On a scale of poor, fair, good, or excellent, two of the teachers rated the schools contribution as excellent. Seven teachers rated the school’s contribution as good, and one teacher rated the school’s contribution as fair.

© 2012 by NCCD, All Rights Reserved https://sharepoint.nccdcrc.org/Projects/Project Documents/USA/Wisconsin/508WI_Milw/2011-12/Kings/Kings Academy 2011-12 Yr 2 FINAL.docx
Appendix F
Parent Surveys/Interviews

F1 © 2012 by NCCD, All Rights Reserved https://sharepoint.nccdcrc.org/Projects/Project Documents/USA/Wisconsin/508WI_Milw/2011-12/Kings/Kings Academy 2011-12 Yr 2 FINAL.docx
Parent Surveys/Interviews
Parent opinions are qualitative in nature and provide a valuable measurement of school performance. To determine how parents heard about the school, why they elected to send their children to the school, parental involvement with the school, and an overall evaluation of the school, parents were provided with a survey during the March parent-teacher conferences. Parents were asked to complete the survey, place it in a sealed envelope, and return it to the school. CRC made at least two follow-up phone calls to parents who had not completed a survey. For families who had not submitted a survey, CRC completed the survey over the telephone or sent the parents/guardians a survey in the mail. All completed survey forms were forwarded to CRC for data entry. At the time of this report, 107 family surveys, representing parents of 138 of 206 (66.9%) children, had been completed and submitted to CRC. Results are presented below. Most parents (58.9%) heard about the school from friends or relatives. Others heard about the school through their church (28.9%), community center (2.8%), or private school (1.9%). Some (18.7%) parents heard about the school from other sources. See table F1 for more information.
Parents listed the following as other reasons they enrolled their children into the school.
x Returning students (two parents);
x Research (three parents); and
x Toured the school (two parents).
x One parent each said: neighborhood school, works in the school, and enrollment
book. Parents chose to send their children to King’s Academy for a variety of reasons. Table F2 provides information relating to the various factors that influenced parents to consider enrolling their children
Table F1
King’s Academy How Parents Learned About the School
2011–12 (N =107)
Method Answer
Yes No No Response
Newspaper 0 107 0
Private school 2 105 0
Community center 3 104 0
Church 31 76 0
Friends/relatives 63 44 0
TV/radio/internet 2 104 0
Other 20 87 0

F2 © 2012 by NCCD, All Rights Reserved https://sharepoint.nccdcrc.org/Projects/Project Documents/USA/Wisconsin/508WI_Milw/2011-12/Kings/Kings Academy 2011-12 Yr 2 FINAL.docx
into King’s Academy. Parents could rate each factor as ranging from being very important in their consideration to selecting the school to not at all important when choosing a school. Most parents (97.2%) rated school safety as being a very important reason for selecting this school. In addition, many parents (93.5%) indicated that the school’s educational methodology and/or curriculum was very important to them when choosing this school. Please see Table F2 for complete information.
Table F2
King’s Academy Parent Reasons for Choosing the School
2011–12 (N = 107)
Factors
Response Very
Important Somewhat Important
Somewhat Unimportant
Not at All Important No Response
N % N % N % N % N %
Location 71 66.4% 26 24.3% 5 4.7% 5 4.7% 0 0.0% Other children or relative already attending this school 34 31.8% 37 34.6% 4 3.7% 31 29.0% 1 0.9%
Educational methodology 100 93.5% 7 6.5% 0 0.0% 0 0.0% 0 0.0%
Range of grades in school 83 77.6% 19 17.8% 3 2.8% 1 0.9% 1 0.9%
Discipline 93 86.9% 13 12.1% 1 0.9% 0 0.0% 0 0.0%
General atmosphere 98 91.6% 7 6.5% 0 0.0% 0 0.0% 2 1.9%
Class size 92 86.0% 13 12.1% 1 0.9% 1 0.9% 0 0.0% Recommendation of family and friends 47 43.9% 31 29.0% 11 10.3% 16 15.0% 2 1.9%
Opportunities for parental participation 78 72.9% 26 24.3% 1 0.9% 1 0.9% 1 0.9%
School safety 104 97.2% 2 1.9% 0 0.0% 1 0.9% 0 0.0% Frustration with previous school 38 35.5% 25 23.4% 10 9.3% 29 27.1% 5 4.7%
Some parents (37 of 107, or 34.6%) identified other reasons for enrolling their children into the school. Reasons included close to home, positive recommendations, and liked the school’s philosophy. Parental involvement was utilized as an additional measure of satisfaction with the school. Parental involvement was measured by the number of contacts between the school and the parent(s) and parents’ participation in educational activities in the home. Parents and the school were in contact for a variety of reasons, including the children’s academic performance and behavior, assisting in the classroom, or engaging in fundraising activities. For example, 38.3% of parents reported contact with the school five or more times regarding their child’s behavior. Table F3 provides complete information relating to the type and frequency of parental contact with the school.
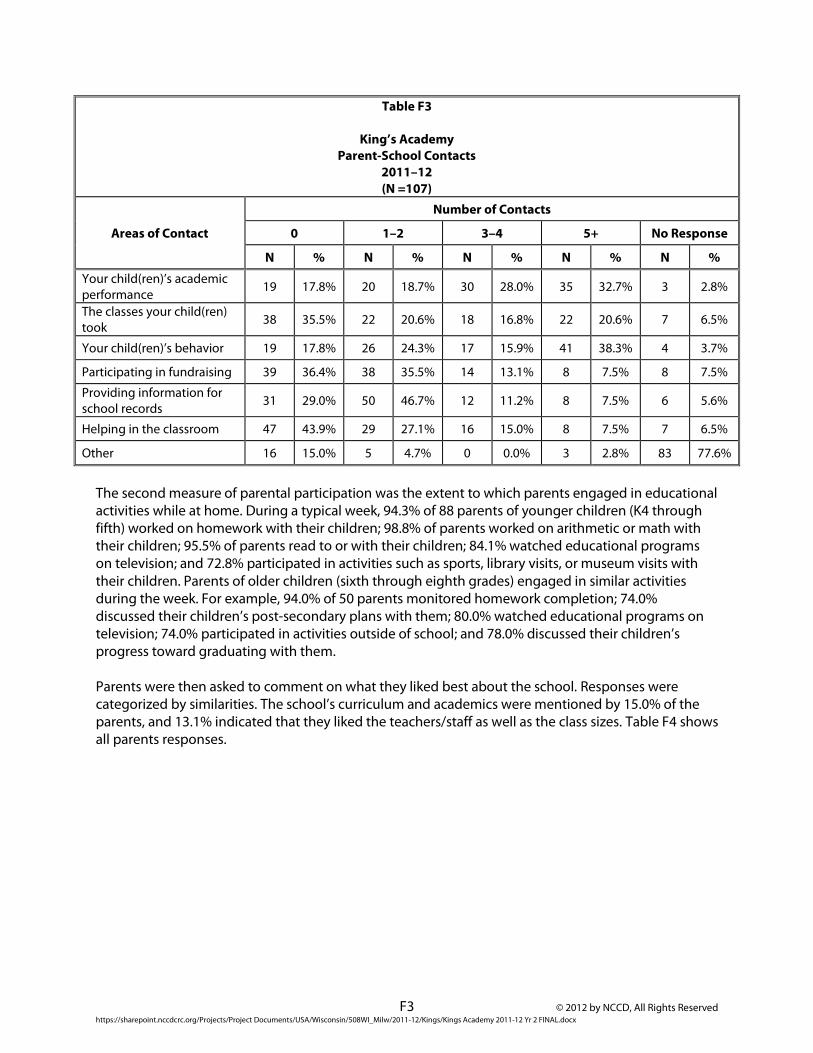
F3 © 2012 by NCCD, All Rights Reserved https://sharepoint.nccdcrc.org/Projects/Project Documents/USA/Wisconsin/508WI_Milw/2011-12/Kings/Kings Academy 2011-12 Yr 2 FINAL.docx
Table F3
King’s Academy Parent-School Contacts
2011–12 (N =107)
Areas of Contact
Number of Contacts
0 1–2 3–4 5+ No Response
N % N % N % N % N % Your child(ren)’s academic performance 19 17.8% 20 18.7% 30 28.0% 35 32.7% 3 2.8%
The classes your child(ren) took 38 35.5% 22 20.6% 18 16.8% 22 20.6% 7 6.5%
Your child(ren)’s behavior 19 17.8% 26 24.3% 17 15.9% 41 38.3% 4 3.7%
Participating in fundraising 39 36.4% 38 35.5% 14 13.1% 8 7.5% 8 7.5% Providing information for school records 31 29.0% 50 46.7% 12 11.2% 8 7.5% 6 5.6%
Helping in the classroom 47 43.9% 29 27.1% 16 15.0% 8 7.5% 7 6.5%
Other 16 15.0% 5 4.7% 0 0.0% 3 2.8% 83 77.6%
The second measure of parental participation was the extent to which parents engaged in educational activities while at home. During a typical week, 94.3% of 88 parents of younger children (K4 through fifth) worked on homework with their children; 98.8% of parents worked on arithmetic or math with their children; 95.5% of parents read to or with their children; 84.1% watched educational programs on television; and 72.8% participated in activities such as sports, library visits, or museum visits with their children. Parents of older children (sixth through eighth grades) engaged in similar activities during the week. For example, 94.0% of 50 parents monitored homework completion; 74.0% discussed their children’s post-secondary plans with them; 80.0% watched educational programs on television; 74.0% participated in activities outside of school; and 78.0% discussed their children’s progress toward graduating with them. Parents were then asked to comment on what they liked best about the school. Responses were categorized by similarities. The school’s curriculum and academics were mentioned by 15.0% of the parents, and 13.1% indicated that they liked the teachers/staff as well as the class sizes. Table F4 shows all parents responses.
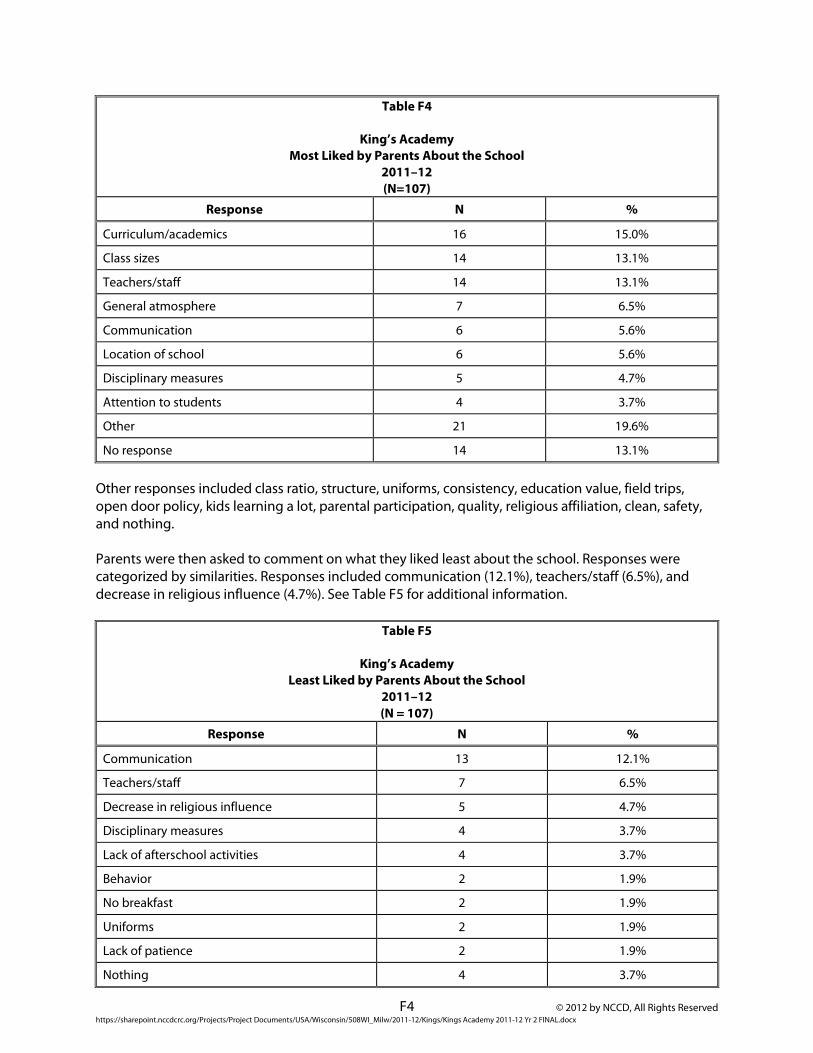
F4 © 2012 by NCCD, All Rights Reserved https://sharepoint.nccdcrc.org/Projects/Project Documents/USA/Wisconsin/508WI_Milw/2011-12/Kings/Kings Academy 2011-12 Yr 2 FINAL.docx
Table F4
King’s Academy Most Liked by Parents About the School
2011–12 (N=107)
Response N %
Curriculum/academics 16 15.0%
Class sizes 14 13.1%
Teachers/staff 14 13.1%
General atmosphere 7 6.5%
Communication 6 5.6%
Location of school 6 5.6%
Disciplinary measures 5 4.7%
Attention to students 4 3.7%
Other 21 19.6%
No response 14 13.1%
Other responses included class ratio, structure, uniforms, consistency, education value, field trips, open door policy, kids learning a lot, parental participation, quality, religious affiliation, clean, safety, and nothing. Parents were then asked to comment on what they liked least about the school. Responses were categorized by similarities. Responses included communication (12.1%), teachers/staff (6.5%), and decrease in religious influence (4.7%). See Table F5 for additional information.
Table F5
King’s Academy
Least Liked by Parents About the School 2011–12 (N = 107)
Response N %
Communication 13 12.1%
Teachers/staff 7 6.5%
Decrease in religious influence 5 4.7%
Disciplinary measures 4 3.7%
Lack of afterschool activities 4 3.7%
Behavior 2 1.9%
No breakfast 2 1.9%
Uniforms 2 1.9%
Lack of patience 2 1.9%
Nothing 4 3.7%

F5 © 2012 by NCCD, All Rights Reserved https://sharepoint.nccdcrc.org/Projects/Project Documents/USA/Wisconsin/508WI_Milw/2011-12/Kings/Kings Academy 2011-12 Yr 2 FINAL.docx
Table F5
King’s Academy Least Liked by Parents About the School
2011–12 (N = 107)
Response N %
Other 17 15.9%
No response 45 42.1%
Other responses included one class per grade, changed to a charter school, lack of diversity, lack of enjoyment, unnecessary phone calls, too much responsibility on principal, older child had issues, curriculum, no playground, no in-school nurse, no in-school suspension, loss of Spanish and music class, location, and issues with permission slips. Parents were also asked to rate the school on various aspects including the program of instruction, the school’s responsiveness, and progress reports provided to parents/guardians. Table F6 indicates that parents rated the school as good or excellent in most of the aspects of the academic environment. For example, most parents indicated that the program of instruction was excellent (42.1%) or good (43.0%) and that responsiveness to their concerns was excellent (57.9%) or good (21.5%). Where no response was indicated, the parent either had no knowledge or experience with that aspect or had no opinion.
Table F6
King’s Academy Parental Satisfaction
2011–12 (N = 107)
Area
Response
Excellent Good Fair Poor No Response
N % N % N % N % N %
Program of instruction 45 42.1% 46 43.0% 9 8.4% 1 0.9% 6 5.6%
Ease of enrollment 65 60.7% 35 32.7% 3 2.8% 1 0.9% 3 2.8%
Child’s academic progress 53 49.5% 38 35.5% 14 13.1% 1 0.9% 1 0.9%
Student teacher ratio 63 58.9% 28 26.2% 12 11.2% 4 3.7% 0 0.0%
Discipline methods 45 42.1% 38 35.5% 18 16.8% 6 5.6% 0 0.0% Parent-teacher relationships 58 54.2% 33 30.8% 12 11.2% 2 1.9% 2 1.9%
Communication regarding learning expectations 56 52.3% 27 25.2% 18 16.8% 4 3.7% 2 1.9%
Opportunities for parental involvement 57 53.3% 38 35.5% 9 8.4% 1 0.9% 2 1.9%
Teacher performance 61 57.0% 28 26.2% 16 15.0% 1 0.9% 1 0.9%
Principal performance 66 61.7% 30 28.0% 9 8.4% 2 1.9% 0 0.0% Teacher/principal availability 58 54.2% 31 29.0% 14 13.1% 3 2.8% 1 0.9%

F6 © 2012 by NCCD, All Rights Reserved https://sharepoint.nccdcrc.org/Projects/Project Documents/USA/Wisconsin/508WI_Milw/2011-12/Kings/Kings Academy 2011-12 Yr 2 FINAL.docx
Table F6
King’s Academy Parental Satisfaction
2011–12 (N = 107)
Area
Response
Excellent Good Fair Poor No Response
N % N % N % N % N % Responsiveness to concerns 62 57.9% 23 21.5% 14 13.1% 5 4.7% 3 2.8%
Progress reports for parents/guardians 50 46.7% 37 34.6% 10 9.3% 0 0.0% 10 9.3%
Parents were then asked to indicate their level of agreement with several statements about school staff. Results are summarized in Table F7.
Table F7
King’s Academy Parental Rating of School Staff
2011–12 (N = 107)
Statement
Response Strongly
Agree Agree Neutral Disagree Strongly Disagree
No Response
N % N % N % N % N % N % I am comfortable talking with staff 70 65.4% 25 23.4% 5 4.7% 4 3.7% 1 0.9% 2 1.9%
The staff welcomes suggestions from parents 56 52.3% 29 27.1% 15 14.0% 2 1.9% 3 2.8% 2 1.9%
The staff keeps me informed about my child(ren)’s performance
61 57.0% 26 24.3% 7 6.5% 6 5.6% 4 3.7% 3 2.8%
I am comfortable with how the staff handles discipline
50 46.7% 24 22.4% 17 15.9% 7 6.5% 7 6.5% 2 1.9%
I am satisfied with the number of adult staff available to work with the students
51 47.7% 35 32.7% 10 9.3% 5 4.7% 3 2.8% 3 2.8%
I am satisfied with the overall performance of the staff
52 48.6% 35 32.7% 11 10.3% 5 4.7% 2 1.9% 2 1.9%
The staff recognizes my child(ren)’s strengths and weaknesses
60 56.1% 31 29.0% 10 9.3% 2 1.9% 2 1.9% 2 1.9%

F7 © 2012 by NCCD, All Rights Reserved https://sharepoint.nccdcrc.org/Projects/Project Documents/USA/Wisconsin/508WI_Milw/2011-12/Kings/Kings Academy 2011-12 Yr 2 FINAL.docx
Lastly, parental satisfaction was evident in the following results:
x Many (94, or 87.9%) parents would recommend this school to other parents;
x Of the 107 surveyed parents, 74 (69.2%) will send their children to the school next year;
x When asked to rate the school’s overall contribution to their child’s learning, a majority (66, or 61.7%) of parents indicated excellent and 30 (28.0%) parents rated the school as good. Eight (7.5%) parents thought the school was fair, and one parent (0.9%) rated the school as poor. Two parents did not respond to the question.

© 2012 by NCCD, All Rights Reserved https://sharepoint.nccdcrc.org/Projects/Project Documents/USA/Wisconsin/508WI_Milw/2011-12/Kings/Kings Academy 2011-12 Yr 2 FINAL.docx
Appendix G
Student Interviews

G1 © 2012 by NCCD, All Rights Reserved https://sharepoint.nccdcrc.org/Projects/Project Documents/USA/Wisconsin/508WI_Milw/2011-12/Kings/Kings Academy 2011-12 Yr 2 FINAL.docx
Student Interviews
At the end of the school year, CRC staff asked 20 randomly selected students in seventh and eighth grades several questions about their school. All students reported that they used computers at their school, and most students (n=19) indicated that their teachers were helpful and regularly discussed planning for high school. Additionally, the majority of students (n=18) indicated that they felt safe in school, were learning new things on a daily basis, and that their reading ability had improved. In regard to academic reporting, nine students said that the marks they received on their classwork, homework, and report cards were fair. Eleven students indicated that they felt their marks were unfair. See Table G for additional information.
Students were then asked what they liked best and least about the school. Students liked the following aspects best:
x Teachers (five students);
x Students/staff (three students); and
x Basketball team/season (three students).
Table G
King’s Academy Student Interview
2011–12 (N = 20)
Question
Answer
Yes No No Response/ Don’t Know/
N/A 1. Do you like your school? 16 4 0 2. Are you learning new things every day? 18 1 1 3. Have you improved in reading? 18 2 0 4. Have you improved in math? 13 7 0 5. Do you use computers at school? 20 0 0 6. Is your school clean? 14 6 0 7. Do you like the school rules? 12 8 0 8. Do you think the school rules are fair? 12 7 1 9. Does your homework help you at school? 15 5 0 10. Do your teachers help you at school? 19 1 0 11. Do you like being in school? 13 6 1 12. Do you feel safe in school? 18 2 0 13. Do people work together in school? 17 3 0 14. Do you feel the marks you get on classwork, homework, and
report cards are fair? 9 11 0
15. Do your teachers talk to your parents? 16 4 0 16. Does your school have afterschool activities? 18 2 0 17. Do your teachers talk with you about high school plans? 19 1 0

G2 © 2012 by NCCD, All Rights Reserved https://sharepoint.nccdcrc.org/Projects/Project Documents/USA/Wisconsin/508WI_Milw/2011-12/Kings/Kings Academy 2011-12 Yr 2 FINAL.docx
x One student each said that the school has a library, the field trips, learning with each other, the principal, they make learning interesting, transition to other classrooms, the uniforms, normal classes, and one student had no response.
When asked what they liked least, students responded as follows:
x Uniforms (six students);
x Rules (three students);
x Teachers (three students); and
x Students (two students).
x One student each said lunch, my class does not express how smart they are/could be, concern with discipline, should give the middle school more freedom, fifth grade is mixed with the middle school, and one student indicated that he/she could not think of anything.

© 2012 by NCCD, All Rights Reserved https://sharepoint.nccdcrc.org/Projects/Project Documents/USA/Wisconsin/508WI_Milw/2011-12/Kings/Kings Academy 2011-12 Yr 2 FINAL.docx
Appendix H
Board Member Interviews

H1 © 2012 by NCCD, All Rights Reserved https://sharepoint.nccdcrc.org/Projects/Project Documents/USA/Wisconsin/508WI_Milw/2011-12/Kings/Kings Academy 2011-12 Yr 2 FINAL.docx
Board Member Interviews Board member opinions are qualitative in nature and provide valuable, although subjective, insight regarding school performance and organizational competency. King’s Academy’s board of directors consists of 10 members. One of the members is indicated as president. Five of the 10 members of the board participated in a phone interview conducted by CRC staff using a prepared interview guide. One of the board members has served on the board for 13 years, another for 11, another for 10, one for five and one for three years (note that the school had been in existence prior to being chartered by the City of Milwaukee). These board members represented experience as a professor at the Milwaukee Area Technical College, as former Milwaukee Public School teachers, as a founder of the school, a parent, a fundraiser, a registered nurse and social worker, and a manager in industry. All five reported that they participated in strategic planning for the school. They also reported that the board receives a presentation on the school’s annual academic performance report, receives and approves the school’s annual budget, and reviews the school’s annual financial audit.
Table H
King’s Academy
Board Member Interview Results 2011–12
(N = 5)
Performance Measure Response
Very Satisfied
Somewhat Satisfied
Somewhat Dissatisfied
Very Dissatisfied
Don’t Know
Program of instruction 1 4 0 0 0 Enrollment policy/procedures 4 1 0 0 0 The students’ academic progress 1 4 0 0 0 Student/teacher ratio/class size 3 2 0 0 0 Discipline policy 2 2 0 0 1 Adherence to discipline policy 1 2 1 0 1 Instructional support 3 2 0 0 0 Parent involvement 0 4 1 0 0 Community/business involvement 1 3 0 0 1 Teacher performance 0 5 0 0 0 Principal’s performance 4 1 0 0 0 Current role of the board of directors 1 4 0 0 0 Board of directors’ performance 0 5 0 0 0 Financial resources to fulfill school’s mission 1 4 0 0 0
Commitment of school’s leadership 5 0 0 0 0 Safety of the educational environment 5 0 0 0 0 One board member rated the school overall as excellent, and the other four rated the school overall as good on a scale of excellent, good, fair, or poor.

H2 © 2012 by NCCD, All Rights Reserved https://sharepoint.nccdcrc.org/Projects/Project Documents/USA/Wisconsin/508WI_Milw/2011-12/Kings/Kings Academy 2011-12 Yr 2 FINAL.docx
When asked what they liked best about the school, the board members mentioned a number of different items:
x Leadership and teachers are committed and provide the best education possible; x Location of the school and the fact that it is a safe environment for students; x Academic progress of the students; x Curriculum and that the school is not afraid to try new approaches; x Small class size x Commitment of parents who are involved; and x Technology, hardware, and software used in the school.
Regarding dislikes, the board members mentioned the following issues:
x Lack of sufficient support from parents; need a student and parent mentoring program;
x Students who enter at later grades sometimes have behavior issues;
x Students who are not doing well in school; lagging behind;
x Report cards are not accurate;
x Delay in obtaining materials; and
x Board responsibilities and authority need clarification.
When asked for one suggestion for improving the school, board members mentioned the following: x Establish a student and parent mentoring program; x Extend the school year to focus on math and reading; x Review the chain of command; x Provide more emphasis on basic education with books, pen, and paper; and x Increase teacher support.