Finance & Purchasing Overview 1 Finance and Purchasing Overview.
FEDERAL RESERVE BANK OF ST. LOUIS REGIONAL ECONOMIC DEVELOPMENT VOLUME 2, NUMBER 1 2006 31
K-12 Public School Finance in Missouri:An Overview
Michael Podgursky and Matthew G. Springer
with the 1971 Serrano v. Priest decision inCalifornia, school finance systems based primarilyon local property taxes have been found to violatestate constitutions. Interdistrict per-student spend-ing disparities in many states were substantial. InTexas, for example, given identical property taxrates, high-wealth districts were capable of spendingover 20 times more per student than low-wealthdistricts (Edgewood Independent School District v.Kirby, 1989). These legal challenges, termed “equity”cases, have been successfully argued in 12 states.Research suggests that they have had the effect ofnarrowing spending inequality (Murray, Evans, andSchwab, 1998).
Missouri’s school finance system was chal-lenged on equity grounds and found unconstitu-tional in 1993. The legislature responded by writinginto law the School Improvement Act of 1993,which called for an extensive overhaul of the schoolfunding mechanism by means of an increase inelementary and secondary education spendingand decoupling of local tax collections from local
T he level and structure of public elemen-tary and secondary education fundingis a contentious public policy matterin Missouri and many other states.
Although state revenues and spending grew brisklyduring the latter 1990s, the 2001 recession pro-duced large deficits and sharp declines in taxrevenues in most states. Fiscal recovery has beenslow, and growing spending demands in the areasof public safety, social services, and educationcoupled with rapid growth in Medicaid expenseshave resulted in considerable fiscal stress for states(Kane, Orszag, and Gunter, 2003). Voters also havebeen reluctant to raise tax rates. In Missouri, voterdiscontent led to the passage of a constitutionalamendment in 1980 known as the HancockAmendment, which limits the growth of staterevenues to the growth rate of state per capitapersonal income (Hembree, 2004).
Two generations of school finance litigationhave further complicated fiscal matters. Beginning
The level and distribution of spending for public K-12 education remains a contentious matter ofpolicy in many states because of increasing expectations for school performance and widespreadschool finance litigation. In this paper, the authors examine the policies that have generated schoolfunding in Missouri and the outcomes of these policies in terms of the overall level of schoolspending and interdistrict spending gaps. Interdistrict inequality in average spending is higher inMissouri than in surrounding states, but the spending gaps are equalizing in the sense that poorchildren tend to be concentrated in districts with above-average spending. A new school fundingformula is grounded on a purported link between spending and student achievement. Since thatassociation is tenuous statistically, challenges are likely to arise as this new scheme is fullyimplemented.
Federal Reserve Bank of St. Louis Regional Economic Development, 2006, 2(1), pp. 31-50.
Michael Podgursky is a professor of economics at the University of Missouri–Columbia, and Matthew G. Springer is assistant director for policyresearch at the Peabody Center for Education Policy, Vanderbilt University. The authors thank Mark Ehlert and Gerri Ogle for assistance with thestate finance and assessment data, Art Peng for research assistance, and Michael Wolkoff for helpful comments.
© 2006, The Federal Reserve Bank of St. Louis. Articles may be reprinted, reproduced, published, distributed, displayed, and transmitted intheir entirety if copyright notice, author name(s), and full citation are included. Abstracts, synopses, and other derivative works may be madeonly with prior written permission of the Federal Reserve Bank of St. Louis.
wealth. In theory, districts with identical propertytax rates would raise identical revenues. However,the sharp decline in state revenues as a result ofthe 2001 recession combined with high rates ofhousing price inflation in some parts of the statemade the system unviable.
A second generation of school finance lawsuits,known as “adequacy” or “equity II” (Ladd andHansen, 1999), emerged following Kentucky’sRose v. Council for Better Education (1989). In thesecases, courts have shifted their focus to includeexamination of what dollars buy, including high-quality teachers, class sizes, textbooks, curriculummaterials, facilities, technology, and whether theseinputs are adequate to meet constitutional standardsfor education. An adequacy lawsuit was filed in
2004 in Missouri and once again set the state legis-lature on course to throw out the old finance systemin favor of a very different alternative. A new “ade-quacy based” finance system, approved in 2005,aims to make available to all students a level ofresources sufficient to reach a level of proficiencydefined by state standards.
This paper provides a descriptive overview ofthe Missouri school finance system. The first sectionprovides an overview of the system of school dis-tricts in Missouri and some contextual background.The following section gives a rudimentary explana-tion of the “old” finance regime in Missouri from1993 to the present, but which is now being phasedout. We then examine data on the fiscal outcomesof that system and how Missouri’s per-student
Podgursky and Springer
32 VOLUME 2, NUMBER 1 2006 FEDERAL RESERVE BANK OF ST. LOUIS REGIONAL ECONOMIC DEVELOPMENT
Nevad
a
Delawar
e
Mar
yland
Rhode Isla
nd
Utah
Wyo
ming
Alaska
Wes
t Virg
inia
Louisi
ana
Florid
a
New M
exico
Idah
o
Alabam
a
Virginia
Tennes
see
Miss
issip
pi
Connectic
ut
Kentu
cky
South
Dak
ota
Colora
do
New H
ampsh
ire
Georg
ia
Ore
gon
North D
akota
Main
e
Verm
ont
Indian
a
Was
hington
Kansa
s
Arkan
sas
Arizona
Mas
sach
usetts
Iowa
Minnes
ota
Wisc
onsin
Monta
na
Pennsy
lvania
Miss
ouri
Okla
homa
Mich
igan
Nebra
ska
New Je
rsey
Ohio
New Yo
rk
Illinois
Califo
rnia
Texa
s
1,200
1,000
800
600
400
200
0
Hawaii
South
Car
olina
North C
arolin
a
Hawaii1
Missouri524
Texas1,040
TNKY
KS AR
IA
NE
IL
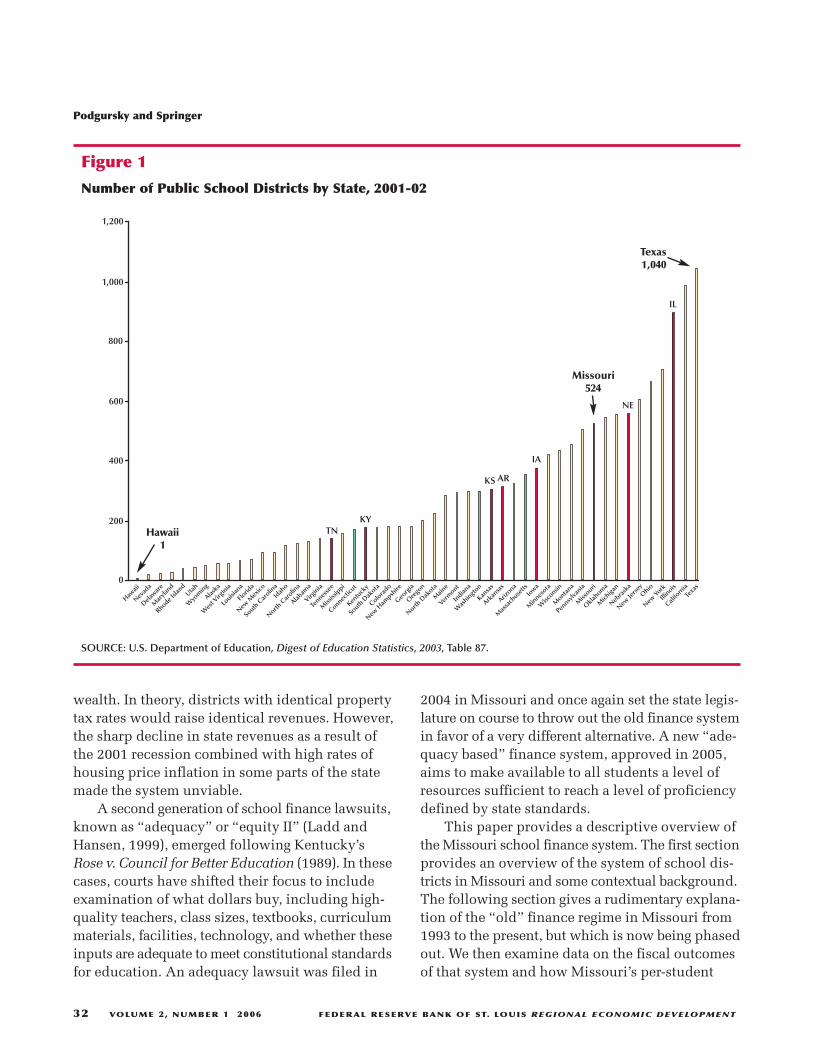
Figure 1
Number of Public School Districts by State, 2001-02
SOURCE: U.S. Department of Education, Digest of Education Statistics, 2003, Table 87.
spending compares with neighboring states. Wethen discuss the new regime, which attempts todetermine “adequate” spending levels based onstudent achievement. Our conclusion briefly sum-marizes our findings and suggests potential bumpsin the school finance road ahead.
INSTITUTIONAL BACKGROUNDBefore considering the distributional effects of
this regime, it is important to consider some insti-tutional features of the school finance landscape.First, relatively speaking, Missouri has many schooldistricts. Missouri has 522 regular school districts(75 K-8 and 447 K-12).1 Figure 1 shows that, amongthe states, there is a wide distribution in the numberof school districts in operation, ranging from 1statewide district in Hawaii to 1,040 in Texas.Missouri is at the high end of the range, and mostof the eight states exceeding Missouri have signifi-cantly larger populations. In many of our compari-sons, we will focus on surrounding Midwesternstates. Most of these states, like Missouri, have alarge number of school districts, many of whichare rural.
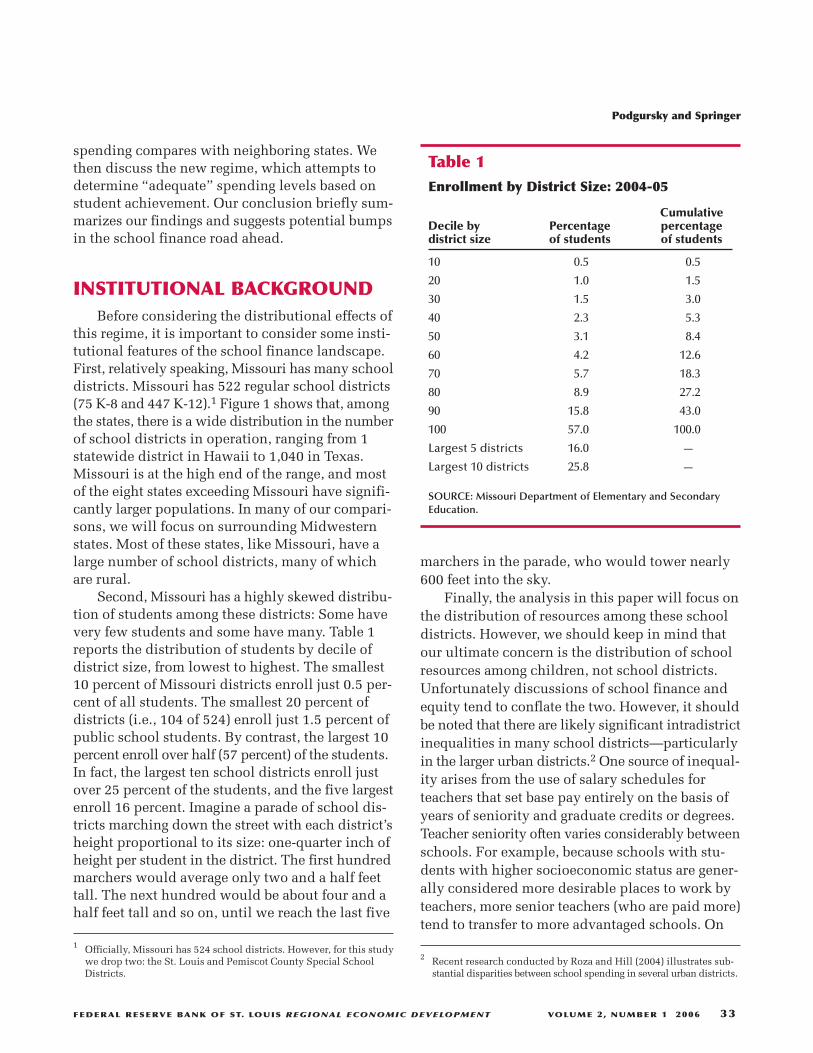
Second, Missouri has a highly skewed distribu-tion of students among these districts: Some havevery few students and some have many. Table 1reports the distribution of students by decile ofdistrict size, from lowest to highest. The smallest10 percent of Missouri districts enroll just 0.5 per-cent of all students. The smallest 20 percent ofdistricts (i.e., 104 of 524) enroll just 1.5 percent ofpublic school students. By contrast, the largest 10percent enroll over half (57 percent) of the students.In fact, the largest ten school districts enroll justover 25 percent of the students, and the five largestenroll 16 percent. Imagine a parade of school dis-tricts marching down the street with each district’sheight proportional to its size: one-quarter inch ofheight per student in the district. The first hundredmarchers would average only two and a half feettall. The next hundred would be about four and ahalf feet tall and so on, until we reach the last five
marchers in the parade, who would tower nearly600 feet into the sky.
Finally, the analysis in this paper will focus onthe distribution of resources among these schooldistricts. However, we should keep in mind thatour ultimate concern is the distribution of schoolresources among children, not school districts.Unfortunately discussions of school finance andequity tend to conflate the two. However, it shouldbe noted that there are likely significant intradistrictinequalities in many school districts—particularlyin the larger urban districts.2 One source of inequal-ity arises from the use of salary schedules forteachers that set base pay entirely on the basis ofyears of seniority and graduate credits or degrees.Teacher seniority often varies considerably betweenschools. For example, because schools with stu-dents with higher socioeconomic status are gener-ally considered more desirable places to work byteachers, more senior teachers (who are paid more)tend to transfer to more advantaged schools. On
Podgursky and Springer
FEDERAL RESERVE BANK OF ST. LOUIS REGIONAL ECONOMIC DEVELOPMENT VOLUME 2, NUMBER 1 2006 33
Table 1Enrollment by District Size: 2004-05
Cumulative Decile by Percentage percentage district size of students of students
10 0.5 0.5
20 1.0 1.5
30 1.5 3.0
40 2.3 5.3
50 3.1 8.4
60 4.2 12.6
70 5.7 18.3
80 8.9 27.2
90 15.8 43.0
100 57.0 100.0
Largest 5 districts 16.0 —
Largest 10 districts 25.8 —
SOURCE: Missouri Department of Elementary and SecondaryEducation.
1 Officially, Missouri has 524 school districts. However, for this studywe drop two: the St. Louis and Pemiscot County Special SchoolDistricts.
2 Recent research conducted by Roza and Hill (2004) illustrates sub-stantial disparities between school spending in several urban districts.
Podgursky and Springer
34 VOLUME 2, NUMBER 1 2006 FEDERAL RESERVE BANK OF ST. LOUIS REGIONAL ECONOMIC DEVELOPMENT
Teacher Salary/Student
$5,500
$5,000
$4,500
$4,000
$3,500
$3,000
$2,500
$2,00060 65 70 75 80 85 90 95 100
Free/Reduced Lunch %
A. St. Louis, MO
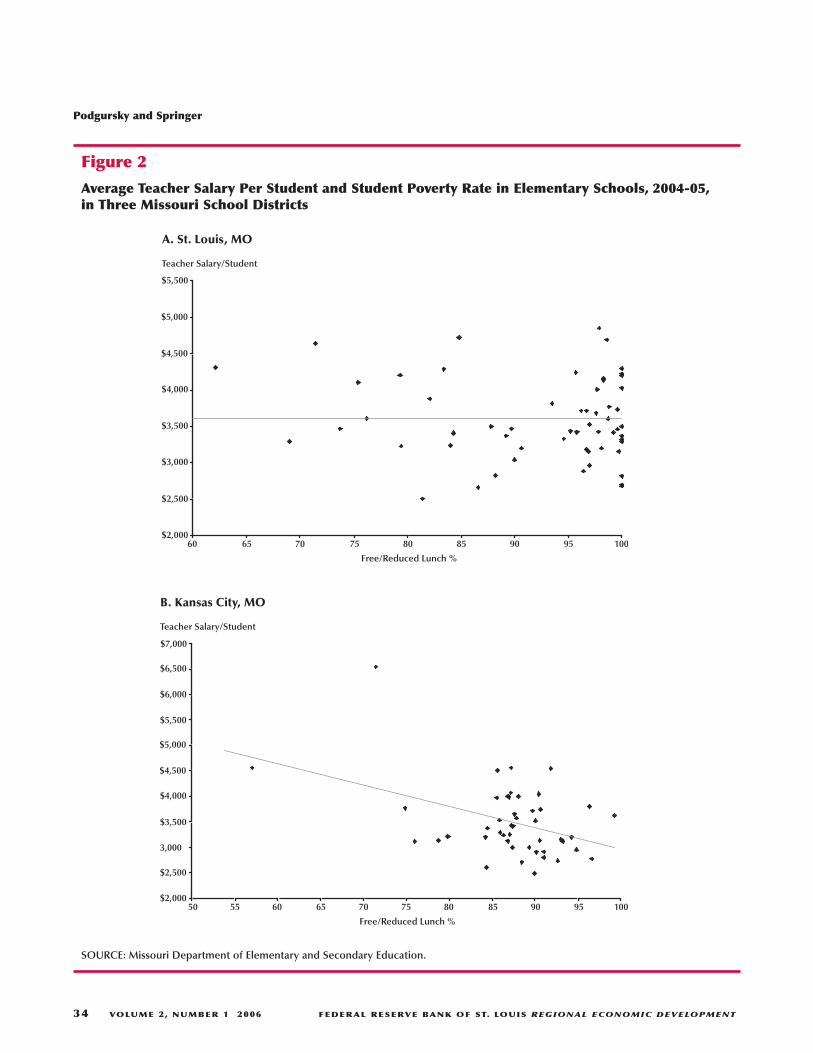
Figure 2
Average Teacher Salary Per Student and Student Poverty Rate in Elementary Schools, 2004-05,in Three Missouri School Districts
SOURCE: Missouri Department of Elementary and Secondary Education.
Teacher Salary/Student
$5,500
$5,000
$4,500
$4,000
$3,500
3,000
$2,500
$2,00060 65 70 75 80 85 90 95 100
Free/Reduced Lunch %
B. Kansas City, MO
$7,000
$6,500
$6,000
5550
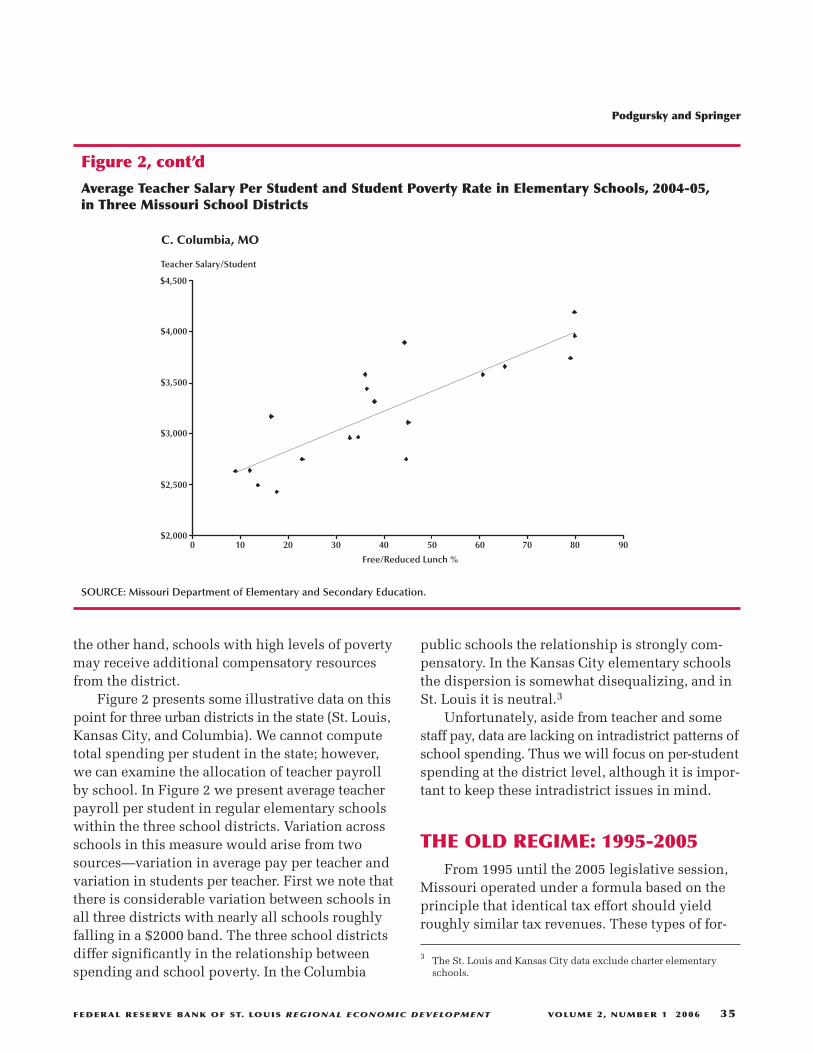
the other hand, schools with high levels of povertymay receive additional compensatory resourcesfrom the district.
Figure 2 presents some illustrative data on thispoint for three urban districts in the state (St. Louis,Kansas City, and Columbia). We cannot computetotal spending per student in the state; however,we can examine the allocation of teacher payrollby school. In Figure 2 we present average teacherpayroll per student in regular elementary schoolswithin the three school districts. Variation acrossschools in this measure would arise from twosources—variation in average pay per teacher andvariation in students per teacher. First we note thatthere is considerable variation between schools inall three districts with nearly all schools roughlyfalling in a $2000 band. The three school districtsdiffer significantly in the relationship betweenspending and school poverty. In the Columbia
public schools the relationship is strongly com-pensatory. In the Kansas City elementary schoolsthe dispersion is somewhat disequalizing, and inSt. Louis it is neutral.3
Unfortunately, aside from teacher and somestaff pay, data are lacking on intradistrict patterns ofschool spending. Thus we will focus on per-studentspending at the district level, although it is impor-tant to keep these intradistrict issues in mind.
THE OLD REGIME: 1995-2005From 1995 until the 2005 legislative session,
Missouri operated under a formula based on theprinciple that identical tax effort should yieldroughly similar tax revenues. These types of for-
Podgursky and Springer
FEDERAL RESERVE BANK OF ST. LOUIS REGIONAL ECONOMIC DEVELOPMENT VOLUME 2, NUMBER 1 2006 35
Teacher Salary/Student
$4,500
$4,000
$3,500
$3,000
$2,500
$2,0000 10 20 30 40 50 60 70 80
Free/Reduced Lunch %
C. Columbia, MO
90
Figure 2, cont’d
Average Teacher Salary Per Student and Student Poverty Rate in Elementary Schools, 2004-05,in Three Missouri School Districts
SOURCE: Missouri Department of Elementary and Secondary Education.
3 The St. Louis and Kansas City data exclude charter elementaryschools.
mulas are sometimes referred to as “power equal-ization” (Hoxby, 2004). This operational structureemerged after Missouri courts in Committee forEducational Equality v. State of Missouri (1993)found the prior system unconstitutional and pro-vided districts with a guaranteed tax base. In prin-ciple, districts exerting identical taxing effort intheir respective property tax rates would be guaran-teed equal resources, with state revenues acting tooffset disparities in district wealth. School districtswere provided foundation aid roughly as follows:
Foundation aid = (EP × T × GTB) – local tax revenues,
where EP is the number of eligible students, T is thelocal school tax rate levy, and GTB is the guaranteedtax base. Senate Bill 180, passed in 1995 in responseto school finance litigation, set the guaranteed taxbase by the district-assessed valuation of the schooldistrict at the 95th percentile of school districtwealth. In other words, the formula intended todecouple tax effort from district wealth. A poorschool district would be guaranteed as much taxrevenue as a rich school district with the same taxrate.4
Such a formula maintained local control of thesetting of property tax rates; however, it also encour-aged school districts with below-average levels ofdistrict wealth to raise their local tax rates.5 A dis-trict with half the local wealth per student of the95th percentile would get one dollar in state aidfor every dollar raised locally. A poor district withone-fifth the property wealth would get four dollarsfor every local dollar. Districts above the 95th per-centile of wealth per student would receive no statefoundation aid, but none of their local tax revenueswould be confiscated either. Unlike some otherstates, Missouri has no “Robin Hood” provisionsfor redistribution of local tax revenues (Hoxby andKuzienko, 2004).
No school finance system ever proves thissimple, however. We have omitted a variety ofdetails. The most important omission for our pur-poses was Senate Bill 180’s “hold harmless” pro-vision. To secure sufficient political support forpassage of Senate Bill 180, school districts thatwere going to lose state aid had their aid frozen at1992-93 levels. These districts, termed “hold harm-less,” were primarily wealthier school districts.Thus, the bill’s equalizing effect was somewhatmuted because of the existence, in any year, of 55or so “hold harmless” districts.
The foundation formula was not the only wayin which state aid was allocated to school districts.The state of Missouri also provided “categoricalaid”—aid that can be used only for specified pur-poses—to school districts. The largest categoricalaid programs in Missouri included the following:
• transportation
• special education and remedial reading
• career ladder program (i.e., bonus pay forteachers)
• vocational education
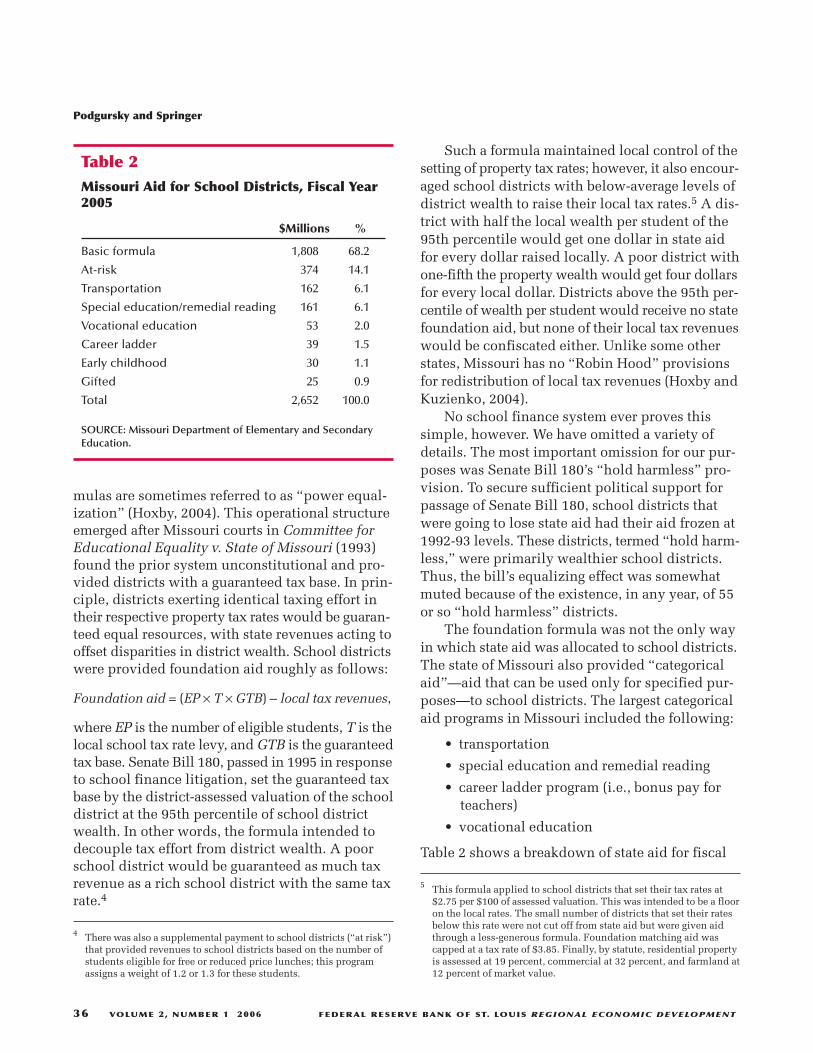
Table 2 shows a breakdown of state aid for fiscal
Podgursky and Springer
36 VOLUME 2, NUMBER 1 2006 FEDERAL RESERVE BANK OF ST. LOUIS REGIONAL ECONOMIC DEVELOPMENT
Table 2Missouri Aid for School Districts, Fiscal Year2005
$Millions %
Basic formula 1,808 68.2
At-risk 374 14.1
Transportation 162 6.1
Special education/remedial reading 161 6.1
Vocational education 53 2.0
Career ladder 39 1.5
Early childhood 30 1.1
Gifted 25 0.9
Total 2,652 100.0
SOURCE: Missouri Department of Elementary and SecondaryEducation.
4 There was also a supplemental payment to school districts (“at risk”)that provided revenues to school districts based on the number ofstudents eligible for free or reduced price lunches; this programassigns a weight of 1.2 or 1.3 for these students.
5 This formula applied to school districts that set their tax rates at$2.75 per $100 of assessed valuation. This was intended to be a flooron the local rates. The small number of districts that set their ratesbelow this rate were not cut off from state aid but were given aidthrough a less-generous formula. Foundation matching aid wascapped at a tax rate of $3.85. Finally, by statute, residential propertyis assessed at 19 percent, commercial at 32 percent, and farmland at12 percent of market value.
year 2005. The first two lines are the basic founda-tion formula. They show that roughly 82 percent ofstate aid to K-12 education was driven by the localtax formula and that 18 percent was distributedthrough categorical grants.
Finally, a substantial share of statewide aid ishidden in “local spending.” In 1982, voters passeda statewide sales tax of 1 percent (Proposition C),the proceeds of which were earmarked for elemen-tary and secondary education. However, these rev-enues were provided directly to school districtson a per-student basis and counted as local ratherthan state revenue. In theory, half of Proposition Crevenues were to be used to reduce property taxpayments. However, districts could waive some
or all of this “rollback” by a majority vote and 471school districts chose to do that. In fiscal year2005, the revenues from Proposition C allocatedto schools amounted to approximately $700 million,or roughly 25 percent of formal state revenuesprovided to schools.
PER-STUDENT EXPENDITURES INMISSOURI AND OTHER STATES
We begin by examining overall funding for K-12public education in Missouri. How does Missourispending compare to the national average? Unfor-tunately, there is a rather long lag in reporting ofstate education spending by the National Center
Podgursky and Springer
FEDERAL RESERVE BANK OF ST. LOUIS REGIONAL ECONOMIC DEVELOPMENT VOLUME 2, NUMBER 1 2006 37
Nevad
a
Delawar
e
Mar
yland
Rhode Isla
nd
Utah
Wyo
ming
Alaska
Wes
t Virg
inia
Louisi
ana
Florid
a
New M
exico
Idah
o
Alabam
a
Virginia
Tennes
see
Miss
issip
pi
Connectic
ut
Kentu
cky
South
Dak
ota
Colora
do
New H
ampsh
ire
Georg
ia
Ore
gon
North D
akota
Main
e
Verm
ont
Indian
a
Was
hington
Kansa
s
Arkan
sas
Arizona
Mas
sach
usetts
Iowa
Minnes
ota
Wisc
onsin
Monta
na
Pennsy
lvania
Miss
ouri
Okla
homa
Mich
igan
Nebra
ska
New Je
rsey
Ohio
New Yo
rk
Illinois
Califo
rnia
Texa
s
180
160
140
120
80
0
Hawaii
South
Car
olina
North C
arolin
a
60
40
20
Distric
t of C
olumbia
MIssouri90.2
rank = 31
KYAR TN
OK
KS IANE
IL
100
US = 100
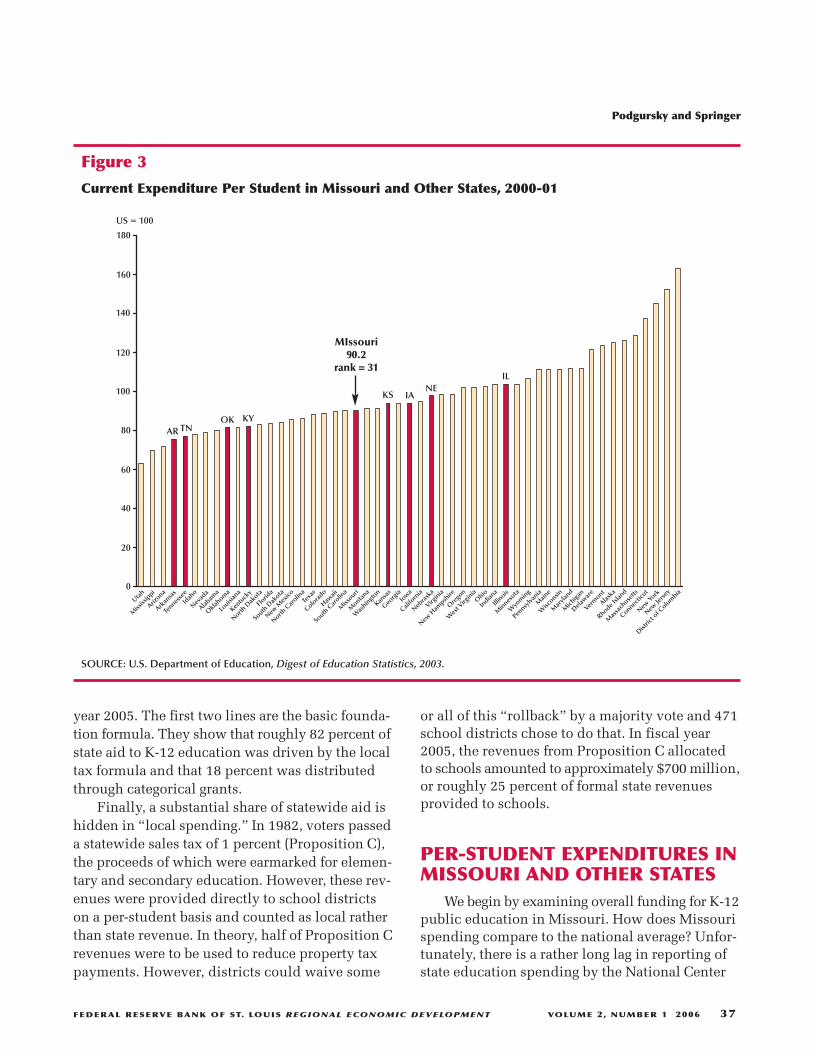
Figure 3
Current Expenditure Per Student in Missouri and Other States, 2000-01
SOURCE: U.S. Department of Education, Digest of Education Statistics, 2003.
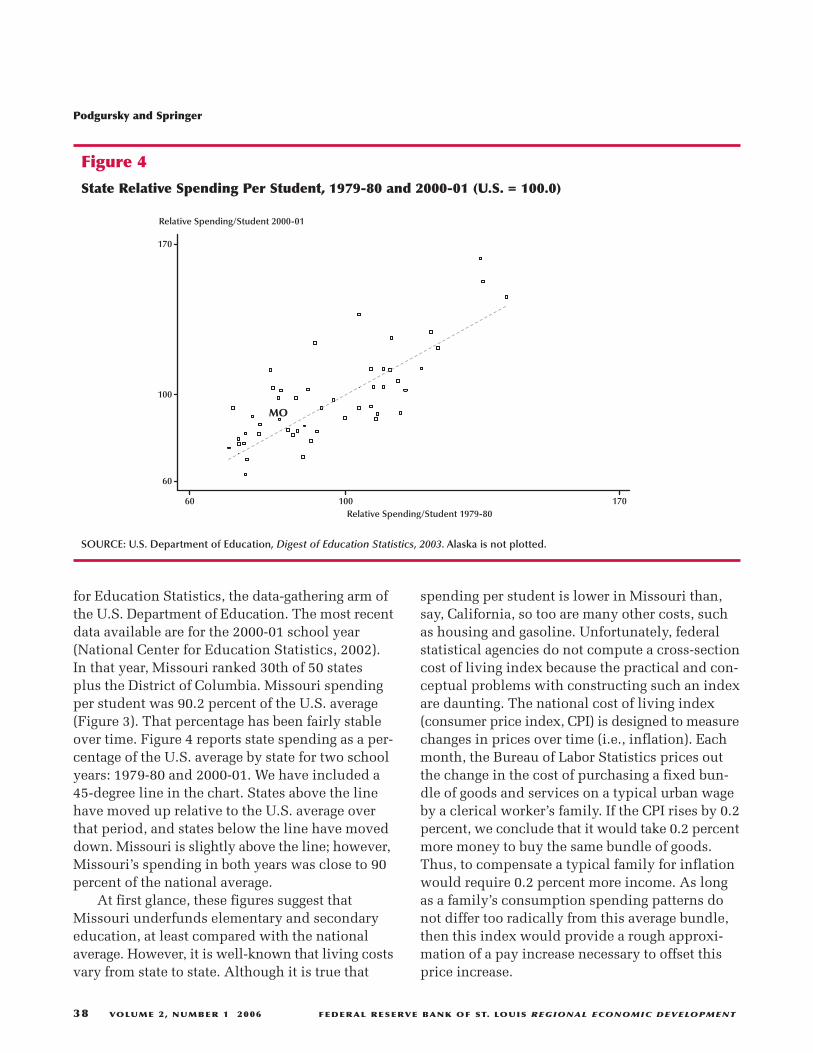
for Education Statistics, the data-gathering arm ofthe U.S. Department of Education. The most recentdata available are for the 2000-01 school year(National Center for Education Statistics, 2002).In that year, Missouri ranked 30th of 50 statesplus the District of Columbia. Missouri spendingper student was 90.2 percent of the U.S. average(Figure 3). That percentage has been fairly stableover time. Figure 4 reports state spending as a per-centage of the U.S. average by state for two schoolyears: 1979-80 and 2000-01. We have included a45-degree line in the chart. States above the linehave moved up relative to the U.S. average overthat period, and states below the line have moveddown. Missouri is slightly above the line; however,Missouri’s spending in both years was close to 90percent of the national average.
At first glance, these figures suggest thatMissouri underfunds elementary and secondaryeducation, at least compared with the nationalaverage. However, it is well-known that living costsvary from state to state. Although it is true that
spending per student is lower in Missouri than,say, California, so too are many other costs, suchas housing and gasoline. Unfortunately, federalstatistical agencies do not compute a cross-sectioncost of living index because the practical and con-ceptual problems with constructing such an indexare daunting. The national cost of living index(consumer price index, CPI) is designed to measurechanges in prices over time (i.e., inflation). Eachmonth, the Bureau of Labor Statistics prices outthe change in the cost of purchasing a fixed bun-dle of goods and services on a typical urban wageby a clerical worker’s family. If the CPI rises by 0.2percent, we conclude that it would take 0.2 percentmore money to buy the same bundle of goods.Thus, to compensate a typical family for inflationwould require 0.2 percent more income. As longas a family’s consumption spending patterns donot differ too radically from this average bundle,then this index would provide a rough approxi-mation of a pay increase necessary to offset thisprice increase.
Podgursky and Springer
38 VOLUME 2, NUMBER 1 2006 FEDERAL RESERVE BANK OF ST. LOUIS REGIONAL ECONOMIC DEVELOPMENT
170
100
60
60 100 170
MO
Relative Spending/Student 2000-01
Relative Spending/Student 1979-80
Figure 4
State Relative Spending Per Student, 1979-80 and 2000-01 (U.S. = 100.0)
SOURCE: U.S. Department of Education, Digest of Education Statistics, 2003. Alaska is not plotted.
A cross-section index is another matter alto-gether. It is meant to measure, for example, thedifferences in costs for a family in Worchester,Massachusetts, to maintain the same standard ofliving in St. Louis, Missouri. Simply stating theintent illustrates the conceptual problems of meas-urement. First of all, the bundles of good consumedby an average family may be very different in dif-ferent locales. Where housing is very expensive,people may live in smaller houses and spend theirmoney on a boat. Winter is much colder on averagein Worchester than in St. Louis; hence, a typicalWorchester household likely spends more on heat-ing oil. Of course, people who like the ocean and
snow are much more likely to live in Worchester.There is no easy way to account for these individualpreferences in a cross-section index.
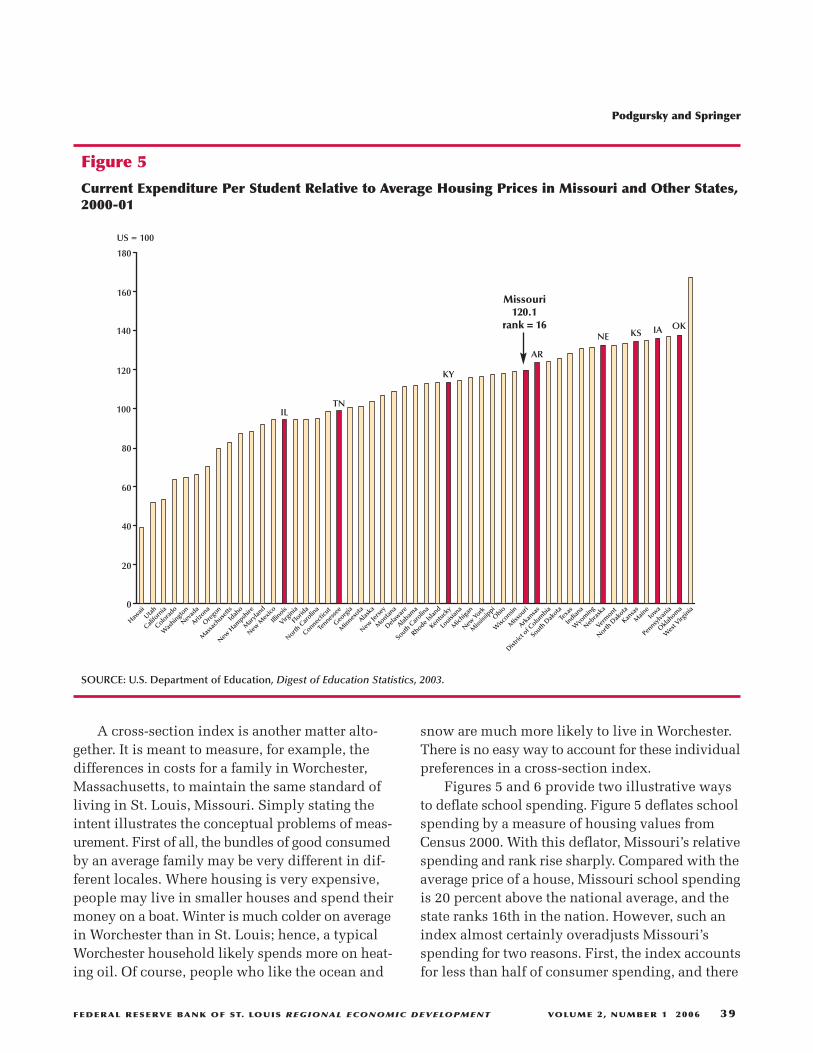
Figures 5 and 6 provide two illustrative waysto deflate school spending. Figure 5 deflates schoolspending by a measure of housing values fromCensus 2000. With this deflator, Missouri’s relativespending and rank rise sharply. Compared with theaverage price of a house, Missouri school spendingis 20 percent above the national average, and thestate ranks 16th in the nation. However, such anindex almost certainly overadjusts Missouri’sspending for two reasons. First, the index accountsfor less than half of consumer spending, and there
Podgursky and Springer
FEDERAL RESERVE BANK OF ST. LOUIS REGIONAL ECONOMIC DEVELOPMENT VOLUME 2, NUMBER 1 2006 39
Nevad
a
Delawar
e
Mar
yland
Rhode Isla
nd
Utah
Wyo
ming
Alaska
Wes
t Virg
inia
Louisi
ana
Florid
a
New M
exico
Idah
o
Alabam
a
Virginia
Tennes
see
Miss
issip
pi
Connectic
ut
Kentu
cky
South
Dak
ota
Colora
do
New H
ampsh
ire
Georg
ia
Ore
gon
North D
akota
Main
e
Verm
ont
Indian
a
Was
hington
Kansa
s
Arkan
sas
Arizona
Mas
sach
usetts
Iowa
Minnes
ota
Wisc
onsin
Monta
na
Pennsy
lvania
Miss
ouri
Okla
homa
Mich
igan
Nebra
ska
New Je
rsey
Ohio
New Yo
rk
Illinois
Califo
rnia
Texa
s
180
160
140
120
80
0
Hawaii
South
Car
olina
North C
arolin
a
60
40
20
Distric
t of C
olumbia
Missouri120.1
rank = 16
IL100 TN
KY
AR
NE KS IA OK
US = 100
Figure 5
Current Expenditure Per Student Relative to Average Housing Prices in Missouri and Other States,2000-01
SOURCE: U.S. Department of Education, Digest of Education Statistics, 2003.
is no reason to believe that the prices of other con-sumer goods and services follow those of housing.Second, housing prices reflect the value of amenitiessuch as sunshine, scenic views, etc. Houses costmore in California than in Iowa because most peo-ple prefer California weather and amenities (e.g.,beaches and mountains). If a scientific studyshowed that living next to cornfields doubled lifeexpectancy, then you could be sure that housingprices would skyrocket in Iowa and much ofMissouri.
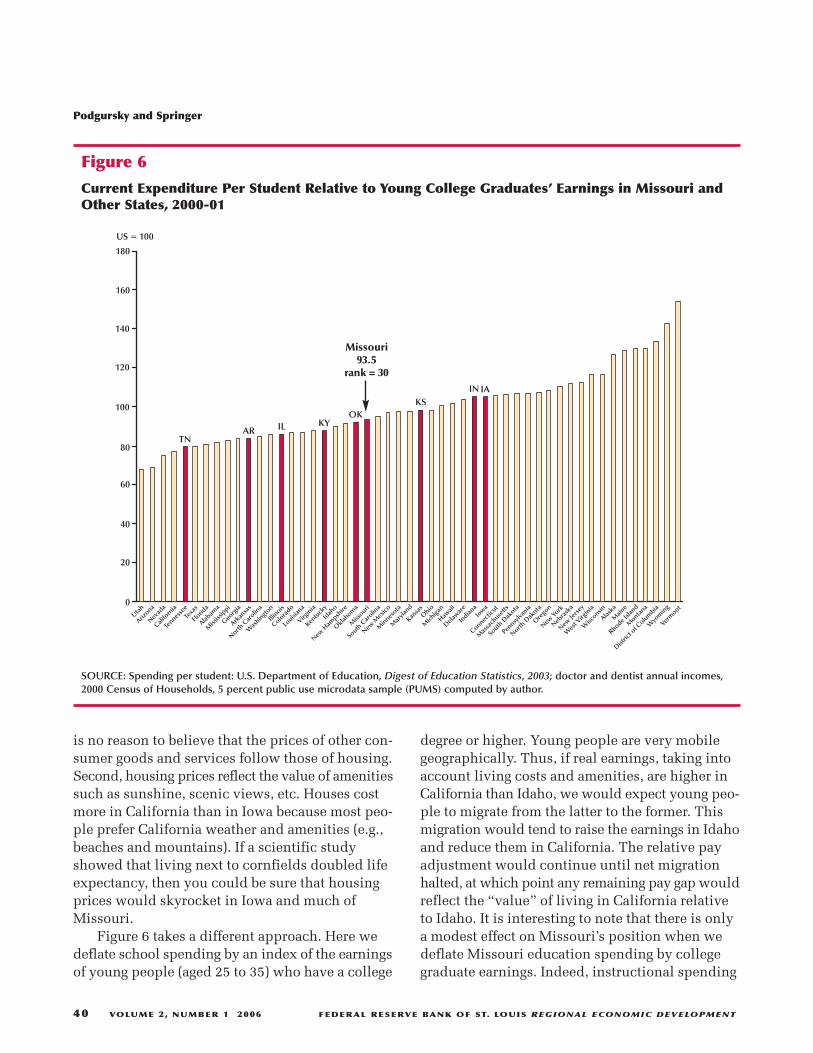
Figure 6 takes a different approach. Here wedeflate school spending by an index of the earningsof young people (aged 25 to 35) who have a college
degree or higher. Young people are very mobilegeographically. Thus, if real earnings, taking intoaccount living costs and amenities, are higher inCalifornia than Idaho, we would expect young peo-ple to migrate from the latter to the former. Thismigration would tend to raise the earnings in Idahoand reduce them in California. The relative payadjustment would continue until net migrationhalted, at which point any remaining pay gap wouldreflect the “value” of living in California relativeto Idaho. It is interesting to note that there is onlya modest effect on Missouri’s position when wedeflate Missouri education spending by collegegraduate earnings. Indeed, instructional spending
Podgursky and Springer
40 VOLUME 2, NUMBER 1 2006 FEDERAL RESERVE BANK OF ST. LOUIS REGIONAL ECONOMIC DEVELOPMENT
Nevad
a
Delawar
e
Mar
yland
Rhode Isla
nd
Utah
Wyo
ming
Alaska
Wes
t Virg
inia
Louisi
ana
Florid
a
New M
exico
Idah
o
Alabam
a
Virginia
Tennes
see
Miss
issip
pi
Connectic
ut
Kentu
cky
South
Dak
ota
Colora
do
New H
ampsh
ire
Georg
ia
Ore
gon
North D
akota
Main
e
Verm
ont
Indian
a
Was
hington
Kansa
s
Arkan
sas
Arizona
Mas
sach
usetts
Iowa
Minnes
ota
Wisc
onsin
Monta
na
Pennsy
lvania
Miss
ouri
Okla
homa
Mich
igan
Nebra
ska
New Je
rsey
Ohio
New Yo
rk
Illinois
Califo
rnia
Texa
s
180
160
140
120
80
0
Hawaii
South
Car
olina
North C
arolin
a
60
40
20
Distric
t of C
olumbia
Missouri93.5
rank = 30
IL
100
TN
KYAR
INKS
IA
OK
US = 100
Figure 6
Current Expenditure Per Student Relative to Young College Graduates’ Earnings in Missouri andOther States, 2000-01
SOURCE: Spending per student: U.S. Department of Education, Digest of Education Statistics, 2003; doctor and dentist annual incomes,2000 Census of Households, 5 percent public use microdata sample (PUMS) computed by author.
is 93 percent of the U.S. average, and Missouri’srank rises just one position, from 31st to 30th.
We conclude from this exercise that Missouri’s“real” spending for K-12 education may be some-what closer to the national average than Figure 2suggests, but it is probably not above the nationalrate.
VARIATION IN SCHOOL SPENDINGBETWEEN DISTRICTS
One concern in school finance is equity or“fairness.” However, there are different notions ofwhat constitutes fairness in school spending. Manyresearchers in the field distinguish “horizontal”and “vertical” equity (e.g., Berne and Stiefel, 1983).If real spending per student were identical for allstudents in the state, regardless of family back-
ground, location, or need, that would constituteperfect horizontal equity. Vertical equity, on theother hand, takes account of need and seeks toequalize educational opportunity or outcomesgiven gaps in family incomes. If more spendingper student is required to equalize educationalopportunity for children from poor families, thenthe ideal distribution of spending from this pointof view would not be equal but compensating.
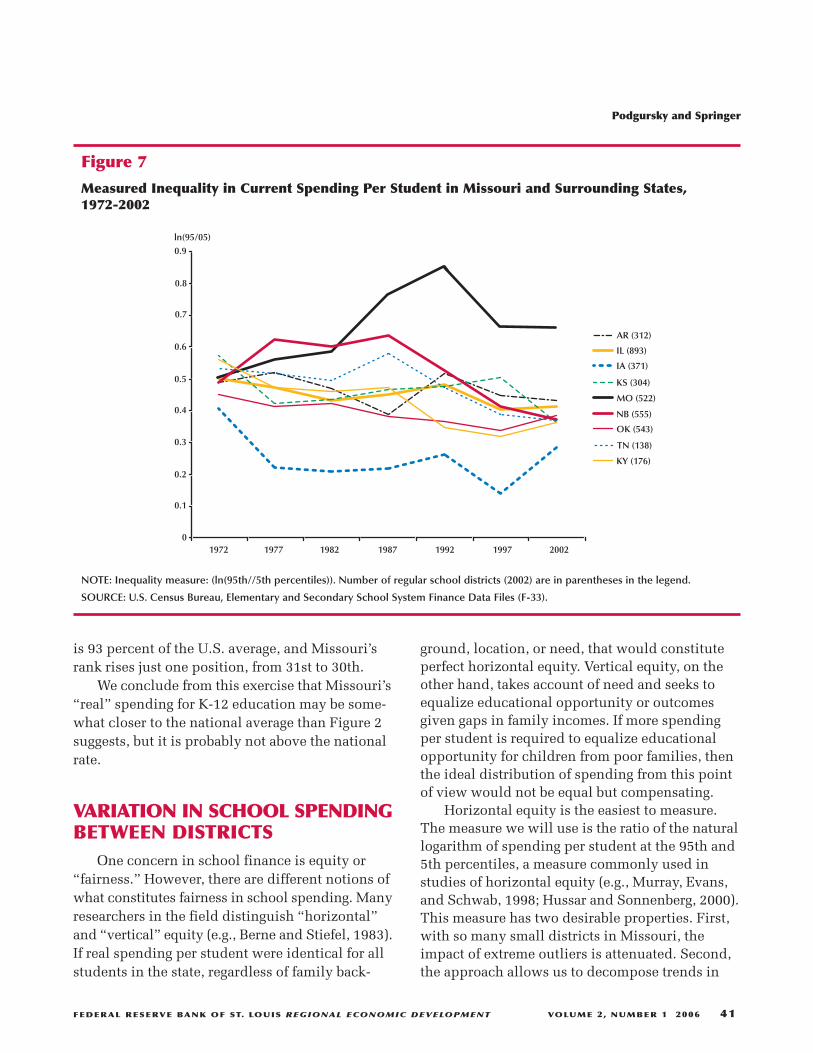
Horizontal equity is the easiest to measure.The measure we will use is the ratio of the naturallogarithm of spending per student at the 95th and5th percentiles, a measure commonly used instudies of horizontal equity (e.g., Murray, Evans,and Schwab, 1998; Hussar and Sonnenberg, 2000).This measure has two desirable properties. First,with so many small districts in Missouri, theimpact of extreme outliers is attenuated. Second,the approach allows us to decompose trends in
Podgursky and Springer
FEDERAL RESERVE BANK OF ST. LOUIS REGIONAL ECONOMIC DEVELOPMENT VOLUME 2, NUMBER 1 2006 41
AR (312)
IL (893)
IA (371)
KS (304)
MO (522)
NB (555)
OK (543)
TN (138)
KY (176)
0.9
0.8
0.7
0.6
0.5
0.4
0.3
0.2
0.1
01972 1977 1982 1987 1992 1997 2002
ln(95/05)
Figure 7
Measured Inequality in Current Spending Per Student in Missouri and Surrounding States,1972-2002
NOTE: Inequality measure: (ln(95th//5th percentiles)). Number of regular school districts (2002) are in parentheses in the legend.
SOURCE: U.S. Census Bureau, Elementary and Secondary School System Finance Data Files (F-33).
inequality above and below the median of the dis-tribution of spending.6
Figures 7 shows inequality trends in resourcedistribution from 1972-2002 for Missouri and sur-rounding states. During the 1972-92 period, Missouriclearly diverged from the trend in these states.While there was a general upward drift in inequalityin the surrounding states, the increase was muchmore pronounced in Missouri. The leveling effectof the 1995 School Improvement Act is also visible.Nonetheless, by the end of the period, spendinginequality was still significantly higher in Missouri.
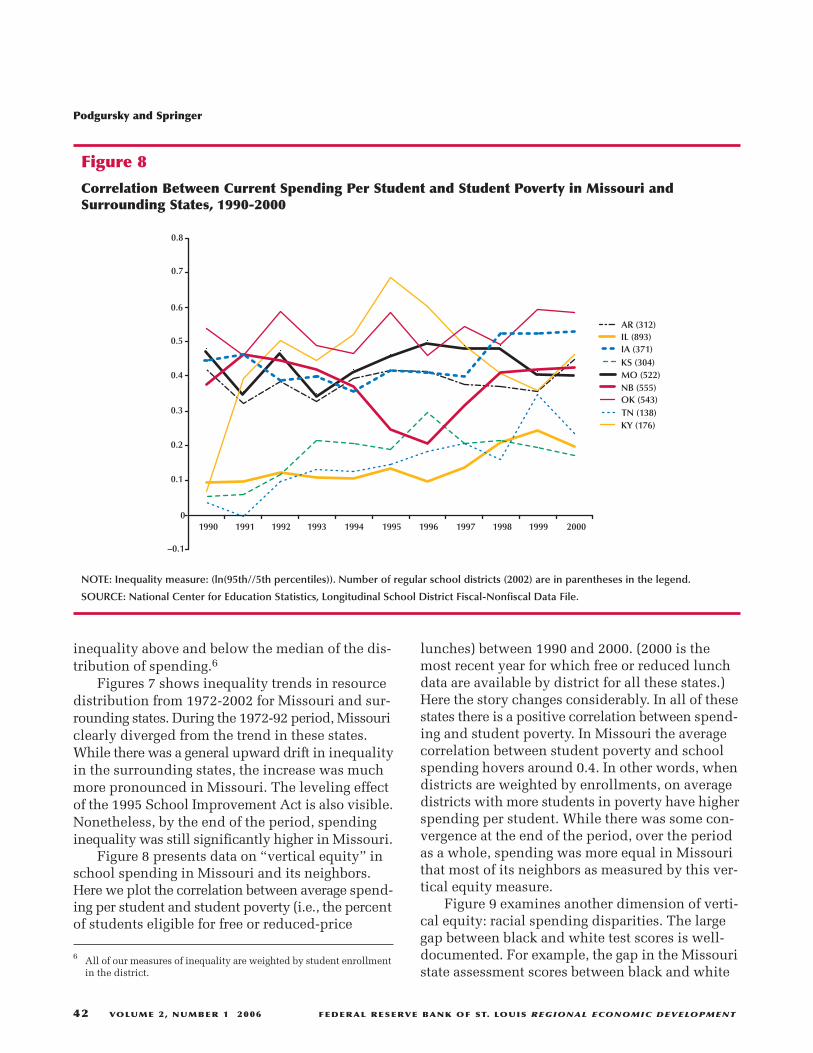
Figure 8 presents data on “vertical equity” inschool spending in Missouri and its neighbors.Here we plot the correlation between average spend-ing per student and student poverty (i.e., the percentof students eligible for free or reduced-price
lunches) between 1990 and 2000. (2000 is themost recent year for which free or reduced lunchdata are available by district for all these states.)Here the story changes considerably. In all of thesestates there is a positive correlation between spend-ing and student poverty. In Missouri the averagecorrelation between student poverty and schoolspending hovers around 0.4. In other words, whendistricts are weighted by enrollments, on averagedistricts with more students in poverty have higherspending per student. While there was some con-vergence at the end of the period, over the periodas a whole, spending was more equal in Missourithat most of its neighbors as measured by this ver-tical equity measure.
Figure 9 examines another dimension of verti-cal equity: racial spending disparities. The largegap between black and white test scores is well-documented. For example, the gap in the Missouristate assessment scores between black and white
Podgursky and Springer
42 VOLUME 2, NUMBER 1 2006 FEDERAL RESERVE BANK OF ST. LOUIS REGIONAL ECONOMIC DEVELOPMENT
AR (312)IL (893)IA (371)KS (304)MO (522)NB (555)OK (543)TN (138)KY (176)
0.8
0.7
0.6
0.5
0.4
0.3
0.2
0.1
01990 1991 1992 1993 1994 1995 1996
–0.1
1997 1998 1999 2000
Figure 8
Correlation Between Current Spending Per Student and Student Poverty in Missouri andSurrounding States, 1990-2000
NOTE: Inequality measure: (ln(95th//5th percentiles)). Number of regular school districts (2002) are in parentheses in the legend.
SOURCE: National Center for Education Statistics, Longitudinal School District Fiscal-Nonfiscal Data File.
6 All of our measures of inequality are weighted by student enrollmentin the district.
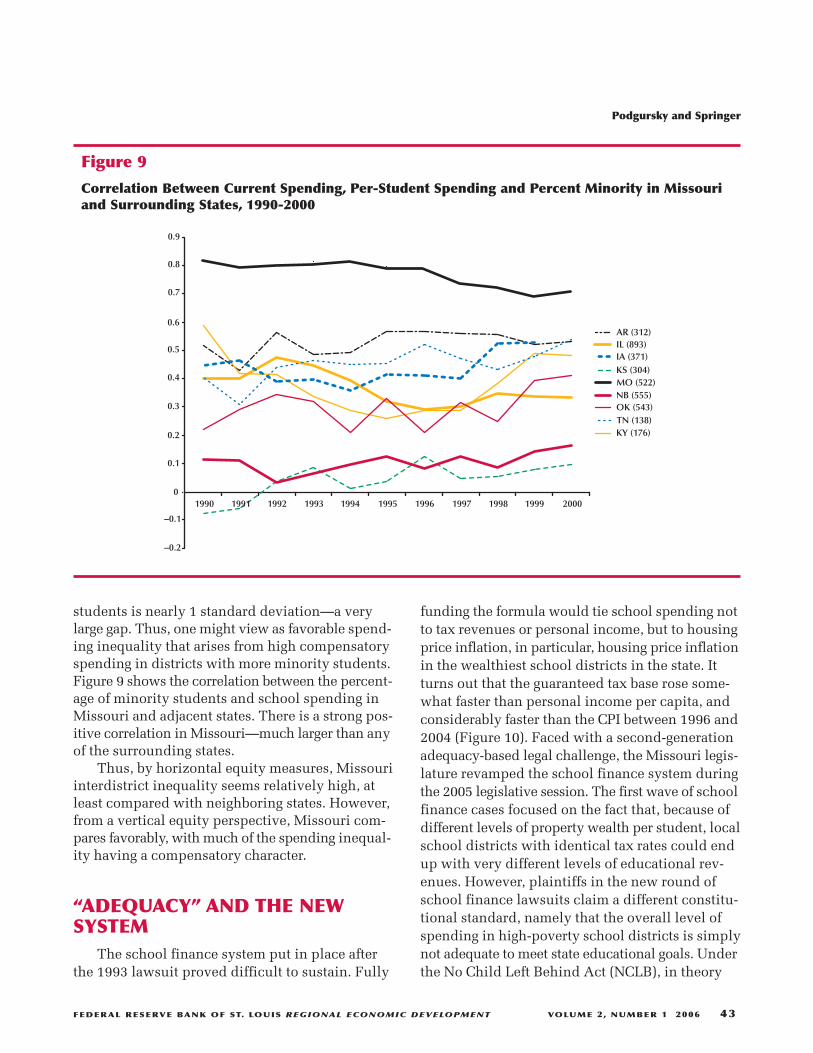
students is nearly 1 standard deviation—a verylarge gap. Thus, one might view as favorable spend-ing inequality that arises from high compensatoryspending in districts with more minority students.Figure 9 shows the correlation between the percent-age of minority students and school spending inMissouri and adjacent states. There is a strong pos-itive correlation in Missouri—much larger than anyof the surrounding states.
Thus, by horizontal equity measures, Missouriinterdistrict inequality seems relatively high, atleast compared with neighboring states. However,from a vertical equity perspective, Missouri com-pares favorably, with much of the spending inequal-ity having a compensatory character.
“ADEQUACY” AND THE NEW SYSTEM
The school finance system put in place afterthe 1993 lawsuit proved difficult to sustain. Fully
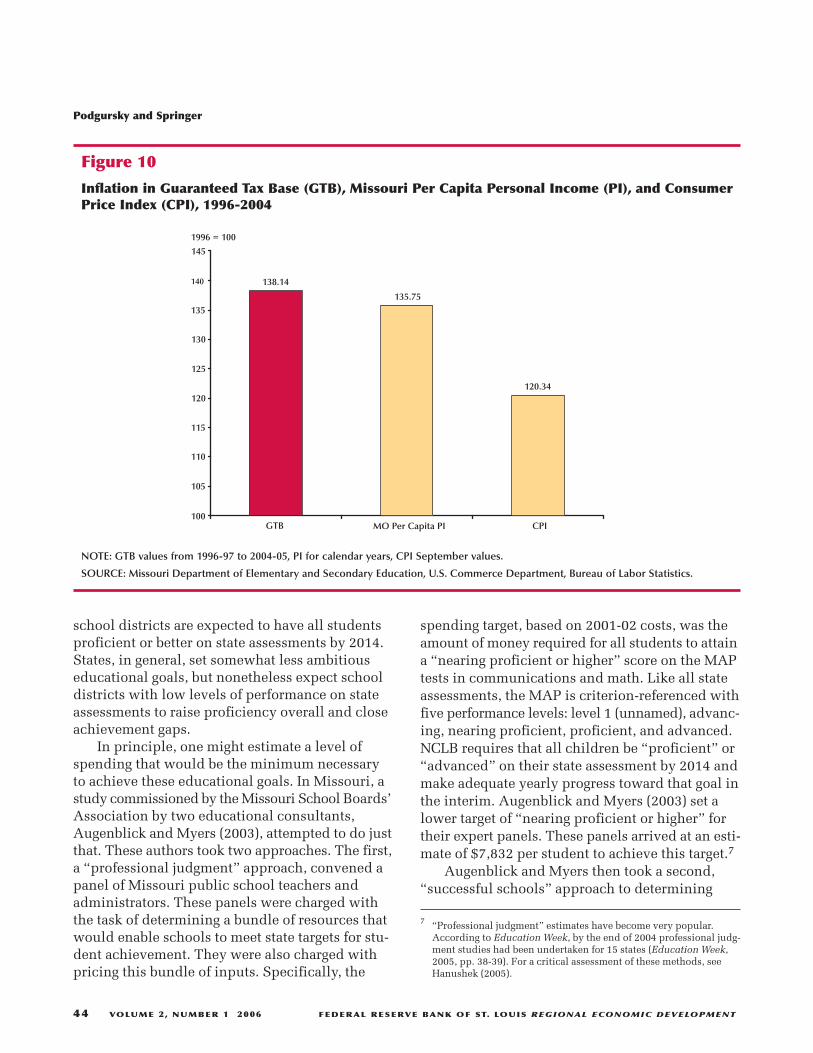
funding the formula would tie school spending notto tax revenues or personal income, but to housingprice inflation, in particular, housing price inflationin the wealthiest school districts in the state. Itturns out that the guaranteed tax base rose some-what faster than personal income per capita, andconsiderably faster than the CPI between 1996 and2004 (Figure 10). Faced with a second-generationadequacy-based legal challenge, the Missouri legis-lature revamped the school finance system duringthe 2005 legislative session. The first wave of schoolfinance cases focused on the fact that, because ofdifferent levels of property wealth per student, localschool districts with identical tax rates could endup with very different levels of educational rev-enues. However, plaintiffs in the new round ofschool finance lawsuits claim a different constitu-tional standard, namely that the overall level ofspending in high-poverty school districts is simplynot adequate to meet state educational goals. Underthe No Child Left Behind Act (NCLB), in theory
Podgursky and Springer
FEDERAL RESERVE BANK OF ST. LOUIS REGIONAL ECONOMIC DEVELOPMENT VOLUME 2, NUMBER 1 2006 43
AR (312)IL (893)IA (371)KS (304)MO (522)NB (555)OK (543)TN (138)KY (176)
0.8
0.7
0.6
0.5
0.4
0.3
0.2
0.1
01990 1991 1992 1993 1994 1995 1996
–0.1
1997 1998 1999 2000
0.9
–0.2
Figure 9
Correlation Between Current Spending, Per-Student Spending and Percent Minority in Missouriand Surrounding States, 1990-2000
school districts are expected to have all studentsproficient or better on state assessments by 2014.States, in general, set somewhat less ambitiouseducational goals, but nonetheless expect schooldistricts with low levels of performance on stateassessments to raise proficiency overall and closeachievement gaps.
In principle, one might estimate a level ofspending that would be the minimum necessaryto achieve these educational goals. In Missouri, astudy commissioned by the Missouri School Boards’Association by two educational consultants,Augenblick and Myers (2003), attempted to do justthat. These authors took two approaches. The first,a “professional judgment” approach, convened apanel of Missouri public school teachers andadministrators. These panels were charged withthe task of determining a bundle of resources thatwould enable schools to meet state targets for stu-dent achievement. They were also charged withpricing this bundle of inputs. Specifically, the
spending target, based on 2001-02 costs, was theamount of money required for all students to attaina “nearing proficient or higher” score on the MAPtests in communications and math. Like all stateassessments, the MAP is criterion-referenced withfive performance levels: level 1 (unnamed), advanc-ing, nearing proficient, proficient, and advanced.NCLB requires that all children be “proficient” or“advanced” on their state assessment by 2014 andmake adequate yearly progress toward that goal inthe interim. Augenblick and Myers (2003) set alower target of “nearing proficient or higher” fortheir expert panels. These panels arrived at an esti-mate of $7,832 per student to achieve this target.7
Augenblick and Myers then took a second,“successful schools” approach to determining
7 “Professional judgment” estimates have become very popular.According to Education Week, by the end of 2004 professional judg-ment studies had been undertaken for 15 states (Education Week,2005, pp. 38-39). For a critical assessment of these methods, seeHanushek (2005).
Podgursky and Springer
44 VOLUME 2, NUMBER 1 2006 FEDERAL RESERVE BANK OF ST. LOUIS REGIONAL ECONOMIC DEVELOPMENT
145
140
135
130
125
120
115
110
105
100 GTB MO Per Capita PI CPI
138.14
135.75
120.34
1996 = 100
Figure 10
Inflation in Guaranteed Tax Base (GTB), Missouri Per Capita Personal Income (PI), and ConsumerPrice Index (CPI), 1996-2004
NOTE: GTB values from 1996-97 to 2004-05, PI for calendar years, CPI September values.
SOURCE: Missouri Department of Elementary and Secondary Education, U.S. Commerce Department, Bureau of Labor Statistics.
adequacy. Each year the Missouri Department ofElementary and Secondary Education scores everyschool district in the state on the basis of MAP per-formance and related academic variables such as thepercentage of students taking the ACT. Augenblickand Myers computed the average spending of 102school districts that had perfect or nearly perfectscores on this report card ($5,664). This was theirsecond measure of adequacy.8 Obviously, these arevery different numbers. Augenblick and Myers triedto reconcile the disparity by arguing that, becauseonly 61 percent of students in the successful schoolsmet the “nearing proficient and above” standardand the expert panel target was based on 100 per-cent proficiency, 61 percent of $7,832 is close to$5,664.9
Although the state legislature did not adoptAugenblick and Myers’s estimates wholesale, theydid adopt the principle of an “adequacy” targetbased on a “successful schools” perspective. Recallthat under the old finance regime what becameequalized was revenue for identical tax effort. Thisformula embodied a concept of fairness that said,in effect, if district X set the same property tax rateas district Y, then both should collect the same taxrevenues. By tying state aid to local fiscal effort,poorer school districts leveraged local tax dollarswith matching state aid. The “adequacy” conceptemploys a very different approach, claiming thereis a minimum adequate level of spending and thatit is the responsibility of the state government tomake certain the level of spending per student meetsthat target regardless of local tax effort. Low-incomedistricts that tax themselves at a high rate willretain those dollars and will not lose equivalent
amounts of state aid. However, those local dollarswill no longer be leveraged.
In 2005, the legislature determined that theminimum adequate level of spending was $6,117dollars per student. The legislature arrived at thisfigure by calculating the average operating spendingper student for the 113 districts with perfect ornearly perfect scores on the annual performancereport (APR) conducted by the Department ofElementary and Secondary Education; these scoresare heavily weighted toward performance on theMAP assessment. This figure will be recomputedevery two years. In theory, the figure could go down;however Senate Bill 287 specifies that the old levelwill stay in effect should that occur.
Simplified greatly, the new formula worksroughly as follows:
Foundation aid = (weighted ADA × $6,117) – ($3.43 × Local Tax Base).
There are no penalties in this formula for local taxeffort. Districts keep every dollar of tax revenueraised locally. However, there will no longer be aleverage effect for low-wealth districts. Each districtwill get a dollar of educational spending for everydollar raised locally. In other words, the “tax price”of additional local spending will be 100 percent(Hoxby, 2001).
Several other changes were made as well.Because the new system was predicated on the con-cept of an adequate level of resources, a questionof cost-of-living arose. As of 2004, nine states usedintrastate cost-of-living adjustments in their stateaid formula (Education Week, 2005). Until now,Missouri had not. Clearly, cost-of-living adjustmentswill tend to reduce payments to rural districts,while raising payments to urban and suburbandistricts. The new system phases in a cost-of-livingadjustment based on average earnings in the countyor the metropolitan area. The new system alsoadjusts student counts for poverty and limitedEnglish proficiency populations if they exceedcertain thresholds. Some categorical aid is also nowfolded into the basic aid. Finally, the new fundingmechanism will be phased in over seven years. Inthe first year, only 15 percent of district aid is deter-mined by the new formula. This figure rises in astepwise fashion to 100 percent by the 2012-13school year.
8 By construction, many of the “successful schools” will have spendingthat is less than adequate. In fact, 69 of 102 successful school districtsspent less than $5,664 per student. Note that Augenblick and Myersestimate costs to educate a regular student (i.e., one who is not poorand does not have limited proficiency in English). Poor studentsand English-language learners are assumed to cost more.
9 This argument assumes that there is a proportionate relationshipbetween spending and student achievement, i.e. that if district Aspends twice as much as district B, then twice as many students willbe nearing proficient or above. They present no evidence in supportof this assumption. In fact, actual test data in spring 2002, the testdata used by the consultants, cast some doubt on the “professionaljudgment” estimate. In spring 2002 only 12 K-12 school districts had100 percent of their students “nearing proficient” or above on themath and communications arts assessments at all grade levels andall 12 of these districts spent less than $7,832 per student.
Podgursky and Springer
FEDERAL RESERVE BANK OF ST. LOUIS REGIONAL ECONOMIC DEVELOPMENT VOLUME 2, NUMBER 1 2006 45
Whether or not the new formula passes musterwith the courts, the entire concept of determining“adequate” levels of finance with reference to stu-dent achievement levels is problematic. We havealready seen that the determination of adequacyin the Augenblick and Myers study was at variancewith the MAP data used in the same year. Moregenerally, it is very difficult to establish a reliablerelationship between any level of spending andstudent achievement. A basic thesis put forth by“adequacy” proponents is that research can estab-lish a reliable causal relationship between spend-ing and student achievement. On the basis of thatrelationship, we can then choose a level of studentachievement (e.g., all students “nearing proficientor better”) and measure the minimum level ofspending necessary to reach that achievement target.The new school finance formula is built on a similarconcept. The adequacy target is the average levelof spending for school districts that earn perfect
scores on their annual performance report. Thistarget is to be updated every two years. However,average test scores exhibit considerable variationfrom year to year. Thus, the list of districts withperfect scores is likely to vary from year to year andis surely going to get smaller as the performancebar rises under NCLB.10
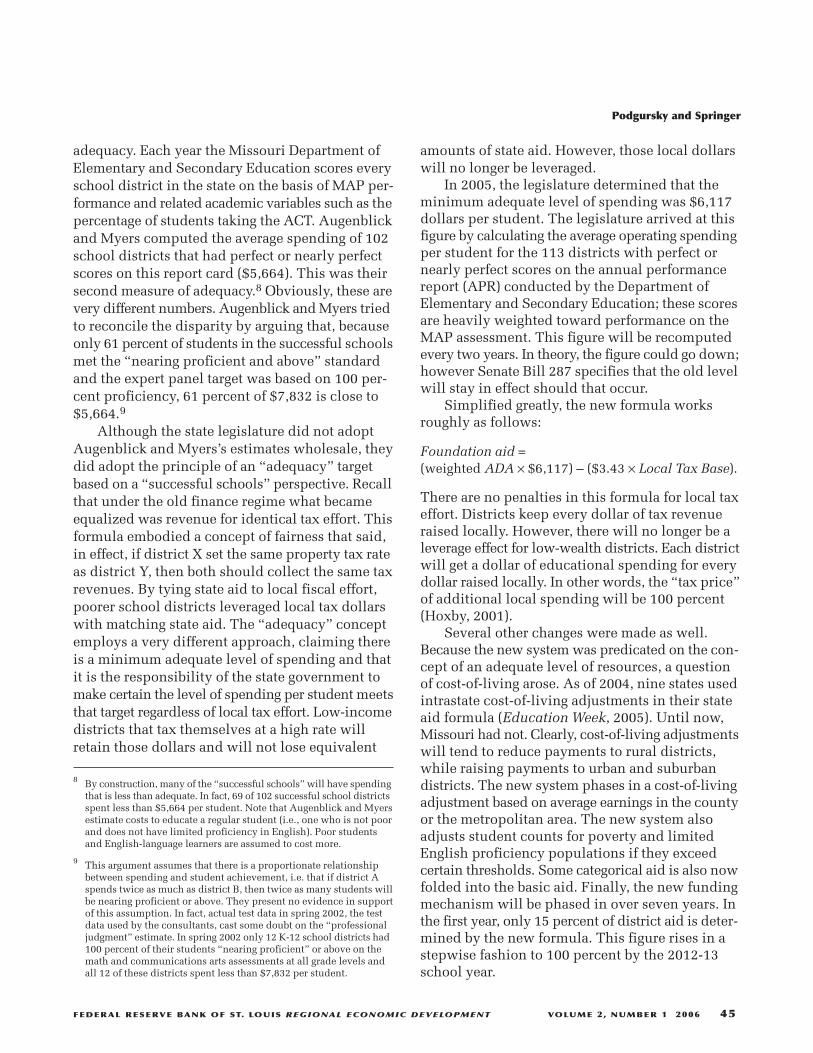
In fact, the research literature cannot reliablyidentify a causal relationship between spendingon any type of resource and student achievement.Surveys of this literature routinely note the diffi-culties of identifying causal links between schoolresources and student achievement gains (e.g.,Hanushek, 2003). Figures 11 through 14 illustratethe problem with Missouri data. In Figure 11 weplot 2004-05 spending in the 113 “distinction”districts (as designated by the Missouri Department
10 The Missouri School Improvement Program system for scoringschool districts’ annual performance report is due for major revisionin 2006.
Podgursky and Springer
46 VOLUME 2, NUMBER 1 2006 FEDERAL RESERVE BANK OF ST. LOUIS REGIONAL ECONOMIC DEVELOPMENT
.0004
.0002
0
5,000 10,000 15,000
Distinction Districts
Other
Current Expenditure Per Student, 2004 $
Figure 11
Distribution of Current Spending Per Student in “Distinction” and Other Missouri Public SchoolDistricts, 2004
SOURCE: Missouri Department of Elementary and Secondary Education.
Podgursky and Springer
FEDERAL RESERVE BANK OF ST. LOUIS REGIONAL ECONOMIC DEVELOPMENT VOLUME 2, NUMBER 1 2006 47
50
0
–50
50
0
–50
100
–2,000 2,000 4,000 6,000 2,000 4,000 6,0000 0
Communication Arts, Grade 3 Math, Grade 4
Change in Spending 1999-2004 ($) Change in Spending 1998-2004 ($)
Figure 12
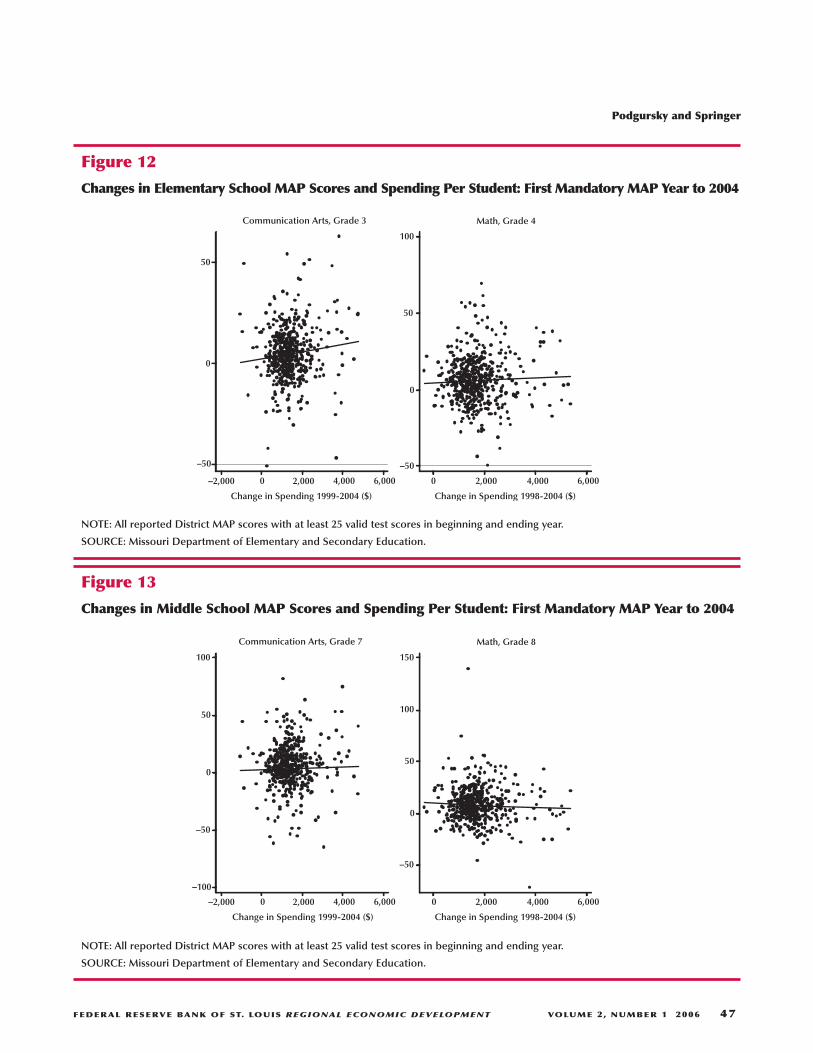
Changes in Elementary School MAP Scores and Spending Per Student: First Mandatory MAP Year to 2004
NOTE: All reported District MAP scores with at least 25 valid test scores in beginning and ending year.
SOURCE: Missouri Department of Elementary and Secondary Education.
–100
–50
0
50
100
–50
0
50
100
150
–2,000 2,000 4,000 6,000 2,000 4,000 6,0000 0
Communication Arts, Grade 7 Math, Grade 8
Change in Spending 1999-2004 ($) Change in Spending 1998-2004 ($)
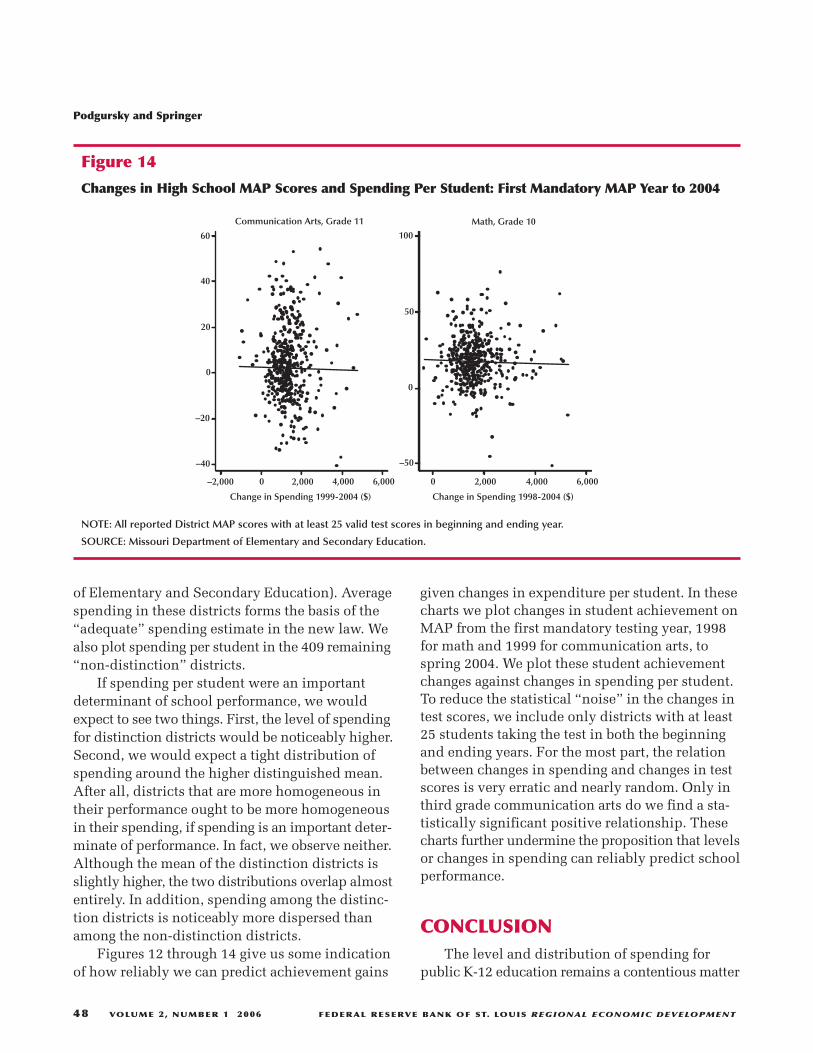
Figure 13
Changes in Middle School MAP Scores and Spending Per Student: First Mandatory MAP Year to 2004
NOTE: All reported District MAP scores with at least 25 valid test scores in beginning and ending year.
SOURCE: Missouri Department of Elementary and Secondary Education.
of Elementary and Secondary Education). Averagespending in these districts forms the basis of the“adequate” spending estimate in the new law. Wealso plot spending per student in the 409 remaining“non-distinction” districts.
If spending per student were an importantdeterminant of school performance, we wouldexpect to see two things. First, the level of spendingfor distinction districts would be noticeably higher.Second, we would expect a tight distribution ofspending around the higher distinguished mean.After all, districts that are more homogeneous intheir performance ought to be more homogeneousin their spending, if spending is an important deter-minate of performance. In fact, we observe neither.Although the mean of the distinction districts isslightly higher, the two distributions overlap almostentirely. In addition, spending among the distinc-tion districts is noticeably more dispersed thanamong the non-distinction districts.
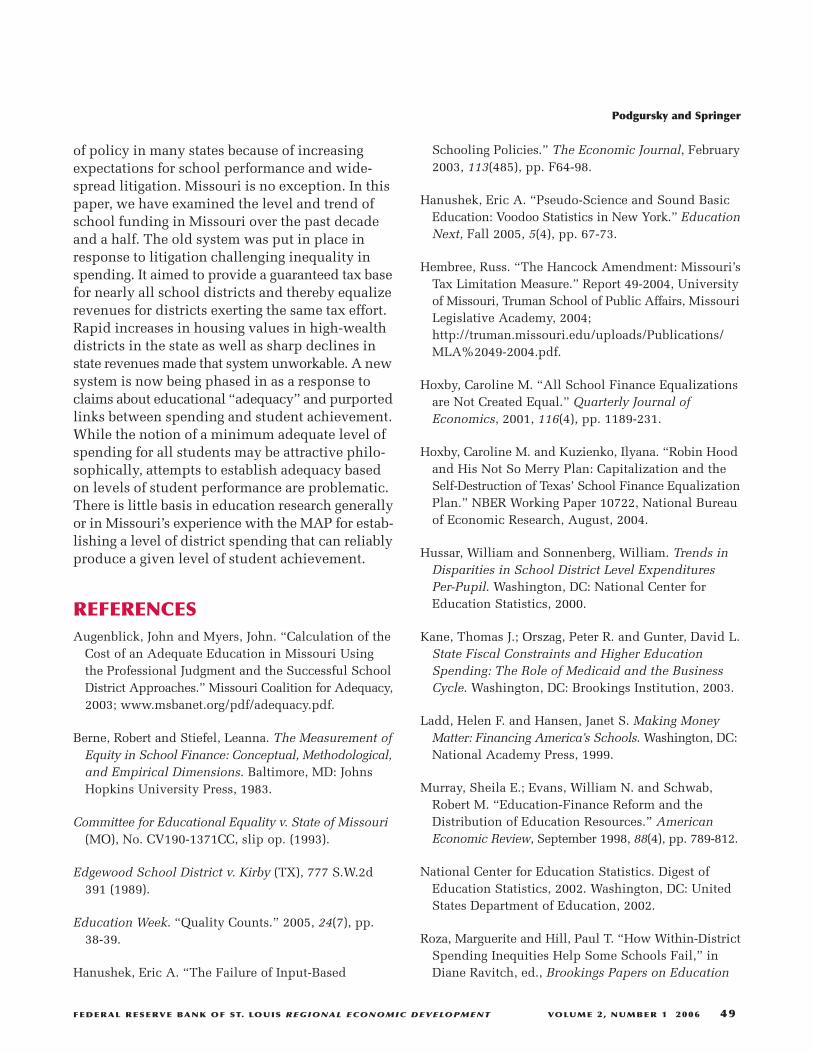
Figures 12 through 14 give us some indicationof how reliably we can predict achievement gains
given changes in expenditure per student. In thesecharts we plot changes in student achievement onMAP from the first mandatory testing year, 1998for math and 1999 for communication arts, tospring 2004. We plot these student achievementchanges against changes in spending per student.To reduce the statistical “noise” in the changes intest scores, we include only districts with at least25 students taking the test in both the beginningand ending years. For the most part, the relationbetween changes in spending and changes in testscores is very erratic and nearly random. Only inthird grade communication arts do we find a sta-tistically significant positive relationship. Thesecharts further undermine the proposition that levelsor changes in spending can reliably predict schoolperformance.
CONCLUSIONThe level and distribution of spending for
public K-12 education remains a contentious matter
Podgursky and Springer
48 VOLUME 2, NUMBER 1 2006 FEDERAL RESERVE BANK OF ST. LOUIS REGIONAL ECONOMIC DEVELOPMENT
–40
–20
0
20
40
–50
0
50
10060
–2,000 2,000 4,000 6,000 2,000 4,000 6,0000 0
Communication Arts, Grade 11 Math, Grade 10
Change in Spending 1999-2004 ($) Change in Spending 1998-2004 ($)
Figure 14
Changes in High School MAP Scores and Spending Per Student: First Mandatory MAP Year to 2004
NOTE: All reported District MAP scores with at least 25 valid test scores in beginning and ending year.
SOURCE: Missouri Department of Elementary and Secondary Education.
of policy in many states because of increasingexpectations for school performance and wide-spread litigation. Missouri is no exception. In thispaper, we have examined the level and trend ofschool funding in Missouri over the past decadeand a half. The old system was put in place inresponse to litigation challenging inequality inspending. It aimed to provide a guaranteed tax basefor nearly all school districts and thereby equalizerevenues for districts exerting the same tax effort.Rapid increases in housing values in high-wealthdistricts in the state as well as sharp declines instate revenues made that system unworkable. A newsystem is now being phased in as a response toclaims about educational “adequacy” and purportedlinks between spending and student achievement.While the notion of a minimum adequate level ofspending for all students may be attractive philo-sophically, attempts to establish adequacy basedon levels of student performance are problematic.There is little basis in education research generallyor in Missouri’s experience with the MAP for estab-lishing a level of district spending that can reliablyproduce a given level of student achievement.
REFERENCESAugenblick, John and Myers, John. “Calculation of the
Cost of an Adequate Education in Missouri Usingthe Professional Judgment and the Successful SchoolDistrict Approaches.” Missouri Coalition for Adequacy,2003; www.msbanet.org/pdf/adequacy.pdf.
Berne, Robert and Stiefel, Leanna. The Measurement ofEquity in School Finance: Conceptual, Methodological,and Empirical Dimensions. Baltimore, MD: JohnsHopkins University Press, 1983.
Committee for Educational Equality v. State of Missouri(MO), No. CV190-1371CC, slip op. (1993).
Edgewood School District v. Kirby (TX), 777 S.W.2d391 (1989).
Education Week. “Quality Counts.” 2005, 24(7), pp.38-39.
Hanushek, Eric A. “The Failure of Input-Based
Schooling Policies.” The Economic Journal, February2003, 113(485), pp. F64-98.
Hanushek, Eric A. “Pseudo-Science and Sound BasicEducation: Voodoo Statistics in New York.” EducationNext, Fall 2005, 5(4), pp. 67-73.
Hembree, Russ. “The Hancock Amendment: Missouri’sTax Limitation Measure.” Report 49-2004, Universityof Missouri, Truman School of Public Affairs, MissouriLegislative Academy, 2004;http://truman.missouri.edu/uploads/Publications/MLA%2049-2004.pdf.
Hoxby, Caroline M. “All School Finance Equalizationsare Not Created Equal.” Quarterly Journal ofEconomics, 2001, 116(4), pp. 1189-231.
Hoxby, Caroline M. and Kuzienko, Ilyana. “Robin Hoodand His Not So Merry Plan: Capitalization and theSelf-Destruction of Texas’ School Finance EqualizationPlan.” NBER Working Paper 10722, National Bureauof Economic Research, August, 2004.
Hussar, William and Sonnenberg, William. Trends inDisparities in School District Level ExpendituresPer-Pupil. Washington, DC: National Center forEducation Statistics, 2000.
Kane, Thomas J.; Orszag, Peter R. and Gunter, David L.State Fiscal Constraints and Higher EducationSpending: The Role of Medicaid and the BusinessCycle. Washington, DC: Brookings Institution, 2003.
Ladd, Helen F. and Hansen, Janet S. Making MoneyMatter: Financing America’s Schools. Washington, DC:National Academy Press, 1999.
Murray, Sheila E.; Evans, William N. and Schwab,Robert M. “Education-Finance Reform and theDistribution of Education Resources.” AmericanEconomic Review, September 1998, 88(4), pp. 789-812.
National Center for Education Statistics. Digest ofEducation Statistics, 2002. Washington, DC: UnitedStates Department of Education, 2002.
Roza, Marguerite and Hill, Paul T. “How Within-DistrictSpending Inequities Help Some Schools Fail,” inDiane Ravitch, ed., Brookings Papers on Education
Podgursky and Springer
FEDERAL RESERVE BANK OF ST. LOUIS REGIONAL ECONOMIC DEVELOPMENT VOLUME 2, NUMBER 1 2006 49
Policy, 2004. Washington, DC: Brookings Institution,2004, pp. 201-28.
Rose v. Council for Better Education (KY), 790 S.W.2d186, 60 Ed. Law Rep. 1289 (1989).
Serrano v. Priest (CA), 5 Cal. 3d. 584, 96 Cal Rptr. 601,487 P. 2d. 1241 (1971).
Podgursky and Springer
50 VOLUME 2, NUMBER 1 2006 FEDERAL RESERVE BANK OF ST. LOUIS REGIONAL ECONOMIC DEVELOPMENT


![[TITLE - Overview of Missouri Premises Liability Law]](https://static.fdocuments.net/doc/165x107/58a2f04a1a28abe1338b9b6b/title-overview-of-missouri-premises-liability-law.jpg)