JV TASK 112 – OPTIMAL ETHANOL BLEND- LEVEL INVESTIGATION
37
JV TASK 112 – OPTIMAL ETHANOL BLEND- LEVEL INVESTIGATION Final Report (for the period of May 1, 2007, through December 31, 2007) Prepared for: AAD Document Control U.S. Department of Energy National Energy Technology Laboratory 626 Cochrans Mill Road PO Box 10940, MS 921-107 Pittsburgh, PA 15236-0940 Cooperative Agreement No. DE-FC26-98FT40321 Project Manager: Donald Krastman EERC Fund 9564 Prepared by: Richard E. Shockey Ted R. Aulich Energy & Environmental Research Center University of North Dakota 15 North 23rd Street, Stop 9018 Grand Forks, ND 58202-9018 Bruce Jones Gary Mead Paul Steevens Minnesota Center for Automotive Research Minnesota State University, Mankato Trafton Science Center 205E Mankato, MN 56001 2008-EERC-01-03 January 2008
Transcript of JV TASK 112 – OPTIMAL ETHANOL BLEND- LEVEL INVESTIGATION

JV TASK 112 – OPTIMAL ETHANOL BLEND-LEVEL INVESTIGATION Final Report (for the period of May 1, 2007, through December 31, 2007) Prepared for: AAD Document Control U.S. Department of Energy National Energy Technology Laboratory 626 Cochrans Mill Road PO Box 10940, MS 921-107 Pittsburgh, PA 15236-0940 Cooperative Agreement No. DE-FC26-98FT40321 Project Manager: Donald Krastman EERC Fund 9564
Prepared by:
Richard E. Shockey Ted R. Aulich
Energy & Environmental Research Center
University of North Dakota 15 North 23rd Street, Stop 9018
Grand Forks, ND 58202-9018
Bruce Jones Gary Mead
Paul Steevens
Minnesota Center for Automotive Research Minnesota State University, Mankato
Trafton Science Center 205E Mankato, MN 56001
2008-EERC-01-03 January 2008
DISCLAIMER
This report was prepared as an account of work sponsored by an agency of the United States Government. Neither the United States Government, nor any agency thereof, nor any of their employees makes any warranty, express or implied, or assumes any legal liability or responsibility for the accuracy, completeness, or usefulness of any information, apparatus, product, or process disclosed or represents that its use would not infringe privately owned rights. Reference herein to any specific commercial product, process, or service by trade name, trademark, manufacturer, or otherwise does not necessarily constitute or imply its endorsement, recommendation, or favoring by the United States Government or any agency thereof. The views and opinions of authors expressed herein do not necessarily state or reflect those of the United States Government or any agency thereof.
This report is available to the public from the National Technical Information Service, U.S. Department of Commerce, 5285 Port Royal Road, Springfield, VA 22161; phone orders accepted at (703) 487-4650. EERC DISCLAIMER
LEGAL NOTICE This research report was prepared by the Energy & Environmental Research Center (EERC), an agency of the University of North Dakota, as an account of work sponsored by U.S. Department of Energy National Energy Technology Laboratory. Because of the research nature of the work performed, neither the EERC nor any of its employees makes any warranty, express or implied, or assumes any legal liability or responsibility for the accuracy, completeness, or usefulness of any information, apparatus, product, or process disclosed or represents that its use would not infringe privately owned rights. Reference herein to any specific commercial product, process, or service by trade name, trademark, manufacturer, or otherwise does not necessarily constitute or imply its endorsement or recommendation by the EERC.

JV TASK 112 – OPTIMAL ETHANOL BLEND-LEVEL INVESTIGATION ABSTRACT
Highway Fuel Economy Test (HWFET) and Federal Test Procedure 75 (FTP-75) tests were conducted on four 2007 model vehicles; a Chevrolet Impala flex-fuel and three non-flex-fuel vehicles: a Ford Fusion, a Toyota Camry, and a Chevrolet Impala. This investigation utilized a range of undenatured ethanol/Tier II gasoline blend levels from 0% to 85%. HWFET testing on ethanol blend levels of E20 in the flex fuel Chevrolet Impala and E30 in the non-flex-fuel Ford Fusion and Toyota Camry resulted in miles-per-gallon (mpg) fuel economy greater than Tier 2 gasoline, while E40 in the non-flex-fuel Chevrolet Impala resulted in an optimum mpg based on per-gallon fuel Btu content. Exhaust emission values for non-methane organic gases (NMOG), carbon monoxide (CO), and nitrogen oxides (NOx) obtained from both the FTP-75 and the HWFET driving cycles were at or below EPA Tier II, Light-Duty Vehicles, Bin 5 levels for all vehicles tested with one exception. The flex-fuel Chevrolet Impala exceeded the NMOG standard for the FTP-75 on E-20 and Tier II gasoline.
i
TABLE OF CONTENTS
LIST OF FIGURES ........................................................................................................................ ii LIST OF TABLES......................................................................................................................... iii EXECUTIVE SUMMARY ........................................................................................................... iv 1.0 INTRODUCTION................................................................................................................. 1 2.0 EXPERIMENTAL ................................................................................................................ 2 2.1 Base Test Fuels ............................................................................................................ 2
2.1.1 EPA Tier 2 EEE Gasoline................................................................................. 2 2.1.2 Undenatured Fuel-Grade Ethanol ..................................................................... 3
2.2 Undenatured Fuel-Grade Ethanol–Tier 2 EEE Gasoline Fuel Blends......................... 3 2.3 Test Vehicles ............................................................................................................... 3 2.4 Testing Procedures and Equipment ............................................................................. 7
2.4.1 Fuel Tank Flushing and Fuel Change-Out Procedure....................................... 7 2.4.2 Engine Management System “Learning” Training........................................... 8 2.4.3 Wide-Open-Throttle Full-Load Horsepower Testing ....................................... 9 2.4.4 Fuel Economy and Emission Testing ............................................................. 10 2.4.5 SuperFlow AC Motor-Driven Chassis Dynamometer.................................... 10 2.4.6 Critical Flow Venturi ...................................................................................... 11 2.4.7 Drive Cycle and Driver’s Trace Monitor........................................................ 11 2.4.8 FTP-75 Driving Cycle..................................................................................... 11 2.4.9 HWFET Driving Cycle ................................................................................... 12
2.5 Gas Analyzers............................................................................................................ 13 2.5.1 Hydrocarbons.................................................................................................. 13 2.5.2 Carbon Monoxide and Carbon Dioxide.......................................................... 13 2.5.3 Oxides of Nitrogen.......................................................................................... 14
3.0 RESULTS AND DISCUSSION ......................................................................................... 14 3.1 Fuel Economy Test Results ....................................................................................... 14
3.1.1 Calculated Fuel Economy............................................................................... 14 3.1.2 Toyota Camry Fuel Economy......................................................................... 14 3.1.3 Chevrolet Impala (non-flex fuel) Fuel Economy............................................ 16 3.1.4 Chevrolet Impala (flex fuel) Fuel Economy ................................................... 16 3.1.5 Ford Fusion Fuel Economy............................................................................. 16 3.1.6 Fuel Economy Improved................................................................................. 18
3.2 Emission Test Results: FTP-75 and HWFET Emissions .......................................... 18 4.0 CONCLUSIONS................................................................................................................. 19 5.0 REFERENCES.................................................................................................................... 22 ANALYZER..................................................................................................................Appendix A

ii
LIST OF FIGURES 1 Ford Fusion ........................................................................................................................... 5 2 Toyota Camry........................................................................................................................ 6 3 Chevrolet Impala ................................................................................................................... 6 4 Chevrolet Impala (flex fuel) .................................................................................................. 7 5 Mustang chassis dynamometer............................................................................................ 10 6 SuperFlow AC motor-driven chassis dynamometer ........................................................... 11 7 FTP-75................................................................................................................................. 12 8 HWFET ............................................................................................................................... 13 9 Calculated highway fuel economy ...................................................................................... 15 10 2007 Toyota Camry, 2.4-L engine, highway fuel economy................................................ 15 11 2007 Chevrolet Impala (non-flex fuel), 3.5-L engine, highway fuel economy .................. 16 12 2007 Chevrolet Impala (flex fuel), 3.5-L engine highway fuel economy........................... 17 13 2007 Ford Fusion, 2.3-L engine, highway fuel economy ................................................... 17 14 Highway fuel economy improvement, E20 and E30 vs. Tier 2 gasoline............................ 19

iii
LIST OF TABLES 1 Tier 2 Gasoline Specifications .............................................................................................. 4 2 Undenatured Fuel-Grade Ethanol–Tier 2 Gasoline Blend Fuel Properties........................... 5 3 Engine Specs and EPA Fuel Economics ............................................................................... 7 4 Tier 2 Light-Duty, Full-Useful-Life Exhaust Emission Standards ..................................... 19 5 FTP-75 and HWFET Emissions and Fuel Economy for Toyota Camry............................. 20 6 FTP-75 and HWFET Emissions and Fuel Economy for Chevrolet Impala ........................ 20 7 FTP-75 and HWFET Emissions and Fuel Economy for Chevrolet Impala (flex fuel)....... 21 8 FTP-75 and HWFET Emissions and Fuel Economy for Ford Fusion ................................ 21

iv
OPTIMAL ETHANOL BLEND-LEVEL INVESTIGATION
EXECUTIVE SUMMARY The University of North Dakota Energy & Environmental Research Center (EERC) and the Minnesota Center for Automotive Research (MnCAR) conducted vehicle fuel economy and emission testing on four 2007 model vehicles. The vehicles tested included a Chevrolet Impala flex-fuel and three non-flex-fuel vehicles: a Ford Fusion, a Toyota Camry, and a Chevrolet Impala. This investigation utilized a range of undenatured ethanol–Tier 2 gasoline blend levels from 0% to 85%. The primary objective of the investigation was to investigate the possible existence of a fuel economy-based optimal ethanol blend level, as determined by the Highway Fuel Economy Test (HWFET), at which measured miles per gallon is greater than predicted based strictly on per-gallon fuel Btu content. A secondary objective was to acquire HWFET hot-start tailpipe emission data for all surveyed fuels. Following optimal blend-level determination, cold-start emissions, as determined by Federal Test Procedure 75 (FTP-75), were determined on the optimal blend-level and Tier 2 gasoline. HWFET testing on ethanol blend levels of E20 in the flex-fuel Chevrolet Impala, E30 in the non-flex-fuel Ford Fusion and Toyota Camry, and E40 in the non-flex-fuel Chevrolet Impala resulted in measured miles-per-gallon fuel economy greater than predicted based on per-gallon fuel Btu content. It is notable that the non-flex-fuel vehicles obtained greater fuel economy at higher blends of ethanol than the unleaded gasoline. In the case of the flex-fuel Chevrolet Impala, the highway fuel economy was greater than calculated for all tested blends, with an especially high peak at E20. While only three non-flex-fuel vehicles were tested in this study, there is a strong indication that non-flex-fuel vehicles operated on optimal ethanol blend levels, which are higher than the standard E10 blend, can obtain better fuel mileage than on gasoline. The Ford Fusion and Toyota Camry obtained a HWFET mileage on E30 of 1% greater than on Tier 2 gasoline; the flex-fuel Chevrolet Impala showed a HWFET mileage of 15% on E20 better than Tier 2 gasoline, as shown in Figure ES-1. Exhaust emission values for nonmethane organic gases (NMOG), nitrogen oxides (NOx), and carbon monoxide (CO) obtained from both the FTP-75 and the HWFET driving cycles were at or below U.S. Environmental Protection Agency (EPA) Tier 2, light-duty vehicle, Bin 5 levels of 0.090, 0.07, and 4.2 grams/mile, respectively, for all vehicles tested, with one exception. The flex-fuel Chevrolet Impala exceeded the NMOG standard for the FTP-75 on E20 and Tier 2 gasoline.

v
Figure ES-1. Highway fuel economy improvement, E20 and E30 vs. Tier 2 gasoline.

1
OPTIMAL ETHANOL BLEND-LEVEL INVESTIGATION
1.0 INTRODUCTION A large body of vehicle fuel economy and emission testing has been done on various ethanol–gasoline fuel blends, resulting in wide variety of data. Often, careful analysis of the data reveals some variance in the testing procedures. This investigation by the Energy & Environmental Research Center (EERC) is designed to minimize the effects of test procedure-related variables, thereby maximizing the potential for accurately assessing the fuel economy and emission impacts of incremental ethanol addition to gasoline. To ensure optimal correlation between fuel chemistry inputs and performance and emission outputs, fuels utilized were gasoline conforming to U.S. Environmental Protection Agency (EPA) Tier 2 EEE specifications and undenatured fuel-grade ethanol. To ensure against narrow applicability of results, vehicles utilized included three non-flex-fuel, late model vehicles and one flex-fuel vehicle from General Motors, Toyota, and Ford. To ensure against potentially confounding the effects of environmental factors, all testing was conducted on a state-of-the-art, fully instrumented SuperFlow AC motor-driven chassis dynamometer coupled with a California Analytical Instruments analytical exhaust emission bench and a Mustang computer-controlled chassis dynamometer. EPA requires all automobile manufacturers that sell light-duty vehicles in the United States to provide vehicle exhaust emissions and city fuel economy values, as determined by the EPA Federal Test Procedure (FTP-75) driving cycle test. The vehicle exhaust emissions must meet or be less than Tier 2 light-duty exhaust emission standards. In addition, the vehicle highway fuel economy must be determined by the EPA Highway Fuel Economy Test (HWFET). The four vehicles tested in this investigation were subjected to the EPA protocol related to FTP-75 and HWFET. FTP-75 comprises cold-start, transition, and hot-start phases. Because 80%–90% of tailpipe emissions occur during cold-start episodes, prior to the point at which a vehicle’s exhaust emission control catalytic converter is heated to its operating temperature, the cold-start phase allows evaluation of any possible emission irregularities that may not be observed during hot-start tests. The EPA HWFET evaluates fuel consumption and hot-start and operating emissions. To ensure maximum data accuracy, each ethanol blend-level evaluation was performed in triplicate. For each vehicle, testing typically commenced at an ethanol blend level of 0%, after which blend level was increased in 10% increments up to 70%, and then to 85%, for a total of up to nine blend-level evaluations per vehicle. When one blend level was switched to the next, old fuel was pumped from the tank, the tank flushed twice, new fuel was added, and the vehicle was road-tested by driving the vehicle approximately 25 miles on both highway and city roads to ensure that the vehicle computer acquired adequate data to “learn” the optimal air-to-fuel requirements of the new fuel. Vehicle fuel trim data were monitored to ensure the fuel had been “learned.” After the vehicle had “learned” the fuel, it was then tested on the Mustang dynamometer. The vehicle was tested to see if the fuel injectors could supply adequate fuel under high-load conditions. If the vehicle could not “learn” the new fuel, either in the road test or the Mustang dynamometer test, as indicated by an engine fault code display, the ethanol blend level of the fuel was reduced to 5% less to determine if the vehicle could “learn” a lesser ethanol blend-level

2
fuel. The highest ethanol blend level for each fuel was that on which the vehicle could operate with no engine fault code display. The engine fault code is triggered because of the inability of the fuel injector system to deliver sufficient fuel for normal operation of the engine. All four vehicles operated on ethanol blendlevels of at least 45% without engine fault code display. When a vehicle had successfully “learned” an ethanol blend level, it was then subjected to a HWFET on the SuperFlow AC motor-driven chassis dynamometer to obtain highway fuel economy and emission data. The highway fuel economy data were used to determine if there was an optimum ethanol blend level at which the vehicle attained a better-than-calculated fuel economy. The optimum ethanol blend level was determined by plotting the HWFET fuel economy against the calculated economy. If several ethanol blend-level HWFET fuel economies were higher than the calculated fuel economy, the one with the greatest difference was selected as the optimum ethanol blend level for that vehicle. In the HWFET testing, ethanol blend levels of E20 in the flex-fuel Chevrolet Impala, E30 in the non-flex-fuel Ford Fusion and Toyota Camry, and E40 in the non-flex-fuel Chevrolet Impala resulted in miles-per-gallon fuel economy greater than predicted based on per-gallon fuel Btu content and in some cases, better than gasoline. An FTP-75 was run (in triplicate) on all the test vehicles at these ethanol blend levels. 2.0 EXPERIMENTAL 2.1 Base Test Fuels 2.1.1 EPA Tier 2 EEE Gasoline The Tier 2 Vehicle and Gasoline Sulfur Program (1) is a landmark program that affects every new passenger vehicle and every gallon of gasoline sold in the United States. By designing cleaner cars that run on cleaner fuels, the result is cleaner air. The program is a series of “firsts.” For the first time:
• Sport utility vehicles (SUVs), pickups, vans, and even the largest personal passenger vehicles are subject to the same national emission standards as cars.
• Vehicles and the fuels they use are treated as a system, so the cleaner vehicles will have
the low-sulfur gasoline they need to run their cleanest.
• New emission standards apply to all light vehicles, regardless of whether they run on gasoline, diesel fuel, or alternative fuels.
The Tier 2 Vehicle and Gasoline Sulfur Program is part of a series of major initiatives that will reduce emissions from passenger vehicles, highway trucks and buses, and nonroad diesel equipment. The result will be reduced emissions, cleaner air, and improved human health. Gasoline purchased at the pump by a consumer is a highly variable commodity. While it must meet certain federally mandated criteria, such as Reid vapor pressure, octane rating, distillation temperature range, etc., the chemical composition can vary widely. Every chemical has different

3
combustion properties, oxidation pathways, combustion end products, etc. The emission data from one gasoline very likely will differ from the data gathered from a different gasoline. To ensure against fuel variability-related impacts, a standardized fuel is required. EPA Tier 2 EEE gasoline is the standardized fuel for vehicle certification of fuel economy and tailpipe emissions. Every vehicle sold in the United States is required to use Tier 2 EEE gasoline for emission and fuel economy testing. Tier 2 gasoline used in the optimal ethanol blend investigation was purchased from Haltermann Products, Channelview, Texas. Table 1 lists the specification requirements of the fuel.
2.1.2 Undenatured Fuel-Grade Ethanol Fuel-grade ethanol is typically denatured with 2%–5% natural gasoline. Denaturing agents, such as natural gasoline, cannot be removed from ethanol without expensive and extraordinary measures. This ensures against fuel-grade ethanol consumption and avoidance of taxation by the federal government. Natural gasoline is a mixture of hydrocarbons, mostly pentanes and heavier hydrocarbons, extracted from natural gas. Undenatured fuel-grade ethanol was used for the blending so that no extraneous organic carbon was included in the final blend. The Tier 2 EEE fuel has a reported weight fraction of carbon in the analysis. The carbon fraction is utilized in the emission calculations. Carbon from denaturants would complicate determination of the weight fraction of carbon in the blended fuel. The undenatured fuel-grade ethanol used for blending was purchased from Alchem, Ltd., Grafton, North Dakota, a dry-grind corn ethanol producer. Alchem markets denatured fuel-grade ethanol conforming to ASTM International D4806-07 “Standard Specification for Denatured Fuel Ethanol for Blending with Gasolines for Use as Automotive Spark-Ignition Engine Fuel.” 2.2 Undenatured Fuel-Grade Ethanol–Tier 2 EEE Gasoline Fuel Blends Eight undenatured fuel-grade ethanol and Tier 2 EEE gasoline compositions, from E10 to E85, on a volume/volume basis, were blended for initial screening in this investigation (Table 2). 2.3 Test Vehicles Four 2007 vehicles, with automatic transmissions, were tested in this study:
• A Ford Fusion with a 2.3-liter engine with approximately 5000 miles on the odometer (Figure 1).
• A Toyota Camry with a 2.4-liter engine with approximately 7000 miles on the odometer
(Figure 2).
• A Chevrolet Impala with a 3.5-liter engine with approximately 31,000 miles on the odometer (Figure 3).
• A Chevrolet Impala (flex fuel) with a 3.5-liter engine with approximately 7000 miles on
the odometer (Figure 4).

4
Table 1. Tier 2 Gasoline Specifications PRODUCT: EPA TIER II EEE Batch No.: VD0321LT10
FEDERAL REGISTER Shipment No: MTSPRODUCT CODE: HF437 Tank No.: 105
Analysis Date: 4/11/2007Shipment Date:
FED Specs HALTERMANN SpecsTEST METHOD UNITS MIN. MAX. MIN. TARGET MAX. RESULTSDistillation – IBP ASTM D86 °F 75 95 75 95 785% °F 11210% °F 120 135 120 135 12420% °F 14330% °F 16740% °F 19850% °F 200 230 200 230 22260% °F 23370% °F 24580% °F 26690% °F 305 325 305 325 31995% °F 334Distillation – EP °F 415 415 392Recovery vol% Report 98.3Residue vol% Report 1.0Loss vol% Report 0.7Gravity ASTM D4052 °API 58.7 61.2 58.7 61.2 59.1Density ASTM D4052 kg/L 0.734 0.744 0.742Reid Vapor Pressure ASTM D323 psi 8.7 9.2 8.7 9.2 9.0Reid Vapor Pressure ASTM D5191 psi 8.7 9.2 8.7 9.2 9.10Carbon ASTM D3343 wt fraction Report 0.0000Carbon ASTM E191 wt fraction Report 0.8637Hydrogen ASTM E191 wt fraction Report 0.1343Hydrogen/Carbon Ratio ASTM E191 mole/mole Report 1.853Oxygen ASTM D4815 wt% 0.05 <0.05Sulfur ASTM D5453 wt% 0.0015 0.0080 0.0025 0.0035 0.0028Lead ASTM D3237 g/gal 0.05 0.01 <0.01Phosphorus ASTM D3231 g/gal 0.005 0.005 <0.0008Composition, aromatics ASTM D1319 vol% 35.0 35.0 29.4Composition, olefins ASTM D1319 vol% 10.0 10.0 0.6Composition, saturates ASTM D1319 vol% Report 70.0Particulate Matter ASTM D5452 mg/L 1 0.4Oxidation Stability ASTM D525 minutes 240 >1000Copper Corrosion ASTM D130 1 1Gum Content, washed ASTM D381 mg/100 mL 5 <0.5Fuel Economy Numerator/C Density ASTM E191 2401 2441 0C Factor ASTM E191 Report 0.0000Research Octane Number ASTM D2699 93.0 96.0 96.6Motor Octane Number ASTM D2700 Report 88.0Sensitivity 7.5 7.5 8.6Net Heating Value, Btu/lb ASTM D3338 Btu/lb Report 0Net Heating Value, Btu/lb ASTM D240 Btu/lb Report 18427Color VISUAL Report CLEAR
APPROVED BY: ANALYST HVD

5
Table 2. Undenatured Fuel-Grade Ethanol–Tier 2 Gasoline Blend Fuel Properties
Blend RVP1 Specific Gravity2
Tier 2 Gasoline 9.07 0.7404 E10 10.11 0.7443 E20 9.91 0.7503 E30 9.76 0.7542 E40 9.30 0.7602 E50 8.92 0.7651 E60 7.82 0.7730 E70 7.38 0.7789 E85 3.28 0.7918 Fuel-Grade Ethanol (undenatured)
2.54 0.7968
1 ASTM Method D323 for Reid vapor pressure. 2 ASTM Method D4052 for density and relative density.
Figure 1. Ford Fusion.

6
Figure 2. Toyota Camry.
Figure 3. Chevrolet Impala.

7
Figure 4. Chevrolet Impala (flex fuel).
Vehicle specifications and EPA-determined fuel economy are shown in Table 3. Table 3. Engine Specs and EPA Fuel Economics EPA EPA
Engine Displacement,
liters Compression
Ratio
City Fuel Economy,
mpg
Highway Fuel Economy,
mpg Horsepower
@ rpm
Torque, lb-ft
@ rpm Toyota Camry 2.4 9.8 to 1 24 32 158@6000 161@4000 Chevrolet Impala 3.5 9.8 to 1 21 31 211@5800 214@4000 Chevrolet Impala, flex fuel 3.5 9.8 to 1 21 31 211@5800 214@4000 Ford Fusion 2.3 9.1 to 1 23 31 160@6250 156@4250
2.4 Testing Procedures and Equipment 2.4.1 Fuel Tank Flushing and Fuel Change-Out Procedure In order to ensure that the fuel tested was not contaminated with fuel currently in the fuel system, it was necessary to thoroughly flush the fuel system. The procedure used, entitled “Fuel Tank Flushing Procedure,” is recommended by the Coordinated Research Council. The fuel tank was completely drained through the fuel line Schrader valve by activating the vehicle fuel pump. Four gallons of the test fuel was added to the vehicle fuel tank, and the vehicle was started and idled for 2 minutes. The fuel tank was again completely drained, and 4 gallons of test fuel was

8
added. The vehicle was started and idled for a total of 2 minutes. From approximately 15 seconds into the idle, for a period of 30 seconds, the rear end of the vehicle was rocked from side to side. Again, the fuel tank was completely emptied through the Schrader valve using the vehicle fuel pump. Eight gallons of test fuel was then added to the vehicle fuel tank for the subsequent learning and dynamometer testing. 2.4.2 Engine Management System “Learning” Training Virtually all vehicles manufactured since the early 1980s utilize a computer to monitor and adjust specific engine parameters that affect fuel economy and tailpipe emissions. These systems attempt to adjust the amount of fuel delivered and ignition timing to the optimal level for performance, drivability, and emissions. The air/fuel ratio (AFR) on all cars utilizing computer controls is primarily controlled through the interaction of the fuel injector, oxygen sensor in the exhaust system, and engine computer. While the vehicle is cruising or driving under light to moderate load, the engine control unit (ECU) tries to target a stoichiometric AFR. A stoichiometric AFR means that there is a perfect mixture of air and fuel so that when combustion takes place, the only products are CO2 and water. The AFR is controlled through the amount of time the fuel injector is turned on by the ECU; the longer it is on, the more fuel is added to achieve a stoichiometric AFR. The injector “on-time” is controlled by the ECU based on many sensor inputs. However, the primary sensor used is the oxygen sensor. The oxygen sensor is placed in the exhaust stream of the vehicle between the engine and the catalytic converter. It sends a signal to the ECU that is a function of the amount of oxygen in the exhaust. If there is not enough fuel in the air–fuel mixture entering the engine, the oxygen content of the exhaust is high, indicating a “lean” AFR. A signal is sent to the ECU requesting more fuel. If the oxygen content of the exhaust is low, the air–fuel mixture is considered “rich.” A signal is sent to the ECU requesting less fuel. The signals sent to the ECU allow fuel adjustment to occur approximately once a second. This is referred to as “closed-loop operation.” However, there are times when the engine requires a mixture that is not stoichiometric. These conditions include, but are not limited to, a cold start and/or a wide-open throttle situation, which requires a richer mixture than a light cruising or idle condition, which requires a leaner mixture to obtain improved fuel economy. Also, the oxygen sensor does not generate a signal until it has reached operating temperature, which can take several minutes of engine operation to attain. During these times, the oxygen sensor signal cannot be used by the ECU for engine control. The ECU must, therefore, estimate how much time to hold the injectors open during those conditions. The ECU has an internal “target fuel map,” based on gasoline, that has been generated by the automobile manufacturer. The ECU uses the target fuel map to optimize the AFR for specific engine operating conditions. Ethanol contains oxygen, and when it is added to the gasoline and combusted, the oxygen content of the exhaust increases, indicating a “lean” AFR. The amount of injector on-time required changes for a specific operating condition.

9
During closed-loop operation of the ECU, the interaction of the oxygen sensor and fuel injectors is adjusted to the oxygen content of various ethanol blends to obtain the stoichiometric AFR. However, during open-loop conditions, the ECU varies the amount of time the fuel injector is turned on based on the target fuel map held in the ECU program. This program has been developed for gasoline and E10. Those values will not deliver the proper amount of fuel with higher ethanol blends. This is where the short-term and long-term fuel trim values come into play. If more correction than normal is needed, as determined by the ECU target fuel map, the ECU uses the short-term fuel trim strategy option to compensate. The ECU short-term fuel trim programming allows the ECU to adapt and adjust the injection duration quickly, delivering the correct amount of fuel. When higher ethanol blends are used, the initial output of the ECU results in a lean mixture. When a specific injector on-time is commanded, the oxygen sensor signals a change in operation, by changing either to a rich or lean AFR. However, if the response is not what the ECU anticipates, the injection timing is adjusted until the expected response is observed. This phenomena is referred to as “learning.” Short-term fuel trim is a very fast-responding adjustment, while long-term fuel trim adjusts via the “target fuel map” stored in the ECU. The procedure followed to “learn” each new ethanol blend involved starting each vehicle a minimum of three times, after the engine coolant temperature was below 160°F, and driving the vehicle on a predetermined test loop that had a variety of driving speeds and conditions. A diagnostic scan tool was used to monitor the short-term fuel trim values to ensure that they varied no more ± 3%, which is an acceptable range for emission testing. 2.4.3 Wide-Open-Throttle Full-Load Horsepower Testing The vehicle emission testing drive cycle is a relatively light-load, low-speed test used to simulate normal driving. The test does not simulate all driving conditions or environmental conditions. As a vehicle is driven at higher speeds, is carrying a heavy load or pulling a trailer, or operating in an extremely cold temperature, it will require more fuel to be delivered by the fuel injectors. As ethanol blends increase, a point may be reached where the injectors do not have the flow capacity required for proper operation. This point cannot be simulated on the emission/fuel economy test. Therefore, prior to any emission/fuel economy testing, each vehicle was placed on a Mustang computer-controlled chassis dynamometer (Figure 5) to run the vehicle at peak horsepower for an extended period of time. This required the vehicle to demand the maximum amount of fuel it would need under high-load conditions. If the ECU detected a lean mixture that it was unable to adjust for, the malfunction indication light (MIL) would become illuminated on the dash, indicating a fault code. Each time a new fuel blend was placed in a vehicle, this testing was conducted. If the MIL came on and a lean AFR condition was indicated, no emission or fuel economy testing was conducted on that blend level.

10
Figure 5. Mustang chassis dynamometer.
2.4.4 Fuel Economy and Emission Testing
The fuel economy and emission testing was performed by the Minnesota Center for Automotive Research (MnCAR) at the University of Minnesota Mankato branch. The system used in the MnCAR lab to measure vehicle tailpipe emissions is a California Analytical Instruments dilution system, which includes five specific systems: the SuperFlow AC motor-driven chassis dynamometer, the critical flow venturi, the drive cycle and driver’s trace monitor, the FTP-75 driving cycle and the HWFET driving cycle, and the gas analyzers. 2.4.5 SuperFlow AC Motor-Driven Chassis Dynamometer
The SuperFlow AC motor-driven chassis dynamometer (Figure 6) allows a vehicle to operate as though being driven on the highway. The inertia weight and horsepower loads are varied by the dynamometer to replicate the loads the vehicle would experience on the road under acceleration and deceleration conditions. This allows the dynamometer to simulate real-world driving conditions with excellent repeatability. This dynamometer is capable of simulating the mass and power requirements of a vehicle under transient operating conditions. The mass of the vehicle and its power requirements are entered into the control software. Once these values are entered, the dynamometer can provide a simulated load that is exactly the same as the vehicle would encounter on the road. This allows the elimination of variables normally encountered on the road, including wind, rain, temperature, traffic, and other variables that affect vehicle operation.

11
Figure 6. SuperFlow AC motor-driven chassis dynamometer.
2.4.6 Critical Flow Venturi The second component of the system is the critical flow venturi, which accurately dilutes the exhaust sample before it reaches the gas analyzers. Either a 350-scfm or a 700-scfm critical flow venturi can be used in the system depending on the emission concentrations of the sample vehicle. The 350-scfm venturi was used because the emission is diluted with less air, improving testing accuracy. A transfer hose was connected to the tailpipe to collect the exhaust gases and direct them into the analyzer cabinet that contains the critical flow venturi. 2.4.7 Drive Cycle and Driver’s Trace Monitor The third system utilized is the drive cycle and driver’s trace monitor. Once the vehicle is properly mounted with the sampling system in place and all the controls and instrumentation are set, the vehicle is driven following a specific drive cycle on a computer monitor. A drive cycle is a speed-versus-time trace designed to simulate a specific type of driving condition. To do this, the driver starts the engine and attempts to follow the driving cycle shown on a computer monitor by accelerating and braking the vehicle. If the vehicle speed deviates from the trace, the test is aborted and must be repeated. The two test procedures that were used to test the four vehicles are the FTP-75 and the HWFET. 2.4.8 FTP-75 Driving Cycle The FTP-75 is the standard federal exhaust emission driving cycle, which uses the urban dynamometer driving schedule (UDDS). The FTP-75 cycle is used by all automobile
12
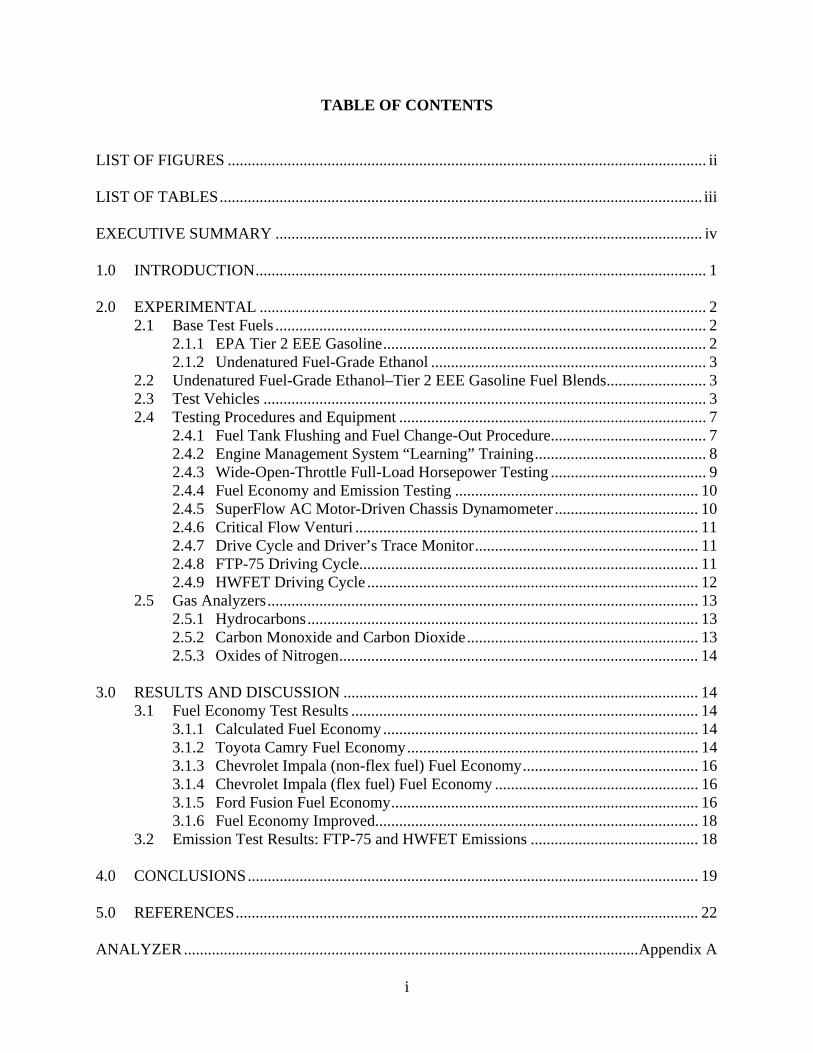
manufacturers and EPA for emission certification of light-duty vehicles. This cycle has three separate phases: a cold-start (505-second) phase known as Bag 1, a hot-transient (864-second) phase known as Bag 2, and a hot-start (505-second) phase known as Bag 3. The hot-start 505 is often called the Hot-505. The three test phases are referred to as Bag 1, Bag 2, and Bag 3 because exhaust samples are collected in separate Tedlar bags during each phase. During a 10-minute cooldown between the second and third phase, the engine is turned off. The 505-second driving trace for the first and third phase is identical. The total test time for the 11-mile FTP-75 is 1874 seconds (31.23 minutes), the top speed is 56.7 mph, and the average speed is 21.4 mph (Figure 7). A single test was performed for each vehicle on both Tier 2 and the optimal ethanol blend level. 2.4.9 HWFET Driving Cycle The HWFET cycle (Figure 8) is a chassis dynamometer driving cycle developed by EPA for the determination of fuel economy of light-duty vehicles. This cycle simulates highway driving at varying speeds, with no stopping until the end of the test. This drive cycle was used to determine the fuel economy for the four vehicles tested. Emission data were obtained, although they are not utilized by the EPA vehicle certification protocol. Each test was performed in triplicate.
Figure 7. FTP-75.

13
Figure 8. HWFET. 2.5 Gas Analyzers
The fourth part of the system is the exhaust gas analyzers. The analyzers used in the project measured the following gases: hydrocarbons, oxides of nitrogen, carbon monoxide, and carbon dioxide. Before the tests were run, each analyzer was calibrated using EPA procedures. The specific details of each analyzer are explained below. 2.5.1 Hydrocarbons Hydrocarbon emissions result from fuel that does not burn completely in the engine. Some of the hydrocarbons can react with NOx and sunlight to form ozone, a major component of smog. Ozone is beneficial in the upper atmosphere, where it protects the earth by filtering out ultraviolet radiation, but at ground level, it is a noxious pollutant. Ozone irritates the lung tissue and causes coughing, choking, and stinging eyes. Some hydrocarbons emitted in exhaust, such as benzene, are known carcinogens, and others, such as 1,3-butadiene, are suspected carcinogens. Hydrocarbons are detected using a flame ionization detector (FID), discussed in Appendix A (shown in Figure A-1). 2.5.2 Carbon Monoxide and Carbon Dioxide Carbon monoxide (CO), which is colorless, odorless, and poisonous, is a product of incomplete combustion. CO is dangerous to humans because it reduces the flow of oxygen in the bloodstream. Infants, the elderly, and persons with respiratory problems are particularly sensitive. Carbon dioxide (CO2) is the product of complete combustion. CO and CO2 are analyzed using a nondispersive infrared detector (NDIR) (Figure A-2).

14
2.5.3 Oxides of Nitrogen (NOx) Nitrogen and oxygen atoms react during combustion to form various oxides of nitrogen. NOx leads to the formation of ozone and contributes to the formation of acid rain. NOx is determined using a chemiluminescence detector (Figure A-3). 3.0 RESULTS AND DISCUSSION
3.1 Fuel Economy Test Results
3.1.1 Calculated Fuel Economy For each vehicle, fuel economy values were calculated for each ethanol blend based on:
• Measured fuel economy with Tier 2 fuel. • A Tier 2 gasoline lower heating value (LHV) of 114,187 Btu/gallon. • An ethanol LHV of 76,000 Btu/gallon. • The proportion of Tier 2 gasoline and ethanol in each fuel blend.
For example, measured fuel economy for the Ford Fusion on Tier 2 gasoline is 23.48 mpg. The E30 calculated fuel economy is determined using the formula below: Calculated fuel economy = ([gasoline fraction][gasoline LHV] + [ethanol fraction] [ethanol LHV])(measured mpg)/gasoline LHV = ([0.7][114,187 Btu/gal] + [0.3][76,000 Btu/gal]) (23.48 mpg)/114,187 Btu/gal = 21.21 mpg The calculated fuel economy values for all of the vehicles are shown in the graph in Figure 9. When the measured and calculated fuel economy values for a vehicle are superimposed graphically, fuel economy performance can be easily visualized and evaluated. If the measured fuel economy was above the calculated fuel economy line, the vehicle performed better than expected, if below, poorer than expected. The fuel economy performance of each vehicle was evaluated based on these data. The measured fuel economy is the average of three replicate tests. An error bar, encompassing the variance of the results, is included in each fuel economy graph. 3.1.2 Toyota Camry Fuel Economy The Toyota Camry gave an engine fault code on E70 but ran well on E65. The Camry operated very close to the calculated fuel economy throughout the range of the tested fuels. HWFET fuel economy values for the eight tested blends were below calculated for all blends except E30. There is a definite peak at E30, which indicates an optimum blend level for this vehicle, shown in Figure 10.

15
Figure 9. Calculated highway fuel economy.
Figure 10. 2007 Toyota Camry, 2.4-L engine, highway fuel economy.
16
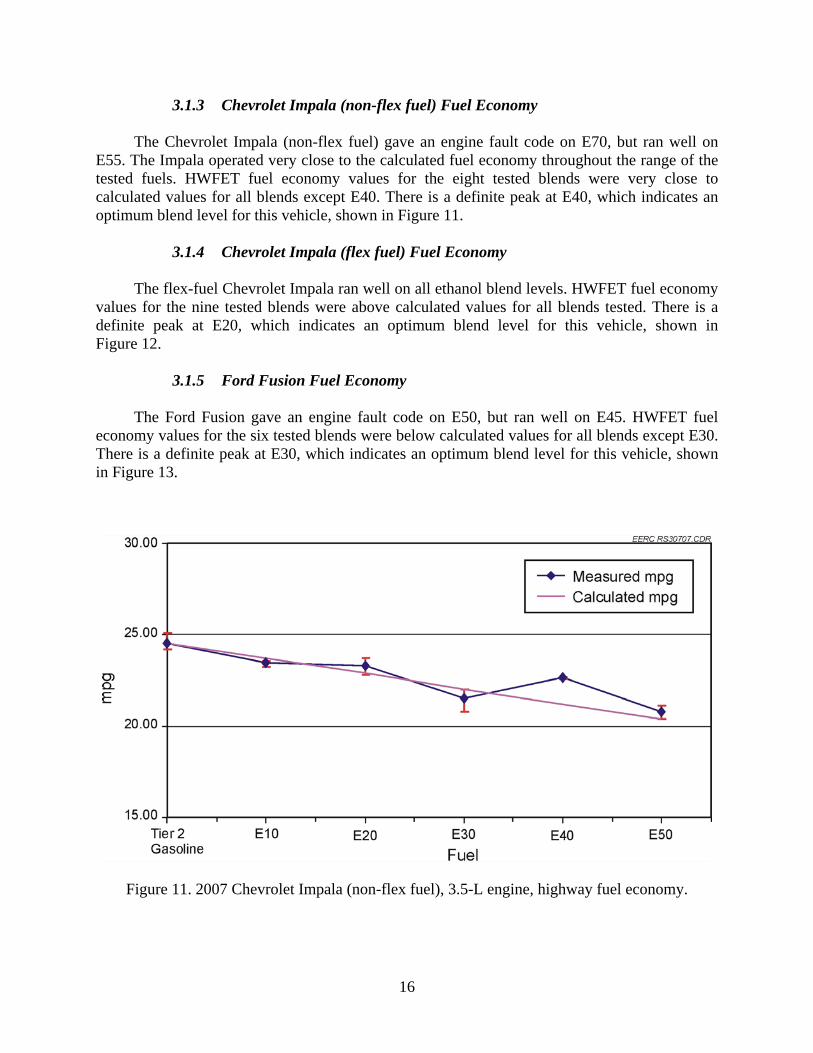
3.1.3 Chevrolet Impala (non-flex fuel) Fuel Economy The Chevrolet Impala (non-flex fuel) gave an engine fault code on E70, but ran well on E55. The Impala operated very close to the calculated fuel economy throughout the range of the tested fuels. HWFET fuel economy values for the eight tested blends were very close to calculated values for all blends except E40. There is a definite peak at E40, which indicates an optimum blend level for this vehicle, shown in Figure 11. 3.1.4 Chevrolet Impala (flex fuel) Fuel Economy The flex-fuel Chevrolet Impala ran well on all ethanol blend levels. HWFET fuel economy values for the nine tested blends were above calculated values for all blends tested. There is a definite peak at E20, which indicates an optimum blend level for this vehicle, shown in Figure 12. 3.1.5 Ford Fusion Fuel Economy The Ford Fusion gave an engine fault code on E50, but ran well on E45. HWFET fuel economy values for the six tested blends were below calculated values for all blends except E30. There is a definite peak at E30, which indicates an optimum blend level for this vehicle, shown in Figure 13.
Figure 11. 2007 Chevrolet Impala (non-flex fuel), 3.5-L engine, highway fuel economy.

17
Figure 12. 2007 Chevrolet Impala (flex fuel), 3.5-L engine, highway fuel economy.
Figure 13. 2007 Ford Fusion, 2.3-L engine, highway fuel economy.

18
3.1.6 Fuel Economy Improved
EPA requires all automobile manufacturers that sell light-duty vehicles in the United States to provide vehicle exhaust emissions and city fuel economy values, as determined by the EPA FTP-75 driving cycle test. The vehicle exhaust emissions must meet or be less than Tier 2 light-duty exhaust emission standards. In addition, the vehicle highway fuel economy must be determined by the EPA HWFET. The four vehicles tested in this investigation were subjected to the EPA protocol related to FTP-75 and HWFET. It is notable that the Ford Fusion and Toyota Camry obtained a HWTET mileage on E30 of 1% greater than on Tier 2 gasoline, and the flex-fuel Chevrolet Impala showed a HWFET mileage of 15% on E20 better than Tier 2 gasoline, as shown in Figure 14. 3.2 Emission Test Results: FTP-75 and HWFET Emissions Current exhaust catalytic converter technology is very advanced. Catalytic converters are easily able to control emissions below the EPA-mandated Tier 2 Light-Duty Full-Useful-Life Exhaust Emissions Standards Bin 5 values (Figure A-5) when the catalyst is at design operating temperature. All 2004 models and later vehicles sold in the United States must meet, at a minimum, Tier 2 Bin 5 criteria, as shown in Table 4. The lower the bin number is, the cleaner the vehicle burns fuel: Tier 2 Bin 1: the cleanest federal Tier 2 standard, a zero-emission vehicle (ZEV) Tier 2 Bins 2 through 4: cleaner than the average standard Tier 2 Bin 5: “average” of new Tier 2 standards Nonmethane organic gas (NMOG) values were not obtained directly. Total hydrocarbon (THC) data from the FTP-75 and HWFET testing were converted to NMOG values using the following formula (2):
NMOG = (THC)(0.84) HWFET conditions ensure that the catalyst is at design operating temperature, which results in favorable emission results. FTP-75 tests the vehicle exhaust emissions from a cold start and during warmup, at which time exhaust emissions are at their highest concentration. All four vehicles tested had both HWFET and FTP-75 CO, NOx, and NMOG emissions levels, as shown in Tables 5–8, below Tier 2 Bin 5 values at all ethanol blend levels, with the exception of the flex-fuel Chevrolet Impala. The flex-fuel Chevrolet Impala exceeded the NMOG standard on the FTP-75 for both E20 (0.120 grams/mile) and Tier 2 fuels (0.152 grams/mile) (Tables 4–7). Raw data for these tests are shown in Figure A-6.

19
Figure 14. Highway fuel economy improvement, E20 and E30 vs. Tier 2 gasoline.
Table 4. Tier 2 Light-Duty, Full-Useful-Life Exhaust Emission Standards, grams/mile
Bin Number NOx NMOG CO HCHO
(formaldehyde)PM (particulate
matter) 5 0.07 0.090 4.2 0.018 0.01
4.0 CONCLUSIONS The EERC and MnCAR conducted vehicle fuel economy and emission testing on four 2007 model vehicles. The vehicles tested included a flex-fuel Chevrolet Impala and three non-flex-fuel vehicles: a Ford Fusion, a Toyota Camry, and a Chevrolet Impala. This investigation utilized a range of ethanol blend levels from 0% to 85% in 10% increments. The primary objective of the investigation was to investigate the possible existence of a fuel economy-based optimal ethanol blend level, as determined by the HWFET, at which measured miles per gallon is greater than predicted based strictly on per-gallon fuel Btu content. A secondary objective was to acquire HWFET hot-start tailpipe emission data for all surveyed fuels. Following optimal blend level determination, cold-start emissions, as determined by FTP-75, were determined on the optimal blend level and Tier 2 gasoline. HWFET testing on ethanol blend levels of E20 in the flex-fuel Chevrolet Impala, E30 in the non-flex-fuel Ford Fusion and Toyota Camry, and E40 in the non-flex-fuel Chevrolet Impala resulted in miles-per-gallon fuel economy greater than predicted based on per-gallon fuel Btu

20
Table 5. FTP-75 and HWFET Emissions and Fuel Economy for Toyota Camry, grams/mile
Fuel Tier 2 Bin 5 Standard Test
THC NA**
NMOG* 0.090
CO 4.2
NOx 0.07
CO2 NA
mpg NA
E30 FTP-75 0.037 0.035 0.1 0.000 426 18.59Tier 2 FTP-75 0.020 0.019 0.8 0.04 446 19.81
Tier 2 HWFET 0.002 0.002 0.2 0.03 318 27.85E10 HWFET 0.003 0.003 0.2 0.02 311 27.53E20 HWFET 0.014 0.014 0.2 0.03 329 25.05E30 HWFET 0.009 0.008 0.3 0.02 280 28.25E40 HWFET 0.007 0.006 0.2 0.02 323 23.54E50 HWFET 0.007 0.006 0.4 0.03 313 23.30E60 HWFET 0.013 0.013 0.4 0.04 314 22.21E65 HWFET 0.016 0.015 0.7 0.04 355 19.18
* THC × 0.84. ** Not applicable. Table 6. FTP-75 and HWFET Emissions and Fuel Economy for Chevrolet Impala (non-flex fuel), grams/mile
Fuel Tier 2 Bin 5 Standard Test
THC NA
NMOG*0.090
CO 4.2
NOx 0.07
CO2 NA mpg NA
E40 FTP-75 0.046 0.043 2.4 0.07 490 15.42 Tier 2 FTP-75 0.092 0.087 2.4 0.05 544 16.19 Tier 2 HWFET 0.088 0.083 1.3 0.02 360 24.51 E10 HWFET 0.069 0.065 1.2 0.01 363 23.44 E20 HWFET 0.076 0.072 1.1 0.03 351 23.30 E30 HWFET 0.074 0.070 1.3 0.00 366 21.53 E40 HWFET 0.057 0.054 1.0 0.02 334 22.65 E50 HWFET 0.031 0.029 0.4 0.01 351 20.80
* THC × 0.84.

21
Table 7. FTP-75 and HWFET Emissions and Fuel Economy for Chevrolet Impala (flex fuel), grams/mile
Fuel Tier 2 Bin 5 Standard Test
THC NA
NMOG* 0.090
CO 4.2
NOx 0.07
CO2 NA
mpg NA
E20 FTP-75 0.127 0.120 2.1 0.00 491 16.65 Tier 2 FTP-75 0.161 0.152 1.9 0.01 604 14.61 Tier 2 HWFET 0.068 0.064 0.9 0.02 376 23.48 E10 HWFET 0.069 0.065 0.8 0.01 355 24.02 E20 HWFET 0.057 0.054 0.7 0.01 303 27.07 E30 HWFET 0.035 0.033 0.7 0.02 359 21.85 E40 HWFET 0.025 0.024 0.6 0.00 326 22.81 E50 HWFET 0.030 0.029 0.6 0.02 313 23.32 E60 HWFET 0.034 0.032 0.5 0.01 317 22.00 E70 HWFET 0.034 0.032 0.5 0.01 339 19.67 E85 HWFET 0.023 0.022 0.6 0.04 349 17.74
* THC × 0.84.
Table 8. FTP-75 and HWFET Emissions and Fuel Economy for Ford Fusion, grams/mile
Fuel Tier 2 Bin 5 Standard Test
THC NA
NMOG* 0.090
CO 4.2
NOx 0.07
CO2 NA
mpg NA
E30 FTP-75 0.013 0.012 0.7 0.01 435 18.19 Tier 2 FTP-75 0.008 0.008 0.9 0.01 445 19.81 Tier 2 HWFET 0.004 0.003 0.2 0.00 329 26.97 E10 HWFET 0.000 0.000 0.5 0.01 363 23.55 E20 HWFET 0.002 0.002 0.4 0.00 319 25.81 E30 HWFET 0.006 0.006 0.2 0.00 292 27.14 E40 HWFET 0.001 0.001 0.5 0.01 346 21.99 E45 HWFET 0.002 0.002 0.5 0.00 352 21.16
* THC × 0.84.

22
content. It is notable that the non-flex-fuel vehicles obtained greater fuel economy at higher blends of ethanol than they were designed for. In the case of the flex-fuel Chevrolet Impala, the highway fuel economy was greater than calculated for all tested blends, with an especially high peak at E20. While only three non-flex-fuel vehicles were tested in this study, there is a strong indication that non-flex-fuel vehicles operated on optimal ethanol blend levels, which are higher than the standard E10 blend, can obtain better fuel mileage than predicted by fuel energy content. Exhaust emission values for NMOG, CO, and NOx obtained from both the FTP-75 and the HWFET driving cycles were at or below EPA Tier 2, light-duty vehicle, Bin 5 levels of 0.090, 0.07, and 4.2 grams/mile, respectively, for all vehicles tested with one exception. The flex-fuel Chevrolet Impala exceeded the NMOG standard for the FTP-75 on E20 and Tier 2 gasoline at 0.120 grams/mile and 0.152 grams/mile, respectively. Formaldehyde and PM values were not obtained during these tests. 5.0 REFERENCES 1. U.S. Environmental Protection Agency. Part II, 40 CFP Parts 80, 85, and 86, Control of Air
Pollution from New Motor Vehicles: Tier 2 Motor Vehicle Emissions Standards and Gasoline Sulfur Control Requirements; Final Rule; 2000.
2. U.S. Environmental Protection Agency. 2006 Model Light Duty Gasoline Vehicle, Fuel
Economy Test Results, EPA Office of Transportation and Air Quality, Assessment and Standards Division.

APPENDIX A
ANALYZER SCHEMATICS AND TIER 2 EMISSION STANDARDS

A-1
Figure A-1. Flame ionization detector.
Figure A-2. Infrared analyzer.

A-2
Figure A-3. NOx analyzer.
Table A-1. Tier 2 Light-Duty Full-Useful-Life Exhaust Emission Standards, grams per mile Bin No. NOx NMOG CO HCHO PM Notes 10 0.6 0.156/0.230 4.2/6.4 0.018/0.027 0.08 a, b, c, d 9 0.3 0.090/0.180 4.2 0.018 0.06 a, b, e The above temporary bins expire in 2006 (for LDVs and LLDTs) and 2008 (for HLDTs) 8 0.20 0.125/0.156 4.2 0.018 0.02 b, f 7 0.15 0.090 4.2 0.018 0.02 6 0.10 0.090 4.2 0.018 0.01 5 0.07 0.090 4.2 0.018 0.01 4 0.04 0.070 2.1 0.011 0.01 3 0.03 0.055 2.1 0.011 0.01 2 0.02 0.010 2.1 0.004 0.01 1 0.00 0.000 0.0 0.000 0.00 Notes: a Bin deleted at end of 2006 model year (2008 for HLDTs). b The higher temporary NMOG, CO, and HCHO values apply only to HLDTs and expire after 2008. c An additional temporary higher bin restricted to MDPVs is discussed in Section IV.B.4.g. d Optional temporary NMOG standard of 0.280 grams/mi applies for qualifying LDT4s and MDPVs only. e Optional temporary NMOG standard of 0.130 grams/mi applies for qualifying LDT2s only. See report. f Higher temporary NMOG standard is deleted at end of 2008 model year.

A-3
Table A-2. Toyota Non-Flex-Fuel Emission and Fuel Economy Raw Data Year 2007 Color: blackMake ToyotaModel CamryEngine Family 7TYXV02.4BEB 2.4 liter motorEvap Family 7TYXR0130A12Test Weight 3750HP@50 11.4 NMOG = THC x 0.84Tier 2 Bin 5 Emissions Standards, grams/mile 0.090 4.2 0.07Fuel Test Number Test Name Remarks THC NMOG CO NOx CO2 Fuel EconomyOptimal MSU FTP 75 Optimal E30 0.037 0.031 0.1 0.00 426 18.59Tier 2 MSU 1804 FTP 75 Tier 2 0.020 0.017 0.8 0.04 446 19.81
Tier 2 HWFET Teir 2 Test 1 0.005 0.004 0.2 0.06 322 27.50HWFET Tier 2 Test 2 0.000 0.000 0.2 0.00 315 28.10HWFET Tier 2 Test 3 0.000 0.000 0.2 0.03 317 27.95
AVERAGE 0.002 0.002 0.2 0.03 318 27.85
E-10 MSU1741 HWFET E-10 Test 1 0.007 0.006 0.2 0.04 313 27.33MSU1742 HWFET E-10 Test 2 0.002 0.002 0.2 0.01 306 27.95MSU1743 HWFET E-10 Test 3 0.001 0.001 0.2 0.02 314 27.31
AVERAGE 0.003 0.003 0.2 0.02 311 27.53
E-20 MSU1732 HWFET E-20 Test 1 0.015 0.013 0.2 0.01 334 24.68MSU1733 HWFET E-20 Test 2 0.017 0.014 0.2 0.07 326 25.28MSU1735 HWFET E-20 Test 3 0.011 0.009 0.2 0.00 327 25.18
AVERAGE 0.014 0.012 0.2 0.03 329 25.05
E-30 MSU1714 HWFET E-30 Test 1 0.010 0.008 0.4 0.02 282 28.11MSU1715 HWFET E-30 Test 2 0.007 0.006 0.2 0.01 276 28.7MSU1716 HWFET E-30 Test 3 0.010 0.008 0.3 0.04 283 27.94
AVERAGE 0.009 0.008 0.3 0.02 280 28.25
E-40 MSU1702 HWFET E-40 Test 1 0.010 0.008 0.2 0.01 324 23.48MSU1703 HWFET E-40 Test 2 0.008 0.007 0.1 0.03 320 23.81MSU1705 HWFET E-40 Test 3 0.002 0.002 0.1 0.00 326 23.33
AVERAGE 0.007 0.006 0.2 0.02 323 23.54
E-50 MSU1683 HWFET E-50 Test 1 0.007 0.006 0.4 0.04 316 23.1MSU1684 HWFET E-50 Test 2 0.007 0.006 0.3 0.01 307 23.79MSU1685 HWFET E-50 Test 3 0.006 0.005 0.4 0.03 317 23.02
AVERAGE 0.007 0.006 0.4 0.03 313 23.30
E-60 MSU1602 HWFET E-60 Test 2 0.024 0.020 0.4 0.04 316 22.09MSU1603 HWFET E-60 Test 3 0.016 0.013 0.4 0.04 318 21.92MSU1604 HWFET E-60 Test 4 0.000 0.000 0.3 0.04 309 22.63
AVERAGE 0.013 0.011 0.4 0.04 314 22.21
E-65 MSU1602 HWFET E-65 Test 1 0.007 0.006 0.6 0.03 350 19.47MSU1603 HWFET E-65 Test 2 0.024 0.020 0.9 0.05 361 18.88MSU1604 HWFET E-65 Test 3 0.016 0.013 0.7 0.05 355 19.19
AVERAGE 0.016 0.013 0.7 0.04 355 19.18

A-4
Table A-3. Chevrolet Flex-Fuel Emission and Fuel Economy Raw Data 2007 Color: whiteChevyImpala flex7GMXV03.5052 3.5 liter motor7GMR0133810387511.5
NMOG = THC x 0.84Tier 2 Bin 5 Emissions Standards, grams/mile 0.090 4.2 0.07Fuel Test Number Test Name Remarks THC NMOG CO NOx CO2 Fuel EconomyOptimal MSU FTP 75 Optimal E20 0.127 0.107 2.1 0.00 491 16.65Tier 2 MSU1745 FTP 75 Tier 2 0.161 0.135 1.9 0.01 604 14.61
Tier 2 MSU1746 HWFET Tier 2 Test 1 0.069 0.058 1.0 0.03 387 22.82MSU1747 HWFET Tier 2 Test 2 0.061 0.051 0.9 0.00 378 23.35MSU1752 HWFET Tier 2 Test 3 0.075 0.063 0.9 0.03 364 24.26
AVERAGE 0.068 0.057 0.9 0.02 376 23.48
E-10 MSU1736 HWFET E-10 Test 1 0.081 0.068 0.7 0.02 355 24.05MSU1737 HWFET E-10 Test 2 0.061 0.051 0.8 0.01 363 23.50MSU1738 HWFET E-10 Test 3 0.064 0.054 0.8 0.00 348 24.51
AVERAGE 0.069 0.058 0.8 0.01 355 24.02
E-20 MSU1721 HWFET E-20 Test 1 0.076 0.064 0.7 0.00 302 27.22MSU1723 HWFET E-20 Test 3 0.046 0.039 0.6 0.00 298 27.55MSU1724 HWFET E-20 Test 4 0.050 0.042 0.7 0.03 311 26.44
AVERAGE 0.057 0.048 0.7 0.01 303 27.07
E-30 MSU1709 HWFET E-30 Test 1 0.036 0.030 0.8 0.03 365 21.63MSU1710 HWFET E-30 Test 2 0.033 0.028 0.7 0.00 350 22.61MSU1711 HWFET E-30 Test 3 0.036 0.030 0.6 0.01 362 21.85
AVERAGE 0.035 0.029 0.7 0.02 359 22.03
E-40 MSU1693 HWFET E-40 Test 1 0.024 0.020 0.5 0.00 328 23.14MSU1695 HWFET E-40 Test 2 0.017 0.014 0.5 0.00 318 23.93MSU1697 HWFET E-40 Test 4 0.035 0.029 0.7 0.00 333 22.81
AVERAGE 0.025 0.021 0.6 0.00 326 23.29
E-50 MSU1680 HWFET E-50 Test 2 0.028 0.024 0.6 0.02 321 22.68MSU1681 HWFET E-50 Test 3 0.028 0.024 0.6 0.02 315 23.15MSU1581 HWFET E-50 Test 4 0.035 0.029 0.6 0.02 302 24.12
AVERAGE 0.030 0.025 0.6 0.02 313 23.32
E-60 MSU1667 HWFET E-60 Test 1 0.042 0.035 0.4 0.01 320 21.80MSU1668 HWFET E-60 Test 2 0.022 0.018 0.4 0.00 309 22.61MUS1670 HWFET E-60 Test 3 0.038 0.032 0.6 0.04 323 21.58
AVERAGE 0.034 0.029 0.5 0.01 317 22.00
E-70 MSU1649 HWFET E-70 Test 1 0.037 0.031 0.6 0.00 340 19.60MSU1650 HWFET E-70 Test 2 0.039 0.033 0.5 0.02 338 19.69MSU1651 HWFET E-70 Test 3 0.025 0.021 0.5 0.01 338 19.72
AVERAGE 0.034 0.028 0.5 0.01 339 19.67
E-85 MSU1631 HWFET E-85 TEST 1 0.019 0.016 0.6 0.02 354 17.51MSU1632 HWFET E-85 TEST 2 0.024 0.020 0.6 0.07 345 17.93MSU1633 HWFET E-85 TEST 3 0.027 0.023 0.6 0.03 348 17.79
AVERAGE 0.023 0.020 0.6 0.038 349 17.74

A-5
Table A-4. Chevrolet Impala Non-Flex-Fuel Emission and Fuel Economy Raw Data Year 2007 Color : grayMake ChevyModel Impala non flexEngine Family 7GMXB03.5048 3.5 liter motorEvap Family 7GMXR0133810Test Weight 3875HP@50 11.5 NMOG = THC x 0.84Tier 2 Bin 5 Emissions Standards, grams/mile 0.090 4.2 0.07Fuel Test Number Test Name Remarks THC NMOG CO NOx CO2 Fuel EconomyOptimal MSU FTP 75 Optimal E-40 0.046 0.039 2.4 0.07 490 15.42Tier 2 MSU1802 FTP 75 Tier 2 0.092 0.077 2.4 0.05 544 16.19
Tier 2 MSU1773 HWFET E-0 Test 1 0.079 0.066 0.9 0.02 356 24.79MSU1774 HWFET E-0 Test 2 0.078 0.066 1.1 0.01 355 24.83MSU1776 HWFET E-0 Test 3 0.106 0.089 2.0 0.03 367 23.92
AVERAGE 0.088 0.074 1.3 0.02 360 24.51
E-10 MSU1770 HWFET E-10 Test 1 0.075 0.063 1.2 0.00 365 23.31MSU1771 HWFET E-10 Test 2 0.068 0.057 1.2 0.01 360 23.64MSU1772 HWFET E-10 Test 3 0.065 0.055 1.0 0.01 364 23.37
AVERAGE 0.069 0.058 1.2 0.01 363 23.44
E-20 MSU1767 HWFET E-20 Test 1 0.062 0.052 0.7 0.02 345 23.79MSU1768 HWFET E-20 Test 2 0.081 0.068 1.2 0.00 353 23.21MSU1769 HWFET E-20 Test 3 0.085 0.071 1.4 0.07 358 22.90
AVERAGE 0.076 0.064 1.1 0.03 352 23.30
E-30 MSU1763 HWFET E-30 Test 1 0.079 0.066 0.7 0.00 376 21.01MSU1764 HWFET E-30 Test 2 0.065 0.055 0.9 0.00 355 22.24MSU1766 HWFET E-30 Test 4 0.078 0.066 2.3 0.01 368 21.34
AVERAGE 0.074 0.062 1.3 0.00 366 21.53
E-40 MSU1760 HWFET E-40 Test 1 0.047 0.039 0.8 0.00 336 22.60MSU1761 HWFET E-40 Test 2 0.060 0.050 0.9 0.03 335 22.66MSU1762 HWFET E-40 Test 3 0.065 0.055 1.4 0.00 332 22.70
AVERAGE 0.057 0.048 1.0 0.01 334 22.65
MSU1628 HWFET E-50 Test 1 0.033 0.028 0.3 0.00 356 20.50E-50 MSU1629 HWFET E-50 Test 2 0.031 0.026 0.4 0.00 343 21.25
MSU1630 HWFET E-50 Test 3 0.028 0.024 0.5 0.03 353 20.66AVERAGE 0.031 0.026 0.4 0.01 351 20.803

A-6
Table A-5. Ford Fusion Non-Flex-Fuel Emission and Fuel Economy Raw Data Year 2007 Color: redMake FordModel FusionEngine Family 7FMXV02.3VET 2.3 liter motorEvap Family 7FMXR0155GAKTest Weight 3625HP@50 13.4 NMOG = THC x 0.84Tier 2 Bin 5 Emissions Standards, grams/mile 0.090 4.2 0.07Fuel Test Number Test Name Remarks THC NMOG CO NOx CO2 Fuel EconomyOptimal MSU FTP 75 Optimal E30 0.013 0.011 0.7 0.01 435 18.19Tier 2 MSU1803 FTP 75 Tier 2 0.008 0.007 0.9 0.01 445 19.87
Tier 2 MSU1726 HWFET Teir 2 Test 1 0.004 0.003 0.3 0.00 332 26.71MSU1727 HWFET Tier 2 Test 2 0.003 0.003 0.2 0.00 322 27.49MSU1728 HWFET Tier 2 Test 3 0.004 0.003 0.3 0.00 332 26.70
AVERAGE 0.004 0.003 0.2 0.00 329 26.97
E-10 MSU1706 HWFET E-10 Test 1 0.000 0.000 0.6 0.02 365 23.37MSU1707 HWFET E-10 Test 2 0.000 0.000 0.4 0.02 359 23.79MSU1708 HWFET E-10 Test 3 0.000 0.000 0.5 0.00 364 23.48
AVERAGE 0.000 0.000 0.5 0.01 363 23.55
E-20 MSU1689 HWFET E-20 Test 1 0.000 0.000 0.4 0.00 323 25.45MSU1690 HWFET E-20 Test 2 0.005 0.004 0.4 0.00 315 26.13MSU1691 HWFET E-20 Test 3 0.000 0.000 0.5 0.00 318 25.85
AVERAGE 0.002 0.002 0.4 0.00 319 25.81
E-30 MSU1675 HWFET E-30 Test 1 0.007 0.006 0.2 0.00 294 26.97MSU1676 HWFET E-30 Test 2 0.007 0.006 0.2 0.00 289 27.40MSU1678 HWFET E-30 Test 3 0.005 0.004 0.2 0.00 293 27.04
AVERAGE 0.006 0.006 0.2 0.00 292 27.14
E-40 MSU1652 HWFET E-40 Test 1 0.000 0.000 0.4 0.01 355 21.44MSU1653 HWFET E-40 Test 2 0.002 0.002 0.5 0.01 346 21.94MSU1654 HWFET E-40 Test 3 0.000 0.000 0.4 0.00 337 22.58
AVERAGE 0.001 0.001 0.5 0.01 346 21.99
E-45 MSU1636 HWFET E-45 Test 1 0.002 0.002 0.5 0.00 346 21.51MSU1637 HWFET E-45 Test 3 0.001 0.001 0.5 0.00 356 20.9MSU1638 HWFET E-45 Test 3 0.002 0.002 0.5 0.00 353 21.08
AVERAGE 0.002 0.002 0.5 0.00 352 21.16


![EFFECT OF DIESEL-BIODIESEL-ETHANOL BLEND ON … · In previous investigations [22] it was found that diesel-ethanol fuel blend up to 30% of etha-nol fuel (EF) is possible to stabile](https://static.fdocuments.net/doc/165x107/5f1040b17e708231d448318c/effect-of-diesel-biodiesel-ethanol-blend-on-in-previous-investigations-22-it-was.jpg)