
Juvenile Recidivism Study: FY 2010/11 Juvenile Sample
70
North Carolina Sentencing and Policy Advisory Commission Juvenile Recidivism Study: FY 2010/11 Juvenile Sample Submitted Pursuant to N.C. Gen. Stat. § 164-48 (2014) May 1, 2015 Prepared by: Mark Bodkin Tamara Flinchum Ginny Hevener Susan Katzenelson Jennifer Wesoloski
Transcript of Juvenile Recidivism Study: FY 2010/11 Juvenile Sample
North Carolina
Sentencing and Policy Advisory Commission
Juvenile Recidivism Study: FY 2010/11 Juvenile Sample
Submitted Pursuant to N.C. Gen. Stat. § 164-48 (2014)
May 1, 2015
Prepared by:
Mark Bodkin Tamara Flinchum Ginny Hevener Susan Katzenelson
Jennifer Wesoloski


Juvenile Recidivism Study: FY 2010/11 Juvenile Sample
North Carolina
Sentencing and Policy Advisory Commission
P.O. Box 2448 Raleigh, NC 27602
(919) 890-1470 www.nccourts.org/courts/crs/councils/spac
The Honorable W. Erwin Spainhour Chairman
Susan Katzenelson Executive Director

NC SENTENCING AND POLICY ADVISORY COMMISSION MEMBERSHIP
Hon. W. Erwin Spainhour, Chairman
Superior Court Judge Art Beeler Lieutenant Governor’s Appointee Hon. Charles E. Brown NC District Court Judges’ Association Hon. Harry Brown State Senator Paul G. Butler, Jr. NC Post-Release Supervision & Parole Commission Robert Campbell NC Bar Association Sheriff James E. Clemmons NC Sheriffs’ Association Chief Scott Cunningham NC Association of Chiefs of Police Hon. Warren Daniel State Senator Hon. N. Leo Daughtry State Representative Louise Davis NC Community Sentencing Association Judge Richard A. Elmore NC Court of Appeals Judge Robert C. Ervin NC Conference of Superior Court Judges Hon. John Faircloth State Representative Christopher Fialko NC Advocates for Justice
David Guice NC Department of Public Safety Hon. Darren Jackson State Representative Hon. Maureen Krueger NC Conference of District Attorneys Ilona Kusa NC Victim Assistance Network
Hon. Floyd McKissick State Senator Dr. Harvey Lee McMurray Academic Member Robert C. Montgomery NC Attorney General’s Office Luther Moore NC Retail Merchants’ Association Judge Fred G. Morrison, Jr. Justice Fellowship Hon. June Ray NC Association of Clerks of Superior Court Billy J. Sanders Commission Chairman’s Appointee Keith S. Shannon Private Citizen, Governor’s Appointee Hon. Thomas Thompson NC Association of County Commissioners

NC SENTENCING AND POLICY ADVISORY COMMISSION STAFF
Susan Katzenelson Executive Director
John Madler Associate Director for Policy, Staff Attorney
Ginny Hevener Associate Director for Research
Tamara Flinchum Senior Research & Policy Associate
Michelle Hall Senior Research & Policy Associate
Sara Perdue Senior Research & Policy Associate
Mark Bodkin Research & Policy Associate
Rebecca Murdock Research & Policy Associate
Jennifer Wesoloski Research & Policy Associate
Shelley Kirk Administrative Secretary

TABLE OF CONTENTS CHAPTER ONE: JUVENILE RECIDIVISM STUDY DIRECTIVE AND METHODOLOGY .................................... 1
Introduction ........................................................................................................................................ 1 The Juvenile Justice System ................................................................................................................ 1
Intake Process .......................................................................................................................... 2 Pre-Dispositional Hearings ....................................................................................................... 3
Probable Cause Hearing ................................................................................................ 3 Transfer Hearing ............................................................................................................ 3 Adjudicatory Hearing ..................................................................................................... 3
Dispositional Hearing ............................................................................................................... 3 Overview of the Process ................................................................................................ 3 Dispositional Alternatives .............................................................................................. 4
Juvenile Recidivism Research Design ................................................................................................. 5 Sample ................................................................................................................................................ 6 Outcome Measures ............................................................................................................................ 7 Data Sources and Enhancements ....................................................................................................... 7 Analysis and Report Outline ............................................................................................................... 8
CHAPTER TWO: STATISTICAL PROFILE OF THE FY 2010/11 JUVENILE SAMPLE ....................................... 9
Sample Selection ................................................................................................................................ 9 Personal Characteristics ................................................................................................................... 10 Delinquency History ......................................................................................................................... 11 DACJJ Supervision ............................................................................................................................. 13 Most Serious Sample Offense .......................................................................................................... 13 Risk and Needs Assessments ............................................................................................................ 15 Chapter Summary ............................................................................................................................. 19
CHAPTER THREE: RECIDIVISM IN THE JUVENILE JUSTICE AND CRIMINAL JUSTICE SYSTEMS................. 21
Follow-Up Period and Time at Risk ................................................................................................... 21 Juvenile and Adult Recidivism .......................................................................................................... 22
Subsequent Juvenile Complaints and Adult Arrests .............................................................. 23 Subsequent Juvenile Adjudications and Adult Convictions ................................................... 26 Personal Characteristics and Recidivism ................................................................................ 27 Prior Complaints and Recidivism ........................................................................................... 28 Sample Offense and Recidivism ............................................................................................. 28 Risk/Needs Levels and Recidivism ......................................................................................... 29 Confinement to a Detention Center and/or a YDC and Adult Arrests ................................... 31 Juvenile Transfers to Superior Court ...................................................................................... 33
Chapter Summary ............................................................................................................................. 33
CHAPTER FOUR: SUMMARY AND CONCLUSIONS ............................................................................... 36
APPENDIX A: RISK AND NEEDS ......................................................................................................... 40
APPENDIX B: JUVENILE DISPOSITION CHART ..................................................................................... 49

APPENDIX C: DISPOSITIONAL OPTIONS ............................................................................................. 51
APPENDIX D: JUVENILES ADJUDICATED AND DISPOSED..................................................................... 53
APPENDIX E: JUVENILES DIVERTED ................................................................................................... 58
APPENDIX F: RISK LEVEL BY NEEDS LEVEL .......................................................................................... 60
LIST OF TABLES
Table 1.1: Juvenile Disposition Chart ............................................................................................................ 4 Table 1.2: Overall Recidivism Rates for North Carolina Juveniles ................................................................ 6 Table 2.1: Personal Characteristics of Juveniles by Level of Involvement .................................................. 10 Table 2.2: Prior Complaints by Age at Sample Event and Level of Involvement ........................................ 11 Table 2.3: Under DACJJ Supervision at the Time of Sample Entry by Level of Involvement ...................... 13 Table 2.4: Most Serious Sample Offense by Level of Involvement ............................................................. 14 Table 2.5: Most Serious Sample Offense by Offense Class and Crime Category ........................................ 15 Table 2.6: Select Risk and Needs Indicators................................................................................................ 16 Table 2.7: Level of Involvement by Risk Level and Needs Level ................................................................. 17 Table 2.8: Risk Level by Needs Level ........................................................................................................... 19 Table 3.1: Recidivism Rates for Juvenile Complaints and Adult Arrests by Level of Involvement during the Three-Year Follow-Up ........................................................................................................................... 24 Table 3.2: Recidivist Events by Level of Involvement during the Three-Year Follow-Up ........................... 25 Table 3.3: Overall Recidivism Rates by Level of Involvement for Each Year of Follow-Up ......................... 26 Table 3.4: Recidivism Rates for Juvenile Adjudications and Adult Convictions by Level of Involvement during the Three-Year Follow-Up ............................................................................................................... 26 Table 3.5: Recidivism Rates by Personal Characteristics of Juveniles and Level of Involvement during the Three-Year Follow-Up ........................................................................................................................... 27 Table 3.6: Recidivism Rates by Prior Complaints and Level of Involvement during the Three-Year Follow-Up .................................................................................................................................................... 28 Table 3.7: Most Serious Recidivist Offense by Most Serious Sample Offense during the Three-Year Follow-Up .................................................................................................................................................... 29 Table 3.8: Recidivism Rates by Risk Level and Needs Level during the Three-Year Follow-Up .................. 30 Table 3.9: Recidivism Rates by Risk/Needs Levels during the Three-Year Follow-Up ................................ 30 Table 3.10: Recidivism Rates by Combined Risk and Needs Indicators by Level of Involvement during the Three-Year Follow-Up ........................................................................................................................... 31 Table 3.11: Adult Arrests by Confinement to a Detention Center and/or a YDC during the Three-Year Follow-Up .................................................................................................................................................... 32 Table 4.1: Juvenile Recidivism Trends ......................................................................................................... 37 Table 4.2: Juvenile Recidivism Trends by Level of Involvement ................................................................. 38 Table A.1: Juveniles with Risk and/or Needs Assessments by Level of Involvement ................................. 48 Table D.1: Identifying Juveniles Adjudicated and Disposed during FY 2010/11 ......................................... 54 Table D.2: Offense Classification of the Sample Offense by Adjudicated Offense, Juveniles Adjudicated and Disposed ............................................................................................................................................... 54 Table D.3: Offense Classification of the Adjudicated Offense by Delinquency History Level, Juveniles Adjudicated and Disposed .......................................................................................................................... 55

Table D.4: Disposition Levels by Offense Classification and Delinquency History Level, Juveniles Adjudicated and Disposed .......................................................................................................................... 56 Table D.5: Recidivism Rates by Individual Components of the Juvenile Disposition Chart during the Three-Year Follow-Up, Juveniles Adjudicated and Disposed ...................................................................... 57 Table E.1: Completion Rates by Type of Diversion Plan, Juveniles Diverted .............................................. 59 Table E.2: Recidivism Rates by Court Status during the Three-Year Follow-Up, Juveniles Diverted .......... 59 Table F.1: Distribution of Risk Level by Needs Level and by Level of Involvement .................................... 61 Table F.2: Recidivism Rates by the Distribution of Risk Level by Needs Level and by Level of Involvement during the Three-Year Follow-Up ............................................................................................................... 62
LIST OF FIGURES Figure 2.1: Juvenile Recidivism Sample ........................................................................................................ 9 Figure 2.2: Prior Juvenile Justice Contacts by Level of Involvement .......................................................... 12 Figure 2.3: Risk Level and Needs Level by Level of Involvement ................................................................ 18 Figure 3.1: Age of Legal Jurisdiction and the FY 2010/11 Sample during the Three-Year Follow-Up ........ 21 Figure 3.2: Average Number and Percentage of Follow-Up Months under Juvenile and Adult
Jurisdictions ............................................................................................................................... 22 Figure 3.3: Recidivism Rates by Sample Characteristics during the Three-Year Follow-Up ....................... 34 Figure 4.1: Three-Year Recidivism Rates for the FY 2010/11 Juvenile Sample ........................................... 36 Figure D.1: Risk Level and Needs Level by Disposition Level, Juveniles Adjudicated and Disposed .......... 55
LIST OF ACRONYMS
CCH Computerized Criminal History CTS Client Tracking System DACJJ Division of Adult Correction and Juvenile Justice DPS Department of Public Safety FY Fiscal Year G.S. General Statute JCPC Juvenile Crime Prevention Councils NCALLIES A Local Link to Improve Effective Services NC-JOIN North Carolina Juvenile Online Information Network SBI State Bureau of Investigation YDC Youth Development Center

1
CHAPTER ONE
JUVENILE RECIDIVISM STUDY DIRECTIVE AND METHODOLOGY
Introduction In the 2005 Session of the General Assembly, the legislature amended Chapter 164 of the General Statutes to direct the North Carolina Sentencing and Policy Advisory Commission (hereinafter referred to as the Sentencing Commission) to conduct biennial juvenile recidivism studies on adjudicated youth in the state:
§ 164-48. Biennial report on juvenile recidivism. The Judicial Department, through the North Carolina Sentencing and Policy Advisory Commission, shall conduct biennial recidivism studies of juveniles in North Carolina. Each study shall be based on a sample of juveniles adjudicated delinquent and document subsequent involvement in both the juvenile justice system and criminal justice system for at least two years following the sample adjudication. All State agencies shall provide data as requested by the Sentencing Commission. The Sentencing and Policy Advisory Commission shall report the results of the first recidivism study to the Chairs of the Senate and House of Representatives Appropriation Committees and the Chairs of the Senate and House of Representatives Appropriation Subcommittees on Justice and Public Safety by May 1, 2007, and future reports shall be made by May 1 of each odd-numbered year.
This is the Sentencing Commission’s fifth biennial report on juvenile recidivism, submitted to the North Carolina General Assembly on May 1, 2015.
The Juvenile Justice System In North Carolina, juveniles are considered to be under the jurisdiction of the juvenile court if they are at least six years old and not older than 16 years old at the time that they are alleged to have committed a delinquent offense. However, juveniles who are at least 13 years of age and are alleged to have committed a felony may be transferred into the criminal justice system and tried as adults. For a juvenile who is alleged to have committed a Class A felony at age 13 or older, the court must transfer the case to superior court if probable cause is found in juvenile court. Juveniles who are alleged to have committed a delinquent offense are processed by, supervised by, and committed to the Department of Public Safety’s (DPS) Division of Adult Correction and Juvenile Justice (DACJJ). In order to provide some context for this study, the following sections describe the processing of juveniles within the juvenile justice system. Juveniles who were adjudicated and received a disposition, as well as dispositional alternatives available to the court, are highlighted.

2
Intake Process All juveniles enter the juvenile justice system by having a formal complaint lodged by a law enforcement officer or private citizen. There are two types of complaints – the delinquency complaint alleges that a juvenile committed a criminal offense, while the undisciplined complaint alleges non-criminal behavior (e.g., running away, unlawful absences from school, incorrigible behavior within the home). For purposes of this study, only juveniles who had a delinquency complaint were discussed. Any juvenile who is subject to a delinquency complaint must go through the intake process for the complaint to be screened and evaluated by a DACJJ court counselor. The court counselor has up to 30 days to determine if a complaint should be handled outside the court or if a complaint should be filed as a petition and set for a hearing before a juvenile court judge. The length and extent of the intake process is based primarily on whether a juvenile is alleged to have committed one of the most serious, statutorily defined group of offenses (i.e., nondivertible offenses1) and/or whether a juvenile is confined in a detention center. During the intake phase, a court counselor conducts interviews with the juvenile, the parent, guardian, or custodian legally responsible for the juvenile, and other individuals who might have relevant information about the juvenile. Beginning in 2006, the risk and needs assessment was incorporated into the intake process for use in the initial decision to approve or not approve a complaint for filing, as well as for use at disposition. These assessments contain information pertaining to the juvenile’s social, medical, psychiatric, psychological, and educational history, as well as factors indicating the probability of the juvenile engaging in future delinquency. (See Appendix A.) Upon reviewing the information gathered during the evaluation, the court counselor determines if the complaint should be closed, diverted, or approved for filing as a petition and brought before the court. If the court counselor decides that a case does not require further action, either by some form of follow-up by a court counselor or through a court hearing, the case is deemed closed. The juveniles in closed cases are typically less problematic and generally have little, if any, history of delinquent behavior. Closed cases constitute the lowest point of involvement in the juvenile justice system. When a court counselor determines that a juvenile’s case should not be brought to court, but that the juvenile is in need of follow-up and referral to a community-based resource (e.g., restitution, counseling), the counselor can then divert the juvenile pursuant to a diversion plan that is developed in conjunction with the juvenile and the juvenile’s parent, guardian, or custodian. If a more formal diversion plan is needed, the court counselor, juvenile, and juvenile’s responsible party enter into a diversion contract. Both the plan and the contract are in effect for up to six months, during which time a court counselor conducts periodic reviews to ensure the compliance of the juvenile and his/her parent, guardian, or custodian. Compliance with the recommendations of the plan or contract results in the finalization of the juvenile’s diversion. If the parties fail to comply, the counselor may re-evaluate the decision to divert and subsequently file the complaint as a petition in juvenile court. If a court counselor concludes, at any point in the intake process, that the juvenile would be best served by referring the case to court, the counselor can authorize the filing of the complaint as a petition and schedule it for a hearing before a juvenile court judge.
1 Nondivertible offenses are defined in N.C. Gen. Stat. (hereafter G.S.) 7B-1701 as murder, first- or second-degree rape, first- or second-degree sexual offense, arson, felony drug offense under Article 5 of G.S. Chapter 90, first-degree burglary, crime against
nature, or a felony involving the willful infliction of serious bodily injury or which was committed by use of a deadly weapon.

3
Pre-Dispositional Hearings Probable Cause Hearing2 Probable cause hearings are held for all felony petitions in which the juvenile was at least 13 years old at the time of the alleged offense. During these hearings, the district attorney’s office must present sufficient evidence to the court that shows there is probable cause to believe that the alleged offense was committed by the juvenile in question. If probable cause is not found, the court may either dismiss the proceeding or find probable cause that the juvenile committed a lesser included offense (e.g., a misdemeanor) and proceed to the adjudicatory hearing, which can immediately follow the probable cause hearing or be set for another date. If probable cause is found and transfer to superior court is not statutorily required (i.e., non-Class A felonies), the court may proceed to a transfer hearing, which can occur on the same day.
Transfer Hearing At the transfer hearing, the court considers a number of factors in reaching a decision on whether the juvenile’s case will be transferred to superior court. If the case is transferred, the juvenile is tried as an adult and is subject to the adult sentencing options. If the judge retains juvenile court jurisdiction and does not transfer the juvenile to superior court, the case then proceeds to the adjudicatory hearing, which can immediately follow the transfer hearing or be set for a later date.
Adjudicatory Hearing The adjudicatory hearing allows for the court to hear evidence from the district attorney, the juvenile’s attorney, and their witnesses in order to make a determination of whether or not the juvenile committed the act(s) alleged in the petition(s). If the court finds that the allegations in the petition have not been proven “beyond a reasonable doubt,” the petition is dismissed and the matter is closed. If the court finds that the allegations have been proven, the juvenile is adjudicated delinquent and the court proceeds to the dispositional hearing.
Dispositional Hearing
Overview of the Process At the dispositional hearing, which may or may not occur on the same date as the adjudicatory hearing, the court decides the sanctions, services, and conditions that will be ordered for the juvenile as a result of the adjudicated offense(s). G.S. 7B-2500 states that the purposes of a disposition are “to design an appropriate plan to meet the needs of the juvenile and to achieve the objectives of the State in exercising jurisdiction, including the protection of the public.” In most cases, juvenile court judges use the predisposition report, which is prepared by the court counselor’s office, in developing a disposition. Risk and needs assessments are attached to this report.
2 Prior to a probable cause hearing, juveniles with a felony petition are scheduled for a first appearance hearing during which a judge determines whether the juvenile has an attorney and provides the juvenile and parent or responsible party with information pertaining to the allegation and future hearings.

4
As shown in Table 1.1, the court’s selection of dispositional alternatives is governed by statute through a graduated sanctions chart that classifies juvenile offenders according to the seriousness of their adjudicated offense (vertical axis) and the degree and extent of their delinquent history (horizontal axis). (See Appendix B for more detailed information.)
Table 1.1 Juvenile Disposition Chart
Offense Classification Delinquency History Level
Low 0-1 point
Medium 2-3 points
High 4 or more points
Violent Class A-E felonies
Level 2 or 3 Level 3 Level 3
Serious Class F-I felonies Class A1 misdemeanors
Level 1 or 2 Level 2 Level 2 or 3
Minor Class 1-3 misdemeanors
Level 1 Level 1 or 2 Level 2
Dispositional Alternatives After reviewing the information provided by the court counselor’s office, juvenile court judges have three dispositional levels available to them in which to dispose the juvenile’s case. A Level 1 or community disposition offers the court less restrictive dispositional alternatives such as probation, community-based programs, non-residential and residential treatment programs, lower degrees of community service and restitution, and sanctions that place specific limitations on a juvenile (e.g., curfew, no association with specified persons, not be in specified places). A Level 2 or intermediate disposition is generally more restrictive than a Level 1 disposition. Level 2 dispositional alternatives include options such as intensive probation, group home placements (e.g., multipurpose group homes), regimented training programs, and house arrest. For a Level 2 disposition, a juvenile can be ordered to make restitution that is in excess of $500 or perform up to 200 hours of community service. The court can also utilize any Level 1 dispositional option for a juvenile adjudicated at Level 2. Several Level 2 options that offer a more restrictive environment for adjudicated juveniles are available for Level 1 dispositions as well. Wilderness programs serve juveniles with behavioral problems in a year-round, residential therapeutic environment.3 Supervised day programs, which allow a juvenile to remain in the community through a highly structured program of services, also represent an alternative that is available at both Level 1 and Level 2 dispositional levels. A Level 3 or commitment disposition provides the most restrictive sanction available to a juvenile court judge – commitment to the DACJJ for placement in a Youth Development Center (YDC). A YDC, as
3 The wilderness camps serve a diverse group of juveniles, including those displaying problematic behavior who are not court-involved.

5
defined in G.S. 7B-1501(29), is “a secure residential facility authorized to provide long-term treatment, education, and rehabilitative services for delinquent juveniles committed by the court to the Division [DACJJ].” Unless a youth is under the age of 10, a court exercising jurisdiction over a juvenile for whom a Level 3 disposition is authorized must commit the juvenile to the DACJJ for placement in a YDC.4 However, G.S. 7B-2513(e) states that the DACJJ, following assessment of a juvenile, may provide commitment services to the juvenile in a program not located in a YDC or detention facility (i.e., community placement). Another exception gives the court discretion to impose a Level 2 disposition rather than a Level 3 disposition if the court makes written findings that substantiate extraordinary needs on the part of the juvenile in question. The length of a juvenile’s commitment must be at least six months; however, there are statutory provisions for extended jurisdiction for committed youth.5 Upon completion of their term of commitment, juveniles are subject to a minimum of 90 days of post-release supervision. The DACJJ currently houses approximately 225 committed juveniles in four YDCs. Appendix C contains a complete list of dispositional alternatives for all three levels. It is noteworthy that many of the community-based programs for adjudicated youth who can receive a Level 1 or 2 disposition are funded through Juvenile Crime Prevention Councils (JCPC) allocations. An even more restrictive option is available for Level 1 or 2 dispositions in the form of intermittent confinement in a detention center. Detention centers are facilities that are approved to provide secure, temporary confinement and care for juveniles who meet statutorily defined criteria.6 The court can impose intermittent confinement for no more than five 24-hour periods as part of a Level 1 disposition. When a Level 2 disposition is authorized, the court can impose confinement on an intermittent basis for up to fourteen 24-hour periods. Because of the short-term nature of detention, programs and services offered in these centers are limited.
Juvenile Recidivism Research Design The research design for the 2015 biennial juvenile recidivism study was first specified in the Sentencing Commission’s Report on the Proposed Methodology for Measuring Juvenile Recidivism in North Carolina to the General Assembly.7 Based on that blueprint, the research strategy for the current study included:
The selection of a population of juveniles brought to court with a delinquent complaint that was adjudicated, dismissed, diverted, or closed during the sample period of July 1, 2010 through June 30, 2011.
The tracking of all juveniles in the sample for a fixed three-year follow-up period from their first court involvement in the sample period.
The definition of recidivism as all subsequent delinquent complaints and adult arrests within the three years following the event that placed the juvenile in the sample.
4 Pursuant to G.S. 7B-2508(d), a court may impose a Level 3 disposition (commitment to a YDC) in lieu of a Level 2 disposition if the juvenile has previously received a Level 3 disposition in a prior juvenile action. Additionally, G.S. 7B-2508(g) allows for juveniles who have been adjudicated of a minor offense to be committed to a YDC if the juvenile has been adjudicated of four or more prior offenses. 5 G.S. 7B-2513(a). 6 In addition to utilizing a detention placement as a dispositional alternative, juveniles can also be detained by the court pending their adjudicatory or dispositional hearing, or their adult hearing following the transfer of the case from juvenile court. 7 North Carolina Sentencing and Policy Advisory Commission, Report on the Proposed Methodology for Measuring Juvenile Recidivism in North Carolina Pursuant to Session Law 2004-124, Section 16.5, Raleigh, NC: North Carolina Sentencing and Policy Advisory Commission, 2005.

6
It should be noted that this methodology expands the study beyond its legislatively mandated scope. Juveniles adjudicated delinquent are studied within the context of all juveniles who were the subject of a delinquent complaint in FY 2010/11 and the sample is followed for a three-year period to capture their delinquent and criminal re-involvement. Based on the reports conducted using this expanded methodology and a three-year follow-up period, the Sentencing Commission’s previous juvenile recidivism studies provide a framework to look at trends in recidivism rates. As shown in Table 1.2, the overall recidivism rate, which is a combined measure of subsequent juvenile complaints and/or adult arrests, has remained consistent across the previous studies – 44.8% for the FY 2004/05 sample, 43.0% for the FY 2006/07 sample, and 44.0% for the FY 2008/09 sample. The findings have consistently indicated that the further a juvenile is processed in the juvenile justice system, the more likely the juvenile is to recidivate. For each study, the juveniles were categorized by level of involvement in the system from a closed case (least serious) to diversion, dismissal, and adjudication (most serious). The findings indicate a stair-step progression in recidivism rates by type of involvement, with closed cases having the lowest recidivism rates (ranging from 33.5% to 35.5%) and adjudicated juveniles having the highest recidivism rates (ranging from 53.3% to 57.1%).
Table 1.2 Overall Recidivism Rates for North Carolina Juveniles
Three-Year Follow-Up
Sample Year
Sample Size
Subsequent Delinquent Complaint and/or Adult Arrest Rates
Level of Involvement
Total Adjudicated Dismissed Diverted Closed
FY 2004/05 20,236 55.7 48.0 38.7 35.5 44.8
FY 2006/07 20,364 53.3 45.7 38.4 34.7 43.0
FY 2008/09 17,660 57.1 46.4 37.8 33.5 44.0
SOURCE: NC Sentencing and Policy Advisory Commission
Sample There were 15,942 juveniles identified in the DACJJ’s automated database who had their delinquent complaint either adjudicated, dismissed, diverted, or closed without further action between July 1, 2010 and June 30, 2011. If a juvenile had more than one sample event during the sample period, his/her case was grouped based on the earliest of these events. If a juvenile had two or more court events on the same day, the most serious of these events was counted as the prompt for inclusion in the sample. Applying these criteria, the 15,942 sample juveniles were divided into four groups based on their level of involvement for their first court event: juveniles with cases adjudicated (n=5,141), dismissed (n=1,954), diverted (n=4,640), or closed (n=4,207).

7
Outcome Measures The primary outcome measure of recidivism was defined as either a delinquent juvenile complaint or an adult arrest that occurred within the three-year follow-up subsequent to the initial event. Additional measures of recidivism included the offense severity of recidivist events, as well as subsequent adjudications and convictions. Each juvenile had a three-year fixed follow-up calculated individually from the date of the event that prompted their inclusion in the sample to the end of the three-year period.
Data Sources and Enhancements Information for this report was collected from the DPS:
North Carolina Juvenile Online Information Network (NC-JOIN), the DACJJ’s management information system, contains data on all juveniles brought to court with delinquent and undisciplined complaints received in a juvenile court counselor office; their demographic and social history information; sample offense and disposition; and prior and subsequent involvement in the juvenile justice system.8
Client Tracking System (CTS) and NCALLIES (A Local Link to Improve Effective Services), the DACJJ’s former and current management information systems, respectively, for JCPC data, include information about JCPC participants and program admissions.
State Bureau of Investigation’s (SBI) automated database, the Computerized Criminal History (CCH) system, includes information on fingerprinted adult arrests and convictions for the sample subjects.9
The final data set for this study consists of over 175 items of information (or variables) for the sample of 15,942 juveniles. A case profile was constructed for each juvenile, comprised of personal and delinquency history characteristics, the most serious current delinquent complaint, the outcome of that complaint (e.g., adjudicated, dismissed, diverted, or closed), and re-involvement with the juvenile justice system (i.e., subsequent complaints and adjudications) or criminal justice system (i.e., adult arrests and convictions).
8 The DACJJ’s NC-JOIN data that were used to determine the most serious delinquent activity alleged in the complaint (i.e., sample offense), prior delinquent complaints/adjudications, and subsequent complaints/adjudications include all felonies and misdemeanors. Data on infractions, local ordinances, and most G.S. Chapter 20 (i.e., traffic) offenses were excluded from the analysis; only the more serious traffic offenses (e.g., misdemeanor death by vehicle) were included. 9 The SBI’s CCH data were used to determine recidivist arrests and convictions in North Carolina. Recidivist arrests were defined as fingerprinted arrests that occurred after a juvenile in the sample turned 16 years old. Although North Carolina’s local law enforcement jurisdictions are required to fingerprint all felonies and only the more serious misdemeanors, most misdemeanor arrests have been consistently fingerprinted across the state. This report includes Class A1 through Class 3 misdemeanor arrests and convictions. Similar to the data analyzed from the DACJJ’s NC-JOIN, CCH data on infractions, local ordinances, and most G.S. Chapter 20 (i.e., traffic) offenses were excluded from the analysis; only the more serious traffic offenses (e.g., misdemeanor death by vehicle) were included.

8
In addition to elements included in the Sentencing Commission’s prior reports, several enhancements were made to the data provided for this sample:
For the most serious current delinquent complaint (i.e., sample offense), the offense is categorized as either a person, property, drug, or other offense.
For the overall recidivism measure (i.e., subsequent complaint or adult arrests), one-year and two-year follow-up information is reported in addition to the three-year follow-up period.
Finally, a portion of the 15,942 juvenile sample were identified as being admitted to at least one program funded by the JCPC prior to and/or subsequent to their sample entry. Information about the sample and their admission to a JCPC program is provided in the Sentencing Commission’s report, Effectiveness of Programs Funded by Juvenile Crime Prevention Councils, submitted to the North Carolina General Assembly on May 1, 2015.
Analysis and Report Outline Chapter Two provides a basic statistical profile of the juveniles whose cases were adjudicated delinquent, dismissed, diverted, or closed in North Carolina between July 1, 2010 and June 30, 2011. It also describes the sample in terms of risk and needs as determined by the Risk and Needs Assessments. Chapter Three describes the sample’s subsequent (i.e., recidivist) involvement in the juvenile and criminal justice systems during the three-year follow-up period. Finally, Chapter Four summarizes the findings of the report and offers some policy implications and conclusions.

9
CHAPTER TWO
STATISTICAL PROFILE OF THE FY 2010/11 JUVENILE SAMPLE This chapter profiles a cohort of juveniles processed through North Carolina’s juvenile justice system from July 1, 2010 through June 30, 2011. The chapter describes the sample selection process and provides a statistical profile of the juvenile sample.
Sample Selection All of the 15,942 juveniles studied in the sample were brought to the attention of the juvenile justice system with at least one delinquent complaint. Based on the first decision that was made regarding their case in FY 2010/11, they were assigned to one of four levels of involvement – juveniles with complaints that were adjudicated, dismissed, diverted, or closed.10, 11 If more than one decision or event occurred on the same day, the juvenile was assigned to a group based on the most serious event, as determined by the level of involvement in the system from a closed case (least serious) to diversion, dismissal, and adjudication (most serious). As shown in Figure 2.1, there were 5,141 juveniles in the sample whose
Figure 2.1 Juvenile Recidivism Sample
FY 2010/11Juvenile Sample
N=15,942
Dismissedn=1,954
12%
Divertedn=4,640
29%
Closedn=4,207
27%
Adjudicatedn=5,141
32%
Definitions for the Juvenile Recidivism Sample Groups
All juveniles in the sample had at least one delinquent complaint. Their assignment to a group within the sample was based on the first decision that was made regarding the complaint in their case in FY 2010/11. Adjudicated: Complaint was filed as a petition and the juvenile was adjudicated delinquent by the court. The adjudication may or may not have had a disposition entered in the time frame of the study. Dismissed: Complaint was filed as a petition and dismissed by the court during the pre-adjudicatory or adjudicatory hearing. Diverted: Complaint was diverted from court by a court counselor who developed a plan or contract for the juvenile to comply with certain conditions. Non-compliance with the plan or contract could later result in the filing of the complaint as a petition in juvenile court. Closed: Complaint was closed at intake by a court counselor, with no further action required.
10 See Appendix D for additional information about juveniles who were adjudicated and disposed and Appendix E for additional information about juveniles whose cases were diverted. 11 Overall, the average number of days from the juvenile’s delinquent complaint received to his/her sample event was 53, with a median of 25 days. Juveniles whose cases were dismissed had the longest average time between complaint received and sample event with 163 days and a median of 114 days, followed by those who were adjudicated with an average of 76 days and a median of 58 days. Juveniles whose cases were closed (with an average of 17 days and a median of 14 days) or diverted (with an average of 14 days and a median of 13 days) had the least amount of time from complaint received to sample event.
10
cases were adjudicated, 1,954 juveniles whose cases were dismissed, 4,640 juveniles whose cases were diverted, and 4,207 juveniles whose cases were closed during the sample period. The information available for all four sample groups included basic demographic data, delinquency history, most serious offense alleged in the complaint, and risk and needs assessments.
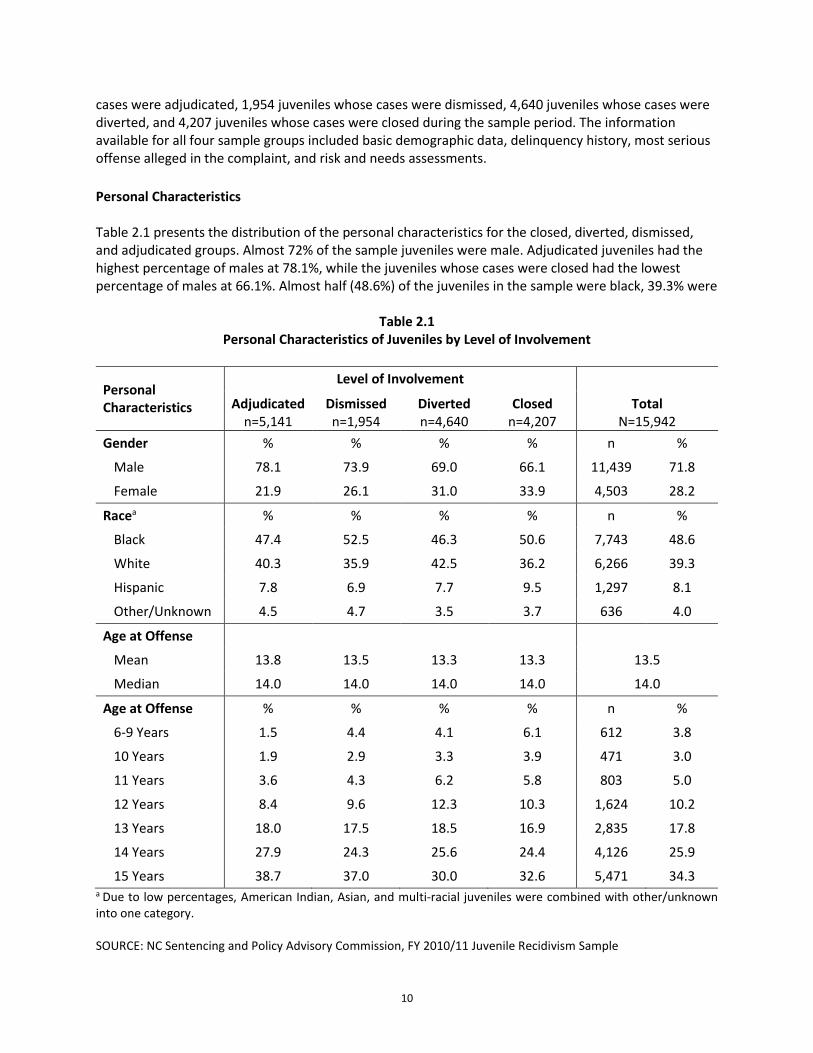
Personal Characteristics Table 2.1 presents the distribution of the personal characteristics for the closed, diverted, dismissed, and adjudicated groups. Almost 72% of the sample juveniles were male. Adjudicated juveniles had the highest percentage of males at 78.1%, while the juveniles whose cases were closed had the lowest percentage of males at 66.1%. Almost half (48.6%) of the juveniles in the sample were black, 39.3% were
Table 2.1 Personal Characteristics of Juveniles by Level of Involvement
Personal Characteristics
Level of Involvement
Total N=15,942
Adjudicated n=5,141
Dismissed n=1,954
Diverted n=4,640
Closed n=4,207
Gender % % % % n %
Male 78.1 73.9 69.0 66.1 11,439 71.8
Female 21.9 26.1 31.0 33.9 4,503 28.2
Racea % % % % n %
Black 47.4 52.5 46.3 50.6 7,743 48.6
White 40.3 35.9 42.5 36.2 6,266 39.3
Hispanic 7.8 6.9 7.7 9.5 1,297 8.1
Other/Unknown 4.5 4.7 3.5 3.7 636 4.0
Age at Offense
Mean 13.8 13.5 13.3 13.3 13.5
Median 14.0 14.0 14.0 14.0 14.0
Age at Offense % % % % n %
6-9 Years 1.5 4.4 4.1 6.1 612 3.8
10 Years 1.9 2.9 3.3 3.9 471 3.0
11 Years 3.6 4.3 6.2 5.8 803 5.0
12 Years 8.4 9.6 12.3 10.3 1,624 10.2
13 Years 18.0 17.5 18.5 16.9 2,835 17.8
14 Years 27.9 24.3 25.6 24.4 4,126 25.9
15 Years 38.7 37.0 30.0 32.6 5,471 34.3 a Due to low percentages, American Indian, Asian, and multi-racial juveniles were combined with other/unknown into one category. SOURCE: NC Sentencing and Policy Advisory Commission, FY 2010/11 Juvenile Recidivism Sample

11
white, 8.1% were Hispanic, and 4.0% were identified as other or unknown. The dismissed group had the highest percent of black juveniles (52.5%), while the diverted group had the lowest percent (46.3%). At the time of their alleged delinquent act, the juveniles’ mean age was 13.5 years, with a median of 14.0 years. The majority of juveniles (60.2%) were 14 or 15 years old when the offense occurred. The adjudicated group had a slightly lower proportion of juveniles nine years or younger and a higher proportion of juveniles 14 years and older.
Delinquency History It is important to look at whether or not juveniles in the sample had contact with the juvenile justice system prior to their entry into the sample to gain an understanding of the juveniles’ frequency of interaction with the system. Table 2.2 contains information on the sample’s prior delinquent complaints by age and level of current involvement.12 Overall, 30.9% of the juveniles had at least one delinquent complaint prior to sample entry. Fifty-four percent of the adjudicated juveniles, the highest percentage compared to the other groups, had at least one prior complaint; 42.2% of the dismissed group had a prior complaint, while the diverted and closed groups had substantially fewer juveniles with a prior complaint (14.9% and 14.7% respectively). A possible explanation for the adjudicated and dismissed groups having higher percentages of juveniles with a prior complaint than the diverted and closed groups is the relationship between juveniles having a prior complaint and having their case referred to court.
Table 2.2 Prior Complaints by Age at Sample Event and Level of Involvement
Level of Involvement
N
% Any Prior
Complaint
% Any Prior Complaint by Age at Sample Event
6-9 Years n=540
10-11 Years
n=1,148
12-13 Years
n=4,020
14-15 Years
n=9,046
16+ Years
n=1,188
Adjudicated 5,141 54.4 38.3 30.1 41.8 59.4 63.1
Dismissed 1,954 42.2 19.3 24.6 29.1 47.0 53.4
Diverted 4,640 14.9 5.7 8.4 10.3 18.7 25.2
Closed 4,207 14.7 2.9 7.1 11.2 17.8 27.3
Total 15,942 30.9 9.6 13.9 21.2 36.2 50.0
SOURCE: NC Sentencing and Policy Advisory Commission, FY 2010/11 Juvenile Recidivism Sample
To examine the length of time available for the juveniles to have prior contact with the juvenile justice system, Table 2.2 also contains the percentage of juveniles with at least one prior contact by the age at sample event. As expected, the younger juveniles, six to nine years at sample event, had fewer prior complaints filed (9.6%) compared to the older juveniles – 36.2% for 14 to 15 year olds and 50.0% for those 16 years and older. Generally, this finding holds true regardless of the level of involvement. 12 For the purposes of this report, the term “prior complaint” refers to the most serious delinquent activity alleged in the complaint for the adjudicated, dismissed, diverted, or closed groups. Infractions, local ordinances, and most G.S. Chapter 20 (i.e., traffic) offenses were excluded from the analysis; only the more serious traffic offenses (e.g., misdemeanor death by vehicle) were included.

12
In addition to prior complaints, other prior juvenile justice contact measures included JCPC program admissions,13 adjudications, detention admissions, and YDC commitments.14 Figure 2.2 provides the percentage of juveniles with each type of prior juvenile justice contact by level of involvement. Adjudicated juveniles had experienced more prior contacts with the juvenile justice system than the other three groups. Overall, the diverted and closed groups had the least number of juveniles with any prior contact with the juvenile justice system. The figure does not report prior YDC commitments due to the low number of juveniles with a prior YDC commitment. Only 51 juveniles out of the 15,942 in the sample were committed to a YDC prior to sample entry – 18 of the adjudicated, 21 of the dismissed, 2 of the diverted, and 10 of the closed groups.
Figure 2.2 Prior Juvenile Justice Contacts by Level of Involvement
Note: It is not possible to determine whether a juvenile who had a prior JCPC admission was court-involved or “at-risk” at the time of program admission. Detention admissions include both pre- and post-adjudication detention. SOURCE: NC Sentencing and Policy Advisory Commission, FY 2010/11 Juvenile Recidivism Sample
13 JCPC programs serve two types of youth: those who are involved in the juvenile justice system at some level (“court-involved”) and those who display behaviors that place them “at-risk” for involvement in the juvenile justice system. It is not possible to determine whether a juvenile who had a prior JCPC admission was court-involved or at-risk at the time of program admission. JCPC programs are grouped into six broad categories based on the services provided: assessments (e.g., psychological evaluations), clinical services (e.g., counseling), residential services (e.g., temporary shelter care), restorative services (e.g., teen court, community service, mediation/conflict resolution), structured activities (e.g., interpersonal skill building), and community day programs. See the Sentencing Commission’s Effectiveness of Programs Funded by Juvenile Crime Prevention Councils reports (http://www.nccourts.org/Courts/CRS/Councils/spac/Publication/Recidivism/JuvenileRec.asp) for a more detailed description of JCPC programs. 14 Prior complaints, adjudications, and detention admissions occurred prior to the date the delinquent complaint was received that placed the juvenile in the sample. Prior JCPC admissions and YDC commitments occurred prior to the sample event (i.e., the date a decision made regarding the delinquent complaint).
54%
42%
15% 15%
31%
39% 40%
13% 12%
24%26%
20%
3%5%
13%
18%
13%
1% 1%
8%
Adjudicated Dismissed Diverted Closed Total
Prior Complaints Prior JCPC Admissions Prior Adjudications Prior Detention Admissions

13
DACJJ Supervision Almost eight percent of the 15,942 juveniles in the sample were under some type of DACJJ supervision at the time of sample entry (see Table 2.3). The adjudicated and dismissed groups, whose cases penetrated further into the juvenile justice system, were more likely to be under DACJJ supervision (15.5% and 17.7% respectively) than the juveniles who had their cases diverted or closed (0.4% and 2.3% respectively). Consistent with the findings for prior complaints, there is a relationship between those juveniles referred to court and having prior contact with the juvenile justice system (e.g., being under DACJJ supervision).
Table 2.3 Under DACJJ Supervision at the Time of Sample Entry by Level of Involvement
DACJJ Supervision at the Time of Sample Entry
Level of Involvement
Total N=15,942
Adjudicated n=5,141
Dismissed n=1,954
Diverted n=4,640
Closed n=4,207
% % % % n %
Under Supervision 15.5 17.7 0.4 2.3 1,259 7.9
Not Under Supervision 84.5 82.3 99.6 97.7 14,683 92.1
Note: DACJJ supervision includes YDC commitment, probation supervision, post-release supervision, continuation of services, protective supervision, or other situations where a court counselor provides supervision and service for a juvenile. SOURCE: NC Sentencing and Policy Advisory Commission, FY 2010/11 Juvenile Recidivism Sample
Most Serious Sample Offense A comparison of the groups with respect to their offense profile is provided in Table 2.4. The most serious offense alleged in the complaint was used to compare juveniles whose cases were closed, diverted, dismissed, or adjudicated.15,16 Eighty-eight percent of the 15,942 juveniles had a misdemeanor as their most serious sample offense. Felonies comprised 26.0% and 18.0%, respectively, of the offenses for the adjudicated and dismissed groups, but only 2.9% and 1.7%, respectively, for the diverted and closed groups. Overall, 1.6% of the sample were alleged to have committed a violent offense (felony offense Classes A through E), 16.8% a serious offense (felony offense Classes F through I and misdemeanor Class A1), and 81.6% a minor offense (misdemeanor Classes 1 through 3).17 None of the juveniles with closed or diverted cases committed violent offenses and only a small percentage committed serious offenses. These findings
15 For the purposes of this report, the term “sample offense” refers to the most serious delinquent activity alleged in the complaint for the adjudicated, dismissed, diverted, or closed groups. Infractions, local ordinances, and most G.S. Chapter 20 (i.e., traffic) offenses were excluded from the analysis; only the more serious traffic offenses (e.g., misdemeanor death by vehicle) were included. 16 See Appendix D for the adjudicated offense classification for juveniles in the adjudicated group. Forty-eight percent of the juveniles in the adjudicated group with a violent sample offense were adjudicated of either a serious or minor offense; 38.0% with a serious sample offense were adjudicated of a minor offense. 17 See Chapter One and Appendix B for a discussion of offense classifications in the Juvenile Disposition Chart.

14
reflect both legal and court counselor considerations such as continued court involvement for nondivertible and other serious felonies with further penetration in the juvenile justice system, and closing the case or seeking diversion for those juveniles with less serious offenses (especially misdemeanors).
Table 2.4 Most Serious Sample Offense by Level of Involvement
Most Serious Sample Offense
Level of Involvement
Total N=15,942
Adjudicated n=5,141
Dismissed n=1,954
Diverted n=4,640
Closed n=4,207
% % % % n %
Offense Type
Felony 26.0 18.0 2.9 1.7 1,890 11.9
Misdemeanor 74.0 82.0 97.1 98.3 14,052 88.1
Offense Classification
Violent Class A-E Felonies
3.9 3.2 0.0 0.0 261 1.6
Serious Class F-I Felonies Class A1 Misd.
31.1 23.2 8.2 5.6 2,670 16.8
Minor Class 1-3 Misd.
65.0 73.6 91.8 94.4 13,011 81.6
SOURCE: NC Sentencing and Policy Advisory Commission, FY 2010/11 Juvenile Recidivism Sample
Juveniles’ most serious sample offenses were grouped into four crime categories: person, property, drug, and other. A person offense is defined as an offense involving force or threat of force. A property offense is defined as a violation of criminal laws pertaining to property. A drug offense is defined as a violation of laws pertaining to controlled substances. Offenses categorized as other include those that do not fall into one of the other three categories. The most common offenses in the other category were weapons on educational property, resisting public officer, and consume any alcoholic beverage by a person less than 21 years old. Overall, the most common type of sample offense, regardless of whether it was a felony or misdemeanor, was property (39.6%), followed by person (38.5%), other (12.4%), and drug (9.5%). (See Table 2.5.) Table 2.5 examines the distribution of the juveniles’ sample offense by offense classification and crime category. The majority of juveniles committed a minor property (32.7%) or person (29.2%) offense (Class 1 through 3 misdemeanors). Larceny, disorderly conduct at school, and injury to real property offenses were the most common property offenses, while simple assault and simple affray offenses were the most common person offenses. For juveniles having a serious offense classification (felony offense Classes F through I and misdemeanor Class A1), person offenses (7.8%) were the most common, including assault on a government official/employee, sexual battery, or assault inflicting serious injury – primarily Class A1 misdemeanors.

15
Less than 2% of the juveniles had a violent offense classification (felony offense Classes A through E), with the most common person offenses being robbery with a dangerous weapon and second degree sexual offense.
Table 2.5 Most Serious Sample Offense by Offense Class and Crime Category
Offense Classification
Crime Category
Total Person n=6,139
Property n=6,318
Drug n=1,511
Other n=1,974
% % % % n %
Violent Class A-E Felonies
1.5 0.1 0.0 0.0 261 1.6
Serious Class F-I Felonies Class A1 Misd.
7.8 6.8 1.7 0.4 2,670 16.8
Minor Class 1-3 Misd.
29.2 32.7 7.8 11.9 13,011 81.6
Total 38.5 39.6 9.5 12.4 15,942 100.0
SOURCE: NC Sentencing and Policy Advisory Commission, FY 2010/11 Juvenile Recidivism Sample
Risk and Needs Assessments The DACJJ staff administers risk and needs assessments to all juveniles to assess the risk of future delinquency and to determine the individual needs of the juvenile during the intake process.18 Table 2.6 lists select results of the assessments for the four groups and for the sample as a whole. Most notable among the risk factors, 81.2% of the juveniles had school behavior problems, 30.2% had at least one prior intake referral, 15.9% had at least one prior assault, and 15.5% had parents/guardians who were unwilling or unable to provide parental supervision. In general, the adjudicated and dismissed groups had more risk factors than the diverted and closed groups. For two of the risk indicators, having a first referral before age 12 and having school behavior problems, all four groups were similar in their risk behavior.
18 See Appendix A for a copy of the North Carolina Assessment of Juvenile Risk of Future Offending and the North Carolina Assessment of Juvenile Needs instruments and for information on the number and percentage of juveniles with a risk and needs assessment for the sample. Overall, 89.8% of the juveniles had a completed risk and needs assessment. Most juveniles in the adjudicated (96.6%) and diverted (94.5%) groups had a risk and needs assessment completed. Fewer juveniles from the dismissed (77.3%) and closed (82.1%) groups had completed risk and needs assessments; therefore, some caution should be taken when interpreting the risk and needs findings for these two groups. For this report, risk and needs assessments were analyzed if the assessment was completed within a year of the date the complaint was received. Eighty-six percent of the juveniles with a risk and needs assessment had their assessment completed within 30 days. One percent of the juveniles had only a risk assessment completed, while another 1.0% had only a needs assessment completed. The risk and needs findings in this report only include the juveniles who had both risk and needs assessments completed.

16
Table 2.6 Select Risk and Needs Indicators
Risk and Needs Indicators Adjudicated
n=4,964 Dismissed n=1,510
Diverted n=4,385
Closed n=3,452
Total N=14,311
Risk Assessment % % % % %
First Referral Before Age 12 13.1 15.1 14.1 16.2 14.4
Prior Intake Referrals 50.3 40.6 16.0 15.0 30.2
Prior Adjudications 28.5 22.4 3.3 4.8 14.4
Prior Assaults 24.4 21.8 8.8 10.1 15.9
Had Run Away 14.1 10.1 4.2 3.0 8.0
Had School Behavior Problems 88.7 81.9 80.2 71.3 81.2
Parents/Guardians Unwilling/Unable to Provide Parental Supervision
26.9 20.7 8.7 5.3 15.5
Needs Assessment % % % % %
Functioning Below Academic Grade Level 13.0 11.7 6.4 4.9 8.9
Juvenile Parent Status (i.e., is a parent) 1.1 1.1 0.6 0.3 0.8
History of Victimization 21.4 17.5 11.0 8.4 14.6
Risky Sexual Behavior 9.4 6.1 2.1 1.0 4.8
Need for Mental Health Care Indicated 77.8 65.7 50.5 32.7 57.3
Basic Needs Are Not Being Met 0.4 0.6 0.0 0.0 0.2
Impaired Functioning (i.e., medical, dental, health/hygiene)
0.6 1.0 0.2 0.3 0.4
Conflict in the Home 28.8 22.8 10.0 6.4 17.0
Parent, Guardian, or Custodian has Disabilities
4.8 3.7 2.6 1.8 3.3
One or More Members of Household have Substance Abuse Problems
12.0 10.9 6.4 3.0 8.0
Indication of Family Member’s Involvement in Criminal Activity
42.4 36.8 28.5 21.6 32.5
Combined Risk and Needs Indicators % % % % %
Substance Abuse 41.2 28.9 20.4 12.4 26.6
Gang Affiliation 10.3 7.6 2.3 1.6 5.5
Negative Peer Relationships 78.0 66.0 49.3 35.2 57.6
Note: There were 1,631 juveniles with missing risk and/or needs assessments excluded from the table. SOURCE: NC Sentencing and Policy Advisory Commission, FY 2010/11 Juvenile Recidivism Sample

17
The needs assessment revealed that very few juveniles had basic needs that were not being met (0.2%). For over half of the juveniles who were assessed, mental health care was indicated as a need (57.3%). Problems related to home-life were evident, with 32.5% of the juveniles having criminality in their family, 17.0% experiencing conflict in the home, and 14.6% having some history of victimization. As seen with the risk indicators, the adjudicated and dismissed groups had more needs than the diverted and closed groups, with the adjudicated group having the highest percentage for almost all the needs indicators compared to the other groups. Combining risk and needs indicators, 26.6% of the juveniles had substance abuse problems, 57.6% had negative peer relationships, and 5.5% reported some type of gang affiliation. Again, the adjudicated group had a greater proportion of juveniles with higher risk and needs indicators compared to the other three groups. Using the assessment instruments, separate risk and needs scores were computed for each juvenile, placing the juvenile in a low, medium, or high level for both risk and needs. Table 2.7 contains the risk and needs levels for each group and for the entire sample. Overall, there were few juveniles that were high risk or high needs (4.9% and 3.0% respectively). More than two-thirds of the juveniles were low risk or low needs (75.4% and 70.4% respectively). Fewer juveniles in the adjudicated and dismissed groups were low risk and more were high risk compared to juveniles in the diverted and closed groups; the same trend was found with the needs level.
Table 2.7 Level of Involvement by Risk Level and Needs Level
Risk Level and Needs Level
Level of Involvement
Total N=14,311
Adjudicated n=4,964
Dismissed n=1,510
Diverted n=4,385
Closed n=3,452
Risk Level % % % % n %
Low 53.8 65.9 90.2 91.7 10,784 75.4
Medium 35.9 25.4 9.3 7.2 2,821 19.7
High 10.3 8.7 0.5 1.1 706 4.9
Needs Level % % % % n %
Low 46.7 62.8 82.7 92.5 10,081 70.4
Medium 47.4 32.4 16.5 6.9 3,805 26.6
High 5.9 4.8 0.8 0.6 425 3.0
Note: There were 1,631 juveniles with missing risk and/or needs assessments excluded from the table. SOURCE: NC Sentencing and Policy Advisory Commission, FY 2010/11 Juvenile Recidivism Sample

18
For assessed juveniles, Figure 2.3 examines the composition of the risk level and needs level by level of involvement. Of the juveniles assessed as being low risk, the majority (37%) were diverted. Adjudicated juveniles comprised the majority of the juveniles in the medium and high risk levels (63% and 73% respectively). Juveniles whose cases were closed represented the lowest percentage of medium risk juveniles (9%), while those who were diverted represented the lowest percentage of high risk juveniles (3%). Similar results were observed with the composition of the needs level.
Figure 2.3 Risk Level and Needs Level by Level of Involvement
Note: There were 1,631 juveniles with missing risk and/or needs assessments excluded from the figures. SOURCE: NC Sentencing and Policy Advisory Commission, FY 2010/11 Juvenile Recidivism Sample
Sixty-four percent of the juveniles scored in the lowest levels of both risk and needs (64.4%), and only a small group (1.4%) demonstrated both a high level of risk and needs. (See Table 2.8.) Seventy-five percent of the sample placed in the same level of risk and needs (as highlighted in the shaded diagonal cells of Table 2.8). Upon closer examination of the shaded cells, differences by level of involvement are observed. Among the low risk and low needs juveniles, the majority had their cases either diverted or closed (38% and 33% respectively), while among the high risk and high needs juveniles, the majority had their cases adjudicated (73%).19
19 See Table F.1 in Appendix F for the level of involvement distribution by risk level and needs level for all of the cells in Table 2.8.
25%
63%73%
9%
14%
19%
37%
14%
3%
29%
9% 5%
Low Riskn=10,784
Med. Riskn=2,821
High Riskn=706
Risk Assessment
Adjudicated Dismissed Diverted Closed
23%
62%69%
9%
13%
17%
36%
19%9%
32%
6% 5%
Low Needsn=10,081
Med. Needsn=3,805
High Needsn=425
Needs Assessment
Adjudicated Dismissed Diverted Closed

19
Table 2.8 Risk Level by Needs Level
Risk Level Needs Level Number/Percent
by Risk Level Low Medium High
Low 9,210 64.4%
1,531 10.7%
43 0.3%
10,784 75.4%
Medium 819
5.7% 1,812 12.7%
190 1.3%
2,821 19.7%
High 52
0.3% 462
3.2% 192
1.4% 706
4.9%
Number/Percent by Needs Level
10,081 70.4%
3,805 26.6%
425 3.0%
14,311 100.0%
Note: There were 1,631 juveniles with missing risk and/or needs assessments excluded from the table. SOURCE: NC Sentencing and Policy Advisory Commission, FY 2010/11 Juvenile Recidivism Sample
Chapter Summary Chapter Two introduced the juvenile delinquent sample selected to be studied and provided a descriptive profile of the entire sample and by their current level of involvement in the juvenile justice system. Summarized information included personal characteristics, delinquency history, sample offense, and risk and needs assessments. These descriptive data provide the foundation for Chapter Three, which examines the recidivism of the juvenile sample and identifies correlations between their probability of reoffending and their personal and systemic characteristics. The following bulleted items highlight the relevant information and key findings in Chapter Two:
The 15,942 juveniles comprising the FY 2010/11 sample were grouped based on their level of involvement in the juvenile justice system. The four levels, ranked from most to least serious, included juveniles whose cases were either adjudicated (n=5,141), dismissed (n=1,954), diverted (n=4,640), or closed (n=4,207).
Of the sample juveniles, 71.8% were male, 48.6% were black, and the mean age was 13.5 years.
Thirty-one percent of the juveniles had at least one delinquent complaint prior to sample entry.
Juveniles adjudicated had the highest percentage of prior complaints (54%) compared to the other three groups. As expected, examination of the juvenile’s age at sample entry and prior delinquent history revealed that older juveniles (14 years and older) had higher percentages of prior delinquent complaints than younger juveniles.
Most juveniles (88.1%) had a misdemeanor as their most serious sample offense. Few juveniles
were alleged to have committed a violent offense (1.6%) or a serious offense (16.8%); the majority were alleged to have committed a minor offense (81.6%). Juveniles’ most frequent crime categories were property (39.6%) and person (38.5%) offenses.

20
Few juveniles were assessed as being high risk (4.9%) or high needs (3.0%). Most were low risk (75.5%) or low needs (70.3%). For the assessed juveniles, the adjudicated group comprised the majority of medium and high risk as well as the medium and high needs juveniles, while the diverted and closed groups comprised the majority of low risk and low needs juveniles.
The next chapter provides the recidivism results for the FY 2010/11 juvenile sample.

21
CHAPTER THREE
RECIDIVISM IN THE JUVENILE JUSTICE AND CRIMINAL JUSTICE SYSTEMS Juveniles in the FY 2010/11 sample were tracked in the juvenile justice system and/or the adult criminal justice system to determine whether they reoffended during the three-year follow-up. The primary measures of recidivism for this study were delinquent juvenile complaints and fingerprinted adult arrests that occurred subsequent to the FY 2010/11 event placing the juvenile in the sample.
Follow-Up Period and Time at Risk Each juvenile in the sample was followed for a period of three years to determine whether subsequent involvement with the juvenile justice or adult criminal justice systems occurred. The follow-up period was calculated individually by using the date a decision (e.g., diversion, adjudication) was reached in the juvenile’s case as the starting point. Given that the age of adult jurisdiction in North Carolina is 16 years, a large number of juveniles in the FY 2010/11 sample reached the age of criminal responsibility during the three-year follow-up. Most juveniles (73%) spent at least a portion of the three-year follow-up under both juvenile and adult jurisdiction (see Figure 3.1). Another 20% of the juveniles remained solely under the jurisdiction of the juvenile justice system for the entire three-year period and were never under adult jurisdiction. A smaller portion of the juveniles (7%) had already turned 16 years old at sample entry and were under adult jurisdiction for their entire three-year follow-up. As expected, the percentage of juveniles aging into the adult system increased during each year of the follow-up period – 40% during year one, 64% during year two, and 80% during year three.
Figure 3.1 Age of Legal Jurisdiction and the FY 2010/11 Sample during the Three-Year Follow-Up
SOURCE: NC Sentencing and Policy Advisory Commission, FY 2010/11 Juvenile Recidivism Sample
In examining recidivism as an overall measure, each juvenile – whether under juvenile or adult jurisdiction – was followed for a three-year period for any new encounter (complaint, arrest, or both). A separate measure of subsequent juvenile complaints was examined for those sample subjects who were
Juvenile Justice System
Age 6 - Age 15
Adult Criminal Justice System
Age 16 +
20% of the juveniles were under juvenile jurisdiction only and never aged into the adult system
73% of juveniles were under both juvenile and adult jurisdictions
7% of the juveniles were 16 years old at sample event and were under adult jurisdiction only

22
under juvenile jurisdiction at least some of the time, while a measure of adult arrests was computed for those sample subjects who were under adult jurisdiction at least some of the time. Figure 3.2 provides information on the sample’s time at risk of recidivism under juvenile jurisdiction and under adult jurisdiction during the three-year follow-up. Overall, the sample was at risk under juvenile jurisdiction for an average of 17.9 months and at risk under adult jurisdiction for an average of 18.1 months, each accounting for 50% of the total follow-up months. Based on their age distribution (see Table 2.1 in Chapter Two), juveniles whose cases were diverted or closed were younger and had a shorter average time at risk as adults (15.5 and 16.4 months respectively) than juveniles whose cases were adjudicated or dismissed (20.7 and 20.8 months respectively).
Figure 3.2 Average Number and Percentage of Follow-Up Months under Juvenile and Adult Jurisdictions
SOURCE: NC Sentencing and Policy Advisory Commission, FY 2010/11 Juvenile Recidivism Sample
A fixed follow-up period was used in an attempt to obtain the same “window of opportunity” for each juvenile to reoffend. However, in actuality, the window of opportunity was not necessarily similar for each sample subject – some may have been admitted to a detention center or committed to a YDC in the juvenile justice system, while others may have been incarcerated in local jails or in prison in the adult criminal justice system.
Juvenile and Adult Recidivism Subsequent delinquent complaints (also referred to as “subsequent complaints”) were used as the primary measure for juvenile recidivism, supplemented with information on subsequent adjudications
17.9 Months (50%)
19.6 Months (54%)
20.5 Months (57%)
15.2 Month (42%)
15.3 Months (43%)
18.1 Months (50%)
16.4 Months (46%)
15.5 Months (43%)
20.8 Months (58%)
20.7 Months (57%)
Total
Closed
Diverted
Dismissed
Adjudicated
Months/Percentage under Juvenile Jurisdicion Months/Percentage under Adult Jurisdiction

23
that resulted from those recidivist complaints.20 A subsequent delinquent complaint had to occur after the start date of the three-year follow-up period, and the juvenile must have committed the alleged offense before age 16 in order for the complaint to be considered recidivism. Subsequent adjudications resulting from those complaints also had to conform to those time constraints in the follow-up.21 In addition, juveniles had to be at risk in the juvenile justice system; therefore, 1,188 juveniles were excluded from the juvenile recidivism analysis because they had already aged out of the juvenile justice system at the start of the follow-up. Arrests were used as the primary measure for adult recidivism, supplemented with information on convictions.22 In order to be counted as recidivism, adult arrests had to occur within the three-year follow-up and the date of arrest had to occur after the juvenile turned 16 years old.23 Convictions were defined similarly, and the arrest leading to the conviction also must have occurred in the follow-up period. In addition, juveniles had to be at risk in the adult criminal justice system; therefore, 3,143 juveniles were excluded from the adult recidivism analysis because they were under juvenile jurisdiction for the entire follow-up period. Finally, a combined measure of subsequent juvenile complaints and/or adult arrests was compiled to indicate any recidivist involvement in either system, which was supplemented by a similar measure for subsequent juvenile adjudications and/or adult convictions.24 All 15,942 sample juveniles were included in analyzing overall recidivism.
Subsequent Juvenile Complaints and Adult Arrests Table 3.1 presents the three primary measures of recidivism for the entire sample and the four groups.25 Of the 15,942 juveniles in the sample, 42.0% had a subsequent juvenile complaint and/or adult arrest (“overall recidivism”). Of those juveniles under juvenile jurisdiction during follow-up (n=14,754), 33.0% had a subsequent delinquent complaint. Of those juveniles under adult jurisdiction during follow-up (n=12,799), 22.9% had an adult arrest. The further a juvenile was processed in the juvenile justice system, the more likely that juvenile was to recidivate, with the overall recidivism rates ranging from 31.5% for the group with a closed complaint to 52.8% for the adjudicated group.
20 The DACJJ’s NC-JOIN data, which are used to determine subsequent complaints/adjudications, include all felonies and misdemeanors. Data on infractions, local ordinances, and most G.S. Chapter 20 (i.e., traffic) offenses were excluded from the analysis; only the more serious traffic offenses (e.g., misdemeanor death by vehicle) were included. 21 Throughout the report, the term “subsequent adjudications” is used. This term refers to adjudications during the three-year follow-up for juveniles who have no prior adjudications, as well as for those who have prior adjudications. 22 The SBI’s CCH data were used to determine recidivist arrests and convictions in North Carolina. Although North Carolina’s local law enforcement jurisdictions are required to fingerprint all felonies and only the more serious misdemeanors, most misdemeanor arrests have been consistently fingerprinted across the state. This report includes Class A1 through Class 3 misdemeanor arrests and convictions. Similar to the data analyzed from the DACJJ’s NC-JOIN, CCH data on infractions, local ordinances, and most G.S. Chapter 20 (i.e., traffic) offenses were excluded from the analysis; only the more serious traffic offenses (e.g., misdemeanor death by vehicle) were included. 23 Although the adult arrests had to occur within the three-year follow-up, the date that the alleged offense occurred could have been prior to the follow-up period. 24 Tables referring to only juvenile recidivism, or only adult recidivism, state so specifically. Otherwise, the terms “recidivism” or “overall recidivism” in this report refer to having a subsequent delinquent juvenile complaint, an adult arrest, or both. Whether a juvenile had one or more subsequent complaints and/or adult arrests, the juvenile will be counted as a recidivist. This also applies to overall recidivism rates for subsequent adjudications and/or convictions. 25 See Appendix D for additional recidivism rates of juveniles who were adjudicated and disposed; see Appendix E for additional recidivism rates of juveniles whose cases were diverted.

24
Table 3.1 Recidivism Rates for Juvenile Complaints and Adult Arrests by Level of Involvement during the Three-Year Follow-Up
Level of Involvement
Subsequent Complaints
Adult Arrests
Overall Recidivism
n % n % N %
Adjudicated 4,640 40.9 4,513 29.5 5,141 52.8
Dismissed 1,598 34.3 1,642 27.7 1,954 43.8
Diverted 4,529 31.7 3,489 17.0 4,640 38.8
Closed 3,987 24.9 3,155 17.4 4,207 31.5
Total 14,754 33.0 12,799 22.9 15,942 42.0
SOURCE: NC Sentencing and Policy Advisory Commission, FY 2010/11 Juvenile Recidivism Sample
Table 3.2 provides information on the total number of recidivist events for those juveniles who had a subsequent juvenile complaint, an adult arrest, or both during the follow-up period.26 The 6,695 juveniles with any recidivism accounted for a total of 16,741 recidivist events. The adjudicated group accounted for the highest volume of subsequent complaints and/or adult arrests at 7,191. Table 3.2 also includes information on the mean number of recidivist events. For those juveniles who reoffended, the average number of recidivist events was 2.5. The adjudicated and dismissed groups had a higher average number of recidivist events (both at 2.6) than the diverted or closed groups (2.3 and 2.4 respectively). Table 3.3 examines overall recidivism rates by level of involvement (i.e., adjudicated, dismissed, diverted, closed) for each year of the three-year follow-up period. Overall, 25.6% of the sample had at least one subsequent delinquent complaint and/or arrest during the one-year follow-up, 36.0% during the two-year follow-up, and 42.0% during the three-year follow-up. For those juveniles with at least one subsequent delinquent complaint and/or arrest, the first recidivist event occurred an average of 11.4 months after the beginning of their follow-up. The adjudicated and dismissed groups tended to recidivate somewhat earlier (an average of 10.6 months and 11.4 months respectively) than the juveniles whose cases were diverted or closed (an average of 12.1 months and 12.0 months respectively). Of the 6,695 juveniles with a recidivist event, 30.3% (or n=2,031) recidivated within three months. It should also be noted that a number of juveniles spent some portion of that “time at risk” under some form of supervision in the community or in confinement.
26 In calculating total number of recidivist events, only one subsequent complaint and only one adult arrest were counted per day if multiple complaints or arrests occurred on the same day.

Table 3.2 Recidivist Events by Level of Involvement during the Three-Year Follow-Up
Level of Involvement
Total Number and Average Number of Recidivist Events
Subsequent Complaints n=14,754
Adult Arrests
n=12,799
Overall Recidivism N=15,942
# of Juveniles with Any
Complaint # of
Complaints Avg. # of
Complaints
# of Juveniles with Any
Arrest # of
Arrests Avg. # of Arrests
# of Juveniles with Any
Complaint or Arrest
# of Complaints
and/or Arrests
Avg. # of Complaints
and/or Arrests
Adjudicated 1,896 4,253 2.2 1,330 2,938 2.2 2,716 7,191 2.6
Dismissed 548 1,204 2.2 454 1,058 2.3 856 2,262 2.6
Diverted 1,435 3,020 2.1 594 1,038 1.7 1,798 4,058 2.3
Closed 993 2,122 2.1 548 1,108 2.0 1,325 3,230 2.4
Total 4,872 10,599 2.2 2,926 6,142 2.1 6,695 16,741 2.5
SOURCE: NC Sentencing and Policy Advisory Commission, FY 2010/11 Juvenile Recidivism Sample
25

26
Table 3.3 Overall Recidivism Rates by Level of Involvement for Each Year of Follow-Up
Level of Involvement
N
Months to First
Recidivist Event
% Overall Recidivism
One-Year Follow-up
Two-Year Follow-up
Three-Year Follow-up
Adjudicated 5,141 10.6 34.1 46.1 52.8
Dismissed 1,954 11.4 26.4 37.9 43.8
Diverted 4,640 12.1 22.8 32.7 38.8
Closed 4,207 12.0 18.0 26.5 31.5
Total 15,942 11.4 25.6 36.0 42.0
SOURCE: NC Sentencing and Policy Advisory Commission, FY 2010/11 Juvenile Recidivism Sample
Subsequent Juvenile Adjudications and Adult Convictions Table 3.4 details subsequent adjudication and conviction rates for the four sample groups. As expected, adjudication/conviction rates were lower than complaint/arrest rates for two reasons: due to cases being closed or dismissed and due to a time lag between initial processing and court action with the case possibly falling outside the follow-up period. Adjudication/conviction rates followed patterns similar to complaint/arrest rates – the more serious the level of involvement in the juvenile justice system, the higher the rate of subsequent adjudications/convictions. Of those juveniles under juvenile jurisdiction during follow-up (n=14,754), 21.7% had a subsequent adjudication. Of those juveniles under adult jurisdiction during follow-up (n=12,799), 8.9% had an adult conviction. The combined recidivist adjudication/conviction rate for the sample was 25.4%, with the adjudicated group having the highest recidivism rates (36.0%) and the closed group having the lowest recidivism rates (16.0%).
Table 3.4 Recidivism Rates for Juvenile Adjudications and Adult Convictions
by Level of Involvement during the Three-Year Follow-Up
Level of Involvement
Subsequent Adjudications
Adult Convictions
Adjudications and/or Convictions
n % n % N %
Adjudicated 4,640 30.8 4,513 12.9 5,141 36.0
Dismissed 1,598 22.0 1,642 12.1 1,954 26.4
Diverted 4,529 19.6 3,489 5.0 4,640 21.7
Closed 3,987 13.3 3,155 6.0 4,207 16.0
Total 14,754 21.7 12,799 8.9 15,942 25.4
SOURCE: NC Sentencing and Policy Advisory Commission, FY 2010/11 Juvenile Recidivism Sample

27
Personal Characteristics and Recidivism Table 3.5 provides recidivism rates during the three-year follow-up by the juvenile’s personal characteristics: gender, race, and age at the time of the sample offense.27 Overall, males had higher recidivism rates than females (46.1% and 31.7% respectively). Black juveniles had the highest recidivism rates at 48.6%, followed by juveniles identifying as other or unknown (41.7%), white juveniles (35.3%), and Hispanic juveniles (35.2%). The youngest juveniles, aged six to nine, had the lowest recidivism rates at 21.1%. Juveniles aged 13 and 14 had the highest recidivism rates (49.0% and 45.0% respectively), but rates declined considerably for 15 year olds (to 38.8%). Generally, similar patterns were found by level of involvement.
Table 3.5 Recidivism Rates by Personal Characteristics of Juveniles and Level of Involvement
during the Three-Year Follow-Up
Personal Characteristics
Level of Involvement
Total Adjudicated
n=5,141 Dismissed n=1,954
Diverted n=4,640
Closed n=4,207
Gender % % % % n %
Male 55.4 47.5 42.2 36.4 11,439 46.1
Female 43.7 33.5 31.1 22.0 4,503 31.7
Racea % % % % n %
Black 62.0 48.5 45.0 36.9 7,743 48.6
White 43.4 38.2 32.4 26.7 6,266 35.3
Hispanic 45.9 32.1 38.3 22.6 1,297 35.2
Other/Unknown 52.6 51.1 33.3 28.4 636 41.7
Age at Offense % % % % n %
6-9 Years 36.4 19.5 24.6 14.4 612 21.1
10 Years 40.2 25.0 31.8 27.4 471 31.2
11 Years 51.9 48.8 38.8 32.2 803 40.9
12 Years 56.3 49.5 41.3 35.0 1,624 44.5
13 Years 58.6 50.7 47.3 37.8 2,835 49.0
14 Years 55.9 46.6 42.2 32.3 4,126 45.0
15 Years 48.5 41.0 32.2 30.1 5,471 38.8
Total 52.8 43.8 38.8 31.5 15,942 42.0 a Due to low percentages, American Indian, Asian, and multi-racial juveniles were combined with other/unknown into one category. SOURCE: NC Sentencing and Policy Advisory Commission, FY 2010/11 Juvenile Recidivism Sample
27 See Table 2.1 in Chapter Two for further details of the sample’s personal characteristics.

28
Prior Complaints and Recidivism Overall, 30.9% (n=4,932) of the juveniles had at least one prior delinquent complaint before entry into the sample.28 Table 3.6 examines recidivism rates for juveniles with at least one prior complaint in comparison to juveniles with no prior complaint before sample entry. Nearly 60% of the juveniles with at least one prior complaint had a subsequent complaint or adult arrests compared to 34.0% of juveniles with no prior complaint.
Table 3.6 Recidivism Rates by Prior Complaints and Level of Involvement during the Three-Year Follow-Up
Level of Involvement
Recidivism Rates for Juveniles with:
Overall Recidivism
No Prior Complaint
At Least One Prior Complaint
n % n % N %
Adjudicated 2,345 42.1 2,796 61.9 5,141 52.8
Dismissed 1,130 33.3 824 58.3 1,954 43.8
Diverted 3,947 36.0 693 54.7 4,640 38.8
Closed 3,588 27.0 619 57.8 4,207 31.5
Total 11,010 34.0 4,932 59.8 15,942 42.0
SOURCE: NC Sentencing and Policy Advisory Commission, FY 2010/11 Juvenile Recidivism Sample
Sample Offense29 and Recidivism While the most serious sample offense for the majority of juveniles at all levels of involvement was a misdemeanor, the relative percentage of felony offenses was higher for the dismissed and adjudicated groups (18.0% and 26.0% respectively) than for the diverted and closed groups (2.9% and 1.7% respectively). These findings reflect both legal and court counselor considerations such as continued court involvement for nondivertible offenses30 and other serious felonies with further penetration in the juvenile justice system, and closing the case or seeking diversion for those juveniles with less serious offenses (primarily misdemeanors).31 Overall, juveniles with a felony as their most serious sample offense were slightly more likely to recidivate than those with a misdemeanor – 44.3% and 41.7% respectively. Recidivism rates by crime category (i.e., person, property, drug, other) based on the categorization of the sample offense were also examined. Juveniles with a property offense had the
28 This analysis excludes the delinquent complaint that placed the juvenile in the sample. It should be noted that not all juveniles had equal amounts of time to accrue prior complaints. The percentage of juveniles with at least one prior complaint by group are as follows: adjudicated at 54.4%, dismissed at 42.2%, diverted at 14.9%, and closed at 14.7%. 29 As a reminder, the term “sample offense” refers to the most serious delinquent activity alleged in the complaint for the adjudicated, dismissed, diverted, or closed groups. Infractions, local ordinances, and most G.S. Chapter 20 (i.e., traffic) offenses were excluded from the analysis; only the more serious traffic offenses (e.g., misdemeanor death by vehicle) were included. 30 Nondivertible offenses are defined in G.S. 7B-1701 as murder, first- or second-degree rape, first- or second-degree sexual offense, arson, felony drug offense under Article 5 of G.S. Chapter 90, first-degree burglary, crime against nature, or a felony involving the willful infliction of serious bodily injury or which was committed by use of a deadly weapon. 31 See Table 2.4 in Chapter Two.

29
highest recidivism rates (45.3%), followed by juveniles with a drug offense (42.2%), a person offense (40.9%), and other offense (34.8%).32 A comparison of the sample offense and subsequent recidivist offense is provided in Table 3.7 for the 6,695 juveniles with any recidivism. Within the three-year follow-up, juveniles with a sample felony offense were more likely (66.2%) to have a felony offense as their most serious subsequent offense. Similarly, juveniles who had a sample misdemeanor offense were more likely (59.4%) to have a misdemeanor offense as their most serious subsequent offense. It should also be noted that, overall, of those with one or more recidivist event during the follow-up, 56.2% recidivated with a misdemeanor. As expected, adjudicated and dismissed groups were more likely to have a subsequent felony complaint or adult arrest (51.1% and 49.8% respectively) than juveniles whose cases were diverted or closed (34.9% and 37.3% respectively).
Table 3.7 Most Serious Recidivist Offense by Most Serious Sample Offense during the Three-Year Follow-Up
Sample Offense
N
Most Serious Recidivist Offense
% Total % Felony % Misdemeanor
n=2,935 n=3,760 N=6,695
Felony 837 66.2 33.8 12.5
Misdemeanor 5,858 40.6 59.4 87.5
Total 6,695 43.8 56.2 100.0
SOURCE: NC Sentencing and Policy Advisory Commission, FY 2010/11 Juvenile Recidivism Sample
Risk/Needs Levels and Recidivism Based on risk and needs assessments administered to 89.8% (or n=14,311) of the sample, the majority of juveniles were assessed as low risk (75.3%) and as low needs (70.4%) with few juveniles determined to be either high risk (4.9%) or high needs (3.0%).33 Table 3.8 explores the relationship between the juvenile’s risk and needs levels and their recidivism rates. As expected, low risk juveniles had the lowest recidivism rates (36.5%) compared to medium and high risk juveniles (60.3% and 71.8% respectively), with the gap between the recidivism rates of the medium and high risk juveniles being smaller than the gap between the recidivism rates of low and medium risk juveniles. Similar findings in the recidivism rates were seen when examining the relationship between needs level and subsequent complaints and/or adult arrests. While Table 3.8 examined recidivism separately by risk level and needs level, Table 3.9 provides recidivism rates for juveniles with each combination of risk and needs levels. Juveniles who were both low risk and low needs had the lowest recidivism rates at 34.3% and were primarily from the groups
32 See Chapter Two for a description of the crime categories as well as the distribution of the crime categories for the sample. 33 See Chapter Two for a more detailed description of the risk and needs assessments and Appendix A for a copy of the risk and needs assessment tools.
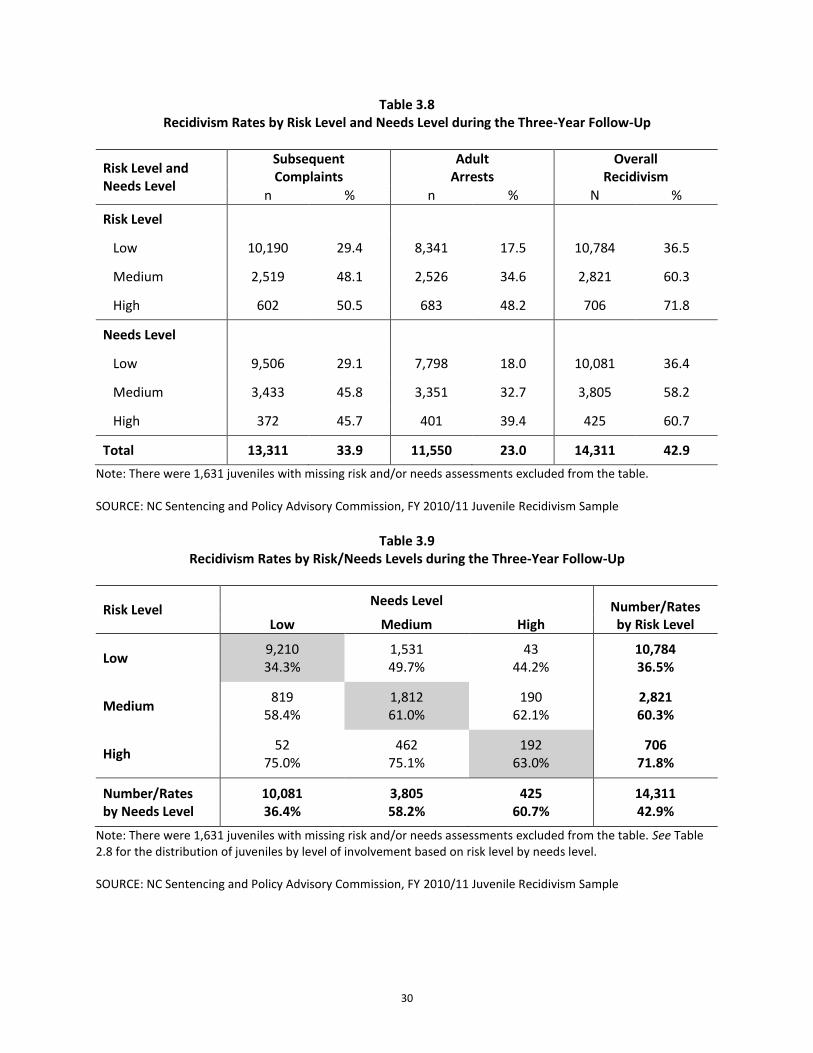
30
Table 3.8 Recidivism Rates by Risk Level and Needs Level during the Three-Year Follow-Up
Risk Level and Needs Level
Subsequent Complaints
Adult Arrests
Overall Recidivism
n % n % N %
Risk Level
Low 10,190 29.4 8,341 17.5 10,784 36.5
Medium 2,519 48.1 2,526 34.6 2,821 60.3
High 602 50.5 683 48.2 706 71.8
Needs Level
Low 9,506 29.1 7,798 18.0 10,081 36.4
Medium 3,433 45.8 3,351 32.7 3,805 58.2
High 372 45.7 401 39.4 425 60.7
Total 13,311 33.9 11,550 23.0 14,311 42.9
Note: There were 1,631 juveniles with missing risk and/or needs assessments excluded from the table. SOURCE: NC Sentencing and Policy Advisory Commission, FY 2010/11 Juvenile Recidivism Sample
Table 3.9
Recidivism Rates by Risk/Needs Levels during the Three-Year Follow-Up
Risk Level Needs Level Number/Rates
by Risk Level Low Medium High
Low 9,210 34.3%
1,531 49.7%
43 44.2%
10,784 36.5%
Medium 819
58.4% 1,812 61.0%
190 62.1%
2,821 60.3%
High 52
75.0% 462
75.1% 192
63.0% 706
71.8%
Number/Rates by Needs Level
10,081 36.4%
3,805 58.2%
425 60.7%
14,311 42.9%
Note: There were 1,631 juveniles with missing risk and/or needs assessments excluded from the table. See Table 2.8 for the distribution of juveniles by level of involvement based on risk level by needs level. SOURCE: NC Sentencing and Policy Advisory Commission, FY 2010/11 Juvenile Recidivism Sample

31
with closed or diverted cases. Beyond that, recidivism rates seemed to track more closely to a juvenile’s risk level. The rates for juveniles at medium risk were all between 58.4%-62.1%, independent of their needs levels. Similarly, the rates for juveniles at high risk were all between 63.0%-75.1% (the highest rates overall) independent of their needs levels. Most of these high risk juveniles were adjudicated, had a higher percentage of felony offenses, and a higher probability of confinement.34 Information on the recidivism rates and the combined indicators from the risk and needs assessment tools – substance abuse, gang affiliation (whether as a gang member or as an associate of a gang member), and peer relationships – is included in Table 3.10. Juveniles with substance abuse, gang affiliation, and negative peer influence had higher recidivism rates (54.0%, 65.2%, and 50.6% respectively) compared to their counterparts (no substance abuse, no gang affiliation, and positive peer influence). Similar results were found when examined by level of involvement.
Table 3.10 Recidivism Rates by Combined Risk and Needs Indicators by Level of Involvement
during the Three-Year Follow-Up
Combined Risk and Needs Indicators
Level of Involvement
Total N=14,311
Adjudicated n=4,964
Dismissed n=1,510
Diverted n=4,385
Closed n=3,452
% % % % n %
Substance Abuse
No 49.4 40.5 36.9 30.6 10,503 38.9
Yes 58.2 56.0 47.8 45.0 3,808 54.0
Gang Affiliation
No 51.5 43.3 38.6 31.8 13,527 41.6
Yes 66.1 65.2 59.4 66.7 784 65.2
Peer Relationships
Positive 42.2 34.3 32.9 26.9 6,064 32.5
Negative 56.0 50.4 45.5 42.4 8,247 50.6
Note: There were 1,631 juveniles with missing risk and/or needs assessments excluded from the table. SOURCE: NC Sentencing and Policy Advisory Commission, FY 2010/11 Juvenile Recidivism Sample
Confinement to a Detention Center and/or a YDC and Adult Arrests One of the more consistent research findings links juvenile confinement to an increased probability of adult criminality. To examine this assertion, information was collected for each juvenile on admission to a detention center and commitment to a YDC at any time between the sample entry and the end of their follow-up period. Adult arrest rates are reported to provide information on recidivist activity for those juveniles confined in a DACJJ facility compared to all juveniles in the sample during the follow-up period. 34 See Table F.2 in Appendix F for the recidivism rates for juveniles with each combination of risk level and needs level by level of involvement.

32
Admission to a detention center can occur while a juvenile awaits adjudication and disposition, or it may be imposed as a condition of probation. Of the entire sample, 18.8% (n=2,999) had at least one admission to a detention center during the three-year follow-up. The adjudicated group had the highest percentage (37.8%) with an admission to a detention center, followed by the dismissed (14.4%), diverted (10.1%), and closed (7.3%) groups. Commitment to a YDC is the most severe sanction available in the juvenile justice system for juveniles who are adjudicated delinquent. Of the juveniles in the sample, 3.0% (n=481) had one or more commitments to a YDC during the three-year follow-up. A YDC commitment is not necessarily linked to the sample event and could have resulted either from a delinquent complaint prior to the follow-up period or from a delinquent complaint that occurred during the follow-up period. The adjudicated group had the highest rate of YDC commitments at 7.0%. The remaining groups had very few juveniles with a YDC commitment during the follow-up period – dismissed at 2.4%, diverted at 0.7%, and closed at 1.0%. Most juveniles committed to a YDC also had a detention center admission (97.1%). Table 3.11 provides adult arrest rates for the 2,598 juveniles with at least one detention center admission and/or YDC commitment (i.e., confinement) and for the 10,201 juveniles with no confinement who aged into the adult system during the three-year follow-up. Juveniles experiencing confinement in a detention center and/or a YDC during their juvenile years were more likely to have a subsequent adult arrest. Overall, 37.6% of the confined juveniles had one or more adult arrests compared to 19.2% of the juveniles who were not confined. Although juveniles with a detention center admission had higher arrest rates compared to juveniles with a YDC commitment, only 14 of the 431 juveniles with a YDC commitment did not also have a detention center admission. The lower adult arrest rate for juveniles with a YDC commitment is most likely due to the smaller window of opportunity to reoffend.
Table 3.11 Adult Arrests by Confinement to a Detention Center and/or a YDC
during the Three-Year Follow-Up
Confinement Adult Arrests
n %
Type of Confinement
Detention Center Admission 2,584 37.5
YDC Commitment 431 31.8
Any Confinement 2,598 37.6
No Confinement 10,201 19.2
Total 12,799 22.9
SOURCE: NC Sentencing and Policy Advisory Commission, FY 2010/11 Juvenile Recidivism Sample

33
Juvenile Transfers to Superior Court As mentioned in Chapter One, juveniles alleged to be delinquent with a felony offense may be transferred to the superior court for trial as adults. Of the 4,872 juveniles with any subsequent complaint, there were 29 juveniles who were transferred to adult court during the follow-up period. No information is available about findings of guilt or innocence, or dispositions, in those proceedings. However, 17.2% of the juveniles transferred to adult court had at least one or more adult arrests during follow-up compared to 22.9% of the juveniles who were not transferred to adult court during follow-up. Juveniles who were transferred to adult court may have a lower adult arrest rate due to confinement (i.e., detention center, local jail, prison).
Chapter Summary The primary purpose of the study, addressed in this chapter, is to assess the recidivism of the juvenile delinquent sample and identify correlations between their probability of reoffending and their personal and systemic characteristics. The outcome measure – recidivism – was defined in a number of ways: subsequent complaints and adult arrests (as well as subsequent adjudications and adult convictions) within the first-, second-, and third-year of follow-up; volume and type of reoffending; and lag-time to a first recidivist event, if any. Variations in recidivism rates were explored in relation to the juveniles’ gender, race, and age; their prior encounters with the juvenile justice system; their assessed levels of risk and needs; and the level of their current involvement from complaint to diversion, adjudication, and possible commitment. Forty-two percent of the 15,942 juveniles had at least one subsequent complaint or adult arrest in the three-year follow-up. Males, blacks, and juveniles aged 13-14 had higher recidivism rates, as did those with prior juvenile justice encounters and higher risk or needs scores. Finally, and consistently, the probability of reoffending increased the deeper a juvenile was involved with the system, from a closed complaint to diversion, dismissal, adjudication, and admission to a detention center or commitment to a YDC. Following is a summary list of the main points and specific findings in Chapter Three (see Figure 3.3):
Three primary recidivism measures were used: subsequent delinquent juvenile complaint, adult arrest, and a combined measure of complaint and/or arrest (i.e., overall recidivism) – with a fixed three-year follow-up period for each juvenile.
The overall recidivism rate for the sample was 42.0%. The rate of subsequent delinquent
complaint was 33.0%; the rate of adult arrest was 22.9%.
A stair-step progression of recidivism was observed among the sample groups: the adjudicated group recidivated at the highest rates and the closed group recidivated at the lowest rates.

34
Figure 3.3 Recidivism Rates by Sample Characteristics during the Three-Year Follow-Up
SOURCE: NC Sentencing and Policy Advisory Commission, FY 2010/11 Juvenile Recidivism Sample
42%
53%
44%
39%
32%
46%
32%
49%
35%
35%
42%
21%
37%
47%
41%
34%
60%
44%
42%
37%
60%
72%
36%
58%
61%
Adjudicated
Dismissed
Diverted
Closed
Male
Female
Black
White
Hispanic
Other/Unknown
6-9 Years
10-11 Years
12-13 Years
14-15 Years
None
At Least One
Felony
Misdemeanor
Low
Medium
High
Low
Medium
High
Total Recidivism Rate
Level of Involvement
Gender
Race
Age at Offense
Prior Complaints
Sample Offense Type
Risk Level
Needs Level

35
Males were more likely to have a subsequent complaint and/or adult arrest than females. Blacks had higher recidivism rates than all other race categories. There was a complex relationship between juvenile age and rates of recidivism. Recidivism rates gradually increased by age and peaked at age 13. Recidivism rates decreased slightly for 14 year olds and then declined considerably for 15 year olds.
Juveniles who had prior juvenile justice contact (i.e., delinquent complaint) before sample entry
had higher recidivism rates (59.8%) compared to juveniles with no prior juvenile justice contact (34.0%). This finding held constant for all four groups.
Sample offense type (i.e., felony or misdemeanor) and crime category (i.e., person, property,
drug, other) were linked to the rates of recidivism. Juveniles alleged to have committed a felony as their most serious sample offense were slightly more likely to recidivate than those with a misdemeanor. Recidivism rates were higher for juveniles with a property offense or a drug offense than those with a person or other offense as their most serious sample offense.
As the risk level or needs level increased in severity so did the recidivism rates. However, the
greatest increase in the recidivism rates occurred from low risk/needs level to medium risk/needs level.
Confinement as a juvenile – whether in a detention center or a YDC – increased the probability
of having an adult arrest. Chapter Four summarizes the findings of the FY 2010/11 juvenile recidivism study and offers some policy implications and conclusions.

36
CHAPTER FOUR
SUMMARY AND CONCLUSIONS During the 2005 Session, the North Carolina General Assembly expanded the Sentencing and Policy Advisory Commission’s mandate to include the preparation of biennial reports on statewide rates of juvenile recidivism. (Session Law 2005-276, Section 14.19.) This marks the fifth biennial report, submitted to the legislature on May 1, 2015. The study followed a sample of 15,942 juveniles who had a delinquent complaint processed in the juvenile justice system between July 1, 2010 and June 30, 2011 and tracked their subsequent contacts with the juvenile justice and criminal justice systems over the next three years. Juveniles with undisciplined complaints were excluded from the sample. Data on the sample were obtained from the automated databases of the DACJJ and the SBI. In line with the decisions made within the juvenile justice system, the 15,942 juveniles in the sample were categorized into one of four groups – juveniles with adjudicated (32%), dismissed (12%), diverted (29%), or closed (27%) cases. Altogether, the mean age of the sample was 13.5 years; the adjudicated juveniles were the oldest of the four groups. The sample was largely comprised of male juveniles (72%) and 49% of the juveniles were black. The events that brought the youths to the attention of the juvenile justice system in FY 2010/11 were largely misdemeanors (88%); less than 2% were charged with a violent delinquent act. Juveniles with felony or violent offense charges were predominantly in the adjudicated and dismissed groups. Thirty-one percent of the sample juveniles had at least one prior delinquent complaint and 8% percent were under some form of DACJJ supervision at the time of sample entry. Few of the juveniles were assessed as high risk or high needs; the majority of medium and high risk or needs juveniles were within the adjudicated group. Three measures of juvenile recidivism were utilized in the study: subsequent juvenile delinquent complaints, adult arrests, and a combination measure (see Figure 4.1) that captured recidivism in both the juvenile and adult systems (i.e., overall recidivism). A three-year follow-up period was calculated for
Figure 4.1 Three-Year Recidivism Rates for the FY 2010/11 Juvenile Sample
FY 2011/12 Juvenile SampleN=15,942
Subsequent Complaint: 33.0%Adult Arrest: 22.9%Overall Recidivism: 42.0%
Dismissedn=1,954
Subsequent Complaint: 34.3%Adult Arrest: 27.7%Overall Recidivism: 43.8%
Divertedn=4,640
Subsequent Complaint: 31.7%Adult Arrest: 17.0%Overall Recidivism: 38.8%
Closedn=4,207
Subsequent Complaint: 24.9%Adult Arrest: 17.4%Overall Recidivism: 31.5%
Adjudicatedn=5,141
Subsequent Complaint: 40.9%Adult Arrest: 29.5%Overall Recidivism: 52.8%
SOURCE: NC Sentencing and Policy Advisory Commission, FY 2010/11 Juvenile Recidivism Sample

37
each juvenile to measure their recidivism in either the juvenile or adult systems. The rate of subsequent delinquent complaint for the entire sample was 33%, the rate of adult arrest was 23%, and the overall recidivism rate was 42%. The highest rate of all three measures of recidivism was observed in the adjudicated group. Twenty-five percent of the juveniles also had one or more juvenile adjudications or adult convictions within the follow-up period. The 6,695 sample juveniles with any subsequent recidivism accounted for a total of 16,741 offenses (or an average of 2.5 offenses) within the three-year follow-up: 10,599 juvenile complaints and 6,142 adult arrests. When comparing the findings from this study of the FY 2010/11 sample to the Commission’s three previous studies with a three-year follow-up period,35 the recidivism rate of between 42-45% emerges for all four samples with slight increases and decreases alternating each sample year (see Table 4.1). The FY 2010/11 sample had a two percentage point decrease in the overall recidivism rate compared to the FY 2008/09 sample. This decrease in the recidivism rate appears to be an actual change in juveniles’ criminal behavior and not related to any methodological or technological changes.
Table 4.1 Juvenile Recidivism Trends
Three-Year Follow-Up
Juvenile Samples by Fiscal Year
Subsequent Complaints Adult Arrests Overall Recidivism
n % n % N %
FY 2004/05 18,754 36.7 17,011 21.4 20,236 44.8
FY 2006/07 18,818 33.6 17,151 22.8 20,364 43.0
FY 2008/09 16,308 34.4 14,700 23.7 17,660 44.0
FY 2010/11 14,754 33.0 12,799 22.9 15,942 42.0
SOURCE: NC Sentencing and Policy Advisory Commission
The differences between the recidivism rates of juveniles by their level of involvement remained stable over the four samples, with the highest rates for the adjudicated group, followed by the dismissed, diverted, and closed groups (see Table 4.2). Note an overall drop of 22% in the number of cases from FY 2006/07 to FY 2010/11. In addition, there is a decrease in the recidivism rates for three of the four groups of the FY 2010/11 sample compared to the FY 2008/09 sample, with a slight increase in the recidivism rates for the diverted group of juveniles. The findings from the overall sample indicated that juvenile recidivism was related to several factors. First, a clear relationship emerged between the level of involvement with the juvenile justice system and likelihood of recidivating. Level of involvement ranged from the least serious (a closed case) to the most serious (an adjudicated case), paralleled by recidivism rates ranging from 32% for juveniles with closed cases and 39% for juveniles diverted to 44% for juveniles dismissed and 53% for those adjudicated. In a number of ways, the data demonstrated that the deeper the involvement of the youth in the juvenile justice system, the more likely s/he was to have subsequent recidivism.
35 The first juvenile recidivism report published May 1, 2007, used a six-month sample and a two-year follow-up and is excluded from this analysis due to those differences.

38
Table 4.2 Juvenile Recidivism Trends by Level of Involvement
Three-Year Follow-Up
Level of Involvement
Juvenile Samples by Fiscal Year
FY 2004/05 FY 2006/07 FY 2008/09 FY 2010/11
N % N % N % N %
Adjudicated 7,012 55.7 6,639 53.3 5,826 57.1 5,141 52.8
Dismissed 2,409 48.0 2,413 45.7 2,117 46.4 1,954 43.8
Diverted 5,100 38.7 5,383 38.4 5,014 37.8 4,640 38.8
Closed 5,715 35.5 5,929 34.7 4,703 33.5 4,207 31.5
Total 20,236 44.8 20,364 43.0 17,660 44.0 15,942 42.0
SOURCE: NC Sentencing and Policy Advisory Commission
Youth who received the most serious and restrictive sanctions in the juvenile system – admission to a detention center or commitment to a YDC – were also considerably more likely to experience one or more arrests in the adult system. This finding, which should be interpreted with some caution, does not necessarily imply a causal relationship between deeper involvement and recidivism. The level of involvement is also a systemic response to the complicated set of circumstances, risk and needs of the juvenile, a set that is correlated with future recidivism independent of the possible effect of the youth’s juvenile justice involvement. A similar pattern was also found in the average amount of time to a first subsequent complaint or arrest. The adjudicated and dismissed groups had, on average, a shorter amount of time until their first recidivist event than the diverted and closed groups. A second finding concerned the type of sample offense and its relationship with recidivist events in the three-year follow-up period. Reviewing the severity of their recidivist offenses, 44% percent of the recidivist juveniles were charged with at least one felony during the follow-up. Furthermore, those who entered the FY 2010/11 sample with a felony were also more likely to recidivate with a felony as their most serious new offense, while those who entered the sample with a misdemeanor were more likely to recidivate with a misdemeanor as their most serious new offense. A third finding from these data demonstrated a complex relationship between age and recidivism for juveniles in the sample. Juveniles between the ages of six and nine had very low recidivism rates, those aged 10-11 showed gradually increasing rates with the highest recidivism observed for 12-13 year-olds, while ages 14-15 showed considerably decreasing rates. A possible explanation for this finding might be in the dynamic between a child’s age; school attendance and discipline; delinquency history; and the capacity of the juvenile justice system to exercise discretion. A direct relationship was also observed between the juveniles’ assessed risk and needs and their recidivism. Generally, as risk and needs levels increased, so did the recidivism rates. Particularly large increases in recidivism rates were noted between the juveniles with low and medium levels of risk and needs. Further, juveniles’ risk levels appeared to be driving differences in the recidivism rates more than their needs levels. A juvenile’s prior delinquency, a component of risk, was also directly linked to the probability of recidivism.

39
In conclusion, the study’s key finding that recidivism corresponded with the juvenile’s level of involvement in the juvenile justice system could have a bearing on policy-related issues in this system. The analyses in this report revealed that recidivism was lower when the systemic response of the juvenile justice system was less invasive, either by processing and intervening with youths short of adjudication or, if adjudicated, providing dispositions short of the most restrictive option of confinement. It is important to recognize that there are several possible explanations for this finding – the relationship is a correlation and thus precludes any determination of causality. While the depth of the system’s response may contribute to a juvenile’s probability of reoffending, another possibility is that the system’s increasingly invasive, restrictive response is elicited by the most troubled youths affected by family dynamics, psychological issues, and school problems. The explanation to recidivistic behavior, more likely, lies in some interaction of all of these factors. Whatever the reason for the relationship between deeper involvement in the juvenile justice system and recidivism, the point remains that the most efficient investment of sufficient resources is in the community, at the front-end of the juvenile justice system. Community resources are more easily accessible to juveniles and their families and have a proven track record of successfully intervening with the complex issues associated with delinquent youth. Another finding, which indicated a relationship between recidivism and age, has a related message for policy makers. If appropriate resources were targeted at the age group with the highest overall recidivism rate (juveniles aged 11-14), and at the earliest possible point of their contact with the juvenile justice system, it might affect their rate of reoffending. While there will be youths for whom the juvenile system will have no recourse but the use of the most restrictive sanction of commitment to a YDC, the majority of the youth will need – and benefit from – rehabilitative resources of a less restrictive nature. Meeting this need for community-based and evidence-based alternatives is the challenge for policy makers, juvenile justice professionals, and youth services providers as they work together to reduce reoffending behavior.

APPENDIX A
Risk and Needs

41
Risk Assessment

42

43
Needs Assessment

44

45

46

47

48
Table A.1 Juveniles with Risk and/or Needs Assessments by Level of Involvement
Level of Involvement
N
No Risk or Needs
Risk Only
Needs Only
Both Risk and Needs
n % n % n % n %
Adjudicated 5,141 94 1.8 13 0.2 70 1.4 4,964 96.6
Dismissed 1,954 401 20.5 9 0.5 34 1.7 1,510 77.3
Diverted 4,640 186 4.0 51 1.1 18 0.4 4,385 94.5
Closed 4,207 637 15.1 73 1.7 45 1.1 3,452 82.1
Total 15,942 1,318 8.3 146 0.9 167 1.0 14,311 89.8
Note: Risk and/or needs assessments were counted if the assessment was completed within a year of the date the complaint was received. SOURCE: NC Sentencing and Policy Advisory Commission, FY 2010/11 Juvenile Recidivism Sample

APPENDIX B
Juvenile Disposition Chart

50
Juvenile Disposition Chart
Offense Classification Delinquency History Level
Low 0-1 point
Medium 2-3 points
High 4 or more points
Violent Class A-E felonies
Level 2 or 3 Level 3 Level 3
Serious Class F-I felonies Class A1 misdemeanors
Level 1 or 2 Level 2 Level 2 or 3
Minor Class 1-3 misdemeanors
Level 1 Level 1 or 2 Level 2
Offense Classification (G.S. 7B-2508) Violent – Adjudication of a Class A through E felony offense. Serious – Adjudication of a Class F through I felony offense or a Class A1 misdemeanor. Minor – Adjudication of a Class 1, 2, or 3 misdemeanor. Delinquency History Levels (G.S. 7B-2507(c)) Points For each prior adjudication of a Class A through E felony offense, 4 points. For each prior adjudication of a Class F through I felony offense or a Class A1 misdemeanor offense, 2 points. For each prior adjudication of a Class 1, 2, or 3 misdemeanor, 1 point. If the juvenile was on probation at the time of the offense, 2 points. Levels Low – No more than 1 point. Medium – At least 2, but not more than 3 points. High – At least 4 points.

APPENDIX C
Dispositional Options

52
Dispositional Options
Level 1 Community
Level 2 Intermediate
Level 3 Commitment
intensive substance abuse treatment program
excuse from school attendance
residential treatment program
in-home supervision
community-based program
custody
restitution up to $500
nonresidential treatment program
not associate with specified persons
community service up to 100 hours
victim-offender reconciliation
probation
no driver’s license
intermittent confinement up to 5 days
fine
not be in specified places
curfew
wilderness program
supervised day program
intensive substance abuse treatment program
residential treatment program
intensive nonresidential treatment program
wilderness program
group home placement
intensive probation
supervised day program
regimented training program
house arrest with/without electronic monitoring
suspension of more severe disposition w/conditions
intermittent confinement up to 14 days
multipurpose group home
restitution over $500
community service up to 200 hours
6 month minimum confinement
minimum 90 day post-release supervision

APPENDIX D
Juveniles Adjudicated and Disposed

54
JUVENILES ADJUDICATED AND DISPOSED
Descriptive Information
Table D.1 Identifying Juveniles Adjudicated and Disposed during FY 2010/11
Total Number of Adjudicated Juveniles Disposition Imposed Disposition Not Imposed
N=5,141 n=4,931 95.9% n=210 4.1%
Note: In the juvenile justice system, the dispositional hearing often occurs at a later date than the adjudicatory hearing in order for a pre-disposition report to be completed. As a result, a disposition hearing may not have occurred during FY 2010/11 for the adjudicated juveniles in the sample. SOURCE: NC Sentencing and Policy Advisory Commission, FY 2010/11 Juvenile Recidivism Sample
Table D.2 Offense Classification of the Sample Offense by Adjudicated Offense
Juveniles Adjudicated and Disposed
Sample Offense Classification
N
Adjudicated Offense Classification
% Violent
% Serious
% Minor
% Total
n=100 n=1,030 n=3,801 N=4,931
Violent 193 51.8 37.8 10.4 3.9
Serious 1,543 0.0 62.0 38.0 31.3
Minor 3,195 0.0 0.0 100.0 64.8
Total 4,931 2.0 20.9 77.1 100.0
SOURCE: NC Sentencing and Policy Advisory Commission, FY 2010/11 Juvenile Recidivism Sample

55
Table D.3 Offense Classification of the Adjudicated Offense by Delinquency History Level
Juveniles Adjudicated and Disposed
Adjudicated Offense Classification
N
Delinquency History Level
% Low
% Medium
% High
% Total
n=3,897 n=588 n=446 N=4,931
Violent 100 81.0 6.0 13.0 2.0
Serious 1,030 72.5 15.4 12.1 20.9
Minor 3,801 80.7 11.2 8.1 77.1
Total 4,931 79.0 12.0 9.0 100.0
SOURCE: NC Sentencing and Policy Advisory Commission, FY 2010/11 Juvenile Recidivism Sample
Figure D.1 Risk Level and Needs Level by Disposition Level
Juveniles Adjudicated and Disposed
Note: Of the 4,931 juveniles adjudicated and disposed, there were 137 cases with missing values for risk level and 84 cases with missing values for needs level. SOURCE: NC Sentencing and Policy Advisory Commission, FY 2010/11 Juvenile Recidivism Sample
64%
28%11%
33%
47%
28%
3%
25%
61%
Level 1n=3,347
Level 2n=1,367
Level 3n=80
Risk Level by Disposition Level
Low Risk Medium Risk High Risk
52%
32%
14%
43%
59%
65%
5% 9%21%
Level 1n=3,365
Level 2n=1,401
Level 3n=81
Needs Level by Disposition Level
Low Needs Medium Needs High Needs

Table D.4 Disposition Levels by Offense Classification and Delinquency History Level
Juveniles Adjudicated and Disposed
Offense Classification
Delinquency History Level
Total Low 0-1 Point
Medium 2-3 Points
High 4+ Points
Violent Class A-E Felonies
Level 2/Level 3 Level 3 Level 3 Level 2/Level 3
Level 1: 1 (1.2%) Level 2: 65 (80.3%) Level 3: 15 (18.5%)
n = 81
Level 1: 0 (0.0%) Level 2: 3 (50.0%) Level 3: 3 (50.0%)
n = 6
Level 1: 1 (7.7%) Level 2: 5 (38.5%) Level 3: 7 (53.8%)
n = 13
Level 1: 2 (2.0%) Level 2: 73 (73.0%) Level 3: 25 (25.0%)
n = 100
Serious Class F-I Felonies Class A1 Misdemeanors
Level 1/Level 2 Level 2 Level 2/Level 3 Level1/Level 2/Level 3
Level 1: 389 (52.1%) Level 2: 357 (47.8%)
Level 3: 1 (0.1%) n = 747
Level 1: 18 (11.4%) Level 2: 137 (86.7%)
Level 3: 3 (1.9%) n = 158
Level 1: 5 (4.0%) Level 2: 85 (68.0%) Level 3: 35 (28.0%)
n = 125
Level 1: 412 (40.0%) Level 2: 579 (56.2%)
Level 3: 39 (3.8%) n = 1,030
Minor Class 1, 2, 3 Misdemeanors
Level 1 Level 1/Level 2 Level 2 Level 1/Level 2
Level 1: 2,908 (94.8%) Level 2: 160 (5.2%)
Level 3: 1 (0.0%) n = 3,069
Level 1: 91 (21.5%) Level 2: 332 (78.3%)
Level 3: 1 (0.2%) n = 424
Level 1: 17 (5.5%) Level 2: 275 (89.3%)
Level 3: 16 (5.2%) n = 308
Level 1: 3,016 (79.3%) Level 2: 767 (20.2%)
Level 3: 18 (0.5%) n = 3,801
Total
Level1/Level 2/Level 3 Level1/Level 2/Level 3 Level 2/Level 3 Level1/Level 2/Level 3
Level 1: 3,298 (84.6%) Level 2: 582 (14.9%)
Level 3: 17 (0.5%) n = 3,897
Level 1: 109 (18.5%) Level 2: 472 (80.3%)
Level 3: 7 (1.2%) n = 588
Level 1: 23 (5.2%) Level 2: 365 (81.8%) Level 3: 58 (13.0%)
n = 446
Level 1: 3,430 (69.5%) Level 2: 1,419 (28.8%)
Level 3: 82 (1.7%) N = 4,931
Note: In FY 2010/11, there were 232 juveniles (or 4.7%) involving a disposition not specified by the dispositional chart. However, it must be noted that certain provisions of the juvenile code allow a judge to impose a disposition other than those specified by the chart. Under G.S. 7B-2508(e), judges may find “extraordinary needs” and impose a lower level disposition. Under G.S. 7B-2508(g), juveniles adjudicated delinquent for a minor offense with four or more prior adjudications may be committed to a YDC. Finally, under G.S. 7B-2508(d), juveniles adjudicated for a minor offense with a previous Level 3 disposition may be committed to a YDC. SOURCE: NC Sentencing and Policy Advisory Commission, FY 2010/11 Juvenile Recidivism Sample
56

57
Recidivism Results
Table D.5 Recidivism Rates by Individual Components of the Juvenile Disposition Chart
during the Three-Year Follow-Up Juveniles Adjudicated and Disposed
Individual Components of the Juvenile Disposition Chart
Subsequent Complaints
Adult Arrests
Overall Recidivism
Adjudicated Offense Classification n % n % N %
Violent (Class A-E) 77 13.0 95 14.7 100 22.0
Serious (Class F- A1) 912 41.0 908 23.5 1,030 49.1
Minor (Class 1-3) 3,467 42.4 3,342 32.1 3,801 55.8
Delinquency History Level n % n % N %
Low (0-1 Point) 3,559 39.8 3,366 27.1 3,897 50.7
Medium (2-3 Points) 504 48.2 553 38.5 588 64.3
High (4+ Points) 393 49.1 426 40.4 446 66.1
Disposition Level n % n % N %
Level 1 (Community) 3,146 40.5 2,947 28.1 3,430 51.8
Level 2 (Intermediate) 1,248 45.2 1,317 33.6 1,419 58.8
Level 3 (YDC Commitment) 62 22.6 81 32.1 82 43.9
Adjudicated and Disposed 4,456 41.6 4,345 29.9 4,931 53.7
Sample Total 14,754 33.0 12,799 22.9 15,942 42.0
SOURCE: NC Sentencing and Policy Advisory Commission, FY 2010/11 Juvenile Recidivism Sample

APPENDIX E
Juveniles Diverted

59
JUVENILES DIVERTED Descriptive Information
Table E.1 Completion Rates by Type of Diversion Plan
Juveniles Diverted
Type of Diversion Plan
N
% Successful
% Unsuccessful
% Other
n=3,534 n=813 n=293
Contract 2,170 74.3 19.8 5.9
Plan 2,470 77.8 15.5 6.7
Diverted 4,640 76.2 17.5 6.3
Note: The “Unsuccessful” category applies to juveniles who were referred to a program and they did not go or they failed to cooperate with the program placement. These juveniles may have received another delinquent complaint while under the diversion plan in this category. Generally, the juveniles in this category are approved for court. The “Other” category applies to juveniles who do not complete their diversion program, but their non-completion may not be due to any fault of their own (i.e., family moved and closure is appropriate, complainant does not want to pursue program completion, medical/mental health issue prevent completion). Generally, the juveniles in this category are not approved for court. SOURCE: NC Sentencing and Policy Advisory Commission, FY 2010/11 Juvenile Recidivism Sample
Recidivism Results
Table E.2 Recidivism Rates by Court Status during the Three-Year Follow-Up
Juveniles Diverted
Court Status of Juveniles Diverted
Subsequent Complaints
Adult Arrests
Overall Recidivism
n % n % n %
Approved for Court 647 64.6 512 25.0 657 69.6
Not Approved for Court 3,882 26.2 2,977 15.7 3,983 33.7
Diverted 4,529 31.7 3,489 17.0 4,640 38.8
Sample Total 14,754 33.0 12,799 22.9 15,942 42.0
SOURCE: NC Sentencing and Policy Advisory Commission, FY 2010/11 Juvenile Recidivism Sample

APPENDIX F
Risk Level by Needs Level

Table F.1
Distribution of Risk Level by Needs Level and by Level of Involvement
Risk Level Needs Level Number/Percent by
Risk Level Low Medium High
Low
Low Risk/Low Needs n=9,210 (64.4%)
Adjudicated 1,849 (20%) Dismissed 822 (9%) Diverted 3,476 (38%) Closed 3,063 (33%)
Low Risk/Medium Needs n=1,531 (10.7%)
Adjudicated 793 (52%) Dismissed 167 (11%) Diverted 470 (31%) Closed 101 (6%)
Low Risk/High Needs n=43 (0.3%)
Adjudicated 27 (63%) Dismissed 6 (14%) Diverted 8 (19%) Closed 2 (4%)
Low Risk n=10,784 (75.4%)
Adjudicated 2,669 (25%) Dismissed 995 (9%) Diverted 3,954 (37%) Closed 3,166 (29%)
Medium
Medium Risk/Low Needs n=819 (5.7%)
Adjudicated 434 (53%) Dismissed 113 (14%) Diverted 145 (18%) Closed 127 (15%)
Medium Risk/Medium Needs n= 1,812 (12.7%)
Adjudicated 1,220 (67%) Dismissed 241 (14%) Diverted 239 (13%) Closed 112 (6%)
Medium Risk/High Needs n=190 (1.3%)
Adjudicated 128 (67%) Dismissed 29 (15%) Diverted 24 (13%) Closed 9 (5%)
Medium Risk n=2,821 (19.7%)
Adjudicated 1,782 (63%) Dismissed 383 (14%) Diverted 408 (14%) Closed 248 (9%)
High
High Risk/Low Needs n=52 (0.3%)
Adjudicated 32 (61%) Dismissed 13 (25%) Diverted 3 (6%) Closed 4 (8%)
High Risk/Medium Needs n=462 (3.2%)
Adjudicated 341 (74%) Dismissed 82 (18%) Diverted 16 (3%) Closed 23 (5%)
High Risk/High Needs n=192 (1.3%)
Adjudicated 140 (73%) Dismissed 37 (19%) Diverted 4 (2%) Closed 11 (6%)
High Risk n=706 (4.9%)
Adjudicated 513 (73%) Dismissed 132 (19%) Diverted 23 (3%) Closed 38 (5%)
Number/Percent by Needs Level
Low Needs n=10,081 (70.4%)
Adjudicated 2,315 (23%) Dismissed 948 (9%) Diverted 3,624 (36%) Closed 3,194 (32%)
Medium Needs n=3,805 (26.6%)
Adjudicated 2,354 (62%) Dismissed 490 (13%) Diverted 725 (19%) Closed 236 (6%)
High Needs n=425 (3.0%)
Adjudicated 295 (69%) Dismissed 72 (17%) Diverted 36 (9%) Closed 22 (5%)
Total N=14,311 (100.0%)
Adjudicated 4,964 (35%) Dismissed 1,510 (10%) Diverted 4,385 (31%) Closed 3,452 (24%)
Note: There were 1,631 juveniles with missing risk and/or needs assessments excluded from the table.
SOURCE: NC Sentencing and Policy Advisory Commission, FY 2010/11 Juvenile Recidivism Sample
61

Table F.2
Recidivism Rates by the Distribution of Risk Level by Needs Level and by Level of Involvement during the Three-Year Follow-Up
Risk Level Needs Level Rates by
Risk Level Low Medium High
Low
Low Risk/Low Needs 34.3%
Adjudicated 42.4% Dismissed 34.8% Diverted 34.8% Closed 28.6%
Low Risk/Medium Needs 49.7%
Adjudicated 50.8% Dismissed 45.5% Diverted 50.2% Closed 45.5%
Low Risk/High Needs 44.2%
Adjudicated 40.7% Dismissed 50.0% Diverted 37.5% Closed 100.0%
Low Risk 36.5%
Adjudicated 44.9% Dismissed 36.7% Diverted 36.7% Closed 29.2%
Medium
Medium Risk/Low Needs 58.4%
Adjudicated 58.3% Dismissed 54.9% Diverted 57.9% Closed 62.2%
Medium Risk/Medium Needs 61.0%
Adjudicated 60.7% Dismissed 57.7% Diverted 62.8% Closed 67.0%
Medium Risk/High Needs 62.1%
Adjudicated 60.9% Dismissed 65.5% Diverted 58.3% Closed 77.8%
Medium Risk 60.3%
Adjudicated 60.2% Dismissed 57.4% Diverted 60.8% Closed 64.9%
High
High Risk/Low Needs 75.0%
Adjudicated 75.0% Dismissed 69.2% Diverted 66.7% Closed 100.0%
High Risk/Medium Needs 75.1%
Adjudicated 73.3% Dismissed 78.1% Diverted 75.0% Closed 91.3%
High Risk/High Needs 63.0%
Adjudicated 62.9% Dismissed 56.8% Diverted 75.0% Closed 81.8%
High Risk 71.8%
Adjudicated 70.6% Dismissed 71.2% Diverted 73.9% Closed 89.5%
Rates by Needs Level
Low Needs 36.4%
Adjudicated 45.8% Dismissed 37.7% Diverted 35.8% Closed 30.0%
Medium Needs 58.2%
Adjudicated 59.2% Dismissed 56.9% Diverted 54.9% Closed 60.2%
High Needs 60.7%
Adjudicated 60.0% Dismissed 59.7% Diverted 55.6% Closed 81.8%
Total 42.9%
Adjudicated 53.0% Dismissed 45.0% Diverted 39.1% Closed 32.4%
Note: See Table F.1 for the distribution of juveniles by level of involvement based on risk level by needs level. The majority of juveniles in the sample were assessed as low risk/low needs (64.4%); only 1.3% were assessed as high risk/high needs. This distribution must be considered when examining the recidivism rates in this table. SOURCE: NC Sentencing and Policy Advisory Commission, FY 2010/11 Juvenile Recidivism Sample
62


