Jute, kenaf, sisal, abaca, coir and allied bres · Jute, kenaf, sisal, abaca coir and allied fibres...
40
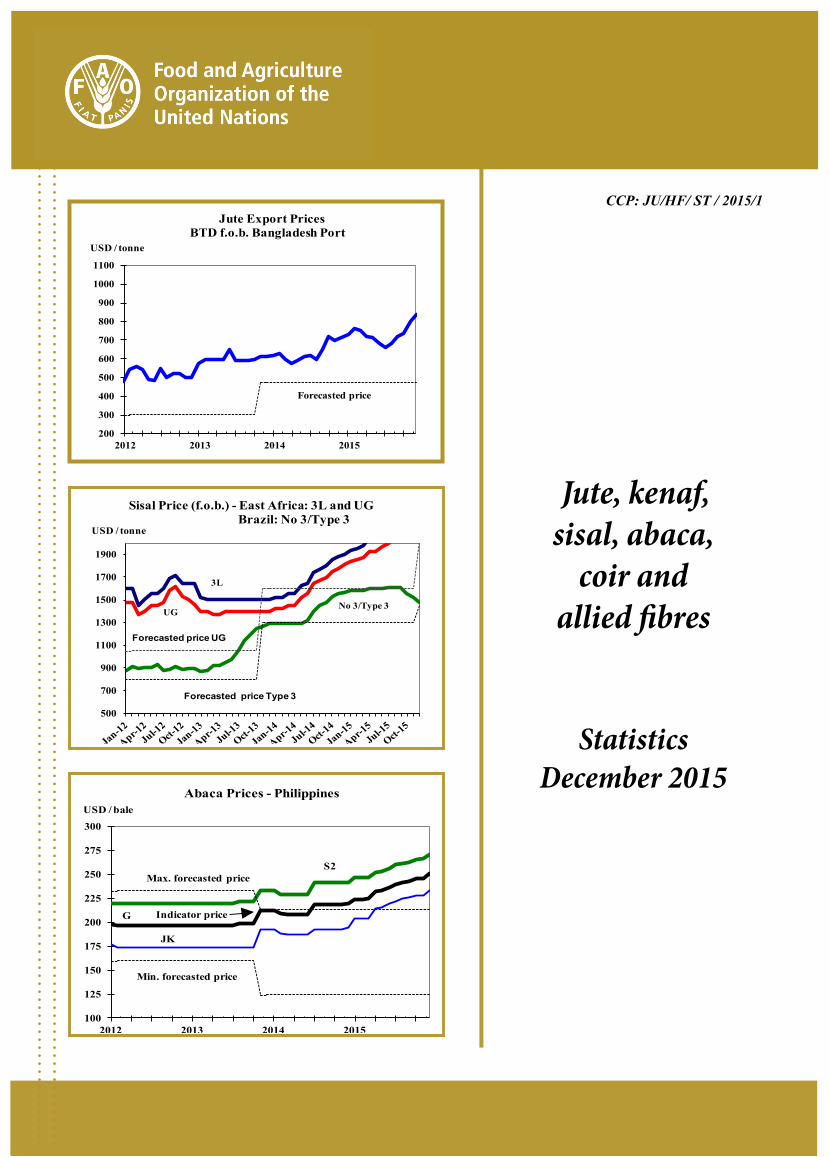
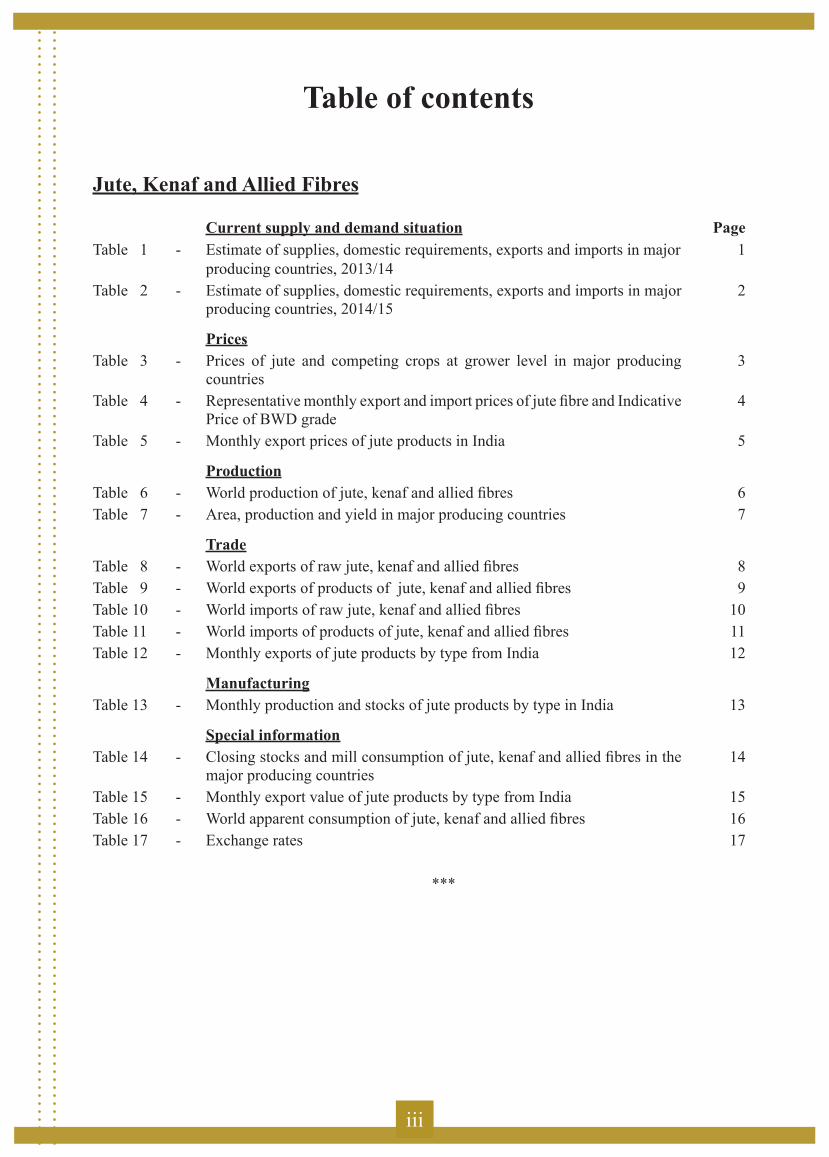
CCP: JU/HF/ ST / 2015/1 200 300 400 500 600 700 800 900 1000 1100 2012 2013 2014 2015 USD / tonne Jute Export Prices BTD f.o.b. Bangladesh Port Forecasted price 500 700 900 1100 1300 1500 1700 1900 Forecasted price Type 3 Forecasted price UG 3L No 3/Type 3 UG Sisal Price (f.o.b.) - East Africa: 3L and UG Brazil: No 3/Type 3 USD / tonne 100 125 150 175 200 225 250 275 300 2012 2013 2014 2015 S2 JK Indicator price USD / bale Max. forecasted price Abaca Prices - Philippines G Min. forecasted price Jute, kenaf, sisal, abaca, coir and allied fibres Statistics December 2015
Transcript of Jute, kenaf, sisal, abaca, coir and allied bres · Jute, kenaf, sisal, abaca coir and allied fibres...
CCP: JU/HF/ ST / 2015/1
200
300
400
500
600
700
800
900
1000
1100
2012 2013 2014 2015
USD / tonne
Jute Export PricesBTD f.o.b. Bangladesh Port
Forecasted price
500
700
900
1100
1300
1500
1700
1900
Forecasted price Type 3
Forecasted price UG
3L
No 3/Type 3UG
Sisal Price (f.o.b.) - East Africa: 3L and UG Brazil: No 3/Type 3
USD / tonne
100
125
150
175
200
225
250
275
300
2012 2013 2014 2015
S2
JK
Indicator price
USD / bale
Max. forecasted price
Abaca Prices - Philippines
G
Min. forecasted price
Jute, kenaf, sisal, abaca,
coir and allied fibres
StatisticsDecember 2015
Jute, kenaf, sisal, abacacoir and allied fibres
StatisticsDecember 2015
Market and Policy Analyses of Raw Materials, Horticulture and Tropical (RAMHOT) Products Team
Trade and Markets DivisionFood and Agriculture Organization of the United Nations
FOOD AND AGRICULTURE ORGANIZATION OF THE UNITED NATIONSRome, 2016
The designations employed and the presentation of material in this information product do not imply the expression of any opinion whatsoever on the part of the Food and Agriculture Organization of the United Nations (FAO) concerning the legal or development status of any country, territory, city or area or of its authorities, or concerning the delimitation of its frontiers or boundaries. The mention of specific companies or products of manufacturers, whether or not these have been patented, does not imply that these have been endorsed or recommended by FAO in preference to others of a similar nature that are not mentioned.
The views expressed in this information product are those of the author(s) and do not necessarily reflect the views or policies of FAO.
FAO encourages the use, reproduction and dissemination of material in this information product. Except where otherwise indicated, material may be copied, downloaded and printed for private study, research and teaching purposes, or for use in non-commercial products or services, provided that appropriate acknowledgement of FAO as the source and copyright holder is given and that FAO’s endorsement of users’ views, products or services is not implied in any way.
All requests for translation and adaptation rights, and for resale and other commercial use rights should be made via www.fao.org/contact-us/licence-request or addressed to [email protected].
FAO information products are available on the FAO website (www.fao.org/publications) and can be purchased through [email protected].
© FAO 2016
iii
Table of contents
Jute, Kenaf and Allied Fibres
Current supply and demand situation PageTable 1 - Estimate of supplies, domestic requirements, exports and imports in major
producing countries, 2013/141
Table 2 - Estimate of supplies, domestic requirements, exports and imports in major producing countries, 2014/15
2
PricesTable 3 - Prices of jute and competing crops at grower level in major producing
countries3
Table 4 - Representative monthly export and import prices of jute fibre and Indicative Price of BWD grade
4
Table 5 - Monthly export prices of jute products in India 5
Production Table 6 - World production of jute, kenaf and allied fibres 6Table 7 - Area, production and yield in major producing countries 7
TradeTable 8 - World exports of raw jute, kenaf and allied fibres 8Table 9 - World exports of products of jute, kenaf and allied fibres 9Table 10 - World imports of raw jute, kenaf and allied fibres 10Table 11 - World imports of products of jute, kenaf and allied fibres 11Table 12 - Monthly exports of jute products by type from India 12
ManufacturingTable 13 - Monthly production and stocks of jute products by type in India 13
Special informationTable 14 - Closing stocks and mill consumption of jute, kenaf and allied fibres in the
major producing countries14
Table 15 - Monthly export value of jute products by type from India 15Table 16 - World apparent consumption of jute, kenaf and allied fibres 16Table 17 - Exchange rates 17
***
iv
Sisal
PageTable 18 - Production of sisal, henequen and other similar hard fibres 18Table 19 - Sisal and henequen fibres and manufactures: exports from producing
countries19
Table 20 - Sisal: prices of representative grades, 2009-2015 20Table 21 - Sisal: imports of raw fibre 21Table 22 - Sisal: imports of manufactures 22
***
Abaca
Table 23 - Production of abaca 23Table 24 - Export of abaca: fibre and manufactures from producing countries 23Table 25 - Abaca: prices of representative grades, 2009-2015 24Table 26 - Abaca: imports of fibre and manufactures 25
***
Coir
Table 27 - Production of coir fibre 26Table 28 - Production of coir yarn 26Table 29 - Exports of coir fibre 27Table 30 - Exports of coir yarn 28Table 31 - Exports of coir mats, matting and rugs from principal exporting countries 28Table 32 - Sri Lanka: prices of coir fibres and yarn 29Table 33 - Imports of coir fibre 30Table 34 - Imports of coir yarn into principal importing countries 31Table 35 - Imports of coir mats, matting and rugs into principal importing countries 32
***
Notes 33

v
Foreword
The Market and Policy Analyses of Raw Materials, Horticulture and Tropical Products Team (RAMHOT) provides economic data and analyses on major agricultural raw materials and horticultural and tropical products. Commodities covered under the Team include, bananas and tropical fruits, citrus fruits, cotton, hard fibres (abaca, coir and sisal), hides and skins, jute, kenaf and allied fibres, sugar, and tea.
The Team also undertakes market reviews, outlook appraisals and projections, and provides assistance to developing countries in designing and implementing national policies for those agricultural commodities which enter into international trade.
The tables contained in this document bring together governments’ replies to the Group’s latest questionnaires, supplemented by other data available to the Secretariat at 31 December 2015. It is prepared in the Trade and Markets Division, FAO, Rome and it is available at the following FAO Web site:
http://www.fao.org/economic/futurefibres/resources2/en/

1
Table 1 - Jute/Kenaf: estimate of supplies, domestic requirements, exports and imports in major producing countries, 2013/14 1/
Bangladesh India Myanmar Nepal Thailand Others TOTAL
( . . . . . . . . . . . . . . . . . . . . . . . . . . . . . . lakh bales . . . . . . . . . . . . . . . . . . . . . . . . . . . . . . . )
Opening stocks 3.75 19.04 0.32 4.34 2.16
Production 75.22 90.00 0.04 0.87 0.06 6.70 172.88
Imports 0.00 2.94 0.00 2.81 0.23
Total supply 78.97 111.98 0.36 8.02 2.44
Mill consumption 65.00 81.15 0.28 3.06 1.67
Village consumption 2.50 10.00 0.06 0.00 0.00
Loss/Damage 0.00 0.00 0.00 0.00 0.00
Closing stocks 1.63 18.36 0.02 4.85 0.77
Total domestic requirements 69.13 109.51 0.36 7.91 2.43
Exports 9.84 2.47 0.00 0.11 0.01 0.82 13.24
( . . . . . . . . . . . . . . . . . . . . . . . . . . thousand tonnes . . . . . . . . . . . . . . . . . . . . . . . . . . . . . . )
Opening stocks 67.5 342.7 5.8 78.1 38.8
Production 1 354.0 1 620.0 0.6 15.7 1.0 120.6 3 111.9
Imports 0.0 53.0 0.0 50.5 4.1
Total supply 1 421.5 2 015.7 6.4 144.3 43.9
Mill consumption 1 170.0 1 460.7 5.0 55.0 30.0
Village consumption 45.0 180.0 1.0 0.0 0.0
Loss/Damage 0.0 0.0 0.0 0.0 0.0
Closing stocks 29.4 330.5 0.4 87.3 13.8
Total domestic requirements 1 244.4 1 971.2 6.4 142.3 43.8
Exports 177.1 44.5 0.0 2.0 0.1 14.7 238.4
2
Table 2 - Jute/Kenaf: estimate of supplies, domestic requirements, exports and imports in major producing countries, 2014/15 1/
Bangladesh India Myanmar Nepal Thailand Others TOTAL
( . . . . . . . . . . . . . . . . . . . . . . . . . . . . . . lakh bales . . . . . . . . . . . . . . . . . . . . . . . . . . . . . . . )
Opening stocks 1.63 18.36 0.02 4.85 0.77
Production 75.89 86.00 0.06 0.89 0.04 6.78 169.66
Imports 0.00 2.45 0.00 2.81 0.03
Total Supply 77.52 106.81 0.08 8.54 0.84
Mill consumption 65.00 73.87 0.06 3.06 0.56
Village consumption 2.50 10.00 0.02 0.00 0.00
Loss/Damage 0.00 0.00 0.00 0.00 0.00
Closing stocks 0.01 20.84 0.00 5.37 0.20
Total domestic requirements 67.51 104.71 0.08 8.42 0.75
Exports 10.01 2.10 0.00 0.12 0.09 0.93 13.24
( . . . . . . . . . . . . . . . . . . . . . . . . . . . thousand tonnes . . . . . . . . . . . . . . . . . . . . . . . . . . . . . )
Opening stocks 29.4 330.5 0.4 87.3 13.8
Production 1 366.0 1 548.0 1.0 16.0 0.7 122.1 3 053.8
Imports 0.0 44.1 0.0 50.5 0.6
Total supply 1 395.4 1 922.6 1.4 153.8 15.1
Mill consumption 1 170.0 1 329.7 1.0 55.0 10.0
Village consumption 45.0 180.0 0.4 0.0 0.0
Loss/Damage 0.0 0.0 0.0 0.0 0.0
Closing stocks 0.2 375.1 0.0 96.6 3.5
Total domestic requirements 1 215.2 1 884.8 1.4 151.6 13.5
Exports 180.1 37.8 0.0 2.2 1.6 16.7 238.4
3
Table 3 - Prices of jute and competing crops at grower level in major producing countries
Bangladesh 1/ India Jute Rice Jute 2/ Rice 3/
. . . Taka/maund . . . . . . Rupees/maund . . .
2009/10 Season 1 568.9 1 050.6 326.02010/11 Season 1 598.6 1 308.3 373.92011/12 Season 1 146.3 916.7 343.82012/13 Season 1 244.0 1 075.6 385.4
2013/14 Season 1 235.6 1 123.3 466.22013 July 1 337.0 1 004.8 421.8
August 1 103.0 1 022.4 455.4September 1 090.0 1 045.2 447.9October 1 100.0 1 036.7 481.5November 1 161.0 1 151.5 503.9December 1 277.0 1 149.8 436.7
2014 January 1 349.0 1 127.2 466.6February 1 317.0 1 125.8 475.9March 1 264.0 1 181.1 485.2April 1 215.0 1 181.1 483.3May 1 271.0 1 246.5 470.3June 1 343.0 1 207.4
2014/15 Season 1 517.3 1 185.42014 July 1 308.0 1 134.9
August 1 300.0 1 072.4September 1 365.0 1 074.3October 1 410.0 1 138.7November 1 409.0 1 198.5December 1 450.0 1 220.9
2015 January 1 530.0 1 253.5February 1 675.0 1 286.8March 1 697.0 1 288.6April 1 725.0May 1 673.0June 1 666.0
2010 Calendar year 1 814.5 1 224.9 372.32011 Calendar year 1 378.5 1 115.9 361.52012 Calendar year 1 132.5 979.2 360.22013 Calendar year 1 249.4 1 097.9 421.82014 Calendar year 1 333.4 1 159.1
4
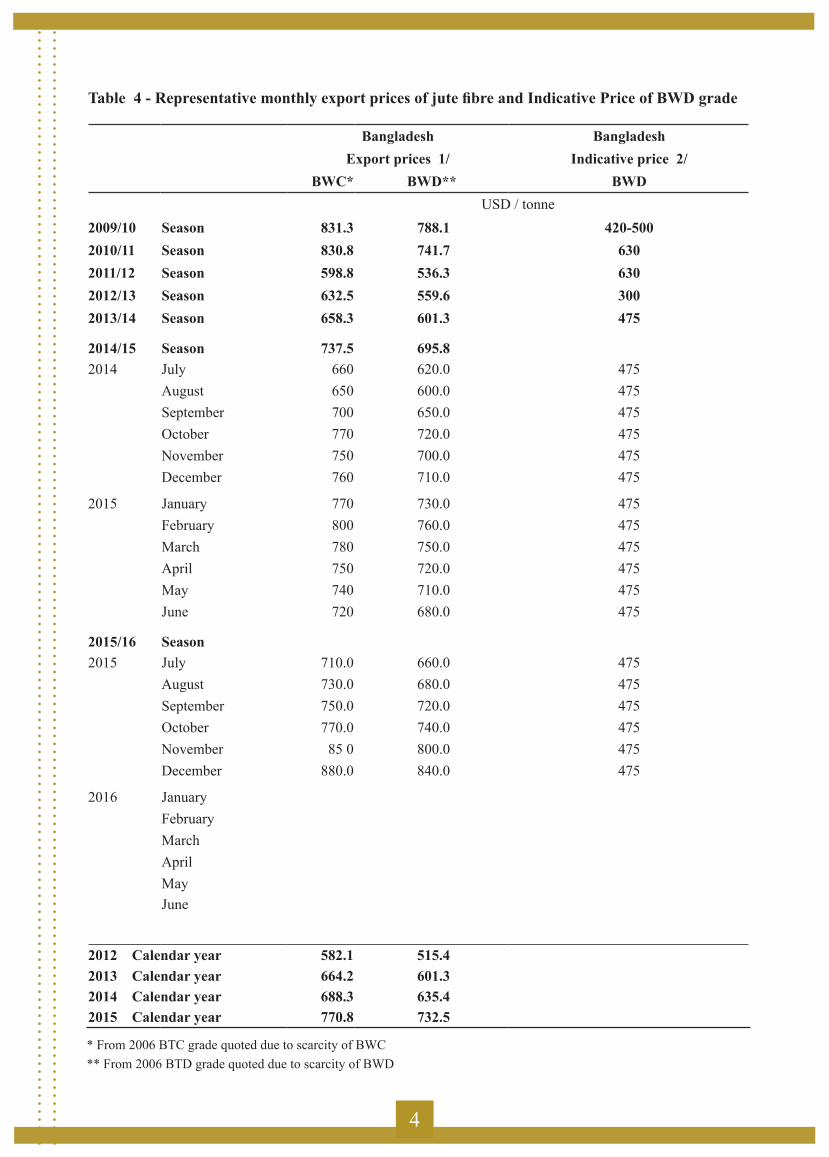
Table 4 - Representative monthly export prices of jute fibre and Indicative Price of BWD grade
Bangladesh BangladeshExport prices 1/ Indicative price 2/
BWC* BWD** BWDUSD / tonne
2009/10 Season 831.3 788.1 420-5002010/11 Season 830.8 741.7 630 2011/12 Season 598.8 536.3 630 2012/13 Season 632.5 559.6 300 2013/14 Season 658.3 601.3 475
2014/15 Season 737.5 695.82014 July 660 620.0 475
August 650 600.0 475 September 700 650.0 475 October 770 720.0 475 November 750 700.0 475 December 760 710.0 475
2015 January 770 730.0 475 February 800 760.0 475 March 780 750.0 475 April 750 720.0 475 May 740 710.0 475 June 720 680.0 475
2015/16 Season2015 July 710.0 660.0 475
August 730.0 680.0 475 September 750.0 720.0 475 October 770.0 740.0 475 November 85 0 800.0 475 December 880.0 840.0 475
2016 JanuaryFebruaryMarchAprilMayJune
2012 Calendar year 582.1 515.42013 Calendar year 664.2 601.32014 Calendar year 688.3 635.42015 Calendar year 770.8 732.5
* From 2006 BTC grade quoted due to scarcity of BWC** From 2006 BTD grade quoted due to scarcity of BWD

5
Table 5 - Monthly export prices of jute products in India 1/
Hessian (40” - 10 oz) Sacking (B - Twills) Rupees USD Rupees USD
. . . Per 100 metres . . . . . . Per 100 bags . . .
2009/10 Season 1 546 33.2 2 914 62.72010/11 Season 1 802 39.8 3 349 73.92011/12 Season 1 716 34.2 3 246 64.82012/13 Season 1 752 32.0 3 473 63.4
2013/14 Season 1 759 28.6 3 158 51.42013 July 1 704 28.5 3 098 51.8
August 1 675 26.5 2 914 46.1September 1 708 26.8 3 096 48.6October 1 705 27.7 3 059 49.6November 1 712 27.3 3 096 49.4December 1 778 28.7 3 242 52.4
2014 January 1 790 28.8 3 221 51.8February 1 805 29.0 3 109 49.9March 1 781 29.2 3 127 51.3April 1 807 29.9 3 239 53.7May 1 830 30.8 3 351 56.5June 1 818 30.4 3 345 56.0
2014/15 Season 1 798 29.5 3 237 53.12014 July 1 784 29.7 3 239 53.9
August 1 769 29.0 3 124 51.3September 1 772 29.1 3 130 51.4October 1 822 29.7 3 298 53.8November 1 845 29.9 3 396 55.1December
2015 JanuaryFebruaryMarchAprilMayJune
2011 Calendar year 1 769 37.9 3 336 71.82012 Calendar year 1 738 32.5 3 379 63.32013 Calendar year 1 740 29.7 3 291 56.72014 Calendar year 1 802 29.5 3 234 48.7

6
Table 6 - World production of jute, kenaf and allied fibres
2009/10 2010/11 2011/12 2012/13 2013/14 2014/15 (preliminary)
(.........................................thousand tonnes...........................................)Jute fibre:World 2 580.8 3 088.4 3 132.6 2 932.9 2 860.3 2 821.0Developing countries 2 580.8 3 088.4 3 132.6 2 932.9 2 860.3 2 821.0 Far East 2 580.8 3 088.4 3 132.6 2 932.9 2 860.3 2 821.0 Bangladesh 1 070.1 1 404.4 1 404.9 1 363.0 1 354.0 1366.0 India 1 488.8 1 660.0 1 705.0 1 554.0 1 490.0 1 438.0 Myanmar 4.3 9.6 8.2 1.0 0.6 1.0 Nepal 17.7 14.4 14.4 15.0 15.7 16.0
Kenaf and Allied fibres:World 282.6 280.7 277.8 248.7 251.5 232.8Developing countries 275.8 273.9 271.0 241.9 244.7 226.0 Far East 226.3 227.6 218.6 196.3 198.5 179.8 China 75.2 75.2 68.5 68.5 61.2 63.0 India 131.2 140.0 140.0 120.0 130.0 110.0 Indonesia 3.8 4.0 4.0 4.0 4.0 4.0 Thailand 2.0 1.7 1.7 1.3 1.0 0.7 VietNam 12.1 5.0 3.2 1.2 1.0 0.7 Cambodia 0.5 0.3 0.3 0.3 0.3 0.3 Pakistan 1.5 1.5 1.0 1.0 1.0 1.0 Latin America and Caribbean 35.6 30.8 35.2 28.2 28.9 28.9 Brazil 14.9 14.2 16.7 9.8 10.0 10.0 Cuba 10.0 6.6 6.6 6.6 7.0 7.0 Other 10.7 10.1 11.9 11.9 11.9 11.9 Africa 10.3 12.1 13.8 13.9 13.9 13.9 Near East 3.6 3.4 3.5 3.5 3.4 3.4 Developed countries 6.7 6.7 6.9 6.9 6.9 6.9Total Jute, Kenaf and Allied Fibres:World 2 863.4 3 369.1 3 410.4 3 181.7 3 111.9 3 053.8Developing countries 2 856.6 3 362.3 3 403.6 3 174.8 3 105.0 3 047.0 Far East 2 807.1 3 316.0 3 351.2 3 129.3 3 058.8 3 000.8 Bangladesh 1 070.1 1 404.4 1 404.9 1 363.0 1 354.0 1 366.0 China 75.2 75.2 68.5 68.5 61.2 63.0 India 1 620.0 1 800.0 1 845.0 1 674.0 1 620.0 1 548.0 Indonesia 3.8 4.0 4.0 4.0 4.0 4.0 Myanmar 4.3 9.6 8.2 1.0 0.6 1.0 Nepal 17.7 14.4 14.4 15.0 15.7 16.0 Thailand 2.0 1.7 1.7 1.3 1.0 0.7 VietNam 12.1 5.0 3.2 1.2 1.0 0.7 Other 2.0 1.8 1.3 1.3 1.3 1.3
Latin America and Caribbean 35.6 30.8 35.2 28.2 28.9 28.9
Africa 10.3 12.1 13.8 13.9 13.9 13.9
Near East 3.6 3.4 3.5 3.5 3.4 3.4
Developed countries 6.7 6.7 6.9 6.9 6.9 6.9
7
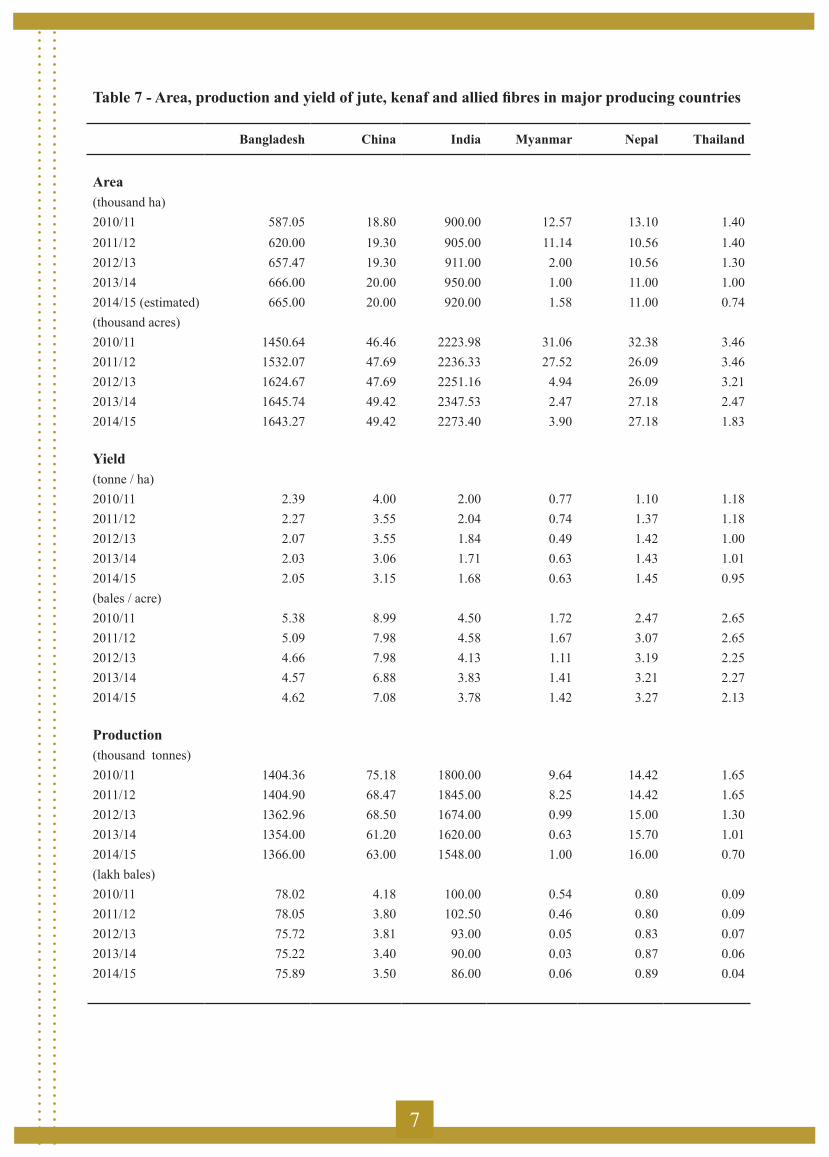
Table 7 - Area, production and yield of jute, kenaf and allied fibres in major producing countries
Bangladesh China India Myanmar Nepal Thailand
Area (thousand ha)2010/11 587.05 18.80 900.00 12.57 13.10 1.402011/12 620.00 19.30 905.00 11.14 10.56 1.402012/13 657.47 19.30 911.00 2.00 10.56 1.302013/14 666.00 20.00 950.00 1.00 11.00 1.002014/15 (estimated) 665.00 20.00 920.00 1.58 11.00 0.74(thousand acres)2010/11 1450.64 46.46 2223.98 31.06 32.38 3.462011/12 1532.07 47.69 2236.33 27.52 26.09 3.462012/13 1624.67 47.69 2251.16 4.94 26.09 3.212013/14 1645.74 49.42 2347.53 2.47 27.18 2.472014/15 1643.27 49.42 2273.40 3.90 27.18 1.83
Yield (tonne / ha)2010/11 2.39 4.00 2.00 0.77 1.10 1.182011/12 2.27 3.55 2.04 0.74 1.37 1.182012/13 2.07 3.55 1.84 0.49 1.42 1.002013/14 2.03 3.06 1.71 0.63 1.43 1.012014/15 2.05 3.15 1.68 0.63 1.45 0.95(bales / acre)2010/11 5.38 8.99 4.50 1.72 2.47 2.652011/12 5.09 7.98 4.58 1.67 3.07 2.652012/13 4.66 7.98 4.13 1.11 3.19 2.252013/14 4.57 6.88 3.83 1.41 3.21 2.272014/15 4.62 7.08 3.78 1.42 3.27 2.13
Production (thousand tonnes)2010/11 1404.36 75.18 1800.00 9.64 14.42 1.652011/12 1404.90 68.47 1845.00 8.25 14.42 1.652012/13 1362.96 68.50 1674.00 0.99 15.00 1.302013/14 1354.00 61.20 1620.00 0.63 15.70 1.012014/15 1366.00 63.00 1548.00 1.00 16.00 0.70(lakh bales)2010/11 78.02 4.18 100.00 0.54 0.80 0.092011/12 78.05 3.80 102.50 0.46 0.80 0.092012/13 75.72 3.81 93.00 0.05 0.83 0.072013/14 75.22 3.40 90.00 0.03 0.87 0.062014/15 75.89 3.50 86.00 0.06 0.89 0.04
8
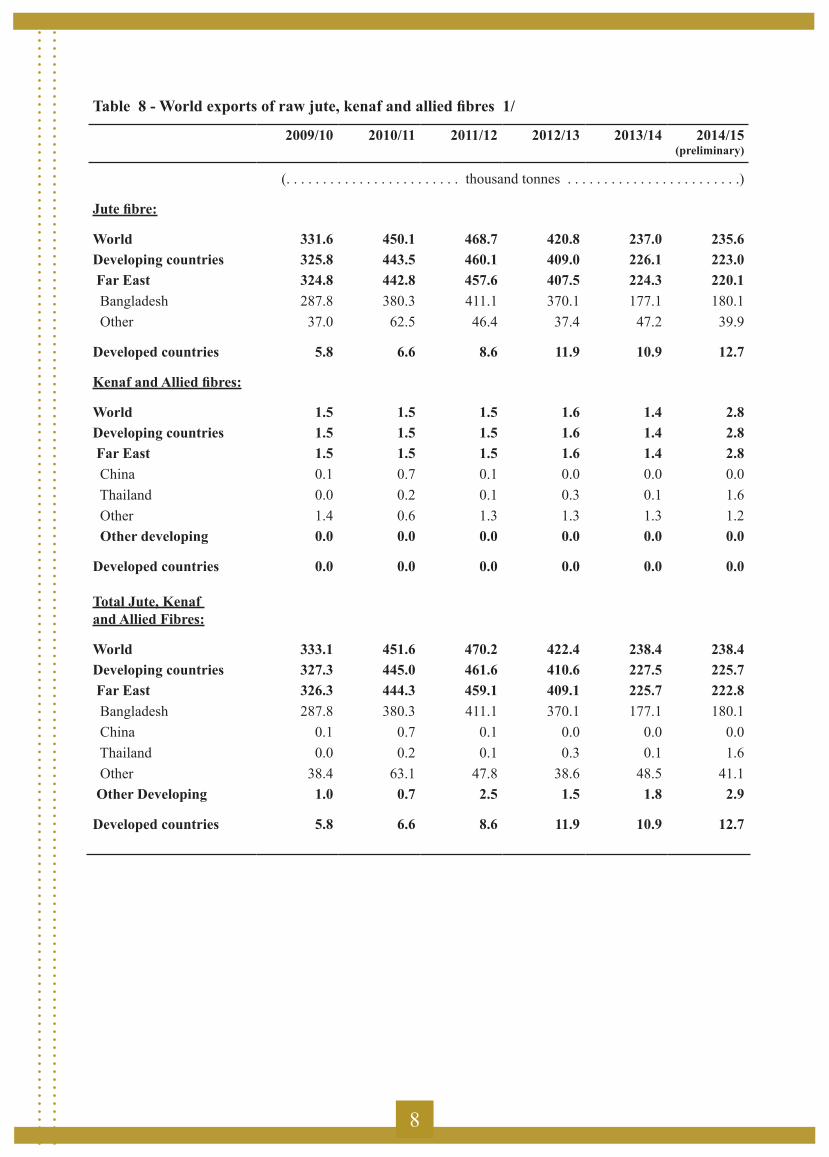
Table 8 - World exports of raw jute, kenaf and allied fibres 1/
2009/10 2010/11 2011/12 2012/13 2013/14 2014/15 (preliminary)
(. . . . . . . . . . . . . . . . . . . . . . . . thousand tonnes . . . . . . . . . . . . . . . . . . . . . . . .)
Jute fibre:
World 331.6 450.1 468.7 420.8 237.0 235.6Developing countries 325.8 443.5 460.1 409.0 226.1 223.0 Far East 324.8 442.8 457.6 407.5 224.3 220.1 Bangladesh 287.8 380.3 411.1 370.1 177.1 180.1 Other 37.0 62.5 46.4 37.4 47.2 39.9
Developed countries 5.8 6.6 8.6 11.9 10.9 12.7
Kenaf and Allied fibres:
World 1.5 1.5 1.5 1.6 1.4 2.8Developing countries 1.5 1.5 1.5 1.6 1.4 2.8 Far East 1.5 1.5 1.5 1.6 1.4 2.8 China 0.1 0.7 0.1 0.0 0.0 0.0 Thailand 0.0 0.2 0.1 0.3 0.1 1.6 Other 1.4 0.6 1.3 1.3 1.3 1.2 Other developing 0.0 0.0 0.0 0.0 0.0 0.0
Developed countries 0.0 0.0 0.0 0.0 0.0 0.0
Total Jute, Kenaf and Allied Fibres:
World 333.1 451.6 470.2 422.4 238.4 238.4Developing countries 327.3 445.0 461.6 410.6 227.5 225.7 Far East 326.3 444.3 459.1 409.1 225.7 222.8 Bangladesh 287.8 380.3 411.1 370.1 177.1 180.1 China 0.1 0.7 0.1 0.0 0.0 0.0 Thailand 0.0 0.2 0.1 0.3 0.1 1.6 Other 38.4 63.1 47.8 38.6 48.5 41.1 Other Developing 1.0 0.7 2.5 1.5 1.8 2.9
Developed countries 5.8 6.6 8.6 11.9 10.9 12.7

9
Table 9 - World exports of products of jute, kenaf and allied fibres 1/
2009/10 2010/11 2011/12 2012/13 2013/14 2014/15(preliminary)
( . . . . . . . . . . . . . . . . . . . . . . . . thousand tonnes . . . . . . . . . . . . . . . . . . . . . . . . . )
World 709.4 783.1 1027.2 895.2 1157.9 1036.8
Developing 682.9 757.0 1005.2 875.5 1137.1 1019.9
Africa 2.8 2.1 2.5 2.5 2.5 2.5
Latin America 0.6 0.7 1.1 1.7 1.6 1.1 El Salvador 0.2 0.4 0.5 1.1 0.4 0.4 Guatemala 0.2 0.1 0.1 0.1 0.1 0.2 Mexico 0.1 0.1 0.4 0.5 1.0 0.4
Near East 10.9 11.8 10.5 9.0 11.8 9.8 Egypt 2.0 0.1 1.2 0.2 0.6 0.6 Saudi Arabia 0.5 0.8 0.9 1.0 1.1 1.0 Syrian Arab Republic 4.0 3.5 4.2 4.0 4.0 4.0 Turkey 4.4 7.4 4.2 3.8 6.1 4.1
Far East 668.5 742.4 991.1 862.3 1 121.2 1 006.5 Bangladesh 459.4 475.5 696.3 597.4 858.7 817.4 China 15.9 12.0 10.3 12.6 4.2 2.8 India 163.5 182.9 211.7 171.1 179.4 107.9 Nepal 19.8 57.6 60.4 63.5 64.1 65.0 Pakistan 6.9 12.0 10.5 15.9 13.2 9.5 Thailand 1.3 1.4 0.7 0.7 0.5 2.8
Developed 26.6 26.1 22.0 19.7 20.8 17.0
North America 3.5 5.2 4.3 2.7 2.7 1.9 United States of America 3.1 4.8 3.9 2.5 2.2 1.9
Europe 21.1 19.9 17.0 16.3 16.5 13.5 EU (28) 20.9 19.6 16.7 16.1 16.3 13.3 Belgium-Luxembourg 11.6 10.9 8.9 8.1 8.1 6.0 France 0.3 0.4 0.2 0.1 0.5 0.5 Germany 2.1 2.2 2.0 2.0 2.0 1.9 Netherlands 1.5 1.7 1.7 1.7 1.3 1.4 United Kingdom 1.5 0.7 0.4 0.3 1.5 0.4 Other EU 0.2 0.2 0.3 0.2 0.2 0.2
CIS 0.9 0.2 0.4 0.1 0.5 0.3
Oceania 0.2 0.2 0.1 0.1 0.1 0.0 Australia 0.2 0.2 0.1 0.1 0.1 0.0
Other developed 0.9 0.7 0.2 0.5 1.1 1.3 Japan 0.1 0.3 0.0 0.1 0.1 0.0 South Africa 0.8 0.4 0.2 0.4 1.0 1.2
10
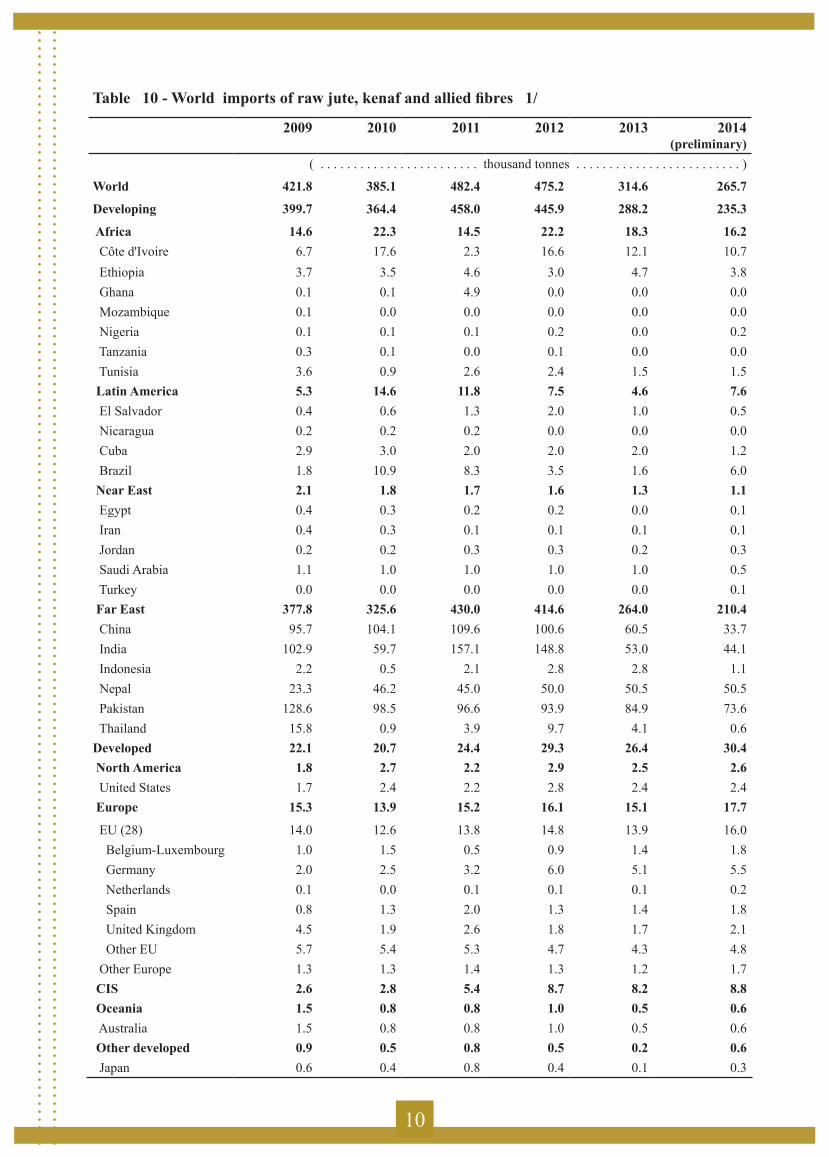
Table 10 - World imports of raw jute, kenaf and allied fibres 1/
2009 2010 2011 2012 2013 2014 (preliminary)
( . . . . . . . . . . . . . . . . . . . . . . . . thousand tonnes . . . . . . . . . . . . . . . . . . . . . . . . . )
World 421.8 385.1 482.4 475.2 314.6 265.7
Developing 399.7 364.4 458.0 445.9 288.2 235.3
Africa 14.6 22.3 14.5 22.2 18.3 16.2 Côte d'Ivoire 6.7 17.6 2.3 16.6 12.1 10.7 Ethiopia 3.7 3.5 4.6 3.0 4.7 3.8 Ghana 0.1 0.1 4.9 0.0 0.0 0.0 Mozambique 0.1 0.0 0.0 0.0 0.0 0.0 Nigeria 0.1 0.1 0.1 0.2 0.0 0.2 Tanzania 0.3 0.1 0.0 0.1 0.0 0.0 Tunisia 3.6 0.9 2.6 2.4 1.5 1.5 Latin America 5.3 14.6 11.8 7.5 4.6 7.6 El Salvador 0.4 0.6 1.3 2.0 1.0 0.5 Nicaragua 0.2 0.2 0.2 0.0 0.0 0.0 Cuba 2.9 3.0 2.0 2.0 2.0 1.2 Brazil 1.8 10.9 8.3 3.5 1.6 6.0 Near East 2.1 1.8 1.7 1.6 1.3 1.1 Egypt 0.4 0.3 0.2 0.2 0.0 0.1 Iran 0.4 0.3 0.1 0.1 0.1 0.1 Jordan 0.2 0.2 0.3 0.3 0.2 0.3 Saudi Arabia 1.1 1.0 1.0 1.0 1.0 0.5 Turkey 0.0 0.0 0.0 0.0 0.0 0.1 Far East 377.8 325.6 430.0 414.6 264.0 210.4 China 95.7 104.1 109.6 100.6 60.5 33.7 India 102.9 59.7 157.1 148.8 53.0 44.1 Indonesia 2.2 0.5 2.1 2.8 2.8 1.1 Nepal 23.3 46.2 45.0 50.0 50.5 50.5 Pakistan 128.6 98.5 96.6 93.9 84.9 73.6 Thailand 15.8 0.9 3.9 9.7 4.1 0.6Developed 22.1 20.7 24.4 29.3 26.4 30.4 North America 1.8 2.7 2.2 2.9 2.5 2.6 United States 1.7 2.4 2.2 2.8 2.4 2.4 Europe 15.3 13.9 15.2 16.1 15.1 17.7
EU (28) 14.0 12.6 13.8 14.8 13.9 16.0 Belgium-Luxembourg 1.0 1.5 0.5 0.9 1.4 1.8 Germany 2.0 2.5 3.2 6.0 5.1 5.5 Netherlands 0.1 0.0 0.1 0.1 0.1 0.2 Spain 0.8 1.3 2.0 1.3 1.4 1.8 United Kingdom 4.5 1.9 2.6 1.8 1.7 2.1 Other EU 5.7 5.4 5.3 4.7 4.3 4.8 Other Europe 1.3 1.3 1.4 1.3 1.2 1.7 CIS 2.6 2.8 5.4 8.7 8.2 8.8 Oceania 1.5 0.8 0.8 1.0 0.5 0.6 Australia 1.5 0.8 0.8 1.0 0.5 0.6 Other developed 0.9 0.5 0.8 0.5 0.2 0.6 Japan 0.6 0.4 0.8 0.4 0.1 0.3

11
Table 11 - World imports of products of jute, kenaf and allied fibres 1/ 2/ 2008 2009 2010 2011 2012 2013
(preliminary)
( . . . . . . . . . . . . . . . . . . . . . . . thousand tonnes . . . . . . . . . . . . . . . . . . . . . . . . )
World 699.7 738.7 814.3 973.0 954.1 967.8
Developing 533.3 552.0 634.8 810.6 792.0 809.1 Africa 44.9 45.0 68.5 59.9 62.1 61.8 Algeria 5.8 7.7 8.6 10.0 8.4 8.4 Cameroon 1.9 2.0 2.0 2.0 2.0 2.0 Ghana 12.8 6.9 24.3 14.0 25.5 27.0 Kenya 5.1 3.0 3.5 3.5 3.0 4.0 Morocco 3.8 4.0 4.1 4.5 4.1 4.2 Tanzania 2.3 5.3 5.6 8.1 2.1 1.6 Zimbabwe 2.2 3.0 7.7 4.8 4.8 2.6 Latin America 12.8 13.5 20.0 15.3 13.5 15.7 Argentina 1.2 1.2 1.2 0.8 0.6 0.5 Brazil 3.1 4.1 9.9 5.3 2.6 7.9 Costa Rica 0.6 0.8 0.9 0.9 0.8 0.9 Mexico 0.5 0.7 1.7 2.5 4.7 1.8 Uruguay 1.0 1.0 0.3 0.2 0.2 0.2 Near East 290.9 347.0 330.9 372.6 372.1 427.2 Egypt 8.8 21.8 15.8 17.4 20.0 15.0 Iran 56.4 66.1 60.9 50.0 50.0 60.0 Saudi Arabia 4.8 16.4 17.8 18.6 17.4 22.0 Sudan 43.0 38.5 30.4 40.4 30.0 35.0 Syrian Arab Republic 32.0 32.3 30.0 30.0 30.0 40.0 Turkey 136.9 160.0 165.0 206.1 213.7 240.3 Other 9.0 12.0 11.0 10.0 11.0 15.0 Far East 184.7 146.5 215.4 362.8 344.3 304.4 China 7.9 14.3 54.3 66.3 97.8 119.5 India 112.8 87.1 117.9 141.9 99.6 130.7 Indonesia 22.5 26.6 23.0 35.5 32.8 31.8 Malaysia 3.7 1.6 1.6 1.4 2.1 1.6 Pakistan 4.2 9.4 1.3 2.8 3.7 3.0 Republic of Korea 4.3 4.0 4.1 3.5 3.7 3.3 Sri Lanka 2.5 3.0 2.4 2.9 2.8 2.7
Developed 166.4 186.7 179.5 162.4 162.1 158.6 North America 28.4 33.8 35.2 34.8 35.9 41.5 United States 25.1 30.9 31.7 32.0 33.1 39.0 Europe 86.2 99.9 89.6 74.5 74.9 73.0 EU (28) 84.7 98.2 88.0 73.8 74.4 72.1 Belgium-Luxembourg 38.6 46.3 33.5 26.0 25.8 22.3 Germany 9.7 10.6 11.9 10.0 9.5 10.7 Netherlands 9.9 12.2 14.0 11.0 10.8 10.3 Spain 3.7 3.9 4.7 4.3 5.1 5.7 United Kingdom 7.4 8.4 7.4 7.2 7.3 7.3 Other Europe 1.5 1.7 1.6 0.7 0.5 0.9CIS 13.5 16.8 20.4 25.4 22.3 19.5 Russian Federation 10.5 12.7 15.0 15.4 13.9 11.1 Oceania 21.8 20.6 23.9 17.1 19.4 14.9 Australia 18.6 17.4 20.3 14.0 16.1 12.0 Other developed 16.5 15.6 10.4 10.6 9.6 9.7 Israel 0.6 0.7 0.5 1.0 1.2 1.0 Japan 14.2 13.0 8.0 7.7 6.5 6.7 South Africa 1.7 1.9 1.9 1.9 1.9 2.0
12
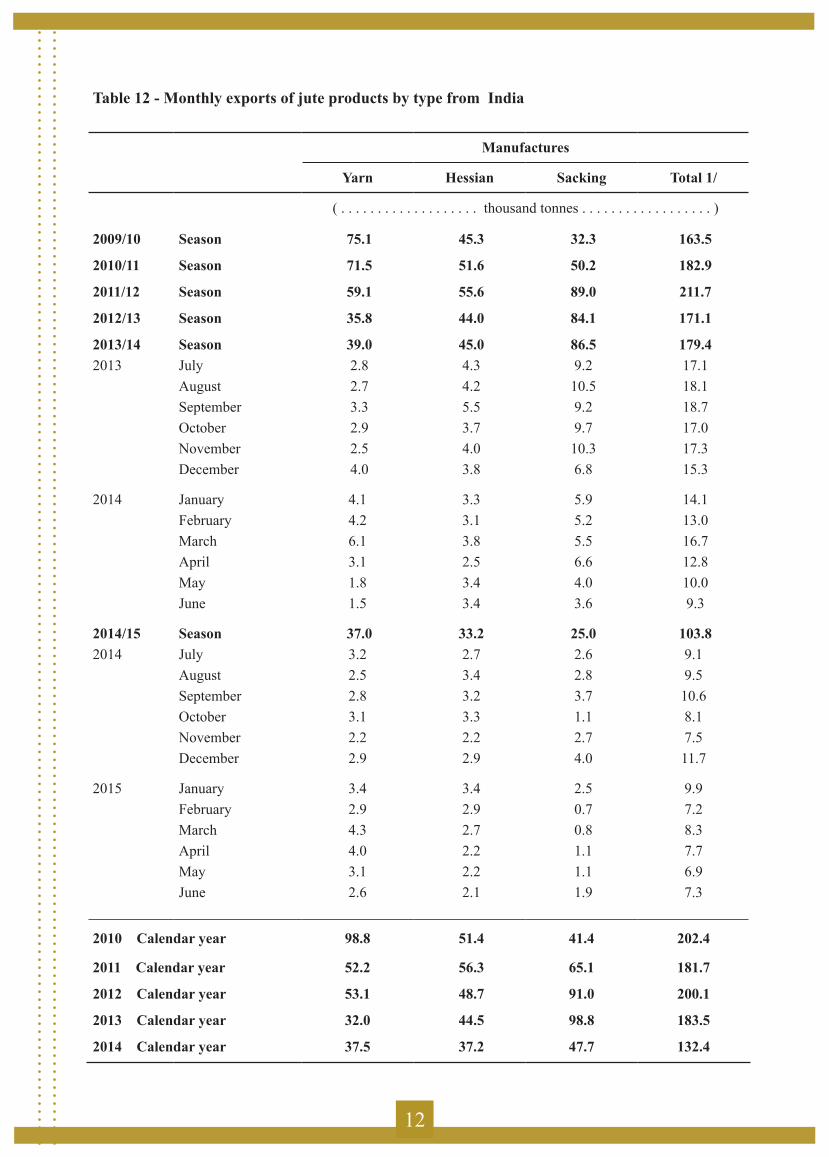
Table 12 - Monthly exports of jute products by type from India
Manufactures
Yarn Hessian Sacking Total 1/
( . . . . . . . . . . . . . . . . . . . thousand tonnes . . . . . . . . . . . . . . . . . . )
2009/10 Season 75.1 45.3 32.3 163.5
2010/11 Season 71.5 51.6 50.2 182.9
2011/12 Season 59.1 55.6 89.0 211.7
2012/13 Season 35.8 44.0 84.1 171.1
2013/14 Season 39.0 45.0 86.5 179.42013 July 2.8 4.3 9.2 17.1
August 2.7 4.2 10.5 18.1September 3.3 5.5 9.2 18.7October 2.9 3.7 9.7 17.0November 2.5 4.0 10.3 17.3December 4.0 3.8 6.8 15.3
2014 January 4.1 3.3 5.9 14.1February 4.2 3.1 5.2 13.0March 6.1 3.8 5.5 16.7April 3.1 2.5 6.6 12.8May 1.8 3.4 4.0 10.0June 1.5 3.4 3.6 9.3
2014/15 Season 37.0 33.2 25.0 103.82014 July 3.2 2.7 2.6 9.1
August 2.5 3.4 2.8 9.5 September 2.8 3.2 3.7 10.6 October 3.1 3.3 1.1 8.1 November 2.2 2.2 2.7 7.5 December 2.9 2.9 4.0 11.7
2015 January 3.4 3.4 2.5 9.9 February 2.9 2.9 0.7 7.2 March 4.3 2.7 0.8 8.3 April 4.0 2.2 1.1 7.7 May 3.1 2.2 1.1 6.9 June 2.6 2.1 1.9 7.3
2010 Calendar year 98.8 51.4 41.4 202.4
2011 Calendar year 52.2 56.3 65.1 181.7
2012 Calendar year 53.1 48.7 91.0 200.1
2013 Calendar year 32.0 44.5 98.8 183.5
2014 Calendar year 37.5 37.2 47.7 132.4
13
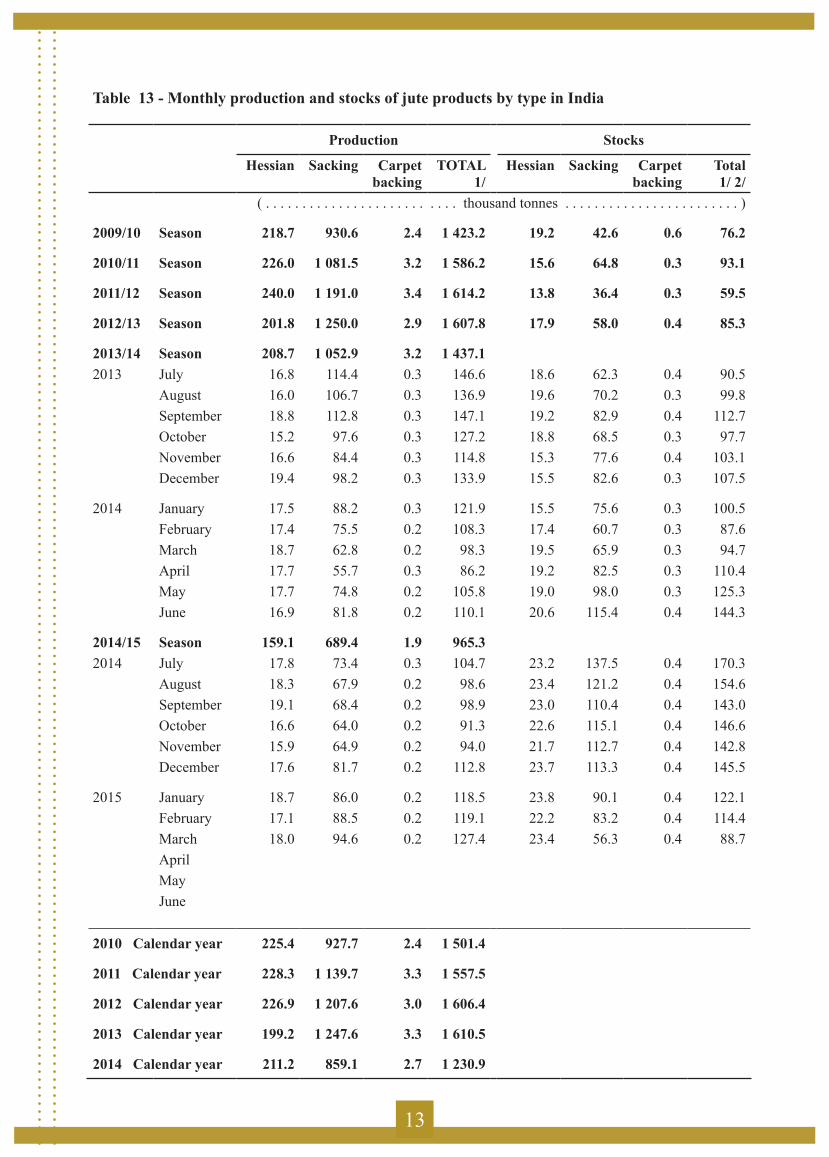
Table 13 - Monthly production and stocks of jute products by type in India
Production Stocks
Hessian Sacking Carpet backing
TOTAL 1/
Hessian Sacking Carpet backing
Total 1/ 2/
( . . . . . . . . . . . . . . . . . . . . . . . . . . thousand tonnes . . . . . . . . . . . . . . . . . . . . . . . . )
2009/10 Season 218.7 930.6 2.4 1 423.2 19.2 42.6 0.6 76.2
2010/11 Season 226.0 1 081.5 3.2 1 586.2 15.6 64.8 0.3 93.1
2011/12 Season 240.0 1 191.0 3.4 1 614.2 13.8 36.4 0.3 59.5
2012/13 Season 201.8 1 250.0 2.9 1 607.8 17.9 58.0 0.4 85.3
2013/14 Season 208.7 1 052.9 3.2 1 437.12013 July 16.8 114.4 0.3 146.6 18.6 62.3 0.4 90.5
August 16.0 106.7 0.3 136.9 19.6 70.2 0.3 99.8September 18.8 112.8 0.3 147.1 19.2 82.9 0.4 112.7October 15.2 97.6 0.3 127.2 18.8 68.5 0.3 97.7November 16.6 84.4 0.3 114.8 15.3 77.6 0.4 103.1December 19.4 98.2 0.3 133.9 15.5 82.6 0.3 107.5
2014 January 17.5 88.2 0.3 121.9 15.5 75.6 0.3 100.5 February 17.4 75.5 0.2 108.3 17.4 60.7 0.3 87.6 March 18.7 62.8 0.2 98.3 19.5 65.9 0.3 94.7 April 17.7 55.7 0.3 86.2 19.2 82.5 0.3 110.4 May 17.7 74.8 0.2 105.8 19.0 98.0 0.3 125.3 June 16.9 81.8 0.2 110.1 20.6 115.4 0.4 144.3
2014/15 Season 159.1 689.4 1.9 965.32014 July 17.8 73.4 0.3 104.7 23.2 137.5 0.4 170.3
August 18.3 67.9 0.2 98.6 23.4 121.2 0.4 154.6September 19.1 68.4 0.2 98.9 23.0 110.4 0.4 143.0October 16.6 64.0 0.2 91.3 22.6 115.1 0.4 146.6November 15.9 64.9 0.2 94.0 21.7 112.7 0.4 142.8December 17.6 81.7 0.2 112.8 23.7 113.3 0.4 145.5
2015 January 18.7 86.0 0.2 118.5 23.8 90.1 0.4 122.1February 17.1 88.5 0.2 119.1 22.2 83.2 0.4 114.4March 18.0 94.6 0.2 127.4 23.4 56.3 0.4 88.7AprilMayJune
2010 Calendar year 225.4 927.7 2.4 1 501.4
2011 Calendar year 228.3 1 139.7 3.3 1 557.5
2012 Calendar year 226.9 1 207.6 3.0 1 606.4
2013 Calendar year 199.2 1 247.6 3.3 1 610.5
2014 Calendar year 211.2 859.1 2.7 1 230.9

14
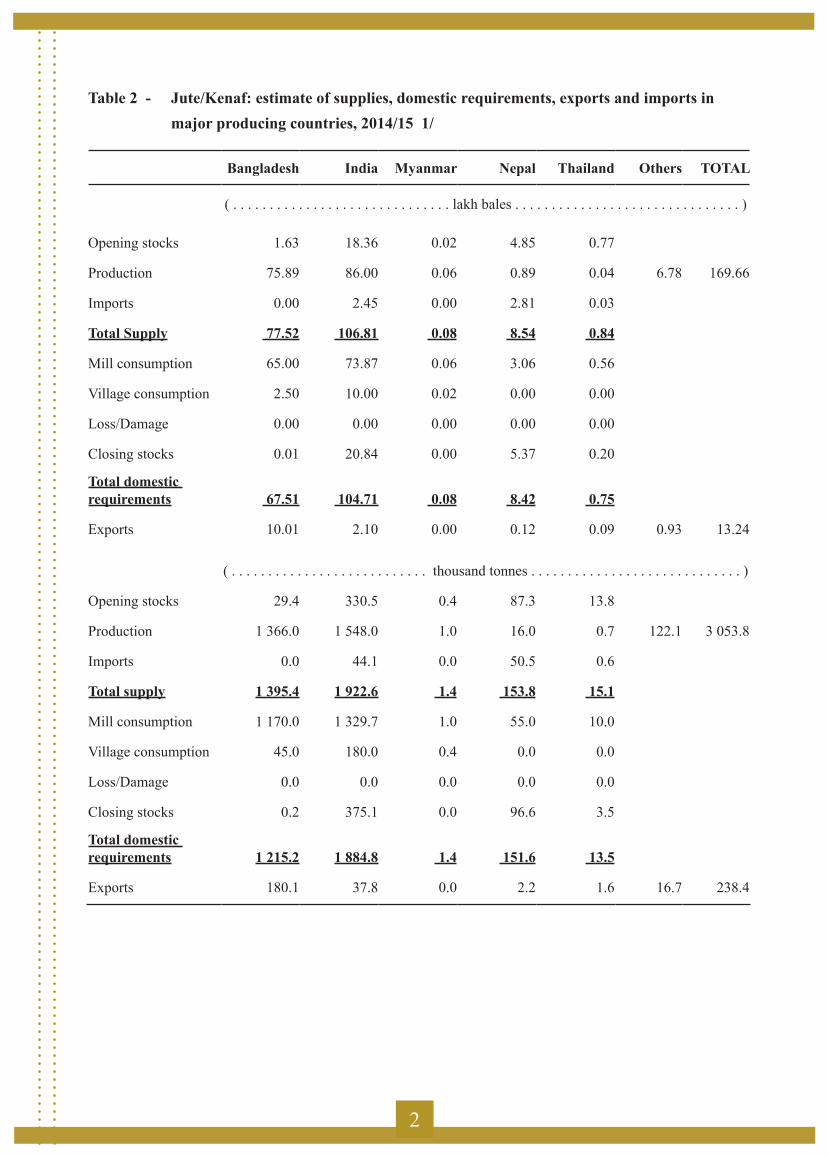
Table 14 - Closing stocks and mill consumption of jute, kenaf and allied fibres in the major producing countries
2010/11 2011/12 2012/13 2013/14 2014/15(preliminary)
(......................................thousand tonnes......................................)
Stocks of fibre end of season Bangladesh 189.9 274.8 67.5 29.4 0.2 India 185.6 355.3 342.7 330.5 375.1 Myanmar 26.3 19.5 5.8 0.4 0.0 Nepal 55.4 64.9 78.1 87.3 96.6 Thailand 102.6 68.2 38.8 13.8 3.5Total 559.9 782.7 532.9 461.4 475.4
Mill consumption Bangladesh 794.9 861.8 1155.2 1170.0 1170 India 1553.5 1623.2 1621.3 1460.7 1329.7 Myanmar 12.0 11.0 11.0 5.0 1.0 Nepal 46.2 45.0 50.0 55.0 55.0 Thailand 40.0 40.0 40.0 30.0 10.0Total 2446.6 2581.0 2877.5 2720.7 2565.7
Percent of stocks tomill consumption 22.9 30.3 18.5 17.0 18.5
0.0
50.0
100.0
150.0
200.0
250.0
300.0
350.0
400.0
2010/11 2011/12 2012/13 2013/14 2014/15
thou
sand
tonn
es
Closing Stocks of Fibrein major producing countries
India
Bangladesh

15
Table 15 - Monthly export value of jute products by type from India
MANUFACTURES
Yarn Hessian Sacking Total 1/
( . . . . . . . . . . . . . . . million USD . . . . . . . . . . . . . . . . . )
2009/10 Season 73.5 49.1 25.4 163.0 2010/11 Season 92.7 57.0 51.3 216.0 2011/12 Season 64.4 75.7 101.5 252.8 2012/13 Season 34.7 48.5 89.6 184.2 2013/14 Season 40.4 51.2 90.1 200.3 2013 July 2.9 5.6 9.6 20.0
August 2.5 4.4 10.3 18.6 September 3.2 6.0 9.3 19.8 October 2.9 4.1 10.1 18.6 November 2.5 4.6 10.8 19.0 December 3.9 4.3 7.0 16.8
2014 January 4.0 3.7 6.1 15.6 February 3.9 4.9 5.2 15.1 March 5.8 4.1 5.5 18.4 April 2.9 2.7 6.7 13.7 May 2.9 3.0 5.1 12.3 June 3.0 3.5 4.5 12.4
2014/15 Season 35.1 42.0 24.3 129.3 2014 July 3.0 3.7 2.9 10.9
August 2.3 4.3 3.1 11.3 September 2.7 3.8 4.0 12.1 October 2.9 3.9 1.2 9.1 November 2.1 2.7 2.8 8.4 December 2.7 3.4 4.0 13.7
2015 January 3.2 4.1 2.5 10.8February 2.7 3.5 0.7 8.2March 4.1 3.1 0.8 15.6April 3.2 3.2 0.8 10.4May 3.1 3.1 0.8 9.4June 3.1 3.1 0.8 9.4
2010 Calendar year 114.7 57.8 36.7 224.3 2011 Calendar year 65.1 78.8 77.4 234.3 2012 Calendar year 53.5 51.0 96.3 211.0 2013 Calendar year 31.4 51.3 104.5 201.5 2014 Calendar year 38.2 44.0 50.9 153.0
16
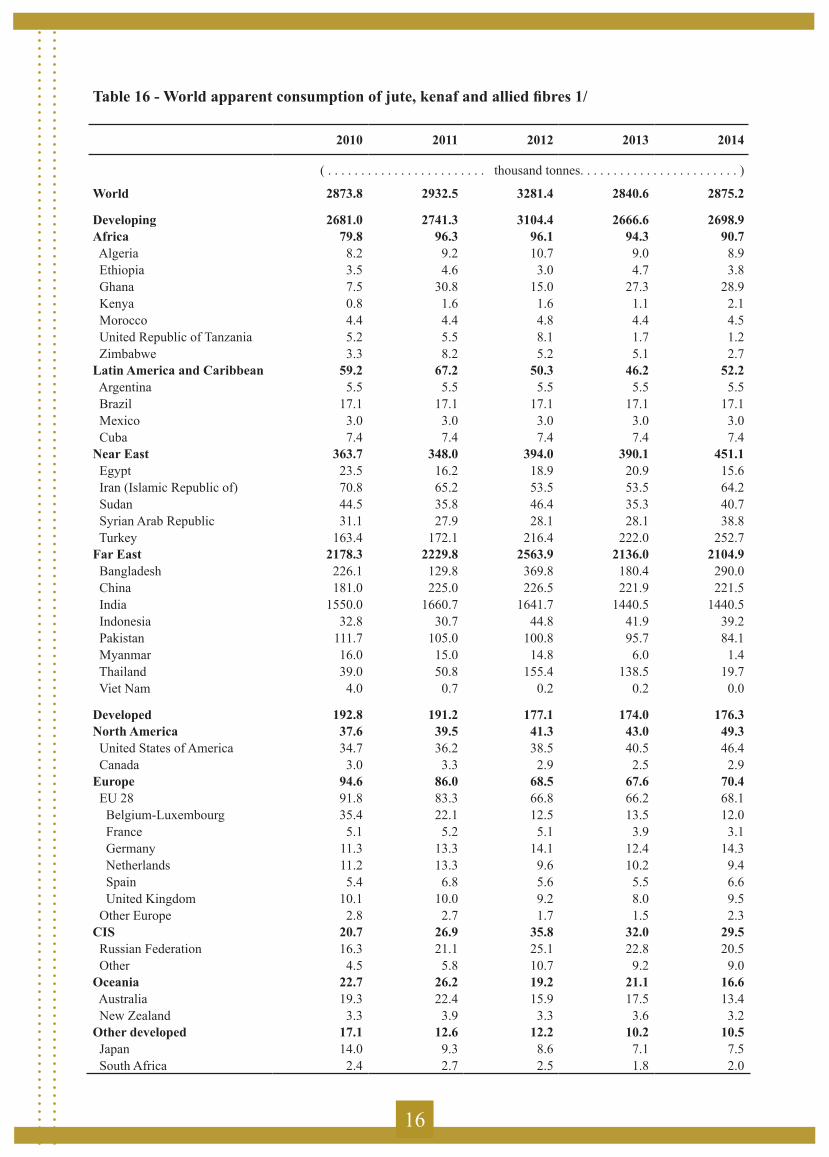
Table 16 - World apparent consumption of jute, kenaf and allied fibres 1/
2010 2011 2012 2013 2014
( . . . . . . . . . . . . . . . . . . . . . . . . thousand tonnes. . . . . . . . . . . . . . . . . . . . . . . . )
World 2873.8 2932.5 3281.4 2840.6 2875.2
Developing 2681.0 2741.3 3104.4 2666.6 2698.9Africa 79.8 96.3 96.1 94.3 90.7 Algeria 8.2 9.2 10.7 9.0 8.9 Ethiopia 3.5 4.6 3.0 4.7 3.8 Ghana 7.5 30.8 15.0 27.3 28.9 Kenya 0.8 1.6 1.6 1.1 2.1 Morocco 4.4 4.4 4.8 4.4 4.5 United Republic of Tanzania 5.2 5.5 8.1 1.7 1.2 Zimbabwe 3.3 8.2 5.2 5.1 2.7Latin America and Caribbean 59.2 67.2 50.3 46.2 52.2 Argentina 5.5 5.5 5.5 5.5 5.5 Brazil 17.1 17.1 17.1 17.1 17.1 Mexico 3.0 3.0 3.0 3.0 3.0 Cuba 7.4 7.4 7.4 7.4 7.4Near East 363.7 348.0 394.0 390.1 451.1 Egypt 23.5 16.2 18.9 20.9 15.6 Iran (Islamic Republic of) 70.8 65.2 53.5 53.5 64.2 Sudan 44.5 35.8 46.4 35.3 40.7 Syrian Arab Republic 31.1 27.9 28.1 28.1 38.8 Turkey 163.4 172.1 216.4 222.0 252.7Far East 2178.3 2229.8 2563.9 2136.0 2104.9 Bangladesh 226.1 129.8 369.8 180.4 290.0 China 181.0 225.0 226.5 221.9 221.5 India 1550.0 1660.7 1641.7 1440.5 1440.5 Indonesia 32.8 30.7 44.8 41.9 39.2 Pakistan 111.7 105.0 100.8 95.7 84.1 Myanmar 16.0 15.0 14.8 6.0 1.4 Thailand 39.0 50.8 155.4 138.5 19.7 Viet Nam 4.0 0.7 0.2 0.2 0.0
Developed 192.8 191.2 177.1 174.0 176.3North America 37.6 39.5 41.3 43.0 49.3 United States of America 34.7 36.2 38.5 40.5 46.4 Canada 3.0 3.3 2.9 2.5 2.9Europe 94.6 86.0 68.5 67.6 70.4 EU 28 91.8 83.3 66.8 66.2 68.1 Belgium-Luxembourg 35.4 22.1 12.5 13.5 12.0 France 5.1 5.2 5.1 3.9 3.1 Germany 11.3 13.3 14.1 12.4 14.3 Netherlands 11.2 13.3 9.6 10.2 9.4 Spain 5.4 6.8 5.6 5.5 6.6 United Kingdom 10.1 10.0 9.2 8.0 9.5 Other Europe 2.8 2.7 1.7 1.5 2.3CIS 20.7 26.9 35.8 32.0 29.5 Russian Federation 16.3 21.1 25.1 22.8 20.5 Other 4.5 5.8 10.7 9.2 9.0Oceania 22.7 26.2 19.2 21.1 16.6 Australia 19.3 22.4 15.9 17.5 13.4 New Zealand 3.3 3.9 3.3 3.6 3.2Other developed 17.1 12.6 12.2 10.2 10.5 Japan 14.0 9.3 8.6 7.1 7.5 South Africa 2.4 2.7 2.5 1.8 2.0
17
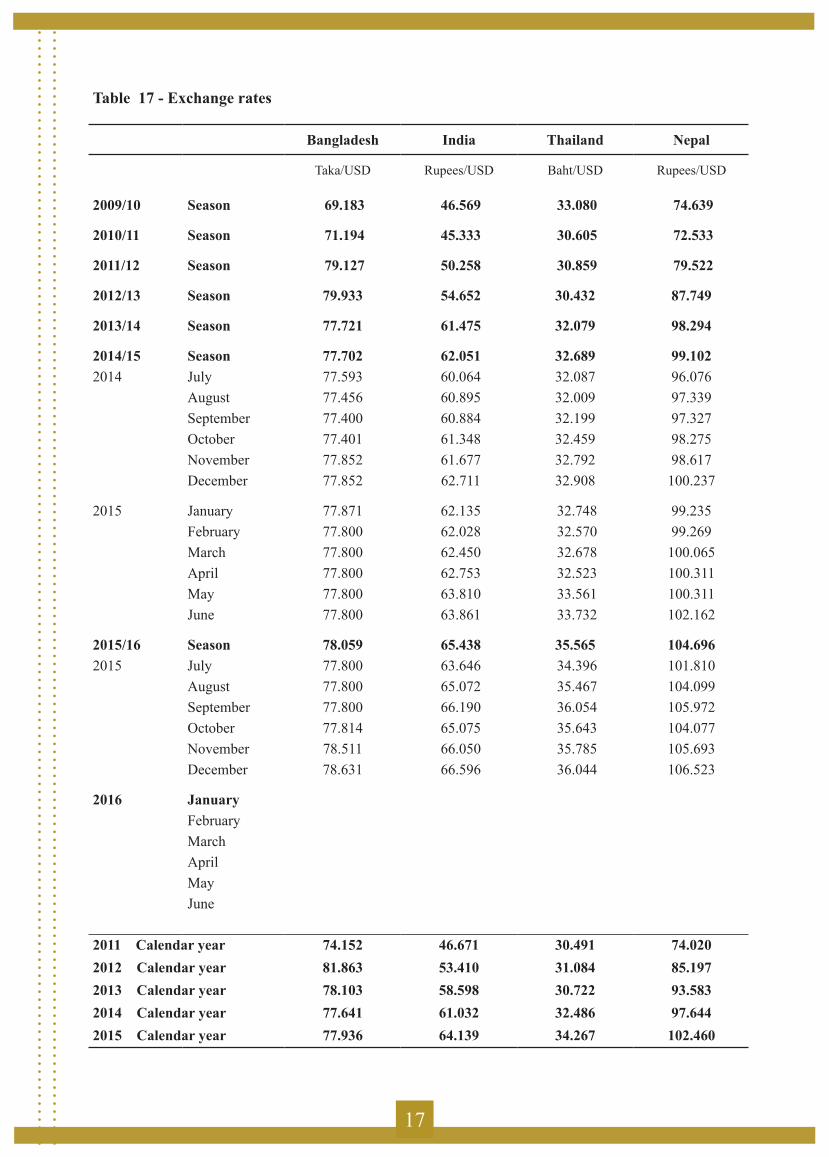
Table 17 - Exchange rates
Bangladesh India Thailand Nepal
Taka/USD Rupees/USD Baht/USD Rupees/USD
2009/10 Season 69.183 46.569 33.080 74.639
2010/11 Season 71.194 45.333 30.605 72.533
2011/12 Season 79.127 50.258 30.859 79.522
2012/13 Season 79.933 54.652 30.432 87.749
2013/14 Season 77.721 61.475 32.079 98.294
2014/15 Season 77.702 62.051 32.689 99.1022014 July 77.593 60.064 32.087 96.076
August 77.456 60.895 32.009 97.339September 77.400 60.884 32.199 97.327October 77.401 61.348 32.459 98.275November 77.852 61.677 32.792 98.617December 77.852 62.711 32.908 100.237
2015 January 77.871 62.135 32.748 99.235February 77.800 62.028 32.570 99.269March 77.800 62.450 32.678 100.065April 77.800 62.753 32.523 100.311May 77.800 63.810 33.561 100.311June 77.800 63.861 33.732 102.162
2015/16 Season 78.059 65.438 35.565 104.6962015 July 77.800 63.646 34.396 101.810
August 77.800 65.072 35.467 104.099September 77.800 66.190 36.054 105.972October 77.814 65.075 35.643 104.077November 78.511 66.050 35.785 105.693December 78.631 66.596 36.044 106.523
2016 JanuaryFebruaryMarchAprilMayJune
2011 Calendar year 74.152 46.671 30.491 74.0202012 Calendar year 81.863 53.410 31.084 85.1972013 Calendar year 78.103 58.598 30.722 93.5832014 Calendar year 77.641 61.032 32.486 97.6442015 Calendar year 77.936 64.139 34.267 102.460
18
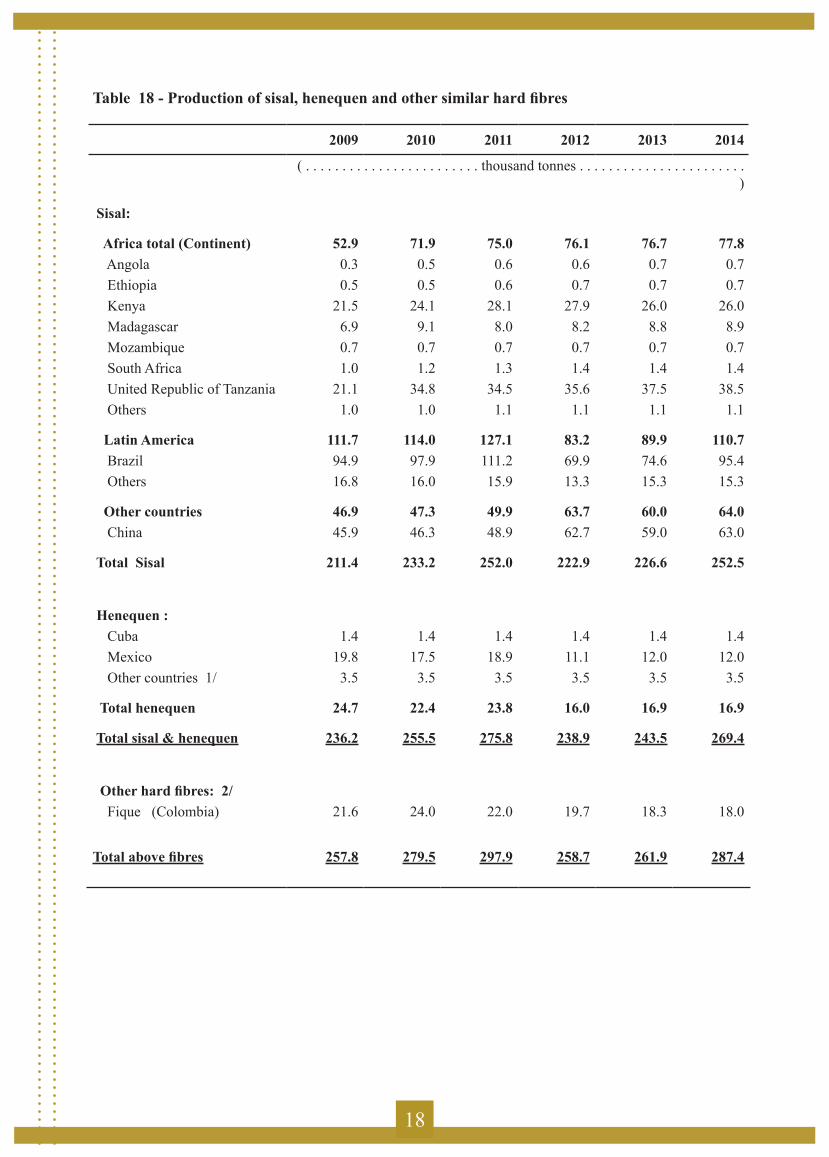
Table 18 - Production of sisal, henequen and other similar hard fibres
2009 2010 2011 2012 2013 2014
( . . . . . . . . . . . . . . . . . . . . . . . . thousand tonnes . . . . . . . . . . . . . . . . . . . . . . . )
Sisal:
Africa total (Continent) 52.9 71.9 75.0 76.1 76.7 77.8 Angola 0.3 0.5 0.6 0.6 0.7 0.7 Ethiopia 0.5 0.5 0.6 0.7 0.7 0.7 Kenya 21.5 24.1 28.1 27.9 26.0 26.0 Madagascar 6.9 9.1 8.0 8.2 8.8 8.9 Mozambique 0.7 0.7 0.7 0.7 0.7 0.7 South Africa 1.0 1.2 1.3 1.4 1.4 1.4 United Republic of Tanzania 21.1 34.8 34.5 35.6 37.5 38.5 Others 1.0 1.0 1.1 1.1 1.1 1.1
Latin America 111.7 114.0 127.1 83.2 89.9 110.7 Brazil 94.9 97.9 111.2 69.9 74.6 95.4 Others 16.8 16.0 15.9 13.3 15.3 15.3
Other countries 46.9 47.3 49.9 63.7 60.0 64.0 China 45.9 46.3 48.9 62.7 59.0 63.0
Total Sisal 211.4 233.2 252.0 222.9 226.6 252.5
Henequen : Cuba 1.4 1.4 1.4 1.4 1.4 1.4 Mexico 19.8 17.5 18.9 11.1 12.0 12.0 Other countries 1/ 3.5 3.5 3.5 3.5 3.5 3.5
Total henequen 24.7 22.4 23.8 16.0 16.9 16.9
Total sisal & henequen 236.2 255.5 275.8 238.9 243.5 269.4
Other hard fibres: 2/ Fique (Colombia) 21.6 24.0 22.0 19.7 18.3 18.0
Total above fibres 257.8 279.5 297.9 258.7 261.9 287.4
19
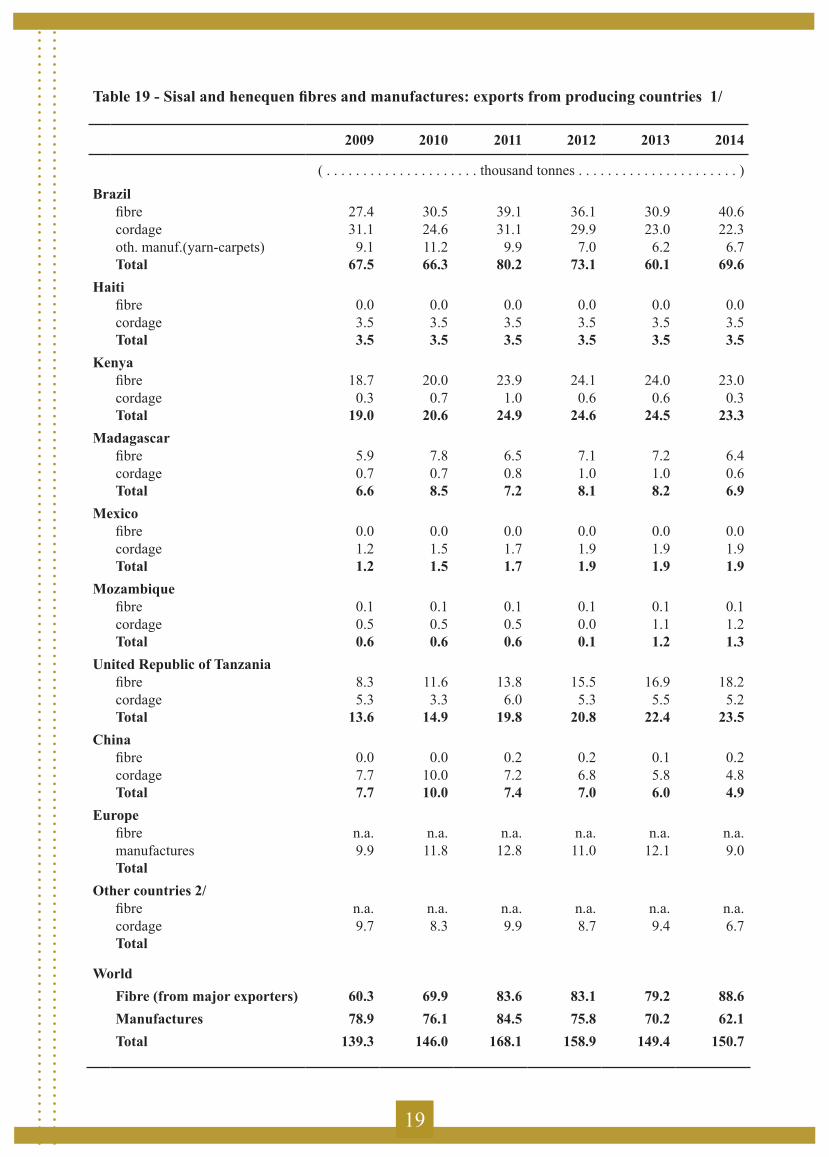
Table 19 - Sisal and henequen fibres and manufactures: exports from producing countries 1/
2009 2010 2011 2012 2013 2014
( . . . . . . . . . . . . . . . . . . . . . thousand tonnes . . . . . . . . . . . . . . . . . . . . . . )Brazil
fibre 27.4 30.5 39.1 36.1 30.9 40.6cordage 31.1 24.6 31.1 29.9 23.0 22.3oth. manuf.(yarn-carpets) 9.1 11.2 9.9 7.0 6.2 6.7Total 67.5 66.3 80.2 73.1 60.1 69.6
Haitifibre 0.0 0.0 0.0 0.0 0.0 0.0cordage 3.5 3.5 3.5 3.5 3.5 3.5Total 3.5 3.5 3.5 3.5 3.5 3.5
Kenyafibre 18.7 20.0 23.9 24.1 24.0 23.0cordage 0.3 0.7 1.0 0.6 0.6 0.3Total 19.0 20.6 24.9 24.6 24.5 23.3
Madagascarfibre 5.9 7.8 6.5 7.1 7.2 6.4cordage 0.7 0.7 0.8 1.0 1.0 0.6Total 6.6 8.5 7.2 8.1 8.2 6.9
Mexicofibre 0.0 0.0 0.0 0.0 0.0 0.0cordage 1.2 1.5 1.7 1.9 1.9 1.9Total 1.2 1.5 1.7 1.9 1.9 1.9
Mozambiquefibre 0.1 0.1 0.1 0.1 0.1 0.1cordage 0.5 0.5 0.5 0.0 1.1 1.2Total 0.6 0.6 0.6 0.1 1.2 1.3
United Republic of Tanzaniafibre 8.3 11.6 13.8 15.5 16.9 18.2cordage 5.3 3.3 6.0 5.3 5.5 5.2Total 13.6 14.9 19.8 20.8 22.4 23.5
Chinafibre 0.0 0.0 0.2 0.2 0.1 0.2cordage 7.7 10.0 7.2 6.8 5.8 4.8Total 7.7 10.0 7.4 7.0 6.0 4.9
Europefibre n.a. n.a. n.a. n.a. n.a. n.a.manufactures 9.9 11.8 12.8 11.0 12.1 9.0Total
Other countries 2/fibre n.a. n.a. n.a. n.a. n.a. n.a.cordage 9.7 8.3 9.9 8.7 9.4 6.7Total
WorldFibre (from major exporters) 60.3 69.9 83.6 83.1 79.2 88.6Manufactures 78.9 76.1 84.5 75.8 70.2 62.1Total 139.3 146.0 168.1 158.9 149.4 150.7
20
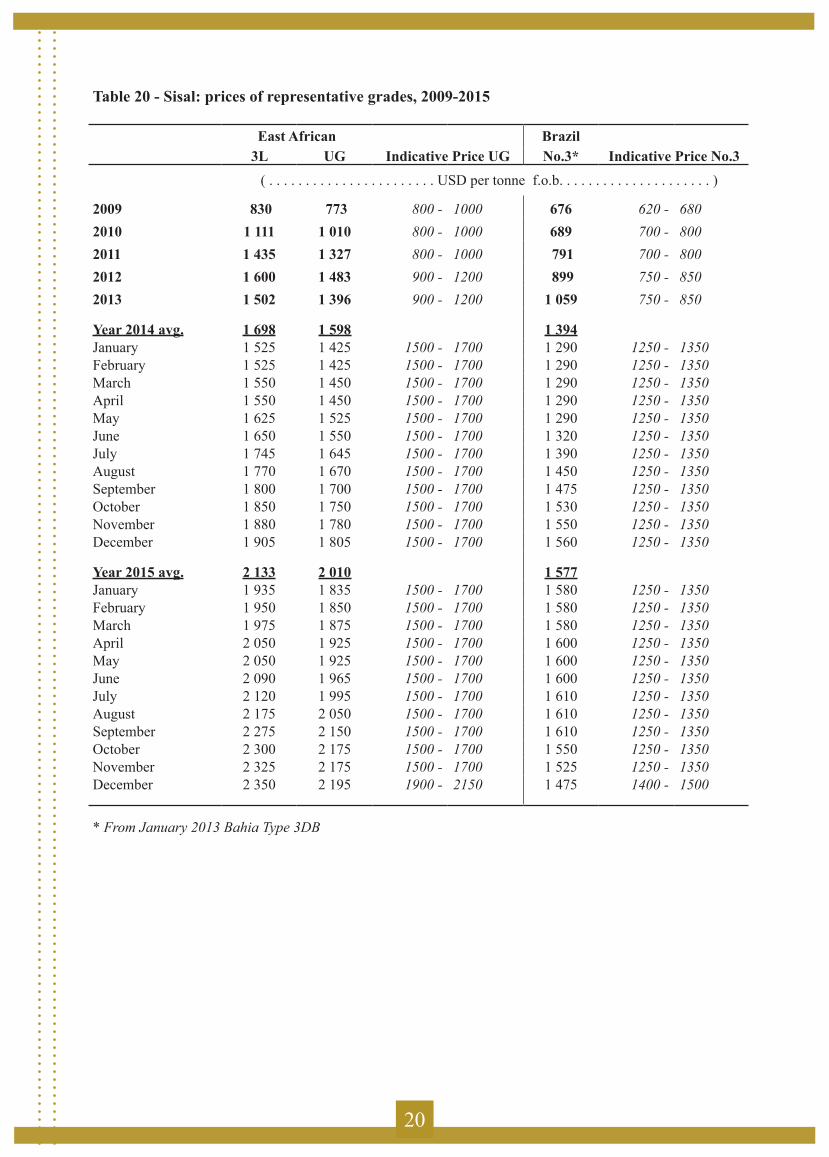
Table 20 - Sisal: prices of representative grades, 2009-2015
East African Brazil3L UG Indicative Price UG No.3* Indicative Price No.3 ( . . . . . . . . . . . . . . . . . . . . . . . USD per tonne f.o.b. . . . . . . . . . . . . . . . . . . . . )
2009 830 773 800 - 1000 676 620 - 6802010 1 111 1 010 800 - 1000 689 700 - 8002011 1 435 1 327 800 - 1000 791 700 - 8002012 1 600 1 483 900 - 1200 899 750 - 8502013 1 502 1 396 900 - 1200 1 059 750 - 850
Year 2014 avg. 1 698 1 598 1 394January 1 525 1 425 1500 - 1700 1 290 1250 - 1350February 1 525 1 425 1500 - 1700 1 290 1250 - 1350March 1 550 1 450 1500 - 1700 1 290 1250 - 1350April 1 550 1 450 1500 - 1700 1 290 1250 - 1350May 1 625 1 525 1500 - 1700 1 290 1250 - 1350June 1 650 1 550 1500 - 1700 1 320 1250 - 1350July 1 745 1 645 1500 - 1700 1 390 1250 - 1350August 1 770 1 670 1500 - 1700 1 450 1250 - 1350September 1 800 1 700 1500 - 1700 1 475 1250 - 1350October 1 850 1 750 1500 - 1700 1 530 1250 - 1350November 1 880 1 780 1500 - 1700 1 550 1250 - 1350December 1 905 1 805 1500 - 1700 1 560 1250 - 1350
Year 2015 avg. 2 133 2 010 1 577January 1 935 1 835 1500 - 1700 1 580 1250 - 1350February 1 950 1 850 1500 - 1700 1 580 1250 - 1350March 1 975 1 875 1500 - 1700 1 580 1250 - 1350April 2 050 1 925 1500 - 1700 1 600 1250 - 1350May 2 050 1 925 1500 - 1700 1 600 1250 - 1350June 2 090 1 965 1500 - 1700 1 600 1250 - 1350July 2 120 1 995 1500 - 1700 1 610 1250 - 1350August 2 175 2 050 1500 - 1700 1 610 1250 - 1350September 2 275 2 150 1500 - 1700 1 610 1250 - 1350October 2 300 2 175 1500 - 1700 1 550 1250 - 1350November 2 325 2 175 1500 - 1700 1 525 1250 - 1350December 2 350 2 195 1900 - 2150 1 475 1400 - 1500
* From January 2013 Bahia Type 3DB

21
Table 21 - Sisal : imports of raw fibre
2009 2010 2011 2012 2013 2014
( . . . . . . . . . . . . . . . . . . . . . thousand tonnes . . . . . . . . . . . . . . . . . . . . )
World 63.6 64.1 81.2 81.6 76.5 86.7
Developed 18.9 19.0 23.0 23.1 20.9 23.1
North America 0.2 0.1 0.1 0.2 0.1 0.1
Europe 17.8 17.8 21.5 22.2 19.8 21.9
CIS 0.1 0.1 0.3 0.0 0.2 0.2
Oceania 0.0 0.0 0.0 0.0 0.1 0.1
Other Developed 0.8 1.0 1.1 0.7 0.8 0.8
Developing 44.7 45.1 58.2 58.6 55.6 63.6
Africa 7.0 6.8 8.5 11.3 8.9 10.5
Latin America 4.2 4.9 3.3 4.1 4.1 2.8
Near East 3.9 3.5 4.6 5.6 4.6 4.4
Far East 29.7 29.9 41.8 37.5 38.0 45.9
22
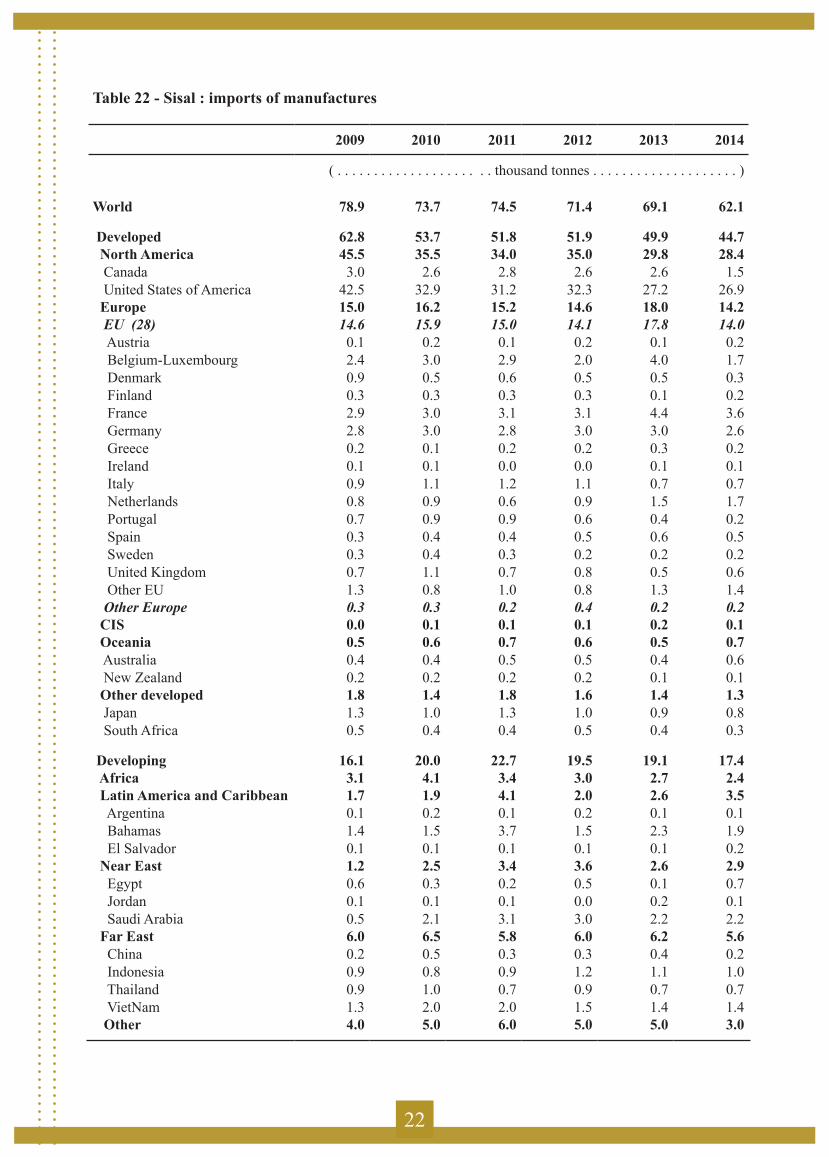
Table 22 - Sisal : imports of manufactures
2009 2010 2011 2012 2013 2014
( . . . . . . . . . . . . . . . . . . . . . thousand tonnes . . . . . . . . . . . . . . . . . . . . )
World 78.9 73.7 74.5 71.4 69.1 62.1
Developed 62.8 53.7 51.8 51.9 49.9 44.7 North America 45.5 35.5 34.0 35.0 29.8 28.4 Canada 3.0 2.6 2.8 2.6 2.6 1.5 United States of America 42.5 32.9 31.2 32.3 27.2 26.9 Europe 15.0 16.2 15.2 14.6 18.0 14.2 EU (28) 14.6 15.9 15.0 14.1 17.8 14.0 Austria 0.1 0.2 0.1 0.2 0.1 0.2 Belgium-Luxembourg 2.4 3.0 2.9 2.0 4.0 1.7 Denmark 0.9 0.5 0.6 0.5 0.5 0.3 Finland 0.3 0.3 0.3 0.3 0.1 0.2 France 2.9 3.0 3.1 3.1 4.4 3.6 Germany 2.8 3.0 2.8 3.0 3.0 2.6 Greece 0.2 0.1 0.2 0.2 0.3 0.2 Ireland 0.1 0.1 0.0 0.0 0.1 0.1 Italy 0.9 1.1 1.2 1.1 0.7 0.7 Netherlands 0.8 0.9 0.6 0.9 1.5 1.7 Portugal 0.7 0.9 0.9 0.6 0.4 0.2 Spain 0.3 0.4 0.4 0.5 0.6 0.5 Sweden 0.3 0.4 0.3 0.2 0.2 0.2 United Kingdom 0.7 1.1 0.7 0.8 0.5 0.6 Other EU 1.3 0.8 1.0 0.8 1.3 1.4 Other Europe 0.3 0.3 0.2 0.4 0.2 0.2 CIS 0.0 0.1 0.1 0.1 0.2 0.1 Oceania 0.5 0.6 0.7 0.6 0.5 0.7 Australia 0.4 0.4 0.5 0.5 0.4 0.6 New Zealand 0.2 0.2 0.2 0.2 0.1 0.1 Other developed 1.8 1.4 1.8 1.6 1.4 1.3 Japan 1.3 1.0 1.3 1.0 0.9 0.8 South Africa 0.5 0.4 0.4 0.5 0.4 0.3
Developing 16.1 20.0 22.7 19.5 19.1 17.4 Africa 3.1 4.1 3.4 3.0 2.7 2.4 Latin America and Caribbean 1.7 1.9 4.1 2.0 2.6 3.5 Argentina 0.1 0.2 0.1 0.2 0.1 0.1 Bahamas 1.4 1.5 3.7 1.5 2.3 1.9 El Salvador 0.1 0.1 0.1 0.1 0.1 0.2 Near East 1.2 2.5 3.4 3.6 2.6 2.9 Egypt 0.6 0.3 0.2 0.5 0.1 0.7 Jordan 0.1 0.1 0.1 0.0 0.2 0.1 Saudi Arabia 0.5 2.1 3.1 3.0 2.2 2.2 Far East 6.0 6.5 5.8 6.0 6.2 5.6 China 0.2 0.5 0.3 0.3 0.4 0.2 Indonesia 0.9 0.8 0.9 1.2 1.1 1.0 Thailand 0.9 1.0 0.7 0.9 0.7 0.7 VietNam 1.3 2.0 2.0 1.5 1.4 1.4 Other 4.0 5.0 6.0 5.0 5.0 3.0

23
Table 23 - Production of abaca
2009 2010 2011 2012 2013 2014
( . . . . . . . . . . . . . . . . . . . thousand tonnes . . . . . . . . . . . . . . . . )
Ecuador 10.4 10.2 9.6 11.1 9.4 8.4 Philippines 54.6 57.2 73.3 64.8 56.0 66.0 Other countries 2.9 2.7 3.2 2.2 2.3 2.3
Total above countries 67.9 70.1 86.1 78.1 67.7 76.7
Table 24 - Abaca: exports of fibre and manufactures from producing countries
2009 2010 2011 2012 2013 2014
( . . . . . . . . . . . . . . . . . . . thousand tonnes . . . . . . . . . . . . . . . . )
Ecuador Fibre 10.4 10.2 9.6 11.1 9.4 8.4 Cordage 0.0 0.0 0.0 0.0 0.0 0.0 Total 10.4 10.2 9.6 11.1 9.4 8.4
Philippines Fibre 7.4 11.3 9.8 4.5 3.3 9.8 Cordage 5.3 7.0 7.5 5.0 4.2 5.1 Pulp 12.0 20.9 29.8 21.5 17.6 20.9 Other 1.3 1.6 1.4 2.4 2.0 2.5 Total 26.0 40.7 48.5 33.3 27.2 38.3
Total exports 36.4 50.9 58.1 44.4 36.6 46.7
Total exports in fibre equivalent Fibre 17.8 21.5 19.4 15.5 12.7 18.1 Cordage 5.6 7.3 7.9 5.2 4.5 5.4 Pulp 24.1 41.8 59.5 43.0 35.2 41.8 Other 1.4 1.8 1.5 2.6 2.2 2.8 Total 48.9 72.3 88.4 66.4 54.6 68.1
Of which: Philippines 38.5 62.1 78.8 55.4 45.2 59.8 Ecuador 10.4 10.2 9.6 11.1 9.4 8.4

24
Table 25 - Abaca: prices of representative grades, 2009-2015 1/
Philippines
Hand-cleaned non-DavaoS2 G JK Indicator Price 2/
f.o.b. Manila port f.o.b. c.i.f. USD per 125 kg. bale USD / bale USD / tonne
Annual average
2009 201.6 181.3 163.7 182.2 1 657.6
2010 193.7 176.8 154.8 175.1 1 600.7
2011 211.9 192.1 170.2 191.4 1 731.1
2012 220.0 197.0 174.3 197.1 1 776.7
2013 222.7 200.3 177.0 200.0 1 800.0
2014 average 235.8 214.8 190.7 213.8 1 910.0January 233.0 211.0 192.0 212.0 1 896.0February 229.0 208.0 189.0 208.7 1 869.3March 229.0 208.0 188.0 208.3 1 866.7April 229.0 208.0 188.0 208.3 1 866.7May 229.0 208.0 188.0 208.3 1 866.7June 229.0 208.0 188.0 208.3 1 866.7July 242.0 221.0 192.0 218.3 1 946.7August 242.0 221.0 192.0 218.3 1 946.7September 242.0 221.0 192.0 218.3 1 946.7October 242.0 221.0 192.0 218.3 1 946.7November 242.0 221.0 192.0 218.3 1 946.7December 242.0 221.0 195.0 219.3 1 954.7
2015 average 257.5 234.3 218.7 236.8 2 094.7January 247.0 221.0 204.0 224.0 1 992.0February 247.0 221.0 204.0 224.0 1 992.0March 247.0 226.0 204.0 225.7 2 005.3April 252.0 230.0 214.0 232.0 2 056.0May 253.0 231.0 216.0 233.3 2 066.7June 256.0 234.0 220.0 236.7 2 093.3July 260.0 237.0 222.0 239.7 2 117.3August 262.0 239.0 225.0 242.0 2 136.0September 263.0 240.0 226.0 243.0 2 144.0October 265.0 242.0 228.0 245.0 2 160.0November 267.0 244.0 228.0 246.3 2 170.7December 271.0 247.0 233.0 250.3 2 202.7

25
Table 26 - Abaca : imports of fibre and manufactures
2009 2010 2011 2012 2013 2014
( . . . . . . . . . . . . . . . . . . thousand tonnes . . . . . . . . . . . . . . . . . . . )
Fibre
World 18.9 25.2 23.8 16.7 15.4 21.0
Developed 16.6 22.1 21.1 15.7 14.7 19.4
Europe 12.6 14.7 13.6 11.6 9.4 12.7 EU (28) 12.6 14.7 13.6 11.6 9.4 12.7
Other developed 4.1 7.4 7.5 4.1 5.3 6.7 Japan 3.7 7.3 7.3 4.0 5.0 6.2 Others 0.3 0.1 0.2 0.1 0.3 0.5
Developing 2.2 3.1 2.7 1.0 0.7 1.5
Manufactures 1/
World 20.9 31.4 41.0 29.8 23.8 27.7
Developed 15.5 25.9 33.2 22.7 20.0 23.7
North America 3.6 6.3 7.7 4.5 3.5 5.1 Canada 0.1 0.1 0.2 0.2 0.2 0.2 United States of America 3.4 6.2 7.5 4.3 3.4 4.9
Europe 8.6 14.8 20.4 13.9 12.6 14.5 EU (28) 8.6 14.8 20.4 13.9 12.6 14.5
Other developed 3.4 4.8 5.1 4.2 3.9 4.1 Japan 3.1 4.5 4.5 3.6 3.3 3.5
Developing 5.4 5.5 7.7 7.1 3.8 4.0
Far East 4.0 4.9 6.4 4.9 3.4 3.8
1/ - Includes pulp

26
Table 27 - Production of coir fibre
2009 2010 2011 2012 2013 2014
( . . . . . . . . . . . . . . . . . . . . thousand tonnes . . . . . . . . . . . . . . . . . . . . )
India (brown fibre) * 394.0 415.5 425.0 431.5 455.8 458.8 Sri Lanka * 169.6 149.8 135.0 131.2 123.7 150.4 Thailand 64.6 63.7 49.9 61.7 64.8 68.1 VietNam 91.1 103.0 97.6 115.1 105.9 143.3 Other countries 57.7 66.5 81.9 84.8 79.3 97.6
Total above countries 777.1 798.5 789.5 824.3 829.4 918.3
White fibre - India 97.0 100.0 100.5 100.0 80.4 81.0Curled fibre - India 49.5 54.2 59.0 63.8 63.8 64.7
Total 923.6 952.7 949.0 988.1 973.6 1 064.0
* India and Sri Lanka production data does not include coir pith
Table 28 - Production of coir yarn
2009 2010 2011 2012 2013 2014
( . . . . . . . . . . . . . . . . . . . . thousand tonnes . . . . . . . . . . . . . . . . . . . . )
India 292.9 296.5 299.5 318.9 321.7 323.9 Sri Lanka 1/ 6.5 7.4 7.3 9.6 9.1 12.3 Thailand 2.0 2.0 2.0 2.0 2.0 2.0
Total above countries 301.4 305.9 308.8 330.5 332.8 338.2

27
Table 29 - Exports of coir fibre
2009 2010 2011 2012 2013 2014
( . . . . . . . . . . . . . . . . . . . . . thousand tonnes . . . . . . . . . . . . . . . . . . )
Developed 6.2 6.7 7.1 9.3 10.3 12.0
EU (28) 5.4 6.0 6.3 8.3 9.3 10.7
Developing 504.4 595.9 641.5 711.6 740.9 905.3
Far East 502.1 592.6 638.8 708.6 738.1 902.4
Sri Lanka 143.7 126.9 114.4 111.2 104.8 127.5of which: bristle fibre 8.3 6.3 9.5 8.2 10.3 16.4
twisted fibre 51.5 36.9 26.8 45.1 41.4 74.7mattress fibre 83.9 83.7 78.2 57.9 53.1 36.3
China 1.0 1.1 1.0 0.8 0.7 0.1 India* 158.7 259.5 321.0 366.0 407.5 505.6 Indonesia 27.8 31.8 46.9 46.2 25.8 35.3 Malaysia 22.4 14.2 12.6 14.0 18.6 11.9 Philippines 9.2 10.2 9.2 10.4 26.5 33.3 Thailand 53.8 53.1 41.6 51.4 54.0 56.8 Singapore 0.2 0.3 0.5 0.7 0.8 1.6 VietNam 85.3 95.5 91.7 107.8 99.5 130.3
Africa 0.0 0.0 0.0 0.0 0.0 0.0
Near East 0.1 0.1 0.1 0.1 0.1 0.1
Latin America 2.3 3.2 2.6 2.9 2.7 2.8 Mexico 1.3 3.2 2.6 2.9 2.7 2.8 Venezuela 1.0 0.0 0.0 0.0 0.0 0.0
Total above countries 510.6 602.5 648.6 720.9 751.3 917.3
Sri Lanka coir pith 82.8 119.5 131.9 133.5 143.9 157.2
Total including coir pith 593.4 722.1 780.5 854.4 895.2 1074.5
* Includes coir pith

28
Table 30 - Exports of coir yarn from producing countries
2009 2010 2011 2012 2013 2014
( . . . . . . . . . . . . . . . . . . . . . . . thousand tonnes . . . . . . . . . . . . . . . . . . . . . . )
Developed 1.0 0.8 0.9 0.5 0.5 0.5 EU (28) 1.0 0.8 0.9 0.5 0.5 0.5
Developing 14.0 12.7 12.9 13.8 13.2 14.7 India 5.6 5.3 5.6 4.5 4.4 4.2 Sri Lanka 1/ 7.3 6.2 6.2 8.2 7.7 10.4 Others 1.1 1.1 1.1 1.1 1.1 0.1
Total above countries 15.0 13.5 13.7 14.3 13.7 15.2
Table 31 - Exports of coir mats, mattings and rugs from principal exporting countries 1/
2009 2010 2011 2012 2013 2014
( . . . . . . . . . . . . . . . . . . . . . . . thousand tonnes . . . . . . . . . . . . . . . . . . . . . . )
Developed 5.0 4.7 4.4 3.0 3.1 2.9
EU (28) 5.0 4.7 4.4 3.0 3.1 2.9 Austria 0.1 0.1 0.1 0.0 0.1 0.1 Belgium-Luxembourg 0.0 0.0 0.0 0.0 0.0 0.0 Denmark 0.1 0.1 0.1 0.1 0.0 0.1 France 0.0 0.0 0.0 0.0 0.0 0.1 Germany 1.0 0.5 0.3 0.3 0.4 0.2 Italy 0.0 0.3 0.3 0.3 0.1 0.2 Netherlands 2.8 3.1 2.8 1.6 1.3 1.7 Portugal 0.0 0.1 0.0 0.0 0.0 0.0 Sweden 0.1 0.1 0.1 0.1 0.1 0.1 United Kingdom 0.3 0.3 0.3 0.2 0.2 0.2 Other EU 0.2 0.2 0.1 0.2 0.5 0.1
Developing 50.9 49.6 49.0 45.6 43.5 51.2 India 2/ 41.5 37.7 35.6 31.1 30.3 34.8 Sri Lanka 2/ 4.1 6.6 7.4 8.3 7.1 9.8 China 0.3 0.3 0.4 0.6 0.5 0.5 Other 5.0 5.0 5.6 5.6 5.6 6.0
Total above countries 55.9 54.3 53.4 48.6 46.6 54.1
2/ - Includes coir Geo Fabrics
29
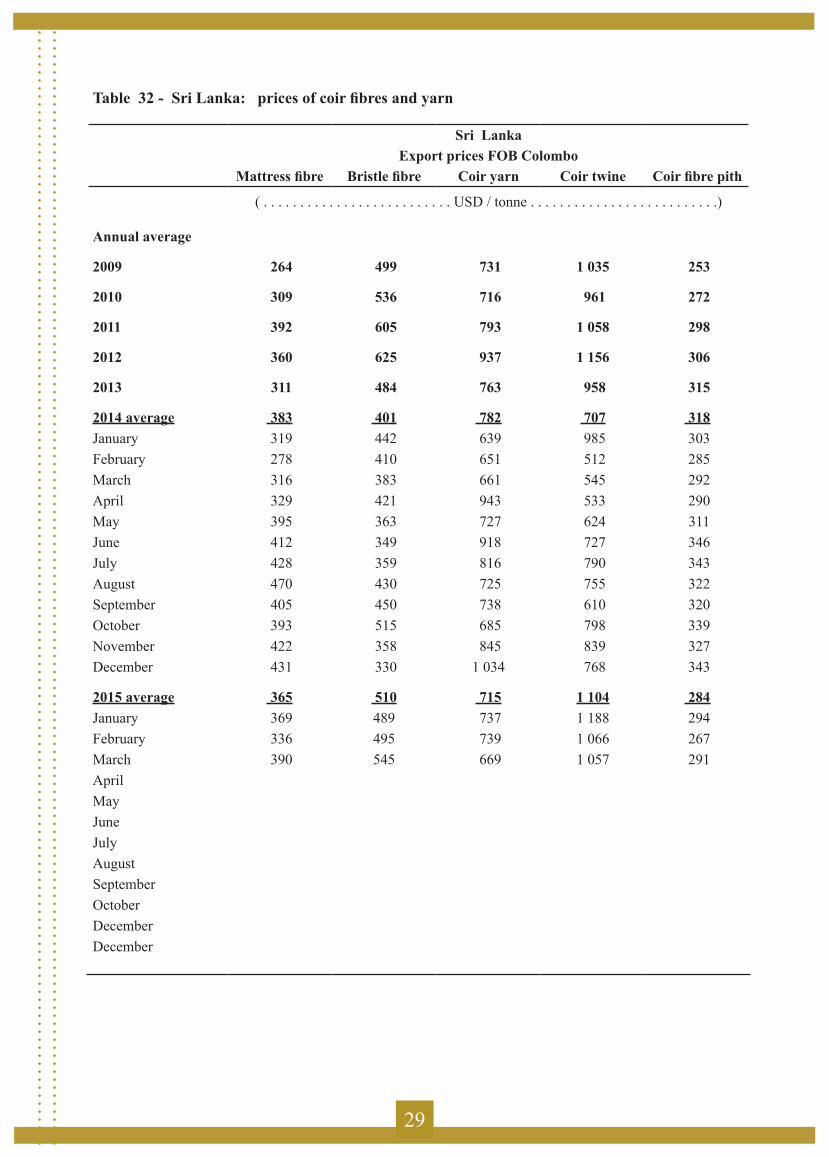
Table 32 - Sri Lanka: prices of coir fibres and yarn
Sri LankaExport prices FOB Colombo
Mattress fibre Bristle fibre Coir yarn Coir twine Coir fibre pith
( . . . . . . . . . . . . . . . . . . . . . . . . . . USD / tonne . . . . . . . . . . . . . . . . . . . . . . . . . .)
Annual average
2009 264 499 731 1 035 253
2010 309 536 716 961 272
2011 392 605 793 1 058 298
2012 360 625 937 1 156 306
2013 311 484 763 958 315
2014 average 383 401 782 707 318January 319 442 639 985 303February 278 410 651 512 285March 316 383 661 545 292April 329 421 943 533 290May 395 363 727 624 311June 412 349 918 727 346July 428 359 816 790 343August 470 430 725 755 322September 405 450 738 610 320October 393 515 685 798 339November 422 358 845 839 327December 431 330 1 034 768 343
2015 average 365 510 715 1 104 284January 369 489 737 1 188 294February 336 495 739 1 066 267March 390 545 669 1 057 291AprilMayJuneJulyAugustSeptemberOctoberDecemberDecember

30
Table 33 - Imports of coir fibre
2009 2010 2011 2012 2013 2014
( . . . . . . . . . . . . . . . . . . . . . thousand tonnes . . . . . . . . . . . . . . . . . . . . )
Developed 137.6 152.9 190.0 187.1 150.3 181.8
North America 41.0 58.0 85.2 76.7 39.9 55.2 United States of America 33.3 52.3 76.6 66.3 29.1 45.2 Canada 7.7 5.7 8.6 10.3 10.8 10.1
Europe 88.0 81.6 89.9 93.9 92.2 107.7 EU (28) 86.7 80.3 88.8 92.1 90.4 106.6 Other Europe 1.3 1.3 1.1 1.8 1.8 1.1
Russian Federation 0.5 2.4 3.7 4.2 5.7 5.9
Oceania 3.5 4.1 4.3 5.9 5.7 6.1 Australia 2.0 2.4 2.5 4.2 3.8 4.4 New Zealand 1.5 1.8 1.8 1.7 1.9 1.7
Other developed 4.6 6.8 6.8 6.5 6.7 6.8 Japan 2.2 3.5 3.3 2.0 2.3 2.9 South Africa 2.4 3.3 3.5 4.5 4.4 3.9
Developing 387.2 427.7 475.5 574.5 624.4 667.1 China 352.9 387.0 412.2 505.2 515.0 572.2 Taiwan 5.9 5.8 6.1 4.8 4.9 5.3 Republic of Korea 17.7 23.5 38.9 51.6 90.8 76.5 Pakistan 3.6 4.8 11.4 4.1 3.0 1.3 Saudi Arabia 4.0 3.1 4.4 5.0 4.1 5.0 Malaysia 1.9 2.0 1.2 2.6 1.4 1.5 Others 1.3 1.5 1.3 1.1 5.2 5.3
Total above countries 524.8 580.6 665.5 761.6 774.6 848.9
31
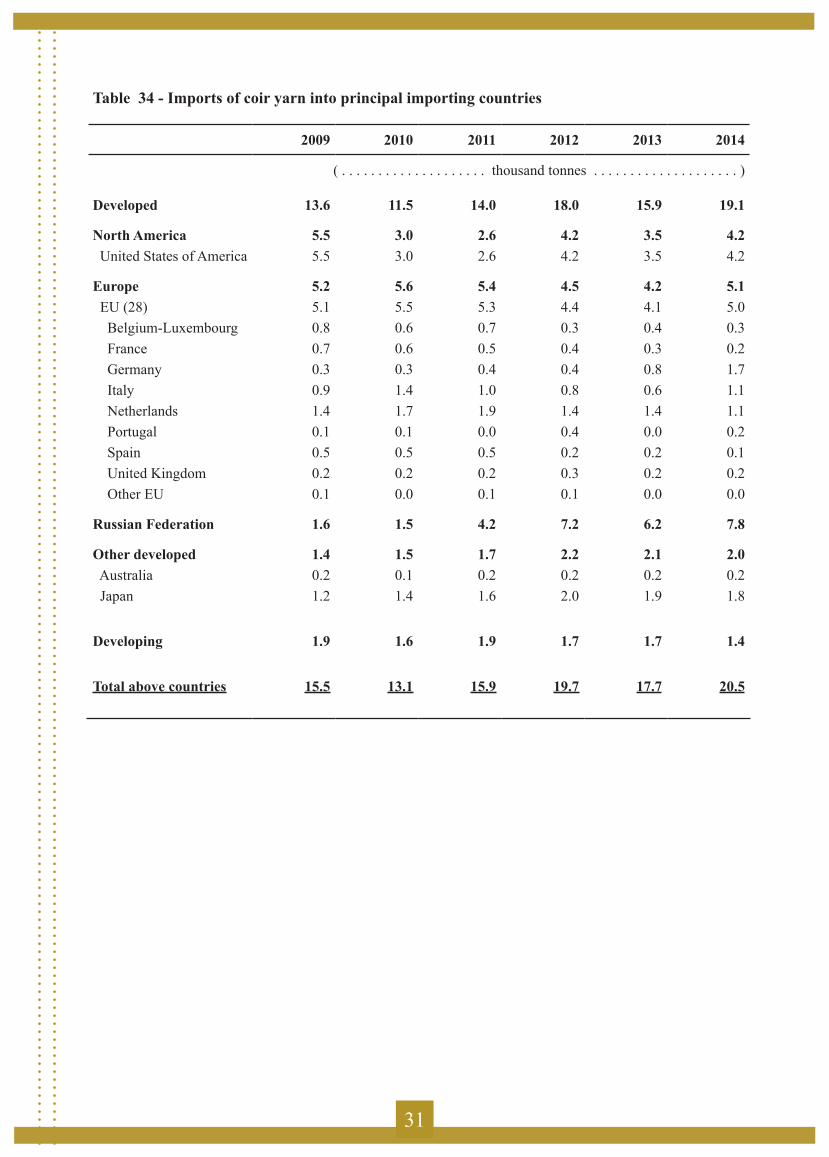
Table 34 - Imports of coir yarn into principal importing countries
2009 2010 2011 2012 2013 2014
( . . . . . . . . . . . . . . . . . . . . thousand tonnes . . . . . . . . . . . . . . . . . . . . )
Developed 13.6 11.5 14.0 18.0 15.9 19.1
North America 5.5 3.0 2.6 4.2 3.5 4.2 United States of America 5.5 3.0 2.6 4.2 3.5 4.2
Europe 5.2 5.6 5.4 4.5 4.2 5.1 EU (28) 5.1 5.5 5.3 4.4 4.1 5.0 Belgium-Luxembourg 0.8 0.6 0.7 0.3 0.4 0.3 France 0.7 0.6 0.5 0.4 0.3 0.2 Germany 0.3 0.3 0.4 0.4 0.8 1.7 Italy 0.9 1.4 1.0 0.8 0.6 1.1 Netherlands 1.4 1.7 1.9 1.4 1.4 1.1 Portugal 0.1 0.1 0.0 0.4 0.0 0.2 Spain 0.5 0.5 0.5 0.2 0.2 0.1 United Kingdom 0.2 0.2 0.2 0.3 0.2 0.2 Other EU 0.1 0.0 0.1 0.1 0.0 0.0
Russian Federation 1.6 1.5 4.2 7.2 6.2 7.8
Other developed 1.4 1.5 1.7 2.2 2.1 2.0 Australia 0.2 0.1 0.2 0.2 0.2 0.2 Japan 1.2 1.4 1.6 2.0 1.9 1.8
Developing 1.9 1.6 1.9 1.7 1.7 1.4
Total above countries 15.5 13.1 15.9 19.7 17.7 20.5

32
Table 35 - Imports of coir mats, matting and rugs into principal importing countries 1/
2009 2010 2011 2012 2013 2014
( . . . . . . . . . . . . . . . . . . . . thousand tonnes . . . . . . . . . . . . . . . . . . . . )
Developed 41.8 38.7 34.3 29.3 30.8 31.8
Europe 25.6 20.3 20.5 15.9 17.8 16.8
EU (28) 25.2 20.0 20.0 15.5 17.5 16.5 Austria 0.4 0.4 0.3 0.2 0.3 0.3 Belgium-Luxembourg 1.2 0.7 0.1 0.7 0.8 0.8 Denmark 0.5 0.4 0.5 0.3 0.2 0.3 Finland 0.0 0.1 0.1 0.0 0.1 0.1 France 3.2 2.6 2.3 2.1 2.2 2.1 Germany 4.2 1.8 1.9 1.4 1.7 1.7 Greece 0.3 0.3 0.2 0.2 0.1 0.1 Ireland 0.0 0.0 0.1 0.1 0.1 0.3 Italy 3.7 3.6 3.5 2.0 1.8 2.2 Netherlands 1.3 1.6 1.7 1.1 1.1 1.3 Portugal 0.2 0.3 0.4 0.2 0.3 0.5 Spain 1.8 1.9 1.8 1.4 1.4 1.0 Sweden 0.4 0.2 0.4 0.3 0.9 0.3 United Kingdom 5.3 4.6 5.4 4.8 5.2 4.6 Other EU 2.9 1.5 1.6 0.7 1.2 1.0 Other Europe 0.4 0.3 0.4 0.4 0.3 0.3
Russian Federation 0.2 0.3 0.3 0.3 0.4 0.4
North America 13.6 15.6 10.3 10.1 9.7 11.7 United States of America 11.9 13.6 8.6 8.7 8.3 10.2 Canada 1.7 2.0 1.7 1.4 1.4 1.4
Other developed 2.4 2.5 3.3 3.1 2.9 3.0 Australia 1.4 1.2 2.1 1.9 1.8 1.8 Japan 0.5 0.6 0.4 0.4 0.2 0.4
Developing 2.7 2.7 2.8 2.7 3.2 2.2
Total above countries 44.5 41.4 37.2 32.0 34.0 34.0

33
Notes
Table 1 - 1/ - Crop year (July/June)Table 2 - 1/ - Crop year (July/June)Table 3 - 1/ - Loose jute "White & Tossa combined", Rice (Coarse) Open Market Price, (1 maund = 37.324
Kg.).- 2/ - Jute "TD5" at Calcutta.- 3/ - Rice Paddy (Coarse) until Nov.1995 (average of two centres in West Bengal); From Jan. 1998
Rice Paddy (Fine Variety).Table 4 - 1/ - Bangladesh BWD and BWC f.o.b. Chittagong-Chalna, at sight until Dec. 96, from January
1997 f.o.b. Mongla.- 2/ - Established by FAO Intergovernmental Group (IGG) on Jute, Kenaf and Allied fibres.
Table 5 - 1/ - F.o.b. price Calcutta inclusive of port and customs charges.Table 8 - 1/ - Crop year (July/June)Table 9 - 1/ - Crop year (July/June)Table 10 - 1/ - Calendar year basis.Table 11 - 1/ - Calendar year basis.
- 2/ - All volumes are expressed in terms of product weight.Table 12 - 1/ - Includes other minor items.Table 13 - 1/ - Includes other minor items.
- 2/ - Stocks end of season (July/June)Table 15 - 1/ - Includes other minor items.Table 16 - 1/ - In fibre equivalent.Table 18 - 1/ - Includes Dominican Republic, Guatemala, Honduras and Nicaragua
- 2/ - Excluding Abaca and CoirTable 19 - 1/ - Fibre include tow
- 2/ - Includes Costa Rica, Cuba, El Salvador, South Africa,VenezuelaTable 25 - 1/ - Average of weekly quotation, excluding surcharges for buyers' account
- 2/ - C.i.f. equivalent in US$/tonne of the indicator price which, as of 1.1.1982, has been expressed in $/bale f.o.b.
Table 28 - 1/ - Includes twineTable 30 - 1/ - Includes twineTable 31 - 1/ - Product weightTable 35 - 1/ - Product weight
34
I5609E/1/04.16


![Advanced Materials Manufacturing & Characterization · 2017-09-28 · [8-12]. The tensile properties of sisal, hemp, coir, kenaf, and jute reinforced composites have been studied](https://static.fdocuments.net/doc/165x107/5f6d50e3c0ed2e008c6979aa/advanced-materials-manufacturing-2017-09-28-8-12-the-tensile-properties.jpg)