in Underdeveloped Areas: A Case Study of Guizhou Province ...

Identifying Barriers for Student
Success: Acting with Intentionality
June 2018 | Old Dominion University Norfolk, Virginia
© Copyright 2018 The Education Trust @EdTrust /edtrust edtrust www.edtrust.org
Wil Del Pilar VP for Higher Education @Wil_EdTrust

Session Overview
• About Ed Trust
• State ratings on degree attainment among Black and Latino adults
• Postsecondary Pathways: How Race, Ethnicity & SES Shape Choice
• Institutional Selectivity
• Postsecondary Persistence
• Graduation Rates

Through our research and advocacy, The Education
Trust supports work that:
Expands excellence and equity in education, from preschool
through college;
Increases college access and completion, particularly for
historically underserved students; and
Builds and engages diverse communities that care about
education equity, and increases political and public will to act
on equity issues.

State Ratings on Degree Attainment Among Black and
Latino Adults

State Attainment Ratings for Black and Latino Adults – Framework
Attainment
What percentage of Black and Latino adults hold a college degree? • 25-64 year olds; associate’s or higher; American Community Survey (ACS), 2014-16
Growth
How have those attainment rates changed from 2000 to 2016?
Gap
What is the difference between attainment rates of White adults and Black/Latino adults?

31% of Black Adults and 47% of White Adults Have a College Degree or Higher
6.2%
12.2%
25.3%
31.2%
21.4%
25.8%
10.0%
9.0%
23.7%
14.0%
13.4%
7.8%
0.0% 25.0% 50.0% 75.0% 100.0%
White
Black
Black and White Educational Attainment, 2016
Less Than HS HS Grad / Equiv Some College Associate Bachelor Graduate
31%
47%

Gains in Degree Attainment for Black Adults Have Not Closed Gaps
2.8
4.4
2.2
9.4
2.9
3.6
2.6
9.1
0 1 2 3 4 5 6 7 8 9 10
Graduate
Bachelor
Associate
Total
Gains in Degree Attainment Since 2000
Black White

Attainment Gaps Are Largest Among Young Black and White Adults
30.2%35.0%
30.7%27.0%
51.0% 51.4%
45.8%41.7%
0.0%
10.0%
20.0%
30.0%
40.0%
50.0%
60.0%
Adults 25-34 Adults 34-44 Adults 44-54 Adults 55-64
Black and White Degree Attainment by Age, 2016Black White
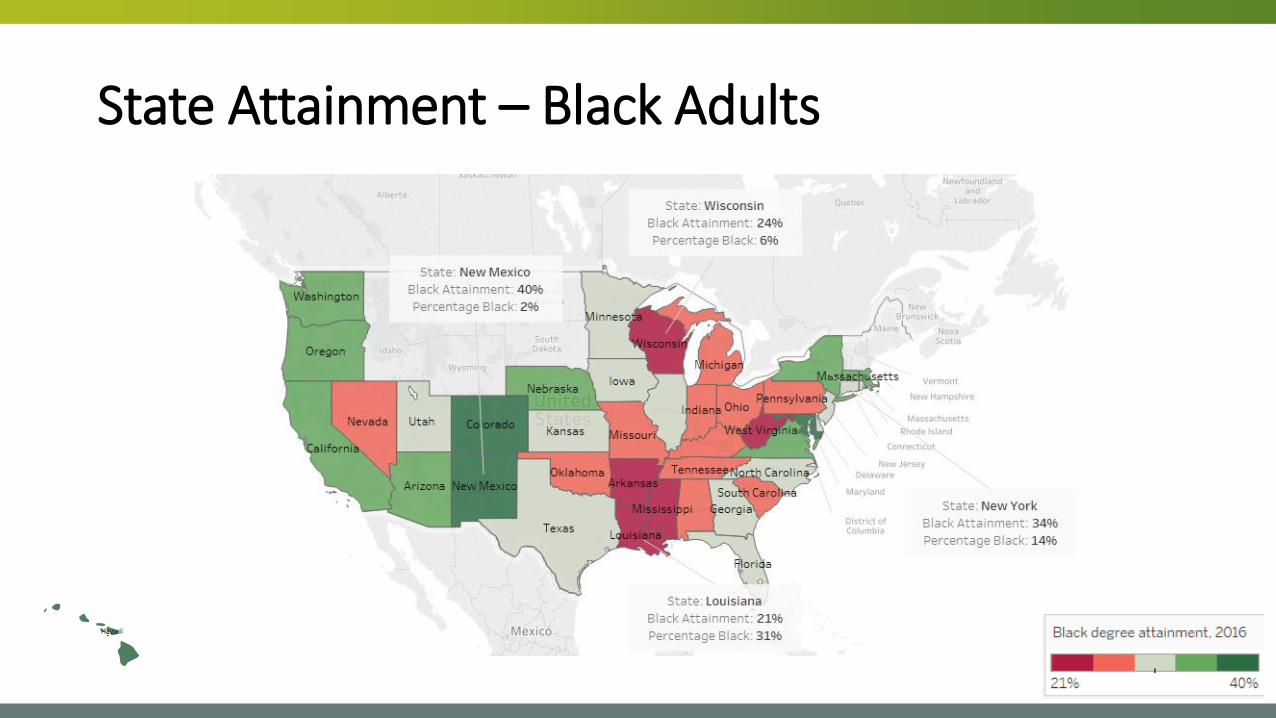
State Attainment – Black Adults

State Attainment Gaps – Black Adults

State Attainment Gaps – Black Adults2
3.5
23
.3
23
.0
22
.3
21
.9
21
.3
19
.7
19
.1
19
.1
18
.6
0
5
10
15
20
25
Co
nn
ect
icu
t
Min
ne
sota
Mas
sach
use
tts
Wis
con
sin
Ne
w J
ers
ey
Ne
w Y
ork
Illin
ois
Co
lora
do
Cal
ifo
rnia
Vir
gin
ia
Ten States with Largest Black - White Degree Attainment Gap, 2016
Below average Black degree attainment

23% of Latino Adults and 47% of White Adults Have a College Degree or Higher
6.2%
30.8%
25.3%
28.4%
21.4%
18.3%
10.0%
6.6%
23.7%
11.0%
13.4%
5.0%
0.0% 25.0% 50.0% 75.0% 100.0%
White
Latino
Latino and White Educational Attainment, 2016
Less Than HS HS Grad / Equiv Some College Associate Bachelor Graduate
23%
47%

Gains in Degree Attainment for Latino Adults Have Not Been Enough to Close Persistent Gaps
2.8
4.4
2.2
9.4
1.1
4.0
2.0
7.1
0.0 1.0 2.0 3.0 4.0 5.0 6.0 7.0 8.0 9.0 10.0
Graduate
Bachelor
Associate
Total
Gains in Degree Attainment Since 2000
Latino White
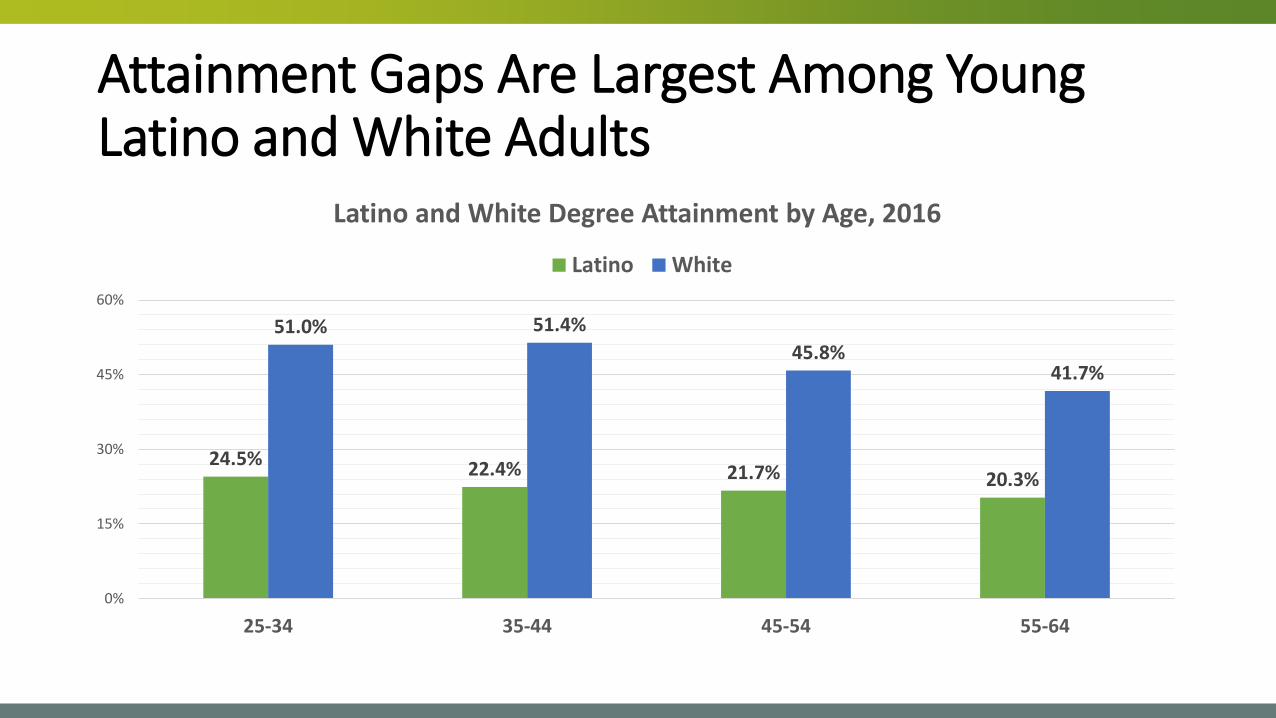
Attainment Gaps Are Largest Among Young Latino and White Adults
24.5% 22.4% 21.7% 20.3%
51.0% 51.4%
45.8%41.7%
0%
15%
30%
45%
60%
25-34 35-44 45-54 55-64
Latino and White Degree Attainment by Age, 2016
Latino White

State Attainment – Latino Adults

State Attainment Gaps – Latino Adults

State Attainment Gaps – Latino Adults3
5.1
34
.1
33
.2
32
.8
31
.9
30
.0
29
.5
29
.5
28
.7
28
.4
0
10
20
30
40
Cal
ifo
rnia
Co
lora
do
Ne
bra
ska
Mas
sach
use
tts
Co
nn
ect
icu
t
Illin
ois
Ne
w J
ers
ey
Min
ne
sota
Ne
w Y
ork
Uta
h
Ten States with Largest Latino - White Degree Attainment Gap, 2016

Immigration Influences Latino Degree Attainment
14.6%
42.7%
29.8%
27.4%
25.9%
12.7%
9.1%
4.7%
14.4%
8.5%
6.3%
4.0%
NativeBorn
ForeignBorn
Degree Attainment by Birthplace, 2016
Less Than HS HS Grad / Equiv Some College Associate Bachelor Graduate
17%
30%

Postsecondary Pathways: How Race, Ethnicity & SES
Shape Choice
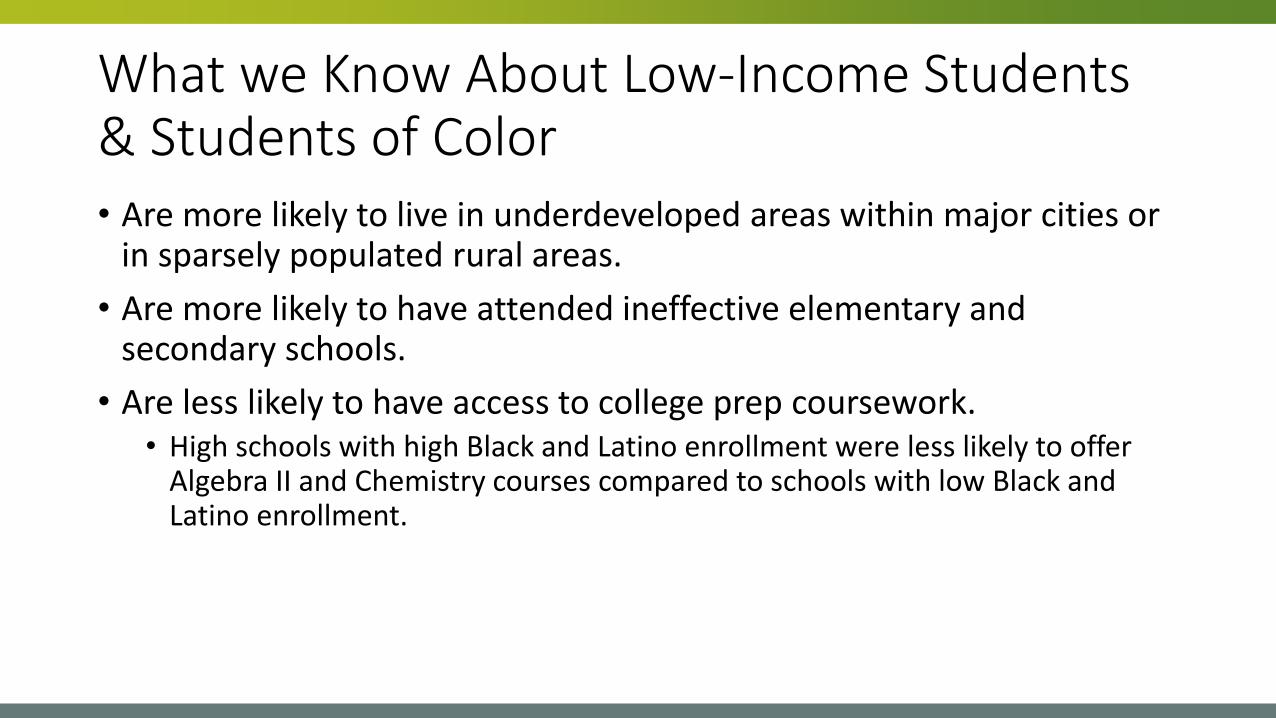
What we Know About Low-Income Students & Students of Color• Are more likely to live in underdeveloped areas within major cities or
in sparsely populated rural areas.
• Are more likely to have attended ineffective elementary and secondary schools.
• Are less likely to have access to college prep coursework.• High schools with high Black and Latino enrollment were less likely to offer
Algebra II and Chemistry courses compared to schools with low Black and Latino enrollment.

High School Graduation Rates
0
10
20
30
40
50
60
70
80
90
100
2006 2007 2008 2009 2010 2011 2012 2015
All Students White African American Latino Low-Income

Persistent Disadvantage
• Michael Hurwitz and Jason Lee found that grades have been rising since at least the 1990s.
• The study finds that grade inflation has been most noticeable at high schools with students who are wealthier than average and where the majority of students are white.
• Research shows that admissions test (SAT/ACT) have an economic, racial and gender bias. • Research evidence consistently finds that Black and Latino students score lower on the SAT• Additional research has found that on the verbal section, “the SAT, a high-stakes test with
significant consequences for the educational opportunities available to young people in the United States, favors one ethnic group over another”(p. 126).
• Additional research has found that found that in addition to a racial bias, the test have a gender bias (favor males) and an economic bias (students from higher incomes families score better).

Persistent Disadvantage
• Colleges use non-academic factors in admissions decisions like: • Legacy status (9.1%), extracurricular activities (31%), and indicators of
demonstrated interest (39%). • Institutions take the group of students deemed academically qualified based
on formulas that disadvantage students and judge them on factors that further exacerbate inequities.
• Students can’t participate in the debate team after school if they’re busy working a part time job to bring home extra income, and they may not have the time or resources to travel out of town for campus tours, both of which would score them extra points during a holistic review.
• Wealthy students are also more likely to have access to a college counselor in their high school to help them write admissions essays, apply for scholarships, and tailor their applications.
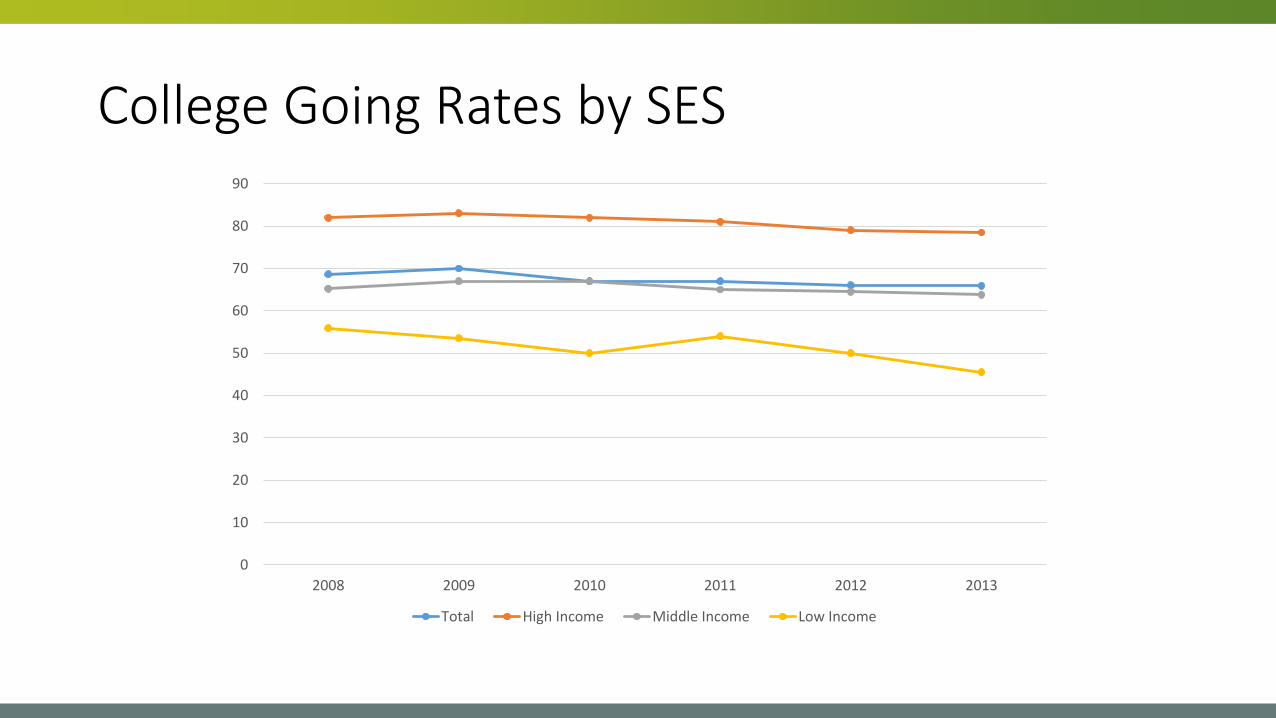
College Going Rates by SES
0
10
20
30
40
50
60
70
80
90
2008 2009 2010 2011 2012 2013
Total High Income Middle Income Low Income

69%71%
56%
69%
83%
69% 70%
63%
67%
87%
0%
10%
20%
30%
40%
50%
60%
70%
80%
90%
100%
Overall White Black Latino Asian
Immediate College-Going Rates for High School Completers by Race/Ethnicity
-2015 (Avg of 2013-15)

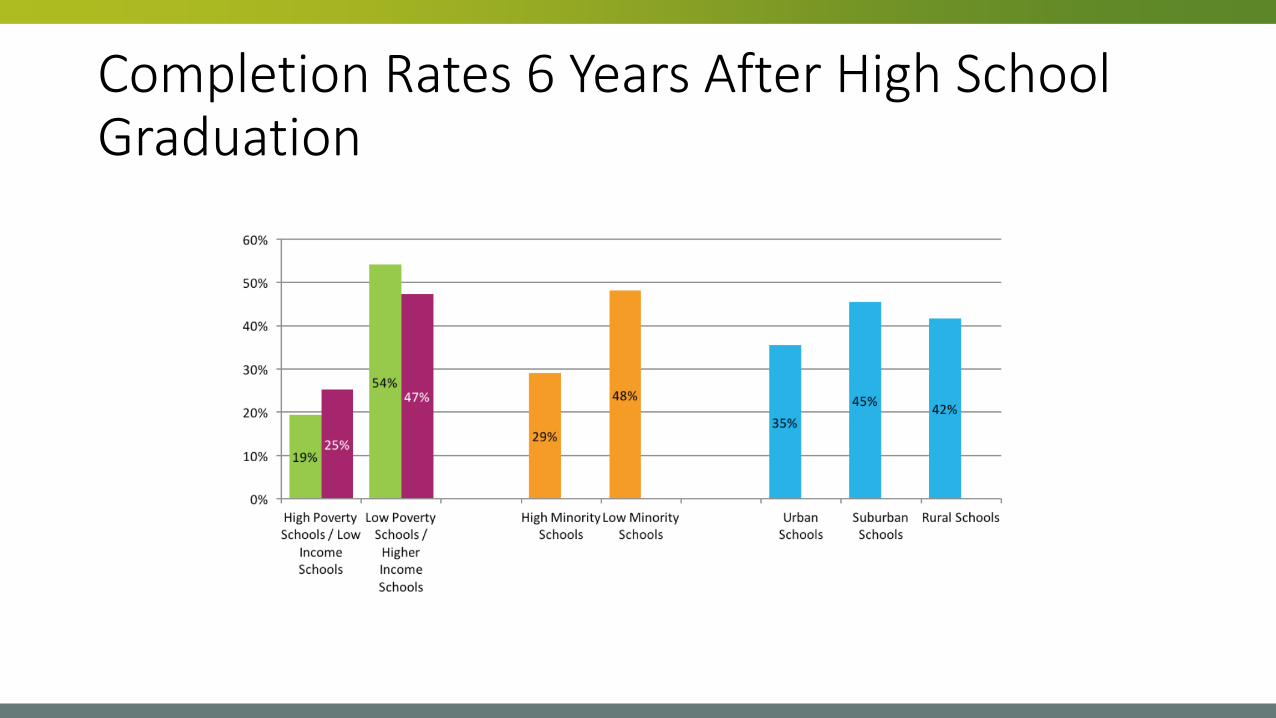
5254
77
70
57
69
62
67
61
0
10
20
30
40
50
60
70
80
90
High PovertySchools
Low IncomeScools
Low PovertySchools
High IncomeSchools
HighMinoritySchools
Low MinoritySchools
UrbanSchools
SuburbanSchools
Rural Schools
Immediate College Going Rates by School Attributes

What Policies Can Increase Pipeline into College • Improve quality of public education
• Improve teacher training and teacher quality
• Create/establish postsecondary pathways
• Educate parents and students on value of postsecondary education
• Improve counseling
• Programs like TRIO, Gear Up provide information and aid with the transition
• Postsecondary and high school partnerships are changing school culture.

What Policies/Practices Increase Access
• Use of Alternative Measures of Student Success away from standardized test
• Provide students access to postsecondary courses while in high school/dual enrollment
• Text reminders to students decreases summer melt
• Information alone is not enough, low-income students and underrepresented students often require additional support
Identifying Policies/Barrier
• Within your state/institutional context what policies and practices will improve the postsecondary access for low-income/underrepresented student populations?
• What state/institutional barriers can you identify/remove to improve postsecondary access?
• What data do you have and/or do you need to assess policies?

Institutional Selectivity

Institutional Selection
• 44% of low-income students (those with family incomes of less than $25,000 per year) attend community colleges as their first college after high school.
• 15% of high-income students enroll in community colleges initially.
• 38% of students whose parents did not graduate from college choose community colleges as their first institution
• Compared to 20% of students whose parents graduated from college.
• 48.5% of Black students and 50.8% of Hispanic students started at a two-year public college, compared to 35.6 percent of White students and 37.8 percent of Asian students (Shapiro et al., 2017).

Institutional Selection
Postsecondary Persistence
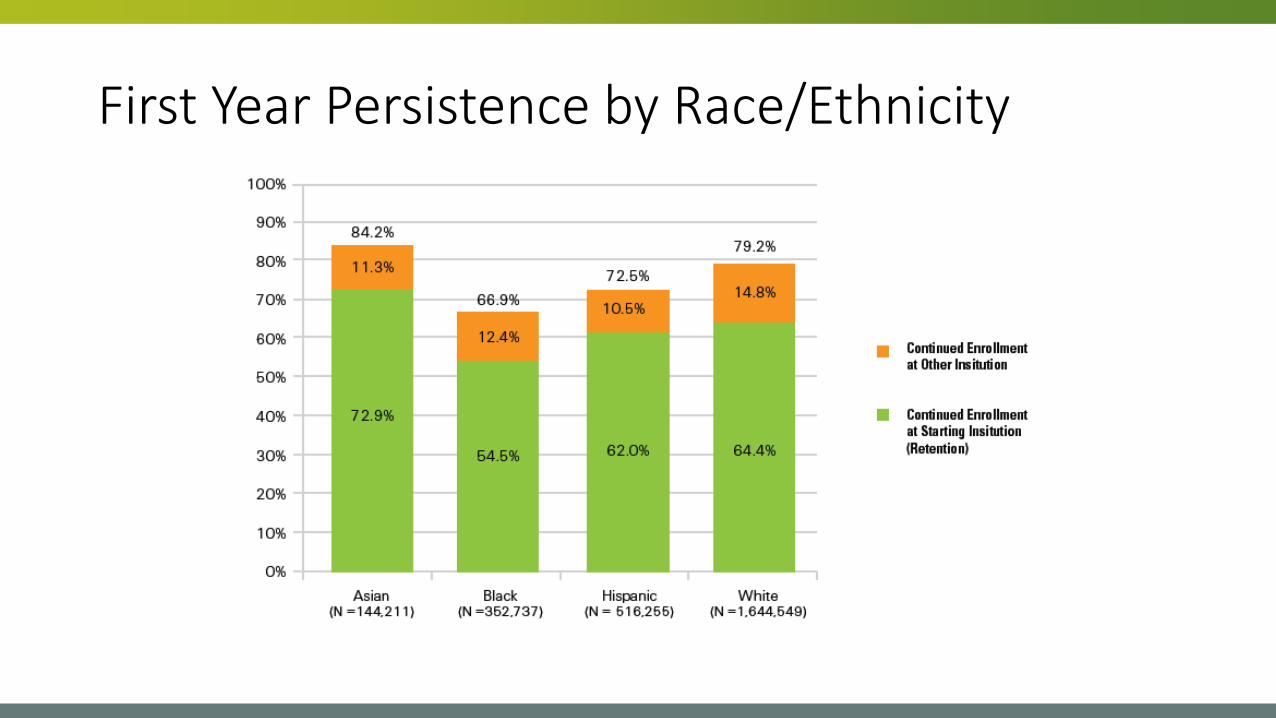
First Year Persistence by Race/Ethnicity
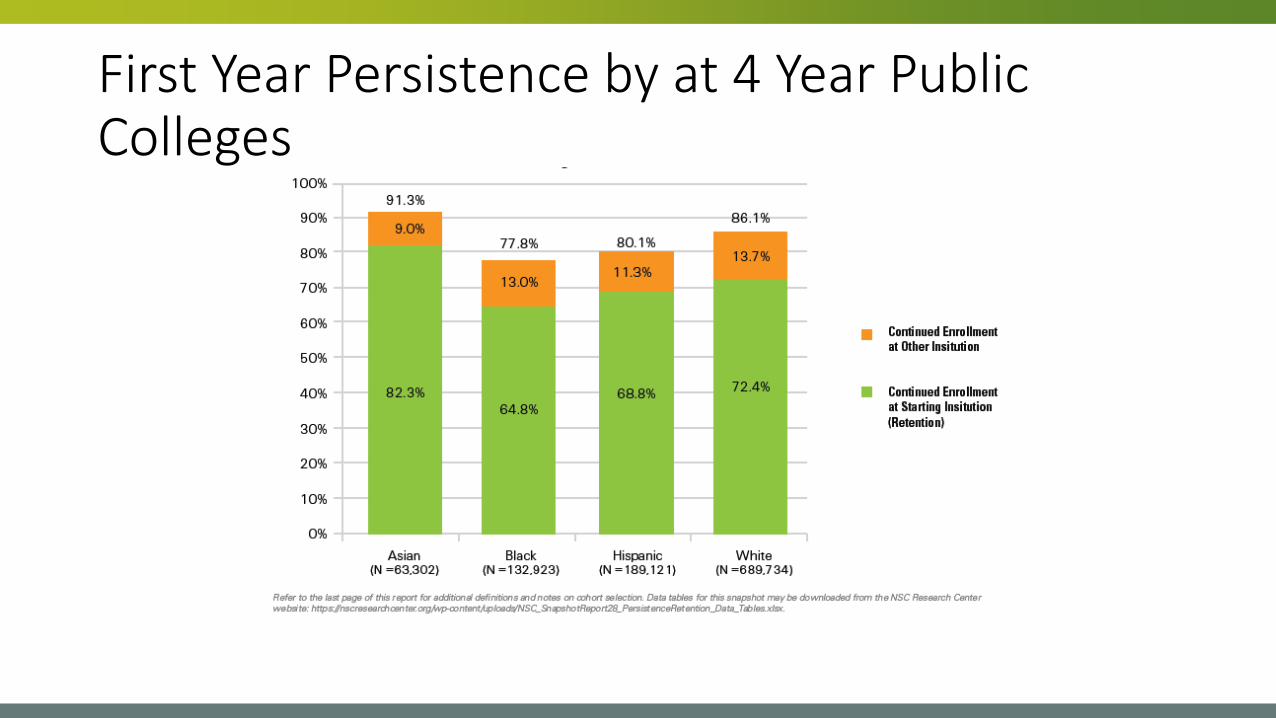
First Year Persistence by at 4 Year Public Colleges

First Year Persistence at 2-Year Public Colleges

First Year Persistence at 4 Year Private Colleges

Persistence Rates by School Types

What Policies/Practices Increase Persistence• Texting reminders to students about enrollment deadlines
• Student advising around major and career choice
• Improving connections between workforce and education
• Wrap around support services improve persistence
• Student Success Teams
• Models like CUNY ASAP show increases to persistence for low-income students and students of color.
• Accountability policies and policies that increase support for institutions enrolling high numbers of underrepresented students improve persistence (ASPIRE Act).

Identifying Policies/Barrier
• Within your state/institutional context what policies and practices will improve the postsecondary persistence for low-income/underrepresented student populations?
• What institutional barriers can you identify/remove to improve postsecondary persistence?
• What data do you have and do you need to assess policies?
Graduation Rates
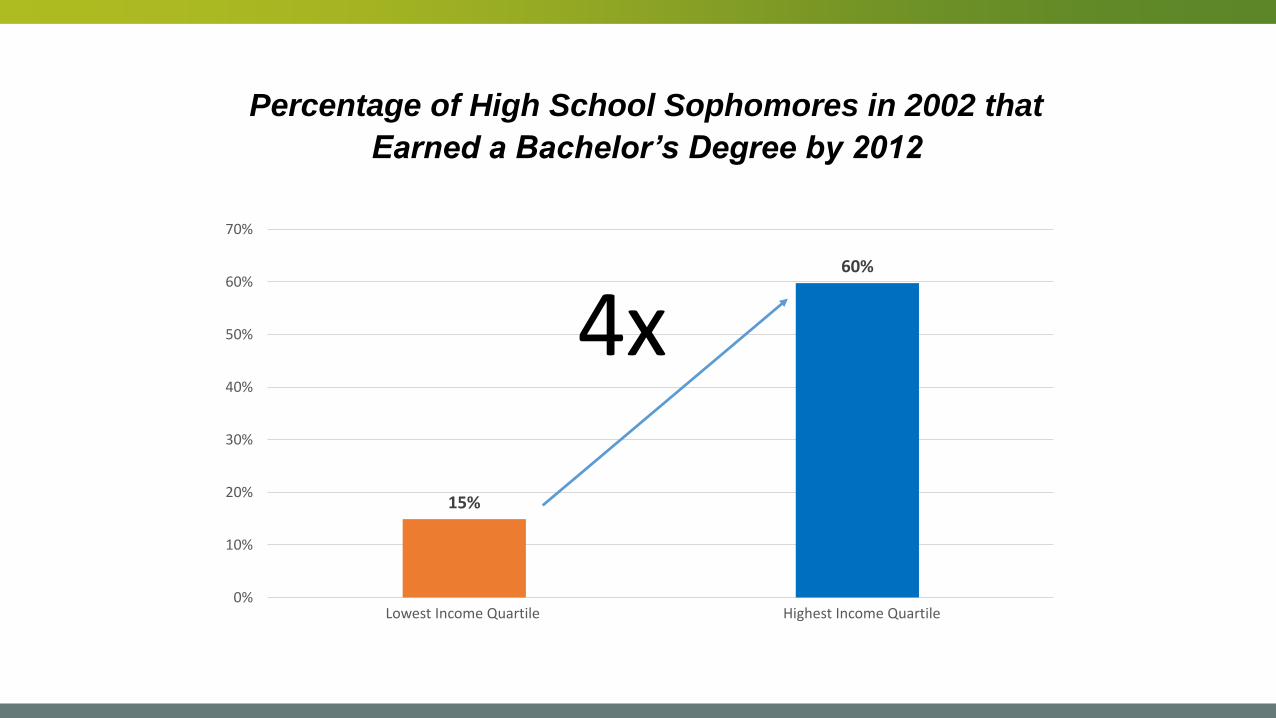
15%
60%
0%
10%
20%
30%
40%
50%
60%
70%
4x
Highest Income QuartileLowest Income Quartile
Percentage of High School Sophomores in 2002 that
Earned a Bachelor’s Degree by 2012
Completion Rates 6 Years After High School Graduation
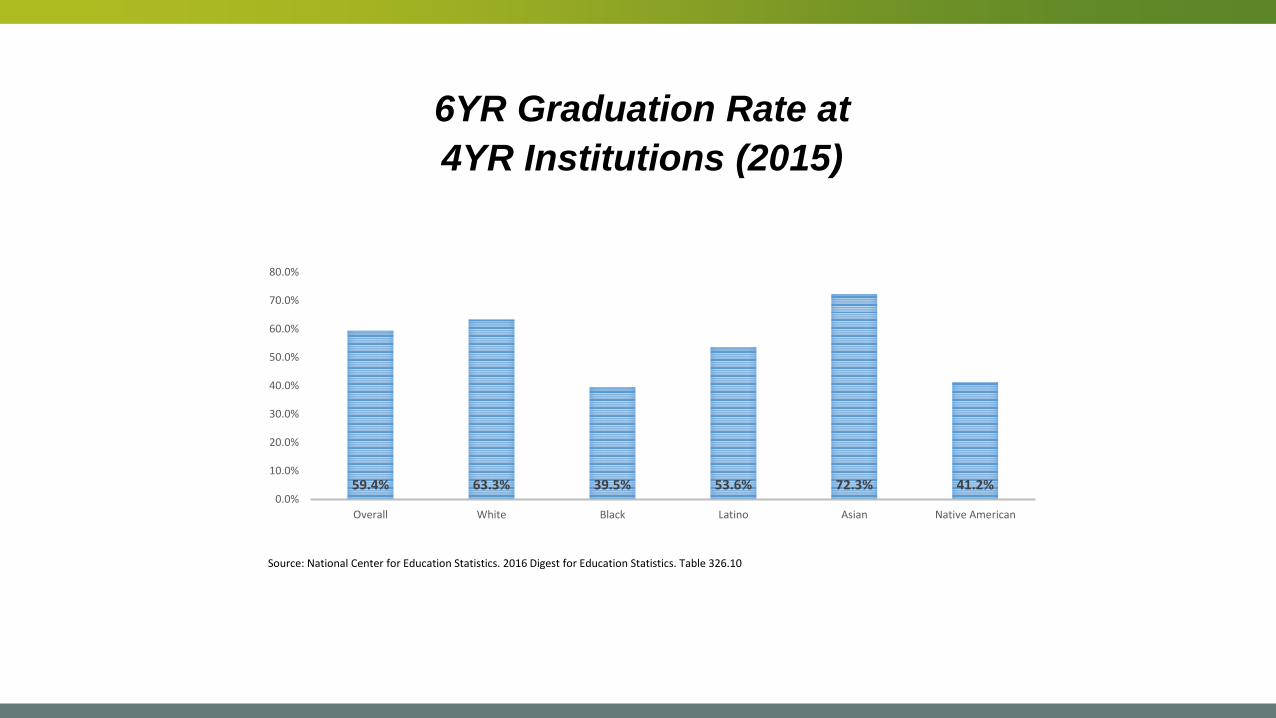
59.4% 63.3% 39.5% 53.6% 72.3% 41.2%0.0%
10.0%
20.0%
30.0%
40.0%
50.0%
60.0%
70.0%
80.0%
Overall White Black Latino Asian Native American
Source: National Center for Education Statistics. 2016 Digest for Education Statistics. Table 326.10
6YR Graduation Rate at
4YR Institutions (2015)

What Policies/Practices Increase Graduation Rates• Increase student support structures to meet student
• Intrusive advising, emergency grants,
• Emerging evidence on developmental ed reform
• Identification of course redesign and redesign of developmental education/ corequisitemodels
• Emerging evidence on campus climate for students of color (faculty training, faculty diversity, etc.);
• Emerging evidence on basic needs insecurity (homelessness, hunger, unique challenges facing undocumented students like lack of access to healthcare).
• Programs like TRIO, Gear Up provide information and aid with the transition
• Use of data to identify and direct interventions at students most likely to drop out
• Performance/Outcomes Based Funding Policies Are Showing Positive Results in Improving Graduation Rates

Identifying Policies/Barrier
• Within your state/institutional context what policies and practices will improve the graduation rates for low-income/underrepresented student populations?
• What institutional barriers can you identify/remove to improve graduation rates?
• What data do you have and do you need to assess policies?


QUESTIONS?
Wil Del Pilar
VP for Higher Education Policy and Practice
[email protected] // @Wil_EdTrust
Thank You!