June 2011 CSGJusceCenter— Massachuse2s$$ Justice ......• During the same period, the number of...
24
1/11/16 1 CSG Jus(ce Center — Massachuse2s Criminal Jus(ce Review Working Group Mee.ng 1: review of jus.ce reinvestment process and proposed scope of work January 12, 2016 Council of State Governments Jus(ce Center Steve Allen, Senior Policy Advisor, Behavioral Health Ka>e Mosehauer, Project Manager Monica Peters, Research Manager Cassondra Warney, Policy Analyst David Sisk, Policy Analyst Council of State Governments Jus>ce Center Council of State Governments Jus>ce Center 2 • Na>onal nonprofit, nonpar>san membership associa>on of state government officials • Engages members of all three branches of state government • Jus>ce Center provides prac>cal, nonpar>san advice informed by the best available evidence
Transcript of June 2011 CSGJusceCenter— Massachuse2s$$ Justice ......• During the same period, the number of...

1/11/16
1
Justice Reinvestment in HawaiiOverview
There is consensus among policymakers in Hawaii that the state needs to reduce its dependence on out-of-state prisons, where, as of 2011, approximately one-third of the state’s adult prison population is housed. At the same time, state leaders are determined to reduce vio-lent crime, which, like the state prison population, has increased significantly over the last decade.
Governor Neil Abercrombie, Chief Justice Mark Reck-tenwald, Senate President Shan Tsutsui, House Speaker Calvin Say and Department of Public Safety Director Jodie Maesaka-Hirata seek to employ a data-driven justice reinvestment strategy to bring out-of-state prisoners back to Hawaii, reduce spending on corrections, and rein-vest savings generated in strategies that would reverse recent crime trends.
To this end, they sought assistance from the Bureau of Justice Assistance, a division of the U.S. Department of Justice, and the Pew Center on the States. The state leaders agreed to establish a bipartisan, inter-branch Justice Reinvestment Working Group comprising leading state and local officials which would receive inten-sive technical assistance from the Council of State Governments Justice Center, in partnership with the Pew Center on the States. The CSG Justice Center will assist the working group in analyzing data and developing a comprehensive set of policy options.
June 2011
Property crime has declined, but violent crime has increased.
• Hawaii’s violent crime rate was relatively low in 2009, at 275 reported incidents per 100,000 residents, which ranks it thirty-fifth among the states. This crime rate, however, is up from what it was in 2000. Hawaii was one of only twelve states to experience an increase in violent crime rates during this period.1
• Violent crime increases were driven by a significant rise in the reported rape rate, up five percent from 2000, and aggravated assaults, up 37 percent from 2000. Murder and robbery rates dropped by 38 percent and 14 percent, respectively.2
• During the same period, the number of arrests for reported rape offenses relative to the number of offenses fell by 30 percent. In 2009, the Honolulu Police Department estimated the department has a backlog of somewhere between 143 and 203 sexual assault kits left unexamined.3
• Between 2000 and 2009, the property crime rate dropped 26 percent in Hawaii, from 4,9554 to 3,6615 reported crimes per 100,000 residents. Despite this decline, Hawaii’s property crime rate remains above the national average; it is the twelfth highest in the nation.6
Criminal Justice Trends in Hawaii
CSG Jus(ce Center —Massachuse2s Criminal Jus(ce Review Working Group Mee.ng 1: review of jus.ce reinvestment process and proposed scope of work ���January 12, 2016 Council of State Governments Jus(ce Center Steve Allen, Senior Policy Advisor, Behavioral Health Ka>e Mosehauer, Project Manager Monica Peters, Research Manager Cassondra Warney, Policy Analyst David Sisk, Policy Analyst
Council of State Governments Jus>ce Center
Council of State Governments Jus>ce Center 2
• Na>onal non-‐profit, non-‐par>san membership associa>on of state government officials
• Engages members of all three branches of state government
• Jus>ce Center provides prac>cal, nonpar>san advice informed by the best available evidence

1/11/16
2
Jus>ce reinvestment goals
Council of State Governments Jus>ce Center 3
A data-‐driven approach to reduce correc1ons spending and reinvest savings in strategies that can decrease recidivism and increase public safety The Jus>ce Reinvestment Ini>a>ve is supported by funding from the U.S. Department of Jus>ce’s Bureau of Jus(ce Assistance (BJA) and The Pew Charitable Trusts
MassachuseXs is the 24th state to use the jus>ce reinvestment approach with CSG Jus>ce Center assistance
Council of State Governments Jus>ce Center 4
NV
AZ
TX
KS
OK
WI
NC
IN
HI
VT NH
OH CT
MI
WV
RI
ID
AL
NE
Past states Current states (Phase I or II)
PA
WA MT
AR
MA
1/11/16
3
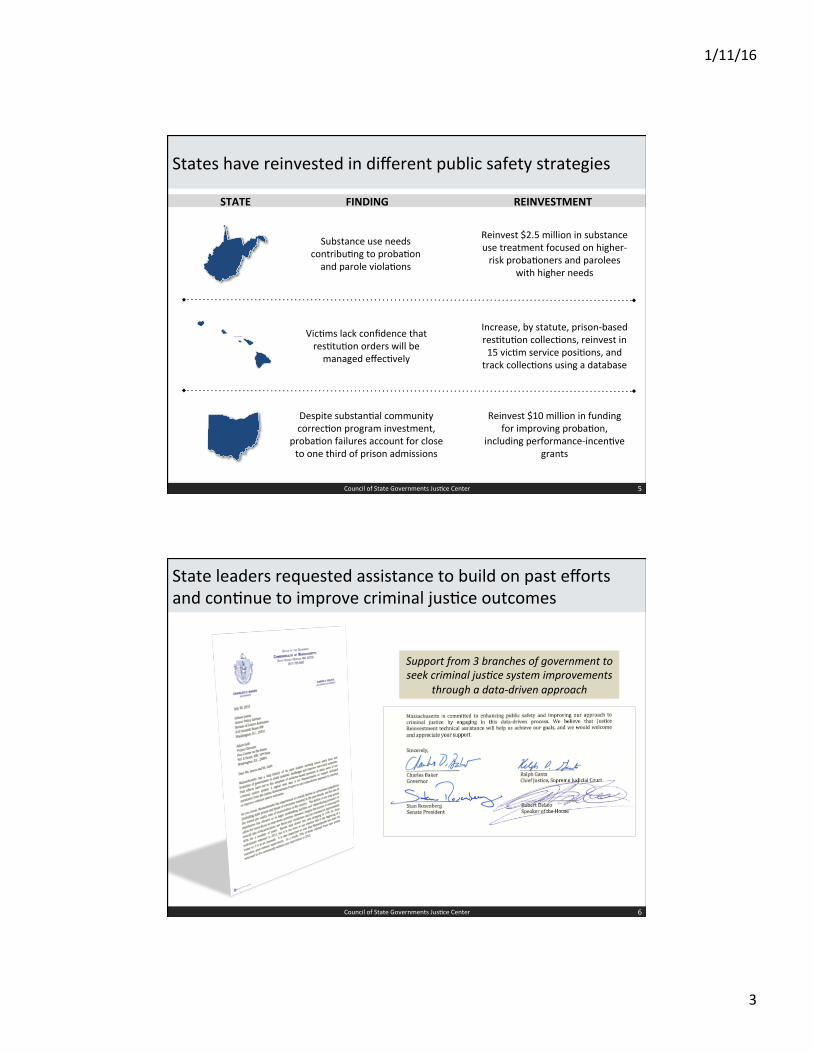
States have reinvested in different public safety strategies
Reinvest $2.5 million in substance use treatment focused on higher-‐risk proba>oners and parolees
with higher needs
Substance use needs contribu>ng to proba>on and parole viola>ons
Despite substan>al community correc>on program investment,
proba>on failures account for close to one third of prison admissions
Reinvest $10 million in funding for improving proba>on,
including performance-‐incen>ve grants
STATE FINDING REINVESTMENT
Vic>ms lack confidence that res>tu>on orders will be managed effec>vely
Increase, by statute, prison-‐based res>tu>on collec>ons, reinvest in 15 vic>m service posi>ons, and track collec>ons using a database
Council of State Governments Jus>ce Center 5
State leaders requested assistance to build on past efforts and con>nue to improve criminal jus>ce outcomes
Support from 3 branches of government to seek criminal jus.ce system improvements
through a data-‐driven approach
6 Council of State Governments Jus>ce Center

1/11/16
4
Jus>ce reinvestment focuses on improving core correc>onal elements and involves intensive stakeholder engagement
Council of State Governments Jus>ce Center 7
The Jus>ce Reinvestment Process
Improvement of Core Correc>onal Elements: RISK ASSESSMENT, PROGRAMS, SUPERVISION
Focus on Subject MaXer Areas
PHASE I • Working group forma>on / presenta>ons • Data analysis • Stakeholder engagement • Sentencing policy analysis • Policy development • Modeling of policy impact
PHASE II • Implementa>on oversight structure & planning • Transla>ng projec>ons into metrics • Training strategies • Communica>on plan • Sub-‐award plan development and tracking • State monitoring of key metrics
• System-‐wide assessment & analysis • On-‐site observa>on of current prac>ce • Char>ng of current vs. ideal prac>ce • Rollout of op>ons for improvement connected to policy framework
• Administra>ve policy review & redesign • Retraining, revalida>on, QA processes • Troubleshoo>ng the change process • Suppor>ng leaders and oversight of the process
• Prosecutor engagement • Vic>m advocates & service providers • Parole board members
• Law enforcement • Sentencing policies & case law • Behavioral health state officials and providers
Council of State Governments Jus>ce Center 8
Jus>ce Reinvestment and Results First are separate complementary projects
JUSTICE REINVESTMENT (Council of State Governments)
POLICY AREA
GOAL
FOCUS
COST SAVINGS
DURATION
Adult criminal jus>ce policy Mul>ple policy areas: criminal/juvenile jus>ce, educa>on, etc.
Results First (The Pew Charitable Trusts) Commonali(es
Data-‐driven CJ system improvements.
Develop, implement data-‐driven policy framework
Inform budget and policy process
Improve public safety and reduce cost
Drivers of crime, recidivism, and correc>onal popula>ons
Programs’ evidence of effec>veness
Reinvest cost savings in public safety strategies
Reallocate to other budget priori>es
Increased effec>veness of state spending
Phase I (1 year), Phase II (2-‐3 years), ongoing monitoring
Ongoing Sustainable impacts
Cross system collabora>on

1/11/16
5
Roles and responsibili>es during the CSG Jus>ce Center-‐MassachuseXs Criminal Jus>ce Review
Council of State Governments Jus>ce Center 9
Steering Commi2ee
Working Group
CSG Jus(ce Center
Develop and implement a data-‐
driven policy framework
Serves as dedicated staff to the state
Analyzes data and engages stakeholders
Delivers presenta>ons
Endorses project scope of work
Provides strategic direc>on in the development of policy op>ons
Approves policy package
Provides technical exper>se on system dynamics and structures
Assess areas for policy development
Create momentum for
adop>on of jus>ce reinvestment policy
Interpret data and assess full system trends
Iden>fy state leaders’ priori>es for reinvestment
CSG Jus>ce Center and state/local agencies and offices are entering into data sharing agreements
10
• Shortage of “data staff” • Delays in delivery due to
“data cleaning”
Data Type Source Status Sentencing MassachuseXs Trial Courts Received, analyzing
Prison MassachuseXs Department of Correc>on
Received, analyzing
Proba>on supervision MassachuseXs Office of the Commissioner of Proba>on
Received, analyzing
Parole supervision MassachuseXs Parole Board Received, analyzing
Parole decision-‐making MassachuseXs Parole Board Delivery pending
HOC and Jail Coun>es / MassachuseXs Parole Board (HOC)
Received, analyzing – Middlesex County; Addi>onal scoping underway
Behavioral Health Data Department of Mental Health Scoping underway
Roadblocks that some(mes arise
Council of State Governments Jus>ce Center 10
• Agencies unaccustomed to sharing data with outside groups
• Data is insufficient for analysis

1/11/16
6
Today’s analyses are largely based on published reports, and future presenta>ons will include case-‐level analysis
Council of State Governments Jus>ce Center 11
Ø This presenta>on aims to capture a snapshot of system trends in MassachuseXs leading up to the jus>ce reinvestment project
Ø While all future presenta>ons will include original data analysis performed by the Jus>ce Center, this presenta>on relies on publicly available system data
Ø All data sources are listed in slide footnotes
Presenta>on Overview
Council of State Governments Jus>ce Center 12
Incarcera(on Recidivism Supervision

1/11/16
7
Defini>on of terms for this presenta>on
Council of State Governments Jus>ce Center 13
County Jail – Operated by county sheriffs, these facili>es house people who are awai>ng trial or arraignment, or are being held for an alleged proba>on supervision viola>on*. Both of these popula>ons are held in custody un>l they are released on their own recognizance, are able to post bail, or un>l their cases are disposed.
Total Jail Popula(on – Single day count of individuals housed in a county jail, regardless of case status or county of jurisdic>on. House of Correc(on (HOC) – Operated by county sheriffs, these facili>es house people who have been sentenced to a period of confinement for a misdemeanor or felony offense by either a district or superior court. A sentence to HOC must be no more than 30 months. These facili>es primarily house individuals serving a county sentence, but may also include those serving a state or federal sentence. Department of Correc(on (DOC) – Operated by the state, these facili>es primarily house people who have been sentenced to a period of confinement for a felony offense by the superior court. A sentence to DOC must be at least one year. These facili>es may also house individuals awai>ng trial or a hearing for an alleged supervision viola>on. In addi>on, the DOC also oversees facili>es providing interven>ons for people who are civilly commiXed as mentally ill, substance abusing, or Sexually Dangerous Persons. Department of Correc(on Sentenced Popula(on – Single day count of individuals who have been criminally sentenced to a term of confinement and are housed in a Department of Correc>on facility. This primarily includes individuals serving a state sentence, but may also include those serving a county or federal sentence. Incarcerated Popula(on – Single day count of individuals housed in county jails, HOCs, and DOC for a criminal maXer. *Parole violators are returned to the HOC/DOC facility to which he/she was originally sentenced.
Front-‐end criminal jus>ce system pressures are declining, par>cularly since 2008
Council of State Governments Jus>ce Center 14
181,371
151,666
0
50,000
100,000
150,000
200,000
2005 2006 2007 2008 2009 2010 2011 2012 2013 2014
Total Index Crime Down 10%
112,437 125,708
0
50,000
100,000
150,000
200,000
2005 2006 2007 2008 2009 2010 2011 2012 2013 2014
Arrests* Up 12%
(Down 16% since 2008)
216,047 194,869
0
50,000
100,000
150,000
200,000
250,000
2005 2006 2007 2008 2009 2010 2011 2012 2013 2014
Criminal Case Filings Down 10%
56,286
39,049
0
20,000
40,000
60,000
2004 2005 2006 2007 2008 2009 2010 2011 2012 2013
Convic>ons Down 31%
*Arrest data is suscep.ble to gaps in repor.ng
For crime, arrests, and criminal case filings, 2014 was the latest year of data available. For convic.ons, 2013 was the latest year available. Source: FBI, Crime in the US; MassachuseXs Office of the Trial Courts; MassachuseXs Annual Survey of Sentencing Prac>ces.

1/11/16
8
The incarcerated popula>on is divided approximately in half between state and county facili>es
Council of State Governments Jus>ce Center 15
27% HOC Sentenced Popula>on
Incarcerated Popula>ons in MassachuseXs, January 1, 2015
27% Awai>ng Trial or Hearing
46% DOC Sentenced Popula>on
Awai>ng trial or awai>ng proba>on viola>on hearing in a county jail or DOC facility
Serving a sentence in a House of Correc>on (county facility)
Serving a sentence in a Department of Correc>on (state facility)
Source: MassachuseXs Department of Correc>on Weekly Count Sheets: hXp://www.mass.gov/eopss/law-‐enforce-‐and-‐cj/prisons/rsch-‐data/weekly-‐count-‐sheets.html; MDOC, Prison Popula.on Trends 2014.
*DOC popula.on includes only criminal sentences, and includes a small number of people sentenced to a HOC but are serving .me in DOC.
23,220
20,325
9,072 9,337
8,433 5,488
5,125 4,927
590 573 0
5,000
10,000
15,000
20,000
25,000
30,000
2006 2007 2008 2009 2010 2011 2012 2013 2014 2015
A sharp drop in the HOC popula>on drove a reduc>on in the total number of people incarcerated
Council of State Governments Jus>ce Center 16
Source: MassachuseXs Department of Correc>on Weekly Count Sheets: hXp://www.mass.gov/eopss/law-‐enforce-‐and-‐cj/prisons/rsch-‐data/weekly-‐count-‐sheets.html; MDOC, Prison Popula.on Trends 2014.
DOC (sentenced)
HOC (sentenced)
County Jail DOC (pretrial)
Total Incarcerated Popula(on
Incarcera>on Trends, 2006 -‐ 2015
-‐12% + 3% -‐35% -‐4% -‐3%
TOTAL:
PRISON: HOC: JAIL:
DOC PRETRIAL:

1/11/16
9
The total jail popula>on inched downward, but there is considerable varia>on in trends across the jails
Source: MassachuseXs Department of Correc>on, Weekly Count Sheets, January 2009 and January 2015.
Council of State Governments Jus>ce Center 17
25%
-‐52%
-‐1% -‐2%
-‐13% -‐17%
16%
35%
-‐8%
-‐45%
-‐13%
12%
-‐4%
-‐60%
-‐40%
-‐20%
0%
20%
40%
Percent Change in Total Jail Popula>on by County, January 2009-‐2015
*Total jail popula.on, including detainees held from other coun.es. 2009 was the earliest available date for a breakdown by county. Dukes County not included due to small popula.on.
The number of people held in a county jail can be par>cularly vola>le and affected by factors outside of crime and arrests, such as:
• Changes in the county’s resident popula>on
• Contrac>ng out jail beds or holding detained individuals from neighboring coun>es
• Court-‐mandated popula>on caps
Jails with a decreasing popula>on s>ll may be opera>ng at or over capacity and experiencing budget and capacity pressure.
2012-‐2015
-‐9% 2006-‐2012
+13%
9,072
10,251 9,337
0
2,000
4,000
6,000
8,000
10,000
12,000
2006 2007 2008 2009 2010 2011 2012 2013 2014 2015
Ater a substan>al state prison popula>on increase, numbers returned approximately to 2006 levels
Council of State Governments Jus>ce Center 18 Source: MassachuseXs Department of Correc>on Prison Popula>on Trends, 2014.
77
MassachuseXs DOC Criminally Sentenced Custody Popula>on January 1, 2006-‐2015
168 89 337 134 74 Number of Court/Crime Lab Releases*
**
545 people released from DOC between 2012 and 2014 due to court or crime lab releases
*As reported by the Department of Correc.on **Data not available

1/11/16
10
Arrests and convic>ons for drug offenses fell by half
Council of State Governments Jus>ce Center 19
-‐50%
-‐45%
-‐40%
-‐35%
-‐30%
-‐25%
-‐20%
-‐15%
-‐10%
-‐5%
0%
5%
10% Drug Non-‐Drug
Percent change 2008-‐2014
-‐47%
Percent change 2008-‐2013*
Drug Non-‐Drug
-‐49%
Arrests Convic(ons
*2014 data not currently available
-‐11%
-‐20%
Source: FBI, Crime in the US; MassachuseXs Office of the Trial Courts; MassachuseXs Annual Survey of Sentencing Prac>ces.
People in state prison for drug offenses dropped 44%, while other offense categories were stable or increased
Council of State Governments Jus>ce Center 20
7,688
8,238
2,571
1,432
0
1,000
2,000
3,000
4,000
5,000
6,000
7,000
8,000
9,000
2010 2011 2012 2013 2014 2015
Non-‐Drug Offenses
Drug Offenses
+7%
-‐44%
* Other offenses include obstruc.on, habitual offender, pros.tu.on, and certain weapons possession. Source: MassachuseXs Department of Correc>on Prison Popula>on Trends, 2009-‐2014.
% Change 2010 —2015
N 2015
Person + 9% 5,197
Sex 0% 1,352
Property + 2% 865
Other* + 14% 824
Total Non-‐Drug 8,238
DOC Criminally Sentenced Jurisdic>on Popula>on by Governing Offense, January 1, 2010 — 2015

1/11/16
11
The demographic composi>on of the state prison popula>on is rela>vely sta>c
Council of State Governments Jus>ce Center 21
Demographics 2011 2012 2013 2014 2015
Age
Under 29 26% 26% 24% 24% 23% 30-‐39 30% 30% 30% 30% 30% 40-‐49 25% 25% 25% 24% 24% Over 50 19% 19% 21% 22% 23%
Race
White 41% 41% 42% 43% 43% Black 28% 28% 28% 28% 28% Hispanic 28% 28% 27% 26% 26% Other 3% 3% 3% 3% 3%
Gender Male 94% 95% 95% 95% 95% Female 6% 5% 5% 5% 5%
DOC Criminally Sentenced Jurisdic>on Popula>on Jan 1, 2011-‐ Jan 1, 2015
Percent of the State Prison Popula(on
Source: MassachuseXs Department of Correc>ons Prison Popula>on Trends, 2009-‐2014.
-‐3%
+4%
There are differences in the demographic composi>on of the resident and state prison popula>ons
Council of State Governments Jus>ce Center 22
2014 Resident Popula(on
Source: U.S. Census 2010-‐2014 American Community Survey 5-‐Year Es>mates, hXp://facwinder.census.gov/faces/tableservices/jsf/pages/productview.xhtml?src=CF .
Demographic Composi>on of Resident and State Prison Popula>ons, 2014
75%
43%
0%
10%
20%
30%
40%
50%
60%
70%
80%
6%
28%
10%
26%
9% 3%
Resident popula>on
State prison popula>on 48% Male
52% Female
2014 State Prison Popula(on
95% Male
5% Female
*Demographic informa.on is currently only publicly available for the DOC criminally sentenced popula.on represen.ng approximately 11% of the total number of individuals in the criminal jus.ce system. **Race/ethnicity is self-‐reported by inmate at .me of admission. Other categories include Asian, Na.ve American, Pacific Islander, and Other. Resident popula.on includes data reported by the U.S. Census. Hispanic includes any race while all other categories include that race alone.
White Black Hispanic Other

1/11/16
12
State leaders are interested in learning more about the behavioral health needs of jus>ce system-‐involved individuals
Council of State Governments Jus>ce Center 23
How common are behavioral health issues at different points in the system?
Diversion programs
LE call for service
Courts
Supervision
Jail, HOC, prison
What types of behavioral health needs exist in criminal
jus(ce popula(ons?
Serious mental illness
Drug use
Alcohol use
Co-‐occurring disorders
What interven(ons exist to respond to these needs and
who do they serve?
Treatment access
Health care coverage
Appropriate levels of care
Tailored interven>ons
Relapse preven>on
Ini>al ques>ons to approach a behavioral health systems analysis
Informa>on on the sizable diversion popula>ons will also be pursued in case-‐level analysis
Council of State Governments Jus>ce Center 24
DA DIVERSION PROGRAMS
PROBATION (Pretrial proba1on, pretrial condi1ons of release)
LAW ENFORCEMENT ASSISTED DIVERSION CWOFs (con1nue without a finding)
SPECIALTY COURTS (Drug Court, Mental Health Court, Veterans Court, Homeless Court)
YOUTHFUL DIVERSION PROGRAM
*This is not a comprehensive list of pre-‐disposi.on, post-‐disposi.on, or other diversion or deferred adjudica.on programs in MassachuseZs.

1/11/16
13
Key ques>ons in ini>al incarcera>on analysis
Council of State Governments Jus>ce Center 25
What are the demographic and criminogenic characteris(cs of individuals incarcerated in MassachuseXs?
What types of admissions are driving incarcera(on rates—supervision viola>ons, the commission of new crimes, or recidivism?
What diversion op(ons or pretrial services are available to individuals with behavioral health needs? Are those strategies impac>ng incarcera>on rates?
How has length of stay changed over >me? How is length of sentences impac>ng incarcera>on rates?
How are post convic(on release decisions and reentry plans, including addressing behavioral health needs in the community, impac>ng incarcera>on rates in the state?
Are there systemic factors affec>ng classifica(on decisions and contribu>ng to delays impeding reentry transi(on planning?
Policies and data to explore in ini>al incarcera>on analysis
Council of State Governments Jus>ce Center 26
POLICIES TO EXPLORE
• Availability of diversion op>ons
• Bail and pre-‐trial release decision-‐making
• U>liza>on and eligibility requirements of pre-‐trial supervision
• Sentencing op>ons and alterna>ves to incarcera>on
• Prison/HOC release process
• Access and availability to behavioral health
• Jail bookings and ini>al release decisions
• Pretrial deten>on and supervision popula>ons
• Police, prosecutor, and court diversions and corresponding outcomes
• Jail and HOC popula>on trends and characteris>cs
• Sentencing prac>ces
• Prison admissions, releases, and popula>on characteris>cs
DATA TO ANALYZE

1/11/16
14
Presenta>on Overview
Council of State Governments Jus>ce Center 27
Incarcera(on Recidivism Supervision
Recidivism can add significant pressure to correc>onal systems
Council of State Governments Jus>ce Center 28
INCREASING PRESSURES ON THE SYSTEM
FORMS OF RECIDIVISM
NEW ADMISSIONS
ARREST JAIL CONVICTION HOC/PRISON RELEASE

1/11/16
15
Measuring recidivism at mul>ple points in the system and over different >meframes provides valuable informa>on to guide interven>ons
Council of State Governments Jus>ce Center 29
Re-‐arrest Technical viola>on of supervision
Revoca>on of supervision Re-‐convic>on
Re-‐incarcera>on
Pretrial popula>ons Proba>oners Parolees
Former HOC inmates Former DOC inmates
Disposi>on Incarcera>on Release Arrest/ Arraignment Pre-‐Trial
Proba>on
Who is recidiva(ng? How? When?
One year Two years Three years
In MassachuseXs, few recidivism measures are rou>nely calculated and reported
Council of State Governments Jus>ce Center 30
Pretrial
Re-‐arrest/ arraignment
Supervision Viola(on
Houses of Correc(on
Department of Correc(on
Proba(on
Parole
Type of New System Interac(on
Popu
la(o
n
? ? ?
? ? ?
? ?
? ? ?
? ?
?
Re-‐Incarcerated
Re-‐Convic(on
?
?
?
?
?
Reported annually in a published report
Tracked internally
Informa>on not reported
Re-‐convic>on only reported if it
results in a return to incarcera>on
? Reported annually in a published report
Some individual coun>es tracking and repor>ng, but no regular statewide tracking or repor>ng
Previously reported, not as
of 2008
Informa>on not reported
Re-‐arrest only reported if it
results in a return to incarcera>on
Informa>on not reported
*Does not include MA’s recent involvement in the Results First Ini>a>ve, which produced re-‐convic>on rates for HOC, DOC, proba>on, and parole popula>ons

1/11/16
16
State prison recidivism rates have hovered around 40% in the last decade with a recent decline
43% 44% 41%
43% 39%
41% 39%
35%
0%
5%
10%
15%
20%
25%
30%
35%
40%
45%
50%
2004 2005 2006 2007 2008 2009 2010 2011
Source: MassachuseXs Department of Correc>on Popula>on Trends 2013, MassachuseXs Department of Correc>on Popula>on Trends 2014.
MassachuseXs DOC Three Year Recidivism Rate (Re-‐incarcera>on), 2004 -‐ 2011
Council of State Governments Jus>ce Center 31
Each year represents a cohort of individuals tracked for the following three years. Recidivists are defined as those criminally sentenced and released to the street from a DOC facility and re-‐incarcerated for a new sentence or viola.on or parole or
proba.on to a MassachuseZs state or county facility or to a federal facility within three years of his/her release.
State prison recidivism represents a small por>on of individuals involved with the criminal jus>ce system.
• 90,000 people with some form of correc>onal control
• DOC popula>on represents 11% of individuals involved with the criminal jus>ce system
• In 2011, 806 people returned to incarcera>on
Risk assessment tools use key factors to predict the likelihood of recidivism
Council of State Governments Jus>ce Center 32
In 2013, the Parole Board adopted a risk/needs assessment instrument, the LS/CMI, for parole hearings and the supervision popula>on.
5%
31%
44%
18%
2%
0%
5%
10%
15%
20%
25%
30%
35%
40%
45%
50%
Very Low Low Medium High Very High
LS/CMI Risk Assessment Scores for Parolees in the Community, 2013
• Criminal history
• Criminal aztudes and behavioral paXerns
• Educa>on and employment
• Family and rela>onship problems
• Substance use
• Peer associa>ons
Domains typically included in risk assessments
Source: MassachuseXs Parole Board, Annual Report 2013.

1/11/16
17
Key ques>ons in ini>al recidivism analysis
Council of State Governments Jus>ce Center 33
What measures of recidivism should be defined and promulgated in MassachuseXs? Who is recidiva(ng? How has recidivism changed over >me? How are behavioral health challenges impac>ng recidivism and what programs are currently making an impact on recidivism rates? How are risk and needs assessments being used throughout the system to drive evidence-‐based interven>on strategies to achieve recidivism reduc>on goals? How are reentry plans and programs impac>ng recidivism rates?
Policies and data to explore in ini>al recidivism analysis
Council of State Governments Jus>ce Center 34
POLICIES TO EXPLORE
• Defini>on of recidivism
• Performance measurement in tracking outcomes
• Incen>ve-‐based programming
• Recidivism reduc>on goals
• Use of risk assessment at key decision points
• Applica>on of risk and needs informa>on
• Impact of recidivism on prison, HOC, and jail admissions
• Recidivism rates across the system (prison/HOC releases, proba>oners, pre-‐trial defendants)
• Outcomes for re-‐entry popula>ons by supervision status
• Propor>on of proba>oners and HOC popula>on admiXed to prison
DATA TO ANALYZE

1/11/16
18
Presenta>on Overview
Council of State Governments Jus>ce Center 35
Incarcera(on Recidivism Supervision
Over 70,000 people are on proba>on or parole, supervised across mul>ple phases in the system
Council of State Governments Jus>ce Center 36
Pretrial Proba(on
Proba(on/Community Correc(ons Sentence
“From & Aner” Proba(on
PRETRIAL SENTENCED POST-‐RELEASE
Parole
Following Incarcera(on
Release
Pretrial Condi(on of Release

1/11/16
19
Community supervision serves over 3/4 of the total criminal jus>ce popula>on
Council of State Governments Jus>ce Center 37
Source: MDOC, Prison Popula>on Trends 2013, Weekly Count Sheets; MassachuseXs Parole Board, Annual Report 2013; Personal Communica>on, Office of Commissioner of Proba>on, 2015.
Proba(on 67,622
Parole Board 1,949
Department of Correc(ons Criminally Sentenced and pretrial
9,910
Sheriff’s Departments HOC and Jails
10,415
12%
11%
2014 End-‐of-‐Year Criminal Jus>ce Popula>on
75%
89,896 2%
Pretrial Supervision (Includes pretrial proba(on and condi(ons of release)
Administra(ve
Risk-‐Need Proba(on (Includes Community Correc(ons)
OUI
DISTRIBUTION OF ALL SUPERVISED INDIVIDUALS 69,571
Parole
15% 10,365
39% 26,912
17% 11,832
26% 18,513
3% 1,949
*Popula>on in DOC, HOC, jail as of January 1, 2015. Proba>on and parole caseloads as of December 31, 2014.
Proba>on has consistently been relied upon for post-‐release supervision, significantly more so in recent years
Council of State Governments Jus>ce Center 38
566
830
535 440
0
200
400
600
800
1,000
1,200
2005 2006 2007 2008 2009 2010 2011 2012 2013 2014
Proba(on
Parole
Source: MassachuseXs Department of Correc>on, Prison Popula.on Trends 2009-‐2014; MassachuseXs Trial Court, Survey of Sentencing Prac.ces 2013.
Sentences to State Prison, FY2013**
From & Aner Sentence
48%
No From & Aner Sentence
52%
DOC Popula>on Released to Supervision, 2004 -‐ 2015
Individuals sentenced to DOC may receive a period of post-‐release proba>on through a sentencing
structure called a “from & ater.” To be eligible for a from & ater sentence, an individual must be
convicted of two or more charges.*
*Individuals sentenced to HOC can also be sentenced to a period of proba.on a]er release through a from & a]er sentence as described above or a “split” sentence, which allows a mix of incarcera.on and post-‐release proba.on to be sentenced on one convic.on. Only DOC informa.on is included in this graphic. **2013 is the most recent year for which sentencing data is publicly available.

1/11/16
20
40%
33%
17%
10%
No Supervision
Proba>on Parole Both
Two out of 5 people released from prison return to the community without proba>on or parole supervision
Council of State Governments Jus>ce Center 39
MassachuseXs DOC Criminally Sentenced Releases to the Street, 2014
N = 2,535
A na>onal report found that, in 2012, only six states had higher rates of people released from prison without supervision than MA. Since then, four of those states (SC, NC, OH, and OK) have enacted policies to increase rates of release to post-‐release supervision.
Sources: MDOC, Prison Popula.on Trends 2014 (Concord: MDOC, May 2015). The Pew Charitable Trusts, “Max Out: The Rise of Prison Inmates Released Without Supervision,” June 2014
Releases from incarcera>on offer an opportunity to support successful reentry
Council of State Governments Jus>ce Center 40
RISK, NEED, RESPONSIVITY PRINCIPLES
Are programs responsive to the learning and interac>on styles of
par>cipants?
Are high-‐quality programs available to address criminogenic
needs?
What is the risk and need profile of the reentry
popula>on?
EFFECTIVE SUPERVISION
Do supervision officers focus >me and quality of interac>ons on higher-‐
risk popula>ons?
Do supervision officers receive training in evidence-‐based
prac>ces?
BEHAVIORAL HEALTH TREATMENT
Do treatment providers receive training in
working with people with criminogenic needs?
Are there linkages to care to meet the behavioral health care needs of the higher-‐risk popula>ons?
BEHAVIOR CHANGE
Are the most intensive responses priori>zed for more serious viola>ons
and highest-‐risk popula>ons?
Are systems in place to respond to supervision viola>ons in swit,
certain, and propor>onal manner?
Ini>al ques>ons to approach a recidivism-‐focused reentry analysis
More than 2,000 people are released from state prisons to the street each year
In 2014, N = 2,535

1/11/16
21
Key ques>ons in ini>al supervision analysis
Council of State Governments Jus>ce Center 41
Who is on community supervision in MassachuseXs?
How is risk and needs assessment informa>on used in determining diversion and step down opportuni(es as well as supervision supports and services in the community? Is this risk and needs informa>on impac>ng outcomes?
Are community based programs effec>vely addressing criminal thinking?
Do proba>oners and parolees have (mely access to substance use and mental health treatment that is tailored to criminogenic need? How are these programs impac>ng incarcera>on and recidivism?
How does the system respond to supervision viola(ons? Do different approaches have different impacts on recidivism?
What is the impact of fines and fee collec(on on the quality and scope of supervision, on the rate of viola>on, and on the risk of recidivism?
Policies and data to explore in ini>al recidivism analysis
Council of State Governments Jus>ce Center 42
POLICIES TO EXPLORE
• Community-‐based re-‐entry programs and services addressing criminal thinking
• Substance abuse and mental health treatment, tailored to criminogenic needs, available in community
• System responses to supervision viola>ons
• Case load distribu>on across risk level
• Parole viola>ons and revoca>ons • Outcomes for re-‐entry popula>ons by supervision status
• Proba>on programming and viola>on sanc>oning prac>ces
• Enrollment in community treatment and atercare
DATA TO ANALYZE

1/11/16
22
Key ini>al findings
Council of State Governments Jus>ce Center 43
Incarcera(on
MassachuseXs’s incarcerated popula>ons are divided in half between county and state facili>es
HOC popula>ons have driven overall decline in incarcera>on Trends in jail popula>ons differ across coun>es
Recidivism
Few recidivism measures are rou>nely calculated and reported in MA
Recidivism for prison releases has remained at around 40%
Use of risk and needs assessments are fundamental to effec>ve recidivism reduc>on strategies
Supervision
Community supervision serves approximately 3/4 of the criminal jus>ce popula>on in MA
Proba>on has consistently been relied upon for post-‐release supervision from incarcera>on
Two out of five prison releases are released to no supervision
Jus>ce reinvestment will explore opportuni>es for genera>ng increased public safety with less spending
Council of State Governments Jus>ce Center 44
Ensuring Effec(ve Supervision Prac(ces
Measuring and Reducing Recidivism
Focusing Use of Incarcera(on
Reduced Crime and Increased Public Safety
State and Local Dollars Saved Resources Reinvested

1/11/16
23
Jus>ce reinvestment >meline
Council of State Governments Jus>ce Center 45
Working Group (WG)
Mee(ng 1
Impact Analysis
Data Analysis
Ini>al Analysis Detailed Data Analysis
WG Mee>ng
2 Bill Introduc(on
Final Report Released
Policymaker and Stakeholder Engagement
Stakeholder Engagement and Policymaker Briefings Policy Op>on Development Ongoing engagement
WG Mee>ng 5: Ini>al Policy
Op>on Discussion
Jan Feb Mar Apr May Jun Jul Aug Oct -‐ Dec 2017 Session
WG Mee>ng
3
Steering commiZee to meet 1-‐2 weeks in advance of each working group mee.ng
WG Mee>ng
4
WG Mee>ng 6:
Final Policy Op>ons
Discussion
Sept
Community supervision is likely to be the focus of the next working group mee>ng
Council of State Governments Jus>ce Center 46
Dec Jan Feb Mar Apr May Jun Jul
Working Group Mee>ng
2
Aug Sep -‐ Dec 2017 Session
To prepare for the next mee>ng, CSG Jus>ce Center staff will circulate a survey to collect informa>on on ideas and recommenda>ons for data analysis, stakeholder input, policy review, and more.

1/11/16
24
Council of State Governments Jus>ce Center 47
Thank You Cassondra Warney, Policy Analyst [email protected]
This material was prepared for the State of MassachuseXs. The presenta>on was developed by members of the Council of State Governments Jus>ce Center staff. Because presenta>ons are not subject to the same rigorous review process as other printed materials, the statements made reflect the views of the authors, and should not be considered the official posi>on of the Jus>ce Center, the members of the Council of State Governments, or the funding agency suppor>ng the work.
C SG J U S T I C E C EN T E R . O RG / SUB S C R I B E