June 19, 2013 Mr. Joseph T. Martella II, Senior Engineer ... 19, 2013 Mr. Joseph T. Martella II,...
26
AMEC Environment & Infrastructure, Inc. 107 Audubon Road, Suite 301 Wakefield, MA 01880 Tel +(781) 245-6606 Fax +(781) 246-5060 www.amec.com June 19, 2013 Mr. Joseph T. Martella II, Senior Engineer RIDEM Office of Waste Management Site Remediation Program 235 Providence Street Providence, RI 02908 RE: Parcel C-1 Phase III Area - Pre-Design Soil Sampling Former Gorham Manufacturing Facility 333 Adelaide Avenue, Providence, Rhode Island MACTEC Project No. 3650100169.01 Dear Mr. Martella: On behalf of Textron, this letter presents the scope of work AMEC Environment and Infrastructure, Inc. (AMEC) has planned for the collection of up to 20 soil samples from within the northeastern upland area of Parcel C-1 of the Former Gorham Manufacturing Facility site (the Site). This upland area is defined as the Phase III area of the Site’s phased remedial actions. The objective of this pre-design sampling program is to define the eastern most edge of the proposed Phase III cap. BACKGROUND Soil investigations and test pits were conducted in the northeast portion of the Site between 1994 and 2002. Supplemental soil investigations were then conducted on the northeastern portion of the Site in June 2006 to fill data gaps and to support completion of a human health and ecological risk assessment for Parcel C-1. Following a sampling grid consisting of nine 70- by 70-foot squares placed across the former parking area at the north easternmost portion of the Site (i.e., Phase III cap area) AMEC collected a surface soil sample from the center of each grid square (SS-SI012 through SS-SI020), including one (SS-SI012) from a localized depression as shown in Figure 1. AMEC collected additional surface soil samples (SS-SI022, SS-SI023, and SS-SI024) from beneath a large debris pile located in that area (removed by the City of Providence in 2007), and from below two historic discharge pipes and drainage pathways (SS-SI002 and SS-SI021) leading from the northeastern area of the Site. Results of this soil sampling investigation were summarized in the 2006 Supplemental Site Investigation Report (SSIR) (MACTEC, 2006). These data were used to define the proposed soil cap for the Phase III area. As shown in Table 1 the Phase III area soils exceeded the Rhode Island Residential Direct Exposure Criteria (RDEC) for arsenic, lead and polycyclic aromatic hydrocarbons (PAHs) and the dioxin toxic equivalent concentration (TEQ). The 2006 SSIR concluded that additional soil sampling was required along the eastern side of the Phase III cap area to further define the extent of the soil cap construction.
Transcript of June 19, 2013 Mr. Joseph T. Martella II, Senior Engineer ... 19, 2013 Mr. Joseph T. Martella II,...

AMEC Environment & Infrastructure, Inc. 107 Audubon Road, Suite 301 Wakefield, MA 01880 Tel +(781) 245-6606 Fax +(781) 246-5060 www.amec.com
June 19, 2013
Mr. Joseph T. Martella II, Senior Engineer RIDEM Office of Waste Management Site Remediation Program 235 Providence Street Providence, RI 02908
RE: Parcel C-1 Phase III Area - Pre-Design Soil Sampling Former Gorham Manufacturing Facility 333 Adelaide Avenue, Providence, Rhode Island MACTEC Project No. 3650100169.01
Dear Mr. Martella:
On behalf of Textron, this letter presents the scope of work AMEC Environment and Infrastructure, Inc. (AMEC) has planned for the collection of up to 20 soil samples from within the northeastern upland area of Parcel C-1 of the Former Gorham Manufacturing Facility site (the Site). This upland area is defined as the Phase III area of the Site’s phased remedial actions. The objective of this pre-design sampling program is to define the eastern most edge of the proposed Phase III cap.
BACKGROUND
Soil investigations and test pits were conducted in the northeast portion of the Site between 1994 and 2002. Supplemental soil investigations were then conducted on the northeastern portion of the Site in June 2006 to fill data gaps and to support completion of a human health and ecological risk assessment for Parcel C-1. Following a sampling grid consisting of nine 70- by 70-foot squares placed across the former parking area at the north easternmost portion of the Site (i.e., Phase III cap area) AMEC collected a surface soil sample from the center of each grid square (SS-SI012 through SS-SI020), including one (SS-SI012) from a localized depression as shown in Figure 1. AMEC collected additional surface soil samples (SS-SI022, SS-SI023, and SS-SI024) from beneath a large debris pile located in that area (removed by the City of Providence in 2007), and from below two historic discharge pipes and drainage pathways (SS-SI002 and SS-SI021) leading from the northeastern area of the Site. Results of this soil sampling investigation were summarized in the 2006 Supplemental Site Investigation Report (SSIR) (MACTEC, 2006). These data were used to define the proposed soil cap for the Phase III area. As shown in Table 1 the Phase III area soils exceeded the Rhode Island Residential Direct Exposure Criteria (RDEC) for arsenic, lead and polycyclic aromatic hydrocarbons (PAHs) and the dioxin toxic equivalent concentration (TEQ). The 2006 SSIR concluded that additional soil sampling was required along the eastern side of the Phase III cap area to further define the extent of the soil cap construction.

Mr. Joseph T. Martella II, Senior Engineer June 19, 2013 Page 2 As summarized in attached Table 1 and depicted on attached Figure 1, the eastern edge of Phase III cap area is defined by low (i.e., less than the respective RDEC or non-detect concentrations of contaminants at sampling points SS-SI021, SS-SI014, SS-SI013, and SS-SI012. However, as shown in Figure 1, data gaps still exist on the most northern end at sampling location SS-SI002, and south and east of sampling locations SS-SI012, SS-SI022, SS-SI023, and SS-SI024. To close the data gaps, AMEC will collect soil samples along the eastern edge of the upland area as part of the Phase III cap pre-design activities described in the proposed scope of work below. It should be noted that pavement from a former parking area exists beneath portions of the northeast area, and soil and/or fill material is present on top of that pavement. Textron also intends to cap the former City of Providence Fire Museum building area located along the railroad right of way (ROW) so soil sampling of this area is not required or proposed under this work plan (Figure 2). No soil sampling is proposed under the access road easement maintained by the City of Providence or within the Amtrak parcel located along the railroad ROW (Figure 2).
SCOPE OF WORK Two AMEC field scientists will collect soil samples from eight locations within the upland portion of Parcel C-1 as shown in Figure 2 and summarized on Table 2. To be consistent with historical contamination depths, soil samples will be collected from two depth intervals, 0-1 foot and 1-2 feet below the ground surface, at each location using handcore samplers. In addition, AMEC will follow the sampling methodology used during the 2006 soil investigation by including the soil / fill material present on top of the pavement in the surface soil sample. At each location observations noting the presence or absence of pavement and the layer of soil on top of pavement will be recorded on the field sampling record. Additional hand tools (e.g., sledge hammer, pry bar) may be employed to remove pavement to allow access to the soil beneath at affected sample locations. Care will be taken to prevent pieces of pavement from being included in the soil samples.
Soil samples will be collected from two parallel lines extending north to south beyond the 2006 soil sample locations on the northeastern edge of the Parcel C-1 property line. As shown in Figure 2, soil samples from these two lines (Line A and Line B) will close the data gaps and refine the actual limits of the eastern edge of the proposed Phase III cap. Samples from both depth intervals (0-1 foot and 1-2 feet) from each location (Line A and Line B) will be submitted to the contract laboratory via courier on the same day as the samples are collected, under standard sample preservation and chain-of-custody (COC) requirements. Requested analyses will include PAHs, metals (arsenic and lead only), and dioxins/furans based on the 2006 SSIR sampling and human health risk assessment results. Consistent with these historic results, only the samples from the 0-1 foot interval will be analyzed for dioxins/furans. One field duplicate sample and one matrix spike/matrix spike duplicate (MS/MSD) sample will be collected and submitted for analysis for quality control purposes. Soil samples will be screened in the field using a photoionization detector (PID), and the sample locations will be documented using Global Positioning System (GPS) technology.

Mr. Joseph T. Martella II, Senior Engineer June 19, 2013 Page 3 The contracted laboratory will be instructed to analyze Line A samples from locations A1, A2, and A3 (two depth intervals), for PAHs and metals (arsenic and lead) only. Since PAHs have a short hold time (14 days), that and the metals analyses will be conducted under standard 5-day turnaround time. The samples from Line A4, A5 and A6 locations will be analyzed for PAHs, metals (arsenic and lead only) and dioxin/furans (surface soil samples only) under standard turnaround time. All Line B samples will be held pending the PAHs and metals results for the Line A samples. AMEC will evaluate the Line A PAHs and metals results against RDEC (Table 1) to meet the objective of this sampling program. Based on this screening evaluation, individual soil samples from Line A will be identified for dioxins/furans (surface soil sample only) analysis as described below and depicted in Table 2 and summarized below.
If a sample from Line A1, A2, or A3 does not exceed RDEC PAHs or metals (arsenic and lead) criteria, the laboratory will be instructed to analyze the surface soil sample (0 – 1 ft bgs) for dioxin/furan to complete the pre-design sampling and analysis for that location.
If a sample from Line A1, A2, or A3 exceeds RDEC PAHs and/or metals (arsenic and lead) criteria, the surface soil sample from that location will not be analyzed for dioxins/furans. Instead, the laboratory will be instructed to analyze the corresponding Line B sample (B1, B2, or B3) for PAHs within the original 14-day hold time, metals (arsenic and lead only), and dioxin/furan (surface soil sample only). See Table 2.
A total of 16 soil samples collected from up to eight locations along both Line A and Line B (two depth intervals), and two quality control (field duplicate and matrix spikes) are budgeted for analysis. This results in a total of 20 soil samples that are budgeted for analysis. AMEC expects that two field scientists can complete the sampling event in one 10-hour day. REPORTING AMEC will evaluate and summarize the data in a letter report to RIDEM approximately 3 weeks after AMEC receives all of the analytical data. This pre-design data will be used to refine the eastern edge of the proposed Phase III cap boundary. If the sampling results indicate that the eastern edge of the Phase III cap has not been defined, AMEC will recommend additional samples be collected further east and south of the June 2013 pre-design sampling locations up to, but not crossing the road or adjacent land currently used by the railroad.
PROPOSED SCHEDULE Textron and AMEC have tentatively scheduled soil sampling activities for the week of June 17, 2013. AMEC will mail written notification of this work to the abutters, stakeholders and building owner/occupants in accordance with the Remediation Regulations prior to conducting this work. The notification will be issued in both English and Spanish. AMEC will also notify Dig Safe for utility clearance prior to conducting this work.

Mr. Joseph T. Martella II, Senior Engineer June 19, 2013 Page 4 Textron and AMEC look forward to working with RIDEM on the execution of this soil sampling event and review of the Parcel C-1 upland area pre-design soil data. Feel free to contact either Greg Simpson of Textron at (401) 457-2635 or Dave Heislein at (781) 213-5655 with any questions. We are available either for a conference call or to meet with RIDEM to address any questions you may have on this work plan.
Respectfully, AMEC Environment and Infrastructure, Inc.
Annette McLean David E. Heislein Project Scientist Senior Project Manager
Attachments: Figure 1 – 1994 to 2006 Soil Sample Locations Figure 2 – Pre-Design Phase III Proposed Soil Sample Locations Table 1 Summary of Detections in Soil to be Capped Table 2 Soil Sampling and Analysis Methodology
AMEC Project File:P:\old_Wakefield_Data\projects\3652130009 - Textron Gorham Phase III Design\4.0 Project Deliverables\4.2 Work Plans\Parcel C-1 Phase III Pre-Design Soil Sampling WP 06-19-13.docx
AMEC Environment & Infrastructure, Inc. 107 Audubon Road, Suite 301 Wakefield, MA 01880 Tel +(781) 245-6606 Fax +(781) 246-5060 www.amec.com
FIGURE 1 Proposed Phase III Cap Area

%C
%C
%C
ED
ED
ED
ED
@A
"A
"A
"A
"A
"A
%C
%C%C
%C
%C
%C
%C
%C
%C
%C
%C
%C
%C
%C
%C
%C
%C
%C
%C
%C
%C%C
%C %C
%C
%C
%C
%C
%C
%C
%C
%C
%C
"A
"A"A"A"A
ED
ED
ED
ED
ED
ED
ED
ED
ED
ED
%C%C%C
%C
%C
%C
%C%C
%C
%C
%C
%C
%C
%C
%C
%C
%C
%C
%C
%C
%C
%C
%C
%C
%C
%C%C
%C
%C%C
%C
%C
%C
%C
%C
%C
%C
%C
%C BK-5
BK-4JTP-4
JTP-3
JTP-2
JTP-1
SS-001
SS-402
SS-401
SS-400
SS-304
SS-301
SS-300
SS-216
SS-214SS-213
SS-212
SS-211 SS-207
SS-206
SS-205
SS-204
SS-203
SS-202
SS-201
SS-215
SS-104
SS-102
SS-101
SS-100
SD-008SD-007
SD-005 EX-002
SS-1003(approximate)
SS-1002(approximate)
MW-Q/B-23
MW-P/B-22
MW-O/B-21
MW-N/B-20
MW-M/B-19 TP-039 (89)
TP-038 (89)
TP-037 (89)
TP-036 (89)
TP-035 (89)
TP-034 (89)
TP-033 (89)
TP-032 (89)
TP-030 (89)
TP-029 (89)
TP-020 (94)
TP-019 (94)
TP-018 (94)
TP-017 (94)
SS-001-002N
SS-103
SS-001-002E
SS-001-002S
SS-001-002WSD-006-002W
SD-006-002N
SS-SI020
SS-SI018
SS-SI016
SS-SI015 SS-SI014
SS-SI006SS-SI004
SS-SI003
SS-SI206
SS-SI205
SS-SI024
SS-SI023
SS-SI022
SS-SI201
SS-SI207
SS-SI101
SS-SI202
SS-SI008
SS-SI007
SS-SI017
SS-SI019
SS-SI012
SS-SI013
SS-SI002
SS-SI021
Legend@A Monitoring Well"A Soil Boring%C Surface SoilED Test Pit
Division of Phase I and III for access road to coveProposed Cap AreaApproximate Park Parcel BoundaryApproximate Easement
Figure 11994 to 2006 SoilSample Locations
333 Adelaide AvenueProvidence, RI
Document: P:\TEXTRON\GORHAM\GIS\MapDocuments\PhaseIII Work Plan\AdditionalCapSampling_8x11_LS.mxd PDF: P:\old_Wakefield_Data\projects\3652130009 - Textron Gorham Phase III Design\4.0 Project Deliverables\4.2 Work Plans\Figure 1 - 1994 to 2006 Soil Sample Locations.pdf
0 15075Feet
Prepared/Date: BJR 06/19/13 Checked/Date: ARM 06/19/13¯
Existing Access Easement
City Sewer Easement
Amtrak

FIGURE 2 Proposed Soil Sample Locations
Phase III Area

!(!(!(!(
!(!(!(
!(!(
!(!(
!(
!(!(
!(!(!(
!(!(
!(!(!(
!(
!(
!(!(
!(
!(
!(
!(
!(!(
!(
!(
!(
!(
!(
!(
!(
!(
!(
!(
!(!(!(
!(
!(
!(
!(!(
!(!(
!(
!(
!(!(
!(
!(
!(
!(
!(
!(
!(
!(
!(
#*
#*
#*
#*
#*
#*
#*
#*
SS-402
SS-401
SS-400
SS-304
SS-300
SS-204
SS-203
SS-201
SS-100
SS-202
SS-101
SS-SI024
SS-SI023
SS-SI022
SS-SI021
SS-SI020
SS-SI019
SS-SI018
SS-SI015
SS-SI014
SS-SI016
SS-SI012
SS-SI002
SS-SI017
SS-SI013
BK-5
BK-4
B2
B1
A1
A2
A3
A4A5
A6
Legend#* Proposed Soil Sample!( Soil concentration exceeds RIDEC!( Soil concentration does not exceeds RIDEC
Division of Phase I and III for access road to coveProposed Cap AreaApproximate Park Parcel BoundaryApproximate Easement
Figure 2Proposed Phase III Cap Area and
Pre Design Sample Locations333 Adelaide Avenue
Providence, RIDocument: P:\TEXTRON\GORHAM\GIS\MapDocuments\PhaseIII Work Plan\AdditionalCapSampling_8x11_LS.mxd PDF: P:\old_Wakefield_Data\projects\3652130009 - Textron Gorham Phase III Design\4.0 Project Deliverables\4.2 Work Plans\Figure 2.pdf 6/19/2013 11:56 AM brian.roden
0 15075Feet
Prepared/Date: BJR 06/19/13 Checked/Date: ARM 06/19/13¯
Existing Access Easement
City Sewer Easement
Amtrak

TABLE 1
Summary of Detections in Soil to be Capped

Table 1Summary of Detected Compounds in Soil - Phase III Area to be Capped
Former Gorham Manufacturing FacilityProvidence, Rhode Island
parameter.name
Residential Direct
Exposure Criteria (ppm)
BK-4D 3/12/2001
1.5-2 ft
BK4XX020-1 8/6/2002
0-1 ft
BK4XX021-1.5 8/6/2002 1-1.5 ft
BK5D 3/1/2001 1.5-2 ft
BK5S 3/1/2001 0-0.5 ft
GMSS100X01LDXX
5/27/1998 0-1 ft
GMSS101X01LDXX
5/27/1998 0-1 ft
GMSS201X01RAXX
12/11/1998 0-1 ft
GMSS202X01RAXX
12/11/1998 0-1 ft
Semivolatile Organics (mg/Kg)Acenaphthylene 23 0.366 U 0.45 U 0.348 UAnthracene 35 0.366 U 0.45 U 0.348 UBenzo(a)anthracene 0.9 0.366 U 0.808 0.348 UBenzo(a)pyrene 0.4 0.366 U 1.11 0.348 UBenzo(b)fluoranthene 0.9 0.366 U 1.24 0.348 UBenzo(g,h,i)perylene 0.8 0.366 U 0.508 0.348 UBenzo(k)fluoranthene 0.9 0.366 U 1.1 0.348 UChrysene 0.4 0.366 U 0.904 0.348 UDibenzo(a,h)anthracene 0.4 0.366 U 0.45 U 0.348 UFluoranthene 20 0.368 2.3 0.348 UFluorene 28 0.366 U 0.45 U 0.348 UIndeno(1,2,3-cd)pyrene 0.9 0.366 U 0.514 0.348 UNaphthalene 54 0.366 U 0.45 U 0.348 UPhenanthrene 40 0.366 U 0.928 0.348 UPyrene 13 0.366 U 1.74 0.348 UPolyaromatic Hydrocarbons (mg/Kg)Anthracene 35 0.337 U 0.337 UBenzo(a)anthracene 0.9 0.337 U 0.337 UBenzo(a)pyrene 0.4 0.337 U 0.337 UBenzo(b)fluoranthene 0.9 0.337 U 0.337 UBenzo(g,h,i)perylene 0.8 0.337 U 0.337 UBenzo(k)fluoranthene 0.9 0.337 U 0.337 UChrysene 0.4 0.337 U 0.337 UDibenzo(a,h)anthracene 0.4 0.337 U 0.337 UFluoranthene 20 0.337 U 0.337 UIndeno(1,2,3-cd)pyrene 0.9 0.337 U 0.337 UPhenanthrene 40 0.337 U 0.337 UPyrene 13 0.337 U 0.337 UPesticides/PCBs (mg/Kg)4,4'-DDD 2.74,4'-DDE 1.94,4'-DDT 1.9alpha-Chlordane 1.8beta-BHC 0.4Chlordane 0.5gamma-Chlordane 1.8Heptachlor epoxide 0.07Hexachlorobenzene 0.4Aroclor-1242 10Aroclor-1254 10
\\WFD-fs1\projects\old_Wakefield_Data\projects\3652130009 - Textron Gorham Phase III Design\4.0 Project Deliverables\4.2 Work Plans\Table 1 - Summary of Detections - Soil to be Capped.xls, Detects Page 1 of 15
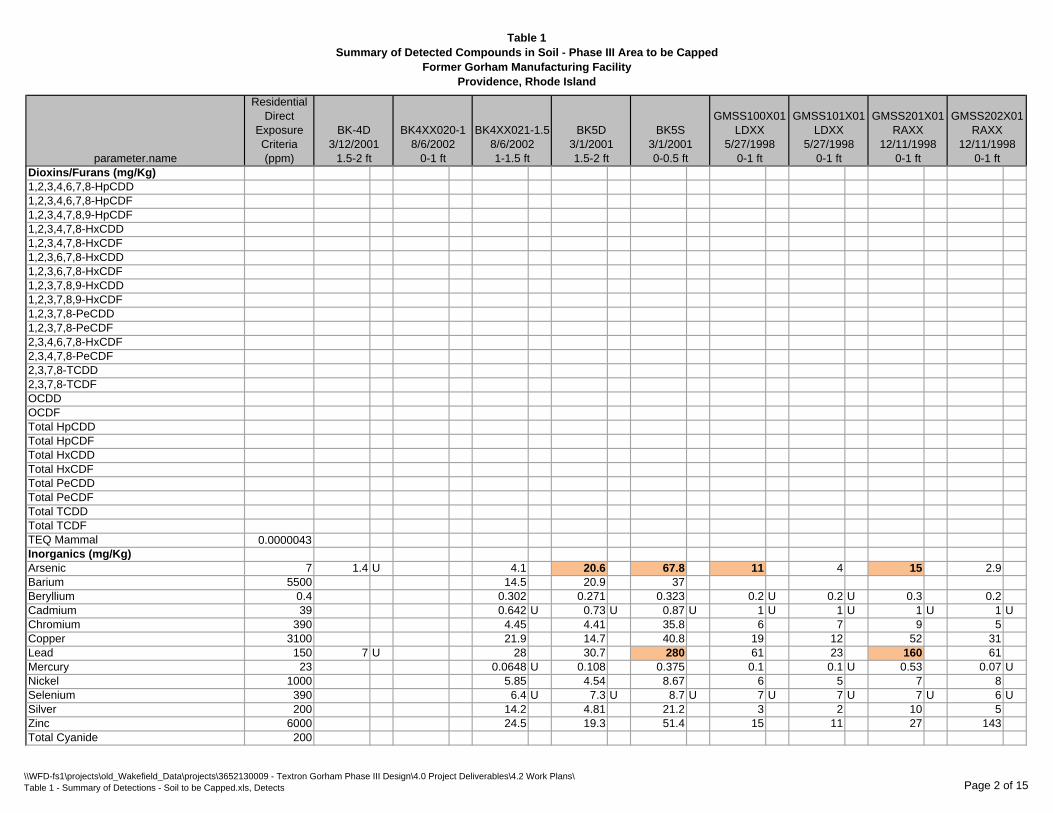
Table 1Summary of Detected Compounds in Soil - Phase III Area to be Capped
Former Gorham Manufacturing FacilityProvidence, Rhode Island
parameter.name
Residential Direct
Exposure Criteria (ppm)
BK-4D 3/12/2001
1.5-2 ft
BK4XX020-1 8/6/2002
0-1 ft
BK4XX021-1.5 8/6/2002 1-1.5 ft
BK5D 3/1/2001 1.5-2 ft
BK5S 3/1/2001 0-0.5 ft
GMSS100X01LDXX
5/27/1998 0-1 ft
GMSS101X01LDXX
5/27/1998 0-1 ft
GMSS201X01RAXX
12/11/1998 0-1 ft
GMSS202X01RAXX
12/11/1998 0-1 ft
Dioxins/Furans (mg/Kg)1,2,3,4,6,7,8-HpCDD1,2,3,4,6,7,8-HpCDF1,2,3,4,7,8,9-HpCDF1,2,3,4,7,8-HxCDD1,2,3,4,7,8-HxCDF1,2,3,6,7,8-HxCDD1,2,3,6,7,8-HxCDF1,2,3,7,8,9-HxCDD1,2,3,7,8,9-HxCDF1,2,3,7,8-PeCDD1,2,3,7,8-PeCDF2,3,4,6,7,8-HxCDF2,3,4,7,8-PeCDF2,3,7,8-TCDD2,3,7,8-TCDFOCDDOCDFTotal HpCDDTotal HpCDFTotal HxCDDTotal HxCDFTotal PeCDDTotal PeCDFTotal TCDDTotal TCDFTEQ Mammal 0.0000043Inorganics (mg/Kg)Arsenic 7 1.4 U 4.1 20.6 67.8 11 4 15 2.9Barium 5500 14.5 20.9 37Beryllium 0.4 0.302 0.271 0.323 0.2 U 0.2 U 0.3 0.2Cadmium 39 0.642 U 0.73 U 0.87 U 1 U 1 U 1 U 1 UChromium 390 4.45 4.41 35.8 6 7 9 5Copper 3100 21.9 14.7 40.8 19 12 52 31Lead 150 7 U 28 30.7 280 61 23 160 61Mercury 23 0.0648 U 0.108 0.375 0.1 0.1 U 0.53 0.07 UNickel 1000 5.85 4.54 8.67 6 5 7 8Selenium 390 6.4 U 7.3 U 8.7 U 7 U 7 U 7 U 6 USilver 200 14.2 4.81 21.2 3 2 10 5Zinc 6000 24.5 19.3 51.4 15 11 27 143Total Cyanide 200
\\WFD-fs1\projects\old_Wakefield_Data\projects\3652130009 - Textron Gorham Phase III Design\4.0 Project Deliverables\4.2 Work Plans\Table 1 - Summary of Detections - Soil to be Capped.xls, Detects Page 2 of 15

Table 1Summary of Detected Compounds in Soil - Phase III Area to be Capped
Former Gorham Manufacturing FacilityProvidence, Rhode Island
parameter.name
Residential Direct
Exposure Criteria (ppm)
BK-4D 3/12/2001
1.5-2 ft
BK4XX020-1 8/6/2002
0-1 ft
BK4XX021-1.5 8/6/2002 1-1.5 ft
BK5D 3/1/2001 1.5-2 ft
BK5S 3/1/2001 0-0.5 ft
GMSS100X01LDXX
5/27/1998 0-1 ft
GMSS101X01LDXX
5/27/1998 0-1 ft
GMSS201X01RAXX
12/11/1998 0-1 ft
GMSS202X01RAXX
12/11/1998 0-1 ft
Petroleum Hydrocarbons (mg/Kg)Total Petroleum Hydrocarbon 56 42
mg/Kg = milligram per kilogramU = not detected, value is the reporting limitJ = value is estimatedP = Percent difference between primary and confirmation results exceeds 40%A = Detection limit based on signal-to-noise meansurementB = Less than 10 times higher than method blank levelE = PCDE InterferenceI = Interference
\\WFD-fs1\projects\old_Wakefield_Data\projects\3652130009 - Textron Gorham Phase III Design\4.0 Project Deliverables\4.2 Work Plans\Table 1 - Summary of Detections - Soil to be Capped.xls, Detects Page 3 of 15

Table 1Summary of Detected Compounds in Soil - Phase III Area to be Capped
Former Gorham Manufacturing FacilityProvidence, Rhode Island
parameter.nameSemivolatile Organics (mg/Kg)AcenaphthyleneAnthraceneBenzo(a)anthraceneBenzo(a)pyreneBenzo(b)fluorantheneBenzo(g,h,i)peryleneBenzo(k)fluorantheneChryseneDibenzo(a,h)anthraceneFluorantheneFluoreneIndeno(1,2,3-cd)pyreneNaphthalenePhenanthrenePyrenePolyaromatic Hydrocarbons (mg/Kg)AnthraceneBenzo(a)anthraceneBenzo(a)pyreneBenzo(b)fluorantheneBenzo(g,h,i)peryleneBenzo(k)fluorantheneChryseneDibenzo(a,h)anthraceneFluorantheneIndeno(1,2,3-cd)pyrenePhenanthrenePyrenePesticides/PCBs (mg/Kg)4,4'-DDD4,4'-DDE4,4'-DDTalpha-Chlordanebeta-BHCChlordanegamma-ChlordaneHeptachlor epoxideHexachlorobenzeneAroclor-1242Aroclor-1254
GMSS203X01RAXX
12/11/1998 0-1 ft
GMSS204X01RAXX
12/11/1998 0-1 ft
GMSSBK400101XX
10/12/1994 0-1 ft
GMSSBK500101XX
10/12/1994 0-1 ft
SS-100D 3/12/2001
1.5-2 ft
SS-203D 3/12/2001
1.5-2 ft
SS203XX020-1
8/6/2002 0-1 ft
SS204XX020-1
8/6/2002 0-1 ft
SS-300D 3/12/2001
1.5-2 ft
0.34 U 0.6290.34 U 1.850.34 U 1.710.34 U 1.60.34 U 0.7160.34 U 1.430.34 U 1.880.34 U 0.365 U
0.568 4.280.34 U 0.6380.34 U 2.71
0.461 3.95
\\WFD-fs1\projects\old_Wakefield_Data\projects\3652130009 - Textron Gorham Phase III Design\4.0 Project Deliverables\4.2 Work Plans\Table 1 - Summary of Detections - Soil to be Capped.xls, Detects Page 4 of 15

Table 1Summary of Detected Compounds in Soil - Phase III Area to be Capped
Former Gorham Manufacturing FacilityProvidence, Rhode Island
parameter.nameDioxins/Furans (mg/Kg)1,2,3,4,6,7,8-HpCDD1,2,3,4,6,7,8-HpCDF1,2,3,4,7,8,9-HpCDF1,2,3,4,7,8-HxCDD1,2,3,4,7,8-HxCDF1,2,3,6,7,8-HxCDD1,2,3,6,7,8-HxCDF1,2,3,7,8,9-HxCDD1,2,3,7,8,9-HxCDF1,2,3,7,8-PeCDD1,2,3,7,8-PeCDF2,3,4,6,7,8-HxCDF2,3,4,7,8-PeCDF2,3,7,8-TCDD2,3,7,8-TCDFOCDDOCDFTotal HpCDDTotal HpCDFTotal HxCDDTotal HxCDFTotal PeCDDTotal PeCDFTotal TCDDTotal TCDFTEQ MammalInorganics (mg/Kg)ArsenicBariumBerylliumCadmiumChromiumCopperLeadMercuryNickelSeleniumSilverZincTotal Cyanide
GMSS203X01RAXX
12/11/1998 0-1 ft
GMSS204X01RAXX
12/11/1998 0-1 ft
GMSSBK400101XX
10/12/1994 0-1 ft
GMSSBK500101XX
10/12/1994 0-1 ft
SS-100D 3/12/2001
1.5-2 ft
SS-203D 3/12/2001
1.5-2 ft
SS203XX020-1
8/6/2002 0-1 ft
SS204XX020-1
8/6/2002 0-1 ft
SS-300D 3/12/2001
1.5-2 ft
23 19 11 60 6.21 2.35 2.23
0.2 0.3 1 U 1 U1 U 1 U 1 U 1 U6 7 10 70
43 91 66 49119 274 279 591 23.2 6.8 U 95.20.45 0.34 0.5 U 0.5
6 9 17 117 U 8 U 1 U 5
16 18 52 1 U13 35 74 77
0.5 U 0.5
\\WFD-fs1\projects\old_Wakefield_Data\projects\3652130009 - Textron Gorham Phase III Design\4.0 Project Deliverables\4.2 Work Plans\Table 1 - Summary of Detections - Soil to be Capped.xls, Detects Page 5 of 15

Table 1Summary of Detected Compounds in Soil - Phase III Area to be Capped
Former Gorham Manufacturing FacilityProvidence, Rhode Island
parameter.namePetroleum Hydrocarbons (mg/Kg)Total Petroleum Hydrocarbon
mg/Kg = milligram per kilogramU = not detected, value is the reporting limitJ = value is estimatedP = Percent difference between primary and confirmation results exceeds 40%A = Detection limit based on signal-to-noise meansurementB = Less than 10 times higher than method blank levelE = PCDE InterferenceI = Interference
GMSS203X01RAXX
12/11/1998 0-1 ft
GMSS204X01RAXX
12/11/1998 0-1 ft
GMSSBK400101XX
10/12/1994 0-1 ft
GMSSBK500101XX
10/12/1994 0-1 ft
SS-100D 3/12/2001
1.5-2 ft
SS-203D 3/12/2001
1.5-2 ft
SS203XX020-1
8/6/2002 0-1 ft
SS204XX020-1
8/6/2002 0-1 ft
SS-300D 3/12/2001
1.5-2 ft
21 U 3600
\\WFD-fs1\projects\old_Wakefield_Data\projects\3652130009 - Textron Gorham Phase III Design\4.0 Project Deliverables\4.2 Work Plans\Table 1 - Summary of Detections - Soil to be Capped.xls, Detects Page 6 of 15

Table 1Summary of Detected Compounds in Soil - Phase III Area to be Capped
Former Gorham Manufacturing FacilityProvidence, Rhode Island
parameter.nameSemivolatile Organics (mg/Kg)AcenaphthyleneAnthraceneBenzo(a)anthraceneBenzo(a)pyreneBenzo(b)fluorantheneBenzo(g,h,i)peryleneBenzo(k)fluorantheneChryseneDibenzo(a,h)anthraceneFluorantheneFluoreneIndeno(1,2,3-cd)pyreneNaphthalenePhenanthrenePyrenePolyaromatic Hydrocarbons (mg/Kg)AnthraceneBenzo(a)anthraceneBenzo(a)pyreneBenzo(b)fluorantheneBenzo(g,h,i)peryleneBenzo(k)fluorantheneChryseneDibenzo(a,h)anthraceneFluorantheneIndeno(1,2,3-cd)pyrenePhenanthrenePyrenePesticides/PCBs (mg/Kg)4,4'-DDD4,4'-DDE4,4'-DDTalpha-Chlordanebeta-BHCChlordanegamma-ChlordaneHeptachlor epoxideHexachlorobenzeneAroclor-1242Aroclor-1254
SS-300S 3/12/2001
0-0.5 ft
SS300XX020-1
8/6/2002 0-1 ft
SS304XX010-1
8/6/2002 0-1 ft
SS400S 3/1/2001 0-0.5 ft
SS401D 3/1/2001 1.5-2 ft
SS401S 3/1/2001 0-0.5 ft
SS402S 3/1/2001 0-0.5 ft
SS-SI002 6/7/2006 0-0.5 ft
SS-SI012 6/8/2006 0-0.5 ft
0.404 U 0.368 U 0.431 U 0.443 U 1.13 U 0.0277 U0.404 U 0.504 0.657 0.511 2.18 0.0277 U
1.51 1.53 4.45 1.62 2.4 0.1771.81 1.81 4.08 2.22 1.71 0.2112.05 2.02 3.74 2.23 1.45 0.244
0.782 0.816 2.04 1.26 1.13 U 0.0611.83 1.65 3.8 1.73 1.81 0.1921.64 1.61 4.08 1.74 2.61 0.184
0.404 U 0.368 U 0.431 U 0.443 U 1.13 U 0.02774.2 3.99 8.34 3.76 6.59 0.495
0.404 U 0.368 U 0.431 U 0.443 U 1.13 U 0.0277 U0.809 0.806 2.08 1.16 1.13 U 0.06820.404 U 0.368 U 0.431 U 0.443 U 1.13 U 0.0277 U
2.09 2.68 3.02 1.72 10.7 0.06213.07 3.28 7.78 3.23 7.52 0.294
1.13 0.344 U3.04 0.53.44 0.6353.15 0.675
1.8 0.4252.72 0.526
3.1 0.7010.687 0.344 U
8.11 1.231.59 0.3695.54 0.5556.61 0.994
0.048 0.00528 U0.116 0.00528 U0.496 0.00976
0.0119 U 0.00528 U0.0119 U 0.00528 U
0.119 U 0.0528 U0.0119 U 0.00528 U0.0119 U 0.00528 U0.0119 U 0.00528 U
0.119 U 0.0527 U0.119 U 0.0527 U
\\WFD-fs1\projects\old_Wakefield_Data\projects\3652130009 - Textron Gorham Phase III Design\4.0 Project Deliverables\4.2 Work Plans\Table 1 - Summary of Detections - Soil to be Capped.xls, Detects Page 7 of 15

Table 1Summary of Detected Compounds in Soil - Phase III Area to be Capped
Former Gorham Manufacturing FacilityProvidence, Rhode Island
parameter.nameDioxins/Furans (mg/Kg)1,2,3,4,6,7,8-HpCDD1,2,3,4,6,7,8-HpCDF1,2,3,4,7,8,9-HpCDF1,2,3,4,7,8-HxCDD1,2,3,4,7,8-HxCDF1,2,3,6,7,8-HxCDD1,2,3,6,7,8-HxCDF1,2,3,7,8,9-HxCDD1,2,3,7,8,9-HxCDF1,2,3,7,8-PeCDD1,2,3,7,8-PeCDF2,3,4,6,7,8-HxCDF2,3,4,7,8-PeCDF2,3,7,8-TCDD2,3,7,8-TCDFOCDDOCDFTotal HpCDDTotal HpCDFTotal HxCDDTotal HxCDFTotal PeCDDTotal PeCDFTotal TCDDTotal TCDFTEQ MammalInorganics (mg/Kg)ArsenicBariumBerylliumCadmiumChromiumCopperLeadMercuryNickelSeleniumSilverZincTotal Cyanide
SS-300S 3/12/2001
0-0.5 ft
SS300XX020-1
8/6/2002 0-1 ft
SS304XX010-1
8/6/2002 0-1 ft
SS400S 3/1/2001 0-0.5 ft
SS401D 3/1/2001 1.5-2 ft
SS401S 3/1/2001 0-0.5 ft
SS402S 3/1/2001 0-0.5 ft
SS-SI002 6/7/2006 0-0.5 ft
SS-SI012 6/8/2006 0-0.5 ft
0.000012 1.2E-06 J9.1E-06 1.2E-06 J2.1E-06 J 8.1E-07 U1.5E-06 J 8.1E-07 U7.7E-06 8.1E-07 U2.7E-06 J 8.1E-07 U1.1E-06 UE 8.1E-07 UE1.9E-06 J 8.1E-07 U4.9E-06 J 8.1E-07 U3.4E-06 J 8.1E-07 U3.2E-06 J 8.1E-07 U5.7E-06 8.1E-07 U
0.000023 1.1E-06 J0.000001 J 1.6E-07 U
1.9E-06 1.6E-07 U0.00005 0.0000114.7E-06 J 1.6E-06 U
0.000025 2.4E-06 J0.000022 1.2E-06 J0.000039 8.1E-07 U
0.00016 6.3E-060.000037 8.1E-07 U
0.00025 0.0000130.00002 1.6E-07 U
0.000081 4.1E-060.000027 0.0000012
6.02 11 29.2 20 19.8 44.6 3.1 U 1.927.7 42.2 356 45.6 58.5 38.8 12.7
0.347 0.346 0.281 0.265 0.372 0.12 U 0.06 U0.694 U 0.79 U 0.74 U 0.85 U 0.87 U 1.23 U 0.61 U
8 34.4 12.5 21.7 70 10.6 7.4118 86.8 66.1 81.9 76.4 127 8.4
332 157 213 402 350 453 138 15.40.373 0.357 0.253 0.283 1.21 0.143 0.055
13.7 9.02 9.53 9.86 12.6 13.9 3.36.9 U 7.9 U 7.4 U 8.5 U 8.7 U 12.3 U 6.1 U30 19 35.6 63.9 53.5 10.7 0.81
49.6 64.4 88 139 83.4 120 16.2
\\WFD-fs1\projects\old_Wakefield_Data\projects\3652130009 - Textron Gorham Phase III Design\4.0 Project Deliverables\4.2 Work Plans\Table 1 - Summary of Detections - Soil to be Capped.xls, Detects Page 8 of 15

Table 1Summary of Detected Compounds in Soil - Phase III Area to be Capped
Former Gorham Manufacturing FacilityProvidence, Rhode Island
parameter.namePetroleum Hydrocarbons (mg/Kg)Total Petroleum Hydrocarbon
mg/Kg = milligram per kilogramU = not detected, value is the reporting limitJ = value is estimatedP = Percent difference between primary and confirmation results exceeds 40%A = Detection limit based on signal-to-noise meansurementB = Less than 10 times higher than method blank levelE = PCDE InterferenceI = Interference
SS-300S 3/12/2001
0-0.5 ft
SS300XX020-1
8/6/2002 0-1 ft
SS304XX010-1
8/6/2002 0-1 ft
SS400S 3/1/2001 0-0.5 ft
SS401D 3/1/2001 1.5-2 ft
SS401S 3/1/2001 0-0.5 ft
SS402S 3/1/2001 0-0.5 ft
SS-SI002 6/7/2006 0-0.5 ft
SS-SI012 6/8/2006 0-0.5 ft
\\WFD-fs1\projects\old_Wakefield_Data\projects\3652130009 - Textron Gorham Phase III Design\4.0 Project Deliverables\4.2 Work Plans\Table 1 - Summary of Detections - Soil to be Capped.xls, Detects Page 9 of 15

Table 1Summary of Detected Compounds in Soil - Phase III Area to be Capped
Former Gorham Manufacturing FacilityProvidence, Rhode Island
parameter.nameSemivolatile Organics (mg/Kg)AcenaphthyleneAnthraceneBenzo(a)anthraceneBenzo(a)pyreneBenzo(b)fluorantheneBenzo(g,h,i)peryleneBenzo(k)fluorantheneChryseneDibenzo(a,h)anthraceneFluorantheneFluoreneIndeno(1,2,3-cd)pyreneNaphthalenePhenanthrenePyrenePolyaromatic Hydrocarbons (mg/Kg)AnthraceneBenzo(a)anthraceneBenzo(a)pyreneBenzo(b)fluorantheneBenzo(g,h,i)peryleneBenzo(k)fluorantheneChryseneDibenzo(a,h)anthraceneFluorantheneIndeno(1,2,3-cd)pyrenePhenanthrenePyrenePesticides/PCBs (mg/Kg)4,4'-DDD4,4'-DDE4,4'-DDTalpha-Chlordanebeta-BHCChlordanegamma-ChlordaneHeptachlor epoxideHexachlorobenzeneAroclor-1242Aroclor-1254
SS-SI013 6/8/2006 0-
0.5 ft
SS-SI014 6/8/2006 0-
0.5 ft
SS-SI015 6/8/2006 0-0.5 ft
SS-SI016 6/8/2006 0-0.5 ft
SS-SI017 6/8/2006 0-0.5 ft
SS-SI018 6/8/2006 0-
0.5 ft
SS-SI019 6/8/2006 0-
0.5 ft
SS-SI020 6/8/2006 0-
0.5 ft
0.027 U 0.0261 U 0.559 U 0.543 U 0.574 0.0272 U 0.0264 U 0.552 U0.0811 0.0261 U 0.784 0.543 U 1.05 0.0272 U 0.0264 U 0.558
0.193 0.0261 U 2.78 1.36 3.12 0.0717 0.0332 2.240.165 0.0261 U 2.69 1.65 3.11 0.0869 0.0585 2.350.222 0.0261 U 2.68 1.95 3.33 0.125 0.0886 2.47
0.0513 0.0261 U 1.55 0.944 1.35 0.0272 U 0.0264 U 1.210.157 0.0261 U 1.95 1.36 2.25 0.0934 0.0638 1.760.195 0.0261 U 2.7 1.47 2.96 0.0766 0.0427 2.160.027 U 0.0261 U 0.559 U 0.543 U 0.529 U 0.0272 U 0.0264 U 0.552 U0.504 0.0261 U 5.52 2.84 6.95 0.273 0.116 4.8
0.0438 0.0261 U 0.559 U 0.543 U 0.529 U 0.0272 U 0.0264 U 0.552 U0.0573 0.0261 U 1.53 0.952 1.38 0.0293 0.0264 U 1.16
0.027 U 0.0261 U 0.559 U 0.543 U 0.529 U 0.0272 U 0.0264 U 0.552 U0.413 0.0261 U 3.71 0.664 5.09 0.0565 0.0364 2.560.438 0.0261 U 3.97 1.91 5.42 0.171 0.0828 4.04
0.00514 U 0.00507 U 0.00729 0.00572 U 0.0228 0.00549 U 0.00554 U 0.008370.00514 U 0.00507 U 0.0191 0.00572 U 0.0486 0.00549 U 0.00554 U 0.03970.00514 U 0.00507 U 0.109 0.00858 0.0332 0.00549 U 0.00554 U 0.1070.00514 U 0.00507 U 0.0354 0.00572 U 0.0763 0.00549 U 0.00554 U 0.0661 P0.00514 U 0.00507 U 0.00562 U 0.00572 U 0.00558 U 0.00549 U 0.00554 U 0.097
0.0514 U 0.0507 U 0.226 0.0572 U 0.372 0.0549 U 0.0554 U 0.0598 U0.00514 U 0.00507 U 0.0248 0.00729 0.0483 0.00549 U 0.00554 U 0.158 P0.00514 U 0.00507 U 0.00562 U 0.00572 U 0.00869 0.00549 U 0.00554 U 0.00598 U0.00514 U 0.00507 U 0.00562 U 0.00572 U 0.00558 U 0.00549 U 0.00554 U 0.0339
0.0514 U 0.0506 U 0.0561 U 0.0572 U 0.0558 U 0.0548 U 0.0554 U 6.870.0514 U 0.0506 U 0.126 0.0572 U 0.0558 U 0.0548 U 0.0554 U 0.0597 U
\\WFD-fs1\projects\old_Wakefield_Data\projects\3652130009 - Textron Gorham Phase III Design\4.0 Project Deliverables\4.2 Work Plans\Table 1 - Summary of Detections - Soil to be Capped.xls, Detects Page 10 of 15

Table 1Summary of Detected Compounds in Soil - Phase III Area to be Capped
Former Gorham Manufacturing FacilityProvidence, Rhode Island
parameter.nameDioxins/Furans (mg/Kg)1,2,3,4,6,7,8-HpCDD1,2,3,4,6,7,8-HpCDF1,2,3,4,7,8,9-HpCDF1,2,3,4,7,8-HxCDD1,2,3,4,7,8-HxCDF1,2,3,6,7,8-HxCDD1,2,3,6,7,8-HxCDF1,2,3,7,8,9-HxCDD1,2,3,7,8,9-HxCDF1,2,3,7,8-PeCDD1,2,3,7,8-PeCDF2,3,4,6,7,8-HxCDF2,3,4,7,8-PeCDF2,3,7,8-TCDD2,3,7,8-TCDFOCDDOCDFTotal HpCDDTotal HpCDFTotal HxCDDTotal HxCDFTotal PeCDDTotal PeCDFTotal TCDDTotal TCDFTEQ MammalInorganics (mg/Kg)ArsenicBariumBerylliumCadmiumChromiumCopperLeadMercuryNickelSeleniumSilverZincTotal Cyanide
SS-SI013 6/8/2006 0-
0.5 ft
SS-SI014 6/8/2006 0-
0.5 ft
SS-SI015 6/8/2006 0-0.5 ft
SS-SI016 6/8/2006 0-0.5 ft
SS-SI017 6/8/2006 0-0.5 ft
SS-SI018 6/8/2006 0-
0.5 ft
SS-SI019 6/8/2006 0-
0.5 ft
SS-SI020 6/8/2006 0-
0.5 ft
0.0000011 J 8.5E-07 J 0.000015 4.9E-06 0.000015 0.000001 J 0.00000093 J 0.0000268.2E-07 U 8.1E-07 U 9.2E-06 4.5E-06 0.000011 0.00000081 U 0.00000081 U 0.0000138.2E-07 U 8.1E-07 U 1.8E-06 J 8.1E-07 U 0.000002 J 0.00000081 U 0.00000081 U 0.0000027 J8.2E-07 U 8.1E-07 U 8.4E-07 U 8.1E-07 U 8.3E-07 U 0.00000081 U 0.00000081 U 0.00000084 U8.2E-07 U 8.1E-07 U 0.000004 J 1.2E-06 J 4.6E-06 0.00000081 U 0.00000081 U 0.00000628.2E-07 U 8.1E-07 U 1.8E-06 J 9.7E-07 J 2.1E-06 J 0.00000081 U 0.00000081 U 0.0000033 J8.2E-07 U 8.1E-07 U 2.9E-06 J 8.1E-07 UE 3.4E-06 J 0.00000081 U 0.00000081 U 0.000004 J8.2E-07 U 8.1E-07 U 1.1E-06 J 8.1E-07 U 9.5E-07 J 0.00000081 U 0.00000081 U 0.0000018 J8.2E-07 U 8.1E-07 U 1.9E-06 J 8.1E-07 UE 2.1E-06 J 0.00000081 U 0.00000081 U 0.0000039 J8.2E-07 U 8.1E-07 U 8.4E-07 U 8.1E-07 U 8.3E-07 U 0.00000081 U 0.00000081 U 0.0000014 J8.2E-07 U 8.1E-07 U 8.4E-07 U 8.1E-07 UE 1.2E-06 J 0.00000081 U 0.00000081 U 0.00000084 UE8.2E-07 U 8.1E-07 U 2.4E-06 J 8.1E-07 UI 2.2E-06 J 0.00000081 U 0.00000081 U 0.0000031 J8.2E-07 U 8.1E-07 U 3.2E-06 J 6.6E-06 6.6E-06 0.00000081 U 0.00000081 U 0.00000481.6E-07 U 1.6E-07 U 1.7E-07 UA 2.2E-07 JA 2.2E-07 J 0.00000016 U 0.00000016 U 0.00000019 J1.6E-07 U 1.6E-07 U 8.5E-07 A 9E-07 A 7.3E-07 JA 0.00000018 J 0.00000016 U 0.00000075 JA
0.0000084 0.000007 J 0.00027 0.000057 0.00031 0.0000072 J 0.0000059 J 0.000420.0000016 U 0.0000016 U 0.000014 1.6E-06 UI 9.6E-06 0.0000016 U 0.0000016 U 0.0000180.0000021 J 8.5E-07 J 0.00003 0.00001 0.000031 0.000002 J 0.00000093 J 0.000055
8.2E-07 U 8.1E-07 U 0.000023 9.7E-06 0.000022 0.00000081 U 0.000001 J 0.0000318.2E-07 U 8.1E-07 U 0.00002 6.1E-06 0.000023 0.00000081 U 0.00000081 U 0.0000418.2E-07 U 8.1E-07 U 0.000072 0.000051 0.000047 0.00000081 U 0.00000081 U 0.00018.2E-07 U 8.1E-07 U 5.6E-06 8.1E-07 U 0.000012 0.00000081 U 0.00000081 U 0.0000198.2E-07 U 0.0000015 J 0.000064 0.00011 0.000039 0.0000011 J 0.00000081 U 0.0000651.6E-07 U 1.6E-07 U 2.4E-06 1.1E-06 4.6E-06 0.00000016 U 0.00000016 U 0.00000491.6E-07 U 3.5E-07 BJ 0.000029 0.000027 0.000022 0.00000018 BJ 0.00000016 U 0.000021
0.00000094 0.00000093 0.0000034 0.0000032 0.0000047 0.00000094 0.00000093 0.0000059
1.5 U 1.5 3 1.5 U 3.5 1.5 U 1.5 U 354.9 36.1 41.4 27.3 44.1 29.4 22.8 47.40.31 U 0.06 U 0.17 0.06 U 0.13 0.06 U 0.06 U 0.150.61 U 0.6 U 0.61 U 0.61 U 0.6 U 0.6 U 0.61 U 0.63 U10.8 9.8 11.3 9.3 12.1 11.8 11.4 13.926.3 22.8 37.9 26.3 60.4 28.1 23.7 50.3
8.5 9.3 54.4 10.2 99.4 6.8 6.1 U 67.70.034 U 0.032 U 0.571 0.035 U 0.789 0.034 U 0.032 U 0.539
11.1 9.3 10 9.1 11 10.4 9.3 11.56.1 U 6 U 6.1 U 6.1 U 6 U 6 U 6.1 U 6.3 U
0.61 U 0.6 U 12 0.61 U 13.4 0.6 U 0.61 U 10.829.4 27.3 67.3 24.2 97.1 26.2 23.6 82.3
\\WFD-fs1\projects\old_Wakefield_Data\projects\3652130009 - Textron Gorham Phase III Design\4.0 Project Deliverables\4.2 Work Plans\Table 1 - Summary of Detections - Soil to be Capped.xls, Detects Page 11 of 15

Table 1Summary of Detected Compounds in Soil - Phase III Area to be Capped
Former Gorham Manufacturing FacilityProvidence, Rhode Island
parameter.namePetroleum Hydrocarbons (mg/Kg)Total Petroleum Hydrocarbon
mg/Kg = milligram per kilogramU = not detected, value is the reporting limitJ = value is estimatedP = Percent difference between primary and confirmation results exceeds 40%A = Detection limit based on signal-to-noise meansurementB = Less than 10 times higher than method blank levelE = PCDE InterferenceI = Interference
SS-SI013 6/8/2006 0-
0.5 ft
SS-SI014 6/8/2006 0-
0.5 ft
SS-SI015 6/8/2006 0-0.5 ft
SS-SI016 6/8/2006 0-0.5 ft
SS-SI017 6/8/2006 0-0.5 ft
SS-SI018 6/8/2006 0-
0.5 ft
SS-SI019 6/8/2006 0-
0.5 ft
SS-SI020 6/8/2006 0-
0.5 ft
\\WFD-fs1\projects\old_Wakefield_Data\projects\3652130009 - Textron Gorham Phase III Design\4.0 Project Deliverables\4.2 Work Plans\Table 1 - Summary of Detections - Soil to be Capped.xls, Detects Page 12 of 15

Table 1Summary of Detected Compounds in Soil - Phase III Area to be Capped
Former Gorham Manufacturing FacilityProvidence, Rhode Island
parameter.nameSemivolatile Organics (mg/Kg)AcenaphthyleneAnthraceneBenzo(a)anthraceneBenzo(a)pyreneBenzo(b)fluorantheneBenzo(g,h,i)peryleneBenzo(k)fluorantheneChryseneDibenzo(a,h)anthraceneFluorantheneFluoreneIndeno(1,2,3-cd)pyreneNaphthalenePhenanthrenePyrenePolyaromatic Hydrocarbons (mg/Kg)AnthraceneBenzo(a)anthraceneBenzo(a)pyreneBenzo(b)fluorantheneBenzo(g,h,i)peryleneBenzo(k)fluorantheneChryseneDibenzo(a,h)anthraceneFluorantheneIndeno(1,2,3-cd)pyrenePhenanthrenePyrenePesticides/PCBs (mg/Kg)4,4'-DDD4,4'-DDE4,4'-DDTalpha-Chlordanebeta-BHCChlordanegamma-ChlordaneHeptachlor epoxideHexachlorobenzeneAroclor-1242Aroclor-1254
SS-SI021 6/8/2006 0-
0.5 ft
SS-SI022 6/8/2006 0-
0.5 ft
SS-SI023 6/7/2006 0-
0.5 ft
SS-SI024 6/7/2006 0-
0.5 ft
SS-SI101 6/8/2006 0-0.5 ft
SS-SI202 6/7/2006 0-0.5 ft
0.643 U 0.544 U 0.644 U 2.97 0.028 U 0.0295 U0.643 U 0.544 U 0.644 U 2.34 0.028 U 0.05720.643 U 1.33 0.644 U 9.67 0.108 0.2030.643 U 2.01 0.644 U 9.54 0.137 0.2030.643 U 2.22 0.644 U 10.9 0.174 0.240.643 U 1.33 0.644 U 4.11 0.0342 0.05780.643 U 1.36 0.644 U 9.81 0.128 0.1830.643 U 1.39 0.644 U 11.6 0.141 0.2290.643 U 0.544 U 0.644 U 0.68 U 0.028 U 0.0330.643 U 2.01 1.3 17.7 0.429 0.6460.643 U 0.544 U 0.644 U 1.07 0.028 U 0.0295 U0.643 U 1.29 0.644 U 4.54 0.0392 0.06360.643 U 0.544 U 0.644 U 1.08 0.028 U 0.0295 U0.643 U 0.544 U 0.868 11.1 0.123 0.3
1.45 1.54 1.25 21.2 0.267 0.45
0.0063 U 0.00523 U 0.0235 0.0164 0.0061 U 0.00578 U0.019 0.00523 U 0.0458 0.0297 0.0061 U 0.00578 U0.143 0.0105 0.0609 0.0617 0.0061 U 0.0085
0.0063 U 0.00523 U 0.258 0.0411 0.0061 U 0.00578 U0.0063 U 0.00523 U 0.00611 U 0.00669 U 0.0061 U 0.00578 U
0.063 U 0.0523 U 2.09 0.323 0.061 U 0.0578 U0.0063 U 0.00737 0.18 0.0363 0.0061 U 0.00578 U0.0063 U 0.00523 U 0.124 0.00669 U 0.0061 U 0.00578 U0.0063 U 0.00523 U 0.00611 U 0.00669 U 0.0061 U 0.00578 U0.0629 U 0.0523 U 0.061 U 0.0669 U 0.0609 U 0.0577 U0.0629 U 0.0523 U 0.061 U 0.0669 U 0.0609 U 0.0577 U
\\WFD-fs1\projects\old_Wakefield_Data\projects\3652130009 - Textron Gorham Phase III Design\4.0 Project Deliverables\4.2 Work Plans\Table 1 - Summary of Detections - Soil to be Capped.xls, Detects Page 13 of 15

Table 1Summary of Detected Compounds in Soil - Phase III Area to be Capped
Former Gorham Manufacturing FacilityProvidence, Rhode Island
parameter.nameDioxins/Furans (mg/Kg)1,2,3,4,6,7,8-HpCDD1,2,3,4,6,7,8-HpCDF1,2,3,4,7,8,9-HpCDF1,2,3,4,7,8-HxCDD1,2,3,4,7,8-HxCDF1,2,3,6,7,8-HxCDD1,2,3,6,7,8-HxCDF1,2,3,7,8,9-HxCDD1,2,3,7,8,9-HxCDF1,2,3,7,8-PeCDD1,2,3,7,8-PeCDF2,3,4,6,7,8-HxCDF2,3,4,7,8-PeCDF2,3,7,8-TCDD2,3,7,8-TCDFOCDDOCDFTotal HpCDDTotal HpCDFTotal HxCDDTotal HxCDFTotal PeCDDTotal PeCDFTotal TCDDTotal TCDFTEQ MammalInorganics (mg/Kg)ArsenicBariumBerylliumCadmiumChromiumCopperLeadMercuryNickelSeleniumSilverZincTotal Cyanide
SS-SI021 6/8/2006 0-
0.5 ft
SS-SI022 6/8/2006 0-
0.5 ft
SS-SI023 6/7/2006 0-
0.5 ft
SS-SI024 6/7/2006 0-
0.5 ft
SS-SI101 6/8/2006 0-0.5 ft
SS-SI202 6/7/2006 0-0.5 ft
0.000014 0.0000028 J 0.0000055 0.000031 U 3.6E-06 J 0.0000070.0000077 0.0000018 J 0.0000094 0.000031 U 3.6E-06 J 4.8E-06
0.00000099 U 0.00000083 U 0.00000097 U 0.000031 U 8.9E-07 U 8.9E-07 U0.00000099 U 0.00000083 U 0.00000097 U 0.000031 U 8.9E-07 U 8.9E-07 U
0.0000018 J 0.00000083 U 0.0000011 J 0.000031 U 8.9E-07 U 1.2E-06 J0.00000099 U 0.00000083 U 0.00000097 U 0.000031 U 8.9E-07 U 8.9E-07 U
0.0000023 J 0.00000083 U 0.00000097 U 0.000031 U 8.9E-07 UE 8.9E-07 U0.00000099 U 0.00000083 U 0.00000097 U 0.000031 U 8.9E-07 U 8.9E-07 U0.00000099 U 0.00000083 U 0.00000097 U 0.000031 U 8.9E-07 U 8.9E-07 U0.00000099 U 0.00000083 U 0.00000097 U 0.000031 U 8.9E-07 U 8.9E-07 U
0.0000017 J 0.00000083 U 0.00000097 U 0.000031 U 8.9E-07 U 8.9E-07 U0.000003 J 0.00000083 U 0.0000011 J 0.000031 U 0.000001 J 1.5E-06 J0.000005 0.0000026 J 0.0000014 J 0.000031 U 1.7E-06 J 2.2E-06 J
0.00000021 J 0.00000017 U 0.00000019 U 0.0000063 U 1.8E-07 U 1.8E-07 U0.0000016 0.00000026 J 0.00000081 J 0.0000063 U 1.1E-06 1.3E-06
0.0001 0.000037 0.000058 0.00021 0.000025 0.000040.0000077 J 0.0000017 UI 0.0000069 J 0.000063 U 3.1E-06 J 3.9E-06 J
0.000028 0.0000063 0.000011 0.000031 U 7.7E-06 0.0000150.000014 0.0000043 0.000014 0.000031 U 5.1E-06 0.0000070.000011 0.0000029 J 0.0000027 J 0.000031 U 1.4E-06 J 4.8E-060.000034 0.0000072 0.00001 0.000031 U 8.2E-06 0.000014
0.0000038 J 0.00000083 U 0.00000097 U 0.000031 U 8.9E-07 U 1.4E-06 J0.000053 0.000026 0.000011 0.000036 0.000017 0.000023
0.0000079 0.00000031 J 0.0000022 0.0000063 U 0.000002 2.7E-060.000039 0.0000083 0.000012 0.000014 0.000019 0.000017
0.0000036 0.0000017 0.0000017 0.000035 0.0000016 0.0000020
1.8 U 1.6 U 37.3 4.515.6 28.4 31.3 75.80.14 0.06 U 0.13 0.210.71 U 0.62 U 1.15 0.74 U
5 13.5 21 11.415.7 27.5 36 153
43 14.5 113 2310.07 0.098 0.284 0.228
5 10.4 6.7 13.87.1 U 6.2 U 7.3 U 7.4 U
2.81 1.98 7.94 28.749.1 31.8 32.6 125
\\WFD-fs1\projects\old_Wakefield_Data\projects\3652130009 - Textron Gorham Phase III Design\4.0 Project Deliverables\4.2 Work Plans\Table 1 - Summary of Detections - Soil to be Capped.xls, Detects Page 14 of 15

Table 1Summary of Detected Compounds in Soil - Phase III Area to be Capped
Former Gorham Manufacturing FacilityProvidence, Rhode Island
parameter.namePetroleum Hydrocarbons (mg/Kg)Total Petroleum Hydrocarbon
mg/Kg = milligram per kilogramU = not detected, value is the reporting limitJ = value is estimatedP = Percent difference between primary and confirmation results exceeds 40%A = Detection limit based on signal-to-noise meansurementB = Less than 10 times higher than method blank levelE = PCDE InterferenceI = Interference
SS-SI021 6/8/2006 0-
0.5 ft
SS-SI022 6/8/2006 0-
0.5 ft
SS-SI023 6/7/2006 0-
0.5 ft
SS-SI024 6/7/2006 0-
0.5 ft
SS-SI101 6/8/2006 0-0.5 ft
SS-SI202 6/7/2006 0-0.5 ft
Prepared by / Date: KJC 04/22/13Checked by / Date: ARM 05/29/13
\\WFD-fs1\projects\old_Wakefield_Data\projects\3652130009 - Textron Gorham Phase III Design\4.0 Project Deliverables\4.2 Work Plans\Table 1 - Summary of Detections - Soil to be Capped.xls, Detects Page 15 of 15

TABLE 2
Soil Sampling and Analysis Methodology

AMEC Environment & Infrastructure, Inc. 107 Audubon Road, Suite 301 Wakefield, MA 01880 Tel +(781) 245-6606 Fax +(781) 246-5060 www.amec.com
Table 2 Soil Sample Investigation Methodology
Soil Sample
Line
Collect Samples Analytical Methods / Holding Times
Analyze Samples Hold Samples for Analysis
Determine Action
Line A Collect soil samples for PAH, metals (arsenic and lead only), and dioxins/furans (surface soil only) from six locations along Line A from two depth intervals (0-1 foot and 1-2 feet bgs) at each location shown on Figure 2. Two quality control samples (a field duplicate and an MS/MSD) will also be collected at one of the Line A sample locations. Total of 16 samples.
PAHs-EPA 8270C/14
days
Metals-EPA 6010B/180
days
Dioxin-EPA 8290/30 days (or 1 year if
frozen)
Analyze all Line A soil samples for PAHs and metals (arsenic and lead) under standard turnaround time of 5 days. Since there is no corresponding sample location along Line B for sample locations Line A4, A5, and A6, analyze soil samples from those locations (Line A4, A5, and A6) locations for dioxin/furans (surface soil sample only).
Hold Line A dioxins/ furans samples (except samples from Line A4, A5, and A6) pending Line A PAHs and metals (arsenic and lead) results.
If sample from Line A1, A2, or A3 PAHs and metals (arsenic and lead) meet RDEC, analyze the Line A surface soil sample from that location(s) for and dioxins/furans.
If sample from Line A1, A2, or A3 PAHs or metals (arsenic and lead) results exceed RDEC, do not analyze the surface soil sample from that location(s) for dioxins/furans. Instead, have the lab analyze corresponding Line B sample for all analyses (PAHs, metals [arsenic and lead], and dioxins/furans (surface soil only). For example: If results for sample location Line A1 exceed RDEC for PAHs and/or metals, analyze the corresponding samples from location Line B1 for all three analyses: PAHs, metals (arsenic and lead only), and dioxins/furans within holding times. If results for location Line A2 exceed RDEC for lead but not for PAHs, analyze the corresponding samples from location Line B2 for all three analyses: PAHs, metals (arsenic and lead), and dioxins/furans (surface soil only) within holding times.
Line B Collect soil samples for PAHs, metals (arsenic and lead only), and dioxins/furans (surface soil sample only) from up to two locations along Line B from two depth intervals (0-1 foot and 1-2 feet bgs) at each location shown on Figure 2. Total of 4 samples.
-
Hold all Line B PAHs, metals (arsenic and lead), and dioxin/furans samples pending Line A PAHs and metals (arsenic and lead) results.
Only analyze a Line B sample, if the corresponding Line A sample exceeds RDEC for any analysis as described above.