Jumping on the Data Analytics Bandwagon - cdn.ymaws.com · • Recognize the differences between...
23
Jumping on the Data Analytics Bandwagon TACCBO 2018 Annual Meeting and Conference
Transcript of Jumping on the Data Analytics Bandwagon - cdn.ymaws.com · • Recognize the differences between...

Jumping on the Data Analytics Bandwagon
TACCBO 2018 Annual Meeting and Conference

2
Presenting Today
Elisa Gilbertson, CPAManager, Weaver Analytics
More than 10 years of experience Practice emphasis in data analytics, auditing and consulting for a
variety of industries including nonprofit organizations and higher education.
Reema Parappilly, CISAPartner, IT Advisory Services
More than 13 years of experience Practice emphasis in IT audits, data analytics, Sarbanes-Oxley
Compliance, and System and Organization Controls (SOC) reporting.

Objectives
• Recognize the differences between data and information
• Understand the process of analysis used to turn data into information
• Provide examples of analytics that may be useful for you

First, Some Perspective:The Data Analytics Bandwagon

What is Data Analysis?
The process of drawing inferences fromlarge sets of data to help identify trends,preferences, hidden patterns, and more.

Data vs Information
Data:• Raw, unorganized facts
that need processing
• No interpretation or analysis
• Inefficient and ineffective for communicating
• Cannot be wrong (but isn’t always right)
Information:• Data that is
processed, organized, structured, and/or presented in a given context to make it useful
• Meaningful to the user
• Can be wrong

Data: Journal Entries (as part of a
general ledger detail)
Vendor Lists (with no comparative figures)
Employee Master Files
Student AR Subledger Detail
Information: Subset of Journal Entries posted
on a holiday
Period-by-period comparison of Vendor purchases
Period-by-period comparison of Employee gross pay
Student AR Aging
7
Data vs Information

Garbage In – Garbage Out
• Computers operate by logical processes– Will process unintended or nonsensical inputs– Result in undesired and nonsensical outputs
• Fields not used as intended– Non-unique or non-required Purchase Order numbers– Transaction Dates vs Posting Dates
• Processes not occurring as intended– Attendance not taken in every class– Manual adjustments used instead of subledger entry

Data Analytics Matrix

Data to Information: Phases of Analysis

11
Phases of AnalysisIdentify a
problem or question
Create a hypothesis
Gather the data
Develop and run a
model
Prepare the final product
Adjust as needed

Data to Information
1. Identify a problem or question– Be as specific as reasonable– Make a problem “hierarchy” if needed
– Example: Why was there such a large return of Federal Student Financial Aid (SFA) funds during the Spring-18 semester?
2. Create a hypothesis– Be as specific as possible– Utilize knowledge of others to provide direction
– Example: There was an increase in SFA recipient withdrawals during SP-18.

Data to Information
3. Gather the data– Start broad, but stay on target– Check completeness and accuracy– Verify data validity
– Example: Obtain multiple semester’s worth of student enrollment data (including withdrawal and financial aid information)**
4. Create a “draft” model & run analysis– Identify analysis parameters – Review results against hypothesis – do they agree?
– Example: SP-18 student withdrawals went DOWN

Data to Information
5. Make adjustments and repeat (as necessary) – Hypothesis – was the original disproved?– Data – did it contain garbage?– Analysis – did it return useless information?
– Example: New hypothesis that SP-18 withdrawals occurred EARLIER, resulting in greater R2T4 returns.
6. Prepare product for presentation – Present analysis in clear, succinct manner
– Example: Comparative bar chart showing R2T4 days

Data Analysis Examples

Analysis Tools
• Microsoft Excel• Microsoft Access• ACL• IDEA
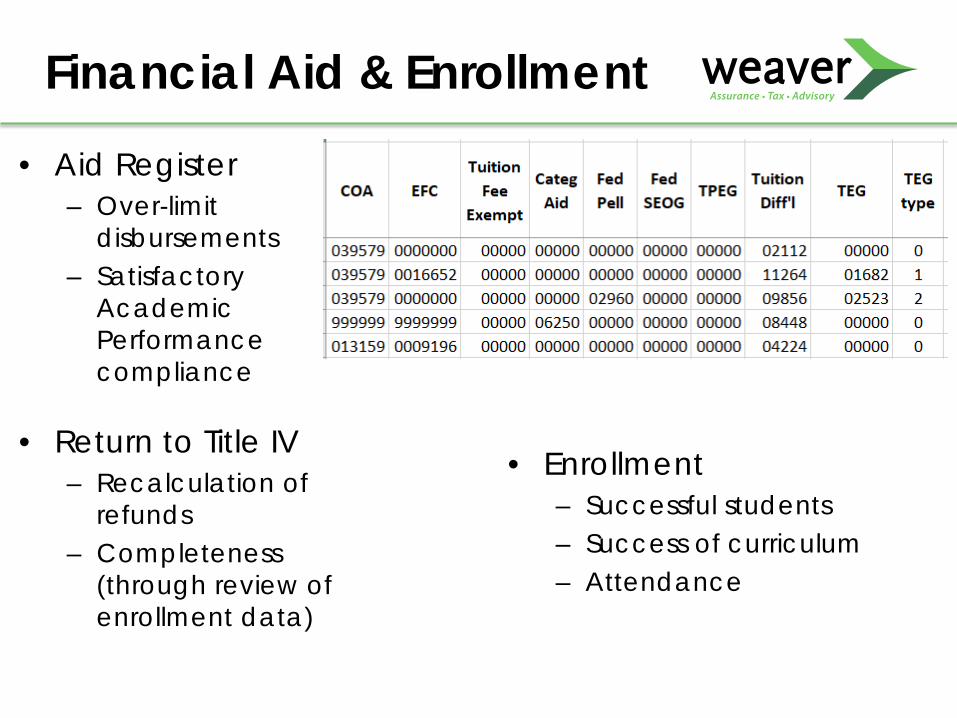
• Aid Register– Over-limit
disbursements– Satisfactory
Academic Performance compliance
• Return to Title IV– Recalculation of
refunds– Completeness
(through review of enrollment data)
• Enrollment– Successful students– Success of curriculum– Attendance
Financial Aid & Enrollment

• Check Register– Check number gaps– Check number dups– Duplicate payments– Unapproved vendors– Employee payments– Threshold avoidance
• Vendor Master File– Lacking proper fields– Vendor duplicates– Employee matches– Address irregularities
Accounts Payable
VendorID VendorName CheckAmount #Of Checks VendorAddr1 VendorCity VendorState1 Company A 7,896.29 3 PO BOX 8 Anywhere TX2 Company A 74,199.82 16 PO BOX 1 Anywhere TX
56 Company B 756.00 4 PO BOX 3 Anywhere TX77 Company B 186.00 1 PO BOX 3 Anywhere TX
9879 Company C 57.00 1 1100 Main Here TX23 Company C 675.00 2 PO BOX 3 Here TX
345 Company D 5,372.00 3 PO BOX 141 Here TX456 Company D 11,743.00 1 PO BOX 149 Here TX234 Company E 1,500.00 1 PO BOX 32 Here TX
8421 Company E 52,185.14 9 101 15 Here TX215 Company F 574.80 2 PO BOX 30 Anywhere TX
8753 Company F 30,314.65 19 PO BOX 26 Elsewhere WA
Check Register GapsGap_Start_Check
Gap_End_Check
Number_Items _Missing
178140 178142 1178142 178144 1178260 178262 1178386 178388 1178422 178424 1178466 178468 1178472 178474 1178506 178523 16
1782523 178661 137
Multiple Vendor Records for 1 Vendor

• Invoice Register– Duplicate payments– Duplicate billing– Threshold avoidance
Accounts Payable
– Split-transactions– Invoice number irregularities– Comparative analysis
Potential duplicate billings – same amounts, same dates, different invoice numbers

• Payroll Register– Payments after termination– Employees not in master file– Comparative analysis– Overtime appropriateness– Vacation/Benefit analysis
Payroll
• Employee Master File– Lacking proper fields– Employee duplicates– Address irregularities
Employees with duplicate addresses

• P-Card Charges– Duplicate payments– Out-of-policy purchases– Credits/returns
P-Cards
– Split-transactions– Off-time purchases– MCC analysis– Benford Analysis

Data analysis can be a daunting and stressful process;
however, with good data and focused analysis,the process can
add value to your operations.

23
Let’s Connect
@weavercpas
facebook.com/weavercpas
linkedin.com/company/weavercpas
youtube.com/weavercpas
Insights blog – weaver.com
Questions?
Elisa Gilbertson, CPAManager, Weaver Analytics
Reema Parappilly, CISAPartner, IT Advisory Services