July 2015 - Market Snapshot - General Overview
47
MLSListings Inc Confidential Copyright 2015 1 Market Snapshot – Jul 2015 vs. Jul 2014 J ul 2015 J ul 2014 % C hange J ul 2015 J ul 2014 % C hange J ul 2015 J ul 2014 % C hange J ul 2015 J ul 2014 % C hange J ul 2015 J ul 2014 % C hange J ul 2015 J ul 2014 % C hange J ul 2015 J ul 2014 % C hange J ul 2015 J ul 2014 % Change Monterey 1128 982 15% 281 219 28% $485,000 $450,000 8% $741,183 $723,007 3% $209,013,551 $158,338,743 32% 58 52 12% 336 311 8% 98 106 -8% S an B enito 161 172 -6% 57 46 24% $450,000 $417,475 8% $524,063 $446,641 17% $29,871,588 $20,545,500 45% 69 67 3% 71 76 -7% 99 104 -5% S an Mateo 842 711 18% 441 465 -5% $1,300,000 $1,138,000 14% $1,653,193 $1,370,918 21% $729,058,010 $634,735,294 15% 21 26 -19% 486 471 3% 110 100 10% S anta C lara 2447 1870 31% 1099 1012 9% $965,000 $865,000 12% $1,234,265 $1,126,036 10% $1,357,691,180 $1,138,422,396 19% 23 23 0% 1393 1288 8% 105 99 6% S anta C ruz 687 654 5% 227 191 19% $750,000 $725,000 3% $829,653 $816,501 2% $188,331,205 $155,951,749 21% 45 51 -12% 266 274 -3% 99 99 0% J ul 2015 J ul 2014 % C hange J ul 2015 J ul 2014 % C hange J ul 2015 J ul 2014 % C hange J ul 2015 J ul 2014 % C hange J ul 2015 J ul 2014 % C hange J ul 2015 J ul 2014 % C hange J ul 2015 J ul 2014 % C hange J ul 2015 J ul 2014 % Change Monterey 89 103 -14% 43 22 95% $374,000 $432,000 -13% $541,282 $455,599 19% $23,275,137 $10,023,199 132% 44 54 -19% 25 26 -4% 99 105 -6% S an B enito 7 9 -22% 2 2 0% $314,000 $299,975 5% $314,000 $299,975 5% $628,000 $599,950 5% 3 23 -87% 9 7 29% 103 104 -1% S an Mateo 171 196 -13% 122 149 -18% $708,000 $650,000 9% $756,692 $684,107 11% $91,559,682 $101,932,036 -10% 18 27 -33% 130 161 -19% 106 100 6% S anta C lara 672 649 4% 434 418 4% $635,000 $530,000 20% $697,064 $586,212 19% $302,525,730 $245,036,761 23% 18 23 -22% 499 557 -10% 107 100 7% S anta C ruz 126 152 -17% 62 53 17% $457,539 $419,000 9% $468,577 $469,116 0% $29,051,777 $24,863,150 17% 38 62 -39% 61 73 -16% 101 97 4% % to List Price Received Condo/Tow nhouse Y earoverY ear-July 2015 vs.July 2014 % to List Price Received Single Fam ily Y ear overY ear-July 2015 vs.July 2014 New Listings Total Dollars Days on Market New Listings County Inventory * Closed Sales Median Price Average Price Total Dollars Days on Market County Inventory Closed Sales Median Price Average Price
-
Upload
mlslistings-inc -
Category
Real Estate
-
view
95 -
download
1
Transcript of July 2015 - Market Snapshot - General Overview

MLSListings Inc Confidential Copyright 2015 1
Market Snapshot – Jul 2015 vs. Jul 2014
Jul 2015
Jul 2014
% Change
Jul 2015
Jul 2014
% Change
Jul 2015
Jul 2014
% Change
Jul 2015
Jul 2014
% Change
Jul 2015
Jul 2014
% Change
Jul 2015
Jul 2014
% Change
Jul 2015
Jul 2014
% Change
Jul 2015
Jul 2014
% Change
Monterey 1128 982 15% 281 219 28% $485,000 $450,000 8% $741,183 $723,007 3% $209,013,551 $158,338,743 32% 58 52 12% 336 311 8% 98 106 -8%
San Benito 161 172 -6% 57 46 24% $450,000 $417,475 8% $524,063 $446,641 17% $29,871,588 $20,545,500 45% 69 67 3% 71 76 -7% 99 104 -5%
San Mateo 842 711 18% 441 465 -5% $1,300,000 $1,138,000 14% $1,653,193 $1,370,918 21% $729,058,010 $634,735,294 15% 21 26 -19% 486 471 3% 110 100 10%
Santa Clara 2447 1870 31% 1099 1012 9% $965,000 $865,000 12% $1,234,265 $1,126,036 10% $1,357,691,180 $1,138,422,396 19% 23 23 0% 1393 1288 8% 105 99 6%
Santa Cruz 687 654 5% 227 191 19% $750,000 $725,000 3% $829,653 $816,501 2% $188,331,205 $155,951,749 21% 45 51 -12% 266 274 -3% 99 99 0%
Jul 2015
Jul 2014
% Change
Jul 2015
Jul 2014
% Change
Jul 2015
Jul 2014
% Change
Jul 2015
Jul 2014
% Change
Jul 2015
Jul 2014
% Change
Jul 2015
Jul 2014
% Change
Jul 2015
Jul 2014
% Change
Jul 2015
Jul 2014
% Change
Monterey 89 103 -14% 43 22 95% $374,000 $432,000 -13% $541,282 $455,599 19% $23,275,137 $10,023,199 132% 44 54 -19% 25 26 -4% 99 105 -6%
San Benito 7 9 -22% 2 2 0% $314,000 $299,975 5% $314,000 $299,975 5% $628,000 $599,950 5% 3 23 -87% 9 7 29% 103 104 -1%
San Mateo 171 196 -13% 122 149 -18% $708,000 $650,000 9% $756,692 $684,107 11% $91,559,682 $101,932,036 -10% 18 27 -33% 130 161 -19% 106 100 6%
Santa Clara 672 649 4% 434 418 4% $635,000 $530,000 20% $697,064 $586,212 19% $302,525,730 $245,036,761 23% 18 23 -22% 499 557 -10% 107 100 7%
Santa Cruz 126 152 -17% 62 53 17% $457,539 $419,000 9% $468,577 $469,116 0% $29,051,777 $24,863,150 17% 38 62 -39% 61 73 -16% 101 97 4%
% to List Price Received
Condo/Townhouse Year over Year - July 2015 vs. July 2014
% to List Price Received
Single Family Year over Year - July 2015 vs. July 2014
New Listings
Total Dollars Days on Market New Listings
County
Inventory * Closed Sales Median Price Average Price Total Dollars Days on Market
County Inventory Closed Sales Median Price Average Price

MLSListings Inc Confidential Copyright 2015 2
Market Snapshot – Jul 2015 vs. Jun 2015
Jun 2015
Jul 2015
% Change
Jun 2015
Jul 2015
% Change
Jun 2015
Jul 2015
% Change
Jun 2015
Jul 2015
% Change
Jun 2015
Jul 2015
% Change
Jun 2015
Jul 2015
% Change
Jun 2015
Jul 2015
% Change
Jun 2015
Jul 2015
% Change
Monterey 1156 1128 -2% 245 281 13% $499,000 $485,000 -3% $708,454 $741,183 4% $173,571,191 $209,013,551 17% 67 58 -16% 359 336 -7% 98 98 0%
San Benito 157 161 2% 52 57 9% $482,000 $450,000 -7% $509,863 $524,063 3% $26,512,879 $29,871,588 11% 48 69 30% 53 71 25% 99 99 0%
San Mateo 834 842 1% 420 441 5% $1,300,000 $1,300,000 0% $1,670,457 $1,653,193 -1% $701,591,779 $729,058,010 4% 21 21 0% 486 486 0% 110 110 0%
Santa Clara 2395 2447 2% 1109 1099 -1% $1,000,000 $965,000 -4% $1,318,461 $1,234,265 -7% $1,462,173,123 $1,357,691,180 -8% 22 23 4% 1321 1393 5% 107 105 -2%
Santa Cruz 691 687 -1% 219 227 4% $730,000 $750,000 3% $812,461 $829,653 2% $177,928,951 $188,331,205 6% 38 45 16% 261 266 2% 101 99 -2%
Jun 2015
Jul 2015
% Change
Jun 2015
Jul 2015
% Change
Jun 2015
Jul 2015
% Change
Jun 2015
Jul 2015
% Change
Jun 2015
Jul 2015
% Change
Jun 2015
Jul 2015
% Change
Jun 2015
Jul 2015
% Change
Jun 2015
Jul 2015
% Change
Monterey 99 89 -11% 30 43 30% $499,000 $374,000 -33% $737,015 $541,282 -36% $22,110,450 $23,275,137 5% 60 44 -36% 48 25 -92% 97.3 99 2%
San Benito 3 7 57% 2 2 0% $284,500 $314,000 9% $284,500 $314,000 9% $569,000 $628,000 9% 8 3 -167% 4 9 56% 99.1 103 4%
San Mateo 169 171 1% 137 122 -12% $697,500 $708,000 1% $726,408 $756,692 4% $101,697,176 $91,559,682 -11% 15 18 17% 132 130 -2% 107.9 106 -2%
Santa Clara 682 672 -1% 455 434 -5% $650,000 $635,000 -2% $715,372 $697,064 -3% $325,404,155 $302,525,730 -8% 14 18 22% 511 499 -2% 107.6 107 -1%
Santa Cruz 138 126 -10% 48 62 23% $446,000 $457,539 3% $475,416 $468,577 -1% $22,819,972 $29,051,777 21% 27 38 29% 65 61 -7% 100.5 101 0%
% to List Price Received
Condo/Townhouse - Current Month vs. Prior Month - July 2015 vs. June 2015
County
Inventory Closed Sales Median Price Average Price Total Dollars Days on Market New Listings
Total Dollars Days on Market New Listings
Single Family - Current Month vs. Prior Month - July 2015 vs. June 2015
County
Inventory Closed Sales Median Price Average Price % to List Price Received

MLSListings Inc Confidential Copyright 2015 33
Single Family + Condo/Townhouse Inventory, Closed Sales, New Listings - Home CountiesJan ’03 – Jul ’15

MLSListings Inc Confidential Copyright 2015 44
Single Family + Condo/Townhouse Inventory - Home CountiesJan ’03 – Jul ’15

MLSListings Inc Confidential Copyright 2015 55
Single Family + Condo/Townhouse Inventory - Home CountiesJan ’05 – Jul ’15
2005 2006 2007 2008 2009 2010 2011 2012 2013 2014 2015
Jan 4223 7295 8588 12447 12693 8558 10330 8140 3179 3578 4175
Feb 4839 8023 9184 13528 13079 9650 10803 8231 4296 3924 3932
Mar 5502 8827 10357 14355 13240 10910 11127 7991 4286 4322 5515
Apr 6434 9722 11812 15513 12806 11773 11506 7630 4765 4776 5944
May 7020 10819 12923 15787 11749 11903 11730 7712 5222 3520 6069
Jun 7189 11493 13287 15802 11104 12691 11740 7570 5616 5322 5233
Jul 7878 12317 13910 15948 10763 13016 11372 7306 5950 4389 6330
Aug 8030 12122 14275 15356 10044 13072 11201 7116 5850 5378
Sep 8798 12239 13943 15192 9823 13294 10944 6523 5806 5290
Oct 8946 11490 14020 15070 9295 12440 10241 6173 5384 4863
Nov 8252 9968 13308 13849 8724 11500 9482 5292 4592 3925
Dec 6372 7874 11420 12221 7778 9825 7790 3901 3198 3174
Jul '05 7878
Jul '06 12317
Jul '07 13910
Jul '08 15948
Jul '09 10763
Jul '10 13016
Jul '11 11372
Jul '12 7306
Jul '13 5950
Jul '14 4389
Jul '15 6330
Home Counties Inventory
-19.6%
-48.6%
-54.5%
-60.3%
-41.2%
-51.4%
-44.3%
-13.4%
6.4%
44.2%
Home Counties - Single Family + Condo/Townhouse Inventory
Variance to prior Years
02000400060008000
10000120001400016000
Jul'05
Jul'06
Jul'07
Jul'08
Jul'09
Jul'10
Jul'11
Jul'12
Jul'13
Jul'14
Jul'15
15948
6330

MLSListings Inc Confidential Copyright 2015 66
Single Family Inventory – San Mateo, Santa Clara CountiesJan ’04 – Jul ’15
MLSListings Inc Confidential Copyright 2015 77
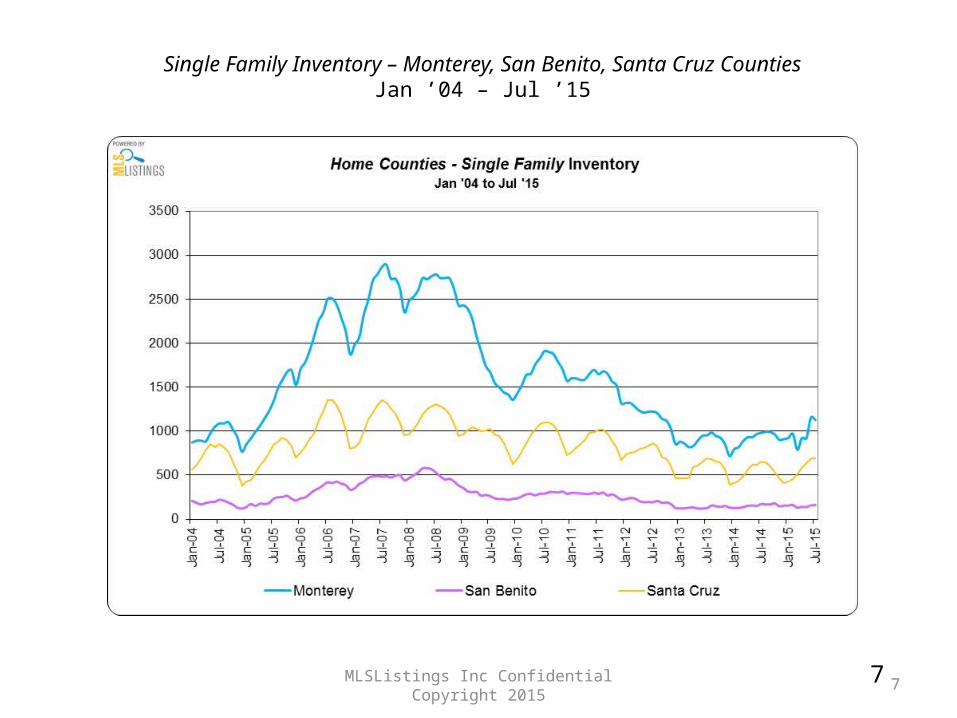
Single Family Inventory – Monterey, San Benito, Santa Cruz CountiesJan ’04 – Jul ’15

MLSListings Inc Confidential Copyright 2015 88
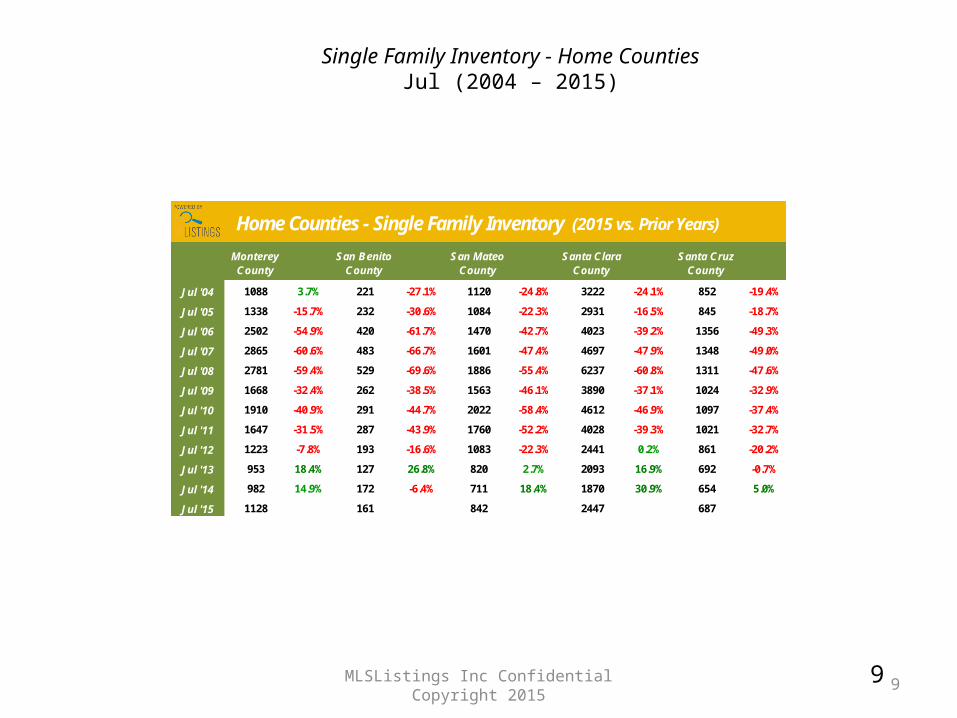
Single Family Inventory - Home CountiesJul (2004 – 2015)
MLSListings Inc Confidential Copyright 2015 99
Single Family Inventory - Home CountiesJul (2004 – 2015)
Monterey County
San Benito
County
San Mateo County
Santa Clara
County
Santa Cruz County
Jul '04 1088 3.7% 221 -27.1% 1120 -24.8% 3222 -24.1% 852 -19.4%
Jul '05 1338 -15.7% 232 -30.6% 1084 -22.3% 2931 -16.5% 845 -18.7%
Jul '06 2502 -54.9% 420 -61.7% 1470 -42.7% 4023 -39.2% 1356 -49.3%
Jul '07 2865 -60.6% 483 -66.7% 1601 -47.4% 4697 -47.9% 1348 -49.0%
Jul '08 2781 -59.4% 529 -69.6% 1886 -55.4% 6237 -60.8% 1311 -47.6%
Jul '09 1668 -32.4% 262 -38.5% 1563 -46.1% 3890 -37.1% 1024 -32.9%
Jul '10 1910 -40.9% 291 -44.7% 2022 -58.4% 4612 -46.9% 1097 -37.4%
Jul '11 1647 -31.5% 287 -43.9% 1760 -52.2% 4028 -39.3% 1021 -32.7%
Jul '12 1223 -7.8% 193 -16.6% 1083 -22.3% 2441 0.2% 861 -20.2%
Jul '13 953 18.4% 127 26.8% 820 2.7% 2093 16.9% 692 -0.7%
Jul '14 982 14.9% 172 -6.4% 711 18.4% 1870 30.9% 654 5.0%
Jul '15 1128 161 842 2447 687
Home Counties - Single Family Inventory (2015 vs. Prior Years)

MLSListings Inc Confidential Copyright 2015 1010
Single Family Months of Inventory – San Mateo, Santa Clara, Santa CruzMar ’03 – Jul ’15 (Rolling Three Month Average)

MLSListings Inc Confidential Copyright 2015 1111
Single Family Months of Inventory – Monterey and San Benito CountiesMar ’03 – Jul ’15 (Rolling Three Month Average)

MLSListings Inc Confidential Copyright 2015 1212
Single Family Market Outlook – Home CountiesJun ’14 vs. Jul ’15

MLSListings Inc Confidential Copyright 2015 1313
Single Family + Condo/Townhouse Closed Sales – Home CountiesJan ’03 – Jul ’15

MLSListings Inc Confidential Copyright 2015 1414
Single Family + Condo/Townhouse Closed Sales - Home CountiesJan ’05 – Jul ’15
2005 2006 2007 2008 2009 2010 2011 2012 2013 2014 2015
Jan 2078 1638 1539 877 1390 1529 1574 1552 1460 1330 1182
Feb 2048 1762 1658 1063 1497 1537 1648 1785 1597 1371 921
Mar 3210 2775 2248 1388 1916 2197 2399 2520 2289 1882 2068
Apr 3407 2595 2101 1664 2158 2245 2329 2517 2468 2402 2527
May 3376 2706 2270 1953 2355 2805 2369 2885 2780 2484 2407
Jun 3836 2847 2353 2123 2808 2592 2633 2639 2543 2456 2045
Jul 3396 2446 2136 2230 2788 2299 2238 2457 2643 1933 2769
Aug 3538 2668 1962 2244 2421 2196 2446 2525 2559 2255
Sep 3312 2186 1223 2127 2503 2037 2144 2194 2258 2270
Oct 2881 2219 1426 2114 2577 1994 2008 2456 2404 2312
Nov 2667 2182 1328 1594 2138 1930 2038 2273 1899 1787
Dec 2408 2066 1201 1810 2325 2234 2201 2230 1859 1371
Jul '05 3396
Jul '06 2446
Jul '07 2136
Jul '08 2230
Jul '09 2788
Jul '10 2299
Jul '11 2238
Jul '12 2457
Jul '13 2643
Jul '14 1933
Jul '15 2769
Home Counties - Single Family + Condo/Townhouse Closed Sales
20.4%
23.7%
12.7%
4.8%
-18.5%
13.2%
29.6%
24.2%
43.2%
-0.7%
Home Counties Closed Sales
Variance to prior Years
0500
1000150020002500300035004000
Jul'05
Jul'06
Jul'07
Jul'08
Jul'09
Jul'10
Jul'11
Jul'12
Jul'13
Jul'14
Jul'15
33962769

MLSListings Inc Confidential Copyright 2015 1515
Single Family Closed Sales – San Mateo, Santa Clara CountiesJan ’04 – Jul ’15

MLSListings Inc Confidential Copyright 2015 1616
Single Family Closed Sales – San Mateo, Santa Clara CountiesJul (2004 – 2015)

MLSListings Inc Confidential Copyright 2015 1717
Single Family Closed Sales – Monterey, San Benito, Santa Cruz CountiesJan ’04 – Jul ’15

MLSListings Inc Confidential Copyright 2015 1818
Single Family Closed Sales – Monterey, San Benito, Santa Cruz CountiesJul (2004 – 2015)
MLSListings Inc Confidential Copyright 2015 1919
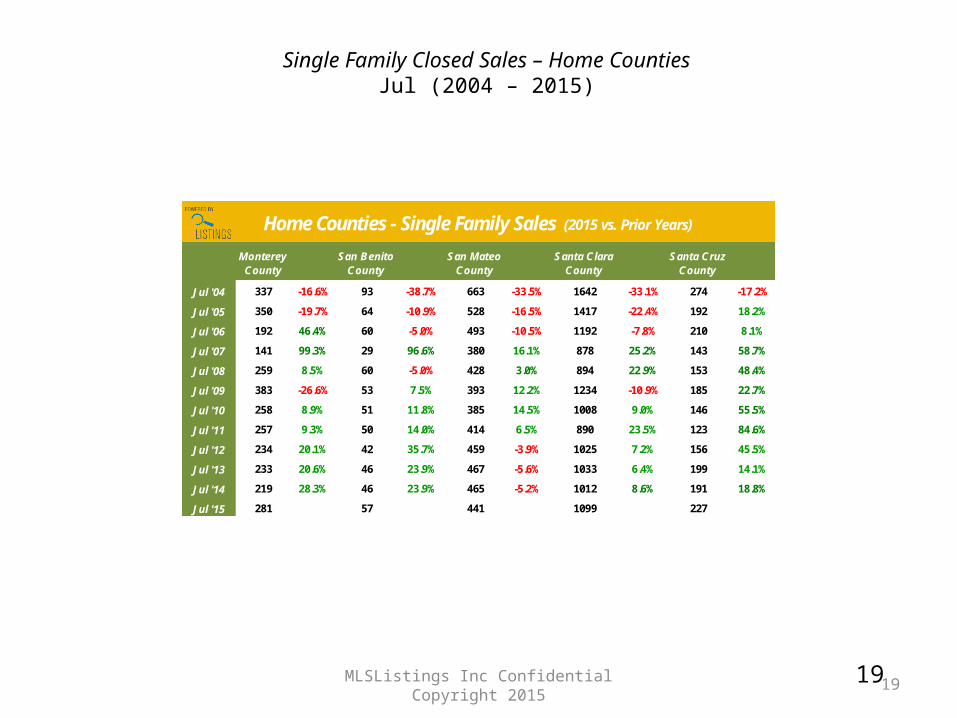
Single Family Closed Sales – Home CountiesJul (2004 – 2015)
Monterey County
San Benito
County
San Mateo County
Santa Clara
County
Santa Cruz County
Jul '04 337 -16.6% 93 -38.7% 663 -33.5% 1642 -33.1% 274 -17.2%
Jul '05 350 -19.7% 64 -10.9% 528 -16.5% 1417 -22.4% 192 18.2%
Jul '06 192 46.4% 60 -5.0% 493 -10.5% 1192 -7.8% 210 8.1%
Jul '07 141 99.3% 29 96.6% 380 16.1% 878 25.2% 143 58.7%
Jul '08 259 8.5% 60 -5.0% 428 3.0% 894 22.9% 153 48.4%
Jul '09 383 -26.6% 53 7.5% 393 12.2% 1234 -10.9% 185 22.7%
Jul '10 258 8.9% 51 11.8% 385 14.5% 1008 9.0% 146 55.5%
Jul '11 257 9.3% 50 14.0% 414 6.5% 890 23.5% 123 84.6%
Jul '12 234 20.1% 42 35.7% 459 -3.9% 1025 7.2% 156 45.5%
Jul '13 233 20.6% 46 23.9% 467 -5.6% 1033 6.4% 199 14.1%
Jul '14 219 28.3% 46 23.9% 465 -5.2% 1012 8.6% 191 18.8%
Jul '15 281 57 441 1099 227
Home Counties - Single Family Sales (2015 vs. Prior Years)

MLSListings Inc Confidential Copyright 2015 2020
Single Family Total Sales Dollars – San Mateo and Santa Clara CountiesJan ’04 – Jul ’15

MLSListings Inc Confidential Copyright 2015 2121
Single Family Total Sales Dollars – San Mateo, Santa Clara CountiesJul (2004 – 2015)

MLSListings Inc Confidential Copyright 2015 2222
Single Family Total Sales Dollars – Santa Cruz, Monterey, and San Benito CountiesJan ’04 – Jul ’15
MLSListings Inc Confidential Copyright 2015 2323
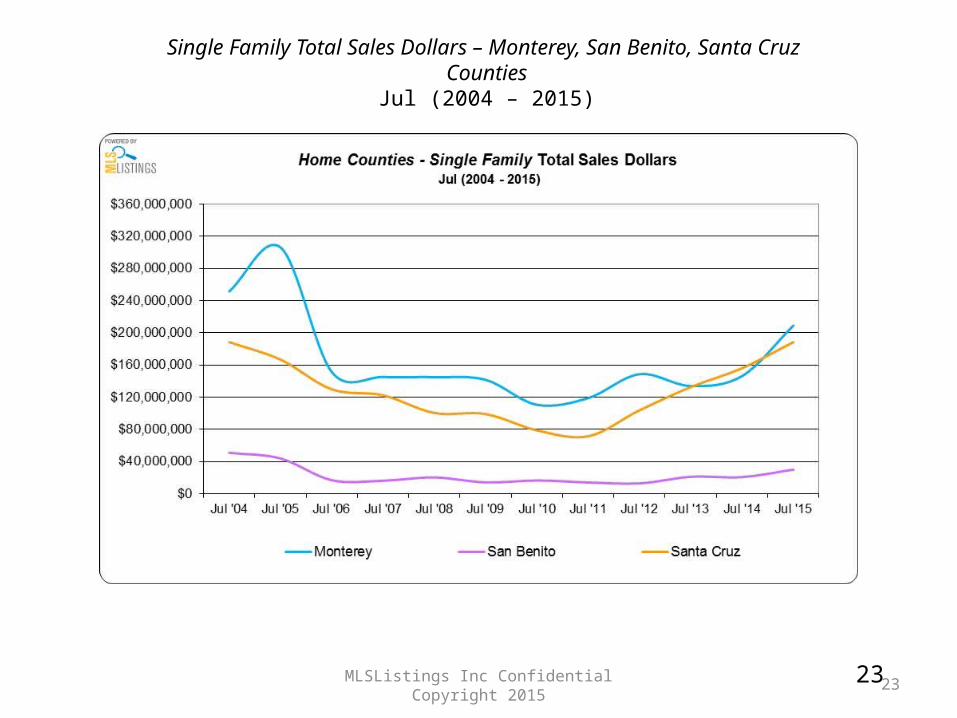
Single Family Total Sales Dollars – Monterey, San Benito, Santa Cruz Counties
Jul (2004 – 2015)

MLSListings Inc Confidential Copyright 2015 2424
Single Family Total Sales Volume – Home CountiesJul (2004 – 2015)
Monterey County
San Benito
County
San Mateo County
Santa Clara
County
Santa Cruz County
Jul '04 $251,420,465 -16.9% $50,836,654 -41.2% $627,770,378 16.1% $1,250,211,914 8.6% $188,310,614 0.0%
Jul '05 $306,117,694 -31.7% $43,780,050 -31.8% $573,678,834 27.1% $1,286,478,564 5.5% $166,668,965 13.0%
Jul '06 $151,145,604 38.3% $16,708,850 78.8% $519,542,925 40.3% $951,130,927 42.7% $129,679,451 45.2%
Jul '07 $145,064,762 44.1% $16,095,150 85.6% $517,157,868 41.0% $914,820,922 48.4% $122,265,926 54.0%
Jul '08 $144,886,179 44.3% $20,226,149 47.7% $444,346,117 64.1% $792,264,531 71.4% $100,315,918 87.7%
Jul '09 $141,499,677 47.7% $14,004,367 113.3% $368,757,897 97.7% $879,593,293 54.4% $98,964,208 90.3%
Jul '10 $110,509,582 89.1% $16,369,154 82.5% $394,513,067 84.8% $807,533,873 68.1% $78,710,416 139.3%
Jul '11 $118,819,329 75.9% $13,927,141 114.5% $397,742,466 83.3% $697,877,748 94.5% $71,294,807 164.2%
Jul '12 $148,539,324 40.7% $12,752,710 134.2% $477,381,812 52.7% $935,070,273 45.2% $103,684,395 81.6%
Jul '13 $133,801,892 56.2% $20,973,900 42.4% $594,639,869 22.6% $1,092,246,246 24.3% $132,567,692 42.1%
Jul '14 $146,215,013 42.9% $20,545,500 45.4% $634,735,294 14.9% $1,138,422,396 19.3% $155,951,749 20.8%
Jul '15 $209,013,551 $29,871,588 $729,058,010 $1,357,691,180 $188,331,205
Home Counties - Single Family Total Sales Dollars (2015 vs. Prior Years)

MLSListings Inc Confidential Copyright 2015 2525
Single Family + Condo/Townhouse New Listings - Home CountiesJan ’03 – Jul ’15

MLSListings Inc Confidential Copyright 2015 2626
Single Family + Condo/Townhouse New Listings - Home CountiesJan ’05 – Jul ’15
2005 2006 2007 2008 2009 2010 2011 2012 2013 2014 2015
Jan 3291 4061 3519 3947 3907 3334 3380 2890 2170 2164 1727
Feb 3561 4080 3508 4353 3867 3711 3373 3011 2534 2496 1616
Mar 4912 5140 4828 4785 4397 4649 3953 3313 3011 3081 3129
Apr 5359 4787 4745 5185 3909 4613 3916 3151 3499 3380 3324
May 5224 6019 5279 4934 3636 4044 3986 3551 3592 3520 3298
Jun 5392 6152 4894 4840 3820 4423 3784 3132 3358 3209 2480
Jul 5210 5523 4747 4530 3915 4089 3429 3096 3529 2420 3204
Aug 5450 5356 4720 4344 3612 3867 3342 2941 3163 2850
Sep 5544 4810 4143 4632 3608 3726 3095 2619 3016 2924
Oct 5106 3763 4202 4468 3480 3267 2988 2732 2650 2497
Nov 3648 2646 3034 3098 2700 2657 2355 1923 1774 1531
Dec 1929 1666 2223 2656 2219 2088 1724 1237 1113 705
Jul '05 5210
Jul '06 5523
Jul '07 4747
Jul '08 4530
Jul '09 3915
Jul '10 4089
Jul '11 3429
Jul '12 3096
Jul '13 3529
Jul '14 2420
Jul '15 3204
Home Counties - Single Family + Condo/Townhouse New Listings
32.4%
-18.2%
-21.6%
Variance to prior Years
Home Counties New Listings
-38.5%
-6.6%
3.5%
-9.2%
-42.0%
-32.5%
-29.3%
0
1000
2000
3000
4000
5000
6000
Jul'05
Jul'06
Jul'07
Jul'08
Jul'09
Jul'10
Jul'11
Jul'12
Jul'13
Jul'14
Jul'15
5523
3204

MLSListings Inc Confidential Copyright 2015 2727
Single Family New Listings – San Mateo, Santa Clara CountiesJan ’04 – Jul ’15

MLSListings Inc Confidential Copyright 2015 2828
Single Family New Listings – Monterey, San Benito, Santa Cruz CountiesJan ’04 – Jul ’15

MLSListings Inc Confidential Copyright 2015 2929
Single Family New Listings - Home CountiesJul (2004 – 2015)

MLSListings Inc Confidential Copyright 2015 3030
Single Family New Listings - Home CountiesJul (2004 – 2015)
Monterey County
San Benito
County
San Mateo County
Santa Clara
County
Santa Cruz County
Jul '04 438 -23.3% 111 -36.0% 734 -33.8% 2287 -39.1% 371 -28.3%
Jul '05 548 -38.7% 129 -45.0% 800 -39.3% 2150 -35.2% 363 -26.7%
Jul '06 637 -47.3% 120 -40.8% 777 -37.5% 2222 -37.3% 489 -45.6%
Jul '07 570 -41.1% 105 -32.4% 742 -34.5% 1871 -25.5% 366 -27.3%
Jul '08 675 -50.2% 92 -22.8% 639 -23.9% 2137 -34.8% 328 -18.9%
Jul '09 467 -28.1% 94 -24.5% 585 -16.9% 1560 -10.7% 310 -14.2%
Jul '10 483 -30.4% 67 6.0% 687 -29.3% 1727 -19.3% 243 9.5%
Jul '11 386 -13.0% 77 -7.8% 557 -12.7% 1434 -2.9% 246 8.1%
Jul '12 350 -4.0% 56 26.8% 521 -6.7% 1206 15.5% 278 -4.3%
Jul '13 282 19.1% 60 18.3% 520 -6.5% 1507 -7.6% 275 -3.3%
Jul '14 311 8.0% 76 -6.6% 471 3.2% 1288 8.2% 274 -2.9%
Jul '15 336 71 486 1393 266
Home Counties - Single Family New Listings (2015 vs. Prior Years)

MLSListings Inc Confidential Copyright 2015 3131
Single Family Median Prices – San Mateo, Santa Clara CountiesJan ’04 – Jul ’15
MLSListings Inc Confidential Copyright 2015 3232
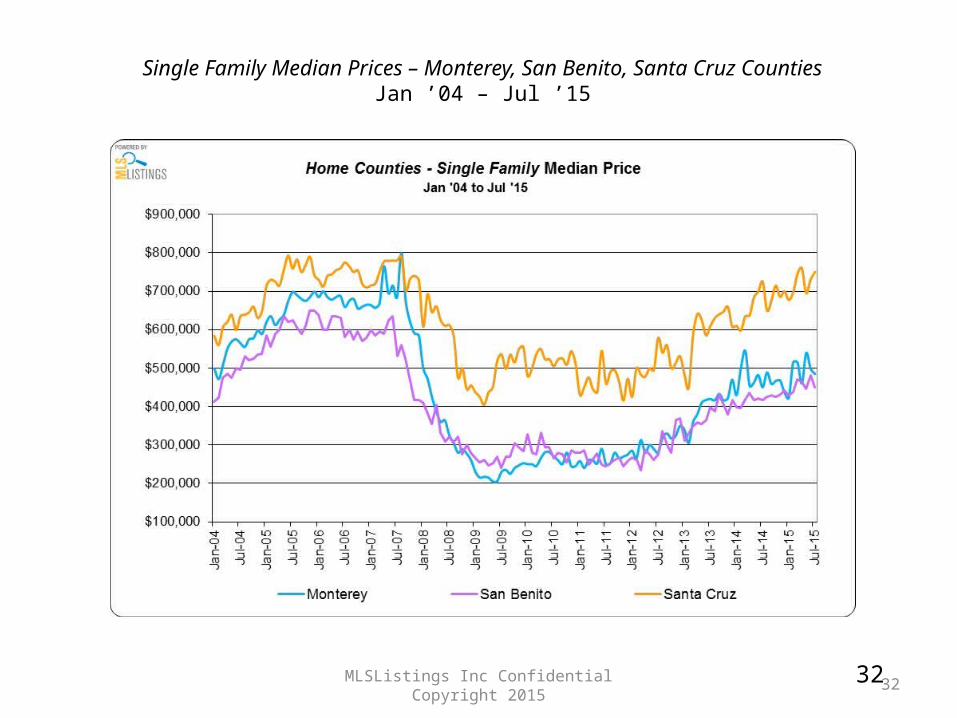
Single Family Median Prices – Monterey, San Benito, Santa Cruz CountiesJan ’04 – Jul ’15

MLSListings Inc Confidential Copyright 2015 3333
Single Family Median Prices - Home CountiesJul (2004 – 2015)
MLSListings Inc Confidential Copyright 2015 3434
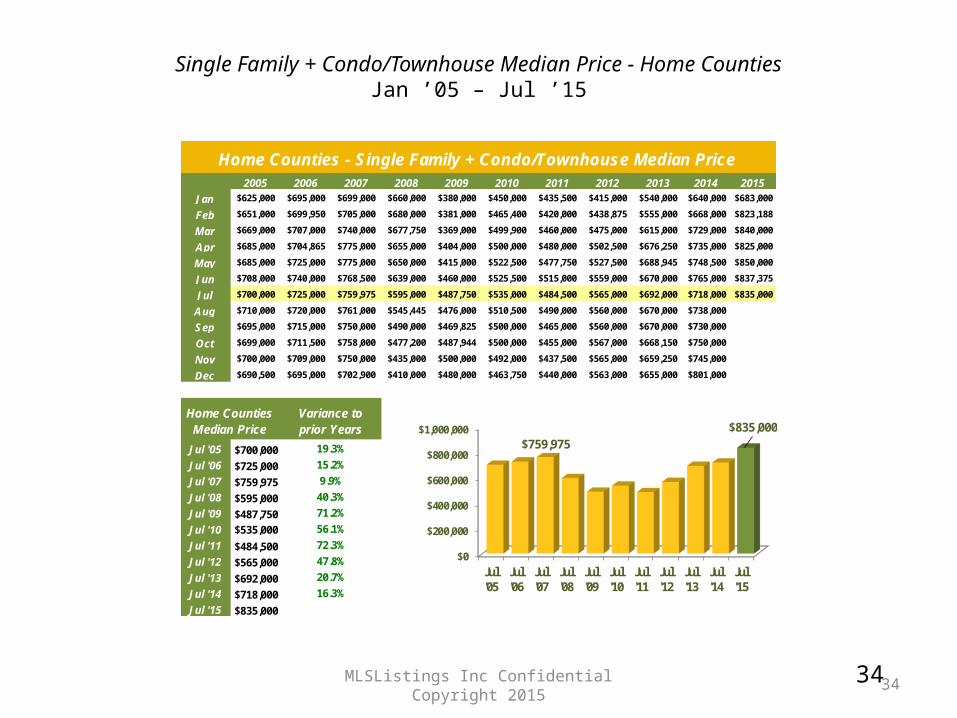
Single Family + Condo/Townhouse Median Price - Home CountiesJan ’05 – Jul ’15
2005 2006 2007 2008 2009 2010 2011 2012 2013 2014 2015
Jan $625,000 $695,000 $699,000 $660,000 $380,000 $450,000 $435,500 $415,000 $540,000 $640,000 $683,000
Feb $651,000 $699,950 $705,000 $680,000 $381,000 $465,400 $420,000 $438,875 $555,000 $668,000 $823,188
Mar $669,000 $707,000 $740,000 $677,750 $369,000 $499,900 $460,000 $475,000 $615,000 $729,000 $840,000
Apr $685,000 $704,865 $775,000 $655,000 $404,000 $500,000 $480,000 $502,500 $676,250 $735,000 $825,000
May $685,000 $725,000 $775,000 $650,000 $415,000 $522,500 $477,750 $527,500 $688,945 $748,500 $850,000
Jun $708,000 $740,000 $768,500 $639,000 $460,000 $525,500 $515,000 $559,000 $670,000 $765,000 $837,375
Jul $700,000 $725,000 $759,975 $595,000 $487,750 $535,000 $484,500 $565,000 $692,000 $718,000 $835,000
Aug $710,000 $720,000 $761,000 $545,445 $476,000 $510,500 $490,000 $560,000 $670,000 $738,000
Sep $695,000 $715,000 $750,000 $490,000 $469,825 $500,000 $465,000 $560,000 $670,000 $730,000
Oct $699,000 $711,500 $758,000 $477,200 $487,944 $500,000 $455,000 $567,000 $668,150 $750,000
Nov $700,000 $709,000 $750,000 $435,000 $500,000 $492,000 $437,500 $565,000 $659,250 $745,000
Dec $690,500 $695,000 $702,900 $410,000 $480,000 $463,750 $440,000 $563,000 $655,000 $801,000
Jul '05 $700,000
Jul '06 $725,000
Jul '07 $759,975
Jul '08 $595,000
Jul '09 $487,750
Jul '10 $535,000
Jul '11 $484,500
Jul '12 $565,000
Jul '13 $692,000
Jul '14 $718,000
Jul '15 $835,000
Home Counties - Single Family + Condo/Townhouse Median Price
16.3%
Home Counties Median Price
Variance to prior Years
19.3%
15.2%
47.8%
20.7%
9.9%
40.3%
71.2%
56.1%
72.3%$0
$200,000
$400,000
$600,000
$800,000
$1,000,000
Jul'05
Jul'06
Jul'07
Jul'08
Jul'09
Jul'10
Jul'11
Jul'12
Jul'13
Jul'14
Jul'15
$759,975$835,000
MLSListings Inc Confidential Copyright 2015 3535
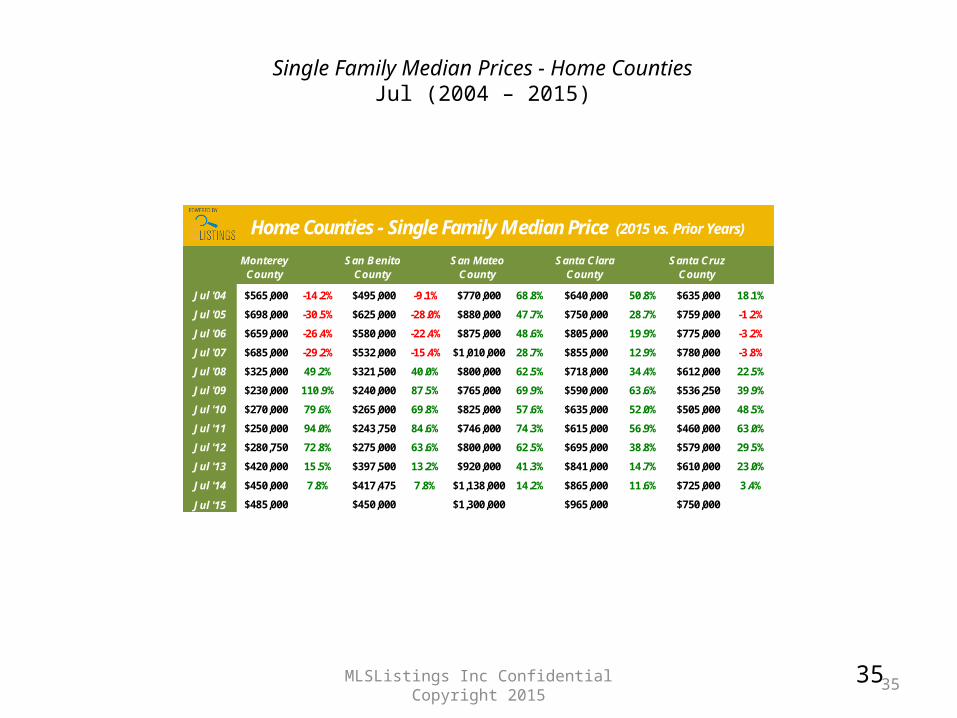
Single Family Median Prices - Home CountiesJul (2004 – 2015)
Monterey County
San Benito
County
San Mateo County
Santa Clara
County
Santa Cruz County
Jul '04 $565,000 -14.2% $495,000 -9.1% $770,000 68.8% $640,000 50.8% $635,000 18.1%
Jul '05 $698,000 -30.5% $625,000 -28.0% $880,000 47.7% $750,000 28.7% $759,000 -1.2%
Jul '06 $659,000 -26.4% $580,000 -22.4% $875,000 48.6% $805,000 19.9% $775,000 -3.2%
Jul '07 $685,000 -29.2% $532,000 -15.4% $1,010,000 28.7% $855,000 12.9% $780,000 -3.8%
Jul '08 $325,000 49.2% $321,500 40.0% $800,000 62.5% $718,000 34.4% $612,000 22.5%
Jul '09 $230,000 110.9% $240,000 87.5% $765,000 69.9% $590,000 63.6% $536,250 39.9%
Jul '10 $270,000 79.6% $265,000 69.8% $825,000 57.6% $635,000 52.0% $505,000 48.5%
Jul '11 $250,000 94.0% $243,750 84.6% $746,000 74.3% $615,000 56.9% $460,000 63.0%
Jul '12 $280,750 72.8% $275,000 63.6% $800,000 62.5% $695,000 38.8% $579,000 29.5%
Jul '13 $420,000 15.5% $397,500 13.2% $920,000 41.3% $841,000 14.7% $610,000 23.0%
Jul '14 $450,000 7.8% $417,475 7.8% $1,138,000 14.2% $865,000 11.6% $725,000 3.4%
Jul '15 $485,000 $450,000 $1,300,000 $965,000 $750,000
Home Counties - Single Family Median Price (2015 vs. Prior Years)

MLSListings Inc Confidential Copyright 2015 3636
Single Family Average Price – San Mateo, Santa Clara CountiesJan ’04 – Jul ’15

MLSListings Inc Confidential Copyright 2015 3737
Single Family Average Price – Monterey, San Benito, Santa Cruz CountiesJan ’04 – Jul ’15

MLSListings Inc Confidential Copyright 2015 3838
Single Family Average Price - Home CountiesJul (2004 – 2015)

MLSListings Inc Confidential Copyright 2015 3939
Single Family Average Price - Home CountiesJul (2004 – 2015)
Monterey County
San Benito
County
San Mateo County
Santa Clara
County
Santa Cruz County
Jul '04 $746,055 -0.7% $546,631 -4.1% $946,863 74.6% $761,396 62.1% $687,265 20.7%
Jul '05 $874,622 -15.3% $684,063 -23.4% $1,086,513 52.2% $907,889 35.9% $868,068 -4.4%
Jul '06 $863,689 -14.2% $596,745 -12.2% $1,091,477 51.5% $977,524 26.3% $882,173 -6.0%
Jul '07 $1,028,828 -28.0% $555,005 -5.6% $1,360,942 21.5% $1,041,937 18.5% $855,006 -3.0%
Jul '08 $468,505 58.2% $377,102 39.0% $1,040,623 58.9% $887,194 39.1% $655,659 26.5%
Jul '09 $359,161 106.4% $264,233 98.3% $938,315 76.2% $713,955 72.9% $537,848 54.3%
Jul '10 $450,983 64.3% $320,963 63.3% $1,024,709 61.3% $801,124 54.1% $539,112 53.9%
Jul '11 $400,076 85.3% $278,542 88.1% $960,730 72.1% $785,898 57.1% $579,632 43.1%
Jul '12 $517,838 43.1% $303,635 72.6% $1,040,047 59.0% $914,047 35.0% $664,643 24.8%
Jul '13 $641,713 15.5% $455,954 14.9% $1,278,795 29.3% $1,059,404 16.5% $666,169 24.5%
Jul '14 $723,007 2.5% $446,641 17.3% $1,370,918 20.6% $1,126,036 9.6% $816,501 1.6%
Jul '15 $741,183 $524,063 $1,653,193 $1,234,265 $829,653
Home Counties - Single Family Average Price (2015 vs. Prior Years)

MLSListings Inc Confidential Copyright 2015 4040
Condo/Townhouse Market Outlook – Home CountiesJul ’14 vs. Jul ’15

MLSListings Inc Confidential Copyright 2015 4141
Condo/Townhouse Total Sales Dollars – San Mateo and Santa Clara CountiesJan ’04 – Jul ’15

MLSListings Inc Confidential Copyright 2015 4242
Condo/Townhouse Total Sales Dollars – San Mateo, Santa Clara CountiesJan ’04 – Jul ’15

MLSListings Inc Confidential Copyright 2015 4343
Condo/Townhouse Total Sales Dollars – Monterey, San Benito, Santa Cruz CountiesJul (2004 – 2015)

MLSListings Inc Confidential Copyright 2015 4444
Condo/Townhouse Total Sales Dollars – Monterey, San Benito, Santa Cruz CountiesJul (2004 – 2015)

MLSListings Inc Confidential Copyright 2015 4545
Condo/Townhouse Total Sales Dollars – Home CountiesJul (2004 – 2015)
Monterey County
San Benito
County
San Mateo County
Santa Clara
County
Santa Cruz County
Jul '04 $20,325,700 15.3% $1,989,900 -68.4% $106,040,527 -13.3% $275,871,705 9.7% $22,983,674 26.4%
Jul '05 $21,506,400 8.9% $1,810,000 -65.3% $95,198,796 -3.4% $297,956,710 1.5% $31,447,388 -7.6%
Jul '06 $9,678,490 142.1% $1,421,000 -55.8% $95,076,625 -3.3% $225,112,005 34.4% $21,826,846 33.1%
Jul '07 $9,110,450 157.2% $275,000 128.4% $79,802,814 15.2% $215,909,733 40.1% $15,249,500 90.5%
Jul '08 $13,522,750 73.2% $160,000 292.5% $55,858,350 64.6% $144,540,701 109.3% $13,520,800 114.9%
Jul '09 $4,867,505 381.3% $517,900 21.3% $52,999,396 73.5% $137,005,320 120.8% $12,644,500 129.8%
Jul '10 $8,430,500 177.9% $75,000 737.3% $38,269,087 140.2% $120,346,125 151.4% $14,394,807 101.8%
Jul '11 $6,971,800 236.0% $358,500 75.2% $40,800,810 125.3% $125,354,273 141.3% $8,384,000 246.5%
Jul '12 $8,142,800 187.7% $465,000 35.1% $59,401,500 54.8% $149,722,089 102.1% $12,762,469 127.6%
Jul '13 $12,979,000 80.5% $1,665,900 -62.3% $92,707,852 -0.8% $228,503,488 32.4% $18,398,160 57.9%
Jul '14 $10,023,199 133.7% $599,950 4.7% $101,932,036 -9.8% $245,036,761 23.5% $24,863,150 16.8%
Jul '15 $23,427,637 $628,000 $91,934,682 $302,525,730 $29,051,737
Home Counties - Condo+Townhouse Total Sales Dollars (2015 vs. Prior Years)

MLSListings Inc Confidential Copyright 2014 4646
Condo/Townhouse Months of Inventory – San Mateo, Santa Clara, Santa Cruz Mar ’03 – Jul ’15 (Rolling Three Month Average)
MLSListings Inc Confidential Copyright 2015 4747
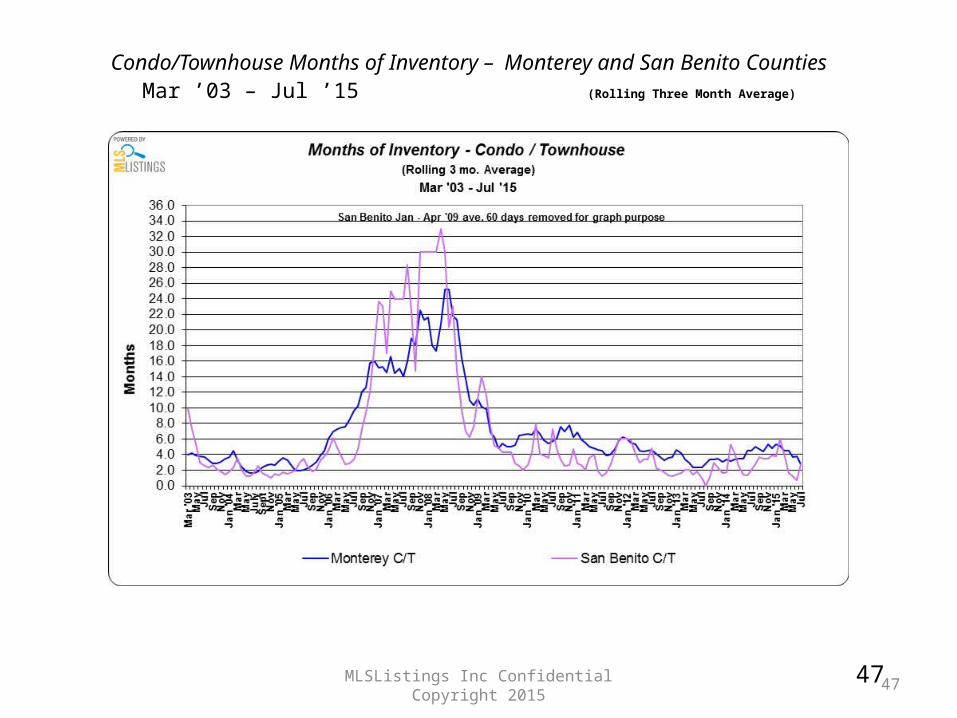
Condo/Townhouse Months of Inventory – Monterey and San Benito CountiesMar ’03 – Jul ’15 (Rolling Three Month Average)