
July 2010 NHS Calderdale Health Investment slide pack QIPP Right Care Important: Please note this...
47
July 2010 NHS Calderdale Health Investment slide pack QIPP Right Care Important: Please note this health investment slide pack may differ from other SHA’s as it was created as part of the initial pilot scheme
-
Upload
roger-armstrong -
Category
Documents
-
view
214 -
download
0
Transcript of July 2010 NHS Calderdale Health Investment slide pack QIPP Right Care Important: Please note this...

July 2010
NHS Calderdale Health Investment slide pack
QIPP Right Care
Important: Please note this health investment slide pack may differ from other SHA’s as it was created as part of the initial pilot scheme

22
About this health investment pack
• Purpose / Objectives – to highlight the scale of variation in healthcare at PCT and GP Practice level and demonstrate how Programme Budgeting tools can help the search for unwarranted variation and support the health investment process
• The analysis presented provides a high level narrative in terms of expenditure, expenditure drivers, and the resulting outcomes for one disease area per PCT
• By triangulating data from a variety of sources, the analysis draws on a wide evidence base to provide
consistent messages and therefore minimises opportunities to highlight data quality issues
• This pack cannot draw comprehensive conclusions but provides a summary of readily available and
free to use national level information sets for local organisations to raise questions and investigate
further
• PCTs who want to explore these variations in more detail should take this forward through their DPH
and Public Health Observatories and Quality Observatories
• As the NHS moves towards commissioning by GP Consortia it is imperative that PCTs establish a
clear framework and evidence base for making and evaluating health investment decisions

3
Overview
We will:-
• Examine DH Programme Budget Spreadsheet and SPOT • Identify a programme area to review in more depth
• Explore this programme area in the Programme Budget Atlases and NHS Comparators
• Develop a clearer picture of areas for further investigation

4
What is Programme Budgeting?
Programme Budgeting:
- Outlines how PCTs cut their cake in terms of 23 ICD 10 defined programme budgeting categories; hence is a
- a retrospective appraisal of resource allocation broken down into ‘programmes’ - with a view to influencing and tracking future expenditure in those same programmes.
- Allows for cross sectional and time series comparisons, at England, SHA, PCT and increasingly, practice Level.
Marginal Analysis
- An appraisal of the added costs and added benefits when the resources in programmes are increased, or deployed in new ways.
- Programme Budgeting and Marginal Analysis provides a framework to help commissioners make, track and evaluate health investment decisions.

5
23 Programme Budgeting Categories
1 Infectious Diseases2 Cancers & Tumours3 Blood Disorders4 Endocrine, Nutritional and Metabolic
Problems5 Mental Health Problems6 Learning Disability Problems7 Neurological System Problems8 Eye/Vision Problems9 Hearing Problems10 Circulation Problems (CVD)11 Respiratory System Problems12 Dental Problems13 Gastro Intestinal System Problems
14 Skin Problems15 Musculo Skeletal System Problems
(excludes Trauma)16 Trauma & Injuries17 Genito Urinary System Disorders
(except infertility)18 Maternity & Reproductive Health19 Neonates20 Poisoning21 Healthy Individuals22 Social Care Needs23 Other Conditions
What is Programme Budgeting?

6
2007/08 and 2008/09 Programme Level Expenditure for England

7
Information Available for PCTs
This pack will provide an update on the products available to commissioners including:
• Programme Budgeting Spreadsheet;• Spend & Outcome Tool (SPOT);• Programme Budgeting Atlas;• NHS Comparators.• Inpatient Variation Expenditure Tool (IVET)
These tools allow commissioners to compare expenditure and outcomes at disease level.
To access these tools visit;
www.networks.nhs.uk/nhs-networks/health-investment-network/key-tools
These tools are a starting point for the process of making health investment decisions.

8
Programme Budgeting Spreadsheet: Calderdale PCT Expenditure
2006-07 2007-08 2008-09% change from
2007-08
01 Infectious Diseases 3,794 2,286 3,468 52%02 Cancers and Tumours 18,219 20,676 14,840 -28%03 Disorders of Blood 2,339 3,591 3,530 -2%04 Endocrine, Nutritional and Metabolic 5,476 5,890 7,131 21%05 Mental Health Disorders 30,283 32,154 33,504 4%06 Problems of Learning Disability 6,251 5,579 13,023 133%07 Neurological 7,900 17,652 10,591 -40%08 Problems of Vision 5,847 4,842 6,685 38%09 Problems of Hearing 1,698 564 2,230 295%10 Problems of Circulation 17,577 23,523 20,731 -12%11 Problems of the Respiratory System 10,348 14,711 18,287 24%12 Dental Problems 9,866 12,308 13,607 11%13 Problems of Gastro Intestinal System 13,742 17,364 14,732 -15%14 Problems of the Skin 4,288 4,430 5,047 14%15 Problems of Musculo Skeletal System 10,326 11,877 8,875 -25%16 Problems due to Trauma and Injuries 7,778 10,772 10,690 -1%17 Problems of Genito Urinary System 9,794 10,553 11,384 8%18 Maternity and Reproductive Health 17,907 15,464 11,980 -23%19 Conditions of Neonates 2,940 1,013 1,930 91%20 Adverse effects and poisoning 2,408 3,898 2,511 -36%21 Healthy Individuals 3,202 2,965 3,098 4%22 Social Care Needs 6,675 21,352 26,463 24%23 Other 62,077 37,589 61,695 64%All Total 260,735 281,053 306,032 9%
Programme Budgeting Category
Expenditure on own population (£000s)
Calderdale PCT

9
Programme Budgeting Spreadsheet – Calderdale PCT Expenditure per 100,000 population (weighted by age, sex and need) – 2008/9 rank column shows PCT is a high spender on Respiratory, Social care and Other categories; Respiratory was a low spend in 2006/07.
Population (as per Allocations)
Dist from Target £'000 (Under/ Over)Dist from Target % (Under/ Over)
2006-07 Rank 2007-08 Rank 2008-09 Rank % Change
01 Infectious Diseases 1,960,519 55 1,179,542 135 1,771,111 83 50%
02 Cancers and Tumours 9,414,524 17 10,668,507 19 7,578,802 136 -29%
03 Disorders of Blood 1,208,660 120 1,852,902 82 1,802,774 87 -3%
04 Endocrine, Nutritional and Metabolic 2,829,680 142 3,039,152 143 3,641,808 133 20%
05 Mental Health Disorders 15,648,500 90 16,590,984 100 17,110,524 103 3%
06 Problems of Learning Disability 3,230,155 131 2,878,681 145 6,650,858 31 131%
07 Neurological 4,082,262 139 9,108,168 2 5,408,834 131 -41%
08 Problems of Vision 3,021,391 47 2,498,400 127 3,414,036 60 37%
09 Problems of Hearing 877,428 21 291,016 148 1,138,863 23 291%
10 Problems of Circulation 9,082,775 143 12,137,517 86 10,587,341 137 -13%
11 Problems of the Respiratory System 5,347,247 138 7,590,656 39 9,339,188 15 23%
12 Dental Problems 5,098,177 89 6,350,744 60 6,949,108 41 9%
13 Problems of Gastro Intestinal System 7,101,070 89 8,959,565 16 7,523,646 94 -16%
14 Problems of the Skin 2,215,790 128 2,285,814 136 2,577,508 139 13%
15 Problems of Musculo Skeletal System 5,335,879 121 6,128,355 120 4,532,471 147 -26%
16 Problems due to Trauma and Injuries 4,019,220 135 5,558,191 77 5,459,393 99 -2%
17 Problems of Genito Urinary System 5,060,972 143 5,445,190 136 5,813,819 145 7%
18 Maternity and Reproductive Health 9,253,300 4 7,979,193 10 6,118,197 73 -23%
19 Conditions of Neonates 1,519,222 58 522,693 145 985,653 145 89%
20 Adverse effects and poisoning 1,244,315 104 2,011,310 23 1,282,370 140 -36%
21 Healthy Individuals 1,654,608 121 1,529,896 134 1,582,151 146 3%
22 Social Care Needs 3,449,253 37 11,017,313 6 13,514,679 6 23%
23 Other 32,077,540 7 19,395,362 105 31,507,694 4 62%
All Total 134,732,487 145,019,149 156,290,828 8%
193,520 193,804 195,809
8,418 6,921 7,299
2.58%
Programme Budgeting Category
3.42% 2.58%
£ per 100,000 population
EXPENDITURE ON OWN POPULATION
Note: Calderdale has a high proportion of spend in category 23x ‘Other Miscellaneous’. This may result in low reported expenditure in disease specific categories.

10
Programme Budgeting Spreadsheet – Calderdale PCT Expenditure per 100,000 population (weighted by age, sex and need) on Problems of the Respiratory System category – Green circle shows that the PCT has higher spend than most PCTs, both nationally (blue diamonds), and in similar PCT cluster (purple triangles)

11
APHO Spend and Outcomes tool (SPOT)
• The Spend and Outcomes tool has been developed by the Association of Public Health Observatories.
• The tool allows PCTs to compare their expenditure and outcome data for each of the 23 Programme Budget disease categories on a single page.
• The tool is interactive and allows PCTs to select different outcome measures and different views of the data – including a comparison with any other selected PCT.
• A very useful tool that quickly allows PCTs to identify areas of expenditure that warrant further investigation.

12
[2008/09] Each diamond represents a disease category and shows spend and outcome compared to the national average – In Calderdale PCT Respiratory has a higher spend with worse outcome when compared to other PCTs nationally.
Mortality from all circulatory diseases: Under 75s
Mortality from all cancers: Under 75s, Cancers was a high spend area in 2007/08
Patients on enhanced CPA receiving early FU
Mortality from bronchitis, emphysema, COPD
13
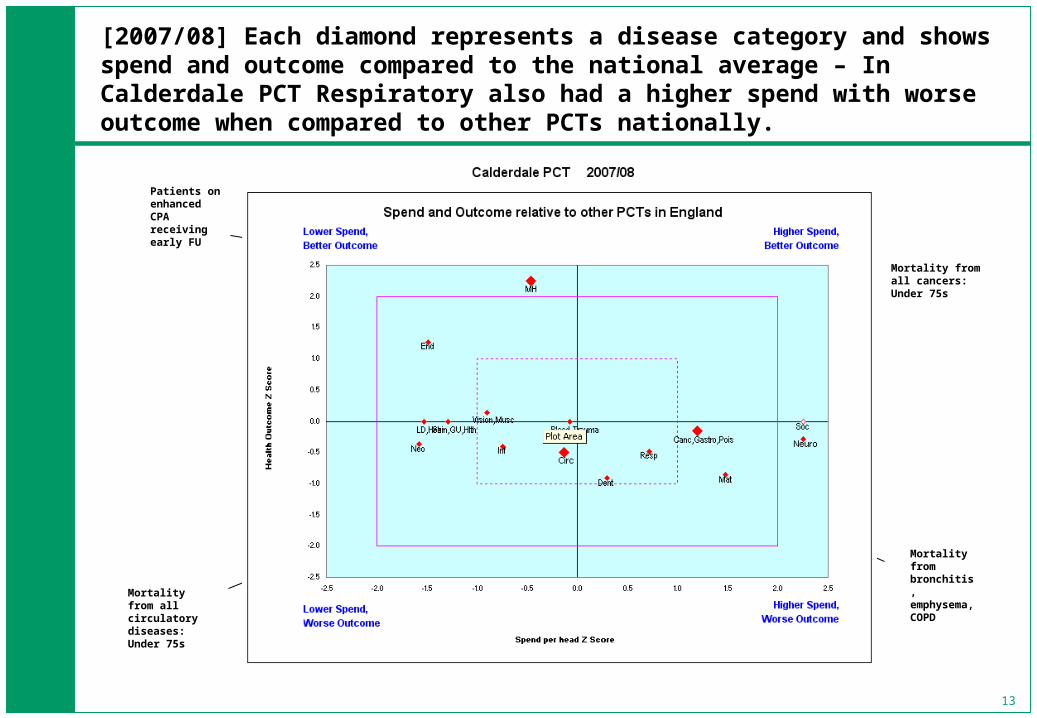
[2007/08] Each diamond represents a disease category and shows spend and outcome compared to the national average – In Calderdale PCT Respiratory also had a higher spend with worse outcome when compared to other PCTs nationally.
Mortality from all circulatory diseases: Under 75s
Mortality from all cancers: Under 75s
Patients on enhanced CPA receiving early FU
Mortality from bronchitis, emphysema, COPD

14
Summary of DH PB Expenditure and SPOT data
• Expenditure Budget Spreadsheet– Spending on Respiratory was low in 2006/07 but has risen to became the 5 th highest category
spend in 2008/09;
– In 2006/07 its spend was 138th across England, in 2008/09 it was 15th;
• Rank– Calderdale was the 5th highest spender on Respiratory systems in 2008/09 within its own
cluster;
• SPOT– Respiratory appears in the Higher Spend/Worse Outcome quadrant in both 2007/08 and
2008/09 data sets;
• The following slides will now look at Respiratory in more depth for Calderdale PCT.

15
Programme Budgeting Atlases (1)
• The Programme Budgeting Atlases are provided on our behalf by the National Centre for Health Outcomes Development, under contract to the Information Centre for Health and Social as part of the Compendium of Public Health Indicators.
• The Atlas links programme budgeting expenditure data, as presented in the programme budgeting spreadsheet with an array of outcome data.
• By using mapping software, bar charts and correlation plots, the Atlases provides an illuminating and user-friendly way of analysing and presenting data.
• Atlases available via an NHS Net connection from:
nww.nchod.nhs.uk

16
Programme Budgeting Atlases (2)
Atlases include a vast array of data configured in terms of:
Expenditure Data.• Expenditure per 100,000 population (weighted for age, sex and need) • Expenditure per 100,000 population (weighted for age, sex and need) filtered by ONS Cluster• Expenditure per 100,000 population (weighted for age, sex and need) filtered by SHA
Output Data• Primary care prescribing – number of items and expenditure;• Admissions/ALOS/Beddays (total, non-elective, elective ordinary, daycase); • Day case rates.• Prescription expenditure• Prescription Volume
Outcome Data
• Expenditure on Respiratory Family health services prescribing per 100,000 population• Prevalence data from QOF;• Emergency readmissions data;
17
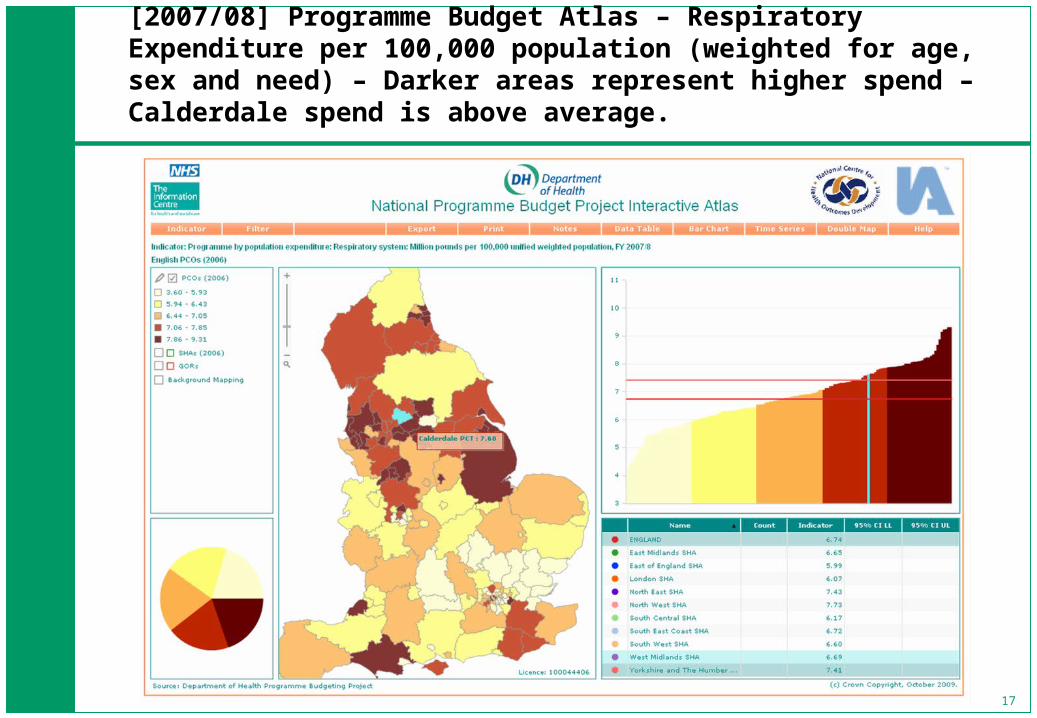
[2007/08] Programme Budget Atlas – Respiratory Expenditure per 100,000 population (weighted for age, sex and need) – Darker areas represent higher spend – Calderdale spend is above average.

18
[2007/08] Programme Budget Atlas - Respiratory Expenditure per 100,000 population (weighted for age, sex and need) filtered by ONS Cluster (Centres with Industry) – Darker areas represent higher spend – Calderdale is above average compared to similar PCTs
19
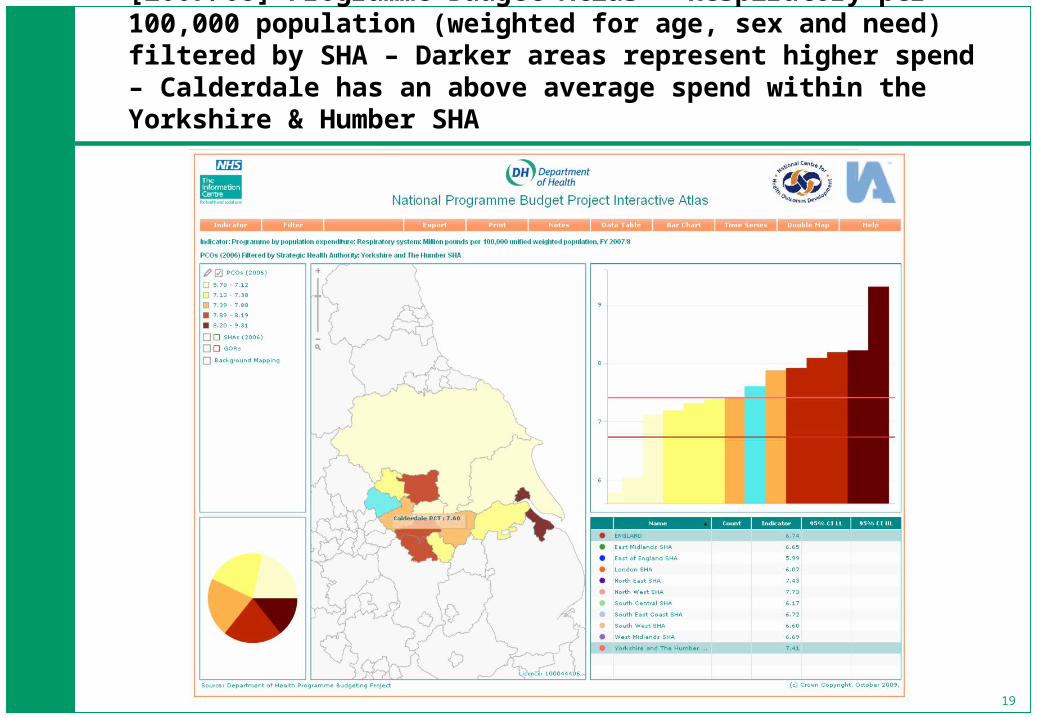
[2007/08] Programme Budget Atlas – Respiratory per 100,000 population (weighted for age, sex and need) filtered by SHA – Darker areas represent higher spend – Calderdale has an above average spend within the Yorkshire & Humber SHA
20
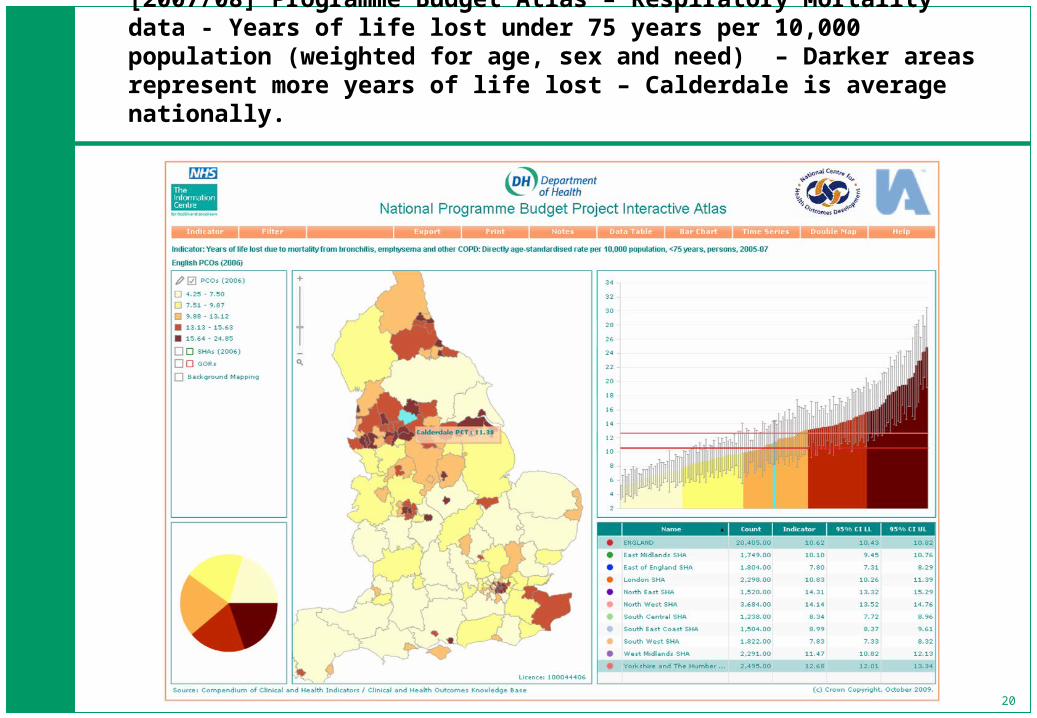
[2007/08] Programme Budget Atlas – Respiratory Mortality data - Years of life lost under 75 years per 10,000 population (weighted for age, sex and need) – Darker areas represent more years of life lost – Calderdale is average nationally.

21
[2007/08] Programme Budget Atlas – Scatterplot shows Respiratory Expenditure and Mortality data from previous slides on the same graph – Calderdale (highlighted by blue dot) has a high spend (vertical axis) and below average mortality (horizontal axis) – PCTs can use the chart to identify PCTs with good outcomes (and can filter by
SHA and ONS similar PCT cluster)

22
[2007/08] Programme Budget Atlas – Expenditure on Respiratory Family Health Services Prescribing per 100,000 population (weighted for age, sex and need) SHA – Darker areas represent higher spend – Calderdale PCT spend is average nationally

23
[2007/08] Programme Budget Atlas – Prescribing Volume on Respiratory Family Health Services per 100,000 population (weighted for age, sex and need) SHA – Darker areas represent higher spend – Calderdale PCT spend is average nationally

24
2007/2008 Programme Budget Atlas – Prevalence of COPD (QOF); Percent, all ages FY, Calderdale PCT has slightly above average prevalence of COPD

25
2007/2008 Programme Budget Atlas – Fev1 checks for patients with COPD (QOF); Percent, all ages – Calderdale PCT has a below average level of checks for patients with COPD

26
2007/2008 Programme Budget Atlas – Vaccination against influenza for patients with COPD (QOF) Patients all ages – Calderdale PCT has a low vaccination rate against influenza for patients with COPD
27
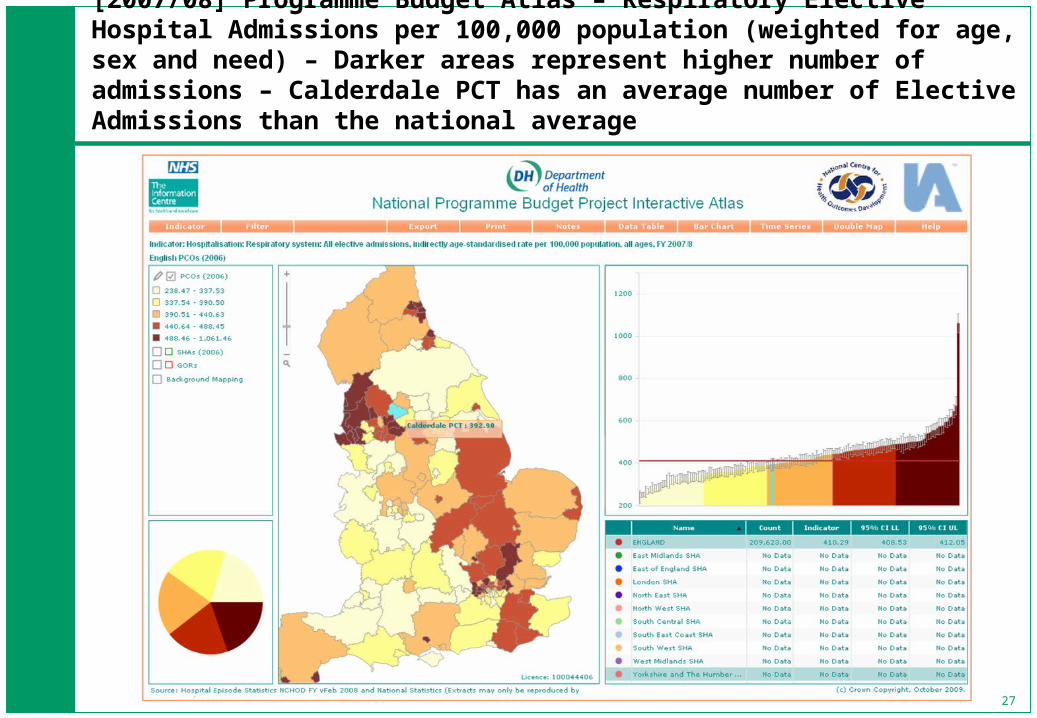
[2007/08] Programme Budget Atlas – Respiratory Elective Hospital Admissions per 100,000 population (weighted for age, sex and need) – Darker areas represent higher number of admissions – Calderdale PCT has an average number of Elective Admissions than the national average

28
[2007/08] Programme Budget Atlas – Respiratory Non-Elective Hospital Admissions per 100,000 population (weighted for age, sex and need) – Darker areas represent higher number of admissions – Calderdale PCT has an average number of Non-Elective Admissions

29
[2007/08] Programme Budget Atlas – Respiratory Non-Elective Average Length of Stay per spell in hospital – Darker areas represent higher LOS Calderdale PCT has an average Length of Stay per spell in hospital

30
[2007/08] Programme Budget Atlas – Respiratory Emergency Readmissions to hospital within 28 days of discharge – Darker areas represent higher number of readmissions – Calderdale PCT has an average number of Respiratory Emergency Readmissions

31
[2007/08] Programme Budget Atlas – Deaths within 30 days of admission for all respiratory system problems – Darker areas represent higher number of deaths – Calderdale has a low number of deaths (but there are very large confidence intervals so caution must be used when interpreting this data)

32
2007/2008 Programme Budget Atlas – SCATTERPLOT – Vaccination against influenza for patients with COPD vs Hospitalisation: Respiratory system: Non elective admissions, Calderdale PCT has a below average number of patients hospitalised and an average number of patients vaccinated

33
NHS Comparators
NHS Comparators provided by the IC on the NHS net;
nww.nhscomparators.nhs.uk
• Holds data at England, SHA, PCT and Practice level;• Data are timely and frequent – every quarter up to Q3 2009/10• Various sources of data including:
– total admissions – activity and expenditure;– non-elective admissions – activity and expenditure– elective admissions – activity and expenditure– prescribing – items and expenditure– better care better value metrics – including low cost statin prescribing
• Very powerful for showing variation, and time series – which allows to track change over time
• Outpatient referrals by GP

34
[2008/09] NHS Comparators - Expenditure on all admissions covered by PBR tariff (age and sex adjusted rate) - Comparison with other PCTs –Calderdale has slightly higher expenditure than national average

35
[2008/09] NHS Comparators – GP Practice Level Comparison of Expenditure on Respiratory Emergency Admissions – Large variation between spend at practice level in Calderdale PCT
Easy to identify high and low spending practices. Can compare practices within groups based on
need of population

36
[2008/09] NHS Comparators – GP Practice Level Comparison of Average Length of Stay of Respiratory Emergency Admissions – Large variation at practice level in Calderdale PCT

37
[2008/09] NHS Comparators - Quarterly Time Series of Calderdale PCT Expenditure on Emergency Admissions for Respiratory – The PCT admissions rate is higher than the National average rate
PCT has over the last three years been constantly high
spending for respiratory. Peaks due to seasonality.
38
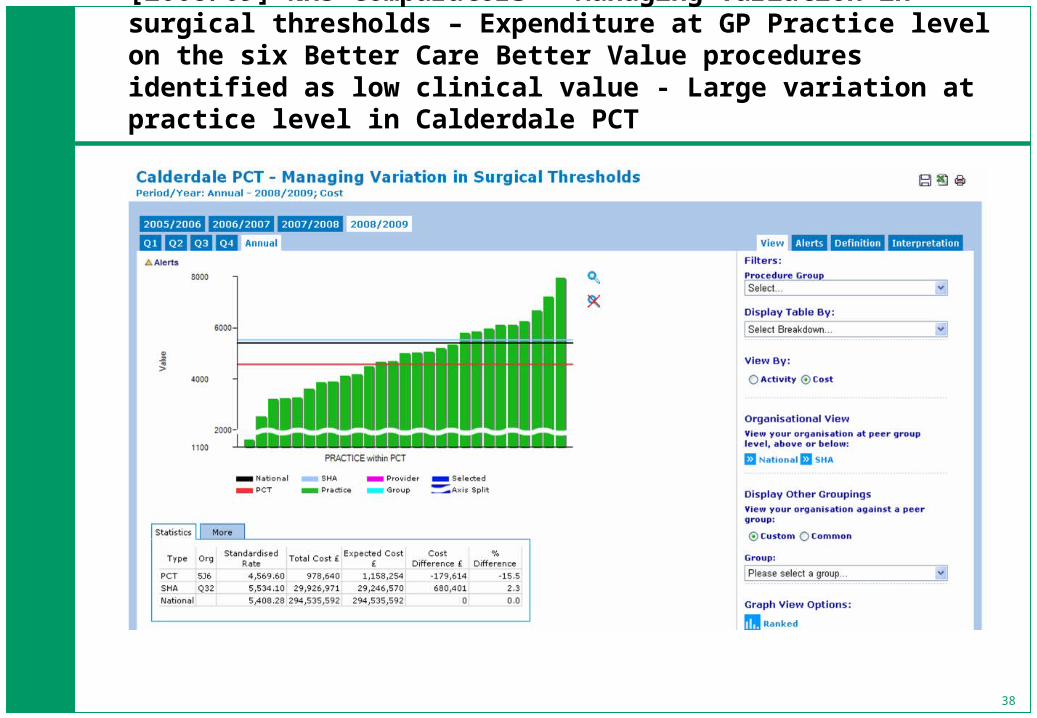
[2008/09] NHS Comparators - Managing variation in surgical thresholds – Expenditure at GP Practice level on the six Better Care Better Value procedures identified as low clinical value - Large variation at practice level in Calderdale PCT

39
[2008/09] NHS Comparators - Quarterly Time Series of Calderdale PCT Outpatient First Attendances – The PCT rate is higher than SHA and National average rate – Breakdown by source of referral is also available

40
[2008/09] NHS Comparators – Includes FHS Prescribing data (volume and cost of prescriptions) – Calderdale PCT has an average proportion of low cost Statins

41
[2008/09] NHS Comparators – Breakdown of Actual and Expected Expenditure on admissions by Programme Budget or Disease Category – Also available for FHS Prescribing Expenditure
This table is available at SHA, PCT, and Practice level, on a quarterly or annual basis.
The table shows for inpatient admissions in each disease area, actual spend, expected based on national averages, and expenditure differences in absolute and % terms.
Because expenditure is calculated as activity multiplied by tariff, the table is less useful where tariff is less well developed – e.g. Mental Health.

42
ONS Cluster Variation
• The following three slides demonstrate further ways of looking at variation within programme areas.
• The first slide shows total variation in expenditure by programme, compared with cluster comparator.
• The next two slides show quadrant charts comparing expenditure and outcome for the PCT compared with other PCTs in its cluster.

43
Programme Budgeting Spreadsheet – Calderdale PCT Expenditure per 100,000 population (weighted by age, sex and need) on all categories compared to cluster average – Calderdale has large variations on Social Care needs and Other when compared with similar PCTs

44
[2007/08] Each diamond represents a disease category and shows spend and outcomes compared to the ONS Cluster average – In Rotherham PCT Cancer has higher spend with better outcome when compared to other PCTs in the same ONS Cluster

45
[2008/09] Each diamond represents a disease category and shows spend and outcomes compared to the ONS Cluster average – In Calderdale PCT Mental Health, Circulation and Cancer have lower spend and better outcome when compared to other PCTs in the same ONS Cluster

46
Conclusion
We have:-
• Examined DH Programme Budget Spreadsheet and SPOT • Identified a programme area to review in more depth
• Explored this programme area in the Programme Budget Atlases and NHS Comparators
• Developed a clearer picture of areas for further investigation

47
Next Steps• Visit the Health Investment Network website:
www.networks.nhs.uk/nhs-networks/health-investment-network• Use the E guides to understand how the tools use in this slidepack work and to
gain a better understanding of expenditure and associated outputs and outcomes.
• Produce versions of this slidepack for other programme budgeting categories.
• Download the annual population value review which provides a contextual guide to the health investment process.
• Access a video learning module that explores the definitions, tools and practical application of Programme Budgeting Marginal Analysis (PBMA)
• Find Useful links to other tools, data sources, reports and guidance.
• Further information regarding QIPP Right Care can be found at:
www.rightcare.nhs.uk
47


