Judy Ann Files, - City of Montrose
31
Transcript of Judy Ann Files, - City of Montrose


Judy Ann Files, Mayor
Roy Anderson, Mayor Pro-Tem
David Romero, Council Member
Dave Bowman, Council Member
Barbara Bynum, Council Member
Updated 8/2/17

Image courtesy of the Ted Kierscey Collection

From 2000 to 2010 86.5% of population growth in Montrose County occurred within
the City of Montrose

From 2007 to 2010 74% of population growth in Montrose County occurred within the City of Montrose

0
5,000
10,000
15,000
20,000
25,000
30,000
35,000
40,000
45,000
2000 2002 2004 2006 2008 2010 2012
City County
Source: U.S. Census for years 2000 and 2010; Colorado DOLA SDO July estimates for others. (Updated 02/2014)
33,432 34,926 36,13137,968
39,95241,276
12,34413,946 15,083
16,616
19,13218,152
40,786
18,938


Source: Colorado Department of Labor & EmploymentUpdated as of 12/2013
0
5,000
10,000
15,000
20,000
25,000
2003 2004 2005 2006 2007 2008 2009 2010 2011 2012 2013
Labor force # Employed # Unemployed Unemployment rate

2002 2003 2004 2005 2006 2007 2008 2009 2010 2011 2012 2013
Labor Force
17,836 18,262 19,125 19,927 20,543 21,008 20,925 21,162 20,618 21,967 18,885 19,204
# Employed
16,855 17,178 18,095 18,973 19,723 20,262 19,883 19,217 18,338 20,063 16,877 17,412
# Unemployed
981 1,084 1,030 954 820 746 1,042 1,945 2,280 1,904 2,008 1,792
Unemployment Rate
5.5 5.9 5.4 4.8 4.0 3.6 5.0 9.2 11.1 8.7 10.6 9.3
Source: Colorado Department of Labor & EmploymentUpdated as of 12/2013

Health Care/Social Assistance – 2,207 (16.8%)
Retail Trade – 2,048 (15.6%)
Educational Services – 1,261 (9.6%)
Manufacturing – 1,186 (9.1%)
Public Administration – 1,015 (7.7%)
U.S. Census 2010

9%MF
16%RT
10%ED
17%HC
8%PA
41%OTHER

Employer # of Employees
Montrose County School District 751
Montrose Memorial Hospital 581
Montrose County 384
Russell Stover Candies 360
Volunteers of America 350
Source: MEDC 01/2013

U.S. Census 2010

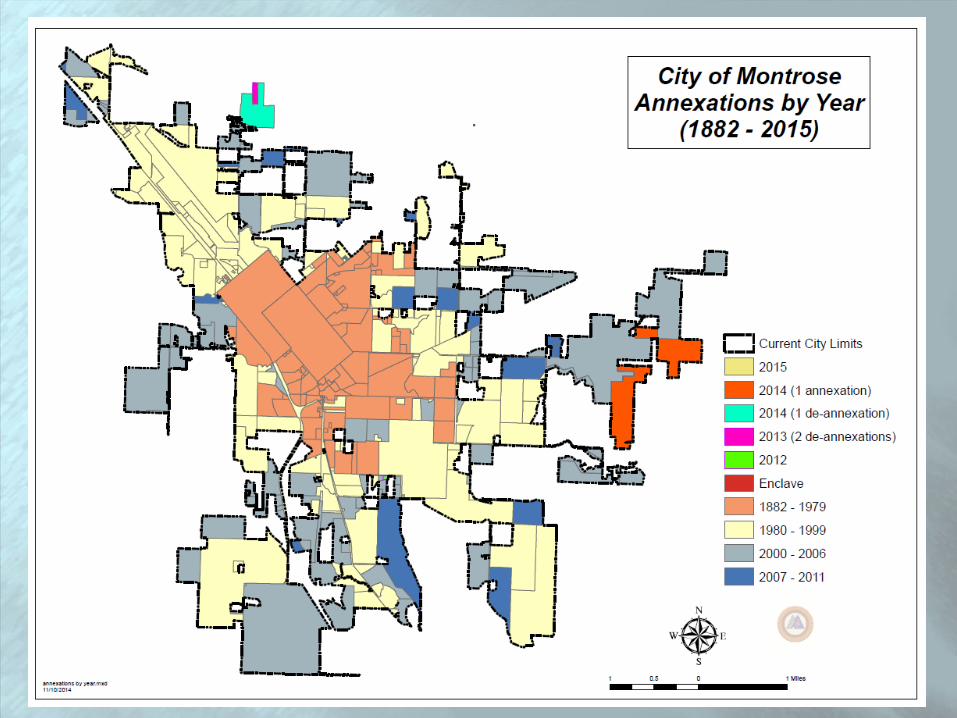
2013 (2 de-annexations)
- Enclaves
1882 – 1979
1980 – 1999
2000 – 2006
2007 – 2011
2012

0
100
200
300
400
500
600
700
800
2002 2003 2004 2005 2006 2007 2008 2009 2010 2011 2012 2013 2014
Acres Annexed

0
50
100
150
200
250
300
350
400
2003 2004 2005 2006 2007 2008 2009 2010 2011 2012 2013 2014 2015
Single Family Residential New Commercial
Source: City of Montrose Updated 01/2016
245
313
397
356
226

0
50
100
150
200
250
300
350
400
2007 2008 2009 2010 2011 2012 2013 2014 2015
All Residential All Commercial
Source: City of Montrose Updated 01/2016
371
55
169
42
104
37
91
33 57 29 57 3971
33 43 47
103
52

Source: City of Montrose Updated 01/17
Month Single Family HomesAll
Commercial
January 2 4
February 2 7
March 6 7
April 3 2
May 9 8
June 5 3
July 6 4
August 5 2
September 5 2
October 6 7
November 7 4
December 0 5
TOTAL TO DATE 56 55

Source: City of Montrose Updated 01/2018
Month Single Family HomesAll
Commercial
January 3 4
February 6 3
March 10 6
April 9 10
May 9 3
June 7 5
July 10 4
August 8 4
September 7 3
October 15 2
November 7 5
December 8 1
TOTAL TO DATE 99 50

The Community Development Department is noticing an increase in customer traffic for reasons such as:
Customers returning more often to discuss their projects
More people are doing remodeling than new construction
Concept meetings with banks and potential developers
We are redoing and undoing what was done in the past

0
20
40
60
80
100
120
140
160
180
200
1988 1989 1990 1991 1992 1993 1994 1995 1996 1997 1998 1999 2000
Single Family Residential
Source: City of Montrose Updated 01/2013

Source: City of MontroseUpdated 02/2014

*Net taxable numbers for the current DDA boundary. Source: City of MontroseUpdated 02/2014

Source: City of Montrose

Source: City of Montrose
35333665
2474
10151206
807
2241 2168
937
2168
957923823
2388
862
2184
896
2198

Adopted March 6, 2008
Recommend Code Revisions and Future Amendments
List of Potential Capital Improvements