
JSF Zero Defect Plan (ZDP) Program Overview -...
14
CQSDI Conference Data Analytics Driving Quality Improvements Silvia Bouchard Corporate Director Quality Northrop Grumman Corporation March 12, 2018
Transcript of JSF Zero Defect Plan (ZDP) Program Overview -...

CQSDI Conference
Data Analytics Driving Quality
Improvements
Silvia BouchardCorporate Director Quality
Northrop Grumman Corporation
March 12, 2018
2

Why Data?
$$$
3

Analytics’ Big Dependency
Regardless of where you are on the spectrum of maturity…
…information management makes effective analytics possible
4

Why is an Analytics strategy Important?
4/16/20185
A sound strategy demonstrates analytic needs. This includes what types are needed, who are
the producers and consumers, and how investments are justified and aligned to strategy.
Aligning to strategic goals
Measuring outcomes
Driving data into the decision making process
The strategy defines how analytics integrate with existing processes, organizational structure, infrastructure and culture to drive successful business outcomes linked to strategic objectives.
The strategy establishes how analytics will generate value and create a return on investment. Linking the strategy directly to business outcomes will help build a foundation towards establishing stakeholder support.
The strategy drives a comprehensive approach for using analytics to accelerate innovation and create a sustainable advantage. The strategy should compel others to utilize analytics to enable their line of business strategies.
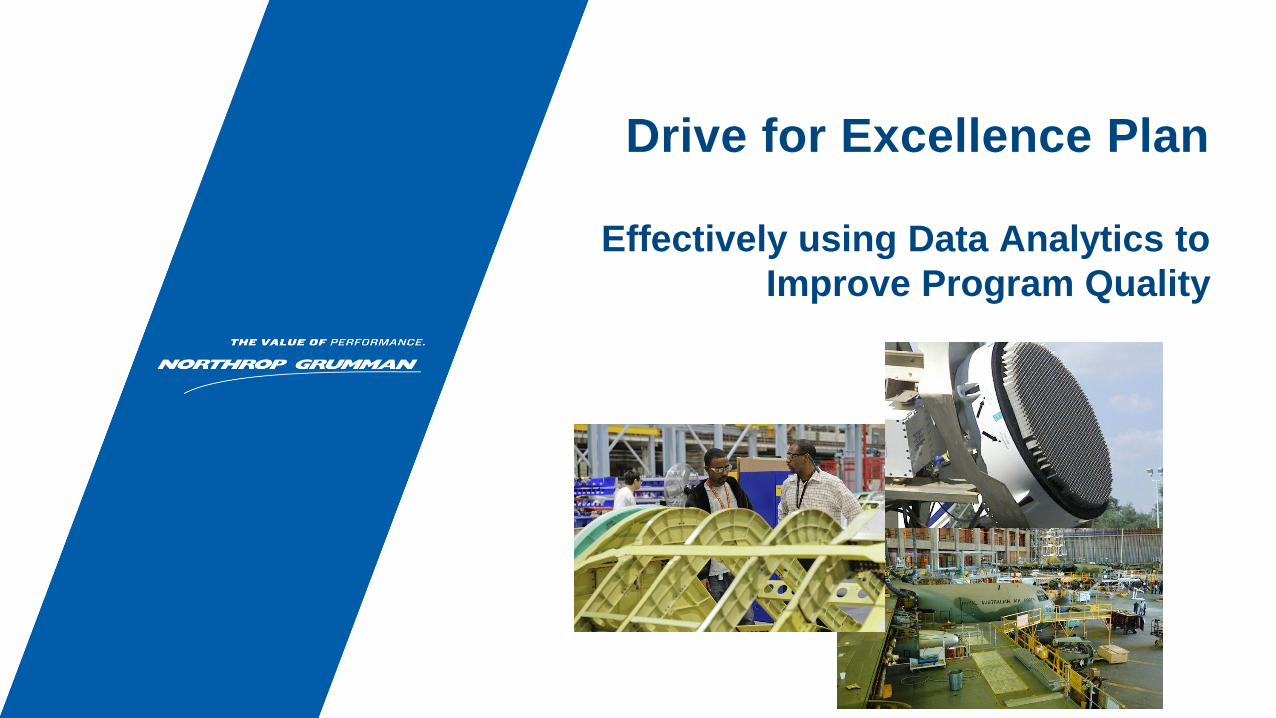
Drive for Excellence Plan
Effectively using Data Analytics to
Improve Program Quality

7
DFX Framework – Effective use of Data Analytics

Process-Centered Approach
9
Buy Make Ship
Incoming Quality
• Data analysis of defects delivered by suppliers
• Actions to drive defects delivered by suppliers to zero
Supplier surveillance audits Weekly/monthly reviews of
critical data points in supplier manufacturing process
Source/FAI initially until process improves
Block/approve as needed
Targeting All Sources of Defects
Internal Quality
• Data analysis of defects you make internal
• Actions taken to get them to zero
Proof of reach across - similar process other products
High defect driver identification / reduction (proactive)
Process optimization / variation reduction (proactive)
Yield improvements Metrics, & data analytics Process FMEA
Outgoing Quality
• Technical review of all defects delivered to customers
• Actions to drive the defects you deliver to zero
RCCA-engineering investigations
RTOK analysis Inspection process
improvements Clarification or design RN’s
Feedback Feedback

DFX Approach
10Customer Focused and Data-driven Improvement
Cross-functional IPT identify product and processcorrective actions
DFX Plan(s) initiated for all non Zero Defect product
Customer Quality Rating applied to all line item deliverables
Customer Quality RatingProgram
Quality Rating

11
Product level performance Process level performance Process-step level capability (CpK)
Peaking under the Hood Utilizing Data Analytics
True Picture of Quality to Drive Lasting Improvements

Supplier DFX Process
12Eliminating Defects We Buy – Driving Supplier Quality
ZDP Supplier Selection
ZDP Plan Analysis
ZDP Improvement
Phase
Improvement Sustainment
Phase 4: CONTROL: Exit Criteria Evaluation
– Based on specific exit criteria defined for each supplier
– Controlled, sustained performance
Phase 2: MEASURE/ANALYZE Supplier DFX Planning:
– Supplier notification and management review (expectations,
Q&A, etc.)
– Initial Supplier DFX submitted & evaluated
• Alignment with defects and/or identified risk areas
• Preventive approach which addresses delivered
material, manufacturing processes, and purchased
material
Phase 3: IMPROVE Supplier DFX Plan
Execution/Management:
– Monthly Performance Reviews to monitor supplier
performance and progress to DFX & defined Exit
Criteria
Phase 1: DEFINE: Supplier Selection and current
state performance based on:
– Quality Yields and/or Defect Trends
– Elevated Supplier Risk
– Level of QMS Rigor (process escapes)
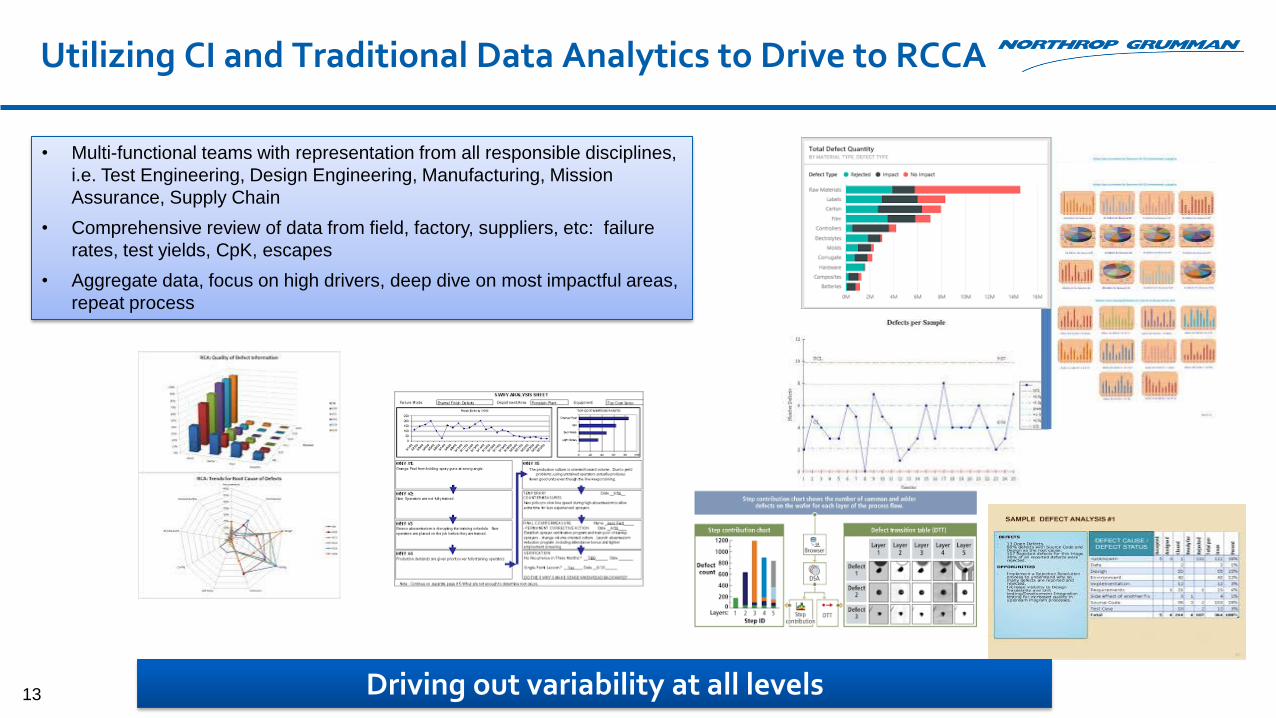
Utilizing CI and Traditional Data Analytics to Drive to RCCA
13
• Multi-functional teams with representation from all responsible disciplines,
i.e. Test Engineering, Design Engineering, Manufacturing, Mission
Assurance, Supply Chain
• Comprehensive review of data from field, factory, suppliers, etc: failure
rates, test yields, CpK, escapes
• Aggregate data, focus on high drivers, deep dive on most impactful areas,
repeat process
Driving out variability at all levels

Results
• Delivered Quality improving steadily
• Significantly reduced Scrap and Rework for major assemblies reduced
• Significantly reduced cycle time for targeted products
• Rolling out DFX more broadly across programs
• Supply base embracing DFX methodology
• Increased enhancements to models – driving to predictive and prevention
• Increased Customer Satisfaction – credibility and confidence
15 Effective Data Analytics Driving Performance Improvements